Your WiFi Is Leaking: Inferring Private User Information ...
188
Your WiFi Is Leaking: Inferring Private User Information Despite Encryption JOHN SATKINSON A thesis submitted in fulfilment of the requirements for the degree of Doctor of Philosophy (PhD) Department of Security & Crime Science University College London March 2015 1
-
Upload
khangminh22 -
Category
Documents
-
view
1 -
download
0
Transcript of Your WiFi Is Leaking: Inferring Private User Information ...

Your WiFi Is Leaking:Inferring Private User Information
Despite Encryption
JOHN S ATKINSON
A thesis submitted in fulfilment of the requirementsfor the degree of Doctor of Philosophy (PhD)
Department of Security & Crime ScienceUniversity College London
March 2015
1

2

Abstract
This thesis describes how wireless networks can inadvertently leak and broadcast users’
personal information despite the correct use of encryption. Users would likely assume
that their activities (for example, the program or app they are using) and personal in-
formation (including age, religion, sexuality and gender) would remain confidential
when using an encrypted network. However, we demonstrate how the analysis of en-
crypted traffic patterns can allow an observer to infer potentially sensitive data remotely,
passively, undetectably, and without any network credentials.
Without the ability to read encrypted WiFi traffic directly, the limited side-channel
data available is processed. Following an investigation to determine what information
is available and how it can be represented, it was determined that the comparison of
various permutations of timing and frame size information is sufficient to distinguish
specific user activities. The construction of classifiers via machine learning (Random
Forests) utilising this side-channel information represented as histograms allows for
the detection of user activity despite WiFi encryption. Studies showed that Skype voice
traffic could be identified despite being interleaved with other activities. A subsequent
study then demonstrated that mobile apps could be individually detected and, con-
cerningly, used to infer potentially sensitive information about users due to their per-
sonalised nature.
Furthermore, a full prototype system is developed and used to demonstrate that this
analysis can be performed in real-time using low-cost commodity hardware in real-
world scenarios. Avenues for improvement and the limitations of this approach are
identified, and potential applications for this work are considered. Strategies to prevent
these leaks are discussed and the effort required for an observer to present a practical
privacy threat to the everyday WiFi user is examined.
3

Statement of Originality
I, John Atkinson, confirm that the work presented in this thesis is my own. Where in-
formation has been derived from other sources, I confirm that this has been indicated
in the thesis.
4

Acknowledgement
The author is pleased to acknowledge the contributions of Ali Ozdengiz, Gbenga Ade-
toye and Zhiyang Sun who provided invaluable assistance in the collection of network
traffic data for this research. Thanks are extended to George Matich of Selex ES, as well
as John Mitchell, Miguel Rio and Kevin Chetty of UCL whose guidance and insight was
essential to completion of this thesis.
Further appreciation is extended to my friends and colleagues in UCL SECReT, EE
and CS for being both welcome distractions and useful venting mechanisms. A special
mention goes to Claire Ries for keeping the biscuit cupboard stocked “like some sort of
covert raccoon” and for accepting 4AM as a reasonable bed time.
5

6

Contents
Front Matter 3Abstract . . . . . . . . . . . . . . . . . . . . . . . . . . . . . . . . . . . . . . . . . . . . . . . . . . . . 3Statement of Originality . . . . . . . . . . . . . . . . . . . . . . . . . . . . . . . . . . . . . . . . 4Acknowledgements . . . . . . . . . . . . . . . . . . . . . . . . . . . . . . . . . . . . . . . . . . . 5Table of Contents . . . . . . . . . . . . . . . . . . . . . . . . . . . . . . . . . . . . . . . . . . . . . 9List of Figures . . . . . . . . . . . . . . . . . . . . . . . . . . . . . . . . . . . . . . . . . . . . . . . . 12List of Tables . . . . . . . . . . . . . . . . . . . . . . . . . . . . . . . . . . . . . . . . . . . . . . . . 13Acronyms & Abbreviations . . . . . . . . . . . . . . . . . . . . . . . . . . . . . . . . . . . . . . 15
1 Research Overview 191.1 Research Motivation . . . . . . . . . . . . . . . . . . . . . . . . . . . . . . . . . . . . . . . 191.2 Research Contribution . . . . . . . . . . . . . . . . . . . . . . . . . . . . . . . . . . . . . 211.3 Publication Summary . . . . . . . . . . . . . . . . . . . . . . . . . . . . . . . . . . . . . . 221.4 Thesis Outline & Research Progression . . . . . . . . . . . . . . . . . . . . . . . . . . 23
2 Essential Concepts 272.1 Ubiquitous Wireless Networks . . . . . . . . . . . . . . . . . . . . . . . . . . . . . . . . 272.2 Security & Encryption . . . . . . . . . . . . . . . . . . . . . . . . . . . . . . . . . . . . . . 302.3 Side-Channels & Inferring Personal Activity . . . . . . . . . . . . . . . . . . . . . . 332.4 Network Activity Classification with Restricted Data . . . . . . . . . . . . . . . . 352.5 Summary . . . . . . . . . . . . . . . . . . . . . . . . . . . . . . . . . . . . . . . . . . . . . . . 39
3 Handling of Leaks: Experimental Foundations 413.1 Experimental Design & Adversarial Model . . . . . . . . . . . . . . . . . . . . . . . 413.2 Inferring Information from Network Activity . . . . . . . . . . . . . . . . . . . . . 433.3 Ethical Considerations . . . . . . . . . . . . . . . . . . . . . . . . . . . . . . . . . . . . . 45
3.3.1 Ethical Challenges in Information Security . . . . . . . . . . . . . . . . . 453.3.2 Codified Guidance . . . . . . . . . . . . . . . . . . . . . . . . . . . . . . . . . . . 473.3.3 Ethical Analysis . . . . . . . . . . . . . . . . . . . . . . . . . . . . . . . . . . . . . 48
3.4 Summary . . . . . . . . . . . . . . . . . . . . . . . . . . . . . . . . . . . . . . . . . . . . . . . 53
4 Acquiring Data: How To Collect Drips 554.1 Implementing a WiFi Collection Platform . . . . . . . . . . . . . . . . . . . . . . . 554.2 Minimising Spurious Variation . . . . . . . . . . . . . . . . . . . . . . . . . . . . . . . 594.3 Essential Software Tools . . . . . . . . . . . . . . . . . . . . . . . . . . . . . . . . . . . . 614.4 Hardware & Automated Collection Platforms . . . . . . . . . . . . . . . . . . . . . 634.5 Supplementary Software Tools . . . . . . . . . . . . . . . . . . . . . . . . . . . . . . . 654.6 Summary . . . . . . . . . . . . . . . . . . . . . . . . . . . . . . . . . . . . . . . . . . . . . . . 67
5 Finding & Visualising Information Leakage 695.1 Performing User Activities . . . . . . . . . . . . . . . . . . . . . . . . . . . . . . . . . . . 695.2 Data In Plain Sight . . . . . . . . . . . . . . . . . . . . . . . . . . . . . . . . . . . . . . . . 755.3 Feature Identification & Visualisation . . . . . . . . . . . . . . . . . . . . . . . . . . 78
5.3.1 Distinguishing User Activity . . . . . . . . . . . . . . . . . . . . . . . . . . . . 795.3.2 Distinguishing Operating Systems . . . . . . . . . . . . . . . . . . . . . . . . 85
5.4 Obscured & Lost Information . . . . . . . . . . . . . . . . . . . . . . . . . . . . . . . . 865.5 Discussion . . . . . . . . . . . . . . . . . . . . . . . . . . . . . . . . . . . . . . . . . . . . . . 88
7

5.6 Study Conclusions . . . . . . . . . . . . . . . . . . . . . . . . . . . . . . . . . . . . . . . . 89
6 Developing Activity Metrics: Finding Skype 91
6.1 Why Skype? . . . . . . . . . . . . . . . . . . . . . . . . . . . . . . . . . . . . . . . . . . . . . 92
6.2 Collecting & Accurately Labelling Activity Data . . . . . . . . . . . . . . . . . . . . 94
6.3 Characterising Time Windows & Distribution Creation . . . . . . . . . . . . . . 97
6.4 Detection via Thresholds . . . . . . . . . . . . . . . . . . . . . . . . . . . . . . . . . . . . 104
6.5 Detector Accuracy . . . . . . . . . . . . . . . . . . . . . . . . . . . . . . . . . . . . . . . . 107
6.6 Discussion . . . . . . . . . . . . . . . . . . . . . . . . . . . . . . . . . . . . . . . . . . . . . . 108
6.7 Study Conclusions . . . . . . . . . . . . . . . . . . . . . . . . . . . . . . . . . . . . . . . . 110
7 Improved Activity Detection: Random Forests 111
7.1 Selecting A Machine Learning Approach . . . . . . . . . . . . . . . . . . . . . . . . 111
7.2 Supervised Classification . . . . . . . . . . . . . . . . . . . . . . . . . . . . . . . . . . . 114
7.3 Random Forests of Decision Trees . . . . . . . . . . . . . . . . . . . . . . . . . . . . . 115
7.4 Sample Data & Representation . . . . . . . . . . . . . . . . . . . . . . . . . . . . . . . 118
7.4.1 Cumulative Distributions . . . . . . . . . . . . . . . . . . . . . . . . . . . . . . 121
7.4.2 Variable Selection . . . . . . . . . . . . . . . . . . . . . . . . . . . . . . . . . . . . 122
7.5 Random Forest Accuracy . . . . . . . . . . . . . . . . . . . . . . . . . . . . . . . . . . . . 123
7.5.1 Parameter Tuning . . . . . . . . . . . . . . . . . . . . . . . . . . . . . . . . . . . . 124
7.6 Considering Ease of Implementation . . . . . . . . . . . . . . . . . . . . . . . . . . . 125
7.7 What defines Skype? . . . . . . . . . . . . . . . . . . . . . . . . . . . . . . . . . . . . . . . 127
7.8 Study Conclusions . . . . . . . . . . . . . . . . . . . . . . . . . . . . . . . . . . . . . . . . 128
8 Inferring Personal Information 131
8.1 The WiFi & Mobile Device Scenario . . . . . . . . . . . . . . . . . . . . . . . . . . . . 132
8.2 Mobile Devices & Mobile App Privacy . . . . . . . . . . . . . . . . . . . . . . . . . . 134
8.3 Mobile App Selection . . . . . . . . . . . . . . . . . . . . . . . . . . . . . . . . . . . . . . 137
8.4 Measuring App Activity . . . . . . . . . . . . . . . . . . . . . . . . . . . . . . . . . . . . . 139
8.5 Metric Distributions & Forest Construction . . . . . . . . . . . . . . . . . . . . . . 141
8.6 Classifier Results . . . . . . . . . . . . . . . . . . . . . . . . . . . . . . . . . . . . . . . . . . 144
8.7 Personas & Real-Time Activity Detection . . . . . . . . . . . . . . . . . . . . . . . . 145
8.8 Optimisation Analysis & Validation . . . . . . . . . . . . . . . . . . . . . . . . . . . . 150
8.9 Discussion . . . . . . . . . . . . . . . . . . . . . . . . . . . . . . . . . . . . . . . . . . . . . . 151
8.10 Study Conclusions . . . . . . . . . . . . . . . . . . . . . . . . . . . . . . . . . . . . . . . . 153
9 Threat Feasibility, Mitigation & Applications 155
9.1 Generalisation . . . . . . . . . . . . . . . . . . . . . . . . . . . . . . . . . . . . . . . . . . . 155
9.1.1 Networks . . . . . . . . . . . . . . . . . . . . . . . . . . . . . . . . . . . . . . . . . . 155
9.1.2 Targeted Activities . . . . . . . . . . . . . . . . . . . . . . . . . . . . . . . . . . . 156
9.2 Feasibility of Developing a Practical Threat . . . . . . . . . . . . . . . . . . . . . . 157
9.3 Real-World Applications . . . . . . . . . . . . . . . . . . . . . . . . . . . . . . . . . . . . 159
9.3.1 Law Enforcement & Digital Forensics . . . . . . . . . . . . . . . . . . . . . 160
9.3.2 Network Security . . . . . . . . . . . . . . . . . . . . . . . . . . . . . . . . . . . . 161
9.3.3 Device Tracking and Local Demographic Information . . . . . . . . . 161
9.4 Awareness & Mitigation . . . . . . . . . . . . . . . . . . . . . . . . . . . . . . . . . . . . . 162
8

10 Conclusion 16510.1 Summary of Key Contributions . . . . . . . . . . . . . . . . . . . . . . . . . . . . . . . 16510.2 Future Avenues of Investigation . . . . . . . . . . . . . . . . . . . . . . . . . . . . . . . 16710.3 Final Remarks . . . . . . . . . . . . . . . . . . . . . . . . . . . . . . . . . . . . . . . . . . . . 168
A Automation Scripts 169A.1 Web Browsing – Google Search, Solar flare Images . . . . . . . . . . . . . . . . . 169A.2 Web Browsing – Wikipedia, 2012 Summer Olympics . . . . . . . . . . . . . . . . 170A.3 Email – GMail, Send Message . . . . . . . . . . . . . . . . . . . . . . . . . . . . . . . . 171A.4 Streaming – Youtube Video, Maru the Cat . . . . . . . . . . . . . . . . . . . . . . . . 172A.5 VoIP – Skype, Make Call . . . . . . . . . . . . . . . . . . . . . . . . . . . . . . . . . . . . . 173
B Wireshark Fields & Filters 175
C Hardware & Software Specifics 177
Bibliography 188
9

10

List of Figures
2.1 Typical WiFi Network Setup . . . . . . . . . . . . . . . . . . . . . . . . . . . . . . . . . . 282.2 OSI Model Diagram . . . . . . . . . . . . . . . . . . . . . . . . . . . . . . . . . . . . . . . 292.3 Packet Encapsulation Example . . . . . . . . . . . . . . . . . . . . . . . . . . . . . . . 312.4 Inferring Activities from Power Usage . . . . . . . . . . . . . . . . . . . . . . . . . . 352.5 Available WiFi Side-Channel Data . . . . . . . . . . . . . . . . . . . . . . . . . . . . . 38
3.1 Observing Encrypted WiFi Traffic . . . . . . . . . . . . . . . . . . . . . . . . . . . . . 41
4.1 Observing Encrypted WiFi Traffic using ‘MiFi’ . . . . . . . . . . . . . . . . . . . . 564.2 Monitor Station Packet Capture Process (promiscuous, via Kismet) . . . . . 574.3 Client Packet Capture Process (managed, via Wireshark) . . . . . . . . . . . . 584.4 2.4GHz WiFi Channel Frequency Overlap . . . . . . . . . . . . . . . . . . . . . . . . 604.5 Example WiFi Saturation Visualisation . . . . . . . . . . . . . . . . . . . . . . . . . . 614.6 Automated Collection Platform Software/Hardware Interaction . . . . . . . 644.7 Automated Collection Device . . . . . . . . . . . . . . . . . . . . . . . . . . . . . . . . 65
5.1 General Transition from User Activity to Network Activity . . . . . . . . . . . . 725.2 Example: Web Search Activity to Network Activity Transition . . . . . . . . . 745.3 Total Bytes Transmitted per 0.5 Second Interval . . . . . . . . . . . . . . . . . . . 805.4 Direction of Packets Transmitted per 0.5 Second Interval . . . . . . . . . . . . 815.5 Difference (Sent − Received) in Frames Transmitted over Time . . . . . . . . 815.6 Time of Observation per Frame . . . . . . . . . . . . . . . . . . . . . . . . . . . . . . . 825.7 Time Since Last Packet per Packet (Logarithmic Time Scale) . . . . . . . . . . 845.8 Difference in Sent/Received Data Rate of Skype Conversation . . . . . . . . . 845.9 Data Rate in Bytes (with Observation Time as reference) per Packet . . . . 855.10 Operating System Data Rate (Bytes) & Direction . . . . . . . . . . . . . . . . . . . 865.11 How Different Time Bin Offsets Alter Measurement Features . . . . . . . . . . 875.12 Example Decision Tree for User Activity Classification . . . . . . . . . . . . . . 89
6.1 Observing Encrypted Skype Traffic . . . . . . . . . . . . . . . . . . . . . . . . . . . . 956.2 Expected FSize Distribution over 5s Window (subsection) . . . . . . . . . . . . 996.3 Expected I-RR Distribution over 5s Window (subsection) . . . . . . . . . . . . 1006.4 Expected I-SS Distribution over 5s Window (subsection) . . . . . . . . . . . . . 1006.5 Expected FSize Distribution over 5s Window (subsection) . . . . . . . . . . . . 1026.6 Expected I-RR Distribution over 5s Window (subsection) . . . . . . . . . . . . 1036.7 Expected I-SS Distribution over 5s Window (subsection) . . . . . . . . . . . . . 1036.8 Detector Scores for Skype Only . . . . . . . . . . . . . . . . . . . . . . . . . . . . . . . 1056.9 Detector Scores for BitTorrent Only . . . . . . . . . . . . . . . . . . . . . . . . . . . . 1066.10 Detector Scores for Simultaneous Skype and BitTorrent . . . . . . . . . . . . . 1066.11 Detector Scores for Simultaneous Skype and Web Browsing . . . . . . . . . . 106
7.1 Machine Learning Process Flow Diagram . . . . . . . . . . . . . . . . . . . . . . . . 1147.2 Observing Encrypted Skype Traffic . . . . . . . . . . . . . . . . . . . . . . . . . . . . 1197.3 Expected I-SS Dist. over 5s Window (subsection) . . . . . . . . . . . . . . . . . . 1217.4 Interarrival Distribution Comparison . . . . . . . . . . . . . . . . . . . . . . . . . . . 1227.5 Error for Random Forest Composed of 200 Trees Utilising 617 Variables . 1247.6 Classification Error of Top 200 Variables with X Trees . . . . . . . . . . . . . . . 125
11

7.7 Forest Classification Error, Top Nv a r Variables . . . . . . . . . . . . . . . . . . . . 1277.8 Variable Importance . . . . . . . . . . . . . . . . . . . . . . . . . . . . . . . . . . . . . . . 1287.9 Skype Prototype Constructed from Top 100 Variables . . . . . . . . . . . . . . . 128
8.1 Observing Encrypted Mobile Device WiFi Traffic . . . . . . . . . . . . . . . . . . 1338.2 How Apps May Be Differentiated Via Distribution Variables . . . . . . . . . . 1438.3 Live Detector: Device & AP Scanning . . . . . . . . . . . . . . . . . . . . . . . . . . . 1468.4 Live Detector: App Detection on Targetted Devices . . . . . . . . . . . . . . . . 1478.5 Forest Error with Decreasing No. Vars . . . . . . . . . . . . . . . . . . . . . . . . . . 1518.6 Variable Importance – All Apps . . . . . . . . . . . . . . . . . . . . . . . . . . . . . . . 1528.7 Comparative Religion: Prototypes of Top 100 Most Important Variables . 153
12

List of Tables
2.1 Network Activity Detection Literature Summary . . . . . . . . . . . . . . . . . . . 37
4.1 Capture Method Comparison . . . . . . . . . . . . . . . . . . . . . . . . . . . . . . . . 59
6.1 Detector Performance: Skype Only . . . . . . . . . . . . . . . . . . . . . . . . . . . . 1076.2 Detector Performance: Skype+Torrent . . . . . . . . . . . . . . . . . . . . . . . . . . 1076.3 Detector Performance: Skype+Web . . . . . . . . . . . . . . . . . . . . . . . . . . . . 1076.4 Detector Performance: BitTorrent . . . . . . . . . . . . . . . . . . . . . . . . . . . . . 107
7.1 Distributions Created For Each 0.5s Window . . . . . . . . . . . . . . . . . . . . . 1207.2 Classification Confusion Matrix . . . . . . . . . . . . . . . . . . . . . . . . . . . . . . . 1237.3 Time Taken to Classify 59319 Windows . . . . . . . . . . . . . . . . . . . . . . . . . 126
8.1 User Information Inferable from use of Mobile Apps . . . . . . . . . . . . . . . . 1368.2 Random Forest Generalisation Error . . . . . . . . . . . . . . . . . . . . . . . . . . . 1438.3 Distributions Created For Each 15s Window . . . . . . . . . . . . . . . . . . . . . . 1448.4 Personas & App-signified Characteristics . . . . . . . . . . . . . . . . . . . . . . . . 1498.5 Live Persona Detection Results . . . . . . . . . . . . . . . . . . . . . . . . . . . . . . . 149
B.1 Useful Wireshark Filters . . . . . . . . . . . . . . . . . . . . . . . . . . . . . . . . . . . . 175B.2 Useful Wireshark Filters (cont.) . . . . . . . . . . . . . . . . . . . . . . . . . . . . . . . 176
13

14

Acronyms & Abbreviations3G Third generation mobile telecommunications technology.
4G Fourth generation mobile telecommunications technology.
amd64 64-bit CPU instruction set. Current dominant standard for general purposedesktop/laptop machines.
AP Access Point.
API Application Programming Interface.
ARM Instruction set often used by CPUs in low-power systems.
CART Classification and Regression Tree(s).
CPU Central Processing Unit.
CRAWDAD Community Resource for Archiving Wireless Data At Dartmouth.
DPA Data Protection Act.
EAP Extensible Authentication Protocol.
EAPOL Extensible Authentication Protocol Over LAN.
EPSRC Engineering and Physical Sciences Research Council (Great Britain).
FSize Frame Size (distribution).
GPS Global Positioning System.
I-RR Interarrival times between received frames and previous received frame (distri-bution).
I-RS Interarrival times between received frames and previous sent frame (distribu-tion).
I-SR Interarrival times between sent frames and previous received frame (distribu-tion).
I-SS Interarrival times between sent frames and previous sent frame (distribution).
ICO Information Commissioner’s Office (UK).
IEEE Institute of Electrical and Electronics Engineers.
IEEE-SA Institute of Electrical and Electronics Engineers Standards Association.
IET Institution of Engineering and Technology.
InfoSec Information Security.
15

IP Internet Protocol.
IPSec Internet Protocol Security.
ISO An ‘image file’ format. Copy of a disk’s entire filesystem.
IT Information Technology.
LAN Local Area Network.
LTE Long Term Evolution. Primary implementation of 4G.
MAC Medium Access Control.
ML Machine Learning.
MTU Maximum transmission unit..
OOB Out Of Bag. Measurement of generalisation error for a random forest.
OS Operating System.
OSI Open Systems Interconnection (model).
P2P Peer-To-Peer (communication).
PC Personal Computer.
PSK Pre-Shared Key.
QoS Quality of Service.
RAM Random Access Memory.
RBF Radial Basis Function.
SD (Card) Secure Digital. Format for solid state ‘flash’ memory.
SVM Support Vector Machine.
TCP Transmission Control Protocol.
TV Television.
UCL University College London.
UDP Universal Datagram Protocol.
USB Universal Serial Bus.
VoIP Voice over Internet Protocol.
WEP Wired Equivalent Privacy.
WiFi Wireless. Communication by the IEEE 802.11 set of protocols.
16

WLAN Wireless Local Area Network.
WPA WiFi Protected Access.
x86 32-bit CPU instruction set. Former dominant standard for general purpose desktop/laptopmachines.
17

18

1 Research Overview
This first chapter explains the motivation for research in the area of “cyber security” and
the topic of inferring user information despite WiFi encryption particularly. It provides
a summary of the content and research contributions of each chapter and lists the pub-
lications authored during the course of this research.
1.1 Research Motivation
‘Cyber Security’ is noted as one of four priority objectives of the United Kingdom’s Na-
tional Security Strategy (Cabinet Office (UK), 2010) with the EPSRC stating that “further
research into cybersecurity — its fundamentals and in particular its human and beha-
vioural aspects — is essential” (EPSRC, 2011). This work described in this thesis scru-
tinises the largely unpublicised privacy vulnerability that inferring user activity repres-
ents. Not only can information regarding (supposedly) private activities be inadvert-
ently broadcast, but analysis of these activities themselves can further leak information
regarding the user that initiates them.
Although there are a multitude of wireless communications, “WiFi” commonly refers
to the IEEE 802.11 protocol. This thesis uses these terms interchangeably, unless spe-
cifically stated. Wireless communications are now prevalent in modern society and
used by home, corporate and government users alike (Dutton and Blank, 2011). Despite
usually being encrypted, wireless network technologies still inadvertently leak side-
channel information. Side-channel information leakage is a result of optimisation pro-
cesses fundamental to efficient network communication. Although data cannot be read
directly, analysis of this information enables the ability to infer user activity by merely
observing these communications. Furthermore, this work takes a novel approach to
link wireless network activity directly to personal information. Depending on the de-
tails of a user activity, it is therefore demonstrated that sensitive information can be
19

CHAPTER 1 Research Overview
inadvertently broadcast over a wide area to any interested observer due to the use of
WiFi. This work will demonstrate that — contrary to expectations — confidentiality
and privacy are not guaranteed even with 100% unbroken encryption working exactly
as designed.
Wireless communication methods are general purpose. Insecurity in an imple-
mentation potentially exposes all the other protocols, applications and devices that rely
upon it. Smartphones, tablets and other mobile devices provide a particularly invit-
ing research opportunity. Their popularity and ubiquity is recent (societally speaking)
and such devices contain a wealth of potentially vulnerable private information. The
security of this data as these devices operate wirelessly therefore warrants investiga-
tion. Commercial interest in wireless broadcasts has piqued in recent years with com-
panies recognising them as a powerful data source. Pertinent recent stories include
London’s controversial “tracking bins” that included hardware to collect WiFi-enabled
device identifiers as owners passed in the street to track their shopping habits (Vincent,
2013). This research aids in the evaluation of wireless devices and infrastructure to as-
certain how much information is being unintentionally leaked, whether this should be
remedied, and how it may be possible to do so through either technological or social
solutions.
Aside from aiding in the design of privacy-preserving networks that resist this kind
of analysis, this research is also useful for detecting undesired activities that would oth-
erwise be hidden or computationally expensive to discover. This may have applications
in the field of digital forensics to prioritise and guide the limited resources of forensic
examiners through progressively large datasets with increasingly prevalent quantities
of encrypted data. Similarly, live monitoring of wireless communications without the
need to break encryption may be useful for law enforcement purposes. Analysis tools
are designed to integrate with the wider security context; with organisational practic-
alities and ethical considerations taken into account.
Ultimately this research seeks to dispel the assumption that encryption provides
true confidentiality, inform the wider academic audience of this fact, and bring about
change in situations where it is determined greater user privacy is necessary. Due to the
wide deployment of wireless networking technology and the ability to generalise the
20

Research Overview CHAPTER 1
techniques developed to other wireless data protocols (e.g. 4G LTE as used in cellular
mobile data networks), the findings detailed in this thesis should be of interest to both
the academic community and security practitioners alike, to better protect the privacy
of end users.
1.2 Research Contribution
This research makes the following novel contributions to the field:
• Undeniably establishes the ability to infer the personal sensitive information of
real-world users from their encrypted WiFi traffic.
• Practicably demonstrates activity detection and information leakage in a live, real-
world WiFi environment.
• Developed a real-time detection program capable of identifying the use of widely-
used mobile apps from a remote, unprivileged vantage point using only live en-
crypted network activity.
• Constructed a classifier capable of identifying Skype voice traffic from a remote,
unprivileged vantage point using only encrypted network activity samples.
• Assesses the applications of user activity inference techniques and the cost and
effort required to present a practical privacy threat to the everyday WiFi user.
Limitations are evaluated and strategies to thwart them are identified.
• Precisely specifies collection protocols, a sampling methodology and data rep-
resentation scheme that facilitates machine learning classification for this chal-
lenging scenario.
• Details the design of the hardware and software platform and user automation
techniques that allow encrypted WiFi data samples to be collected (or derived)
easily and cheaply.
In addition, full source-code for the data collection, analysis, detector program and de-
tector generation is made available alongside this thesis to provide a foundation plat-
form for future work in the same area.
21

CHAPTER 1 Research Overview
1.3 Publication Summary
The research contained within this thesis has resulted in five publications to date and
their content is summarised in the next section. In chronological order of publication
date, they are as follows:
1. J.S. Atkinson, J.E. Mitchell, M. Rio, and G. Matich. Your WiFi Is Leaking: Determ-
ining User Behaviour Despite Encryption. London Communications Symposium
(LCS), September 2011. (Atkinson et al., 2011).
2. J.S. Atkinson, O. Adetoye, M. Rio, J.E. Mitchell, and G. Matich. Your WiFi is leaking:
Inferring User Behaviour, Encryption Irrelevant. IEEE Wireless Communications
and Networking Conference (WCNC), pages 1097–1102. April 2013. ISBN 978-1-
4673-5939-9. (Atkinson et al., 2013).
3. J.S. Atkinson, J.E. Mitchell, M. Rio, and G. Matich. Your WiFi Is Leaking: Building
a Low-Cost Device to Infer User Activities. Cyberpatterns, April 2014. (Atkinson
et al., 2014a).
4. J.S. Atkinson, J.E. Mitchell, M. Rio, and G. Matich. Your WiFi Is Leaking - Ignoring
Encryption, Using Histograms to Remotely Detect Skype Traffic. IEEE Military
Communications Conference (MILCOM), October 2014. (Atkinson et al., 2014b).
In addition, a paper reporting on the study of inferring private information from mobile
apps using WiFi is currently under review:
5. J.S. Atkinson, J.E. Mitchell, M. Rio, and G. Matich. Your WiFi Is Leaking: What Do
Your Mobile Apps Gossip About You? Under review, to appear 2015.
Another paper was also published discussing the challenges that digital evidence (as
opposed to traditional ‘physical’ evidence) poses to the legal system. Although not dir-
ectly contributing to this thesis, the issues outlined will be of consequence to any po-
tential law enforcement or forensic application of information inference via WiFi leaks:
6. J.S. Atkinson. Proof is Not Binary: The Pace and Complexity of Computer Sys-
tems and the Challenges Digital Evidence Poses to the Legal System. Birkbeck
Law Review, 2(2), October 2014. (Atkinson, 2014).
22

Research Overview CHAPTER 1
1.4 Thesis Outline & Research Progression
This thesis is structured so that research findings are presented in chronological or-
der with each chapter building upon previous results. The key research contributions
within each chapter, a summary of their content, and the publications they spawned
are as follows:
Chapter 1 – Research Overview: The chapter you are currently reading. Outlines
the motivation for research in the area of “cyber security”, lists the papers pub-
lished on the topics contained within this thesis, and provides a summary of the
content of each chapter.
Chapter 2 – Essential Concepts: Provides a review of the key literature that un-
derpins the work on wireless network leaks presented in this thesis. These con-
cepts are required to understand the background of WiFi security and related top-
ics. Additional literature is introduced in subsequent chapters as it is required.
Chapter 3 – Handling of Leaks: Experimental Foundations: Illustrates the scen-
ario that wireless devices operate within and how these communications can be
observed. The privacy implications of this are explained and the legal and ethical
issues surrounding the collection of encrypted WiFi traffic are discussed.
Chapter 4 – Acquiring Data: How To Collect Drips: Documents the acquisition
process for encrypted WiFi traffic data. This data enables the analysis techniques
developed through this thesis. The hardware and software used to receive this
data, as well as useful tools to automate the process are detailed. Alongside the
ethical and legal analysis from the previous chapter, this work was condensed
to form a guide for practitioners and presented at Cyberpatterns 2014 (Atkinson
et al., 2014a).
Chapter 5 – Finding & Visualising Information Leakage: Details an initial study
presented at the London Communications Symposium 2011 that illustrates how
information on user activities can be extracted from external observations of WiFi
traffic despite encryption (Atkinson et al., 2011). A selection of common user
23

CHAPTER 1 Research Overview
activities — such as web-browsing, email, video and music streaming, VoIP phone
calls and peer-to-peer downloads — were performed and the side-channel meas-
urements are shown visually. The differences in these side-channel measure-
ments demonstrate the feasibility of an outside observer inferring user activity
information despite the correct use of encryption.
Chapter 6 – Developing Activity Metrics: Finding Skype: Presents an initial ba-
sic mechanism for inferring and detecting user activity from encrypted wireless
network activity without using machine learning. The mechanism targets Skype
voice call activity specifically and looks to separate it from confounding inter-
leaved activity such as BitTorrent and web-browsing. As part of the development
of this mechanism, a program was developed to visualise and compare histo-
grams of timing and frame size measurements over a short time period. Thresholds
for these measurements were analysed, set, and used to determine when Skype
voice activity was occurring within the captured network traffic data.
Results published at the IEEE Wireless Communications & Networking Confer-
ence 2013 (Atkinson et al., 2013) showed that it is quite feasible to infer and detect
a specific kind of user activity despite the observer being entirely passive, despite
being external to the network, despite the correct use of encryption, and despite
the limited data this scenario provides. These metrics interpreted as histograms
form the foundation of this and all subsequent detection methods.
Chapter 7 – Improved Activity Detection: Random Forests: This work builds
directly upon the efforts of the previous chapter and presents the immediate suc-
cessor to the threshold-based detection mechanism. Again concentrating on the
detection of Skype voice activity, this chapter documents the development a re-
mote, undetectable, high accuracy mechanism to infer Skype voice activity on
WiFi networks with a success rate of ∼97% and only a ∼3% false positive rate.
This improvement was achieved via the use of Random Forests (a machine learn-
ing technique) to build the classifier/detector instead of setting thresholds via
manual analysis. Histograms representing frame size and interarrival distribu-
tions (and various permutations thereof) were adjusted so that the data within
24

Research Overview CHAPTER 1
could be more optimally utilised by the machine learning algorithm. Optim-
isation of the Random Forest classifier and the feasibility of a real-time detector
implementation are analysed. The final product is an efficient classifier and an
approach that can be feasibly implemented at low-cost on portable, commodity
hardware as at IEEE Milcom 2014 (Atkinson et al., 2014b).
Chapter 8 – Inferring Personal Information: A final experimental study into how
mobile device apps can inadvertently broadcast personal information despite the
correct use of wireless network encryption. In contrast to previous studies, this
work both demonstrates live analysis of traffic in real-time as well as the inference
of personal and potentially sensitive information. Using a selection of personas,
this work illustrates how app usage can be tied to personal information. Users
would likely assume the confidentiality of personal information (including age,
religion, sexuality and gender) when using an encrypted network. However, we
demonstrate how encrypted traffic pattern analysis can allow a remote observer
to infer potentially sensitive data passively and undetectably without any net-
work credentials.
As before, without the ability to read encrypted WiFi traffic directly, we process
the limited side-channel data available (timing and frame size measurements) to
facilitate remote app detection. These side-channel data measurements are rep-
resented as histograms and used to construct a Random Forest classifier capable
of accurately identifying mobile apps from the encrypted traffic they cause. The
Random Forest algorithm was able to correctly identify apps with a mean accur-
acy of ∼99% within the training set.
Following the successful feasibility study conducted in previous chapter, the clas-
sifier was then adapted to form the core of a detection program that could mon-
itor multiple devices in real-time. Tests in a closed-world scenario showed 84%
accuracy and demonstrated the ability to overcome the data limitations imposed
by WiFi encryption. Although accuracy suffers greatly (67%) when moving to an
open-world scenario, a high recall rate of 86% demonstrates that apps can un-
wittingly broadcast personal information openly despite using encrypted WiFi.
25

CHAPTER 1 Research Overview
The open-world false positive rate (38% overall, or 72% for unseen activity alone)
leaves much room for improvement but the experiment demonstrates a clear
and proven privacy threat. This work is currently awaiting review for publica-
tion alongside a condensed version of the feasibility and applications discussion
in the next chapter.
Chapter 9 – Threat Feasibility, Mitigation & Applications: This chapter con-
siders to what extent the techniques developed will generalise to similar scen-
arios. Real-world applications for these techniques are presented alongside their
caveats and potential approaches to mitigate their effectiveness. We assess the
cost and effort required for an interested observer to present a practical privacy
threat to the everyday WiFi user and ways to defend against accidental broadcast
of personal information are discussed.
Chapter 10 – Conclusion: This final chapter concludes the thesis and reiterates
the key research contributions.
26

2 Essential Concepts
This chapter sets the scene and outlines the essential concepts that form the founda-
tion of this thesis. Additional literature will be introduced as it is utilised in subsequent
chapters.
2.1 Ubiquitous Wireless Networks
Wireless networking is now an unavoidable feature of modern society; pervading homes,
business and almost everything between. This ranges from the typical WiFi (IEEE 802.11)
networks (‘WLANs’) employed by home users and businesses alike, but also includes
technologies such as LTE that are now a global standard for data access via cellular mo-
bile phone networks (Ghosh et al., 2010). Unless specifically indicated, this thesis uses
‘wireless network’ and ‘WiFi’ as shorthand for IEEE 802.11 communications. Although
of course there are many other wireless network protocols, IEEE 802.11 is the most ubi-
quitous and commonly referred to as ‘WiFi’ in everyday speech at the time of writing.
Dutton and Blank (2013) found that 96% of Britons with home internet access connec-
ted through WiFi as of 2013, up from 53% in 2009 and only 5% in 2005. An increased
availability of WiFi and cellular data plans has led to and coincided with an explosion
of popularity in mobile devices with 57% of households regularly using a phone or tab-
let to access the internet. WiFi has seen a similar rate of uptake for commercial use, so
much that specific technologies have been developed for the enterprise environment
(Murty et al., 2008).
WLANs are now so ubiquitous that companies such as Google and Apple are able to
use WiFi broadcasts alone to provide location services to mobile devices and provide a
lower-power alternative to Global Positioning System (GPS) in towns and cities through-
out the developed world (Google Inc., 2010; Apple Inc., 2010).
Figure 2.1 illustrates how a typical wireless device connects the the internet via a
27

CHAPTER 2 Essential Concepts
wireless Access Point (AP). The confidentiality of transmissions between these two are
(supposedly) protected from external eavesdropping by virtue of a wireless encryption
scheme.
WiFi networks are now almost ubiquitous. Although slower than traditional wired
networks, their popularity has been driven by the convenience of the mobile devices
that use them and the relative ease with which they can be set up. As with wired ethernet
networks, data is transferred in discrete blocks called frames (similar to the more com-
monly known ‘packets’ at the Network Layer). Although the physical implementation
of a wireless network differs greatly from their wired counterparts, the remaining logical
implementation is largely unchanged. This is a deliberate consequence of network pro-
tocol design reflected in the OSI model (Zimmermann, 1980). The OSI Model describes
how network protocols are designed as different ‘layers’ with different responsibilities.
The use of a wireless LAN instead of a wired LAN therefore only requires changes at
the Data-Link and (of course) Physical layer. Current generation wireless networking
technology interoperates according to the IEEE 802.11 group of standards (IEEE-SA,
2007, 2009). For example; 802.11b , 802.11g and 802.11n define wireless communica-
tions at progressively faster speeds. Other standards such as 802.11i (IEEE-SA, 2004a)
define how wireless communications can employ encryption to improve security as is
discussed in the next section.
Figure 2.2 shows the standard OSI Model (Zimmermann, 1980) which describes how
network protocols can be separated into different layers with different responsibilities.
Higher layers are reliant on the operation of those below them and their data is encap-
sulated by the communication mechanism of layers below. The 802.11 standards relate
Figure 2.1: Typical WiFi Network Setup
28

Essential Concepts CHAPTER 2
to the first two layers of the OSI Model only; Physical and Data-Link.
Figure 2.2: OSI Model Diagram (WikiMedia Commons (GFDL JB Hewitt), 2007).Adapted from Zimmermann (1980).
In summary, conceptually — although not always in practice — the OSI model defines
layers with specific responsibilities. The protocol at each layer performs its task and de-
fers responsibility for everything else to higher or lower layers as appropriate. The same
protocol stack is implemented by both the sender and receiver. Lower layers commu-
nicate data from higher layers through a method known as ‘packet encapsulation’ with
the data from higher layers often referred to as the ‘payload’. By this method the pay-
load encoded at one layer on the sender will be identical to the payload decoded at the
same layer by the recipient.
Changes to the underlying layers are therefore theoretically transparent to proto-
cols higher in the model. Similarly, a lower level protocol does not need to understand
the contents of its payload. For example, IP, TCP, UDP or application-specific protocols
and encryption should be entirely unaware and unaffected by a change at the Physical
Layer from a wired to a wireless network. The Data Link (or ‘MAC’) layer provides the
interface to support this transition with the IEEE 802.11 (wireless) (IEEE-SA, 2007) and
IEEE 802.3 (wired) (IEEE-SA, 2012) standards defining how data is transferred appro-
priately for the physical medium. For example, defining a collision detection scheme,
power saving information, and exchanging other information essential to efficient op-
29

CHAPTER 2 Essential Concepts
eration alongside the payload data itself. Internet-enabled apps on a smartphone are
similarly agnostic to as whether they are connected to WiFi or using mobile data for the
exact same reason (although conscientious developers can ask the smartphone oper-
ating system for this information to avoid expensive data charges) (Ghosh et al., 2010).
With a change in one layer not requiring changes in others, implementation is made
much simpler. However, from a security or privacy standpoint this can be worrisome:
data, behaviour or other information is exposed in ways the original implementers may
not have considered. As a consequence of moving from a physical to wireless transmis-
sion medium, user data becomes immediately more vulnerable due to the removal of
physical barriers as discussed in the next section. Furthermore, WiFi networks may op-
erate over distances far greater than one might expect with networks communicating
over hundreds of kilometres being demonstrated (Flickenger et al., 2008). While most
hardware is incapable of this, passive monitoring (which does not require the power-
hungry ability to transmit) can occur at distances greatly exceeding standard operating
range.
2.2 Security & Encryption
Users of WiFi would be forgiven for assuming that so long as the encryption being em-
ployed on their wireless network was not broken, the confidentially of the data being
sent across it (and related information about their activity) was securely protected. At
the core of the research presented in this thesis lies a challenge to this assumption.
The only thing that impedes direct visibility of wireless communication and access
to a particular network content is a WiFi encryption scheme. To set up this encryp-
ted connection, a user must first authenticate with the access point. This can be either
be via a pre-shared key (or ‘WiFi password’) as is common on most home routers or
through credentials for a dedicated authentication server (such as username/password
combinations as would be common in enterprise). Once authenticated this encryption
scrambles the data being transmitted over the wireless network such that only devices
with the correct decryption key can transform it back into the original data, as illus-
trated in Figure 2.3.
30

Essential Concepts CHAPTER 2
Figure 2.3: Packet Encapsulation Example
Security for wireless networks is focused on the encryption mechanism used to pre-
vent communications simply being read by an eavesdropper. Eavesdropping upon
wireless communications is obviously significantly easier than eavesdropping upon
those using standard cable networks due to the lack of physical barriers. WiFi encryp-
tion is applied at the Data-Link layer. Thus, as is illustrated on the right of Figure 2.3,
all communications in layers above are also concealed. Without WPA2 encryption (or
an alternative) the vast majority of communications would be transmitted in plain text
over the air. Although encryption may also be employed at higher layers, this tends
to be the exception rather than the rule. For example, some websites using HTTPS at
the Transport Layer to protect passwords or (e.g. in the case of internet banking) en-
tire sessions. Similarly, VoIP phone calls are usually encrypted. However, most internet
communications including email, web browsing and streaming have no additional se-
curity applied.
WEP (‘Wired Equivalent Privacy’) was the first widely adopted attempt to provide
security to wireless network communications. However, Wired Equivalent Privacy is a
misnomer. If the level of privacy was truly equivalent to wired networks, then the col-
lection of data as described in this thesis would be impossible. As noted in the previous
section, user data is routinely broadcast over a wide area from every WiFi device. Al-
though encrypted, the removal of physical barriers means that communications can be
received simply and undetectably. Previously such intrusion would require a physical
31

CHAPTER 2 Essential Concepts
wiretap inside a building.
Any compatible device within range is capable of receiving these transmissions.
With the relaxation of physical restrictions on network access, it only is the encryp-
tion method used to encode and decode communications between devices that the-
oretically preserves confidentiality between the sender and recipient. If discovered (as
has been the case with successive generations of encryption schemes), flaws allow the
supposedly secret keys to be calculated; allowing any and all communications to be
decrypted and read in plain-text by an attacker. Due to a flaw in its implementation,
WEP has been retired and superseded by the WPA2 (WiFi Protected Access, version 2)
encryption scheme. Although WPA2 (which was itself an improvement on the original
WPA) can still be vulnerable in certain configurations (Marlinspike et al., 2012), it re-
mains the accepted standard and is considered ”the only system that protects wireless
transmissions against electronic eavesdropping” (Gold, 2010). WEP should certainly
not be used as it was found to have a fundamentally flawed implementation that can
be trivially defeated in mere seconds (Bittau et al., 2006).
It is important to note that the work presented here does not seek to ‘break’ en-
cryption schemes in the same way. Instead of attempting to extract these secret keys
and read information directly, the method presented attempts to infer user activities
directly from the encrypted transmissions. However, the same ‘side-channel’ informa-
tion that implementations of crypto-systems often leak is utilised in order to do so. Ex-
cept in rare circumstances discussed further in the next section, these side-channels are
common to all communications and should therefore be exploitable regardless of the
encryption scheme employed. Since WiFi encryption is applied at the Data-Link layer,
only the 802.11 header can be read directly from encrypted frames carrying user data.
The remainder of the frame and the data within cannot be read directly. An unbroken
encryption scheme therefore leaves little information to work with. However, all WiFi
frames have their headers in plain sight. This allows for the communications between
specific devices to be isolated. Similarly, non-encrypted frames are easily identified be-
cause they are not marked as ‘protected’ in the frame header. Unprotected frames will
not carry user data, but are used for various functions of network management as dis-
cussed later in Section 5.2. This allows for simple filtering to leave only the interesting
32

Essential Concepts CHAPTER 2
frames containing actual user data. The following section details what information is
still measurable despite encryption and Chapter 5 elaborates as to how this information
can be used and interpreted.
2.3 Side-Channels & Inferring Personal Activity
Side-channels are any measurable phenomena that provides information about an oth-
erwise secure process. Described as “an often-overlooked threat” and no longer requir-
ing specialist equipment (Lawson, 2009), side-channels are seemingly inconsequential
measurements that can expose the secrets of a system.
Modern encryption relies on cryptographic ‘keys’ (actually very long binary codes)
that can be used to decrypt a communication remaining secret. In the case of wire-
less security, this key is usually derived from a passphrase or password in combina-
tion with other information. Except for validation purposes, the analysis performed in
this project assumes that the passphrase is not known and keys remain secure behind
sound cryptography and encryption procedures. However, to quote Schneier (2004),
“security is a chain; it’s only as secure as the weakest link” and that when it came to
real world use, the “weak points had nothing to do with the mathematics.” Flaws are
often the result of supposed ‘secrets’ not being kept secure in a wider, complex sys-
tem in which cryptography plays only a small part. A trivial example would be users
writing down passwords next to computers so they would not be forgotten, but can be
read by anyone. More subtle flaws can present themselves due to the implementation
of cryptographic systems. Even if mathematically sound, encryption requires a phys-
ical implementation and this may leak information that can be used to undermine the
system. Methods to defeat cryptography using this information are known as ‘side-
channel attacks’ where “a side channel is any observable side effect of computation
that an attacker could measure and possibly influence. Crypto is especially vulnerable
to side channel attacks because of its strict requirements for absolute secrecy” (Lawson,
2009).
The most well-known side-channel attacks are those that can be used to reverse
engineer the keys in cryptographic systems and therefore destroy the confidentially of
33

CHAPTER 2 Essential Concepts
any encrypted data. Kocher’s well known demonstrations of attacks against the then
widely-used RSA and DES encryption algorithms showed that analysis of power con-
sumption or response times could be used to severely undermine the strength of the
encryption process by narrowing down the possible keys that might have been used.
Those keys that remained could then be ‘brute-forced’ — tried exhaustively until the
correct one was found (Kocher, 1996; Kocher et al., 1999). Other side channels might
include any other physical output of a system implementation; from electromagnetic
to sound output or even blinking LEDs. In the military and security agencies, meth-
ods using emissions such as these to gain intelligence are known as TEMPEST attacks
and have been employed since at least the early 1960s (National Security Agency (USA),
1972). As a further example, side-channel information provided by clients reporting the
validity of communications was one of the flaws that made WEP insecure. By exploiting
a flaw in the protocol where the validity of transmissions was reported by the receiver,
malicious encrypted frames specially constructed by an attacker could eventually nar-
row down the key being used to secure communications (Borisov et al., 2001).
In contrast to the attacks above this research does not seek to use side-channels
to undermine and ‘break’ encryption schemes in the same way. Instead of attempting
to extract secret keys and read communication data directly, the method presented at-
tempts to infer user activity from the encrypted transmission. It is not an ‘attack’ as
such, but rather an investigation into what information about user activity is leaked
through the WiFi implementation despite encryption being in place.
Knowing what a user or users are doing can be valuable information. As a power-
ful example in this area is the investigation by McDaniel and McLaughlin (2009) into
the potential privacy implications of modern “Smart Grid” electricity supply devices.
They found that “energy use information stored at the meter and distributed thereafter
acts as an information-rich side channel, exposing customer habits and behavior”. The
original intention of these devices is laudable; to make power infrastructure more ef-
ficient by using improved reporting of consumption. However, although the only data
reported back by these devices was how much power was been used, it was done with
sufficient granularity (one minute intervals) to be able to distinguish the usage signa-
tures of different household appliances as shown in Figure 2.4.
34

Essential Concepts CHAPTER 2
Figure 2.4: Inferring Activities from Power Usage (Quinn, 2009)
As illustrated by Quinn (2009), this information could potentially then be used to
discern an incredible amount of information about the activities of individuals. For ex-
ample: how many people live there, when occupants were likely to be out of the house,
whether occupants often regularly came home conspicuously close to bar or church
closing time, whether the occupant is a restless sleeper, or if a parent had left a child
home alone. Aside from the invasion of privacy in itself, there is concern that this in-
formation could be sold to third party advertisers. Where these studies inferred inform-
ation from use of power, this study will investigate if information is divulged by network
side-channels in a similar way.
2.4 Network Activity Classification with Restricted Data
Prior research has also investigated the identification of network traffic and users with
various limitations on the data that can be accessed. Table 2.1 summarises these stud-
ies. Karagiannis et al. (2005) investigated classifying network traffic with limited data
under the premise that more traffic was likely to be encrypted and obfuscated in the fu-
ture and that this would be useful for routing purposes. They were able to classify data
despite deliberately not associated port numbers with applications. Similarly, Wright
35

CHAPTER 2 Essential Concepts
and Masson (2006) analysed TCP streams encrypted at the Transport Layer (thereby
obfuscating payload content) and were able to determine the underlying activities in
most cases by utilising machine learning techniques.
With a recent increasing interest in hosted ‘cloud’ services, the work of (Chen et al.,
2010) looked at popular healthcare and tax services using HTTPS (encryption at the
Application layer) to infer private information and show that “side-channel informa-
tion leak is a realistic and serious threat to user privacy”. Another study found that
it was possible to deduce certain categories of Google search despite the user con-
necting over encrypted HTTPS to a distributed Content Delivery Network (Iacovazzi
et al., 2013). Observing older implementations of the SSH login protocol showed that
password length could be deduced from the size of the packets sent to the server and
padding was added to secure the process (Monrose et al., 1999) and the anonymity-
preserving Tor network also added methods to obfuscate the timing and size charac-
teristics of traffic after it was shown that the process of visiting certain websites could
be ‘fingerprinted’ (Panchenko et al., 2011).
The huge power of limited information is shown in the inspired study by White et al.
(2011) who showed that packet size and timing information could be used to recon-
struct entire conversations from encrypted Skype packets alone. By mapping these
sequences to spoken English phonemes, followed by probabilistic reasoning using a
language model, they were able to extract information about the spoken phrases des-
pite Skype’s encryption scheme. Although the authors were disappointed with general
case performance, the ability for it to work in some cases is still alarming given the de-
liberate effort taken to encrypt and obscure these communications. Their method did
require exact isolation of the Skype traffic (very difficult over encrypted WiFi) and fails
with slight changes from the language model (e.g. regional accents), but nevertheless
shows the extreme power of mere side-channel data. However, all these studies are
undertaken from a position within the network. While the challenges in dealing with
encrypted traffic are similar, any adversary must have a position of privileged access
like that of a network administrator or Internet Service Provider.
The analysis in this project will rely on even less information because encryption
is applied at lower level (Data-Link layer). However, the previous work outlined in this
36
Essential Concepts CHAPTER 2
Tab
le2.
1:N
etw
ork
Act
ivit
yD
etec
tio
nLi
tera
ture
Sum
mar
y
Au
tho
rVa
nta
geP
oin
tE
ncr
ypti
on
Ove
rco
me
Iden
tifi
esM
etri
csM
etri
cTa
rget
Dat
aU
tili
sed
Kar
agia
nn
iset
al.(
2005
)In
tern
alN
on
e(b
ut
excl
ud
esce
rtai
nd
ata)
Ap
plic
atio
n/T
raffi
cTy
pe
Tota
lp
acke
tco
un
t,to
tal
byt
eco
un
t,av
erag
eu
tiliz
atio
np
ertr
affi
cfl
ow&
iden
tifi
ers
inp
ay-
load
con
ten
t
Traf
fic
flow
to/
fro
m1
IPIP
Ad
dre
ss,
pro
toco
l,p
ort
,fu
llp
aylo
adco
n-
ten
t,p
acke
tco
un
t,p
acke
tsiz
eW
righ
tan
dM
asso
n(2
006)
Inte
rnal
Laye
r4
(TC
P)
Ap
plic
atio
n/T
raffi
cty
pe
Ord
ero
fvec
tors
ofp
acke
tsi
zes/
inte
rarr
ival
ino
rder
ofa
rriv
alti
me
TC
P-o
nly
flow
bet
wee
n2
IPs
Pack
etsi
ze,t
imin
g,d
irec
-ti
on
,co
un
t
Ch
enet
al.
(201
0)In
tern
alLa
yer
7(H
TT
PS)
Act
ion
bei
ng
per
form
edb
yu
ser
Ord
ero
fpac
kets
izes
infl
owFl
owb
etw
een
2IP
sPa
cket
Size
,pac
ketc
ou
nt,
ob
ject
size
so
nw
ebsi
teIa
cova
zzi
etal
.(20
13)
Inte
rnal
Laye
r7
(HT
TP
S)Ty
pe
of
sear
ch(t
ext,
im-
age.
..)
bei
ng
per
form
edan
d(p
ote
nti
ally
)ex
act
qu
ery
Seq
uen
ceo
fpac
kets
izes
,tim
ings
TC
P-o
nly
flow
to/
fro
m1
IPIP
,p
acke
tsi
ze,
pac
ket
cou
nt,
pac
kett
imin
gs
Mo
nro
seet
al.(
1999
)In
tern
alLa
yer
7(S
SL)
Pass
wo
rdch
arac
ter
len
gth
,lik
ely
char
acte
rsK
eyst
roke
pac
ketd
ura
tio
n,l
aten
cyFl
owb
etw
een
2IP
sPa
cket
tim
ings
,p
acke
tco
un
tPa
nch
enko
etal
.(20
11)
Inte
rnal
Tor
Web
site
visi
ted
Tota
lpac
kets
,to
talb
ytes
,%in
com
ing
pac
kets
,o
ccu
rrin
gp
acke
tsiz
esTo
r-o
nly
flow
to/
fro
m1
IPPa
cket
size
,pac
ketc
ou
nt,
dir
ecti
on
Wh
ite
etal
.(2
011)
Inte
rnal
Laye
r7
(Sky
pe)
Spo
ken
wo
rds
Seq
uen
ceo
fpac
ketl
engt
hs,
tim
ings
Ou
tgo
ing
Skyp
etr
affi
cst
ream
Pack
etsi
ze,
pac
ket
tim
-in
gs,p
acke
tco
un
t,d
irec
-ti
on
Ch
eng
etal
.(2
013)
Ext
ern
alN
on
eU
np
rote
cted
iden
tity
,lo
c-at
ion
,fi
nan
cial
,so
cial
&p
erso
nal
dat
a
No
ne
N/A
MA
C,
IPA
dd
ress
,p
ro-
toco
l,p
ort
,fu
llp
aylo
adco
nte
nt
Zh
ang
etal
.(2
011)
Ext
ern
alLa
yer
2(8
02.1
1)A
pp
licat
ion/T
raffi
cTy
pe
Dat
ara
te(p
erd
irec
tio
n),
Fram
esi
ze(c
ateg
or-
ies,
mea
n,
med
ian
,va
rian
ce),
Fram
ein
tera
r-ri
val
tim
e(m
ean
,m
edia
n,
vari
ance
),C
oar
sefr
ame
size
dis
trib
uti
on
(500
byt
ew
ide
bin
s),
Tota
lnu
mb
ero
ffra
mes
(per
dir
ecti
on
)
Tim
eW
ind
owM
AC
,fr
ame
size
,fr
ame
tim
ings
,fra
me
qu
anti
ty
Th
isw
ork
Ext
ern
alL
ayer
2(8
02.1
1)A
pp
lica
tion/T
raffi
cTy
pe,
pot
enti
ally
sen
siti
vep
er-
son
alin
form
atio
n
Full
fram
esi
zed
istr
ibu
tion
(1by
tew
ide
bin
s)p
erd
irec
tion
,In
tera
rriv
alT
ime
dis
trib
uti
on(≤
3ms
wid
ebi
ns)
per
dir
ecti
onco
mbi
nat
ion
Tim
eW
ind
owM
AC
,fr
ame
size
,fr
ame
tim
ings
,fra
me
quan
tity
37

CHAPTER 2 Essential Concepts
Figure 2.5: Available WiFi Side-Channel Data
section has shown that limited information and encryption do not prevent analysis;
they just make it more difficult. With all useful data obfuscated as described earlier
in this chapter, we must instead rely on ‘side-channels’ or ‘metadata’ (data about the
data). These measurements outlined in Figure 2.5, can be analysed for patterns that
can be used to discern or ‘fingerprint’ certain network activities. As is demonstrated as
the thesis unfolds, this simple information may be further analysed to denote private
information about the device or user creating the network traffic.
Although not exploiting any side-channels, Cheng et al. (2013) investigated leaks
from open WiFi hotspots, finding an incredible wealth of personal information. Al-
though not necessarily observable directly, these details could be inferred from identi-
fiers and other information that was openly broadcast. They them proceeded to char-
acterizing privacy leakage in terms of the identity, location, financial and social data
discovered. The work of Zhang et al. (2011) presents work that is most similar to this
work in experimental terms. Observing from the same external vantage point, they
were able to use machine learning (hierarchies of Support Vector Machines and Ra-
dial Basis Function Networks) to attempt to infer activity on a wireless network without
breaking encryption. With a reported accuracy upwards of 80%, they were able to differ-
entiate between several broad categories of network activity: “web browsing, chatting,
online gaming, downloading, uploading and video watching”. However, accuracy fell
greatly when observing simultaneous traffic, with BitTorrent being particularly good at
hindering the detecting of other activity. As shown in Table 2.1 the distributions used in
this work provide much richer, finer grained metrics than the sums, means, medians,
variances, and relatively coarse distributions they use.
Except in special circumstances, these side-channels are common to all network
communications. Although the research presented in this thesis is focused on WiFi,
38

Essential Concepts CHAPTER 2
the same side-channel information and techniques should generalise to other encryp-
ted communication methods. One particularly noteworthy generalisation would be
to cellular data transfer protocol technologies such as 4G LTE (Stefania et al., 2009).
Aside from WiFi, this is the internet connection method for mobile devices like those
studied in Chapter 8 and has a much larger operating range. Specially designed VPNs
(Schulz et al., 2014) and anonymity networks such as Tor (Perry, 2011) can pad frame
sizes, adjust timings, and intermix network traffic to thwart traffic analysis. However,
these methods have not seen wide deployment and incur significant performance pen-
alties. A network with optimal throughput will attempt to send data as fast as possible
only when required (causing predictable timings), and only as much data as is needed
(causing predictable frame sizes). Shifting priority away from maximum throughput
introduces significant overhead by necessity, and is especially problematic for mobile
devices where performance is at a premium due to battery life limitations. While these
solutions exist, they are unlikely to see widespread deployment on consumer devices
in the short or medium term.
2.5 Summary
With these foundations, discussion and analysis of the specifics of inferring user in-
formation from observable WiFi communications can begin. Additional information
and supplementary academic literature will be introduced as it is required. However,
as explicitly noted this chapter, the security and privacy implications of these studies
are potentially worrisome. It is prudent to first consider the ethical precautions and
data-collection limitations that should be observed in this field of research. Therefore,
the next chapter outlines the basic experimental scenario and how these precautions
were be built into the experimental process.
39

CHAPTER 2 Essential Concepts
40

3 Handling of Leaks:Experimental Foundations
This chapter presents a basic scenario to monitor, intercept, capture and store encryp-
ted WiFi communication data and outlines how this research will map observable en-
crypted wireless network traffic to user activities. Unless overly restricted, this pro-
cess will interact with devices external to the research scenario and the capture of data
from individuals otherwise uninvolved with these studies. Furthermore, any security
and privacy research is potentially dangerous if not carefully managed. Therefore this
chapter also presents an ethical analysis of the research and the steps undertaken to
mitigate or nullify the risks involved.
3.1 Experimental Design & Adversarial Model
Figure 3.1 illustrates the scenario that forms the foundation of all experimental envir-
onments to follow. This scenario reproduces a standard wireless network infrastructure
whereby user devices — in this case a laptop — connect to the internet via a stationary
access point.
Figure 3.1: Observing Encrypted WiFi Traffic
This is the most common form of WiFi network and given their prevalence will likely
be instantly familiar to the reader. In this model devices need only connect to dedic-
ated Access Points (APs) that are wholly responsible for routing. This ‘infrastructure
41

CHAPTER 3 Handling of Leaks: Experimental Foundations
mode’ is the setup used recognisable for its use in enterprise networks (e.g. EduRoam),
home wireless routers (the router is the dedicated access point), and wireless hotspots.
It is also very similar to the model used by cellular mobile phone networks whereby
a cellular tower provides dedicated voice and data service access to nearby phones.
The alternative to this model is ‘ad-hoc’ wireless networks whereby devices have a flat
hierarchy (i.e. no specially designated Access Points) and must route packets between
themselves and are jointly responsible for service provision. This alternative network
configuration is not used in these studies, but could be analysed using the exact same
tools.
In addition to a normal user connecting to the network to access internet services
as intended, our scenario includes an adversary observing or ‘monitoring’ the commu-
nications of this user. This adversary is not necessarily malicious, but is attempting to
uncover information about the activities of the user without breaking the encryption of
the wireless network. This research seeks to determine to what degree the adversary’s
goal can be achieved. The adversary has no privileged access to the network. This en-
tails that the adversary has:
• No access credentials or decryption keys (and does not seek to uncover them).
• No ability to authenticate or connect to the network (and does not interact with
APs or devices in any way).
• No circuitous ability to read data from ‘inside’ the network.
Therefore anything encrypted by a user device or access point will remain encrypted.
The adversary is therefore:
• Entirely passive.
• Undetectable.
• Can operate anywhere within WiFi reception (not transmission) range.
WiFi encryption prevents any observer without a specific secret key from reading the
broadcast data. This work does not attempt to break the WPA2 encryption scheme or
any other security mechanisms employed by the network. Instead, data gathered des-
pite encryption is utilised to show that encryption alone is insufficient to prevent the
42

Handling of Leaks: Experimental Foundations CHAPTER 3
revelation of details about a user’s activities. Encrypted WiFi’s current WPA2 imple-
mentation does not obscure the measurable variables of frame quantity, sender and
recipient, transmission timing, or frame size (nor do any implementations proposed,
or used previously). As will be demonstrated in later chapters, it is possible to deduce
user activity via statistical analysis by merely observing encrypted network activity.
‘User activity’ refers to a WiFi user’s actions or behaviour at the time of observation.
For example, whether a user is using Skype, streaming music, or browsing the inter-
net. In later research it is shown that analysis can provide surprisingly precise detail
regarding a user’s activities. Furthermore, it is also possible to tie certain user activities
to particular personal information about a user. The user is unlikely to realise that this
personal information is being broadcast over a wide area.
Successive experiments will incorporate more complex scenarios than that shown
in Figure 3.1. Larger scale wireless networks such as EduRoam to test the robustness
of our analysis. We may therefore collect data from other network users. Although we
are primarily only interested in specific encrypted communications, all WiFi networks
use similar hardware and same set of broadcast frequencies. It is inevitable that an ob-
server will also record data from devices that are not directly involved in experiments.
Furthermore, some of these communications may not use encryption. This data may
be retained as it may be useful to analyse in the case of interference or unexplained
variation in the results. As will be discussed in the next section, care will have to be
taken with this data so that the confidentially of any unintentionally observed data is
preserved. This is even the case for even encrypted data because it cannot be guaran-
teed that the encryption scheme will remain secure forever and (by the very nature of
encryption!) the sensitivity of the data contained within cannot be determined.
3.2 Inferring Information from Network Activity
Wireless network communications are broadcast openly with the assumption that en-
cryption makes their contents unreadable. This may not always be the case, but for the
purposes of activity inference it is assumed that this holds true. Therefore, the actual
content of communications cannot be analysed without an impractically large invest-
43

CHAPTER 3 Handling of Leaks: Experimental Foundations
ment of time and resources to discover the secret key. Instead it is hypothesised that it
is possible to identify users’ activities by merely observing the encrypted network traffic
they generate.
Users interact with computer programs to perform a various tasks. If this task re-
quires any kind of internet service, then this will result in the generation of network
traffic. Therefore, certain user activity will map to (i.e. cause) certain network activity
as shown in Equation 3.1.
User activity−→ Application activity−→Network activity (3.1)
∴ User activity−→Network activity
The ability to identify user activity from network traffic requires that some form of re-
verse mapping holds as well, as shown in Equation 3.2. For network activity to com-
pletely and uniquely identify user activity a total, one-to-one, bidirectional relationship
would need to be constructed. This mapping would be the ideal solution, however un-
covering such a perfect mapping is unlikely.
User activity?←−Network activity (3.2)
Furthermore, the study conducted in Chapter 8 shows how the ability to detect user
activities can reveal private information about the user him/herself as denoted in Equa-
tion 3.3.
Personal Information?←−User activity ?←−Network activity (3.3)
∴ Personal Information?←−Network activity
As fully described later in the next chapter, it is relatively easy to collect data that de-
scribes the mapping in Equation (3.1) because user activity can be controlled and the
ensuing network activity recorded. However, the observable network activity inform-
ation will be limited by the use of encryption and obscured by interference and the
44

Handling of Leaks: Experimental Foundations CHAPTER 3
emergent non-determinism of computer systems. It is expected that observable net-
work activity will still exhibit identifiable features, but constructing a reverse mapping
with such sparse data is a challenging problem. The research presented in this thesis
assesses the feasibility and practicalities of identifying these features and constructing
this mapping so that user activity can be inferred from the observable encrypted net-
work transmissions. In practice given the difficulties that encryption and noise impose
on collecting and observing network data, it is likely that such a mapping can be shown
to hold with a certain degree of accuracy instead.
3.3 Ethical Considerations
This section examines the ethical issues surrounding research into how commonplace
wireless networking technology may leak information about the activities of the people
using it. The fundamental ethical validity of this kind of research is discussed and vari-
ous written guidelines from relevant partner organisations and professional bodies to
help ensure it is performed in a proper fashion are identified. Finally, the three most
pertinent ethical issues are picked out and analysed before the conclusions about how
this research should be conducted are presented.
3.3.1 Ethical Challenges in Information Security
As is often the case in the field of computer security, the tools used in this body of work
have the potential to be used either maliciously or virtuously. As such, practitioners
should consider the ethical and legal implications of their use before wielding such
‘dual-edged swords’.
In order to assess the security of any system – technological or otherwise – it is es-
sential to know its flaws and vulnerabilities. Investigating such vulnerabilities can be
a double-edged sword. The very same knowledge required to help secure and under-
stand a system can also be used to undermine and attack it. The question is therefore:
do the benefits as a whole outweigh the risks? Renowned information security expert
Schneier (2008) writes,
“Unequivocally, yes. Despite the risks, vulnerability research is enormously
45

CHAPTER 3 Handling of Leaks: Experimental Foundations
valuable. Security is a mindset, and looking for vulnerabilities nurtures that
mindset. Deny practitioners this vital learning tool, and security suffers ac-
cordingly.”
This ‘adversarial mindset’ and approach to research is even considered essential and
endorsed by the likes of the United States military, a relatively risk-averse and authorit-
arian organisation (Conti and Carol, 2012). On balance the publication of research like
this is accepted and encouraged so that the knowledge required to improve security is
widely available. To mitigate any benefits given to potential attackers, the concept of
‘responsible disclosure’ is espoused and will be discussed in the sections following.
Of course, the unauthorised interception of communications and access of com-
puter systems is prohibited under law in most countries with the Data Protection Act
(Great Britain, 1998) and Computer Abuse Act (Great Britain, 1990) being the key le-
gislation in the United Kingdom. Therefore, legally and ethically permission should
therefore be sought from the owners of any device under observation.
However, less obvious is the fact that it is very easy to unintentionally collect the
communications of additional users and devices. Multiple WiFi networks often use the
same channel and channel frequencies overlap, meaning that data from these networks
can easily be recorded alongside any targeted communications. Practitioners should
therefore ensure they have a mechanism to identify then filter, anonymise or otherwise
purge communications not intended for observation. The easiest way to do this is to
filter out any communication from devices that are not part of the study.
If collecting from volunteers, Data Protection legislation states that any data collec-
ted on individuals is the responsibility of the collector. This is particularly important
in the case of sensitive data (e.g. sexuality, age, ethnicity) and personal identifying data
(which might include names, email addresses etc.). Unless volunteers are prevented
from using internet services as they would normally, it is highly likely that informa-
tion of this kind will be transmitted and recorded. Given the potential volumes of data
recorded and the additional complication of it being hidden behind a wireless encryp-
tion scheme, it is hard to even identify if this data exists. Unless specifically required,
it may therefore prudent to wipe all of the encrypted payload. Otherwise practitioners
46

Handling of Leaks: Experimental Foundations CHAPTER 3
may wish to store collected data using stronger on-disk encryption, such as TrueCrypt
(TrueCrypt Documentation, 2014).
3.3.2 Codified Guidance
This research is part jointly funded by EPSRC1 and Selex ES2. It is therefore important
to examine the stated ethical codes of both entities, and reconcile any differences that
may arise.
Furthermore, UCL has its own research ethics framework (UCL, 2012) by which
all students and staff are bound. These are very much aligned with EPSRC’s, whose
guidelines are defined in the Research Councils UK Code of Conduct (RCUK, 2011).
Combined, these provide a definition of what constitutes legitimate ethical research.
At their core they define basic ethical principles, which are perhaps best summarised
by Pimple (2009):
1. Be honest.
2. Be fair.
3. Do no harm.
In addition, these codes of ethical research conduct specifically highlight the denounce-
ment of plagiarism, the issue of informed consent for research participants, and the
conscientious collection of personal data to be discussed in greater detail later. In con-
trast, as a business Selex ES has a very different code of conduct. It is primarily con-
cerned with employees operating within the law and explicitly condemns any form of
corruption or activities that will harm its shareholders or the reputation of the company
(Selex ES, 2012).
Professional engineering bodies such as the IET and IEEE also have their own eth-
ical guides. Usefully, these professional bodies span both academia and industry. How-
ever, of particular interest is the code of ethics from the Institute of Information Security
Professionals (IISP, 2007). Importantly, as a rather specific facet of the field, it explicitly
outlines the concept of responsible disclosure:
1The Engineering & Physical Sciences Research Council (of Great Britain), publicly funded.2A technology company operating primarily in the defence sector, commercial.
47

CHAPTER 3 Handling of Leaks: Experimental Foundations
“[Members must] respect the confidentiality of information acquired dur-
ing the course of their duties and should not use or disclose any such in-
formation without proper and specific authority or unless there is a legal or
professional requirement to do so.”
Government legislation of particular relevance includes the Computer Misuse Act (Great
Britain, 1990) and Data Protection Act (Great Britain, 1998), for which UCL has a dedic-
ated process to aid compliance. These laws are closely intertwined with ethical research
policy.
3.3.3 Ethical Analysis
Three prominent and challenging ethical issues have arisen from the previous discus-
sion. The initial risk, affected stakeholders, potential mitigation methods and residual
risk presented by the following issues will be analysed:
Issue 1: Participant Consent
Issue 2: Data Protection
Issue 3: Publication & Responsible Disclosure
Participant Consent
Standard off-the-shelf consumer WiFi technology can have a range of anywhere between
30 and 200m, depending on environmental conditions and the precise technology be-
ing used (Belanger, 2007). In a dense urban environment like that surrounding UCL
and most residential areas, picking up data from users unaware of our experiment will
be almost unavoidable.
UCL has strict guidelines about informed participation in experiments, obtaining
consent to use data, and the ability to withdraw from experiments at any time. How-
ever, although we can identify devices by their unique MAC address identifiers, we can-
not directly link them to a person. If we wished to directly use their data, we would
therefore be in a position where we would require the consent of someone we cannot
identify. Furthermore, we have no way of excluding special groups like those under 18
years of age.
48

Handling of Leaks: Experimental Foundations CHAPTER 3
There is also the unclear distinction as to which WiFi information is public (and
therefore does not require direct consent), given that WiFi technology has openly broad-
cast it over a public area, on a public transmission spectrum, and it is similarly access-
ible by anyone else who cares to look. We are not using their data itself (it is probably
encrypted anyway), but rather recording information about how that data itself is sent
(the side-channels discussed in the previous chapter).
This is a complex scenario. However, parallels can be drawn between our research
methods and the controversy surrounding Google’s StreetView data collection. While
taking photographs (on public roads) to aid visual navigation in Google Maps, Google
also recorded WiFi data (MAC addresses and network names) as these cars were driv-
ing. Mapping stationary access point identifiers to specific locations was performed
to aid its mobile device geolocation services as a supplement to GPS. However, they
also recorded and retained some communications being broadcast alongside this in-
formation. Although not analysed, this included some user data, both encrypted and
unencrypted.
The unprecedented collection of this data on such a wide scale lead to legal invest-
igations in both the United States and Europe. In the UK, an investigation was begun
by The Information Commissioner’s Office (ICO). The Office found that,
“[It] is unlikely that Google will have captured significant amounts of per-
sonal data. There is also no evidence as yet that the data captured by Google
has caused or could cause any individual detriment.” (ICO, 2010)
But interestingly still stated,
“Nevertheless it was wrong to collect the information. We will be alerting
Privacy International and others who have complained to us of our posi-
tion.” (ICO, 2010)
So while it was decided that no-one’s privacy was actually compromised, they found
the practice to be unethical. Our experiment is for a different purpose and is on a
vastly smaller scale, however it will still be prudent to minimise the amount of person-
ally identifying information that we collect. To effectively remove information directly
49

CHAPTER 3 Handling of Leaks: Experimental Foundations
pertaining to individuals from our experiment, but retain information about their in-
fluence on network activity, we will take steps to remove their data as is detailed in the
next section. If we are not using their data and it is immediately discarded (as would
usually occur automatically with WiFi hardware), then consent is not required.
Data Protection
Although UCL has an institutional responsibility, it is the responsibility of researchers to
ensure that UCL is aware of the data being collected and following the rules it prescribes
to comply with data protection law.
Similar to the inability to receive consent from unknowing participants discussed
in the previous section, we cannot know a priori what information may be collected.
This is further complicated by the fact that most of this data will be encrypted so it is
impossible to look even if that was appropriate. Although specific devices can be iden-
tified, data from them cannot always be completely discarded because it may be neces-
sary to understand the interoperation between devices for our analysis and understand
the emergent operation of the network.
Even once the data is collected, we cannot know what information is contained
within without breaking the encryption. Although technically possible, it is prohib-
itively difficult to decrypt all the collected data and would serve no useful research be-
nefit. Sensitive and personal data requires special consideration under the Data Pro-
tection Act (Great Britain, 1998) but we cannot know whether such data exists within
our collected datasets.
The Act also requires data to be stored for only as long as is necessary, although this
is potentially at odds with UCL’s requirement that data directly pertaining to research
be retained for 10 years. In the view of UCL, such long retention is necessary for cred-
ible and verifiable research. Although the encryption is problematic to decrypt with
current generation technology and knowledge, security is an iterative process and it is
a recurring trend that encryption schemes are broken over time. As discussed in the
previous chapter, the deprecated wireless encryption schemes of WEP, WPA (version
1), and many schemes before them for different applications have been broken. Even
those that remain mathematically secure, become increasingly ineffective as techno-
50

Handling of Leaks: Experimental Foundations CHAPTER 3
logy improves and their secret keys become easier to guess by brute force (Bittau et al.,
2006). It is reasonable to assume that the information within our datasets will be easily
accessible in ten years.
When we are aware that we have collected data from devices external to our ex-
periment. If used and not immediately discarded, we must therefore assume that it
contains private and sensitive information. However, the real data ‘payload’ part of
collected frames can be overwritten with junk data without effecting the metrics we are
using (e.g. size, timing) in our analysis or the results of our experiment. Our datasets
will therefore be free of sensitive data in the direct sense.
However, inferred information could also potentially be sensitive. For example, as
studied in Chapter 8 it may be possible to identify patterns in network activity that
strongly correlate to the use of a mobile app tailored for gay dating. This is something
that cannot be mitigated, but the risk remains very minimal given that we cannot dir-
ectly tie a device identifier to a real person without actively attempting to locate the
device after the fact. This risk can be mitigated on recorded data by modifying device
identifiers so that they are anonymising and different from those truly observed.
In the field of network analysis, it is common for institutions to collaborate and
share data. Projects such as CRAWDAD (Dartmouth College, 2012) exist to provide a
wider variety of data sources to help drive better understanding. Programmes like this
are already in use and well scrutinised. Submissions to them are fully anonymised (in-
cluding even device identifiers) and have all payload data removed in the same way
as our collected data would. Should be ever wish to participate in this or similar pro-
jects, we will of course adhere to these rules but they can also act as a guide for our own
anonymisation efforts.
Publication & Responsible Disclosure
As embodied in the guidelines of institutions such as the IISP noted earlier, security
professionals have an ethical obligation to ensure that their knowledge is shared in a
responsible manner. This ideal is commonly referred to as ‘responsible disclosure’.
The most obvious part of this process is allowing those responsible for the security
of a system access to your results before would-be attackers. This allows time for any
51

CHAPTER 3 Handling of Leaks: Experimental Foundations
security risk to be fixed or mitigated before a flaw is made public. Not doing this not
only potentially harms the owners of a system, but also their customers/users. Fur-
thermore, not respecting the viewpoint of system owners can greatly hinder coopera-
tion between you, your research institution and the wider academic community and
therefore adversely affect research into the security field as a whole.
Not only is this the ethical responsibility of the researcher, in the United Kingdom
he/she could also potentially be found legally responsible. A somewhat vague section
of the recently amended Computer Misuse Act (Great Britain, 1990) states that,
“A person is guilty of an offence if he supplies or offers to supply any article
believing that it is likely to be used to commit, or to assist in the commission
of, an offence” where “an article” is defined as “any program or data held in
electronic form.”
However, responsible disclosure cuts both ways. As noted in the IISP caveat that mem-
bers “should not use or disclose any such information without proper and specific au-
thority or unless there is a legal or professional requirement to do so” (emphasis ad-
ded). Since professionals are ethically bound to more wide-ranging moral code, if a
researcher believes the inaction of an organisation is harming its users — perhaps for
financial gain or reputation reasons — then it is ethical to announce any flaws so that
users may make an informed choice and/or attempt to pressure an organisation into
fixing a problem. This would similarly apply to whistle-blowing security professionals
within an organisation.
However, unethical action by another party does not morally excuse unethical ac-
tions undertaken by oneself. It is therefore the responsibility of the researcher to do
all in their power to effect change before resorting to actions that might damage the
reputation, financial security or work of others. Large organisations are likely to have
layers of bureaucracy so ethically communicating security problems may require time
and perseverance.
Our research concerns WiFi security; a set of technologies that have become pervas-
ive world-wide. The nature of this specific research project means that finding a specific
serious flaw is unlikely. However, more likely minor flaws that are only problematic in
52
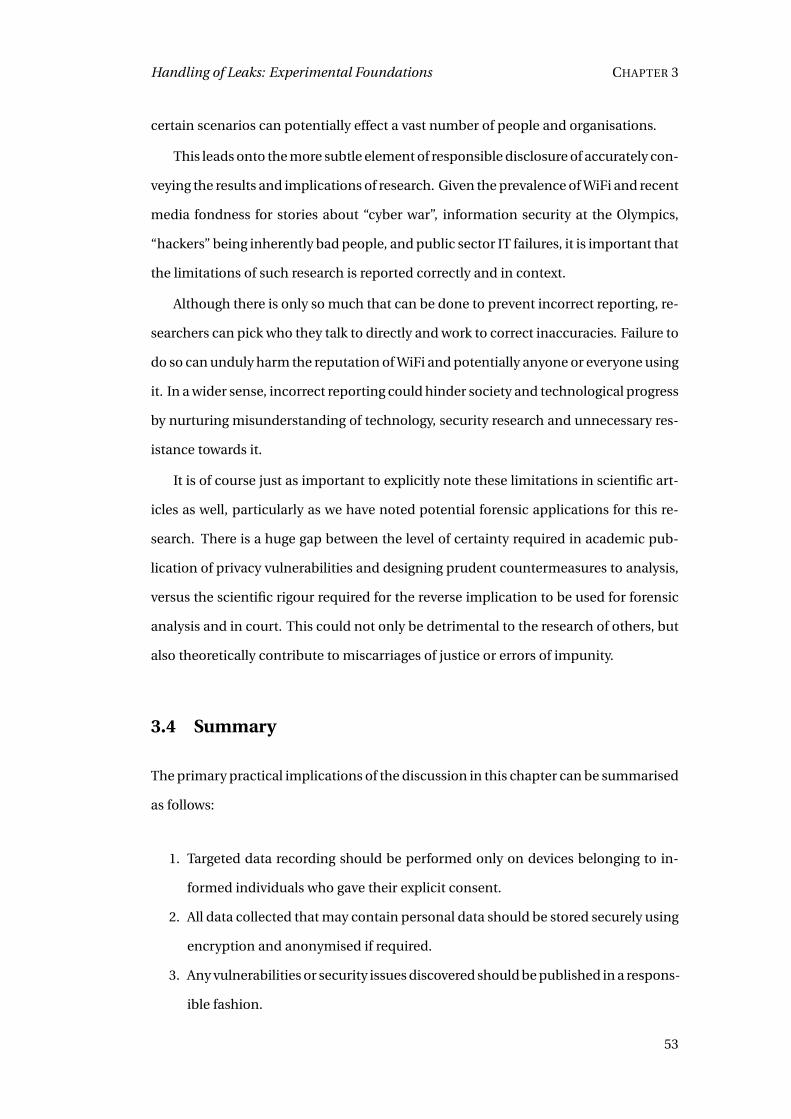
Handling of Leaks: Experimental Foundations CHAPTER 3
certain scenarios can potentially effect a vast number of people and organisations.
This leads onto the more subtle element of responsible disclosure of accurately con-
veying the results and implications of research. Given the prevalence of WiFi and recent
media fondness for stories about “cyber war”, information security at the Olympics,
“hackers” being inherently bad people, and public sector IT failures, it is important that
the limitations of such research is reported correctly and in context.
Although there is only so much that can be done to prevent incorrect reporting, re-
searchers can pick who they talk to directly and work to correct inaccuracies. Failure to
do so can unduly harm the reputation of WiFi and potentially anyone or everyone using
it. In a wider sense, incorrect reporting could hinder society and technological progress
by nurturing misunderstanding of technology, security research and unnecessary res-
istance towards it.
It is of course just as important to explicitly note these limitations in scientific art-
icles as well, particularly as we have noted potential forensic applications for this re-
search. There is a huge gap between the level of certainty required in academic pub-
lication of privacy vulnerabilities and designing prudent countermeasures to analysis,
versus the scientific rigour required for the reverse implication to be used for forensic
analysis and in court. This could not only be detrimental to the research of others, but
also theoretically contribute to miscarriages of justice or errors of impunity.
3.4 Summary
The primary practical implications of the discussion in this chapter can be summarised
as follows:
1. Targeted data recording should be performed only on devices belonging to in-
formed individuals who gave their explicit consent.
2. All data collected that may contain personal data should be stored securely using
encryption and anonymised if required.
3. Any vulnerabilities or security issues discovered should be published in a respons-
ible fashion.
53

CHAPTER 3 Handling of Leaks: Experimental Foundations
It should be noted that this security research is placed under closer ethical scrutiny
than would be common in other scenarios. A variety of applications for this research
and the implications of our findings are discussed in Chapter 9. Any commercial en-
terprise looking to apply this research will likely have less institutional ethical and data
protection guidance, although they are still bound by law. Law enforcement itself is im-
mune to many of these legal restrictions so long as it can be justified as part of a crim-
inal investigation. Certain companies (Selex included) can also be granted exemptions
when developing tools for law enforcement use. Finally, criminals that misuse WiFi
data will pay no heed to any ethical or legal restrictions whatsoever. Data collection for
this research is therefore much more restricted than it would be in many of its potential
applications or if being performed maliciously.
The next chapter describes the construction of a framework to collect WiFi data.
By incorporating the ethical requirements outlined in this chapter into all studies de-
scribed in subsequent chapters, this collection can be performed ethically, legally, and
responsibly.
54

4 Acquiring Data:How to Collect Drips
This chapter describes the methods used for the collection of ‘raw’ WiFi data. As will
be discussed in subsequent chapters, this data can later be submitted for filtering, pro-
cessing or analysis. This raw data is observed at the data-link layer. As already dis-
cussed, higher level layers are obscured from view due to the use of WiFi encryption.
It is possible to analyse even lower level Physical Layer activity with dedicated hard-
ware as shown in research like that of Danev et al. (2012) where they identified specific
instances of wireless hardware using only the physical characteristics of their commu-
nications. However, the focus of the studies in this thesis is to infer user activity despite
encryption where users are assumed to have legitimate access to the network and no
reason to act against current WiFi standards and deliberately obscure their (device’s)
identity. Any patterns in user activity should be fully represented at the data-link layer
and identifiable by MAC address because these users will only interact with the network
using standard programs via the operating system. Data collection efforts are therefore
focused on the data-link layer.
The implementation detailed can perform this entirely passively using only cheap
commodity hardware and freely available software. A paper (Atkinson et al., 2014a)
containing a condensed version of the hardware and software platform description
found in this chapter was published as reference for other researchers and practitioners
wishing to explore activity inference without breaking encryption.
4.1 Implementing a WiFi Collection Platform
To collect data showing network activity, a typical wireless network was set up. This
consisted of a single access point (AP) to which client devices can connect using com-
modity hardware. These studies were performed on a variety of wireless networks. In-
frastructure typical of a home router’s WiFi network or EduRoam (the university-wide
55

CHAPTER 4 Acquiring Data: How To Collect Drips
WiFi network), has already been illustrated in Figure 3.1. For data collection on a net-
work wholly controlled by the researcher, this AP took the form of a ‘MiFi’ dongle as
shown in Figure 4.1. This provided internet connectivity through the cellular 3G mo-
bile network. The local wireless network provided access via 802.11g (max 54Mbit/s)
using WPA2 encryption with a shared secret passphrase (which is believed to be a se-
cure encryption method at the time of writing). Other configuration options were left
with their default settings.
Figure 4.1: Observing Encrypted WiFi Traffic using ‘MiFi’
With full control of this network it was possible to ensure that only chosen devices
(and therefore only chosen users) could connect and pick a communication channel
(frequency) with minimal congestion. Frequency saturation and interference is dis-
cussed further in the next section. Similarly, as this network configuration is experi-
ment specific it simplifies any ethical considerations relating to privacy that would arise
from capturing network traffic from an existing network with users who are not expli-
citly part of the experiment. To aid comprehension, this thesis adopts the convention
of colouring data throughout:
• Data sent from a user device in green
• Data sent from the access point in red
In addition to the network infrastructure, a monitor station was set up to observe the
traffic being transmitted. As a client communicates with the access point, this monitor
station (or any other device listening) will also receive the data which is broadcast. As
shown in Figure 4.2, the software used to monitor and record this data was Kismet,
a wireless ‘traffic sniffer’ (Kismet Wireless, 2012) utilising the PCap (Packet Capture)
56
Acquiring Data: How To Collect Drips CHAPTER 4
Figure 4.2: Monitor Station Packet Capture Process (promiscuous, via Kismet)
library (TCPDump Team, 2012). This monitor station operates entirely passively with
the wireless hardware set to operate in ‘promiscuous’ or ‘monitor’ mode; only listening
for and receiving broadcast data. The monitor station makes no transmissions of its
own. Although operating on multiple frequencies (channels), IEEE 802.11 devices are
not expected to change frequency as part of the data transmission process. A frequency
is set at initialisation and assumed to persist and must be re-initialised if the frequency
is changed. The monitor station can therefore ‘channel hop’ (change channel) at will
to observe communications on different channels if required. However, a wireless card
can only be tuned to one channel at a given time. With a vantage point external to the
network, encrypted WiFi communications will be scrambled from this perspective.
User devices must operate in ‘managed mode’ to communicate with an access point.
Following correct authentication, this provides network connectivity and is the usual
mode of operation for wireless hardware. These communications can also be recor-
ded. However, because wireless networking hardware is not designed to receive and
transmit simultaneously, the recording process must use a different method. (Although
802.11a/g/n are technically frequency division multiplexing, each network is restricted
to a single channel). As shown in Figure 4.3, network traffic is intercepted and recor-
ded between the operating system and wireless card firmware instead. Again, this can
be performed using the Wireshark packet analysis suite (Wireshark Foundation, 2012)
57

CHAPTER 4 Acquiring Data: How To Collect Drips
alongside the PCap library, and can be used to validate any data collected by the mon-
itor station by comparison. However, this vantage point is internal to the network so
no WiFi-layer encryption will be visible. Incoming data will have been decrypted before
it can be recorded, and outgoing data will not have been encrypted yet because these
processes are handled by the wireless card firmware. Devices in managed mode cannot
channel hop as they are locked to the frequency used by the access point. Furthermore,
only communications that are directly addressed to the device (or multicast) will be vis-
ible. Communications to and from other devices as well as some management frames
will be silently handled and suppressed by the wireless card firmware because they are
not required by the operating system or applications for normal operation.
These recordings provide a time-ordered list of all the packets observed and their
contents in the form of a ‘packet capture file’. Wireshark provides functionality to read
and filter these files as appropriate. The client recording will show packets sent from
and received by the client. These will be unencrypted as this process is performed by
the wireless network card immediately before transmission or immediately after recep-
tion. The monitor station recording will consist of all data observed being transmitted
on the same channel as the network. The majority of these broadcasts will have been
encrypted and may also contain data from any other WiFi devices communicating on
the same frequency, especially those probing for available networks.
Figure 4.3: Client Packet Capture Process (managed, via Wireshark)
58

Acquiring Data: How To Collect Drips CHAPTER 4
Table 4.1: Capture Method Comparison
Mode ofOperation
Frames VisibleDevice
Connectivity?Decrypted?
ChannelHopping?
Monitor All in range 7 7 3
Managed Device-addressed only 3 3 7
4.2 Minimising Spurious Variation
These studies attempt to identify features in network traffic that are the result of specific
user activities. Isolating these features will be easier if variation due to the experimental
environment itself is minimised. To minimise spurious results, repeated recordings of
various user activities will be required. Between each test the environment should be
returned to its previous default state. On a user device, this was achieved as follows for
the initial investigation:
• Consistent background processes
→ Same system services running for all tests
→ Disabled automatic update processes (e.g. Operating System, Antivirus, Flash)
→ Ensure no confounding network processes are running (e.g. web servers,
shared directories, remote user access, Dropbox sync)
• Caches and previously saved data cleared before tests
→ DNS cache flushed after all internet activities
→ Browser and Flash cache after web browser activities
→ Files deleted after downloads (so they may not be resumed)
→ Local cache cleared after media streaming
Minimising variation within the network environment is more complex because ex-
ternal devices using the same WiFi technology and frequencies as the test network can-
not be controlled. As illustrated in Figure 4.4, the dominant WiFi implementations of
802.11b , g and n operate at ∼2.4GHz, using several overlapping ‘channels’. 802.11n
may also operate at ∼5GHz, but overlapping channels are similarly present.
Given the physical location of the test sites in dense urban areas and the previously
mentioned ubiquity of WiFi technology, the frequency bands used by wireless network
59

CHAPTER 4 Acquiring Data: How To Collect Drips
technology were found to be congested but not saturated. Tools such as the WiFi Ana-
lyzer app for Android (Farproc, 2013) can help visualise this. Figure 4.5 shows an ex-
ample of the WiFi networks that were within range of UCL test environment and the
channels being used by each. It is important to note that certain networks, namely en-
terprise networks with more advanced infrastructure such as EduRoam (pictured), will
operate on multiple channels. This prevents multiple access points providing access to
the same network from interfering with each other, and allows devices to connect using
the channel with highest signal-to-noise ratio to maximise network performance.
Despite the potential for spurious interference, it was determined that a shielded
room (anechoic chamber and Faraday cage) would be an unrealistic environment and
unnecessary. It was decided that a realistically noisy environment, as typical in the real
world, would be better to judge the feasibility of this research. However, when under
control of the researcher (as is the case in the initial experimentation with a decided
MiFi AP) the least congested wireless channel would be selected to minimise interfer-
ence from other WiFi sources. In addition to interference from competing WiFi hard-
ware, it should also be noted that the 2.4GHz band is an unlicensed part of the elec-
tromagnetic spectrum and used by a variety of other consumer devices. For example,
cordless phones, baby monitors and motion sensors, as well as other wireless commu-
nications standards including Zigbee and Bluetooth opt to operate over these frequen-
cies. This is also the frequency by which microwave ovens heat water. These sources
of interference were also removed where possible if required. Notably, devices such as
smart phones (which may use WiFi and Bluetooth) were disabled, Bluetooth peripher-
als like cordless keyboards and mice unused, and experiments were performed away
Figure 4.4: 2.4GHz WiFi Channel Frequency Overlap(WikiMedia Commons (CC-SA M Gauthier), 2009). Adapted from
IEEE 802.11b /g /n PHY Specification (IEEE-SA, 2007).
60

Acquiring Data: How To Collect Drips CHAPTER 4
Figure 4.5: Example WiFi Saturation Visualisation
from microwave oven-containing kitchens.
Even when these steps are taken, there is still significant opportunity to observe
systemic variation. Consumer WiFi devices are typically built with cost and portab-
ility having precedence over reliability. Low-cost WiFi devices are reliant on frequent
retransmissions to actually receive and transmit data correctly. Due to differences in
range from the transmitter and the interference issues already discussed, an observer
device may not always observe exactly the same frames that a user devices receives and
transmits. Furthermore as will be discussed in Section 5.1, variation is possible within
applications themselves even when repeating the same user activity. This inherent vari-
ation is part of what makes this a challenging research topic.
4.3 Essential Software Tools
All software used to facilitate the collection of data for this research is both free-to-
download and open-source. The primary software tools have already been mentioned:
• Kismet: A ‘wireless network detector, sniffer, and intrusion detection system’. A
command-line utility, it allows for the capture of wireless network traffic. Any
traffic observed while Kismet is running will be saved to disk. It is possible to
filter what is recorded to some degree, by specifying which WiFi channel to listen
61

CHAPTER 4 Acquiring Data: How To Collect Drips
on. Kismet provides the best way to simply record WiFi communications to disk
(Kismet Wireless, 2012).
• The Wireshark Suite: Functions as a ‘network protocol analyser’ to allow for closer
inspection of recorded packets. TShark is the command-line version of the more
interactive Wireshark GUI. Although both are capable of performing the same
tasks, TShark provides an easier way to invoke its functionality from automated
scripts. This tool allows for the extraction of data from each frame which can be
used for analysis. For example, the time a frame was observed, the sender and
receiver MAC address and the frame’s length (Wireshark Foundation, 2012).
• PCap Library: A software library depended upon by both Wireshark and Kismet.
Provides an interface to observe the communications seen by WiFi hardware and
defines a data format to store or restore them to and from disk (TCPDump Team,
2012).
Wireshark and the PCap library are cross-platform. However, WiFi drivers for Win-
dows that support promiscuous mode are rare. Kismet is Linux-specific. The collec-
tion platforms used during this research therefore use a Linux Operating System. Spe-
cifically, Ubuntu was used for desktop and laptops (or any other machine with x86 or
amd64 hardware) and Raspbian for the automated collection devices to be discussed
shortly (using ARM hardware). Although Microsoft Windows is the market-dominant
desktop Operating System (Net Applications, 2014) and may arguably represent access
to a greater selection of user activities, the choice of a Linux OS for WiFi recording does
not diminish their power. The platforms are still capable of observing the WiFi commu-
nications of Windows Systems (or any other OS). If on-device recording is required for
Windows as described in Section 4.1, this can still be performed thanks to the cross plat-
form nature of Wireshark. The same can be said of MacOS, although no Apple products
were used during this research.
Under Ubuntu and Raspbian, Kismet and Wireshark can be easily installed from
the OS’s central software repository. This will install any packages they are depend-
ent on automatically (including PCap). However, these repositories are not always up-
to-date. As Free Software, they can also be compiled from source code and installed
62

Acquiring Data: How To Collect Drips CHAPTER 4
manually. This requires additional effort but provides the latest features, bug-fixes and
cross-platform uniformity.
4.4 Hardware & Automated Collection Platforms
Some form of Linux will run on almost any off-the-shelf hardware you can buy. For
these experiments, the main concern when selecting hardware is to ensure that the
Linux version supports drivers for the WiFi interface that support monitor mode. Some
hardware vendors have better support than others so some research is required before-
hand. However, the laptops and desktops used during this research were not assembled
specifically for WiFi monitoring purposes. A simple solution to allow monitoring ma-
chines with unsupported WiFi hardware was to make USB WiFi dongles that did have
driver support available.
Although additional hardware and software installation is acceptable to a researcher
actively involved in these studies, it is overly burdensome for volunteers helping the
project in the short-term. An automated “just plug it in” collection device was there-
fore created for their use. As, illustrated in Figure 4.6, this platform operates identically
but collects data automatically based on a simple configuration file from the researcher.
Currently costing under $100, the essential components of the automated WiFi cap-
ture devices are as follows: a Raspberry Pi ‘credit-card sized computer’ (Model B), a USB
WiFi dongle, and a MicroSD Card of sufficient capacity. If an external Hard Disk is used
for additional storage then it may be necessary to provide an externally powered USB
hub (output current of the Raspberry Pi USB ports is limited). Conversely, although not
required for any studies in this thesis, for low-power scenarios with no mains access it
is possible to run Raspberry Pi hardware from batteries alone.
As noted previously, the core of the system is provided by Raspbian (a Linux operat-
ing system distribution tailored for Raspberry Pi devices (Raspberry Pi Project, 2013)).
The iwlist tool is part of the core operating system and interrogates wireless network
devices to provide textual output detailing nearby WiFi networks. It can be easily com-
bined with common Unix shell commands to form what is referred to in Figure 4.6 as the
‘Automated Collection System’. This is simply a script that runs as soon as the system
63

CHAPTER 4 Acquiring Data: How To Collect Drips
boots, and (unless aborted) finds the channel associated with a given wireless network
name. It then and starts Kismet recording on that channel, saving to the external hard
drive. This provides a literal ‘plug and play’ portable system which can monitor and re-
cord WiFi communications. As shown in Figure 4.7, it is small, lightweight and the only
requirement of a volunteer is to provide mains power and supply the name of their WiFi
network beforehand.
In addition to performing mere data collection duties, in later research these devices
are used as a standard platform to analyse the feasibility of live WiFi communication
classification. As is also shown in Figure 4.6, TShark can also be configured to read
directly from the network interface as an alternative to Kismet storing data captured
to disk for later analysis. This allows for ‘live’ processing of packets by way of piping
TShark’s output directly into an analysis program. The diagram shows a classification
program. As will be discussed in later chapters, this could be capable of inferring a
given category of activity being observed and visualising this information as appropri-
ate. However, this requires the analysis to be fast enough to keep up with observed
Figure 4.6: Automated Collection Platform Software/Hardware Interaction
64

Acquiring Data: How To Collect Drips CHAPTER 4
packets arriving in real time. Direct analysis means that data is not stored to disk per-
manently. Although this may be useful for real-world applications, retaining the raw
data for verification will often be required in research situations. However, these two
methods are not mutually exclusive and can be performed simultaneously if necessary
at the cost of additional overhead.
Although collection can be performed on this low-cost hardware, the implement-
ation is not bound to it. The interaction diagram is just as representative for the more
powerful laptop or desktop machines that were also used, except that Raspbian OS
would be replaced by Ubuntu. Details of the information contained within the data
that these platforms actually collect is discussed in Chapter 5.
4.5 Supplementary Software Tools
A variety of other software tools were employed during the studies presented in this
thesis. They are listed here for completion, but a full discussion of their function can
be found in later chapters as they are used. A selection of software tools were used to
ease the automation of various research processes:
• Sikuli: When searching for patterns related to user activity, the ability to produce
Figure 4.7: Automated Collection Device
65

CHAPTER 4 Acquiring Data: How To Collect Drips
repeated observations of the same activity is essential. The Sikuli automation
package allows for a user to record his/her desktop activity (mouse clicks and
keyboard input), then replay it at will. Built upon the Python programming lan-
guage, it has both a Windows and Linux version (MIT CSAIL, 2012).
• Hyenae: The ability to precisely isolate the patterns associated with a specific
activity is also essential. The Hyenae packet generator can be used to specifically
‘tag’ the beginning and end of activities. This was achieved by sending a known
combination of frames of known lengths at the start and/or end of each an activ-
ity. This can be detected by an observer without the need for decryption and al-
lows relevant activity data to be easily separated from the rest of a recording. Runs
on Windows (Hyenae Development Team, 2012).
• Skype4Py: A programmatic interface to the Skype client program’s API on Win-
dows using the Python programming language. Allows calls be made, received
etc. without direct user or GUI interaction. Now deprecated due to Skype Inc.
‘retiring’ the API via software updates (Wahlig and Ohtamaa, 2013).
• Aircrack-ng Suite: Primarily designed to crack WEP WiFi encryption, but that
functionality is not required. Instead the Airmon-ng tool is useful as a method of
forcefully overriding WiFi interface settings such as monitor mode and channel
tuning. Can also be used like as a packet generator like Hyenae, but runs on Linux
instead (Aircrack-ng, 2012).
When dealing with user activity on mobile device, several tools were used:
• WiFi Analyzer: As noted during the previous chapter, an Android app that can be
used to map nearby WiFi networks and illustrate the overlap of the channels they
are operating over (Farproc, 2013).
• WiFinspect: An app that provides a native GUI interface to the Android version of
PCap. Allows for on-device capture of packets on the Android platform (provided
it is ‘rooted’) (Hadjittofis, 2014).
• MyMobiler: Allows an Android device connected over USB to be controlled via
keyboard and mouse directly from Microsoft Windows. Displays and allows in-
teraction with the device’s touch-screen directly from the desktop (MTUX, 2014).
66

Acquiring Data: How To Collect Drips CHAPTER 4
Finally, there is of course the software used to analyse the WiFi data itself:
• R: A statistical programming language with a modular library system providing
a huge variety of useful tools. This powerful tool was used for the majority of
scentific analysis and statistical processing found in this thesis and to produce
many of the graphs. Cross-platform (R Core Team, 2013).
• Qt Creator: A development environment for the C++ language. Used in later
research to produce programs capable of live analysis where improving upon
the relatively poor performance of R was necessary. Cross-platform (Qt Project,
2014).
4.6 Summary
This chapter describes the solid platform used to collect raw WiFi data from a vari-
ety of scenarios in a portable, cheap, easy-to-use and repeatable fashion. Subsequent
chapters can now focus upon the analysis and activity inference aspects of these stud-
ies, and it is hoped that other research can do the same and build upon this platform
using the published guide (Atkinson et al., 2014a).
With WiFi communications becoming increasingly ubiquitous, a full understand-
ing of their security strengths and weaknesses is pragmatic, if not essential. The hard-
ware and software described in this chapter allow such investigations to be performed
at low-cost, on commodity hardware, entirely passively, and without the need to break
encryption.
67

CHAPTER 4 Acquiring Data: How To Collect Drips
68

5 Finding & VisualisingInformation Leakage
This chapter presents the findings of an initial study as to how current generation wire-
less network technology can inadvertently leak information about the activities of its
users. It examines the feasibility of an outside observer inferring user activity despite
the presence and correct use of encryption. A selection of common user activities —
such as web-browsing, email, video and music streaming, VoIP phone calls and peer-
to-peer downloads — were performed using internet access provided via an encrypted
wireless network. These findings were presented at the London Communications Sym-
posium (Atkinson et al., 2011).
A dataset of broadcast wireless network traffic was recorded using the passive col-
lection platform described in the previous chapter and automation scripts were pro-
duced to allow easy repetition of user activities. The collected communications were
then analysed and graphical visualisations of broadcast network traffic corresponding
to different user activities were created to demonstrate how features may be discerned.
The study found that side-channel information derived from the direction, rapidity,
throughput and relative timings of data transmission over the network is sufficient to
allow features pertaining to known user activity to be visually identified and provided
the foundational approach for subsequent studies. In addition, factors that complicate
the collection of data and ability to distinguish activity-identifying features are then dis-
cussed to show the limitations of this analysis. It is demonstrated that features can be
identified in spite of the data itself being encrypted. Therefore the possibility of infer-
ring user activity by merely observing encrypted network traffic is shown to be feasible.
5.1 Performing User Activities
This study investigated the network activity patterns observed as a consequence of user
activities. These activities are at what this chapter will term ‘mid-level’ activities. That
69

CHAPTER 5 Finding & Visualising Information Leakage
is, certain general user tasks like “browse a website”, rather than complex macro-level
activity like “research a topic for two hours”, “shop online for 35 minutes”, or micro-level
activities such as a mere ‘click the search button’, or ‘open Firefox’. This would provide
a balance between the amount of data available for analysis and the variation possible
within a given activity definition.
As will shortly be discussed, activities at the mid-level scale can be easily automated
and, due to their relative shortness, capacity limitations on recorded data are not a con-
cern. Similarly, their analysis and visualisation can be quite concise. This is not to say
that these different levels of activity abstraction would not contain a wealth of inform-
ation and display identifiable features as well. Mid-level activity is of course composed
of micro-level activity so this can be analysed in isolation if necessary. Similarly, macro-
level activity is compound in nature so it may be possible to construct inferences from
micro and mid-level activity.
All possible user activities and all the possible ways of performing them are of course
an implausibly large set of possible activities. The sample size of this investigation is
therefore be limited to a relatively minor, but representative, subset of these. A selec-
tion of user activities were chosen based on the common internet activities outlined by
Dutton and Blank (2011) and use of some well-known internet services. These activities
were as follows:
• Web Browsing Activities
→ Web page search (via Google website)
→ Image search (via Google website)
→ Consult an article and several linked articles therein (via Wikipedia website)
• Webmail Activities
→ Send message (via GMail website)
→ Receive & reply to message (via GMail website)
• Social Networking Activities
→ Log in and view profile (on Facebook website)
→ Send message (via Facebook website)
→ Receive & reply to message (via Facebook website)
70

Finding & Visualising Information Leakage CHAPTER 5
→ Real-time chat (via Facebook website)
• Media Streaming Activities
→ Listen to music (via Grooveshark website)
→ Listen to music (using Spotify application)
→ Watch a video (via YouTube website)
• Peer-to-Peer Filesharing Activity
→ BitTorrent download of particular Linux ISO (using µTorrent application)
• VoIP Phone Call Activity
→ Make voice call (via Skype application)
These activities are categorised from a user-centric perspective. Technically knowledge-
able readers may have already realised that the underlying network interactions of web-
mail and search engine usage are quite similar. Likewise, they may be more comfort-
able with the distinction between VoIP phone calls and streaming music from a website
whereas a less technologically aware user may feel that the two are very similar because
they both produce audio. Technological understanding of how the internet works is
generally rather limited, even among the young (Yan, 2009). This choice of categorisa-
tion is deliberate and used throughout these studies. The primary aim of this investiga-
tion is to determine user activity and user information, not identify technical protocols
(although, of course, it may help to do so). This is a simple way to frame the problem
and any associated privacy issues in a way that is accessible to an audience wider than
just those with technical knowledge. As will be seen, this is particularly useful for the
study presented in Chapter 8.
As an interesting aside, features in network traffic from different Operating Systems
(OS) were also observed. This differs from previous activities as the user would have no
interaction (besides pressing the ‘on’ button). The operating systems observed are as
follows:
• Operating System Boot Activity
→ Windows Boot (Microsoft Windows 7)
→ Linux Boot (Ubuntu Linux 11.04)
71

CHAPTER 5 Finding & Visualising Information Leakage
Figure 5.1: General Transition from User Activity to Network Activity
The OS determines which applications (and which versions) can be run to a large ex-
tent. This information may therefore so may potentially act as a useful diagnostic to-
wards the identification of a particular user activity. Full hardware details and software
version information can be found in Appendix C.
Data recordings were taken using the platform described in the previous chapter us-
ing the wholly researcher-controlled MiFi network. These samples observed network
activity from a mixture of user activities performed both manually and with automa-
tion. Manual recordings had no restrictions on the activity other than that specified
in the description. For example, a web or image search could be for any search term,
and any track could be listened to on Spotify. Automated scripts were composed with
at least two possible minor variations. Although many of these activities can be per-
formed by a lone user, Facebook chat and Skype conversations have a conversational
nature which usually require multiple participants. To enable consistent and easy re-
petition of the same activity, especially conversations, these activities were automated
using the Sikuli software package and some custom Python code. As an initial investiga-
tion, activities would always begin from a ‘clean’ starting position to minimise variation
as described in Section 4.2, although this will not represent all real-world situations.
All cached data and cookies would be cleared and services that require authentication
(GMail, Spotify and Facebook) would begin from a logged-out state. As will shortly be
demonstrated, web-based activities require navigation to a service’s index page first and
applications would need to be opened from the desktop. Examples of these automation
72

Finding & Visualising Information Leakage CHAPTER 5
scripts can be found in Appendix A.
Even with this identical starting point there is a large scope for natural variations in
the observed network traffic. In addition to the factors already outlined earlier in Sec-
tion 4.2, applications can exhibit varied activity even when performing identical user
tasks. For example, most web sites are dynamic in nature and may display random
advertisements. The same is true of Spotify, albeit in an audio format. Similarly, pre-
cise timings of network activity will depend on the availability of shared resources; pro-
cessor use may be blocked be by other programs running on the client via multitasking,
and differences in network congestion somewhere between the client device and a re-
mote internet server are unavoidable. Furthermore, while the example transition from
user activity to network activity about to be introduced has a specific order of events,
this may not always be the case. For example, BitTorrent has a random element to its
peer selection process and the Skype protocol can automatically adjust the quality of
the audio it sends.
With known user activities being performed on-demand, their network activity could
be recorded and the data patterns observed. This allows for the observation and map-
ping of the transitions between different types of activity shown in Figure 5.1. This gen-
eral diagram illustrates how, in general, recurring characteristics of these observations
can potentially be used to infer the activity that caused them if it was not known be-
forehand as detailed earlier in the equations of Section 3.2. To provide a more specific
example, a ‘web browsing’ activity incorporating a web search is illustrated in Figure 5.2
and might consist of the following (simplified) activities from the perspective of the
user, application and network:
• User (Alice)
1. Types web address into address bar (www.google.co.uk).
2. After page loads, types search text into address bar. Hits ‘enter’.
• Application (Firefox 5 on Windows 7)
1. Queries domain name typed (www.google.co.uk).
2. Connects to the server IP address received in response to the query and asks
for the index page. Displays it.
73

CHAPTER 5 Finding & Visualising Information Leakage
Figure 5.2: Example: Web Search Activity to Network Activity Transition
3. Requests the relevant results page for Alice’s search text. Displays it.
• Network (Various encapsulated protocols — see diagram)
1 a. Send DNS query request: contains domain name (www.google.co.uk).
b. Receive DNS query reply: contains server IP address.
2 a. Send HTTP request: contains path corresponding to index page (/ ).
b. Receive HTTP reply: contains index page content.
3 a. Send HTTP request: contains path corresponding to results page.
b. Receive HTTP reply: contains results page content.
In this study the applications, infrastructure and often even the ‘user’ (in the case of
automated scripts) are fixed and standardised to allow for data collection with minimal
variation. The ideal solution satisfying the problem of inferring user activity from net-
work activity would require every activity to have its own network traffic pattern that
was identical every time the user activity was performed and with no two different user
activities producing the same network activity. However, this will never be observed
in reality. Even with an automated user and this simple example, there is still ample
possibility for the system to display large variations due to the complicating factors dis-
cussed in Section 4.2.
In actuality, the network activities in this example are made possible by a highly
complex underlying processes. Network protocols will handle all manner of variations
within the interconnected global chain of machines that form the internet. Most errors,
congestion, and delays will be transparently handled automatically while the machines
74

Finding & Visualising Information Leakage CHAPTER 5
involved will have to handle their own variable numbers of concurrent users or connec-
tions, changes in load, updates and content changes.
To further complicate matters, the application activities are also highly simplified.
Modern browsers and websites have many features that will also cause network activity.
To name but a few features that use internet access, Firefox will automatically pre-fetch
links on the current page to speed up load times, may use any number of user-added
plugins, will check security certificates, and check the website you navigated towards is
not on a blacklist for malicious websites. Far from just being a form submission that re-
trieves search results, the Google index page will get and set cookies to identify the user,
log in users with a Google account and provide personalised links, provide automatic
text completion for search box entries, provide instantaneous results as they are typed
(dynamically updating the page after every letter, and not just when ‘enter’ is pressed).
Despite these complications, these variations are still deterministic and quantifi-
able to some degree. Although they will not be identical, the challenge is to discover
enough similarity between recordings of the same activity for them to be identifiable.
Conversely, there must also be enough differences between different user activity samples
to separate them. A visual comparison to identify these similarities and differences is
presented shortly in Section 5.3. However, first we must discuss the data available to
make these comparisons possible.
5.2 Data In Plain Sight
As noted in Chapter 2.2, for WiFi networks employing an encryption scheme all frames
carrying data to and from actual user devices will be encrypted. However, some frames
used to facilitate the operation and management of the network itself remain plainly
broadcast. Full details regarding their purpose and protocol behaviour can be found in
the 802.11 standard (IEEE-SA, 2007). Types of management frame that can be observed
unprotected are as follows:
• Beacons: Advertises the presence and capabilities of an access point.
• Probe Requests: Announces client capabilities and requests a response from avail-
able access points.
75

CHAPTER 5 Finding & Visualising Information Leakage
• Association: Conversation between client and AP when the client joins a network
using that AP to connect. (Also {de|re}-association).
• Authentication: Conversation between client and AP that verifies that the client
has the correct credentials (e.g. passphrase) to connect. (Also de-authentication).
• Management Data: Data transmitted regarding network infrastructure opera-
tions (e.g. power management notifications). These can vary with hardware man-
ufacturers.
Control frames are also broadcast without using encryption:
• Acknowledgement: Transmission a client or AP sends when it has successfully
received a transmission (otherwise it will be rebroadcast).1
• Request- & Clear-to-Send: Used as an optional collision avoidance technique.
Request-to-Send (RTS) is a signal from a WiFi client or AP indicating that it wishes
to transmit to another specified client or AP for a given duration. Clear-to-Send
(CTS) is a confirmation and acceptance from the receiver to begin the transmis-
sion. Other devices that hear the CTS frame will remain silent until the duration
specified has elapsed.
These frames will confer no information about user activity and can be discarded com-
pletely for purposes of activity inference. However, as employed in Chapter 8, they can
provide useful information about the characteristics of any WiFi devices in range that
can be observed. Obviously beacons advertise the networks nearby and what chan-
nels they are operating on. This is essential information for any observer. However,
these beacons also contain a MAC address that we know must belong to an AP. Sim-
ilarly, probe requests must come from client devices and also contain MAC addresses.
One is therefore able to distinguish between client devices and infrastructure hardware
and map the communications between them.
Authentication frames also provide information on user activity since any client
observed communicating with an access point using encryption must be authorised
anyway. However, the capture of these frames can allow the calculation of per-session
1 Acknowledgements at the Data-Link Layer only. Not to be confused with acknowledgements fromhigher layers such as TCP ACKs. These are hidden behind encryption.
76

Finding & Visualising Information Leakage CHAPTER 5
encryption keys and allow easy, after-the-fact decryption of communications observed
by a monitor station. Wireshark is capable of decrypting recorded communications so
long as; a) The WiFi encryption scheme uses a known pre-shared key for all devices (i.e.
WPA-PSK authentication), and b) The entire key exchange during the authentication
process is captured.
The ability to inspect encrypted packets is useful for verification purposes in a con-
trolled study by allowing a researcher to compare remotely observed recordings with
on-device recordings. This was used to ensure that WiFi hardware was correctly oper-
ating in monitor mode and that the observer was within range and not overly affected
by interference. Due to the use of WPA-PSK, this is possible on simple home networks
and the WiFi network provided by the MiFi dongle. However, even with known creden-
tials, Wireshark cannot calculate per-session keys for networks using enterprise-level
authentication such as EduRoam. The simplest way to ensure that the key exchange
process is recorded is to disable, then re-enable WiFi on a user device. As the device re-
connects to the network, authentication must occur. WPA-PSK authentication is per-
formed using the EAPOL protocol (Extensible Authentication Protocol Over LAN) as
defined by IEEE 802.11X (IEEE-SA, 2004b) and can be quickly isolated using Wireshark’s
�eapol� filter.
Control frames are less useful, but should correspond with actual data frame trans-
mission. As noted earlier, an observer may not see exactly the same WiFi communica-
tions as a device being observed due to interference and differences in range from the
sender. A noticeable imbalance between control frames and observed encrypted data
frames, or RTS and CTS frames would imply that frames were being missed by the ob-
server.
In all frames containing actual data from user devices, the payload is scrambled as
illustrated earlier in Figure 2.3. However, the 802.11 headers preceding this encrypted
payload is not encrypted. If, like these studies, you are predominantly interested in
the network activity caused by users then the management and control frames can be
discarded using the ‘protected’ flag in the frame header. In Wireshark or TShark this
is achievable with the �wlan.fc.protected == 1� filter. Even those frames carrying
encrypted user data still contain the following pertinent information unencrypted in
77

CHAPTER 5 Finding & Visualising Information Leakage
the header:
• Sender physical address (for Client or AP)
• Receiver physical address (for Client or AP)
• Total length (byte size) of the information transmitted
• Time the transmission was observed
This data can be read directly or measured by the observer regardless of encryption.
The physical sender and receiver addresses can be used to filter the observed data to
isolate and identify conversations between a specific client and the access point and
determine the direction of each packet. The time a transmission is observed can not
only be used to order the frames, but also as a basis for more complex timing analysis
as will be described in the sections to follow. Finally, the length of a frame provides a
precise measure of how much data is being transferred, and of course the quantity of
frames can be counted to calculate data rates over a specified interval. In combination
this frame data can be used to reliably record the side-channel information we outlined
in Section 2.4 and Figure 2.5.
5.3 Feature Identification & Visualisation
In itself, the information available from a single frame tells us very little. Encryption
renders all useful user data unreadable. However, in a similar way to the information
leaked by ‘Smart Grid’ appliances mentioned in Chapter 2, emergent patterns of this in-
formation over time can act as side-channels to infer information regarding user activ-
ity. From the measurable frame data identified in the previous chapter, the following
simple methods to measure data can be derived:
• On a Per Time Interval basis
→ Frame rate (F r a me C o un t / T i me )
→ Data rate (B y t e s / T i me )
• On a Per Frame basis
→ Data rate (B y t e s / F r a me C o un t )
→ Observation time (T i me / F r a me C o un t )
78

Finding & Visualising Information Leakage CHAPTER 5
This may still appear very limited but this aggregated data can be powerful, especially
when combined with directionality. For example, ‘Difference Between Outgoing Data
Rate and Incoming Data Rate’ or ‘Time Since Last Sent Packet’. Using these metrics to
analyse network activity, features specific to different applications and user activities
can be identified.
The processing, analysis visualisation of the data collected during this investigation
was performed in R, a statistical programming language (R Core Team, 2013). Proced-
ures were developed to extract and aggregate the relevant information from raw frame
data and then visualise it via customised graphing routines. These procedures were de-
signed to be reusable and modifiable and therefore also formed the foundations of data
analysis conducted in subsequent chapters.
5.3.1 Distinguishing User Activity
The combination of all metrics and user activities produce far more data than can be
contained in this chapter. Therefore, this section will demonstrate how progressive de-
grees of analysis can uncover a surprising wealth of information and graphically high-
light some examples of particular interest.
The most rudimentary form of analysis can be seen in Figure 5.3. This shows the
data transmission rate over the time period each user activity occurred. To calculate
this rate, packets were separated into bins of 0.5 second intervals. As anticipated, these
figures confirm the hypothesis that user activity-dependent differences in network traffic
can be observed despite cryptography. Skype shows a noticeably lower data rate and
web browsing displays the expected spikes of activity relating to navigating to a new
page. However, aside from total communication length (which is merely a result of the
total size of the chosen downloads), BitTorrent and YouTube streaming cannot easily
be discerned.
However, as shown in Figure 5.4, by employing the added dimension of directional-
ity distinct differences between the two are visible.2 As in previous chapters, red de-
notes frames received by a user device, and green denotes frames sent from a user
2 Although Figure 5.4 uses packets as a measure of data rate, an equivalent relationship is also presentwhen measured in terms of bytes.
79

CHAPTER 5 Finding & Visualising Information Leakage
Time (seconds)
Tota
l Byt
es S
ent/R
ecei
ved
by C
lient
0 14.5 30 45.5 61 76 91.5 107 122.5
0
50000
100000
150000
200000
250000
300000
(a) Making Skype Call
Time (seconds)
Tota
l Byt
es S
ent/R
ecei
ved
by C
lient
0 24.5 50 75 100.5 126 151 176.5 202
0
50000
100000
150000
200000
250000
300000
(b) BitTorrent Download
Time (seconds)
Tota
l Byt
es S
ent/R
ecei
ved
by C
lient
0 12.5 25.5 39 52 65 78.5 91.5 105
0
50000
100000
150000
200000
250000
300000
(c) Wikipedia Browsing
Time (seconds)
Tota
l Byt
es S
ent/R
ecei
ved
by C
lient
0 19 38.5 58.5 78 97.5 117.5 137 157
0
50000
100000
150000
200000
250000
300000
(d) YouTube Streaming
Figure 5.3: Total Bytes Transmitted per 0.5 Second Interval
device. To aid visual comparison, sent and received frame information can be plot-
ted as positive and negative values respectively. While the ratio of sent to received data
when streaming from YouTube remains relatively constant over time, BitTorrent has an
initial imbalance in favour of the number of frames sent by the client. This is due to the
client making initial connections to join the peer-to-peer network. In addition, we can
distinguish user activities that mostly download data (Wikipedia, YouTube and BitTor-
rent) from the contrasting Skype conversation activity which is a largely balanced and
bidirectional communication.
An alternative representation of the same data is to plot the difference between the
values for sent and received data in each bin (i.e. sum the negative and positive axes in
Figure 5.4). An example of this can be seen in Figure 5.5. Although providing less overall
context, this representation is the clearest way to illustrate predominant direction of
network communication and will be used to visualise a Skype conversation later in this
section.
These figures have used clock time as a continuous, absolute measure of time. An
80

Finding & Visualising Information Leakage CHAPTER 5
Time6VsecondsD
Fra
mes
6Sen
t6VG
reen
D6N
6Fra
mes
6Rec
eive
d6VR
edD6
by6C
lient
6
0 14.5 30 45.5 61 76 91.5 107 122.5
−150
−100
−50
0
50
100
150
{ S1
{S2
{ S3
SENT6V+veD
RCVD6V-veD
(a) Making Skype Call
Time1VsecondsD
Fra
mes
1Sen
t1VG
reen
D1N
1Fra
mes
1Rec
eive
d1VR
edD1
by1C
lient
1
0 24.5 50 75 100.5 126 151 176.5 202
−150
−100
−50
0
50
100
150
{ B1 { B2 { B3
SENT1V+veD
RCVD1V-veD
(b) BitTorrent Download
Time9+secondsV
Fra
mes
9Sen
t9+G
reen
V9E
9Fra
mes
9Rec
eive
d9+R
edV9
by9C
lient
9
0 12.5 25.5 39 52 65 78.5 91.5 105
−150
−100
−50
0
50
100
150
W1W2
W3 W4W5
SENT9+-veV
RCVD9+-veV
(c) Wikipedia Browsing
Time5VsecondsD
Fra
mes
5Sen
t5VG
reen
D5N
5Fra
mes
5Rec
eive
d5VR
edD5
by5C
lient
5
0 19 38.5 58.5 78 97.5 117.5 137 157
−150
−100
−50
0
50
100
150
{Y1 { Y2
{Y3
SENT5V+veD
RCVD5V-veD
(d) YouTube Streaming
Figure 5.4: Direction of Packets Transmitted per 0.5 Second Interval
Time (seconds)
(Fra
mes
Sen
t − F
ram
es R
ecei
ved)
by
Clie
nt
0 14.5 30 45.5 61 76 91.5 107 122.5
−150
−100
−50
0
50
100
150
(a) Making Skype Call
Time (seconds)
(Fra
mes
Sen
t − F
ram
es R
ecei
ved)
by
Clie
nt
0 24.5 50 75 100.5 126 151 176.5 202
−150
−100
−50
0
50
100
150
(b) BitTorrent Download
Time (seconds)
(Fra
mes
Sen
t − F
ram
es R
ecei
ved)
by
Clie
nt
0 12.5 25.5 39 52 65 78.5 91.5 105
−150
−100
−50
0
50
100
150
(c) Wikipedia Browsing
Time (seconds)
(Fra
mes
Sen
t − F
ram
es R
ecei
ved)
by
Clie
nt
0 19 38.5 58.5 78 97.5 117.5 137 157
−150
−100
−50
0
50
100
150
(d) Youtube Streaming
Figure 5.5: Difference (Sent − Received) in Frames Transmitted over Time
81

CHAPTER 5 Finding & Visualising Information Leakage
alternative representation is to use the order in which frames are observed to provide a
relative, discrete time basis. Figure 5.6 plots these two measures against each other. In
doing so, it is possible to easily identify different periods of activity based on changes
in the graph gradient. A shallower gradient denotes a faster frame rate, whereas a sharp
vertical jump denotes a period of idle time. Although this was also possible with a con-
tinuous time basis, it avoids the potential problems related to grouping data in bins that
will be discussed in Section 5.4. By isolating these different gradients, distinct stages of
network activity can be identified. With the ability to decrypt observed WPA-PSK com-
munications after the fact (as described earlier in this chapter), these can be verified,
cross referenced with Figure 5.4, and labelled as follows:
Frame Number
Tim
e O
bser
ved
[sec
s]
0 1000 2000 3000 4000
2040
6080
100
120
S1
S2
S3
(a) Making Skype Call
Frame Number
Tim
e O
bser
ved
[sec
s]
0 2000 4000 6000 8000 10000 12000
050
100
150
200
B1
B2
B3
(b) BitTorrent Download
Frame Number
Tim
e O
bser
ved
[sec
s]
0 500 1000 1500
2040
6080
100
W1W2
W3
W4
W5
(c) Wikipedia Browsing
Frame Number
Tim
e O
bser
ved
[sec
s]
0 2000 4000 6000 8000 10000
5010
015
0
Y2
Y1
Y3
(d) YouTube Streaming
Figure 5.6: Time of Observation per Frame
• Making Skype Call
→ S1: Login to Skype
→ S2: Call Negotiation (Ring, wait for answer etc.)
→ S3: Call in progress
• BitTorrent Download
→ B1: Querying trackers
82

Finding & Visualising Information Leakage CHAPTER 5
→ B2: Searching for peers
→ B3: Downloading file
• Wikipedia Browsing
→ W1: Load index page
→ W2: Load article page
→ W3-5: Load subsequent article pages
• YouTube Streaming
→ Y1: Search for video
→ Y2: Load video page (streaming begins via autoplay)
→ Y3: Load automatic suggestions for other videos after playback finished
For each frame, Figure 5.7 plots the time since a frame was last received and sent. A
regularly used network measurement. This is typically termed “interarrival time”, it
provides an example of how side-channel data can provide identifying features for a
specific protocol, in this case Skype.
Skype exhibits noticeable identifiable ‘bands’ at specific time intervals. Similar bands
are observable in other streamed traffic like YouTube, as compared. The baselines de-
note the fixed target transmission rates Skype and YouTube aim to attain. However, in
addition Skype displays repeated predictable changes in the interarrival time measures
between frames appearing as curves due to the logarithmic scale. This feature is not
present in any other sampled activity and occurs because of the interaction between
regular data transmission rates imposed by the Skype protocol to maintain call quality.
This periodicity remains unobscured and acts as clear identifier even though the ob-
served Skype traffic is encrypted at both the Data-Link layer and the Transport Layer.
Skype will be studied in much greater detail in future chapters.
The operations of Skype can be analysed further. Figure 5.8 plots only the call nego-
tiation (S2) and call in progress (S3) parts of Skype network activity labelled in previous
figures. The automated conversation consisted of a dialogue with 8 interleaved spoken
parts (4 from each side). By calculating the difference between incoming and outgoing
data it is possible to decompose S3 and infer the directionality of the conversation. The
spoken dialogue of participants ‘A’ and ‘B’ are marked A1-4 and B1-4. Although not al-
83

CHAPTER 5 Finding & Visualising Information Leakage
ln (
T S
ince
SE
ND
)
0 1000 2000 3000 4000
ln (
T S
ince
RC
VD
)
Frame Number
1/e6
1/e2
e2
1/e8
1/e4
1/e10
1
1/e6
1/e2
e2
1/e8
1/e4
1/e10
1
(a) Making Skype Callln
(T
Sin
ce S
EN
D)
1/e6
1/e2
e2
1/e8
1/e4
1/e10
1
1/e6
1/e2
e2
1/e8
1/e4
1/e10
1
0 2000 4000 6000 8000 10000
ln (
T S
ince
RC
VD
)
Frame Number
(b) YouTube Streaming
Figure 5.7: Time Since Last Packet per Packet (Logarithmic Time Scale)
TimeA(seconds)
(Byt
esAS
entA−
AByt
esAR
ecei
ved)
AbyA
Clie
nt
75 79.5 84.5 89.5 95 100 105 110 115.5
−6000
−4000
−2000
0
2000
4000
6000
S2
A1
A2A3
A4
B1
B2
B3 B4{
Figure 5.8: Difference in Sent/Received Data Rate of Skype Conversation
ways as clear as this in all samples (and even fluctuates here between B3 and A4), when
combined with other measurements such as the aforementioned interarrival times, this
shows that a surprising amount of information can be extracted from a Skype conver-
sation on a quiet network.
Another interesting observable feature that implies very specific user activity is shown
during the use of the popular online encyclopaedia Wikipedia3. As highlighted in Fig-
ure 5.9, Wikipedia produces a large number of frames with a length of ∼150 and ∼350
bytes when loading the index or article pages. This differentiates it from the other web
browsing traffic tested and is caused by Wikipedia’s unusually large number of sys-
3 http://www.wikipedia.org/
84

Finding & Visualising Information Leakage CHAPTER 5
20
60
100
Tim
e [s
ecs] 80
40
0
500
1000
1500
0 500 1000 1500
Fra
me
Leng
th [B
ytes
]
Frame Number
(a) Wikipedia
20
40
60
80
Tim
e [s
ecs]
0
500
1000
1500
0 200 400 600 800 1000
Fra
me
Leng
th [B
ytes
]
Frame Number
(b) Facebook Browsing
20
40
60
80
Tim
e [s
ecs]
0
500
1000
0 200 400 600 800 1000
Fra
me
Leng
th [B
ytes
]
Frame Number
1500
(c) Google Image Search
50
100
200
Tim
e [s
ecs] 150
0
500
1000
1500
0 2000 4000 6000 8000 10000 12000F
ram
e Le
ngth
[Byt
es]
Frame Number
(d) BitTorrent Download
Figure 5.9: Data Rate in Bytes (with Observation Time as reference) per Packet
tematically named subdomains for different language versions. These trigger a cor-
respondingly large quantity of DNS queries and responses with similar sizes. Although
other websites are not distinguishable by this metric alone, it validates the hypothesis
that features of very specific user activity can be identified even on a site-by-site basis.
5.3.2 Distinguishing Operating Systems
Using the same metrics used to identify features of specific user activity, the ability to
determine the Operating System (OS) of a given device purely from its boot activity was
also tested. Network activity of the device connecting to the network (via saved creden-
tials) was observed for both a Linux and Windows installation on identical hardware.
The boot process was considered complete when the login screen appeared. The log-
in process was not recorded and therefore no user interaction or automation was used
(besides pushing the ‘on’ button).
Figure 5.10 shows the typical network activity generated by the boot process of each
OS in terms of data rate in each direction over time. Both systems share the charac-
teristic of a two-stage boot process in terms of network activity, as is visible from the
distinct areas of frame transmissions. Authentication with the WiFi network also takes
85

CHAPTER 5 Finding & Visualising Information Leakage
Time8(seconds)
Byt
es8S
ent8(
Red
)8&
8Byt
es8R
ecei
ved8
(Gre
en)8
by8C
lient
8
0 17 35 52.5 70.5 88 106 123.5 141.5
−6000
−4000
−2000
0
2000
4000
6000
(a) Ubuntu Linux 11.04
Time4(seconds)
Byt
es4S
ent4(
Red
)4&
4Byt
es4R
ecei
ved4
(Gre
en)4
by4C
lient
4
0 11.5 23.5 36 48 60 72.5 84.5 97
−6000
−4000
−2000
0
2000
4000
6000
(b) Microsoft Windows 7
Figure 5.10: Operating System Data Rate (Bytes) & Direction
place twice in both instances. The total boot time is also very similar at ∼100s with a
∼50s gap of (relative) network inactivity. However, the immediately obvious difference
between the two is the amount of data transferred overall, with up to 4 times as much
being sent and up to twice as much being received at the peak measurement by Win-
dows.
Differences also manifest in terms of frame size and timing. However, this is more
difficult to visualise than user activity due to the differences of scale and smaller sample
size (200-400 frames only). It is also interesting to note, that although some unencryp-
ted management frames contain ‘vendor-specific’ information, this cannot always be
relied upon for simple identification. For example, despite not being a Microsoft OS,
Ubuntu association requests will still announce WiFi capability identifying its WPA2 en-
cryption process as “Microsoft: WPA Information Element” for compatibility reasons,
just as Windows does.
5.4 Obscured & Lost Information
Even though identifiable characteristics of user activities have been shown to be ob-
servable despite encryption, it is important to realise that information can easily be lost
during the data capture and analysis process. This section outlines these problems so
that any analysis methods developed can be as accurate possible and their limitations
correctly determined.
Increased range and interference can impair the ability of devices to correctly re-
ceive data. This may result in some transmissions being ‘unheard’ or corrupted in
86

Finding & Visualising Information Leakage CHAPTER 5
the data collected by the monitor station. By comparing observed data (Kismet) and
transmissions logged at the client (Wireshark) it can be determined that there was little
packet loss. In fact, the data collection devices in these studies actually saw a ∼4% in-
crease in observed packet data due to automatic retransmission at the Data-Link layer
(that is not propagated to the recording software on the client as discussed in Sec-
tion 4.1). However, these tests were performed in a controlled experimental environ-
ment with low noise and devices separated by only a few tens of metres maximum. ‘Un-
heard’ data will be a greater problem for monitor stations that are significantly further
away from the transmitter than the recipient device. As distance increases, the likeli-
hood of interference affecting reception at the monitor station (but not the intended
recipient — so no retransmission) also increases. This may need to be corrected for in
scenarios where observation is performed from greater range or a noisier environment.
As mentioned earlier, another problem is the method used to collect transmission
data into periodic ‘bins’ for representations based on observation time. Figure 5.11
shows the same data divided into bins at 0.5 second intervals. However, the bins in the
second visualisation are offset from the first by ±0.25s. As highlighted, even this small
change can have a drastic effect on the features visible. In the first highlighted area the
number of peaks observed within that time period is altered, and the relative heights of
two peaks are reversed in the second.
Time (seconds)
Tota
l Pac
kets
Sen
t/Rec
eive
d by
Clie
nt
0 12.5 25.5 38.5 52 65 78 91 104.5
0
50
100
150
200
250
300
(a) Wikipedia Browsing – No Offset
Time (seconds)
Tota
l Pac
kets
Sen
t/Rec
eive
d by
Clie
nt
0 12.5 25.5 39 52 65 78.5 91.5 105
0
50
100
150
200
250
300
(b) Wikipedia Browsing – Offset +0.25s
Figure 5.11: How Different Time Bin Offsets Alter Measurement Features
This effect can be mitigated by using larger bin sizes because each frame will have
a lesser effect on any aggregate data (e.g. total data transmitted). However this lessens
the granularity and detail observable in any features. Alternatively, as seen earlier in this
87

CHAPTER 5 Finding & Visualising Information Leakage
chapter, bin sizes can be avoided completely by examining each frame on an individual
basis. But this comes at greater computational cost.
5.5 Discussion
Following practical data collection, its analysis and visualisation, the study outlined in
this chapter demonstrated the feasibility of determining user activity by observing en-
crypted wireless network traffic. The raw data available to perform this analysis and
various methods of representation were identified. Now that this approach had been
shown to yield results, the user automation scripts, collected network data and the
methods to process and visualise it could all be reused and improved upon in sub-
sequent investigations.
The previous section also outlined the inherent methodological problems of scale
and sampling that may obscure user activity information. However, although not en-
tirely isolated from external, this study was performed with data collected on a wholly
controlled network. In addition to these issues, subsequent studies will also have to
contend with greater network congestion and interleaved activities. Subsequent chapters
will need to incorporate increased complexity of the user and network activity so that
any analysis methods developed can be demonstrated to work in ‘real world’ scenarios.
WiFi networks are typically more complex and serve more devices than the one used in
this study. Similarly, users will multi-task and some activities continue in the back-
ground after initiation (for example, music streaming) resulting in multiple activities
being interleaved. Of course many more user activities are possible as well. Analysis of
these increasingly sophisticated scenarios will be much more challenging. These ad-
ditional complications will undoubtedly result in greater opportunity for user activity
features to be obscured.
Furthermore, although a human reader can quickly identify features such as the
gradients, plateaus, and repeated patterns when provided with an appropriate visual-
isation, calculating lines of best fit, estimating gradients and categorising data intelli-
gently is a highly computationally complex process. Even if it was practical for humans
to perform all this complex pattern recognition, there would still need to be general
88
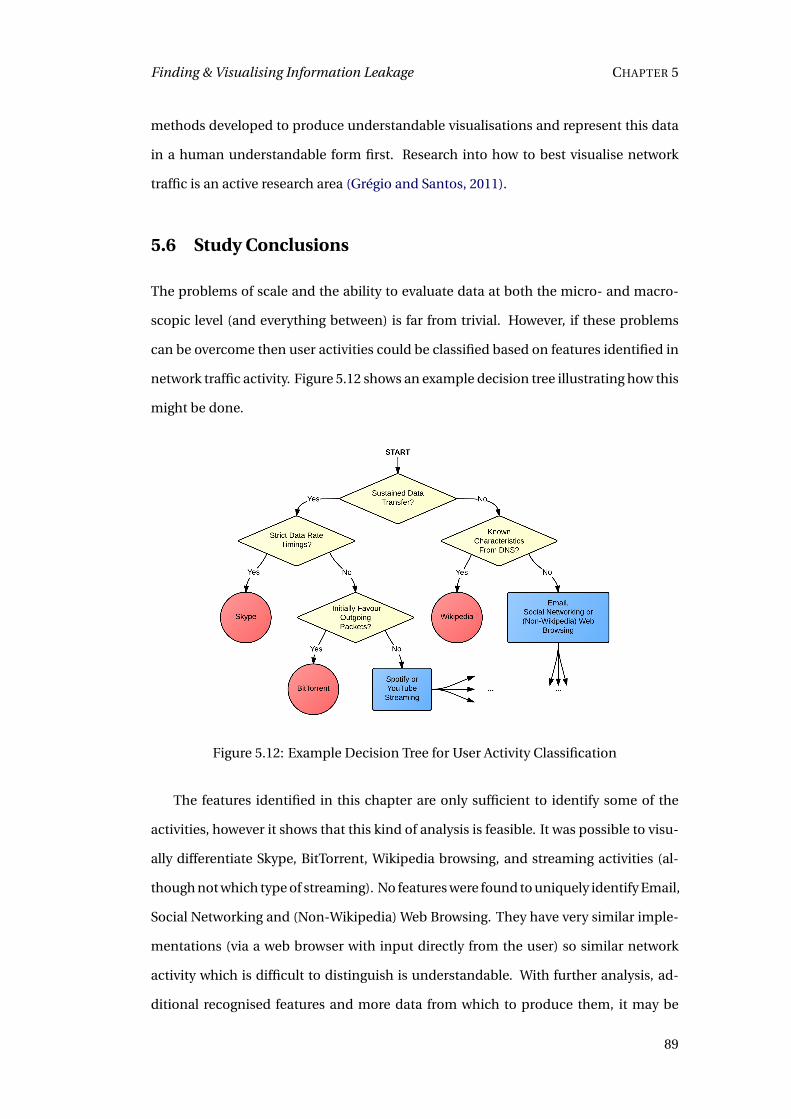
Finding & Visualising Information Leakage CHAPTER 5
methods developed to produce understandable visualisations and represent this data
in a human understandable form first. Research into how to best visualise network
traffic is an active research area (Grégio and Santos, 2011).
5.6 Study Conclusions
The problems of scale and the ability to evaluate data at both the micro- and macro-
scopic level (and everything between) is far from trivial. However, if these problems
can be overcome then user activities could be classified based on features identified in
network traffic activity. Figure 5.12 shows an example decision tree illustrating how this
might be done.
Figure 5.12: Example Decision Tree for User Activity Classification
The features identified in this chapter are only sufficient to identify some of the
activities, however it shows that this kind of analysis is feasible. It was possible to visu-
ally differentiate Skype, BitTorrent, Wikipedia browsing, and streaming activities (al-
though not which type of streaming). No features were found to uniquely identify Email,
Social Networking and (Non-Wikipedia) Web Browsing. They have very similar imple-
mentations (via a web browser with input directly from the user) so similar network
activity which is difficult to distinguish is understandable. With further analysis, ad-
ditional recognised features and more data from which to produce them, it may be
89

CHAPTER 5 Finding & Visualising Information Leakage
possible expand the tree to include these and uniquely classify these user activities. A
decision tree like this is a logical representation of a classification algorithm. As will be
discussed in the coming chapters, provided the data can be provided in a useful format,
this classification process can be automated.
90

6 Developing Activity Metrics:Finding Skype
The previous chapter illustrated how features signifying specific user activities could
be identified within encrypted WiFi traffic. In contrast to the previous manual visual
analysis, this chapter describes the first of several mechanisms capable of algorithmic-
ally detecting a specific activity. To begin, we focus on a single activity; Skype voice
communication because it displayed interesting visual characteristics in the previous
chapter and provides an interesting target for reasons that will be explained shortly.
As before, aside from being within range, the detection mechanism operates without
any level of network access and without the need to break any encryption. It demon-
strates how an entirely passive external observer can detect if and when a user is in-
volved in a Skype voice call. It is further demonstrated that this detection ability re-
mains even when Skype traffic is interleaved with confounding simultaneous traffic
such as BitTorrent. This study was published at the IEEE Wireless Communications
and Networking Conference 2013 (Atkinson et al., 2013).
Unlike the paper, this chapter also describes the analysis prior to producing this
mechanism. As discussed previously, appropriate representation of the available data
is an essential foundation of any detection mechanism. The program implemented to
allow interactive visual inspection of different samples, metrics and data representa-
tions is documented here. Unlike the visualisations created in R, this program featured
helpful interactive features including zoom, scrolling and selection to help mitigate the
problems of visualising patterns at vastly different scales.
Published as this work was undertaken, the paper of Zhang et al. (2011) used hier-
archies of Support Vector Machines and Radial Basis Function Networks to attempt to
infer activity on a wireless network without breaking encryption. With a reported ac-
curacy upwards of 80%, they were able to differentiate between several broad categor-
ies of network activity: “web browsing, chatting, online gaming, downloading, upload-
ing and video watching”. However, accuracy fell greatly when observing simultaneous
91

CHAPTER 6 Developing Activity Metrics: Finding Skype
traffic, with BitTorrent being particularly good at hindering the detecting of other activ-
ity. Skype traffic was not considered in their experimentation. This study attempts to
infer activity similarly, but without the use of machine learning. We do adopt machine
learning in later chapters, however the focus is on WiFi security and privacy leaks rather
than a demonstration of machine learning itself.
6.1 Why Skype?
Skype is a popular real-time voice communication program and has been the subject of
significant research interest. It allows users to chat to each other in real-time using VoIP
(Voice over Internet Protocol) technology. While the work presented in this chapter fo-
cuses on Skype voice calls only, the software also provides instant message (text) and
video communication. Skype makes a good detection target due to its wide appeal, dis-
tinct visual patterns as described in the previous chapter, and successful classification
in different contexts by others.
As a real-time communication mechanism, Skype has comparatively strict latency
requirements compared to the majority of internet traffic (e.g. web pages, large down-
loads). As a popular service, the detection and efficient routing of Skype traffic is there-
fore useful to network administrators. To ensure good Quality of Service (QoS) Net-
work Administrators may wish to prioritise Skype over other traffic which is less time-
sensitive (e.g. bulk downloads). Similarly, as a vehicle for unsupervised communica-
tion, certain organisations may wish to prevent its use. Of course, the actual conver-
sations carried by the voice and video payloads of Skype are of practical interest to law
enforcement, as well as groups with less socially benevolent goals.
Despite the demand for good QoS, the implementation underpinning Skype’s oper-
ation is unpublished and traffic is encrypted at the application level (i.e. within TCP and
UDP packets) to prevent unauthorised eavesdropping. It uses a peer-to-peer network
to distribute (and complicate) its call routing process, and program execution is de-
liberately obfuscated by design to hinder reverse-engineering (Baset and Schulzrinne,
2006). In light of this situation, significant third party effort has been undertaken to
classify Skype accurately. Even with this effort, the development rate of Skype can out-
92

Developing Activity Metrics: Finding Skype CHAPTER 6
strip the speed of academic publishing meaning that third party analysis is often partly
outdated by the time it is published.
To overcome this obfuscation, classifiers of various forms have been developed to
identify Skype traffic in real-time. Since Skype traffic does not openly identify itself,
these classifiers must identify and detect features of Skype’s protocol to be effective. Je-
sudasan et al. (2010) outlines and compares the two data-centric approaches to solving
the problem of Skype classification:
1. Deep Packet Inspection: Identifies data within individual packets that corres-
ponds to Skype traffic. For example; packet types, port numbers, packet lengths
and IP addresses. Although some features of Skype payload are deterministic,
the majority of directly readable data appears random due to encryption. This
renders this type of classifier rather ineffective in isolation.
2. Flow Analysis: Identifies statistical trends of packet flows over the network. A
flow is a sequence of packets between two machines in one or both directions.
Measures used to analyse a flow include the likes of mean packet length, inter-
arrival times and or specific characteristic packet lengths.
Before presenting their own hybrid method, Jesudasan et al. (2010) note that the most
effective classifiers use a combination of both. In addition, Bonfiglio et al. (2007) present
an interesting method founded upon analysis of the encrypted payloads themselves to
complement the above techniques. Somewhat counter-intuitively, they recognise that
the apparent randomness of Skype’s payloads are a feature in themselves:
3. Payload Analysis: Measures the statistical similarity of observed packet’s data.
The encrypted, and therefore seemingly random, appearance of most Skype traffic
actually aids this identification. Skype payloads are dissimilar to everything, even
other Skype payloads.
The first and third approaches both use forms of deep packet inspection and must
read payload data to function. The second does not, but still uses Transport and Net-
work Layer information such as source and destination IP addresses, port number,
and packet type to segregate and identify traffic flows to allow the classification pro-
cess. The approach described in this study resembles flow analysis to some degree,
93
CHAPTER 6 Developing Activity Metrics: Finding Skype
although individual flows cannot be isolated fully due to the lack of IP address inform-
ation that identify remote hosts at the network layer. However, local hosts (user devices)
are uniquely identifiable by MAC address as described earlier. Any form of deep packet
inspection is impossible due to data-link layer obfuscation from WiFi encryption. Only
a small amount of the information commonly used to classify Skype is visible to an ex-
ternal observer of a WiFi network.
Although our external scenario complicates matters, the demonstrated successes of
these methods can be adapted and built upon. Flow analysis has shown that measur-
able side-channel information (rather than directly readable frame data) such as pack-
et/frame sizes and interarrival times and can exhibit features suitable for accurate clas-
sification. Similarly, while the vantage point of the observer in these studies makes ana-
lysis of Skype’s transport-layer payload impossible, Bonfiglio et al. (2007) showed that
encrypted data could also display recognisable patterns.
As noted in Chapter 2, White et al. (2011) exploited similar measures and corrob-
orates the existence of patterns found visually in the previous chapter. Although they
were unable to generalise their language model and worked with perfect, noise-free
Skype traffic recordings, extracting spoken phrases from sequences of encrypted Skype
packets is an incredible demonstration of information leakage. Despite all the obfus-
cation effort by the developers, side-channel information exists for Skype traffic and is
surprisingly powerful. This study exploits these same side-channels in order to distin-
guish Skype from other activities and isolate the voice activity itself in encrypted WiFi
traffic.
6.2 Collecting & Accurately Labelling Activity Data
As before, a passive observer can monitor communications between a user device (i.e.
a laptop running Skype) and a wireless access point (AP). Transmissions from both
devices are broadcast through the air and so can easily be received and stored by a third
party. As described fully in previous chapters, a combination of Linux drivers operating
a standard 802.11b /g /n wireless network card in ‘monitor mode’, Kismet — a wireless
packet ‘sniffer’ — was used to monitor WiFi traffic (Kismet Wireless, 2012). This stored
94

Developing Activity Metrics: Finding Skype CHAPTER 6
the observed transmissions as de facto standard PCap (Packet Capture) files for analysis
(TCPDump Team, 2012).
Despite the communication between a device and access point being easily cap-
tured, it is still encrypted. The networks utilised current generation WPA2 encryption
applied at ISO layer 2 (the data-link layer). As shown earlier in Figure 2.3, this means
that all data from higher layers (e.g. IP Addresses; UDP or TCP port numbers; and, of
course, application data itself) cannot be read. Only the data contained within 802.11
headers, and information that can otherwise be measured remains. Specifically, frame
size and frame direction (from source and receiver MAC addresses) can be read from
802.11. Additionally, frame quantity and frame broadcast time can be recorded by the
observer.
Figure 6.1: Observing Encrypted Skype Traffic
This study utilised two datasets. The first was used to calibrate and develop the de-
tection mechanism and, similarly to the visualisation in the previous chapter, collected
as illustrated in Figure 6.1 on a wholly controlled WiFi network. However, obviously a
Skype voice conversation requires at least two participants. Another laptop was set up
to access the internet via the campus-wide network (represented by the access point in
the lower half of the diagram). The MiFi AP was configured so that it operated on a non-
overlapping channel to the campus network AP. The use of MiFi in combination with
95

CHAPTER 6 Developing Activity Metrics: Finding Skype
the campus-wide network forces the two devices to still communicate via the internet
(i.e. preventing direct communication over the WLAN) despite them being geograph-
ically local, making the simulation closer to a real-world scenario.
Having made an initial set of observations on this private network, the same activity
was then observed with the target devices connected to the campus-wide WiFi network
to form the second dataset. This provided the same conditions but the monitored AP
would also be open to all students and staff. This data served to validate any infer-
ence mechanism using from the private network. In reversing the scenario, the non-
targeted device would use MiFi to once again ensure a non-local network connection.
Although the campus-wide network had many other users while this was occurring,
only the traffic to and from the target devices was required and retained for analysis.
As described in Chapter 4, a series of scripts were written using Sikuli (MIT CSAIL,
2012) to re-enact known user activity. Data was recorded for Skype alone, BitTorrent
alone, simultaneous use of Skype and BitTorrent, and simultaneous Skype and Web
Browsing. BitTorrent was selected because related work (Zhang et al., 2011) had found it
problematic to distinguish, and for its outward similarity to Skype traffic: continual bid-
irectional data transfer, and its peer-to-peer nature. It was selected as a challenge. Web
browsing was chosen as a stark contrast: bursts of data predominantly in one direction,
and because it was a highly likely activity for people to perform while using Skype.
For Skype, automation of voice communication was required in addition to mouse
and keyboard input. A script for two participants was created with four interleaved
spoken parts each. These used pre-recorded audio played-back via the Skype API (Wah-
lig and Ohtamaa, 2013) to simulate conversation between two people. The scripts de-
scribed in the previous chapter (as exemplified in Appendix A) were further modified
to contain a system command that executed the Hyenae ‘packet injection’ program
(Hyenae Development Team, 2012) from the command-line. Each conversation part
was ‘tagged’ by deliberately sending two additional frames of known length before each
conversation part was sent for transmission. This effectively marked when each sim-
ulated user was speaking and provided a known signal visible to an external observer.
This would be used to accurately label samples and then removed prior to detection.
96

Developing Activity Metrics: Finding Skype CHAPTER 6
6.3 Characterising Time Windows & Distribution Creation
In Chapter 3 we identified two key measures of network activity that were still access-
ible despite WiFi encryption: Frame size and timing information. As described, these
measures can be combined with directional data courtesy of the MAC addresses in the
unencrypted 802.11 header. The measures used in this study are as follows:
• I-RR: The interarrival time between a received frame and the previous received
frame. Composed from leaked direction and timing information.
• I-SS: The interarrival time between a sent frame and the previous sent frame.
Composed from leaked direction and timing information.
• FSize: The size (length) of each observed frame in bytes. Sent and received frames
form different parts of the distribution by offsetting the size of sent frames. Com-
posed from leaked direction and communication size (length) information.
Other directional combinations for interarrival time (i.e. I-RS and I-RS) are also pos-
sible. As will be discussed, although not used in this study they are utilised in future
chapters.
Using the Wireshark suite (Wireshark Foundation, 2012), this data was filtered to
be generated only from relevant frames. The accessible MAC addresses in the 802.11
header allow for easy identification of the devices used in the investigation and the re-
moval of any communications from other devices and networks operating on an over-
lapping channel. In addition, any frame without the ‘protected’ bit set (denoting en-
cryption) was removed to filter out traffic such as network management frames and
layer 2 acknowledgements. This left only frames containing encrypted data directly re-
lating to user and application activity to and from the target device.
Over time, these measures can be used to characterise network activity. The fre-
quency of each value of these measures per frame can be plotted over time and, as
will be seen shortly, visually represented as a familiar histogram plot. With this repres-
entation using frequency counts it also inherently incorporates leaked frame quantity
information.
Such distributions have a fixed domain boundaries (i.e. a maximum and minimum
value) and fixed number of bins. This representation helps avoid the problems of scal-
97

CHAPTER 6 Developing Activity Metrics: Finding Skype
ing found in the last chapter because any network activity can be represented using
the same fixed distributions and an identical number of variables. This makes them
directly comparable. Frames are processed as follows to generate each distribution:
1. Generate (sliding) time windows: Group frames that arrive within a given time
period. ‘Sliding’ windows are created by generating these windows at intervals
less than the time period they capture. A single frame will therefore reside within
several overlapping time windows. This helps prevent the loss of information that
would occur if user activity was spread over a window boundary as illustrated in
Section 5.4.
2. Generate metric distributions: For each of these windows, measure, count and
group identical values (or similar values with a given tolerance for continuous
variables) for each metric discussed below. The distribution of these metrics char-
acterises the network activity over that time window.
However, without time or frame number as an axis, frame size and interarrival time
distributions discard frame order information. It is hoped that the loss of information
due to this compromise can be mitigated by using appropriate sample rates. A time
period must be chosen appropriate to the activity or activities of interest, so that short
activities are not lost on the noise of a large time window and windows are not too short
for patterns from longer activities to be observed.
A distribution representing FSize can be generated by counting the number of frames
of a given size observed. Frame sizes are discrete, bounded values so plotting is simple.
Sent frame sizes were offset by +1600 (a number greater than the largest observable
frame size1) to distinguish the two but plot them as part of the same distribution. With
bounds of 1–1600 bytes in each direction, this provided 3200 bins for each possible
frame size.
Interarrival times are continuous, but can be similarly counted when grouped into
‘bins’ representing a given interval (e.g. 0.0–0.2ms, 0.2ms–0.4ms, . . . ). In this study in-
terarrival time measurements were bound to an upper limit of 5 seconds (the length of
1At 7981 bytes, the MTU (maximum transmission unit — see glossary) of 802.11 frames is actually muchlarger than this. However no hardware encountered during the course of this research exceeded the 1500byte MTU of 802.3 Ethernet. This serves a practical purpose: hardware will not have to manually fragmentWiFi frames before forwarding the encapsulated data over LAN.
98

Developing Activity Metrics: Finding Skype CHAPTER 6
Figure 6.2: Expected FSize Distribution over 5s Window (subsection)
a time window, although most measurements would be far lower than this). Again, the
minimum is naturally bound to zero. Other interarrival time measurement combina-
tions (i.e. time between received and sent frames (I-RS), and vice versa (I-SR)) were set
aside for this study as they did not sufficiently improve classification to warrant their
inclusion. However, they do feature in future chapters as part of more complex classi-
fication techniques.
The distributions employed here provide more detail than measures in other re-
search that relies largely upon aggregated measures. The downside to the increased
level of granularity used in this study is the increased computational cost of both stor-
ing and processing all these variables. For the aforementioned traditional Skype clas-
sification approaches, aggregation is a sensible simplification (Jesudasan et al., 2010;
Bonfiglio et al., 2007; Baset and Schulzrinne, 2006). Histograms have also been demon-
strated previously in network traffic classification studies (Kind et al., 2009; Perona et al.,
2010). However, they are not widely used. Although they provide depth of information,
increased data comes at greater computational cost for classifier construction and pre-
dictions.
The majority of activity detection systems are designed to operate internally, within
a network (e.g. Network intrusion or or anomaly detection systems). Unlike our study,
these classifiers are designed to operate inside the network and are designed with much
99

CHAPTER 6 Developing Activity Metrics: Finding Skype
Figure 6.3: Expected I-RR Distribution over 5s Window (subsection)
Figure 6.4: Expected I-SS Distribution over 5s Window (subsection)
greater data throughput in mind. However, they are afforded the convenience of direct
access to data at higher network layers (e.g. IP addresses, port numbers). In contrast,
an external observer in our scenario operates a situation with comparatively low data
throughput, but due to encryption must rely on every scrap of information possible.
Although performance is an important consideration explored in Chapters 7 & 8, is a
lesser concern here. As an external network observer, the data throughput is limited to
only geographically nearby devices.
100

Developing Activity Metrics: Finding Skype CHAPTER 6
Although also observing from an external vantage point, Zhang et al. (2011) used
sums, means, medians, variances, and coarse ranged measures of frame size granu-
larity. Unnecessarily discarding potentially useful information seems imprudent given
the overall lack of data available due to WiFi encryption compared to other scenarios.
This chapters demonstrates that this remains a tractable problem despite the greater
quantities of data resulting from this relatively high granularity.
Histograms providing expected values over a time period can be used in a way ana-
logous to probability density functions. These are a common statistical technique and
have been used for decades to describe general models of network traffic (Redner and
Walker, 1984; Jain and Routhier, 1986). A probability density function models the ex-
pected distribution of ‘Random Variables’ given a number of parameters. Despite the
name, these variables are not truly random. The likelihood a variable will take on a
given value is predicted by a probability function, and an expected distribution of these
values can also be determined. For example, in networking this may model expected
packet length, call duration or error rate (Gebali, 2008). This work uses previous activity
samples to provide the same data empirically. Analysis of the measurements from these
samples previous samples provides expected distributions and an estimate of each his-
togram bin’s value for a particular activity.
The data collected for the first dataset while observing the private MiFi network was
used to profile and characterise the typical appearance of Skype voice traffic. Using the
deliberately injected ‘tags’ at the beginning and end of the voice conversation, it was
possible to generate distributions for only the time windows containing Skype voice
traffic. By combining the distributions created for these time windows over multiple
recordings of only Skype voice traffic, it was possible to create expected distributions for
each metric to represent how Skype voice traffic typically appears. These distributions
used a time window period of 5 seconds at intervals of 50ms (thereby creating sliding
windows).
As a demonstration of how these distributions can differ depending on network
activity the histograms in Figures 6.2, 6.3 and 6.4 show Skype activity overlaid with Bit-
Torrent traffic. Only subsections of the distributions are shown for legibility. Notable
differences between distributions can be explained by analysing the goals and beha-
101

CHAPTER 6 Developing Activity Metrics: Finding Skype
Figure 6.5: Expected FSize Distribution over 5s Window (subsection)
viour of the different protocols. Skype attempts to maintain QoS for voice traffic so that
audio is transmitted both near-instantly and clearly. As such, it transmits at a regular
rate — shown by the I-SS peaks at 20ms and 40ms in Figure 6.4 and corroborating the
analysis of Baset and Schulzrinne (2006) — and with relatively small frame quantities
of data within certain bounds — 200 ±30 bytes as seem in Figure 6.2.
Conversely, as a bulk file download mechanism, BitTorrent will attempt to transfer
information as quickly as possible — denoted by peaks close to zero on the I-SS and I-
RR distributions in Figures 6.3 and 6.4 — and a large number of incoming frames hitting
at the limit (1546 bytes as measured in this study) caused by the MTU. Also of note is
the tendency of received interarrival times between received frames to peak at 10ms
intervals, this is true even for BitTorrent that (to the best of the author’s knowledge)
does not deliberately attempt to achieve this. It is assumed that is an artefact of the
underlying networks’ routing.
In this study we also wish to detect Skype traffic interleaved with other activities.
Figures 6.5, 6.6 and 6.7 illustrate the differences in distributions between Skype traffic
alone and Skype traffic interleaved with BitTorrent traffic.
Figure 6.5 shows that with the addition of Skype, Skype+Torrent traffic is closer to
plain Skype than BitTorrent alone was previously. The fact that these distributions are
not more similar is due to the variation displayed naturally as a variation of the Skype
102

Developing Activity Metrics: Finding Skype CHAPTER 6
Figure 6.6: Expected I-RR Distribution over 5s Window (subsection)
Figure 6.7: Expected I-SS Distribution over 5s Window (subsection)
protocol. Despite being the same conversation, a slightly different range of frame sizes
are produced. This could be due to a variety of factors, but the most likely are the Skype
voice encoder encoding at a different offset from the start of the conversation and dif-
ferent (audio) background noise. Such inherent variance is a testament to the difficultly
of this problem.
Both Figure 6.6 and, most notably Figure 6.7, highlight a problem with the current
representation of interarrival times. As can be shown by the large shift to values less
103

CHAPTER 6 Developing Activity Metrics: Finding Skype
than Skype’s 20ms transmission rate, interarrival distributions will be skewed by addi-
tional traffic. For any interarrival time between two frames, any additional frame in-
serted between then will cause two interarrival times of lesser value to replace it. This
issue and an attempt to remedy it is discussed in the next chapter.
Despite these differences, distributions do become measurably more ‘Skype-like’
overall, even if this is not reflected in every variable as would be ideal. As a first attempt
at Skype detection using the distributions developed in this chapter, the next section
outlines a method to measure the difference between observed traffic and Skype in an
attempt to detect its presence.
6.4 Detection via Thresholds
As was demonstrated by comparing different network activity histograms in the previ-
ous section, a previously unseen recording of unknown data can compared to the ex-
pected values to determine its similarity to Skype voice traffic. In this section we present
a simple method to assign scores to observed distributions in order to quantify simil-
arity.
There are many pre-existing methods of comparing histograms and, as summarised
by Weken et al. (2003), are of particular use to determine the differences between im-
ages. As a necessity for accurate computer vision, there are also tailored algorithms for
tasks like shape matching, colour analysis, and 3D-object recognition (Ling and Okada,
2007). However, these are usually founded on traditional distance measures which, as
described shortly, are not a desirable property in this situation and tailored to over-
come common visual alterations such as changes in luminosity or added noise. These
differ from the perturbations we are likely to see due to network traffic. Ling and Okada
(2007) present an efficient form of the general ‘Earth Mover’s Distance Algorithm’, how-
ever even in this efficient form it is prohibitively computationally expensive. Using this
algorithm, histograms for network activity could be not processed at the rate they are
generated.
Equation 6.1 describes our alternative, inexpensive scoring system to assign time
windows of an unknown recording a score for each metric:
104

Developing Activity Metrics: Finding Skype CHAPTER 6
Figure 6.8: Detector Scores for Skype Only
Sw =N∑
i=1
ei oi w (6.1)
Distributions are formed from N histogram ‘bins’ displayed as the domain axis in the
previous figures. A metric’s score for a given time window (Sw ) is given by multiplying
the values from the pre-calculated expected distribution (ei ) by the number actually ob-
served over that time window (oi w ), and taking their combined sum. Observing a more
likely value therefore increases the score for a metric more than an unlikely value. In
contrast to other potential measures, this deliberately avoids penalising the score of in-
terleaved traffic. For example, using a traditional distance measure like mean squared
error instead would cause both BitTorrent FSize and BitTorrent+Skype FSize to have
a score lower than Skype alone. Instead BitTorrent+Skype will have larger score. This
theoretically allows for distinction between the three.
In combination, these numeric scores can be used to quantify Skype-like activity.
Figures 6.8, 6.9, 6.10 and 6.11 show the metric scores over time for several examples of
different activities. A darkened background denotes when a Skype voice conversation
was in progress. Interarrival scores are scaled by a factor of 100 for illustrative purposes
only. FSize is the strongest indicator of Skype activity, but the addition of I-RR and I-SS
tighten the accuracy over our larger dataset. For example, in Figure 6.10 I-SS could be
used to suppress a potential false positive around the second highest FSize peak. By
105

CHAPTER 6 Developing Activity Metrics: Finding Skype
Figure 6.9: Detector Scores for BitTorrent Only
Figure 6.10: Detector Scores for Simultaneous Skype and BitTorrent
Figure 6.11: Detector Scores for Simultaneous Skype and Web Browsing
comparing the plots for each metric, thresholds for each metric could be determined
that, when exceeded, indicated that Skype voice traffic was probably occurring.
106

Developing Activity Metrics: Finding Skype CHAPTER 6
Table 6.1: Detector Performance: Skype Only
Private Network Campus-Wide NetworkMetric S% NS% All% S% NS% All%FSize 94.58 89.95 90.66 79.96 88.04 86.76I-RR 100.0 37.83 47.29 98.54 36.87 46.59I-SS 100.0 48.47 56.31 100.0 46.05 54.55
Comb. 94.58 89.95 90.66 79.96 88.04 86.76
Table 6.2: Detector Performance: Skype+Torrent
Private Network Campus-Wide NetworkMetric S% NS% All% S% NS% All%FSize 97.56 64.12 69.02 93.92 68.55 71.82I-RR 100.0 26.58 37.35 99.03 22.55 32.41I-SS 100.0 29.66 39.98 100.0 29.08 38.22
Comb. 97.56 64.54 69.38 93.66 68.63 71.85
Table 6.3: Detector Performance: Skype+Web
Private Network Campus-Wide NetworkMetric S% NS% All% S% NS% All%FSize 95.25 84.97 86.56 98.13 79.22 81.92I-RR 100.0 29.05 39.98 99.43 16.22 28.07I-SS 100.0 40.19 49.41 100.0 31.27 41.06
Comb. 95.25 84.99 86.57 97.65 79.41 82.01
Table 6.4: Detector Performance: BitTorrent
Private Network Campus-Wide NetworkMetric S% NS% All% S% NS% All%FSize — 65.10 — — 59.45 —I-RR — 30.21 — — 18.83 —I-SS — 32.41 — — 34.53 —
Comb. — 65.10 — — 60.14 —
6.5 Detector Accuracy
From the observations of Skype-only activity on the MiFi network, 19 data recordings
were used to generate expected normalised distributions for each metric. Thresholds
were then set for each metric by visual inspection. For the purposes of this study, thresholds
were set erring on the side of caution and are therefore relatively low to prioritise true-
positive identification of Skype voice traffic.
The detection process was then performed on the remaining Skype-only obser-
vations as well as the other activities simulated on the private network. As a further
107

CHAPTER 6 Developing Activity Metrics: Finding Skype
test, the same detector was then used on recordings from the campus-wide network.
Tables 6.1, 6.2, 6.3 and 6.4 show the accuracy of each metric for the correct classifica-
tion of Skype (S%) and Non-Skype (NS%) time windows. ‘Comb.’ is the combination
of the three metrics, denoting when all are above their respective thresholds for a given
window.
6.6 Discussion
On the otherwise unused private network the positive detection rate of actual Skype
voice traffic was high with a detection rate in the mid-90s even with ongoing simultan-
eous activity. However, false positives for non-Skype traffic increased in cases of ad-
ditional activity. BitTorrent traffic especially being incorrectly detected as Skype with
comparatively low accuracy of∼65%. As found in similar work (Zhang et al., 2011), Bit-
Torrent proves to be a difficult problem to solve for the reasons outlined earlier in this
chapter, as demonstrated by high false positives for torrent-only traffic on both net-
works.
This study produced selection of metrics to identify particular network activity based
on metrics available despite encryption. Given the granular information available due
to the use of histograms, it may possible to improve accuracy by looking more precisely
at particular features within these distributions. For example, as noted earlier Figure 6.5
the comparison between Skype and BitTorrent traffic shows a marked difference in that
FSize distribution subsection. Although this would of course be expressed through the
overall score, its importance could be prioritised and assessed separately. With com-
parisons between BitTorrent, Skype and the combination of the two, how these distri-
butions are perturbed with the addition of interleaved activity was also demonstrated.
The study presented in the next chapter attempts to address both these issues.
Using the same metrics on the campus-wide network produced interesting results.
While accuracies were slightly poorer for combined activity, the correct detection rate
of Skype voice traffic fell by a much greater ∼15% when analysing Skype-only obser-
vations. This can be explained by the change in network environment causing Skype
activity to not quite meet the thresholds set on the original MiFi network. Differences
108

Developing Activity Metrics: Finding Skype CHAPTER 6
in distribution were expected as a consequence when changing network environment,
but clearly there is a fine balance to be had in maximising the correct detection of Skype
traffic while retaining a low false-positive rate for distinct but similar looking traffic like
BitTorrent. Changes to network infrastructure obviously alter the outward characterist-
ics of activity so ways to overcome this and produce a generalised solution are therefore
considered carefully in future work.
Threshold levels were set by visual inspection from the initial Skype activity on the
private network and the ideal levels for the three metrics to simultaneously maximise
Skype detection and minimise false positives is not obvious, given that all three must be
met for the mechanism to classify something as Skype. Future work could methodic-
ally optimise these thresholds or, as seen in the next chapter, use a method to compare
distributions that creates these automatically. Furthermore, providing a ‘ground truth’
to represent the normal background traffic between a device on a target network when
it is otherwise idle could be used to adjust the mechanism to changes in network en-
vironment.
Although work is required to reduce false positives, this research demonstrated a
mechanism that is relatively robust against the ability to hide actual Skype traffic even
with this relatively rudimentary detection mechanism. In spite of relatively simplistic
score measure, it has shown that the side-channel information to perform this analysis
exists and inferring user activity is possible even on a (supposedly) secure network. It
is quite possible to infer and detect a specific kind of user activity despite the observer
being entirely passive, despite being external to the network, despite the correct use of
encryption, and using only the limited data this scenario provides.
Despite demonstrating high false-positive rates, this technique may still prove to
be a more cost-effective and tractable problem than breaking encryption first (which
is highly computationally complex), and then searching for Skype within. Design of ef-
ficient protocols to resist this analysis may prove very difficult, and awareness of this
security weakness can allow people to recognise where inference techniques such as
this may be a security risk and change their network use as appropriate. Further dis-
cussion of the potential applications of these methods can be found in Chapter 9.
109

CHAPTER 6 Developing Activity Metrics: Finding Skype
6.7 Study Conclusions
This chapter documents the creation of an initial detection mechanism for Skype voice
traffic. The study demonstrated that it is quite feasible to infer and detect a specific
kind of user activity despite the observer being entirely passive, despite being external
to the network, despite the correct use of encryption, and despite the limited data this
scenario provides. Frame size and timing metrics interpreted as histograms form the
foundation of this and all subsequent detection methods. The next chapter looks to
improve the detection mechanism and the data representation that supports it.
110

7 Improved Activity Detection:Random Forests
This work builds upon the efforts in the previous chapter using frame size and per-
mutations of interarrival distributions to infer Skype voice activity by monitoring wire-
less network traffic. However, instead of manual analysis and setting thresholds, ma-
chine learning is used to build a classifier program. Random Forests were chosen as the
machine learning approach to enable accurate identification of specific user activity
within encrypted WiFi traffic. Random Forests are only one of many machine learning
approaches. This chapter details how Random Forests were selected as the appropriate
tool for the task.
Alongside refined representations of the limited data available, the Random Forest
classifier demonstrates improved accuracy in identifying the targeted Skype voice activ-
ity within the sample set. Further analysis shows that following the initial construction
process, classification and monitoring can be performed efficiently so that they are ap-
propriate for low-cost, easily portable commodity hardware. Once again, any adversary
using these techniques need not be in a privileged position. An external observer can
operate while completely external to the network without connectivity or credentials
as long as they are within receiving range of WiFi transmissions. Furthermore the ad-
versary can perform this analysis entirely passively with no chance of being discovered.
7.1 Selecting A Machine Learning Approach
A machine learning algorithm will be used to decide what user activity (if any) is present
within a sample of network activity. Using the procedures in the previous chapter, these
samples are represented as a selection of frame size and interarrival metric distribu-
tions visualised as histograms. Machine learning is the collective name for a wide vari-
ety of computer algorithms that construct statistical models. These algorithms ‘learn’
from their inputs to make some form of prediction or decision regarding subsequent
111

CHAPTER 7 Improved Activity Detection: Random Forests
data. Thus, in contrast to traditional computer programs, they can adapt and improve
their output by altering their internal models as additional data is provided. These tech-
niques typically take one of two approaches (Russell and Norvig, 2009):
• Supervised: The machine learning method is given a data set to ‘train’ with. This
training data contains samples of input data matched to a known correct output.
The algorithm attempts to construct a model that best predicts all these desired
outputs using their corresponding inputs. Providing the sample training data is
representative, it is assumed that the constructed model will generalise to the
whole population the sample training data is drawn from.
• Unsupervised: The machine learning technique is again supplied with training
data, however this time no desired outputs are supplied. Instead, the algorithm
attempts to find and model the structures of the data itself.
Like many statistical tests, machine learning algorithms may also make assumptions
about the data they operate upon. This divides them into two categories:
• Non-parametric: No assumptions are made about the distributions of the data.
• Parametric: Each variable within the input sample data provided to the machine
learning algorithm is assumed to be sampled from a distribution with a known
structure. For example, often variables are be assumed to be normally distrib-
uted. This represents the common scenario where values have an expected value
(mean), but are sampled with some margin of measurement error (deviation).
We have no reason to believe that variables within the histogram distributions will be
normally distributed. Random Forests, as well as the other common machine learning
techniques mentioned, have non-parametric variants and do not make any assump-
tions about the distribution of the data.
Machine Learning techniques can also be categorised by the type of prediction they
are designed to make (i.e. their output) (Russell and Norvig, 2009):
• Classification: A supervised technique, new samples are classified based on the
model constructed from the training data (e.g. predict where an email is spam or
not-spam (Pantel and Lin, 1998)).
112

Improved Activity Detection: Random Forests CHAPTER 7
• Regression: Another supervised technique, but instead produces a continuous
numeric value rather than a discrete class label (e.g. predict future stock prices
based on historic data (Trafalis and Ince, 2000)).
• Clustering: Similar to classification, but for unsupervised techniques. Classes or
‘clusters’ of similar samples are assigned by the algorithm (e.g. find geographical
crime hot-spots from incident reports (Wang et al., 2012)).
Another interesting machine learning approach to note is reinforcement learning:
• Reinforcement Learning: An algorithm attempts to perform a specified task within
a dynamic environment. The algorithm must react to changing circumstances to
achieve this (e.g. correctly drive an autonomous vehicle (Stafylopatis and Ble-
kas, 1998), or develop a strategy to win competitive games against an unpredict-
able adversary (Wender and Watson, 2012)). Here the useful output is the strategy
used to maximise success (as defined by the programmer).
Reinforcement learning is not a feasible approach due to the scenario our observer op-
erates within. The encrypted nature of WiFi communications prevents the creation of a
useful real-time feedback mechanism. Unfortunately this means that the primary fea-
ture of reinforcement learning is unavailable; an activity detector cannot update itself
as it is running. However, it is important to note that a detection mechanism can still be
developed offline then operated in a live environment, as is demonstrated in Chapter 8.
We therefore ideally wish to be able to make predictions on unseen live data based
on data sampled prior to constructing the detector. These predictions will be categor-
ical classes denoting the type of user activity (e.g. Skype, Not-Skype) so regression is not
required. As described in Chapter 4, the data collection process will provide samples
of network activity corresponding to a particular user activity and this can form a well-
labelled training set. Although unsupervised clustering would provide an interesting
analysis of the outward similarities and differences between different activities, activity
identification is our primary goal so supervised classification techniques fit this prob-
lem best. The task is therefore to decide which of the many supervised classification
methods to use.
113

CHAPTER 7 Improved Activity Detection: Random Forests
Figure 7.1: Machine Learning Process Flow Diagram (Kotsiantis, 2007)
7.2 Supervised Classification
Figure 7.1 outlines the process for selecting a machine learning classification algorithm.
The knowledge required prior to algorithm selection (problem, required data, and pre-
processing) have been detailed in previous chapters and can be summarised as follows:
Problem Identifying user activity from encrypted WiFi traffic
(Chapter 3).
Required Data A representative collection of observed, then saved encryp-
ted WiFi frames (Chapter 4).
Pre-processing Separate data into ‘time windows’ and create histograms for
interarrival and frame size information (Chapter 6).
The training set can therefore be defined:
114

Improved Activity Detection: Random Forests CHAPTER 7
Training Set Many time windows labelled as containing to a specific user
activity class. The sample of each time window is represented
by several histograms (distributions of frame size and interar-
rival measurements) and each histogram bin holds a value
(frequency). Each bin value is an input parameter.
Now all that is required is the selection of the machine learning algorithm itself.
Fernéndez-Delgado et al. (2014) authors a paper enquiring “do we need hundreds of
classifiers to solve real world classification problems?”. They surveyed 179 classifiers
from 17 technique families over 121 varied data sets and found that while Random
Forests provided greatest accuracy in the paper, this was a minor and statistically in-
significant performance increase upon second-place Support Vector Machines (SVMs).
Kotsiantis (2007) also provides a useful, if subjective, pro/con comparison of common
machine learning classification techniques. The overall conclusion is that — provided a
machine learning technique is appropriate for the problem — then any of the common
machine learning classification approaches will produce similar results. Perhaps more
importantly, although certain techniques would sometimes excel by a small margin, it
is not possible to predict which technique would perform best in advance.
The choice of algorithm therefore ultimately comes down to personal preference
and Random Forests were chosen in this instance. The Support Vector Machines (SVMs),
Bayesian Classifiers, or monolithic Decision Trees (without being used in an ensemble
to form a forest) could be equally justified and should demonstrate similar accuracy
and overall results. However, in the author’s opinion Random Forests offer some use-
ful visualisation and analysis tools and have similarities to the widely understood flow
chart that are useful to explain their operation to non-researchers.
7.3 Random Forests of Decision Trees
To construct a classifier from the available distributions, we employed the Random
Forest machine learning technique using the BigRF package in R (R Core Team, 2013;
Lim et al., 2013). Popularised by Breiman (2001), Random Forests are a supervised, non-
115

CHAPTER 7 Improved Activity Detection: Random Forests
parametric technique and therefore rely on carefully collected labelled sample data.
However, Random Forests do not make any assumptions about the distribution of the
data. We have no reason to believe that variables within the histogram distributions will
be normally distributed. After construction the Random Forest will be able to predict
the app in use when given a sample of network activity.
The accuracy of this prediction process is measured as Out-Of-Bag (OOB) error.
This is a generalisation error based upon the ability for the Random Forest classifier to
correctly classify sets of test samples. Unlike many other machine learning algorithms,
Random Forests do not require manual separation of data into Training and Test sets.
This is performed automatically as part of the forest construction process. Each tree
selects approximately 2/3 of samples for construction and leaves aside 1/3. The se-
lection of these samples is random and therefore OOB error is calculated as the forest
construction process progresses. It is therefore considered unbiased unlike machine
learning methods that evaluate error with a single test following classifier construction
(Breiman, 2001).
Aside from the final classifier, Random Forests also produce an ordered ranking of
variable importance and the ability to construct class prototypes. As we will show, vari-
able importance can be incredibly useful to optimise the classification process by re-
ducing the variables provided to the Random Forest to only those that are most helpful.
Class prototypes specify which properties are exhibited by a typical class. Best plotted
as a box plot showing the median and interquartile range of each input parameter, they
can be very useful to visualise the differences between classes and provide a concrete
example of which characteristics best define a particular class.
Random Forests are an ensemble method, formed by building many Decision Trees.
Comparable to the common flowchart, a Decision Tree is a sequence of nodes and dir-
ected paths (‘branches’) used to predict the class of a given sample. Any route through
the tree starts at a single ‘root’ node and eventually ends at a terminal ‘leaf’ node provid-
ing a class prediction. The route taken depends on the decision made at each node. The
trees used here are binary decisions operating on a single variable. Each node compares
a variable from the sample data with the model’s predetermined value. The outcome
of this comparison then determines the branch taken to the next decision node or ter-
116

Improved Activity Detection: Random Forests CHAPTER 7
minal leaf.
The variables used in the sample should be selected to allow differences between
classes to be characterised. Each decision attempts to separate classes based on these
characteristics. Providing the tree is well constructed, the sequences of decisions will
cause the available classes to gradually separate as the path through the tree is followed.
A Decision Tree within the Random Forest is grown as follows (Breiman, 2013):
1. Generate a new random training subset for each tree: N training samples with
known class labels are taken from the complete dataset with replacement (so the
same sample can be selected multiple times).
2. Grow the tree: At each node in the tree, select a different random selection of m
variables from the M total in each sample. The best decision on m to split the N
samples by classes is calculated and used for this node. The value of m is constant
across the entire forest.
3. Terminate with leaves denoting a class: Each tree is grown to the largest extent
possible. Decision nodes are grown until only a single class remains on a branch.
This branch will then lead to a terminal ‘leaf’ node denoting the relevant class
label.
The Decision Trees that constitute the forest attempt to optimally separate the classes
based on random subsets of the variables provided. Individually their ability to gener-
alise is poor due to working with only a small fraction of the available data. However,
their predictive power is much improved when used in combination. This ability is
the foundation of ensemble machine learning methods, where combining many smal-
ler less accurate classifiers can be easier to construct and just as powerful as a single
monolithic classifier. Unlike monolithic classification or regression trees, decision trees
within a Random Forest are grown to the maximum extent and there is no pruning.
The statistical measure used to evaluate how well samples are split is ‘Gini impurity’
(although other measures of impurity are available). As detailed in Equation 7.1, it is
a estimate of how likely samples are to be misclassified if they were labelled randomly
in proportion to the distribution of classes at that node. pc is the probability of being
117

CHAPTER 7 Improved Activity Detection: Random Forests
labelled as class c , of C total classes.
Gini impurity=∑
c
1−p 2c (7.1)
Gini impurity is therefore zero (completely pure) at terminal ‘leaf’ nodes where only
a single class exists in the remaining sample subset (i.e. p = 1 as there is only one class).
Gini impurity is at maximum where all classes have an equal chance of being chosen
as a prediction (i.e. p = 1/C ). The decrease of Gini impurity is used as measurement
of how ‘good’ a decision is. This informs the algorithm which decisions to use when
constructing each decision tree: prefer the one that minimises impurity in the two sub-
nodes. Weighting values can also be applied on a per-class basis to the impurity calcu-
lation if appropriate. We used fair weights that corrected for differences in total sample
count for each class. Thus, misclassifying any sample was equally ‘bad’ and added the
same level of impurity. In both this study and the subsequent app identification study,
although we wished to maximise true positive classification, we found that biasing the
impurity calculation against ‘Other’ and ‘Non-Skype’ traffic did not improve classifica-
tion accuracy any further. This is illustrated shortly in Section 7.6.
7.4 Sample Data & Representation
Using the same collection processes from the previous chapter and the same histo-
gram representation, the typical WiFi scenario presented in Figure 7.2 was recreated.
As before, our primary dataset user activity was emulated by utilising several laptops
with automation software to perform predefined user activities over WiFi. The internet
was accessible though WiFi either from a 3G portable hotspot (uncongested, controlled
wholly by us) or via the campus network (public and relatively congested, but with ac-
cess controls and well-provisioned). Skype voice activity was tagged specifically and
labelled as such to distinguish it from other traffic.
In addition, a secondary dataset was provided by volunteers who agreed to operate
our portable device at home for several days. This portable device was an automated
version of the platform described in Chapter 4 and presented in Atkinson et al. (2014a).
This would passively recorded data sent over their home WiFi network automatically
118
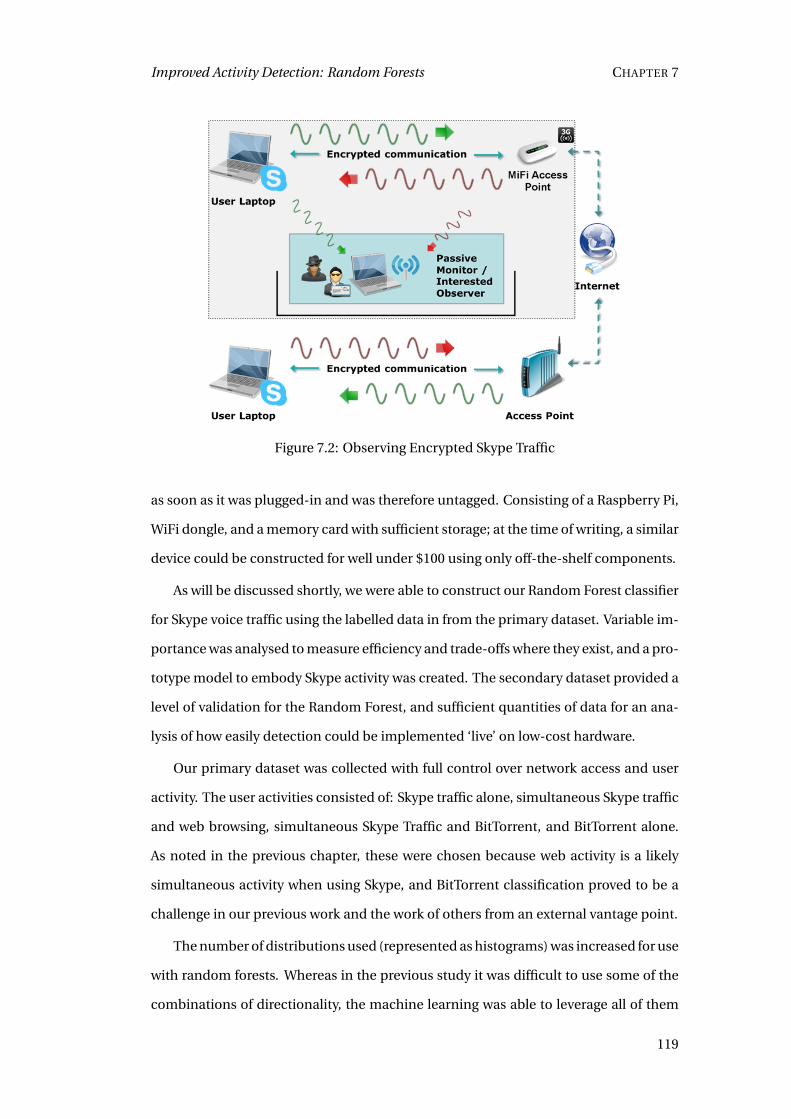
Improved Activity Detection: Random Forests CHAPTER 7
Figure 7.2: Observing Encrypted Skype Traffic
as soon as it was plugged-in and was therefore untagged. Consisting of a Raspberry Pi,
WiFi dongle, and a memory card with sufficient storage; at the time of writing, a similar
device could be constructed for well under $100 using only off-the-shelf components.
As will be discussed shortly, we were able to construct our Random Forest classifier
for Skype voice traffic using the labelled data in from the primary dataset. Variable im-
portance was analysed to measure efficiency and trade-offs where they exist, and a pro-
totype model to embody Skype activity was created. The secondary dataset provided a
level of validation for the Random Forest, and sufficient quantities of data for an ana-
lysis of how easily detection could be implemented ‘live’ on low-cost hardware.
Our primary dataset was collected with full control over network access and user
activity. The user activities consisted of: Skype traffic alone, simultaneous Skype traffic
and web browsing, simultaneous Skype Traffic and BitTorrent, and BitTorrent alone.
As noted in the previous chapter, these were chosen because web activity is a likely
simultaneous activity when using Skype, and BitTorrent classification proved to be a
challenge in our previous work and the work of others from an external vantage point.
The number of distributions used (represented as histograms) was increased for use
with random forests. Whereas in the previous study it was difficult to use some of the
combinations of directionality, the machine learning was able to leverage all of them
119

CHAPTER 7 Improved Activity Detection: Random Forests
to some extent. This study therefore utilised all possible interarrival metric distribu-
tions as outlined in Table 7.1. Furthermore, cumulative interarrival time distributions
were added as will be explained shortly and time windows were shortened from 5s to
0.5s. However, the granularity of these distributions was decreased from 1ms histogram
bins to 3ms bins. Furthermore, these distributions were clipped to maximum of 150ms
whereas previous it was capped at 5000ms with the tail of the distribution having neg-
ligible values. Trials showed that the additional precision was not necessary and these
changes greatly increased construction speed while retaining classification accuracy.
Table 7.1: Distributions Created For Each 0.5s Window
Distribution No. Vars DescriptionFSize 3600→ 217 (1) Frame Size (received frames offset by +1600)I-RR 50 Rcvd-to-Rcvd interarrival timingI-RRCum 50 Cumulative transformation of I-RRI-SR 50 Send-to-Rcvd interarrival timingsI-SRCum 50 Cumulative transformation of I-SRI-RS 50 Rcvd-to-Send interarrival timingsI-RSCum 50 Cumulative transformation of I-RSI-SS 50 Send-to-Send interarrival timingsI-SSCum 50 Cumulative transformation of I-SSTotal 4000→ 617 (1)
After collection, the data is separated into time windows. The classifier operates on
the distributions generated from the frames within these time windows. The primary
dataset produced 59319 windows in total, of which 7149 contained Skype and 52170
were Not Skype. This provides ∼8 hours of recorded (non-idle) network communica-
tion data, representing only the user activities discussed. Windows were of fixed 0.5
second length and proved to be reasonable to detect Skype voice conversation. This
may not be appropriate for other activities and future work could look to optimise this
choice.
As done previously, from each window we then calculate certain distributions from
our observations. Will all directionality combinations now represented, these distribu-
tions consist of Interarrival Times between frames in certain directions; Send-to-Send
(I-SS), Received-to-Received (I-RR), Send-to-Received (I-SR), and Received-to-Send (I-
RS) timings divided into 3ms bins. The Frame Size (FSize) distribution split into direc-
1 A FSize subset is selected prior to forest construction. See next section.
120

Improved Activity Detection: Random Forests CHAPTER 7
Figure 7.3: Expected I-SS Dist. over 5s Window (subsection)
tions was also created by offsetting frame sizes by+1600 (a convenient number greater
than the maximum frame size). Frame sizes are already a discrete, bounded measure-
ment and so the FSize distribution uses these exact values.
To illustrate how differences from these distributions can still be used to delineate
different user activities with these changes, Figure 7.3 shows a subsection of the differ-
ences in the expected (averaged) I-SS distribution for Skype and BitTorrent traffic over
a 5 second time period. (Note: Although 5s provides a better visualisation, the shorter
sample period (0.5 seconds) is used for actual classifier construction. Also note that
data supplied to the Random Forest is not averaged or aggregated over many samples
in this way.)
7.4.1 Cumulative Distributions
Interarrival time distributions plot the time period between frame observations. How-
ever, as a continuous variable time must be ‘binned’ into given ranges to form a histo-
gram. We use bins 3 milliseconds in size, from 0 to 150ms (i.e. 0 < x0 ≤ 1ms, 3 < x1 ≤
6ms, . . . ). Again, this information can be partitioned using the direction of each frame.
The combinations of interarrival time measurements between frame direction result
in four distributions: Time R↔R, between Received frames and the previous Received
frame (I-RR); Time S↔R, between Received frames and the previous Sent frame (I-SR);
Time R↔S, between Sent frames and the previous Received frame (I-RS); Time S↔S,
between Sent frames and the previous Sent frame (I-SS).
121

CHAPTER 7 Improved Activity Detection: Random Forests
0
1
2
1 2 3 4 5 6 7 8Interarrival Time /s
Fre
quen
cy Value
A
(a) Either Dist. with single 6msvalue
0
1
2
1 2 3 4 5 6 7 8Interarrival Time /s
Fre
quen
cy Value
A
B
(b) Standard Dist. with 2x3msvalues
0
1
2
1 2 3 4 5 6 7 8Interarrival Time /s
Fre
quen
cy Value
A
B
(c) Cumulative Dist. with2x3ms values
Figure 7.4: Interarrival Distribution Comparison
Cumulative Interarrival Time plots for each of the Interarrival Time distribution
combinations are also generated as an alternative representation of the interarrival
data. Like normal cumulative frequency charts, they are identical in construction, but
include the sum of previous (lower interarrival measurement) bins in addition to the
value of the bin itself. Figure 7.4a shows an example of a single 6ms interarrival meas-
urement. Using a standard distribution plot, should a frame from another activity be
sent at 3ms, then the original 6ms reading will change dramatically into two 3ms read-
ings as shown in Figure 7.4b. By plotting a cumulative distribution as shown in Fig-
ure 7.4c instead, additional packets cannot mask the original signal at 6ms.
Knowing that each decision within a Random Forest is based on a single variable,
we can reason that the condition x6 > 0 remains true for cumulative distributions when
spurious frames would otherwise interrupt an interarrival time comparison. Note that
the converse is true for x6 ≤ 1, and will hold for (standard) Interarrival Distributions. We
hope to create a classifier that remains accurate in non-ideal conditions and the com-
bination of these two representations allow for additional robustness when spurious
traffic is inevitably found in addition to the user activity we hope to detect.
7.4.2 Variable Selection
Although random forests are capable of dealing with large numbers of variables, provid-
ing parameters that convey little information is unnecessarily time consuming to pro-
cess. This is especially true when we wish to analyse variable importance and create
class prototypes as the processes are computationally expensive. Our objective was to
make the problem tractable (provide a classifier that can be constructed in a reasonable
timeframe) while minimising the amount of potentially useful information we discard.
122

Improved Activity Detection: Random Forests CHAPTER 7
Table 7.2: Classification Confusion Matrix
Predicted ValueNot Skype Skype Error
Actual Not Skype 50644 1526 3.37%Value Skype 241 6908 2.93%
Having already vastly reduced the number of variables in each interarrival distri-
bution by decreasing the granularity, we analyse the FSize distribution to see what can
be discarded for this particular activity. Analysing only the windows that contained
Skype voice data, we calculated which frame sizes occurred in less than 2% of cases (i.e.
which FSize bins had a non-zero value in <2% of cases). By excluding these we were
able to dramatically reduce the samples required from the FSize distribution from 3200
to only 217. This reduces the total number of variables provided to the Random Forest
to a much more manageable 617, down from 4000. As we are concerned with positive
identification of Skype (and not just Skype in isolation), these can be safely discarded.
The remaining variables provide the best distribution measurements reflecting Skype
activity. These can then be passed to the Random Forest algorithm as representative
samples of each time window. Time windows were labelled based on our tagging pro-
cess for Skype voice traffic the primary dataset. Windows after the indicator packets
and within the conversation length were tagged as containing ‘Skype’. All other win-
dows were assumed to be ‘Not Skype’. The process then attempts to construct a Ran-
dom Forest classifier separating the samples labelled as Skype from those labelled as
Not Skype. The Trees that constitute the forest attempt to optimally separate the classes
based on random variable subsets.
7.5 Random Forest Accuracy
A Random Forest of 200 trees using the distributions (617 parameters) produced from
each window was generated. Class weighting proportional to sample size provided an
impressive ∼97% accuracy for the classification of Skype traffic with only a ∼3% false
positive rate, as detailed in Table 7.2.
123

CHAPTER 7 Improved Activity Detection: Random Forests
7.5.1 Parameter Tuning
We can examine the trade-off between maximising finding Skype traffic (true positives),
and incorrectly classifying Non-Skype traffic (false positives). Class weights can be sup-
plied to the Random Forest algorithm that adjust how trees within the forest are con-
structed. The greater the weight, the ‘worse’ a misclassification of a class is considered.
Therefore, altering the weight ratio in favour of a one class will increase the true posit-
ive classification for that class. However, except in ideal datasets where classes do not
overlap, this will result in false positives for other classes.
The accuracy of our ∼97% accurate Random Forest as trees are added is shown
via the OOB error rate in Figure 7.5a. Proportional weighting produces a forest where
neither class is favoured in the classification. This weighting is default in many Ran-
dom Forest implementations (although not BigRF). In certain applications it may be
preferable to err on the side of caution and prioritise true positives at the cost of false
negatives. As expected, Figure 7.5b shows that attempting to push for greater Skype
classification increases false positives (hinders correct ‘Not Skype’ classification) with
little gain. Figure 7.5c provides further confirmation by showing how extreme weight-
ing in favour of Skype leads to hugely diminishing returns. In combination with the
convergence visible in Figure 7.5a this suggests that Skype classification error rate can-
not be improved beyond ∼97% with this approach on this dataset and affirms the ef-
fectiveness of proportional weighting.
0
10
20
30
40
50
60
70
0 20 40 60 80 100 120 140 160 180 200No. Trees
OOBError(%)
(a) Proportional Weighting(7.3:1)
0
10
20
30
40
50
60
70
0 20 40 60 80 100 120 140 160 180 200No. Trees
OO
B E
rror
(%)
(b) Minor Skype BiasedWeighting (11:1)
0
10
20
30
40
50
60
70
0 20 40 60 80 100 120 140 160 180 200No. Trees
OO
BtE
rror
t(%
)
Class
Overall
Skype
NotSkype
(c) Major Skype Biased Weighting(100:1)
Figure 7.5: Error for Random Forest Composed of 200 Trees Utilising 617 Variables
124

Improved Activity Detection: Random Forests CHAPTER 7
0
10
20
30
40
50
60
70
0 20 40 60 80 100 120 140 160 180 200No. Trees
OO
BtE
rror
t(%
)
Class
Overall
Skype
NotSkype
Figure 7.6: Classification Error of Top 200 Variables with X Trees
7.6 Considering Ease of Implementation
Implementation of classifiers on low-cost hardware can be made easier by minimising
the amount of memory and processing power required. First we investigate decreasing
the number of input variables used. As illustrated shortly, the Random Forest produces
a measure of variable importance to aid in this task. Removing them in reverse order
of importance, Figure 7.7a shows how iteratively decreasing the number of variables
by 10 effects classification accuracy. Figure 7.7b shows minimal sampling taken to the
extreme, using only 1–20 variables.
Interestingly, employing only two variables from the I-SS distribution was capable
of producing >80% accuracy. We can infer that this is due to Skype’s regular packet
transmissions. BitTorrent packets would interrupt this timing but would be less pre-
dictably regular. Cumulative distributions allow for the detection of Skype’s regularity
despite the outwardly different interarrival times. If we assume that we wish to achieve
at least 95% accuracy for detection of Skype traffic, Figure 7.7 shows us that this is pos-
sible from around 200 variables so we will set this as an accepted minimum for low-cost
analysis.
Classification trees can be implemented as iterative if-statements. These are simple
operations, but each tree in the forest requires processing to provide its vote for clas-
sification. We will therefore also attempt to minimise the number of trees. Figure 7.6
plots the error rate against the number of trees in our reduced 200-variable forest. The
error rate plateaus at around 20 trees. We can reason that a Skype classification of>95%
accuracy is possible using only 200 variables and 20 trees.
125

CHAPTER 7 Improved Activity Detection: Random Forests
Table 7.3 shows the execution time for predictions using both our initial highly ac-
curate classifier (∼97%), as well as the reduced classifier (∼95%) using fewer trees and
variables. These timings were performed on a standard business laptop with an Intel i7
processor at 1.7GHz (only one core used), and a Raspberry Pi ARM11 at 700MHz (single
core).
Table 7.3: Time Taken to Classify 59319 Windows
Forest No. Trees No. Vars Time taken (i7) Time taken (RPi)Original 200 617 32.57sec 81minReduced 20 200 0.60sec 51sec
On the i7, our initial 96% accurate classifier took only slightly over 30 seconds to
predict a class for every window in our 8 hour primary dataset, while the reduced tree
only takes six tenths of a second. This excellently demonstrates how the analysis per-
formed in previous sections can provide a huge boost in efficiency if it is determined
the cost is acceptable (slightly lower accuracy). Although the original classifier took far
longer on the Raspberry Pi, a good percentage of the time was spent on overhead due
to the multi-GB dataset being far in excess of the meagre 512MB RAM. Despite this,
producing all this data inefficiently still took only a fraction of the 8 hours observation
time. It is therefore reasonable to assume that a real-time implementation could be
achieved.
Our secondary dataset was sourced from volunteers who allowed us to monitor
their home WiFi for several weeks in total. With no regular Skype users, any predic-
tion of Skype traffic produced on this data can be assumed to be a false positive. Unlike
our primary dataset, these home networks will be idle for large periods of time (e.g. at
night). False positives are therefore best reported as a count instead of a percentage
(which would be unrepresentatively low). Over a dataset consisting of tens of millions
of windows, only several thousand were detected as Skype. It is likely this could be re-
duced further if a minimum conversation length was used to filter spurious results. As
is the case with normal phone calls, real Skype calls are likely to last several minutes.
126

Improved Activity Detection: Random Forests CHAPTER 7
3
4
5
6
7
8
9
10
0 100 200 300 400 500 600No. Variables
Fin
alvO
OB
vErr
orv(
t)
Class
Overall
Skype
NotSkype
3
4
5
6
7
8
9
10
0 100 200 300 400 500 600No. Variables
Fin
alvO
OB
vErr
orv(
t)
Class
Overall
Skype
NotSkype
(a) Nvar = {10, 20, 30, . . . , 600}
0
5
10
15
20
25
30
35
40
45
50
2 4 6 8 10 12 14 16 18 20No. Variables
Fin
alkO
OB
kErr
ork(
%)
Class
Overall
Skype
NotSkype
(b) Nvar = {1, 2, 3, . . . , 20}
Figure 7.7: Forest Classification Error, Top Nv a r Variables
7.7 What defines Skype?
Having constructed our accurate Random Forest Classifier, we can analyse the decisions
it took to learn more about our model and Skype itself. From this we are able to de-
termine exactly what characteristics Skype voice activity. Figure 7.8 plots the relative
importance of each input variable. As is clearly visible, the classifier places heavy reli-
ance on the timings between Sent and Sent frames, utilising both standard (I-SS) and
cumulative distribution (I-SSCum), justifying their use. The two versions of I-RS were
less important but similarly broadly sampled. Interestingly, the most important vari-
ables appeared to be in the I-SRCum distribution, despite the rest of the distribution
being relatively unused, revealing a key timing around 35ms. Certain Frame Sizes, for
example length 128 and 148 outgoing, were also found to be indicative of Skype voice
activity.
We can also ask the model to generate class prototypes. Figure 7.9 shows a proto-
type that represents a typical member of the Skype class. Having selected the top 100
variables of importance, the Medians show the typical value while the percentiles de-
note the possible variation. Prototypes can be used to judge how close a measurement
is to the ‘ideal’ Skype sample, and whether it falls within the expected level of variation
normally exhibited by that class. They are also a good way to visualise and communic-
ate what the classifier is looking for. The classifier could also easily construct a model
for non-Skype traffic however this would not be useful as it is an arbitrarily defined class
that only relates to this specific data set.
127

CHAPTER 7 Improved Activity Detection: Random Forests
0.000
0.001
0.002
0.003
0.004
0.005
0.006
0.007
0.008
0.009
0.010
0.011
0 20 40 60 80 100
120
140
160
180
200
220
240
260
280
300
320
340
360
380
400
420
440
460
480
500
520
540
560
580
600
620
VariableSNo.
Impo
rtan
ce
Distribution
FSizeS(subset)
I−RR
I−SR
I−RS
I−SS
I−RRCum
I−SRCum
I−RSCum
I−SSCum
Figure 7.8: Variable Importance
0
5
10
15
20
25
30
35
FS
ize:
128
FS
ize:
146
FS
ize:
734
FS
ize:
820
I−R
RC
um:0
24I−
RR
Cum
:031
I−S
R:0
01I−
SR
Cum
:001
I−S
RC
um:0
02I−
SR
Cum
:004
I−S
RC
um:0
47I−
SR
Cum
:049
I−S
RC
um:0
50I−
RS
Cum
:002
I−R
SC
um:0
03I−
RS
Cum
:004
I−R
SC
um:0
05I−
RS
Cum
:006
I−R
SC
um:0
07I−
RS
Cum
:008
I−R
SC
um:0
09I−
RS
Cum
:010
I−R
SC
um:0
11I−
RS
Cum
:012
I−R
SC
um:0
13I−
RS
Cum
:014
I−R
SC
um:0
15I−
RS
Cum
:016
I−R
SC
um:0
17I−
RS
Cum
:018
I−R
SC
um:0
19I−
RS
Cum
:020
I−R
SC
um:0
21I−
RS
Cum
:022
I−R
SC
um:0
23I−
RS
Cum
:024
I−R
SC
um:0
25I−
RS
Cum
:026
I−R
SC
um:0
27I−
RS
Cum
:028
I−R
SC
um:0
29I−
RS
Cum
:031
I−R
SC
um:0
32I−
RS
Cum
:033
I−R
SC
um:0
39I−
RS
Cum
:040
I−R
SC
um:0
43I−
RS
Cum
:044
I−R
SC
um:0
45I−
RS
Cum
:046
I−R
SC
um:0
47I−
RS
Cum
:048
I−S
S:0
01I−
SS
:007
I−S
S:0
14I−
SS
Cum
:001
I−S
SC
um:0
02I−
SS
Cum
:003
I−S
SC
um:0
04I−
SS
Cum
:005
I−S
SC
um:0
06I−
SS
Cum
:007
I−S
SC
um:0
08I−
SS
Cum
:009
I−S
SC
um:0
10I−
SS
Cum
:011
I−S
SC
um:0
12I−
SS
Cum
:013
I−S
SC
um:0
14I−
SS
Cum
:015
I−S
SC
um:0
16I−
SS
Cum
:017
I−S
SC
um:0
18I−
SS
Cum
:019
I−S
SC
um:0
20I−
SS
Cum
:021
I−S
SC
um:0
22I−
SS
Cum
:023
I−S
SC
um:0
24I−
SS
Cum
:025
I−S
SC
um:0
26I−
SS
Cum
:027
I−S
SC
um:0
28I−
SS
Cum
:029
I−S
SC
um:0
30I−
SS
Cum
:031
I−S
SC
um:0
32I−
SS
Cum
:033
I−S
SC
um:0
34I−
SS
Cum
:035
I−S
SC
um:0
36I−
SS
Cum
:038
I−S
SC
um:0
39I−
SS
Cum
:041
I−S
SC
um:0
42I−
SS
Cum
:045
I−S
SC
um:0
46I−
SS
Cum
:047
I−S
SC
um:0
48I−
SS
Cum
:049
Variable Name
Fre
quen
cy p
er w
indo
w
Distribution
FSize
I−RR
I−RRCum
I−SR
I−SRCum
I−RS
I−RSCum
I−SS
I−SSCum
Figure 7.9: Skype Prototype Constructed from Top 100 Variables
7.8 Study Conclusions
This work was published at Milcom 2014 (Atkinson et al., 2014b). The classifier proved
to be highly accurate on both the primary dataset and our secondary dataset produced
with relatively few false positives. Our approach combining Random Forests with com-
plete frame size and interarrival distributions improved upon the accuracy of our pre-
vious work (especially false positives) and overcame the issues with certain traffic com-
binations (e.g. BitTorrent). This clearly demonstrates an ability to infer and detect spe-
128

Improved Activity Detection: Random Forests CHAPTER 7
cific user activity when using a supposedly secure network. Awareness of this security
weakness can allow people to recognise where this may be a security risk and change
their usage where appropriate.
A remote, undetectable, high accuracy mechanism to infer Skype voice traffic on
WiFi networks with a success rate of ∼97% and only a ∼3% false positive rate was de-
veloped within this chapter. In spite of any encryption scheme employed, user activ-
ity is inferred by exploiting a variety of frame size and interarrival time distributions.
We demonstrate ways to use these efficiently and optimise the Random Forest classi-
fier generated. The final product is an efficient classifier that we believe can be im-
plemented at very low-cost on portable, commodity hardware. Given its design and
the side-channel data used, these methods should easily generalise to other encrypted
communication methods such as 4G LTE. With longer range wireless communications
becoming more prevalent, and increased commercial interest in tracking and analys-
ing publicly broadcast wireless data, this chapter highlights a plausible threat to users’
private activities.
Now that it has been shown to be feasible, an obvious extension to this work is to
actually implement a live classifier on a low-cost device for various activities. Future
work will also look at identifying multiple user activities, rather than focusing on just
one.
129

CHAPTER 7 Improved Activity Detection: Random Forests
130

8 InferringPersonal Information
This chapter presents the final study in this series to be published in the near future.
Instead of focusing on a single user activity like Skype, this study attempts to identify
34 different activities in the form of mobile apps. Furthermore, the real-time detec-
tion of these apps is performed on live network traffic and, via the use of personas,
demonstrates how sensitive personal information can be leaked. Users would likely as-
sume the confidentiality of personal information (including age, religion, sexuality and
gender) when using an encrypted network. However, we demonstrate how encrypted
traffic pattern analysis can allow a remote observer to infer potentially sensitive data
passively and undetectably without any network credentials.
Without the ability to read encrypted WiFi traffic directly, we once again process
the limited side-channel data available (timings and frame sizes) to enable remote app
detection. These side-channel data measurements are represented as histograms and,
in the same way as the previous Skype study, used to construct a Random Forest classi-
fier capable of accurately identifying mobile apps from the encrypted traffic they cause.
The Random Forest algorithm was able to correctly identify apps with a mean accuracy
of ∼99% within the training set. The complication of simultaneous activity (e.g. con-
current BitTorrent and Skype) is removed. Although background services may still be
present, no parallel user activities were deliberately added. Due to the modal design of
mobile apps (small screen space and battery limitations discourage multitasking) this
is a reasonable assumption about the scenario. Future work could investigate this ad-
ded complication, but for this study simultaneous activities were deemed unnecessary
and unrepresentative of actual usage patterns.
The classifier was then adapted to form the core of a detection program that could
monitor multiple devices in real-time. Tests in a closed-world scenario showed 84% ac-
curacy and demonstrated the ability to overcome the data limitations imposed by WiFi
encryption. Although accuracy suffers greatly (67%) when moving to an open-world
131

CHAPTER 8 Inferring Personal Information
scenario, a high recall rate of 86% demonstrates that apps can unwittingly broadcast
personal information openly despite using encrypted WiFi. The open-world false pos-
itive rate (38% overall, or 72% for unseen activity alone) leaves much room for improve-
ment but the experiment demonstrates a plausible threat nevertheless.
8.1 The WiFi & Mobile Device Scenario
We have already discussed how WiFi communications are now an everpresent part
of modern society; pervading homes, business and almost everything between. This
availability of WiFi and cellular data plans has led to an explosion of popularity in mo-
bile devices (phones and tablets) and the apps that run on them. As discussed in Chapter
2, the ability to infer information about encrypted communications via side-channels
has been previously established, as have the privacy implications of persistently car-
rying personal mobile devices. The potential security risks of particular apps and ser-
vices as will also be discussed shortly. However, this study demonstrates how the three
in combination present a perfect storm making users’ private and sensitive informa-
tion vulnerable. This information can be leaked to any listening party within reception
range of the wireless network. The observer can operate despite WiFi encryption work-
ing exactly as designed, requires no access credentials, and can perform the analysis on
commodity hardware. The technique is therefore remote, passive, undetectable and
inexpensive.
To demonstrate this, 34 highly-ranked apps were chosen and the target demograph-
ics of their users identified. Network data was then collected as the apps were opened.
This network activity denotes the use of a particular app. However, due to encryption
only limited information is available in the form of side-channels. Interpretations of
frame size and interarrival time characteristics were used to create histograms detail-
ing the distribution of these metrics over a given time period. The distributions can
then be used to differentiate between samples of encrypted network activity from dif-
ferent apps. These distributions were labelled appropriately and used by a Random
Forest machine learning algorithm to produce a classifier that predicts app usage (or
lack thereof) based on samples of encrypted network activity. The Random Forest was
132

Inferring Personal Information CHAPTER 8
then converted to compiled code for speedy analysis of data in real-time. Personas
were created to emulate different people, possible app choices, and then monitored in
real-time to demonstrate how personal information can be leaked.
As demonstrated in previous chapters, the methods used to identify apps can also
be used to ‘fingerprint’ other activity over encrypted communications (e.g. VoIP, web-
sites). However, the personal ties of mobile apps, an openly ranked market with rel-
atively low diversity (compared to website fingerprinting in other work), and ease of
collection make apps a particularly opportune and vulnerable target. As will be dis-
cussed further in Chapter 9, although the processes are demonstrated using standard
802.11g WiFi, the methods should generalise to other wireless communications proto-
cols unless they are specifically designed to resist analysis. Notably for mobile apps,
the measurements used to perform this analysis will also be present in longer range
protocols like 4G LTE in cellular phone networks.
The scenario presented here will be familiar: a mobile device connects to a WiFi
Access Point (AP) providing internet access. The apps on the device may then use this
connection to communicate with certain remote internet servers. Information from
these servers is used to provide the app’s content or functionality. Although reliant on
an internet connection, this centralised architecture minimises the storage and pro-
cessing power required by the device itself. Devices can therefore be smaller, cheaper,
and provide up-to-date content or backups whenever connected. Furthermore, as dis-
cussed further in Section 8.4, we found that even those apps that only provide static
local content may still use the internet connection to some degree when available. In
Figure 8.1: Observing Encrypted Mobile Device WiFi Traffic
133

CHAPTER 8 Inferring Personal Information
our scenario the AP provides an 802.11g WiFi network utilising industry standard en-
cryption (i.e. WPA2-PSK or WPA2-Enterprise with EAP) so only authorised users can
access the network.
As before, and illustrated in Figure 8.1, our adversary is a remote observer attempt-
ing to infer information about the users of mobile devices connected to an AP. As the
observation process is entirely passive, the observer is completely undetectable by the
user or network operator. They are not necessarily malicious but have no access to the
network’s credentials or security keys, nor do they ever attempt to crack or discover
them. As will be discussed in Chapter 9, the methods presented in this thesis can be
adapted for a variety of purposes including virtuous ones.
8.2 Mobile Devices & Mobile App Privacy
The abundance of private information stored on modern mobile devices is well-established
(Shilton, 2009). Following the jump from ‘dumb phones’ to smartphones, mobile devices
suffer from the same threats that previously targeted personal computers and are privy
to the same personal information. As useful services are added to mobile platforms,
malware that exploits these services and the data stored is soon to follow. This mal-
ware performs all the activities one would expect. For example; stealing personal data,
sending spam, or ramsomware. An interesting twist on the spam business model is to
generate revenue by calling premium-rate numbers or sending SMS (Felt et al., 2011).
Similarly, the propensity to install apps on mobile devices rather than visit a website,
plus easy-to-use virtual ‘app stores’ or ‘markets’, means installing software on mobile
devices is easy and routine. This is in stark contrast to traditional computers where in-
stalling specialised software just to see a particular news source or check the weather
seems very far-fetched. Given the wealth of personal information and functionality that
could be available to unrestricted programs, great efforts have been made to set up per-
missions systems to regulate app behaviour (Felt et al., 2011; Kuehnhausen and Frost,
2013).
The mobile aspect of these devices adds further privacy risks. The most efficient
methods of routing network communications rely upon the easy and unique identi-
134

Inferring Personal Information CHAPTER 8
fication of the sender and recipient. These and similar unique identifiers pervade un-
protected network communications (Aura et al., 2008). Even from an external vant-
age point with WiFi encryption enabled, MAC addresses that uniquely identify devices
are still freely broadcast. Commercial interest in wireless broadcasts has piqued in re-
cent years with companies recognising them as a potentially huge data source for the
multi-billion dollar Customer Relationship Management market. London’s controver-
sial “tracking bins” that included hardware to collect WiFi-enabled device identifiers
as owners passed in the street to track their movements (Vincent, 2013), and Westfield
Groups’ programme to perform similar shopping habits analysis with mobile phone
identifiers (Censk, 2011). Furthermore, mobile devices may also actively search for fa-
miliar APs and in doing so may broadcast the names (SSIDs) of recently used networks.
These can be located using the same databases that aid mobile GPS navigation to de-
termine the home, workplace and other locations important to the user of a mobile
device (Wilkinson, 2014). Disposable Network IDs would work to inhibit analysis of
this kind (Gruteser and Grunwald, 2005) and while it would make tracking specific users
between sessions much harder, it would not prevent the analysis presented here.
The privacy threat of external tracking and the security of personal data held on
mobile devices is often considered separately. In our scenario these two concerns are
combined. We demonstrate how it is possible to exploit WiFi side-channels to infer
private user information without the need for a privileged position within the network
or on the device. This renders safeguards like app permissions and encryption irrelev-
ant. The distance over which this analysis can be performed may also be much greater
than expected. Although most commodity WiFi devices have a range of up to 100m, this
is with omnidirectional antenna and includes the need to transmit. With increased sig-
nal strength and directional antenna, WiFi networks using have been operated effect-
ively point-to-point over hundreds of kilometres (Flickenger et al., 2008). While most
WiFi hardware is of course incapable of this, the observer in our scenario only needs to
receive transmissions.
135

CHAPTER 8 Inferring Personal Information
Table 8.1: User Information Inferable from use of Mobile AppsP
op
.N
ews
Retail
Rel.
Lifestyle
Est.
Health
En
t.Tra.
Ap
pN
ame
GMailTwitterBBC NewsDaily Mail
BuzzfeedGuardianLe MondeNY Times
AldiM&SGameAuto TraderH&M
BibleAl-Quran
TinderGrindrDivorced D.YPlanUrban Spoon
Runkeeper
Sky Sports
Lottery
RightMove
Sotheby’s
Expecting
Period T.MySugr
Anxiety Utd.
Spotify
ShazamNetflix
Trip Advisor
Nat. Rail
No.D
own
load
s
>1Bn>100M>5M
>1M>1M>1M>1M>5M
>100K>100K>100K>1M>5M
>50M
>1M>10M>1M>10K>100K
>1M
>10M
>1M
>1M
>1M
>10K
>1M>10M
>10K
>5K
>10M>100M>50M
>50M>1M
Personal
Gen
der
77
77
77
7C
hild/
Ad
ult
77
77
77
77
77
77
77
77
77
7Sp
ecific
Age
Ran
ge7
77
77
77
7M
aritalStatus
77
7In
com
e7
77
7N
ation
ality7
77
77
7
Sensitive
Sexuality
7R
eligion
77
Race/
Eth
nicity
77
Ph
ysicalHealth
77
77
Men
talHealth
7Po
liticalView
s7
7
Specific MarketableInterest or Hobby
Travel7
77
7D
inin
g7
7G
rocery
77
En
tertainm
ent
77
77
Fashio
n7
7Sp
ort/
Fitn
ess7
7G
amb
ling
7Tech
no
logy
7A
uto
mo
tive7
Datin
g7
77
Pro
perty
77
Oth
erD
eviceC
apab
ility7
77
7
No
tes:(1)
YP
lanm
oreaccu
ratelyim
plies
place
ofresiden
ce,how
everfor
easiercategorisation
we
den
oteth
isas
‘nation
ality’.(2)
Inferen
cesare
agen
eralisationofu
serd
emograp
hic
with
varying
accuracy
and
precision
.Refer
totextfor
more
detail.
136

Inferring Personal Information CHAPTER 8
8.3 Mobile App Selection
We selected 34 apps that we would attempt to detect remotely despite WiFi encryption
being employed. At the time of writing, the apps chosen could be found among the ‘top’
free app listings in their Play Store category. This is not Android-specific and most of
these apps will have equivalents on alternative platforms. If we assume that users are
representative of an app’s majority demographic, Table 8.1 shows how the ability to de-
tect the use of these apps allows personal information about their users to be inferred.
Inferences may change depending on context so we assume these apps were identified
in a public location such as a shopping centre in London, UK.
To assess the importance of the information being leaked, we loosely borrow from
the categorisations in EU Data Protection legislation. Information classified as ‘Per-
sonal’ is that which could be used to identify an individual. While it is not possible
to infer the canonical examples of this category (name and address), other personal
information including gender, age range and nationality can easily be inferred for the
typical app user. Information categorised as ‘Sensitive’ is personal information where
the importance of additional confidentiality is recognised. If disclosed such informa-
tion could be embarrassing, harmful to the well-being of the individual, or used as a
basis for prejudice. Less personal, but still intrusive is where use of an app implies a
‘Specific marketable interest or hobby’. While this may not be particularly important,
it could easily be used to help sell products, target advertising, or otherwise uncover
an individual’s personal interests. Finally, some apps may require certain capabilities
from a device in order to work (for example, geolocation or a HD screen).
It is important to recognise that these inferences are only generalisations based on
an app’s typical user demographic. They will likely hold in a majority of cases, but not
all. The accuracy of these inferences can vary. The nationality of a given news source
may correlate with its readers when generalised over all users. However, for a specific
user this is not necessarily the case. An American may just like to read (UK-based) BBC
News as a personal preference. Similarly, while the majority of AutoTrader users may
be male, there are still plenty of female car enthusiasts and while most people using
dating apps are single, some will be married. Conversely, the MySugr app is essentially
137

CHAPTER 8 Inferring Personal Information
useless to anyone who is not diabetic so it is highly likely that health information can
be inferred about the user correctly. Furthermore, the precision of these inferences can
also vary depending on the narrowness of an app’s appeal. While it is impossible to
infer the exact date of birth for a given user, an age range can be inferred depending on
the app. For example, apps may target specific age ranges (e.g. college students), and
many apps provide information that is only of use to adults (e.g. real estate) and there
are many apps designed for children (although we do not include any).
Popular apps like GMail and Twitter are so widespread that their use signifies little
about the user. News apps on the other hand can signify nationality based on their ori-
gin (BBC News is British, and New York Times from the US) or language (Le Monde is
French and written in French), and the likely political leanings of the reader (The UK
newspapers Daily Mail and Guardian are considered right- and left-wing respectively).
BuzzFeed is social-media based and attracts a certain younger demographic. Retail
apps can inform a great deal depending on their market specialisation. We chose sev-
eral from which a user’s likely income (Aldi and Marks & Spencer are UK supermarkets
at low and premium end of the market respectively) or gender can be inferred (The
audience of AutoTrader, a car sales app, and Game, a computer games retailer, will be
predominantly male. H&M’s app focuses on women’s clothing). Religious apps imply
the likely religion of a user that can be linked to common racial or ethnic trends.
Lifestyle apps cover a wide range of personal interests. Dating apps inform on the
probable marital status of the user and age range (‘young and single’ in the case of
Tinder or Grindr). Grindr further specialises to target gay men, and Divorced Dating
provides a dating service to a even more specific marital status. YPlan is an events
recommendation service limited to 5 major US and UK cities at the time of writing.
It implies a likely nationality, or more accurately a likely area of residence. Urban-
spoon provides information on nearby restaurants, Runkeeper is a map-based fitness
tracker and Sky Sports provides sports news. The Lottery app is used to check num-
bers from the UK’s (age-restricted) national lottery, and implies a positive disposition
to gambling. Real Estate apps provide information on the income of a user (i.e. wealthy
and old enough to wish to buy a house) with Sotheby’s focussing on the very wealthy
especially.
138

Inferring Personal Information CHAPTER 8
Health apps can relay private health information with MySugr for diabetics and
Anxiety United’s app for those who suffer from anxiety. Period Tracker (a menstruation
diary) and I’m Expecting (a pregnancy app) not only denote health information but also
specific gender and age ranges. Like Twitter and GMail, as a common activity Entertain-
ment and Travel apps belay little information with the possible exception that travellers
are likely to be (or accompanied by) adults. However, they do imply the marketable in-
formation that the user has free time at a location and device capabilities such as HD
screen and fast internet connection.
8.4 Measuring App Activity
Here we demonstrate the ability to build a classifier that identifies app usage from the
perspective of Figure 8.1’s external observer. However, the classifier itself need not be
built from data collected from this vantage point. Previous classification efforts attemp-
ted to sample network data directly from this position (Atkinson et al., 2014b; Zhang
et al., 2011; Saponas et al., 2007). Although identical to the scenario that the classifier
would operate, this makes recording accurately labelled samples difficult to coordinate
because the collection platform and device creating the network traffic have no direct
communication method. Synchronising the capture process with the desired activity
depends on the accuracy of careful timing or artificially-inserted indicator frames.
To avoid the complications of synchronising an external capture mechanism with
on-device app activity in previous data collection efforts, a method was developed to
capture network traffic locally (on the device) then transform the information to how
it would appear from an external perspective as the observer would see it. The ‘WiFin-
spect’ (Hadjittofis, 2014) app was used for this purpose. As an Android-specific inter-
face for the commonly known TCPDump (TCPDump Team, 2012), it saves network data
to standard PCap (packet capture) format for later processing. The same local sender
and receiver MAC addresses, frame size and timing data that would also be available
from an external perspective is extracted using TShark from the well-known Wireshark
packet analysis suite (Wireshark Foundation, 2012). The remainder of the data can be
discarded.
139

CHAPTER 8 Inferring Personal Information
The network activity observed will differ slightly from the activity that would be re-
corded naturally. For example, information on Data-Link layer frame retransmissions
will be lost and timing data will vary due to processing delays. However, we found that
this data more than sufficient for our purposes and greatly simplified the data collec-
tion process so that clean data could be easily gathered in large quantities. We used
Android devices during practical experimentation due to greater tool familiarity, how-
ever it is equally possible to collect data in similar ways on other mobile platforms (i.e.
iOS or Windows Phone) provided sufficient privileges required to run packet capture
software could be obtained. This usually requires device rooting.
We recorded the network activity when launching each app. This will load some
sort of main page or welcome menu. Depending on the app, this might trigger net-
work activity for a login or authentication process, fetch initial content (e.g. latest news
or location-sensitive content), display ads, or report usage statistics to the developer.
Internally, the recorded network activity is predominantly HTTP or HTTPS (e.g. for au-
thentication) with DNS alongside to resolve hostnames to usable IP addresses. These
specifics are not used by our analysis as they would be hidden from an external ob-
server by encryption. However, they are useful to understand the typical activities of
an app at startup. In the apps surveyed we found that even those with entirely static
local content (like Al-Quran, and Shazam’s home screen) used network communica-
tion at startup when connectivity was available.
Recorded over several weeks with automatic software updates disabled, our mobile
devices were controlled via USB connection in conjunction with automation software
(MIT CSAIL, 2012). We therefore simulated a user’s actions to begin packet capture,
open an app, wait until loading is complete, then halt the packet capture process. This
process can then be replayed to generate samples of app network activity without direct
human interaction. This on-device data is sufficiently close to the off-device equivalent
and TShark’s was configured so that external frame payloads are consistently reported
as 16Bytes larger than their on-device equivalent. By simply adding an offset to the
‘data length’, these measurements provide representative characterisation of app activ-
ity from an external observer’s perspective. These measurements can then be analysed
to differentiate mobile app network activity.
140

Inferring Personal Information CHAPTER 8
In an attempt to build a classifier that wouldn’t overfit to the characteristics of a par-
ticular network, samples were collected from three different types of network. The first
was a home network employing a standard ISP-supplied router to provide internet ac-
cess over ADSL. Other devices on the network included several mobile phones, laptops
and media streaming devices. The second network was the University enterprise-grade
network. This utilised multiple Cisco APs and would operate with over ten connected
devices (predominantly phones and laptops) at any time. The third was a WiFi network
supplied from a 4G ‘MiFi’ dongle providing internet access via a LTE cellular network.
Aside from the tablet whose traffic was being recorded, this network had no other con-
nected devices. All networks used WPA2 (with PSK authentication for home and 4G
networks, and PEAP-MSCHAPv2 for the enterprise network). Our devices connected at
802.11g speeds, although all APs also provided b and n data rates.
In total, 7480 app samples were recorded. The 220 recordings per app consisted
of 120 recordings from the home network, plus an additional 50 each from both 4G
network and enterprise networks. Additionally, 1766 samples of other activities were
used. These recordings came from previous work and were composed of a wide variety
of activities including Skype, BitTorrent, web browsing and idle time, but importantly
no mobile apps. This allowed for the production of a classifier able to predict “activity
other than that of a known app” (denoted ‘OTHER’), and not just be forced to classify
activity as one of the 34 apps. Without this ability, false positives on any real imple-
mentation would be entirely unavoidable. The generalisation error of this OTHER class
label would also provide a lower limit for false positive detection rates.
8.5 Metric Distributions & Forest Construction
Once again, we develop a classifier to infer personal information without attempting
to break WiFi encryption directly. This results in a highly data-limited scenario. Al-
most identically to the previous study on Skype, these measurements can be represen-
ted as value distributions (histograms) and these distributions can be used to charac-
terise different network activities. For each of the 220 samples of each app, the distri-
butions listed in Table 8.3 were created. These distributions come in 3 broad categor-
141

CHAPTER 8 Inferring Personal Information
ies: Frame Size, Interarrival Time, and Cumulative Interarrival Time. Information from
these Frame Size and Timing measurements can then be further refined by separating
this data based on the direction of the observed frames.
This information only differs from that used in the previous chapter in the number
of FSize variables used. More of these are useful because we are attempting to identify
and distinguish 34 activities instead of just Skype. For efficiency, frame sizes that occur
in fewer than two of the app traffic samples are removed and not provided to the Ran-
dom Forest construction process. This is a very low threshold but nevertheless results
in the removal of 1517 redundant variables so that only approximately half of the 3200
FSize variables are provided to the Random Forest. In contrast, only 217 FSize variables
were used to identify Skype. This reduces the time required to build the Random Forest
(otherwise the algorithm would have to learn the unimportance these variables itself).
The size of this reduction is entirely data dependent. For other data sets (e.g. different
fingerprinting scenarios, or additional apps) the ability to perform this reduction may
be much harder or easier.
The combined output of these distributions is an array of 2483 integer variables
after processing. These distributions can be generated from labelled recordings of net-
work activity and used to construct the Random Forest classifier. Alternatively, they
can be generated from observed network traffic (recorded or live) and provided to the
Random Forest to predict the app activity within. Differences in these distributions per
app can be used to differentiate between the app in use for a given sample. To demon-
strate this, Figure 8.2 shows the most important variables within each distribution type
(Frame Size, Interarrival, or Cumulative Interarrival) and plots their respective values
for every recording of 6 different apps. The ability to rank variables by importance is a
useful feature of the Random Forest algorithm.
For example, the number of sent frames of size exactly 66 bytes can be used to separ-
ate the BBC and Spotify app activity from the others shown in most circumstances. The
Random Forest would use a decision equivalent to F Size 66 > 0. The number of 0-3ms
interarrival measurements between received frames and the previous sent frame could
then further split the majority of BBC activity from Spotify activity with a decision like
1 A FSize subset is selected prior to forest construction. See Section 8.5.
142

Inferring Personal Information CHAPTER 8
Figu
re8.
2:H
owA
pp
sM
ayB
eD
iffe
ren
tiat
edV
iaD
istr
ibu
tio
nV
aria
ble
s
Tab
le8.
2:R
and
om
Fore
stG
ener
alis
atio
nE
rro
r
Po
p.
New
sR
etai
lR
el.
Lif
esty
leE
st.
Hea
lth
En
t.Tr
a.
Ap
pN
ame
GMailTwitterBBCNewsDailyMail
BuzzfeedGuardianLeMondeNYTimes
AldiM&SGameAutoTraderH&M
BibleAl-Quran
TinderGrindrDivorcedD.YPlanUrbanSpoon
Runkeeper
SkySports
Lottery
RightMove
Sotheby’s
Expecting
PeriodT.MySugr
AnxietyUtd.
Spotify
ShazamNetflix
TripAdvisor
Nat.RailOTHER
Mea
nSa
mp
leSi
ze(k
B)
11172322
1101138307
1944163
134670110
54255
117
199
372514
11179
48
192
76
108
17
104
7958
84
80
3587
107
5734
—
OO
BE
rro
r(%
)
7.30.60.6
0.03.00.00.00.6
1.20.00.60.00.6
0.0
3.1
0.60.03.10.0
0.6
0.0
0.0
0.0
3.1
0.0
3.81.9
0.6
2.5
0.60.00.0
2.61.98.8
Ap
pD
etec
tio
nA
ccu
racy
–M
in:9
1.23
%,M
ax:1
00%
,Mea
n:9
8.54
%.F
alse
Po
siti
veR
ate
–8.
8%
143

CHAPTER 8 Inferring Personal Information
Table 8.3: Distributions Created For Each 15s Window
Distribution No. Variables DescriptionFSize 3200→ 1683 (1) Frame Size (1600B per direction)I-RR 50 Rcvd-to-Rcvd interarrival timingI-RRCum 50 Cumulative transformation of I-RRI-SR 50 Sent-to-Rcvd interarrival timingsI-SRCum 50 Cumulative transformation of I-SRI-RS 50 Rcvd-to-Sent interarrival timingsI-RSCum 50 Cumulative transformation of I-RSI-SS 50 Sent-to-Sent interarrival timingsI-SSCum 50 Cumulative transformation of I-SSTotal 4000→ 2483 (1)
I SR1 > 70. Similarly, the cumulative number of interarrival measurements between
sent frames less than 150ms, I SSCum 50 > 250, can separate the majority of Tinder
samples from Bible samples where the other variables cannot so easily.
Conversely the patterns shown by The Guardian, RunKeeper and Tinder are much
harder to separate using only these variables. Decision trees to classify these apps can
be much more complex and this is why the Random Forest algorithm is used. Of course,
the Random Forest has the entire set of variables to work with but must classify and
separate the characteristics of 34 apps plus other traffic, not just the 5 chosen as illus-
trations.
8.6 Classifier Results
Table 8.2 shows the generalisation error for each app and OTHER traffic over the col-
lected dataset. As mentioned earlier, it is important to note that Random Forests do
not manually define Test and Training sets. Therefore, OOB error is equivalent to the
generalisation error reported on the Test set in other machine learning methods and as
accuracy was reported in previous chapters.
Using this method we found that 14 of the apps were identifiable with 100% accur-
acy. The remainder all had less than 9% error on this sample data with an average app
identification rate of ∼98.5%. The hardest app to identify was GMail with 7.3% error.
GMail was also the app with smallest mean sample filesize. Plotting this data across
all sampled apps shows a general trend of lower error rates as average sample file size
144

Inferring Personal Information CHAPTER 8
increases. This is perhaps unsurprising; with more bytes of network data to represent
an app’s startup activity, the more characteristics can be discovered and compared to
distinguish that activity from others.
While correct app identification rates are very high, the usefulness of the classifier
is limited unless it can be combined with a low false positive rate. The generalisation
error for our OTHER traffic was 8.8%. In real world scenarios the maximum accuracy
possible is therefore greater than 90%. This is encouragingly high and leaves room for
error in real-world scenarios that will inevitably present more noise and varied activity
than our sample data.
We have shown that the use of specific apps can be accurately ‘fingerprinted’ and
identified even when encryption is being used. As illustrated earlier in Table 8.1, we can
therefore also infer personal information about the users of these apps when they are
detected
8.7 Personas & Real-Time Activity Detection
Having created an accurate classifier, this section presents a study into how well the
classifier works in real-time on more varied and noisy real world WiFi communications.
A live analysis was then performed in which we attempted to identify the apps corres-
ponding to 7 different personas. Personas are a common user-experience testing and
marketing technique that allow the creation of a realistic (but fictional) representation
of a human individual. As with real individuals, the personas have their own interests
and potentially sensitive characteristics. These characteristics are expressed in their
use of mobile apps as detailed in Table 8.4. The detection of these apps by a passive
observer (and therefore personal information inference) is demonstrated in real-time
and despite WiFi encryption. The Random Forest classifier created in R was ported,
compiled in C++, and directly coupled to TShark to increase performance. The live de-
tection application is fast enough that it can analyse the activity of multiple devices in
real-time simultaneously. However, with a single WiFi adapter this is limited to devices
operating on the same channel. Figure 8.3 shows scanning and selection of the network
and channel. Any or all devices operating on that channel can be selected for observa-
145

CHAPTER 8 Inferring Personal Information
Figure 8.3: Live Detector: Device & AP Scanning
tion.
As was the case when collecting training data, the activities of personas could be
automated for easier repetition. During testing personas would take a total of 10 ac-
tions, actions included opening the apps belonging to that persona exactly once. In
addition to the apps from our ‘closed-world’, the remaining ‘Extra’ actions would other
activities that used the WiFi connection. ‘Extra’ activities would be to visit one of a se-
lection of websites at random using the mobile chrome browser or use another app not
included in this study and provide an ‘open-world’ scenario. Personas would perform
all ten actions in a random (but reported) order.
Every second, the live detection program would take all network activity observed
in the previous 15 seconds and attempt to predict the app activity within the traffic for
each monitored device. From our original activity observations, 15 seconds was the up-
per limit of the time required to automatically start recording, open an app, then stop
recording. Without the overhead of starting and stopping recording and no automa-
146

Inferring Personal Information CHAPTER 8
Figure 8.4: Live Detector: App Detection on Targetted Devices
tion software delay, a real user would be able to complete these actions much faster.
Given that detection process was performed every second, it was determined that the
typical app startup activity would usually register 8 seconds of positive detection. As a
conservative estimate we therefore used a 5 second minimum threshold for a positive
identification of an app. This helps eliminate spurious momentary app identifications.
These are common in the few seconds before an accurate true-positive identification.
At these points the Forest is recognising that something besides OTHER traffic is present.
However, with only part of the information because opening the app is still in progress,
the consensus as to which app is present is incorrect. As we know that opening an app
will cause detectable network activity over a period of many seconds, these spurious
identifications of 4 seconds or less can be discarded.
Figure 8.4 shows an example of the detection screen. This shows the raw detector
output taken from samples taken once per second: once per second data from the pre-
vious 15 seconds is analysed (the time window described in Section 6.3). For evaluation
147

CHAPTER 8 Inferring Personal Information
purposes, a positive app identification is equivalent to 5 or more consecutive samples
identifying the same app.
The 10 actions of each persona were repeated 20 times. With 3–6 apps each these
provided a total of 540 time periods where mobile apps were launched. The remainder
of the observed activities were 860 additional activities (‘Extra’) that used the network.
Following each activity was a period of idle time before the next activity began. This
corresponded to an additional 1400 ‘idle’ time periods with no network activity other
than that caused by background processes. ‘Apps’ and ‘Idle’ activities were all contained
within the training data and therefore constitute a closed-world scenario. The addition
of ‘Extra’ activity provides an open-world test.
We consider these time periods as single units to provide an empirical measure of
performance as shown in Table 8.5. The detector’s output for each time period was
recorded. A true positive (TP) denotes a period of app activity where the app was cor-
rectly identified. Identification of any app in ‘idle’ or ‘extra’ time periods would be a
false positive (FP), otherwise this would be a true negative (TN) with no app detected
(for longer than the detection threshold). False negatives (FN) correspond to a period
of app activity occurring but not being detected. Measurement in this way groups all
app classes together. Although more concise, this does not show the case where app
activity is detected but the wrong app is identified. In Table 8.5 these are also counted
as false negatives and discussed further below. Similarly, it is important to note that
true positives not only denote correct detection of an app, but also which one.
In a closed-world scenario where the classifier was only required to detect activities
it had previously encountered, detection succeeded in spite of data limitations. If the
activity of a targeted app was present then it was correctly identified in 86.3% of cases
despite encryption (high recall). Of the 74 false negatives 30 (41%) were app activity
identified as the wrong app (with the remainder being identified as OTHER). A false
positive rate of 16.4% results in an overall closed-world accuracy of 84.4%. This entails
a gross lack of privacy for our personas. For example, traffic patterns from Dr. Black’s
device would imply that he is most likely relatively wealthy, gay, male, and an anxiety
sufferer provided he opened the M&S, Grindr and Anxiety Utd apps whilst under ob-
servation. Although there are occasional false positives, multiple observations of the
148

Inferring Personal Information CHAPTER 8
Tab
le8.
4:P
erso
nas
&A
pp
-sig
nifi
edC
har
acte
rist
ics
Per
son
aN
ame
Ch
arac
teri
stic
s(S
ign
ifyi
ng
Ap
p)
Pro
f.P
lum
(6ap
ps)
Ave
ryw
ealt
hy
(M&
S,So
theb
y’s)
Bri
tish
(BB
C)m
usl
im(Q
ura
n).
Co
mm
uti
ng
(Nat
.Rai
l)ac
adem
icw
ho
suff
ers
fro
md
iab
etes
(MyS
ugr
).M
iss.
Scar
lett
(4ap
ps)
Sin
gle
(Tin
der
)fe
mal
e(H
&M
)yo
un
gad
ult
.Lov
esm
usi
c(S
pot
ify,
Shaz
am).
Co
l.M
ust
ard
(4ap
ps)
Co
nse
rvat
ive
(Dai
lyM
ail)
mem
ber
of
the
Bri
tish
(Dai
lyM
ail)
arm
edfo
rces
.Li
kes
fitn
ess
(Ru
n-
Kee
per
),fo
otb
all(
Sky
Spor
ts)
and
bet
so
ccas
ion
ally
(Lot
tery
).M
rs.P
eaco
ck(4
app
s)Fr
ench
(Le
Mon
de)
tou
rist
(Urb
anSp
oon
,Tri
pA
dvi
sor)
visi
tin
gLo
nd
on
via
Trai
n(N
at.R
ail)
.M
rs.W
hit
e(3
app
s)D
ivo
rced
(Div
orce
dD
atin
g)c
om
mu
ter
(Nat
.Rai
l)an
dw
om
ano
fch
ild-b
eari
ng
age
wh
ois
pre
g-n
ant(
I’mE
xpec
tin
g).
Rev
.Gre
en(3
app
s)C
hri
stia
n(B
ible
)m
anlo
oki
ng
tob
uy/
sell
his
car
(Au
toTr
ader
).R
esid
ent
of
Lon
do
no
rn
earb
yar
ea(Y
Pla
n).
Dr.
Bla
ck(3
app
s)G
aym
ale
(Gri
nd
r)w
ith
abov
eav
erag
ein
com
e(M
&S)
wh
osu
ffer
sfr
om
anxi
ety
(An
xiet
yU
td.)
.
Tab
le8.
5:Li
veP
erso
na
Det
ecti
on
Res
ult
s
Mo
nit
ore
dA
ctiv
ity
Co
un
tA
ctiv
ity
Ap
ps
Idle
Ext
raT
PF
PF
NT
NF
PR
(%)
Pre
cisi
on
(%)
Rec
all(
%)
Acc
ura
cy(%
)C
lose
d-w
orl
dA
pp
s&
Idle
540
1400
–46
622
974
1171
16.4
67.1
86.3
84.4
Op
en-w
orl
dA
pp
s&
Ext
ra54
0–
860
466
619
7424
172
.042
.986
.350
.5A
ll54
014
0086
046
684
874
1412
37.5
35.5
86.3
67.1
149
CHAPTER 8 Inferring Personal Information
same activity on the device would increase the certainty over time.
When considering the open-world scenario where ‘Extra’ activity (previously un-
seen by the classifier) was also included, a substantial increase in false positives was
observed. For ‘Apps’ and ‘Extra’ activity alone (i.e. excluding FPs from ‘Idle’ activity)
‘Extra’ activities produced a greatly increased false positive rate of 72%. Overall accur-
acy for all activity drops to 67.1% in the open-world case and only 50.5% when con-
sidering only ‘App’ and ‘Extra’ activity. Precision similarly suffers due to this increased
false positive rate at 35.5% and 42.9% respectively. In this open-world scenario Miss
Scarlett’s device would again identify her as a potential single female who enjoys music
via use of the Tinder, H&M, Spotify and Shazam apps. However, the increased number
of false positives for all apps gives the inference less credibility. A far greater number of
observations of the Tinder, H&M, Spotify and Shazam apps would need to be made to
provide the same level of confidence in the personal information inferences compared
to the closed-world.
The small number of false negatives means that a negative detection remains a
strong prediction that an app was not used in either scenario. Unfortunately, this is
not very useful information in context. For example, although Prof. Plum’s use of the
Al-Quran app strongly implies an interest in the religion of Islam, the converse is not
true. Prof. Plum may still be Muslim and not use the app. However, low false negatives
may be useful in other situations such as the forensic scenario discussed in the next
section.
8.8 Optimisation Analysis & Validation
As with the previous study, an analysis of how simplifying the classifier effects accuracy
was performed. Unlike the previous study these optimisations were not part of a feas-
ibility analysis because we already have a classifier capable of operating in real-time.
However, optimisation analysis is still useful to discuss whether the problem can be
made harder and still allow for live detection. The ability to simplify the detection pro-
cess and the ability to compromise accuracy for performance provides assurance that
this scenario does not represent the limitations of this detection process. Even though
150

Inferring Personal Information CHAPTER 8
the process already operates in real-time, the ability to optimise further leaves room
the cost of additional identification targets (i.e. more apps), increased traffic through-
put (i.e. busier networks, more devices monitored), or easier use on lower cost hard-
ware. Although only a selection of apps are shown for clarity, Figure 8.5 demonstrates
how the number of variables used by the classifier could be decreased if required. Of
course, these could be removed in order of importance as shown in Figure 8.6. Since
they are ranked highly, this figure also validates the decision to use retain additional
FSize variables for this mobile app classifier compared to the Skype classifier in the
previous chapter.
Determining the importance of variables also allows for some interesting visual
analysis that aids in the understanding the Random Forest classification process. Fig-
ure 8.7 compares the prototypes for two religious apps on the top 100 most important
variables. This provides a clear visualisation of how a seemingly private detail can be-
come obvious to an observer as information is leaked in spite of WiFi encryption.
8.9 Discussion
The greatest impediment to a low false positive rate was the ‘Extra’ activities in the
open-world scenario. While the data from our OTHER dataset contained a variety of
common web traffic and allowed the Random Forest to usually discount idle (and near-
idle) traffic and some of the added activities correctly, it proved an insufficient baseline
02468
10121416182022
0 200 400 600 800 1000 1200 1400 1600 1800 2000 2200 2400No. Vars
Fin
al O
OB
Err
or (
%)
BBC
BuzzFeed
Guardian
LeMonde
NYT
Aldi
Marks
Game
AutoTrader
OTHER
Figure 8.5: Forest Error with Decreasing No. Vars
151

CHAPTER 8 Inferring Personal Information
0.000
0.005
0.010
0.015
0.020
0.025
0.030
0.0350 50 100
150
200
250
300
350
400
450
500
550
600
650
700
750
800
850
900
950
1000
1050
1100
1150
1200
1250
1300
1350
1400
1450
1500
1550
1600
1650
1700
1750
1800
1850
1900
1950
2000
2050
2100
VariableSNo.
Impo
rtan
ce
Distribution
FSizeS(subset)
I−RR
I−SR
I−RS
I−SS
I−RRCum
I−SRCum
I−RSCum
I−SSCum
Figure 8.6: Variable Importance – All Apps
to accurately discount the universe of all traffic outside our targeted apps’ activities. Fu-
ture work could look to utilise a larger and more representative dataset of other traffic.
It may also be sensible to consider a two-tier classification process whereby interesting
activity (i.e. apps) is first separated from all other activity using a simpler boolean clas-
sifier before any samples classified as ‘interesting’ are passed onto a second classifier
specialising in identifying the correct app. This would partition the problem into two
separate questions that could be tackled separately.
Detection in terms of positively identifying the targeted apps was largely successful.
If an app’s network activity was truly present in live traffic, then the app would be iden-
tified with high recall (true positive rate) and any personal information associated with
that app was demonstrably leaked to the surrounding area. This means that identifiable
patterns that betray personal information are broadcast from mobile devices whenever
an app is used despite the use of encryption. Sensitive information including age, re-
ligion, sexuality and gender is there to be collected for anyone listening. However, in
an open-world scenario any positive result from the detector becomes less meaning-
ful. As indicated by the low precision score, without improvements to decrease the false
positive rate any positive result has low predictive value.
152

Inferring Personal Information CHAPTER 8
0
20
40
60
80
100
120
140
160
180
200
FS
ize:
057
FS
ize:
059
FS
ize:
060
FS
ize:
061
FS
ize:
062
FS
ize:
063
FS
ize:
064
FS
ize:
066
FS
ize:
067
FS
ize:
068
FS
ize:
070
FS
ize:
071
FS
ize:
073
FS
ize:
074
FS
ize:
075
FS
ize:
090
FS
ize:
1F
Siz
e:25
3F
Siz
e:36
7F
Siz
e:57
FS
ize:
645
FS
ize:
649
FS
ize:
665
FS
ize:
688
FS
ize:
690
FS
ize:
700
FS
ize:
790
I−R
RC
um:0
40I−
RR
Cum
:045
I−R
RC
um:0
47I−
RR
Cum
:048
I−R
RC
um:0
49I−
RR
Cum
:050
I−S
R:0
01I−
SR
Cum
:001
I−S
RC
um:0
02I−
SR
Cum
:003
I−S
RC
um:0
05I−
SR
Cum
:006
I−S
RC
um:0
09I−
SR
Cum
:010
I−S
RC
um:0
11I−
SR
Cum
:012
I−S
RC
um:0
14I−
SR
Cum
:015
I−S
RC
um:0
16I−
SR
Cum
:017
I−S
RC
um:0
18I−
SR
Cum
:019
I−S
RC
um:0
20I−
SR
Cum
:021
I−S
RC
um:0
22I−
SR
Cum
:023
I−S
RC
um:0
24I−
SR
Cum
:025
I−S
RC
um:0
26I−
SR
Cum
:029
I−S
RC
um:0
30I−
SR
Cum
:031
I−S
RC
um:0
32I−
SR
Cum
:033
I−S
RC
um:0
34I−
SR
Cum
:035
I−S
RC
um:0
36I−
SR
Cum
:037
I−S
RC
um:0
38I−
SR
Cum
:039
I−S
RC
um:0
40I−
SR
Cum
:041
I−S
RC
um:0
42I−
SR
Cum
:043
I−S
RC
um:0
44I−
SR
Cum
:045
I−S
RC
um:0
46I−
SR
Cum
:047
I−S
RC
um:0
48I−
SR
Cum
:049
I−S
RC
um:0
50I−
RS
Cum
:035
I−R
SC
um:0
36I−
RS
Cum
:038
I−R
SC
um:0
39I−
RS
Cum
:040
I−R
SC
um:0
41I−
RS
Cum
:042
I−R
SC
um:0
43I−
RS
Cum
:044
I−R
SC
um:0
45I−
RS
Cum
:046
I−R
SC
um:0
49I−
RS
Cum
:050
I−S
SC
um:0
41I−
SS
Cum
:042
I−S
SC
um:0
43I−
SS
Cum
:044
I−S
SC
um:0
45I−
SS
Cum
:046
I−S
SC
um:0
48I−
SS
Cum
:049
I−S
SC
um:0
50
Variable Name
Fre
quen
cy p
er w
indo
w
Distribution
FSize
I−RR
I−RRCum
I−SR
I−SRCum
I−RS
I−RSCum
I−SS
I−SSCum
(a) Bible App
0
20
40
60
80
100
120
140
160
180
200
FS
ize:
057
FS
ize:
059
FS
ize:
060
FS
ize:
061
FS
ize:
062
FS
ize:
063
FS
ize:
064
FS
ize:
066
FS
ize:
067
FS
ize:
068
FS
ize:
070
FS
ize:
071
FS
ize:
073
FS
ize:
074
FS
ize:
075
FS
ize:
090
FS
ize:
1F
Siz
e:25
3F
Siz
e:36
7F
Siz
e:57
FS
ize:
645
FS
ize:
649
FS
ize:
665
FS
ize:
688
FS
ize:
690
FS
ize:
700
FS
ize:
790
I−R
RC
um:0
40I−
RR
Cum
:045
I−R
RC
um:0
47I−
RR
Cum
:048
I−R
RC
um:0
49I−
RR
Cum
:050
I−S
R:0
01I−
SR
Cum
:001
I−S
RC
um:0
02I−
SR
Cum
:003
I−S
RC
um:0
05I−
SR
Cum
:006
I−S
RC
um:0
09I−
SR
Cum
:010
I−S
RC
um:0
11I−
SR
Cum
:012
I−S
RC
um:0
14I−
SR
Cum
:015
I−S
RC
um:0
16I−
SR
Cum
:017
I−S
RC
um:0
18I−
SR
Cum
:019
I−S
RC
um:0
20I−
SR
Cum
:021
I−S
RC
um:0
22I−
SR
Cum
:023
I−S
RC
um:0
24I−
SR
Cum
:025
I−S
RC
um:0
26I−
SR
Cum
:029
I−S
RC
um:0
30I−
SR
Cum
:031
I−S
RC
um:0
32I−
SR
Cum
:033
I−S
RC
um:0
34I−
SR
Cum
:035
I−S
RC
um:0
36I−
SR
Cum
:037
I−S
RC
um:0
38I−
SR
Cum
:039
I−S
RC
um:0
40I−
SR
Cum
:041
I−S
RC
um:0
42I−
SR
Cum
:043
I−S
RC
um:0
44I−
SR
Cum
:045
I−S
RC
um:0
46I−
SR
Cum
:047
I−S
RC
um:0
48I−
SR
Cum
:049
I−S
RC
um:0
50I−
RS
Cum
:035
I−R
SC
um:0
36I−
RS
Cum
:038
I−R
SC
um:0
39I−
RS
Cum
:040
I−R
SC
um:0
41I−
RS
Cum
:042
I−R
SC
um:0
43I−
RS
Cum
:044
I−R
SC
um:0
45I−
RS
Cum
:046
I−R
SC
um:0
49I−
RS
Cum
:050
I−S
SC
um:0
41I−
SS
Cum
:042
I−S
SC
um:0
43I−
SS
Cum
:044
I−S
SC
um:0
45I−
SS
Cum
:046
I−S
SC
um:0
48I−
SS
Cum
:049
I−S
SC
um:0
50
Variable Name
Fre
quen
cy p
er w
indo
w
Distribution
FSize
I−RR
I−RRCum
I−SR
I−SRCum
I−RS
I−RSCum
I−SS
I−SSCum
(b) Al-Quran App
Figure 8.7: Comparative Religion: Prototypes of Top 100 Most Important Variables
8.10 Study Conclusions
This study demonstrated that private information including sensitive data such as age,
religion, sexuality and gender can be inadvertently broadcast by mobile device apps.
This was achieved despite WiFi encryption being used exactly as intended. The de-
tection mechanism was able to overcome the data restrictions inherent to this diffi-
cult scenario. We developed a remote, undetectable, detection mechanism to infer
private user information through observation of encrypted app network activity. This
153

CHAPTER 8 Inferring Personal Information
was demonstrated to work in real time, and with appropriate hardware should gener-
alise to other encrypted communication methods.
Despite high false positive rates, these results are still useful in a variety of applica-
tions and have serious implications as will be discussed in the next chapter. With longer
range wireless communications becoming more prevalent, and commercial enterprise
becoming more interested in tracking and analysing publicly broadcast wireless data,
this chapter highlights a clear and demonstrable threat to users’ privacy.
154

9 Threat Feasibility,Mitigation & Applications
This chapter presents an analysis and discussion of how the detection methods de-
veloped during the course of this research might generalise over various interesting
changes to the scenario. Avenues for improvement and the limitations of this approach
are identified. We discuss strategies to prevent these leaks, and an analysis the effort re-
quired for an observer to present a practical privacy threat to the everyday WiFi user is
presented before concluding this thesis.
9.1 Generalisation
Side-channel data leaks, although incredibly limited, have nevertheless been shown
to allow user activity inference despite encryption working exactly as designed. This
side-channel data should be available and exploitable on all efficient networking im-
plementations except those specifically designed to resist fingerprinting. It is reason-
able to believe that similar methods would be effective on the majority of modern wire-
less communications, and not just the protocols found in our demonstration. The ap-
proach shown challenges the assumption that secure cryptography means secure in-
formation. Confidential network content does not necessarily imply confidential net-
work activity.
9.1.1 Networks
The features that allow activities to be identified occur because efficiency is a design
priority for most networks. By minimising transmission time and maximising through-
put, networks will always leak side-channel timing and frame/packet size information.
Because transmissions will be tailored to the data contained within, this side-channel
will occur regardless of encryption. Side-channel leaks are hard to ‘plug’ because they
are a natural result of a design decision, rather than a direct flaw. As will be discussed
155

CHAPTER 9 Threat Feasibility, Mitigation & Applications
shortly, it is impossible to defend against this kind of attack unless data was always sent
and received at a constant rate or randomness is added to deliberately obstruct feature
identification as is the case with networks like Tor (Perry, 2011).
The data used in these studies was only sourced at a single data rate (WiFi 802.11g
as opposed to 802.11a, b or n). Changing the maximum rate at which frames could be
sent would not affect frame sizes, but would undoubtedly affect interarrival timings.
While the classifier is unlikely to operate well on different speed WiFi networks as cur-
rently calibrated, we did demonstrate that data for 3 different types of network allowed
for generalisation of detection over all three. Given that classification operated over a
variety of network types (particularly the 4G dongle), we can have confidence that the
techniques presented in this thesis would be just as effective if training data from net-
works with different data rates was sourced.
Although the precise detail (i.e. exact timings, amount of data transmitted) of the
features identified in these studies will be specific to the particular networking scen-
ario, the concepts used and characteristics observed should hold in the general case.
Assuming that frame size and interarrival metrics are common to both, we can also
have confidence that the same detection methods could be adapted from WiFi to 4G
LTE. This has been partially verified by ensuring that features similar to those identified
while using the ‘MiFi’ network could also be detected on standard WiFi networks with
a physical connection to the internet. This widens the privacy risk to another widely
used and longer range mobile protocol, but would require more complex hardware for
traffic observation (unlike WiFi, the upload and download protocols are asymmetric as
noted in the work of Stöber et al. (2013)). Similarly, although we can monitor any num-
ber of devices, our observations were limited to only observing a single WiFi channel
(frequency) at a given time. This is a hardware limitation, but could be overcome by
using multiple WiFi adapters in parallel.
9.1.2 Targeted Activities
We showed that the computational complexity for these classifiers was low enough for
them to potentially be used in parallel. Future work could investigate classifying a wide
variety of activity types from an external vantage point, but with much more specific
156

Threat Feasibility, Mitigation & Applications CHAPTER 9
targets. For example, web fingerprinting achieved in a similar way to our mobile app
detector described in Chapter 8 could be detected alongside BitTorrent, Skype, stream-
ing or any other activity. An obvious extension for Skype specifically would be the ability
to detect and distinguish video communications as well as voice.
Despite its targeted nature, an advantage of this approach is that the classifier auto-
matically generates a ‘fingerprint’ from the overall activity of a process, rather than
focusing on pre-defined constants (e.g. port numbers). The classifier should there-
fore generalise well, provided changes to the target activity are not too drastic. Minor
changes to an activity or protocol (e.g. additional packets sent to a client, or different
port numbers) may not affect the accuracy of the classifier at all. These less fragile clas-
sification metrics can be useful in some situations. For example, the work of Jesudasan
et al. (2010) shows how research sought to find commonality between protocols to re-
tain detection as Skype’s protocol changed between versions.
However, our classifiers only generalise as well as our datasets and despite our sim-
plified collection process, data collection is time-consuming. It may be possible to con-
vert public data from repositories such as CRAWDAD (Dartmouth College, 2012) for
our purposes. This would provide traffic data from contrasting perspective from inside
the network. However, due to the different point of collection, the conversion process
would require some assumptions to be made about the traffic observed. Technologies
such as NAT could complicate the process as multiple devices are assigned the same IP
address and cannot be identified uniquely. Furthermore, our approach relies on accur-
ately labelled data. Skype, app or other activity data within these large datasets would
need to be identified by a ‘normal’ classification system at the network level. This would
introduce its own biases and possible inaccuracies.
9.2 Feasibility of Developing a Practical Threat
Data collection is the main challenge to the development of an inference system like
this. The predictions can only ever be as good as the sample data provided to the clas-
sifier construction process. Aside from the previously discussed larger dataset of non-
interesting traffic to reduce open-world false positives, every app (or other interesting
157

CHAPTER 9 Threat Feasibility, Mitigation & Applications
activity) must have sufficient sample data for every permutation of the identification
problem. This will require additional data for every change to the scenario. As noted
earlier different data rates will affect interarrival timings. Although we demonstrated
that signatures could be automated and generalised by sampling a variety of networks
with different capabilities, these samples still need to be collected. Therefore, targeting
different WiFi data rates or cellular data protocols like LTE will require additional data
collection for each network.
Alterations to programming and behaviour are a potential problem for the longev-
ity of an effective activity detector (be it Skype, mobile app, or anything else). For ex-
ample, typically on-device apps are automatically update when a developer publishes
to the mobile app store or marketplace. While we demonstrated that changes in con-
tent (e.g. changes to the stories in News apps, or different active users on dating apps)
could be overcome by exploiting other similarities, automatic updates to mobile apps
and laptop programs were disabled for the purpose of these studies. The impact of an
update will be dependent on its effect (or lack thereof) on an app’s network commu-
nications. Random Forests will not be able to accurately classify something that wasn’t
provided as part of the training process: this approach remains ‘signature-based’ with
all the problems that entails.
For example, while stories featured on the BBC News app change routinely the abil-
ity to detect the app was retained. However, following the experimentation the Al-
Quran app was allowed to update. This update changed the ad library in use and caused
such major changes to the app’s network activity that it was no longer accurately iden-
tifiable. Ruiz et al. (Ruiz et al., 2014) estimate that “51–60% of free Android apps have
at least one ad or analytics library”, and that updates to the frameworks the sampled
occurred every 1–3 months. Future work could investigate the variance in signature
longevity in different apps as well as to what degree shared libraries complicate the
process. Despite this, the collection of data to create these signatures can be largely
automated and parallelised. User activity simulation and the ability to convert on-
device recordings is far more practicable than collecting data from an external vant-
age point. However, data collection must occur in real-time and is therefore the most
time-consuming part of the classifier construction process.
158

Threat Feasibility, Mitigation & Applications CHAPTER 9
Just as Skype only represents a single VoIP implementation, the 34 popular apps
used in Chapter 8 only represent a small fraction of entire mobile app market. While
free-to-download apps like the ones used in this study form approximately 90% the mo-
bile app market (Ruiz et al., 2014), there are many paid apps. For these apps, serving
ads or selling information about their users is not their primary business strategy. They
may therefore be less reliant on internet communication. As was seen with GMail’s
small network activity being more difficult to reliably fingerprint, less or no network
activity may make paid apps harder to identify. A further complication, across the app
market as a whole there will be many common libraries and shared code. If this com-
mon programming causes network communication — as would be the case with lib-
rary functionality such as serving ads, developer feedback, and mapping services — the
resultant activity will be difficult to differentiate. Using related activities as contextual
clues may help mitigate the problem of different app actions producing similar signa-
tures. For example, in the Tinder dating app composing a message must be preceded
by first opening the app and then viewing a profile. Tools such as NetworkProfiler (Dai
et al., 2013) could allow for all user actions (and therefore all network activity) paths to
be mapped through the app programmatically. However, the ability to identify greater
number of activities is once again ultimately limited by the ability to sample the net-
work traffic those activities generate.
Finally, the mobile apps identification study only considered scenarios where one
activity was present at a time. This was seen an appropriate assumption given the
modal nature of mobile apps and is a common assumption in related fingerprinting
studies (Wang et al., 2014). Although previous work on Skype has shown it is possible,
simultaneous activities present a much harder problem. Simultaneous downloads and
other background processes will always affect network activity, altering the observed
characteristics and adversely affect detection accuracy.
9.3 Real-World Applications
The analysis demonstrated in this thesis undoubtedly reveals a privacy vulnerability
in widely deployed WiFi technology that is largely ignored. Although the Centre for
159

CHAPTER 9 Threat Feasibility, Mitigation & Applications
Protection of National Infrastructure (UK) (2007) notes that “transmission of packets
over the air are susceptible to interception and Man-in-the-Middle (MitM) attacks”, it
is assumed that encryption provides data confidentiality when unbroken and used cor-
rectly. The security concerns highlighted in the report are concerned with unauthor-
ised access, detecting security breaches and preventing intruders. Wireless Intrusion
Prevention Systems are the recommended countermeasure to active intruders (Zhang
et al., 2010). In contrast, the analysis described in this report is entirely passive and
therefore completely undetectable. However, whether this is actually represents a pri-
vacy threat depends on the context. Whereas the average home user is unlikely to be
concerned if a passer-by can – with a lot of effort – determine if they are using a par-
ticular internet service, mobile, users may be leaking more personal information over a
wide area than is realised. Government and business users may be inadvertently broad-
casting details about their supposedly secure activities.
9.3.1 Law Enforcement & Digital Forensics
With encryption becoming more common by default, law enforcement may also have
uses for activity inference. This is especially true if analysis can be performed in real-
time as it can indicate when a system is active. When active, volatile data is accessible
and encrypted data unlocked.
Conversely, this approach may be a useful supplement to the forensic analysis of
encrypted network traffic in bulk after-the-fact. Forensic analysis of encrypted data
is becoming an increasingly problematic and time-consuming issue (Garfinkel, 2007).
Decryption can be highly computationally expensive and the quantity of data requiring
analysis has grown hugely in recent years to the point where data mining techniques
are being employed (Pollit and Whitledge, 2006). The ability to detect specific activ-
ity without breaking encryption can help focus an investigation on certain devices and
time periods without needing to break all encryption beforehand. Even with false pos-
itives, this may be a more attractive and tractable prospect than attempting to break the
encryption of vast quantities of streamed data in bulk before it can be analysed and can
allow for insight into when operations should be performed to maximise the collection
of volatile data as evidence.
160

Threat Feasibility, Mitigation & Applications CHAPTER 9
9.3.2 Network Security
This research may also have applications in the context of ‘cloud computing’; a term de-
scribing centrally hosted internet services that are becoming increasingly popular with
organisations (Jamil and Zaki, 2011). This results in the transmission of data over pub-
lic networks that would previously have remained local. Although presumably this data
would be encrypted, this project has shown that it is feasible to extract information re-
gardless. Furthermore, cloud computing is not limited to just hosting data. Entire ser-
vices that replace traditional desktop applications can be provided over the internet.
This means that not only data, but every user interaction will be directly transmitted.
These activities could be analysed and detected in the same way as WiFi activity. Users
and organisations may wish to be aware of this potential privacy risk and seek to at-
tempt to disguise particular private activities. In addition, given the centralised sharing
of computing and network resources between huge numbers of users in cloud services,
similar techniques may be able to detect malicious behaviour without requiring direct,
unencrypted access to the confidential network traffic of all users.
9.3.3 Device Tracking and Local Demographic Information
Outside of law enforcement organisations that may be able to justify exemption from
privacy legislation, the legality of these methods is questionable. The legal standing
of partially anonymised information inference is untested and unclear. Furthermore,
it will vary with jurisdiction. While users often accept some information being shared,
for example to allow for targeted ads in internet services, it is difficult to justify anything
other than an explicit opt-in choice by the user. However, as noted in Section 8.2, mo-
bile devices are already used to track customer habits. Provided opne-world false pos-
itive rates can be reduced, it would be possible to infer deeper personal demographic
information from nearby WiFi users using low-cost hardware, although it would be a
significant undertaking to keep signatures up-to-date.
Although device tracking is already possible because WiFi hardware uses static iden-
tifiers (MAC addresses), this could undermine attempts at anonymisation using dispos-
able identifiers (Gruteser and Grunwald, 2005). Although largely ignored until now, an-
161

CHAPTER 9 Threat Feasibility, Mitigation & Applications
onymisation efforts may become more attractive given the recent commercial interest
in WiFi tracking such as London’s controversial shopper “tracking bins” (Vincent, 2013).
Although complex, signature-based analysis similar to the methods developed within
this thesis could identify unique users by their activities similar to how online advert-
isers fingerprint the web browser (Eckersley, 2010).
9.4 Awareness & Mitigation
Perhaps most importantly, this research may lead to increased awareness of how the
privacy guarantees of WiFi encryption are perhaps weaker than expected. Awareness
can allow security conscious individuals, developers and organisations to re-evaluate
their use of WiFi technology if appropriate. Although not a ideal, the simplest solution
to prevent the inference of personal demographic information would be to not use apps
with an association to sensitive information in public areas where they are likely to be
monitored. We hope this work will spur interest and the development of countermeas-
ures appropriate for mobile devices, such as Tor’s Orbot (Tor Project, 2015). Awareness
of this security weakness can allow users and organisations to recognise where infer-
ence techniques such as this may be a security or privacy risk and change their usage if
appropriate.
Although we have demonstrated the ability to infer private user information despite
standard WiFi encryption, existing techniques to thwart web fingerprinting methods
will still work to prevent the detection shown in this thesis. Specially designed VPNs
(Schulz et al., 2014) and anonymity networks such as Tor (Perry, 2011) pad frame sizes,
adjust timings, and intermix network traffic. However, these methods do incur signi-
ficant performance penalties. A network with optimal throughput will attempt to send
data as fast as possible only when required (causing predictable timings), and only as
much data as is needed (causing predictable frame sizes). Shifting priority away from
maximum throughput introduces significant overhead by necessity, and is especially
problematic for mobile devices where performance is at a premium due to battery life
limitations. While these solutions exist, they are unlikely to see widespread deployment
on consumer devices in the short or medium term.
162

Threat Feasibility, Mitigation & Applications CHAPTER 9
It is useful to consider whether all side-channels are equally important. This is not
only interesting from a research perspective to aid future detection work, but poten-
tially helpful to drive mitigation attempts. As can be seen by comparing Figures 7.8
and 8.6, this research found that both the importance of individual variables and the fa-
vouring of variables from particular distributions was dependent on the type of activity
being ‘fingerprinted’. As such, we cannot say that any particular side-channel is more
important in the general case. However, it may be more useful to focus on different
side-channels for specific purposes. For example, increase timing information obfus-
cation to hinder the detection of QoS-reliant Skype.
Although not addressing the problem of side-channel leaks direction, another po-
tential protective measure against leaking private information is to make it more dif-
ficult to eavesdrop upon. Although WiFi can operate on multiple frequencies (‘chan-
nels’), these channels are designed to be largely static. Although devices can change
between channels on the same network, this is only intended as a way to maximise sig-
nal strength. Alternatively, authenticated devices can be issued with a frequency hop-
ping schedule that is unknown outside of the network making the communications
harder to fully track. These techniques are common in military communications (Eph-
remides et al., 1987; Cook and Bonser, 1999) where the radio spectrum is strictly reg-
ulated. Although this unpredictable frequency hopping makes monitoring difficult, it
would also prevent co-located networks from negotiating a schedule to prevent trans-
mission collisions. The ubiquitousness of WiFi makes this solution impractical due to
the sheer number of networks that can be found deployed within the same area. Fur-
thermore, it can still be overcome by monitoring multiple channels in parallel. This
would be costly to an observer, but of course also require costly support in the devices
used by legitimate network users.
163

CHAPTER 9 Threat Feasibility, Mitigation & Applications
164
10 Conclusion
Beginning with only a theory of how leaks from WiFi side-channels may allow the in-
ference of personal information, this work has progressed to not only analyse and ex-
plain a plausible threat, but also develop an efficient and real-time detection program
to demonstrate the privacy vulnerability.
10.1 Summary of Key Contributions
This research accomplished the following:
• Undeniably established the ability to infer personal sensitive information of real-
world users from their encrypted WiFi traffic.
The ability to infer personal information from the encrypted WiFi traffic of
real-world users has been established by coupling remotely detectable tar-
get activities and user personas. This validates our original research premise
that sensitive information can be leaked over WiFi despite encryption work-
ing exactly as designed.
• Practicably demonstrated activity detection and information leakage in a live,
real-world WiFi environment via the development of a real-time detection pro-
gram capable of identifying the use of widely-used mobile apps from a remote,
unprivileged vantage point using only live encrypted network activity.
Relying on a Random Forest classifier with impressive accuracy on the train-
ing data (∼99%), this demonstrated highly accurate detection in a real-time
closed-world environment (∼84%). In a live open-world scenario accuracy
suffered (∼67%) but we believe the high false positive rate responsible can
be improved with improved background WiFi traffic data.
165
CHAPTER 10 Conclusion
• Constructed a classifier capable of identifying Skype voice traffic from a remote,
unprivileged vantage point using only encrypted network activity samples.
This produced a classifier that showed that activity inference was not only
feasible, but also highly accurate (∼97%) on the training data. This proof-
of-concept provided the foundation for the mobile app detection study fo-
cusing on greater personal information inference.
• Assessed the applications of user activity inference techniques and the cost and
effort required to present a practical privacy threat to the everyday WiFi user.
Limitations are evaluated and strategies to thwart them are identified.
Specially designed tools will prevent user activity inference, but are rarely
used by everyday users. Inference is therefore possible from a technical
standpoint in the majority of cases. However, these techniques require large
sets of accurately labelled training data to function well. Although the data
collection process can be automated (as we demonstrated), this data is still
time consuming to collect and keep up-to-date. This expense is encour-
aging for the typical WiFi-using individual, as their user activity informa-
tion is unlikely to be worth the cost. However, these techniques may still
be useful in a variety of applications including law enforcement, prioritisa-
tion during forensic analysis, network security and demographic sampling.
Furthermore, awareness of this privacy vulnerability allows users to make
their own decisions about the activities they perform over supposedly se-
cure wireless communications.
• Precisely specified collection protocols, a sampling methodology and data rep-
resentation scheme that facilitates machine learning classification for this chal-
lenging scenario.
Information can be extracted from external observations of encrypted WiFi
traffic to identify specific user activities despite the highly data-limited (and
potentially noisy) scenario. Time windows and frame size and timing in-
formation measurements can be used to construct histogram representa-
166
Conclusion CHAPTER 10
tions of user activity. With a fixed number of variables per time window,
these allow direct comparison between samples and are an appropriate in-
put for automated machine learning classification techniques.
• Specified designed for a hardware and software platform and user automation
techniques that allow encrypted WiFi data samples to be collected (or derived)
easily and cheaply.
Raspberry Pi hardware alongside free-to-use, open-source software allow
for the construction of a low-cost, portable data collection platform. The
adaptation of software to record, automate and repeat user activities makes
sampling the respective WiFi data a tractable process. In addition, the abil-
ity to convert ‘on-device’ measurements to their equivalent values when ob-
served externally greatly simplifies the collection process. Future research
in this area can use and adapt these specifications for similar benefit.
10.2 Future Avenues of Investigation
In addition to the wider research areas discussed in the previous chapter, the method-
ologies, software and hardware specifications documented in this thesis lay a solid and
well-documented foundation for future work with the same goals. Subsequent WiFi
privacy leak studies may wish to pursue the reduction of false positives in the detection
process. As summarised in Section 9.3, improved data sources for background traffic
and a two-tier process for classification may greatly improve false positive rates.
Our representation discussed in Section 6.3 takes care not to discard information
by using fine-scale distributions rather than coarse metrics. However, as a natural con-
sequence of a histogram-like representation, the information on frame order is lost. Al-
ternative representations and machine learning techniques that preserve this sequence
information may also be helpful to improve detection rates.
As noted throughout this thesis, the side-channels that allow the identified privacy
leaks are not specific to IEEE 802.11 WiFi. A notable extension to this work would be
to determine if the same detection processes can be implemented to monitor mobile
data networks (4G, 5G, . . . ). Given their wide broadcast range and the prevalence of
167

CHAPTER 10 Conclusion
mobile devices in modern society this scenario not only provides interesting proof of
generalisation, but demonstrates a more detrimental effect upon the privacy of every-
day technology users.
This is a nuanced and difficult to solve privacy vulnerability that will not be made
obsolete without considerable changes to current- and next-generation wireless com-
munication protocols. The full source-code for data collection, analysis in R, the live
C++ detector, and the code that generates the latter is made available with this thesis
to encourage and provide a foundation for research into these areas.
10.3 Final Remarks
The research within this thesis investigating Inferring Private User Information Despite
Encryption has contributed to the academic literature over the course of four publica-
tions (Atkinson et al., 2011, 2013, 2014a, b), with another currently under peer review.
It has been undeniably demonstrated that Your WiFi is, in fact, Leaking and this
work provides a strong foundation and powerful motivation for future research into
private information leakage from allegedly confidential encrypted wireless protocols.
168

A Automation Scripts
This appendix lists some examples of Sikuli scripts used to automate user behaviour.Sensitive information such as usernames and passwords for online services have beenremoved or obscured.
A.1 Web Browsing – Google Search, Solar flare Images
click( )
type("firefox www.google.com")
type(Key.ENTER)
wait(20)
type("solar flair") # TYPO
type(Key.ENTER)
wait( ,10)
click(Pattern( ).targetOffset(72,1))
wait(10)
click( )
wait(10)
hover( )
wait(5)
169

APPENDIX A Automation Scripts
A.2 Web Browsing – Wikipedia, 2012 Summer Olympics
click( )
type("firefox www.wikipedia.org")
type(Key.ENTER)
readingTime = 5
wait( ,20)
type("London olympics 2012")
type(Key.ENTER)
wait( ,20)
wait(readingTime)
for i in range(5):
type(Key.DOWN) # Scroll down
click( )
wait(readingTime)
click( )
wait( ,20)
wait(readingTime)
click( )
wait(readingTime)
click( )
wait(readingTime)
170

Automation Scripts APPENDIX A
A.3 Email – GMail, Send Message
click( )
type("firefox www.gmail.com")
type(Key.ENTER)
wait(35)
type( )
wait(15)
type(Key.TAB)
type( )
type(Key.ENTER)
composeLogo =
wait(composeLogo,25)
click(composeLogo)
addressLogo=
wait(addressLogo,25)
click(addressLogo)
paste( )
subjectLogo =
wait(subjectLogo,15)
click(subjectLogo)
type("this is an email from Tom")
<< USERNAME >>
<< PASSWORD >>
<< RECIPIENT EMAIL >>
type(Key.TAB)
type("What's up Tom?")
type(Key.TAB)
wait(5)
type(Key.ENTER)
wait(5)
accountLogo =
wait(accountLogo,10)
click(accountLogo)
signOutLogo =
wait(signOutLogo,5)
click(signOutLogo)
wait(5)
171

APPENDIX A Automation Scripts
A.4 Streaming – Youtube Video, Maru the Cat
click( )
type("firefox www.youtube.com")
type(Key.ENTER)
youtubeLogo = Pattern( ).targetOffset(61,0)
wait(youtubeLogo,30)
click(youtubeLogo)
type("maru box slide")
type(Key.ENTER)
maruBox =
wait(maruBox, 15)
click(maruBox)
wait(10)
172

Automation Scripts APPENDIX A
A.5 VoIP – Skype, Make Call
These code invokes a script to call a given recipient and play specified voice recordingswith pauses. When combined with the script in the next appendix subsection to mimica conversation.
pythonPath = "C:\\Python27"
scriptPath = "C:\\Users\\John\\Desktop\\skype-
callMake.sikuli"
scriptDrive = "C:"
username =
password =
recipient =
click( )
type("skype")
type(Key.ENTER)
wait(Pattern( ).similar(0.10),35)
click(Pattern( ).similar(0.56),35)
type(username)
type(Key.TAB)
type(password)
click( )
wait( ,20)
click( )
type("cmd.exe")
wait( ,25)
type(Key.ENTER)
wait( ,20)
<< USERNAME>>
<< PASSWORD>>
<< RECIPIENT USERNAME>>
type(scriptDrive)
type(Key.ENTER)
type("cd " + scriptPath)
type(Key.ENTER)
type(pythonPath + "\\python PlayAudio-MakeCall.py " +
recipient + " 1-goodnews.wav 8 2-quieter.wav 4 3-no.wav
4 4-ohallright.wav 4")
type(Key.ENTER)
wait(30)
rightClick( )
click( )
173

APPENDIX A Automation Scripts
174

B WiresharkFields & Filters
This appendix lists and explains the uses of key Wireshark data fields used during the
studies presented in this thesis. As will be explained, these fields contain a variety
of useful information. Aside from merely being read from, fields can be filtered us-
ing comparative operators (==, >, etc.) to select only certain frames. They can also
be used in combination via logical operators (NOT, AND, OR, etc.). Wireshark sup-
ports thousands of protocols with hundreds of thousands of field combinations. Full
listings per protocol can be found at http://www.wireshark.org/docs/dfref/, or http:
//www.wireshark.org/docs/dfref/w/wlan.html for WiFi specifically.
Table B.1: Useful Wireshark Filters
Wireshark Field [Example filter] Descriptioneapol Present only in frames used to perform client
authentication. Must be to captured to decryptWPA-PSK communications after-the-fact.
wlan.fc.protected [== 1] Equal to one in encrypted frames only. Allows forfiltering of management and control frames leav-ing only those carrying data from user devices.
frame.len [> 400] Length (size) in bytes of the frame. Includesheader.
data.len The length (size) in bytes of the data payload. Po-tentially misleading as anything that Wiresharkcannot decode is assumed to be data. Will there-fore vary depending on whether frames can bedecrypted and which protocol dissectors are en-abled.
wlan.addr[==�XX:XX:XX:XX:XX:XX�]
MAC address within a WiFi frame. Can be filteredas demonstrated to provide only frames contain-ing the specified MAC address. More specific vari-ations follow.
wlan.sawlan.da
Frames where specified MAC is the source (sa) ordestination (da) address.
cont.
175

APPENDIX B Wireshark Fields & Filters
Table B.2: Useful Wireshark Filters (cont.)
wlan.tawlan.ra
Frames where specified MAC is the transmitter(ta) or receiver (ra) address. Typically these areidentical to sa and da, but some enterprise hard-ware will share a generic source MAC betweenAPs. This allows them to be distinguished.
wlan.sa_resolvedwlan.da_resolvedwlan.ta_resolvedwlan.ra_resolved
As above, except the first 3 octets of the MAC ad-dress are replaced with text identifying the man-ufacturer of that MAC range (e.g. “DC:2B:61:XX:XX:XX” =⇒ “Apple_XX:XX:XX”). Useful formapping MACs to actual devices.
wlan.fc.type_subtype [== ?] Denotes a specific frame subtype. Allows for theidentification of useful management frame typessuch as beacons (0x80) and probe requests (0x40).
wlan_mgmt.ssid In beacon frames contains the SSID (name) of thewireless network being provided by that AP.
wlan_mgmt.ds.current_channel [== 13]
In beacon frames contains the channel that thewireless network is operating.
176

C Hardware &Software Specifics
This appendix details the specific hardware and software framework that provided data
for the studies in Chapters 5–7.
• MiFi Access Point
→ “3” (Pay As you Go) MiFi using 802.11g WPA2-Personal
→ Internet Access Provided via 3G cellular network
• Enterprise Network
→ UK-wide “Eduroam” service using WPA2-Enterprise
→ Internet Access Provided via JANET
• Monitor Station Hardware & Operating System
→ Ubuntu Linux 11.04
→ D-Link Wireless N USB Adapter (DWA-140) operating on 802.11g
• Targetted Client Hardware & Operating System
→ Samsung N120 Netbook
→ Windows 7 Starter Edition (+Ubuntu Linux 11.04 Dual Boot)
→ D-Link Wireless N USB Adapter (DWA-140) operating on 802.11g
• Application Software
→ Firefox 5.0
→ Skype 5.3.0.120
→ µTorrent 2.2.1
→ Spotify 0.5.2.84.g6d797eb9
177

BIBLIOGRAPHY
178

Bibliography
Aircrack-ng. Aircrack-ng Homepage, 2012. URL http://www.aircrack-ng.org/.
Apple Inc. iOS 5: Understanding Location Services, Dec. 2010. URL http://support.apple.com/kb/
HT4084.
J. S. Atkinson. Proof is Not Binary: The Pace and Complexity of Computer Systems and the Challenges
Digital Evidence Poses to the Legal System. Birkbeck Law Review, 2(2), 2014. URL http://www.bbklr.
org/2-2-5.html.
J. S. Atkinson, J. E. Mitchell, M. Rio, and G. Matich. Your WiFi Is Leaking: Determining User Behaviour
Despite Encryption. In London Communications Symposium, 2011.
J. S. Atkinson, O. Adetoye, M. Rio, J. E. Mitchell, and G. Matich. Your WiFi is leaking: Inferring user
behaviour, encryption irrelevant. In Wireless Communications and Networking Conference, pages
1097–1102. IEEE, Apr. 2013. ISBN 978-1-4673-5939-9. doi: 10.1109/WCNC.2013.6554717. URL http:
//ieeexplore.ieee.org/xpl/articleDetails.jsp?tp=&arnumber=6554717.
J. S. Atkinson, J. E. Mitchell, M. Rio, and G. Matich. Your WiFi Is Leaking: Building a Low-Cost Device to
Infer User Activities. Cyberpatterns, 2014a.
J. S. Atkinson, J. E. Mitchell, M. Rio, and G. Matich. Your WiFi Is Leaking - Ignoring Encryption, Using His-
tograms to Remotely Detect Skype Traffic. In Military Communications Conference (MILCOM), pages
40–45. IEEE, 2014b.
T. Aura, J. Lindqvist, M. Roe, A. M. Chattering, N. Borisov, I. Goldberg, and A. Mohammed. Chattering
Laptops. Privacy Enhancing Technologies Symposium, 5134(July):167–186, 2008.
S. A. Baset and H. G. Schulzrinne. An Analysis of the Skype Peer-to-Peer Internet Telephony Protocol. In
Computer Communications, pages 1–11. IEEE, 2006. ISBN 1-4244-0221-2. doi: 10.1109/INFOCOM.
2006.312. URL http://ieeexplore.ieee.org/lpdocs/epic03/wrapper.htm?arnumber=4146965.
P. Belanger. 802.11n Delivers Better Range, 2007. URL http://www.wi-�planet.com/tutorials/article.
php/3680781.
A. Bittau, M. Handley, and J. Lackey. The final nail in WEP’s coffin. In IEEE Symposium on Security and
Privacy (S&P’06), pages 386–400. IEEE, 2006. ISBN 0-7695-2574-1. doi: 10.1109/SP.2006.40. URL http:
//ieeexplore.ieee.org/lpdocs/epic03/wrapper.htm?arnumber=1624028.
D. Bonfiglio, P. Torino, D. Elettronica, D. Rossi, and P. Tofanelli. Revealing skype traffic: when randomness
plays with you. ACM SIGCOMM Computer Communication Review, 37:37–48, Oct. 2007. ISSN 01464833.
doi: 10.1145/1282427.1282386. URL http://doi.acm.org/10.1145/1282380.1282386.
179

BIBLIOGRAPHY
N. Borisov, I. Goldberg, and D. Wagner. Intercepting Mobile Communications: The Insecurity of 802.11. In
Mobile computing and Networking - MobiCom ’01, pages 180–189. ACM Press, 2001. ISBN 1581134223.
doi: 10.1145/381677.381695. URL http://portal.acm.org/citation.cfm?doid=381677.381695.
L. Breiman. Random Forests. Machine Learning, 45(1):5–32, 2001.
L. Breiman. Random Forests, 2013. URL http://www.stat.berkeley.edu/~breiman/RandomForests/cc_
home.htm.
Cabinet Office (UK). A Strong Britain in an Age of Uncertainty : The National Security Strategy. HM Sta-
tionery Office, 2010. ISBN 9780101795326.
A. Censk. Malls track shoppers’ cell phones on Black Friday, Nov. 2011. URL http://money.cnn.com/
2011/11/22/technology/malls_track_cell_phones_black_friday/index.htm.
Centre for Protection of National Infrastructure (UK). 802.11 wireless networks - CPNI viewpoint 05/2007.
HM Stationery Office, 2007.
S. Chen, R. Wang, X. Wang, and K. Zhang. Side-Channel Leaks in Web Applications: A Reality Today, a
Challenge Tomorrow. In Symposium on Security and Privacy, pages 191–206. IEEE, 2010. ISBN 978-1-
4244-6894-2. doi: 10.1109/SP.2010.20. URL http://ieeexplore.ieee.org/lpdocs/epic03/wrapper.htm?
arnumber=5504714.
N. Cheng, X. Oscar Wang, W. Cheng, P. Mohapatra, and A. Seneviratne. Characterizing privacy leakage of
public WiFi networks for users on travel. Proceedings - IEEE INFOCOM, pages 2769–2777, 2013. ISSN
0743166X. doi: 10.1109/INFCOM.2013.6567086.
G. Conti and J. Carol. Embracing the Kobayashi Maru: Why you should teach your students to cheat. IEEE
Security & Privacy, 2012.
P. G. Cook and W. Bonser. Architectural Overview of the SPEAKeasy System. IEEE Journal On Selected Areas
In Communications, 17(4):650–661, 1999.
S. Dai, A. Tongaonkar, X. Wang, A. Nucci, and D. Song. NetworkProfiler: Towards automatic fingerprinting
of Android apps. INFOCOM, pages 809–817, Apr. 2013. doi: 10.1109/INFCOM.2013.6566868. URL
http://ieeexplore.ieee.org/lpdocs/epic03/wrapper.htm?arnumber=6566868.
B. Danev, D. Zanetti, and S. Capkun. On physical-layer identification of wireless devices. ACM Computing
Surveys, 45(1):1–29, Nov. 2012. ISSN 03600300. doi: 10.1145/2379776.2379782. URL http://dl.acm.
org/citation.cfm?doid=2379776.2379782.
Dartmouth College. CRAWDAD: A Community Resource for Archiving Wireless Data At Dartmouth, 2012.
URL http://crawdad.cs.dartmouth.edu/.
180

BIBLIOGRAPHY
W. H. Dutton and G. Blank. Oxford Internet Survey 2011 Report. Next Generation Users: The Internet in
Britain. Oxford Internet Surveys, 2011.
W. H. Dutton and G. Blank. Cultures of the Internet: The Internet in Britain, Oxford Internet Survey 2013
Report. Oxford Internet Institute, 2013.
P. Eckersley. How Unique Is Your Web Browser? Technical report, Electronic Frontier Foundation, 2010.
URL https://www.e�.org/deeplinks/2010/05/every-browser-unique-results-fom-panopticlick.
A. Ephremides, J. E. Wieselthier, and D. J. Baker. A design concept for reliable mobile radio networks with
frequency hopping signaling. Proceedings of the IEEE, 75(1):56–73, 1987.
EPSRC. EPSRC News: Cybersecurity, 2011. URL http://www.epsrc.ac.uk/newsevents/news/2011/
Pages/cybersecurity.aspx.
Farproc. WiFi Analyzer (Android App), 2013. URL https://play.google.com/store/apps/details?id=com.
farproc.wi�.analyzer.
A. P. Felt, M. Finifter, E. Chin, S. Hanna, and D. Wagner. A survey of mobile malware in the wild. Proceedings
of the 1st ACM workshop on Security and privacy in smartphones and mobile devices - SPSM ’11, page 3,
2011. doi: 10.1145/2046614.2046618. URL http://dl.acm.org/citation.cfm?doid=2046614.2046618.
M. Fernéndez-Delgado, E. Cernadas, and S. Barro. Do we Need Hundreds of Classifiers to Solve Real World
Classification Problems? Journal of Machine Learning Research, 15:3133–3181, 2014.
R. Flickenger, S. Okay, E. Pietrosemoli, M. Zennaro, and C. Fonda. Very Long Distance Wi-Fi Networks.
In Networked systems for developing regions - NSDR ’08, page 6, New York, New York, USA, 2008. ACM
Press. ISBN 9781605581804. doi: 10.1145/1397705.1397707.
S. Garfinkel. Anti-Forensics: Techniques, Detection and Countermeasures. In i-Warfare and Security,
volume 2, pages 8–9, 2007. doi: 10.1.1.109.5063.
F. Gebali. Analysis of Computer and Communication Networks. Springer, 2008.
A. Ghosh, R. Ratasuk, B. Mondal, N. Mangalvedhe, and T. Thomas. LTE-advanced: next-generation
wireless broadband technology. IEEE Wireless Communications, 17(3):10–22, June 2010. ISSN
1536-1284. doi: 10.1109/MWC.2010.5490974. URL http://ieeexplore.ieee.org/xpls/abs_all.jsp?
arnumber=5490974&tag=1.
S. Gold. Why WPA standards won’t protect your network. Infosecurity, 7(1):28–31, Jan. 2010. ISSN
17544548. doi: 10.1016/S1754-4548(10)70016-4. URL http://dx.doi.org/10.1016/S1754-4548(10)
70016-4http://linkinghub.elsevier.com/retrieve/pii/S1754454810700164.
181

BIBLIOGRAPHY
Google Inc. On vehicle-based collection of wifi data for use in Google location based services, Apr.
2010. URL http://static.googleusercontent.com/external_content/untrusted_dlcp/www.google.
com/en//googleblogs/pdfs/google_submission_dpas_wi�_collection.pdf.
Great Britain. Computer Misuse Act (Amended 2006; Police and Justice Act). Her Majesty’s Stationery
Office, 1990. URL http://www.legislation.gov.uk/ukpga/1990/18/contents.
Great Britain. Data Protection Act. Her Majesty’s Stationery Office, 1998. URL http://www.legislation.
gov.uk/ukpga/1998/29/contents.
A. R. a. Grégio and R. D. C. Santos. Visualization techniques for malware behavior analysis. In E. M.
Carapezza, editor, Communications, and Intelligence (C3I) Technologies for Homeland Security and
Homeland Defense X, volume 8019, pages 801905–801905–9, May 2011. doi: 10.1117/12.883441. URL
http://proceedings.spiedigitallibrary.org/proceeding.aspx?articleid=1269137.
M. Gruteser and D. Grunwald. Enhancing Location Privacy in Wireless LAN Through Disposable In-
terface Identifiers: A Quantitative Analysis. Mobile Networks and Applications, 10(3):315–325, June
2005. ISSN 1383-469X. doi: 10.1007/s11036-005-6425-1. URL http://link.springer.com/10.1007/
s11036-005-6425-1.
A. Hadjittofis. WiFinespect Play Store Page, 2014. URL https://play.google.com/store/apps/details?id=
uk.co.opticiancms.wi�probe.
Hyenae Development Team. Hyenae Project Information, 2012. URL http://hyenae.sourceforge.net/.
A. Iacovazzi, A. Baiocchi, and L. Bettini. What are you Googling ? - Inferring search type informa-
tion through a statistical classifier. In Global Communications, pages 747–753. IEEE, 2013. ISBN
9781479913534.
ICO. Statement: Google - Assessment of WiFi data. The Information Commissioner’s Office (UK), July
2010. URLwww.ico.gov.uk/upload/documents/pressreleases/2010/ico_statement_google_wi�_
data_290710.pdf.
IEEE-SA. Wireless LAN Medium Access Control (MAC) and Physical Layer (PHY) specifications Amendment
6: Medium Access Control (MAC) Security Enhancements. IEEE, 2004a.
IEEE-SA. 802.1X - Port Based Network Access Control. IEEE Standards Authority, 2004b. URL http://www.
ieee802.org/1/pages/802.1x-2004.html.
IEEE-SA. Wireless LAN Medium Access Control (MAC) and Physical Layer (PHY) Specification. IEEE Stand-
ards Authority, 2007. ISBN 0738156558. doi: 10.1109/IEEESTD.2007.373646.
IEEE-SA. Wireless LAN Medium Access Control (MAC) and Physical Layer (PHY) Specifications Amendment
4: Protected Management Frames. IEEE Standards Authority, 2009. ISBN 9780738160481. doi: 10.1109/
IEEESTD.2009.5278657.
182

BIBLIOGRAPHY
IEEE-SA. IEEE Standard for Ethernet. IEEE Standards Authority, 2012. ISBN 9730738173. URL http:
//standards.ieee.org/about/get/802/802.3.html.
IISP. The IISP Code of Ethics. Institute of Information Security Professionals, Nov. 2007.
R. Jain and S. Routhier. Packet Trains-Measurements and a New Model Computer Network Traffic. Selected
Areas in Communications, 4(6):986–995, 1986.
D. Jamil and H. Zaki. Cloud Computing Security. International Journal of Engineering Science and Tech-
nology (IJEST), 3(4):3478–3483, 2011.
R. N. Jesudasan, P. Branch, and J. But. Generic Attributes for Skype Identification Using Machine
Learning. Technical Report August, Centre for Advanced Internet Architectures, Swinburne Uni-
versity of Technology, Melbourne, Australia, 2010. URL http://caia.swin.edu.au/reports/100820A/
CAIA-TR-100820A.pdf.
T. Karagiannis, K. Papagiannaki, and M. Faloutsos. BLINC: Multilevel Traffic Classification in the Dark.
ACM SIGCOMM Computer Communication Review, 35(4):229, Oct. 2005. ISSN 01464833. doi: 10.1145/
1090191.1080119. URL http://portal.acm.org/citation.cfm?doid=1090191.1080119.
A. Kind, M. Stoecklin, and X. Dimitropoulos. Histogram-based traffic anomaly detection. IEEE Transac-
tions on Network and Service Management, 6(2):110–121, 2009. ISSN 19324537. doi: 10.1109/TNSM.
2009.090604.
Kismet Wireless. Kismet Documentation, 2012. URL http://www.kismetwireless.net/documentation.
shtml.
P. C. Kocher. Timing Attacks on Implementations of Diffie-Hellman, RSA, DSS, and Other Systems. In
CRYPTO ’96 – International Cryptology Conference on Advances in Cryptology, pages 104–113. Springer-
Verlag, 1996. ISBN 3-540-61512-1. URL http://dl.acm.org/citation.cfm?id=646761.706156.
P. C. Kocher, J. Jaffe, and B. Jun. Differential Power Analysis. In CRYPTO ’99 – International Cryptology
Conference on Advances in Cryptology, pages 388–397. Springer-Verlag, Aug. 1999. ISBN 3-540-66347-9.
URL http://dl.acm.org/citation.cfm?id=646764.703989.
S. B. Kotsiantis. Supervised Machine Learning : A Review of Classification Techniques. Informatica, 31:
249–268, 2007.
M. Kuehnhausen and V. S. Frost. Trusting smartphone Apps? To install or not to install, that is the question.
2013 IEEE International Multi-Disciplinary Conference on Cognitive Methods in Situation Awareness
and Decision Support (CogSIMA), pages 30–37, Feb. 2013. doi: 10.1109/CogSIMA.2013.6523820. URL
http://ieeexplore.ieee.org/lpdocs/epic03/wrapper.htm?arnumber=6523820.
183

BIBLIOGRAPHY
N. Lawson. Side-Channel Attacks on Cryptographic Software. IEEE Security & Privacy Magazine, 7(6):65–
68, Nov. 2009. ISSN 1540-7993. doi: 10.1109/MSP.2009.165. URL http://ieeexplore.ieee.org/lpdocs/
epic03/wrapper.htm?arnumber=5370703.
A. Lim, L. Breiman, and A. Cutler. bigrf: Big Random Forests: Classification and Regression Forests for Large
Data Sets, 2013. URL http://cran.r-project.org/package=bigrf.
H. Ling and K. Okada. An Efficient Earth Mover âAZ s Distance Algorithm for Robust Histogram Compar-
ison. Pattern Analysis and Machine Learning, 29(5):840–853, 2007.
M. Marlinspike, D. Hulton, and R. Marsh. Divide and Conquer: Cracking MS-CHAPv2 with a 100% success
rate, 2012. URL https://www.cloudcracker.com/blog/2012/07/29/cracking-ms-chap-v2/.
P. McDaniel and S. McLaughlin. Security and Privacy Challenges in the Smart Grid. Security & Privacy
Magazine, 7(3):75–77, May 2009. ISSN 1540-7993. doi: 10.1109/MSP.2009.76. URL http://ieeexplore.
ieee.org/lpdocs/epic03/wrapper.htm?arnumber=5054916.
MIT CSAIL. Project Sikuli Homepage, 2012. URL http://www.sikuli.org/.
F. Monrose, M. K. Reiter, and S. Wetzel. Password Hardening Based on Keystroke Dynamics. In Computer
and Communications Security, pages 73–82, 1999.
MTUX. MyMobiler for Android, 2014. URL http://www.mymobiler.com/.
R. Murty, J. Padhye, R. Chandra, A. Wolman, and B. Zill. Designing high performance enterprise Wi-Fi
networks. USENIX Symposium on Networked Systems Design and Implementation, pages 73–88, Apr.
2008. URL http://dl.acm.org/citation.cfm?id=1387589.1387595.
National Security Agency (USA). TEMPEST: a signal problem – The story of the discovery of various com-
promising radiations from communications and Comsec equipment. Cryptologic Spectrum, 2(3):103–
115, 1972. URL http://www.nsa.gov/public_info/_�les/cryptologic_spectrum/tempest.pdf.
Net Applications. Desktop Operating System Market Share, 2014. URLhttp://www.netmarketshare.com/
report.aspx?qprid=10&qptimeframe=M&qpsp=188&qpch=350&qpcustomd=0.
A. Panchenko, L. Niessen, A. Zinnen, and T. Engel. Website fingerprinting in onion routing based an-
onymization networks. In Workshop on Privacy in the electronic society - WPES ’11, page 103. ACM
Press, 2011. ISBN 9781450310024. doi: 10.1145/2046556.2046570. URL http://dl.acm.org/citation.
cfm?doid=2046556.2046570.
P. Pantel and D. Lin. Spamcop: A spam classification & organization program. Proceedings of AAAI-98
Workshop on Learning for Text . . . , pages 95–98, 1998. URL http://www.aaai.org/Papers/Workshops/
1998/WS-98-05/WS98-05-017.pdf.
184

BIBLIOGRAPHY
I. Perona, I. Albisua, and O. Arbelaitz. Histogram based payload processing for unsupervised
anomaly detection systems in network intrusion. Proc. of the 14th . . . , 2010. URL http:
//scholar.google.com/scholar?hl=en&btnG=Search&q=intitle:Histogram+based+payload+
processing+for+unsupervised+anomaly+detection+systems+in+network+intrusion#0.
M. Perry. Experimental Defense for Website Traffic Fingerprinting. Technical report, Tor Project, 2011.
URL https://blog.torproject.org/blog/experimental-defense-website-tra�c-�ngerprinting.
K. D. Pimple. The ten most important things to know about research ethics. Self-published, 2009.
M. Pollit and A. Whitledge. Exploring Big Haystacks. In M. Olivier and S. Shenoi, editors, Advances in Di-
gital Forensics II, International Federation for Information Processing, chapter 6, pages 67–76. Boston:
Springer, 2006. ISBN 0387368906.
Qt Project. Qt Creator, 2014. URL http://qt-project.org/wiki/Category:Tools::QtCreator.
E. L. Quinn. Privacy and the New Energy Infrastructure. Social Science Research Network, pages 1995–
2008, Feb. 2009. ISSN 1556-5068. doi: 10.2139/ssrn.1370731. URL http://papers.ssrn.com/abstract=
1370731http://www.ssrn.com/abstract=1370731.
R Core Team. R: A Language and Environment for Statistical Computing. R Foundation for Statistical
Computing, Vienna, Austria, 2013. URL http://www.r-project.org/.
Raspberry Pi Project. Raspberry PI FAQs, 2013. URL http://www.raspberrypi.org/faqs.
RCUK. Policy and Code of Conduct on the Governance of Good Research Conduct. Research Councils
United Kingdom, Oct. 2011.
R. A. Redner and H. F. Walker. Society for Industrial and Applied Mathematics. Society for Industrial and
Applied Mathematics Review, 26(2):195–239, 1984.
I. Ruiz, M. Nagappan, B. Adams, T. Berger, S. Dienst, and A. Hassan. On Ad Library Updates in Android
Apps. In IEEE Software, 2014.
S. Russell and P. Norvig. Artificial Intelligence: A Modern Approach. Prentice Hall, 3rd edition, 2009. ISBN
0-13-604259-7.
T. S. Saponas, J. Lester, C. Hartung, T. Kohno, and S. Agarwal. Devices That Tell On You : Privacy Trends in
Consumer Ubiquitous Computing. USENIX Security, pages 55–70, 2007.
B. Schneier. Secrets and Lies: Digital Security in a Networked World. Wiley, 2004. ISBN 0471453803.
B. Schneier. The Ethics of Vulnerability Research, 2008. URL http://www.schneier.com/blog/archives/
2008/05/the_ethics_of_v.html.
185

BIBLIOGRAPHY
S. Schulz, V. Varadharajan, and A.-R. Sadeghi. The Silence of the LANs: Efficient Leakage Resilience for
IPsec VPNs. Transactions on Information Forensics and Security, 9(2):221–232, Feb. 2014. ISSN 1556-
6013. doi: 10.1109/TIFS.2013.2289978. URLhttp://ieeexplore.ieee.org/lpdocs/epic03/wrapper.htm?
arnumber=6657768.
Selex ES. Code of Ethics. Selex ES, 2012. URLwww.selex-es.com/documents/737448/11300383/body_
121213_ses_codice_etico_v4_uk.pdf.
K. Shilton. Four Billion Little Brothers? ACM Queue, 7:40, 2009. ISSN 15427730. doi: 10.1145/1594204.
1597790.
A. Stafylopatis and K. Blekas. Autonomous vehicle navigation using evolutionary learning reinforcement.
European Journal Of Operational Research, 17(97), 1998.
S. Stefania, I. Toufik, and M. Baker. LTE - The UMTS Long Term Evolution: From Theory to Practice. John
Wiley & Sons, Ltd, Chichester, UK, 1st edition, 2009. ISBN 9780470697160. doi: 10.1002/9780470742891.
T. Stöber, M. Frank, J. Schmitt, and I. Martinovic. Who do you sync you are? In Security and Privacy in
Wireless and Mobile Networks (WiSEC), page 7, New York, USA, 2013. ACM Press. ISBN 9781450319980.
doi: 10.1145/2462096.2462099. URL http://dl.acm.org/citation.cfm?doid=2462096.2462099.
TCPDump Team. TCPDUMP / LIBPCAP Repository, 2012. URL http://www.tcpdump.org/
#documentation.
Tor Project. Installing Tor on Android, 2015. URL https://www.torproject.org/docs/android.html.en.
T. Trafalis and H. Ince. Support vector machine for regression and applications to financial forecasting.
Proceedings of the IEEE-INNS-ENNS International Joint Conference on Neural Networks. IJCNN 2000.
Neural Computing: New Challenges and Perspectives for the New Millennium, 6, 2000. ISSN 1098-7576.
doi: 10.1109/IJCNN.2000.859420.
TrueCrypt Documentation. TrueCrypt, 2014. URL http://www.truecrypt.org/docs/.
UCL. Guidelines on Completing the Application Form. UCL Research Ethics Committee, June 2012.
J. Vincent. London’s bins are tracking your smartphone. The Independent, Aug.
2013. URL http://www.independent.co.uk/life-style/gadgets-and-tech/news/
updated-londons-bins-are-tracking-your-smartphone-8754924.html.
A. Wahlig and M. Ohtamaa. Skype4Py Documentation, 2013. URL https://github.com/awahlig/
skype4py/blob/master/README.rst#introduction.
D. Wang, W. Ding, H. Lo, T. Stepinski, J. Salazar, and M. Morabito. Crime hotspot mapping using the crime
related factorsâATa spatial data mining approach. Applied Intelligence, 39:772–781, 2012. ISSN 0924-
669X. doi: 10.1007/s10489-012-0400-x. URL http://link.springer.com/10.1007/s10489-012-0400-x.
186

BIBLIOGRAPHY
T. Wang, X. Cai, R. Nithyanand, R. Johnson, and I. Goldberg. Effective Attacks and Provable Defenses
for Website Fingerprinting. 23rd USENIX Security Symposium (USENIX Security 14), pages 143–157,
2014. URL https://www.usenix.org/conference/usenixsecurity14/technical-sessions/presentation/
wang_tao.
D. V. D. Weken, M. Nachtegael, and E. Kerre. Using Similarity Measures for Histogram Comparison. In
Fuzzy Sets and Systems, volume 281, pages 396–403. Springer Berlin Heidelberg, 2003.
S. Wender and I. Watson. Applying reinforcement learning to small scale combat in the real-time strategy
game StarCraft:Broodwar. 2012 IEEE Conference on Computational Intelligence and Games, CIG 2012,
pages 402–408, 2012. doi: 10.1109/CIG.2012.6374183.
A. M. White, A. R. Matthews, K. Z. Snow, and F. Monrose. Phonotactic Reconstruction of Encrypted VoIP
Conversations: Hookt on Fon-iks. In Symposium on Security and Privacy, pages 3–18. IEEE, May 2011.
ISBN 978-1-4577-0147-4. doi: 10.1109/SP.2011.34. URL http://ieeexplore.ieee.org/lpdocs/epic03/
wrapper.htm?arnumber=5958018.
WikiMedia Commons (CC-SA M Gauthier). WiFi Channel Overlap Diagram, 2009. URL http://commons.
wikimedia.org/wiki/File:2.4_GHz_Wi-Fi_channels_(802.11b,g_WLAN).png.
WikiMedia Commons (GFDL JB Hewitt). OSI Reference Model Diagram, 2007. URL http://commons.
wikimedia.org/wiki/File:Osi-model-jb.svg.
G. Wilkinson. Digital Terrestrial Tracking : The Future of Surveillance. DEFCON 22, 2014.
Wireshark Foundation. About Wireshark, 2012. URL http://www.wireshark.org/about.html.
C. V. Wright and G. M. Masson. On Inferring Application Protocol Behaviors in Encrypted Network Traffic.
Journal of Machine Learning Research, 7:2745–2769, 2006.
Z. Yan. Limited knowledge and limited resources: Children’s and adolescents’ understanding of the Inter-
net. Journal of Applied Developmental Psychology, 30(2):103–115, Mar. 2009. ISSN 01933973. doi: 10.
1016/j.appdev.2008.10.012. URL http://linkinghub.elsevier.com/retrieve/pii/S0193397308001330.
F. Zhang, W. He, X. Liu, and P. G. Bridges. Inferring users’ online activities through traffic analysis.
In ACM conference on Wireless network security - WiSec ’11, page 59. ACM Press, June 2011. ISBN
9781450306928. doi: 10.1145/1998412.1998425. URL http://portal.acm.org/citation.cfm?doid=
1998412.1998425http://dl.acm.org/citation.cfm?id=1998412.1998425.
Y. Zhang, G. Chen, W. Weng, and Z. Wang. An overview of wireless intrusion prevention systems. In Com-
munication Systems, Networks and Applications, pages 147–150. IEEE, June 2010. ISBN 978-1-4244-
7475-2. doi: 10.1109/ICCSNA.2010.5588671. URLhttp://ieeexplore.ieee.org/lpdocs/epic03/wrapper.
htm?arnumber=5588671.
187

BIBLIOGRAPHY
H. Zimmermann. OSI Reference Model-The ISO Model of Architecture for Open Systems Interconnection.
IEEE Transactions on Communications, 28(4):425–432, 1980.
188