Inferring the curiosity by using Facebook profile data
45
MASTER ’ S T HESIS Inferring the curiosity by using Facebook profile data Inferencia de la curiosidad mediante el uso de datos de perfil de Facebook Author: Rebeca Janina DELCONTE F ERREIRA DOS S ANTOS Supervisor: Dr. Laura S EBASTIA A thesis submitted in fulfillment of the requirements for the Master’s degree in Engineering and Technology of Software Systems in the DSIC - Department of Information Systems and Computation September 2017
-
Upload
khangminh22 -
Category
Documents
-
view
0 -
download
0
Transcript of Inferring the curiosity by using Facebook profile data

MASTER’S THESIS
Inferring the curiosity by using Facebookprofile data
Inferencia de la curiosidad mediante el uso de datos de perfil de Facebook
Author:Rebeca Janina DELCONTE
FERREIRA DOS SANTOS
Supervisor:Dr. Laura SEBASTIA
A thesis submitted in fulfillment ofthe requirements for the Master’s degree in
Engineering and Technology of Software Systems
in the
DSIC - Department of Information Systems and ComputationSeptember 2017

Resum
En els últims anys, l’ús d’Internet i xarxes socials s’ha tornat quasi indispensableen la nostra societat. Malgrat el pensament general, els estudis han demostrat que elperfil en les xarxes socials mostra en gran manera la personalitat real de l’individu.Dit açò, seria valuós extraure algun coneixement de tal quantitat de dades i utilitzar-ho per a millorar el rendiment de les eines de personalització intel·ligent, com larecomanació de productes i serveis o altres tipus de màrqueting.
En aquest treball, hem optat per treballar amb les dades disponibles en el projecteanomenat myPersonality, que posa a disposició tant els perfils de Facebook com lesrespostes al qüestionari psicològic Big Five. El nostre enfocament es va centrar enl’anàlisi de dos trets específics de la personalitat humana, l’obertura a l’experiència ila extroversió, que estan estretament relacionats amb la curiositat. Hem desenvolu-pat models de regressió i de classificació per a predir aquests dos trets. Els resultatshan demostrat una significància feble, a pesar que la extroversió va obtenir resultatslleugerament millors, indicant que algunes dades de Facebook poden expressar elgrau de extroversió de l’usuari.
Paraules clau: Xarxes socials, curiositat, Facebook, myPersonality, Big Five

Resumen
En los últimos años, el uso de Internet y redes sociales se ha vuelto casi indis-pensable en nuestra sociedad. A pesar del pensamiento general, los estudios handemostrado que el perfil en las redes sociales muestra en gran medida la personal-idad real del individuo. Dicho esto, sería valioso extraer algún conocimiento de talcantidad de datos y utilizarlo para mejorar el rendimiento de las herramientas depersonalización inteligente, como la recomendación de productos y servicios u otrostipos de marketing.
En este trabajo, hemos optado por trabajar con los datos disponibles en el proyectollamado myPersonality, que pone a disposición tanto los perfiles de Facebook comolas respuestas al cuestionario psicológico Big Five.
Nuestro enfoque se dió al análisis de dos rasgos específicos de la personalidadhumana, la apertura a la experiencia y la extroversión, que están estrechamente rela-cionados con la curiosidad. Hemos desarrollado modelos de regresión y de clasifi-cación para predecir estos dos rasgos. Los resultados han demostrado una signifi-cancia débil, a pesar de que la extroversión obtuvo resultados ligeramente mejores,indicando que algunos datos de Facebook pueden expresar el grado de extroversióndel usuario.
Palabras clave: Redes sociales, curiosidad, Facebook, myPersonality, Big Five

Abstract
In the recent years, the use of internet and social networks has become almostindispensable in our society. Despite the general thinking, studies have shown thatthe profile in social networks shows a great extent of the actual personality of theindividual. That said, it would be valuable to extract some knowledge from suchamount of data and use it to enhance the performance of intelligent personalizationtools such as recommendation of products and services or other types of marketing.
Seizing the great amount of data available under the project called myPerson-ality, which makes available both Facebook profiles and responses to the Big Fivepsychological questionnaire, we have chosen to work on this data.
We were interested in two specific traits of human personality, the openness toexperience and the extroversion, which are closely related to the curiosity. We builtregression and classification models to predict extroversion and openness of theusers. Results shown weak significance, although extroversion obtained a slightlybetter result, indicating that some Facebook features can express the extroversion ofthe person.
Keywords: Social networks, curiosity, Facebook, myPersonality, Big Five

i
AcknowledgementsMany thanks to David Stillwell and Michal Kosinski for access and guidance re-garding the data from myPersonality project data; to my supervisor Laura who wasalways present when I doubted; and to my lovely husband Alan who has always amotivation word for me, thank you all for supporting me.

ii
Contents
Resum i
Resumen i
Abstract i
Acknowledgements i
1 Introduction 11.1 Motivation . . . . . . . . . . . . . . . . . . . . . . . . . . . . . . . . . . . 11.2 Objectives / Goals . . . . . . . . . . . . . . . . . . . . . . . . . . . . . . 21.3 Structure . . . . . . . . . . . . . . . . . . . . . . . . . . . . . . . . . . . . 2
2 Related Works 32.1 myPersonality . . . . . . . . . . . . . . . . . . . . . . . . . . . . . . . . . 9
3 Methodology 113.1 Data Source . . . . . . . . . . . . . . . . . . . . . . . . . . . . . . . . . . 113.2 Preprocessing . . . . . . . . . . . . . . . . . . . . . . . . . . . . . . . . . 133.3 Correlation Analysis . . . . . . . . . . . . . . . . . . . . . . . . . . . . . 143.4 PCA - Principal Components Analysis . . . . . . . . . . . . . . . . . . . 173.5 Correlation for Population . . . . . . . . . . . . . . . . . . . . . . . . . . 20
4 Models, Results and Discussion 214.1 Regression Model . . . . . . . . . . . . . . . . . . . . . . . . . . . . . . . 214.2 Principal Component Regression . . . . . . . . . . . . . . . . . . . . . . 234.3 Logistic Regression . . . . . . . . . . . . . . . . . . . . . . . . . . . . . . 264.4 Comparison . . . . . . . . . . . . . . . . . . . . . . . . . . . . . . . . . . 274.5 Limitations . . . . . . . . . . . . . . . . . . . . . . . . . . . . . . . . . . . 28
5 Conclusion and Future Work 295.1 Conclusions . . . . . . . . . . . . . . . . . . . . . . . . . . . . . . . . . . 295.2 Future Work . . . . . . . . . . . . . . . . . . . . . . . . . . . . . . . . . . 30
A Big Five Questionnaire (100 items) used in myPersonality 31
Bibliography 34

iii
List of Figures
2.1 EMC Digital Universe, 2014 . . . . . . . . . . . . . . . . . . . . . . . . . 32.2 Big Five Prototypes: Most Central Trait Adjectives Selected Consen-
sually by Expert Judges and Their Factor Loadings in Personality Rat-ings by 10 Psychologists Serving as Observers . . . . . . . . . . . . . . 5
2.3 Means, standard deviations, and Pearson correlations between BigFive and CEI-II . . . . . . . . . . . . . . . . . . . . . . . . . . . . . . . . 9
3.1 Model of the entity-relationship diagram generated by MySQL . . . . 123.2 Summary of the PCA analysis . . . . . . . . . . . . . . . . . . . . . . . . 173.3 matrix with eigenvalues . . . . . . . . . . . . . . . . . . . . . . . . . . . 183.4 Correlation between variables and PCs . . . . . . . . . . . . . . . . . . 183.5 Variables factor map . . . . . . . . . . . . . . . . . . . . . . . . . . . . . 183.6 Variables factor map depicting the 5 most important ones . . . . . . . . 193.7 Scree plot for Principal Components and Variance . . . . . . . . . . . . 19
4.1 Multiple regression for extroversion . . . . . . . . . . . . . . . . . . . . 214.2 Multiple regression for openness . . . . . . . . . . . . . . . . . . . . . . 224.3 Results of the PCR for extroversion with the dataset big5_20 . . . . . . 234.4 Results of the PCR for extroversion with the dataset big5_90 . . . . . . 234.5 Root-Mean-Square Error of Prediction by number of components . . . 24

iv
List of Tables
3.1 Summary of the complete dataset . . . . . . . . . . . . . . . . . . . . . . 143.2 Correlation analysis between all lengths of questionnaires . . . . . . . 153.3 Summary of dataset big5_90 . . . . . . . . . . . . . . . . . . . . . . . . . 153.4 Pairwise correlation analysis of dataset big5_90. Significant correla-
tions at p < 0.05 level are shown in bold . . . . . . . . . . . . . . . . . . 163.5 Distribution of the levels for ex and op . . . . . . . . . . . . . . . . . . . 163.6 Comparison between the correlation matrix for ex and op as factor and
numeric variables, respectively . . . . . . . . . . . . . . . . . . . . . . . 163.7 Correlation between ex, op, and population of hometown . . . . . . . . 203.8 Correlation between ex, op, and population of location . . . . . . . . . . 20
4.1 Coefficients of the LR for extroversion . . . . . . . . . . . . . . . . . . . 264.2 Coefficients of the LR for openness . . . . . . . . . . . . . . . . . . . . . 264.3 Logistic Regression (LR) results for extroversion and openness . . . . . 274.4 LR confusion matrix for Extroversion (a) and Openness (b) . . . . . . . 27

v
Listings
3.1 SQL code to retrieve the wanted data from MySQL database . . . . . . 134.1 PCR code for extroversion . . . . . . . . . . . . . . . . . . . . . . . . . . 234.2 PCR code for openness . . . . . . . . . . . . . . . . . . . . . . . . . . . . 24

1
Chapter 1
Introduction
1.1 Motivation
The human personality says how and why we act this or that way, and it can be usednot only for us to better know ourselves, but also to aid improving a huge amount oftechnology to what we are exposed to. Especially because technology exists to makeour lives better and easier. A psychometric test is one of the most common and easyways people can find out their personality, and there are several different tests thatcan be taken, according to different authors and approaches. For instance, Big Fiveis one of those that allow to measure the personality.
Given the fact that nowadays the use of the internet, especially the social net-works, have been constantly increasing and changing the way people interact andcommunicate with each other, it emerged the idea to turn the data available usefulin ongoing projects also related to psychological factors.
Facebook is not used only for communication; it has been becoming a businesstool. Some companies have Facebook pages to promote their products or services,while others make real business inside the platform, whether selling products (thereis a resource called Facebook store), whether through advertisements, specific foreach user thanks to the recommendation algorithms.
The personality is constantly expressed in our daily activities, in our social re-lations, but these footprints can also be found in the online world, where anythingcan be done, from ordering a pizza to taking a course. It can be measured by meansof questionnaires, but it also could be measured by finding relations among thoseonline footprints. Thus, the discovery of the personality of the user has been open-ing a new window in the research of personality and it has created a new field ofinvestigation by computing researchers. For instance, Menk and Sebastiá, 2016 havefound significant correlations between the curiosity (measured by means of the CEI-II questionnaire) and some features of Facebook profiles of the participants.
In order to perform similar research with a more diverse and big extent of users,we have chosen myPersonality data. The project called myPersonality (Kosinski etal., 2015) was a Facebook application developed in 2007, which contained a Big Five-questionnaire in order to measure the personality of the users on that social network,thus recording the tests and some data from their profile online (with their consent).

Chapter 1. Introduction 2
Sine is not that easy to obtain such amount of users and information, their idealizersmade available for other researchers to use those data.
Since then, over 200 researchers have been working with myPersonality data,and we hope to answer some questions not clearly answered about relations be-tween our personality and the usage of social networks, for instance Facebook, andhow researchers could use this relation to better understand people’s needs andhabits. We have seen some researches talking about the relation between myPerson-ality project and Big Five, so we are interested in explore the relation between myPer-sonality and other questionnaires, such as CEI-II. This is one of the most acceptedquestionnaires to measure the human curiosity. Our main goal is to deeper analyzetwo of the five personality traits, openness and extroversion, which are closely cor-related to curiosity; we believe that curiosity could be a relevant variable/factor toincrement in recommendation systems in order to improve the results obtained interms of satisfaction of the users.
1.2 Objectives / Goals
The main goal of this work is to generate a prediction model for the curiosity basedon the features of Facebook. As secondary objectives, we want to individually ana-lyze the eight lengths of the 20-100 IPIP questionnaire for Big Five and detect withwhich one we get the best correlation results, besides to identify the features morecorrelated with the curiosity.
1.3 Structure
The development of this thesis was divided into 5 chapters. First, the definition andgoals of this study are presented; next, we make an overview on the main subjectsaddressed along this work, Chapter 3 is dedicated to the explanation of the modeldeveloped. In Chapter 4 we describe the results obtained and, finally, in Chapter 5,we discuss them and present future possible work.

3
Chapter 2
Related Works
In recent days, it is clear that a huge amount of data is available online. Media files,such as photos and videos, text files from e-mails and messages changed in socialnetworks, and given that people are always connected
The amount and diversity of data extracted from the internet is immense andupdated every moment, especially in the social networks.
According to IDC, 2014, the digital universe is doubling in size every two years,and will reach 44 Zettabytes in 2020, as we can see in fig. 2.1. Such growth has noway back, so why not to take advantage of this enormous data extent? An importantrole is to filter, analyze and then extract valuable information of that data
Fig. 2.1: EMC Digital Universe, 2014
One type of data that is clearly growing is regarding the use of social networks,especially Facebook. The website has launched in 2004 by Mark Zuckerberg insideHarvard’s University ((Phillips, 2007)), originally known as "The Facebook". The ini-tial intention was to use it as a network within the students, but after its popularityhad grown that fast, it promptly extended to other universities. Until 2006, it wasstill restricted to universities’ students, but had spread to other countries. Nowa-days, it is the most known social network, achieving the figure of two billion usersthis year, according to Zuckerberg himself.
Given the widespread impact that this social network represents, it could bevaluable to use that data to discover patterns in human behavior. But, do the onlineprofiles represent the reality, or they are just a way to show the world and idealizedversion of themselves? Different of previous researchers that had this thinking, Back

Chapter 2. Related Works 4
et al., 2010 shows that people do not use social networks to promote an idealized orprojected personality. It means that, by using Facebook data, it would be possibleto obtain real psychological profiles without the need to filling forms, and use thisresult to improve the recommendation systems, among other things.
Talking about the human personality, it has not a single definition. (John, 2008)mention that a common way that psychologists refer to personality is as people’sconsistent patterns of feeling, cognition, and behaving. When studied, two broadareas can be focused: understanding individual differences in particular personalitycharacteristics, such as sociability or irritability; and understanding how the variousparts of a person come together as a whole (American Psychological Association,2017). The measurement of the personality is often used to diagnose diseases andmental disorders, or to determine workplace suitability. But they can be used inother fields, as we will discuss later. Several authors have been studying ways tointerpret and measure the characteristics of personality, so various approaches havebeen created over the years. And, although psychological researchers recognize thatpersonality is also about biological factors, the role of culture, and needs, amongother things, the most studied perspective involves the trait concept; the study ofpersonality traits began with Allport and Allport, 1921, and refers to personalitytypes or qualities, mostly explained by single adjectives as items. To measure it,there are psychometric tests that assess the personality by traits, as it would be toodifficult to assess it by single responses. Thus, the personality traits are groups ofadjectives that people use when describing themselves or others.
The most widely known, studied, and generally accepted - albeit not unanimousamong all researchers (Block, 1995) - model of personality, according to Goldberg,1993; Costa Jr and McCrae, 1992 is the Big Five model, a five-factor framework ofthe human personality described by a lexical method, that is, based on a linguis-tic analysis. Those five factors are personality dimensions that summarize severalmore specific facets that comprise a person’s personality. Its statistical technique isthrough the application of questionnaires that are able to reduce a huge amount ofinformation in a synthetic and relevant set. In other words, the "Big Five" is a reason-able representation of human personality (McCrae and Costa, 1987). The five factorsare the following:
• Agreeableness: includes attributes such as trust, altruism, kindness, affection,and other prosocial behaviors. People who are high in agreeableness tend tobe more cooperative while those low in this trait tend to be more competitiveand even manipulative (Poropat, 2009).
• Conscientiousness: is a tendency to show self-discipline, act dutifully, and aimfor achievement. In other words, it is related to planning, organization, anddependability (Barrick and Mount, 1991).
• Extraversion: regarding positive emotions, assertiveness, sociability, talkative-ness, and also the tendency to seek stimulation in the interaction with others.

Chapter 2. Related Works 5
• Neuroticism (sometimes reversed and called Emotional Stability): describesvulnerability to unpleasant emotions like anger, anxiety, depression, or vul-nerability. Neuroticism also refers to an individual’s level of emotional sta-bility and impulse control and is sometimes referred to as emotional stability(Barrick and Mount, 1991).
• Openness to experience: it is related to a person’s curiosity of the person, cre-ativity, and preference for novelty and variety. Some disagreement remainsabout how to interpret this factor, which is sometimes called intellect.
Fig. 2.2 shows the complete taxonomy of Big Five, where it is possible to findall the adjectives related to each trait. As we can observe, each trait of the Big Fivemodel is broad and consist of a range of “synonyms” or more specific characteristics.Its structure, divided into 5 groups, was derived from statistical analysis of whichtraits tend to arise in the description of people about themselves or about other peo-ple. The underlying correlations, on the other hand, are probabilistic, and exceptionsmay occur.
Fig. 2.2: Big Five Prototypes: Most Central Trait Adjectives Selected Consensually byExpert Judges and Their Factor Loadings in Personality Ratings by 10 PsychologistsServing as Observers
For instance, Srivastava, 2006 mentions that the traits talkativeness and assertive-ness are both associated with Extraversion, but they do not go together by logicalnecessity: you could imagine somebody that is assertive but not talkative. Neverthe-less, many studies indicate that people who are talkative are usually also assertive(and vice versa), which is why they go together under the broader Extraversion fac-tor.
It is worth highlighting that some aspects of the personality are not subsumedinto the Big Five model, since the term personality trait has a special meaning inpersonality psychology that is narrower than the everyday usage of the term.
Other personality traits such as motivations, emotions, attitudes, abilities, self-concepts, social roles, autobiographical memories, and life stories are just a few ofthe other "units" may have theoretical or empirical relationships with the Big Five

Chapter 2. Related Works 6
traits, but they are conceptually distinct. This way, even a very comprehensive pro-file of somebody’s personality traits can only be considered a partial description oftheir personality (Srivastava, 2006).
Regarding the measurement approaches of the Big Five dimensions, we can men-tion the NEO-PI. The very first version of this measurement was published in 1978by Paul Costa, Jr. and Robert McCrae, so called NEO-I, and included only three fac-tors, Neuroticism, Extraversion and Openness. The other two traits were included ina revised version (Costa and McCrae, 1985) and renamed as NEO Personality Inven-tory (NEO-PI), where NEO became no longer an acronym, but part of its name. Re-vised again, and nowadays considered the most comprehensive inventory (Costa Jrand McCrae, 1992), the NEO-PI-R contains 240 items and permits the measurementof the Big Five domains and six specific facets within each dimension. Given its con-siderable length and time spent to complete it, a number of shorter questionnairesarose. We highlight the 100 trait descriptive adjectives (TDA), where Goldberg, 1992have selected only adjectives that uniquely defined each trait; the NEO-Five FactorInventory (NEO-FFI), composed of 60 items (Costa Jr and McCrae, 1992), which con-sists of items that loaded highly on one of the five factors; and the Big Five Inventory(BFI)(John and Srivastava, 1999), which includes 44 items and, instead of using ad-jectives in the questionnaires, it uses short phrases based on the trait adjectives; forinstance, the “Openness” adjective became the BFI item “Is original, comes up withnew ideas”.
Besides those approaches, Goldberg, 1999 introduced the International Person-ality Item Pool (IPIP), under the reason that broad-bandwidth inventories, such asNEO-PI, are proprietary, thus they cannot be freely used by other researchers, inaddition to not being constantly revised. Another issue is that most publishers donot allow the use of their copyrighted inventories on the internet (Goldberg et al.,2006). Hence, IPIP scales were designed to measure constructs similar to those inexisting personality inventories. Their reliability lies in the correlation between theIPIP scale and the scale on which it was based. For instance, there is a 20 to 100-itemIPIP proxy for NEO-PI-R domains (Five Factor Model), which is a widely acceptedpersonality questionnaire. All scales that have been constructed from the items aregathered in the IPIP website1, which is intended as an international effort to developand continually refine a set of personality inventories, whose items are in the publicdomain, and whose scales can be used for both scientific and commercial purposes(IPIP, 2017).
Our personality can be expressed by deliberate attempts to make statements toothers. However, other forms of expression may simply be individual’s inadvertentactions. This is known as behavioral residue (Gosling et al., 2011). It has been foundin personal websites (Marcus, Machilek, and Schütz, 2006) and in social networkssuch as Facebook (Kosinski, Stillwell, and Graepel, 2013). Given the rising amountof data available online, including very "intimate" information (preferences, tastes,
1http://ipip.ori.org/

Chapter 2. Related Works 7
purchase history, travel routes, amount of friends on social networks, political view,sexual orientation, religion etc.), the tendency is that such online behavioral residueswill increase, which could aid in the task of inferring personality through this data.We can find several projects that use data available on social networks to infer per-sonality implicitly to the user (without the need to fill in forms). For instance, Segalinet al., 2015 explored how self-assessed personality profiles can be inferred by lookingat the Facebook profile pictures. They could demonstrate a positive and significantcorrelation between the profile pictures and Extroversion and Neuroticism, the twotraits that obtained better scores.
A very interesting paper (Bachrach et al., 2012) have shown correlations betweensome traits of Personality measured by Big Five and some features from Facebookprofiles. By using data from 180.000 users from the project MyPersonality, they haveanalyzed the following Facebook features: friends, groups, likes, photos, statusesand tags. Their results show some correlations, such as: positive correlation be-tween Openness and number of users’ likes; negative correlation between agree-ableness and number of likes. Then, they have subset 5.000 individuals and haveused their Facebook profiles to predict their personalty traits, using a multivariatelinear regression with 10-fold cross-validation. The best accuracy for the predictionwas found in Extraversion and Neuroticism traits, and the lower in Agreeableness.
Another study (Golbeck, Robles, and Turner, 2011) performed with 279 usersfrom different countries took into account linguistic features (by applying analysismethods), in addition to personal information, number of friends and activities andpreferences from Facebook. They had to complete a personality test (a 45-questionversion of the BFI) and then, they analyzed the correlations between those featuresand the five personality traits from Big Five, such as that conscientiousness is nega-tively correlated to swear words, but positively correlated with words surroundingsocial processes. After that, they have predicted the score of the personality traits bymeans of a regression analysis in Weka (M5’Rules and Gaussian Processes). Their re-sults have shown strong correlations on Openness, Conscientiousness, Extraversionand Neuroticism.
In the same research line, also using the BFI, Gao et al., 2013 demonstrated thatBig Five personality traits also can be extracted from other data sources and lan-guages. By collecting status text from 1766 users of the Chinese micro-blog Sina (themost popular micro-blog in China, which is reported as having 300 million registerusers), having those users responded to the BFI questionnaire, the authors first per-formed a feature extraction of the statuses, and then, built a prediction model usingGaussian process, M5’Rules and Pace Regression. algorithms, finding significantcorrelations for Conscientiousness, Extroversion, and Openness to Experience.
Solinger et al., 2014 obtained positive prediction accuracy in all traits of Big Five,achieving 65% for Extraversion and Agreeableness, 55% for Neuroticism, 50% forOpenness and 40% for Conscientiousness. They used data collected from Facebooklike: profile bios, status updates, photos, and number of "Friends". To achieve these

Chapter 2. Related Works 8
results, they included additional cognitive psychology metrics in a multidisciplinaryapproach to increase Facebook personality prediction accuracies. This way, theydemonstrated that the inclusion of additional personality dimensions, specificallythe need for cognition and agreeableness, may be predicted with a high degree ofaccuracy.
Ortigosa, Carro, and Quiroga, 2014 have developed TP2010, a Facebook applica-tion, working with data of 20.988 users. Through it, the users filled in a questionnairebased on ZKPQ-50-cc, corresponding to the five traits of the Alternative Five Model.The authors were able to get the users’ personality (extended with questions relatedto infrequency); then, they have tried to infer personality from interactions of theusers on the social network. They performed a prediction with 3-class and 5-classmodel. The results show that the classifiers obtained a level of accuracy higher than70% for all personality traits.
There are also works that predict the personality traits from Big Five with lessknown social networks, such as Foursquare. Chorley et al., 2013 created an onlinepersonality experiment examining the relationship between Big Five traits and thenumber and types of places visited by Foursquare users. The authors have founda positive correlation between Conscientiousness and the number of places visited,possibly due to the organized routine required to consistently check in at places. Onthe other hand, they also identified a negative correlation between Neuroticism andthe number of places visited.
The variety of data sources and questionnaires used shows that, independentlyof the social network used, predictions of personality can be performed, and thishas opening many opportunities to developers, researchers from Psychology andalso from Computing.
Nevertheless, it is worth highlighting that, although the results of the predictionshave been performed in an "implicit" way, that is, without the need of filling lengthyforms, the prediction of human personality is in an initial stage. As we can observefrom the projects previously mentioned, the level of precision is not as high as thepsychological tests. Yet, we believe that the improvement of the prediction models,the escalation of the amount and type of data available, apart from the internet ofthings, the enhancement of the predictions is a matter of time.
We are especially interested in measuring the curiosity of the users. We identi-fied that this facet is highly correlated with extroversion and openness, according toprevious studies (Kashdan et al., 2009). Curiosity is broadly defined as a desire foracquiring new knowledge and new sensory experience, and widely recognized asan important antecedent of exploration (Litman, Hutchins, and Russon, 2005; Spiel-berger and Starr, 1994). In the psychology domain, it is considered one of the fun-damental strengths and personality traits studied by psychologists (Seligman, 2012;Berlyne, 1954; Reis and Judd, 2000).
The most reliable and practical questionnaire to measure the degree of curiosityof a person is the Curiosity and Exploration Inventory (CEI-II), consisting of only

Chapter 2. Related Works 9
10 items (Kashdan et al., 2009). When we compare the Big Five framework and theCEI-II, the curiosity is considered a lower-order, central facet of openness to experi-ence Kashdan et al., 2009. Further, being in accordance with research Fredrickson,1998 that defines curiosity as a discrete positive affect, we can observe the fig. 2.3,where the curiosity has a large positive correlation with openness (r = .51) and alsowith extroversion (r = .42), considered to be a reflection of positive affection and re-ward sensitivity. As another demonstration of links with psychological flexibility,curiosity was associated with more liberal political values (r = .26). To conclude, ofthe three studies, Kashdan et al., 2009 highlights the strongest correlate of the em-bracing sub-scale of the CEI-II was mindful awareness (low scores reflect greatermindful awareness) (r = .22).
Fig. 2.3: Means, standard deviations, and Pearson correlations between Big Five andCEI-II
2.1 myPersonality
The project myPersonality2 started in June 2007 as David’s personal side project,between his undergraduate and postgraduate studies. Only after it became popular,he decided to consider its research possibilities. Nowadays, myPersonality data isbeing used by more than 200 researchers from 149 universities around the globe.To have the access granted to work with myPersonality data, it is needed to sendthem a request by e-mail, in which has to be explained the objective of the research,besides to mention which data one wants to have access. After approval, an accountis created in the webpage of the project and the user can download the datasets.
The psychological profiles that myPersonality provides is vast and comprisesof questionnaires and scales about satisfaction with life, music preferences or bodyconsciousness, among others. However, we were especially interested in the Big
2http://mypersonality.org

Chapter 2. Related Works 10
Five personality scores, a 20 to 100-item IPIP proxy for Costa and McCrae’s NEO-PI-R domains (Goldberg et al., 2006). With 8 length versions, the participants couldeither decide the length of the questionnaire they want to take, or they can take extraquestions in blocks of 10 until they have finished all 100 items. Appendix A showsthe psychometric test performed by the users.
Regarding the data from Facebook, there are available demographic details suchas basic profile, race, location, education, political and religious views, but also"likes", status, photos and general activity from Facebook, besides Last.FM musiclistening data. The data that we were interested in will be described in Chapter 3.

11
Chapter 3
Methodology
The development methodology of this study was performed in the following steps:
• data collection from myPersonality project;
• development of a database and posterior pre-processing of data;
• correlation analysis and detection of the best predictors for extroversion andopenness;
• generation of the prediction models;
• analysis of the models generated.
The following topics present the details of each step as well as the results ob-tained.
3.1 Data Source
As previously mentioned, the data used in this work were provided by the myPer-sonality project, which is derived by an homonym Facebook application that al-lowed users to take psychometric tests and let their profiles on that web be stored.
The access to the databases has to be granted by their founders, David Stillwelland Michal Kosinski; for that, it is needed to register as a collaborator, specifyingwhich datasets will be used, the student bond which includes a supervisor, and alsothe main goal of the general project, besides accepting the terms of use.
The datasets available for use and analysis are related to psychological profiles,demographic data and the activity on Facebook of the users who took the person-ality tests. The access to some selected files was granted, more specifically to thefollowing datasets:
• demog.csv: basic profile, containing personal (and anonymous) data such asage, gender, relationship status etc.;
• fb_school.csv: schools dictionary, with id and the name of the school;
• user_education.csv: diads between the user and the schools;

Chapter 3. Methodology 12
• freq.csv: Facebook activity, which contains number of likes, friends, among oth-ers;
• big5_domains_item_level.csv: results of the questionnaires Big5, specified by itslength (20, 30, 40, 50, 60, 70, 80, 90 and 100 questions);
• location.csv: location of the users; and
• hometown.csv: their hometown.
After we had the access granted, each of the above mentioned datasets wasdownloaded in comma-separated values (csv) format to then make part of a database,which was built in MySQL 5.5, hosted in the cloud. The creation of this databasewas necessary to make possible the correlation and subsequent analysis among allthe data. In figure 3.1 it is possible to see the relationship between the tables of thedatabase.
Fig. 3.1: Model of the entity-relationship diagram generated by MySQL
It is valuable to mention that some tables have more than one instance (tuple)per user. It can happen in the following tables: big5, since the user could take thepersonality test as many times as wanted; location; hometown; and user_education,since the user can have more than one study. That is why userid is not the PrimaryKey for those tables.
After the database was built, an SQL query was created in order to have it alltogether into a single csv file, for posterior analysis in different softwares. So, weselected the variables we thought it would be valuable for the analysis. A posteriorisome of them could be discarded if they showed to be not relevant. As the goalof this work is to predict the curiosity of the users through their Facebook data,

Chapter 3. Methodology 13
we necessarily need information about at least their Facebook activity (fb_activity),results of their psychometric tests (big5) and, of course, general information aboutthe users (user_profile). As we wanted only the best score of each user from big5table, the boolean column best_protocol = 1, indicating the best score for that user,was used as a filter when retrieving the results.
We performed previous queries in which we detected that several users hadmore than one hometown, location, or school; this way, when retrieving all this dataaltogether, their unique information (e.g. he psychometric test) appeared repeated.That is why we decided not to retrieve that information in the general query.
Then, we ran the SQL code (3.1) into the environment of the R studio tool, thusgenerating an R object that could be used in this environment and also easily ex-ported in csv format, if needed. It have retrieved from our database 1.336.998 in-stances: this will be the size of the dataset we will use in this work.
Listing 3.1: SQL code to retrieve the wanted data from MySQL database
SELECT DISTINCT u . userid , u . gender , u . age , u .r e l a t i o n s h i p _ s t a t u s , u . i n t e r e s t e d _ i n , u . network_size ,
f . n_l ike , f . n_status , f . n_event , f . n_concentrat ion , f . n_group, f . n_work , f . n_education , f . n_tags , f . n_diads ,
b . q1 , b . q3 , b . q4 , b . q7 , b . q10 , b . q14 , b . q16 , b . q18 , b . q21 , b .q23 , b . q24 , b . q29 , b . q31 , b . q33 , b . q34 , b . q39 , b . q41 , b .q43 , b . q44 , b . q49 , b . q51 , b . q53 , b . q54 , b . q59 , b . q61 , b .q63 , b . q64 , b . q69 , b . q71 , b . q73 , b . q74 , b . q79 , b . q81 , b .q83 , b . q84 , b . q89 , b . q91 , b . q93 , b . q94 , b . q99 , b . ex , b . op ,
b . ne , b . ag , b . co , b . qlength , b . no_ans , b . b e s t _ p r o t o c o lFROM u s e r _ p r o f i l e uINNER JOIN f b _ a c t i v i t y fON u . user id = f . user idINNER JOIN big5 bON u . user id = b . user idWHERE b . b e s t _ p r o t o c o l = ’ 1 ’
3.2 Preprocessing
After having performed the query to retrieve all the relevant data we want from theoriginal dataset, we got 1.336.998 tuples as stated above. From the complete dataset,we have that 62.6% of the users are identified as female and the other 37.4%, asmale. Additionally, 35.3% are single, and 29.9% did not mention their relationshipstatus. Table 3.1 gives us an overview on the numeric columns of the dataset. Thedata taken from the psychometric tests are complete, which does not happen withthe other variables. That is because only 30%-40% of users have given their consent

Chapter 3. Methodology 14
in sharing their Facebook profile data for research; in addition, not all users tellFacebook about their age, for instance (Kosinski et al., 2015).
Table 3.1: Summary of the complete dataset
Label n Mean SD Min Max
age 795,740 26.65 9.37 1 112network_size 1,122,512 227.73 245.32 1 5008n_like 180,461 218.83 404.94 1 4819n_status 115,802 142.38 162.54 1 2450n_event 13,216 27.86 83.51 1 2840n_concentration 41,798 1.60 .96 1 12n_group 159,600 32.37 45.06 1 812n_work 580,491 1.09 .47 1 44n_education 650,748 1.25 .69 1 19n_tags 644,529 28.08 91.90 1 3081n_diads 409,515 66.92 161.28 2 5057ex 1,336,998 3.60 .80 1 5op 1,336,998 3.82 .67 1 5
Then, some preprocessing analysis were performed with the dataset by means ofthe tool R. First of all, the columns related to binary data, such as gender, or relatedto classification, such as relationship status, were converted to type factor.
Next, we divided the dataset by length of questionnaires. This way, we obtained9 smaller datasets, from big5_20 (with 724.115 observations) to big5_100 (with 254.052observations). Then, we removed all users who have not completed the entire ques-tionnaire; this was recorded during the realization of the psychometric test by thecolumn no_ans, which indicates the number of questions that the user has not filledin. We did this for all the 9 datasets. We then removed this column and also thecolumn qlength, which denotes the size of the questionnaire taken for each user andwas used here only for sub-setting the datasets.
3.3 Correlation Analysis
Having all datasets separated by length of questionnaire, a correlation analysis wasperformed for each of them, in order to find the individual values of correlation forthe different questionnaire lengths and, then, analyze which of them obtains the bestscore. Table 3.2 shows the result we obtained for the main numeric variables of thedatasets.
The correlations highlighted in bold denote the best score for each feature, whereit is possible to see that the dataset that obtained the best score is the one of 90questions (big5_90). Thus, we are going to use this dataset to perform the subsequentanalyses. Tables 3.3 depicts the summary of this dataset. Its correlation matrix (lowertriangle) is shown in 3.4, where it is possible to observe the meaningful correlationbetween extroversion and openness, which reinforces the strong correlation between

Chapter 3. Methodology 15
Table 3.2: Correlation analysis between all lengths of questionnaires
20 30 40 50 60 70 80 90 100ex op ex op ex op ex op ex op ex op ex op ex op ex op
age -.05 -.02 -.05 -.01 -.03 .01 -.04 .02 -.04 -.02 -.02 -.01 -.02 .02 .00 .01 .01 .04network_size .16 .03 .17 .05 .17 .02 .19 .02 .20 .04 .19 .05 .20 .01 .21 .05 .19 .01n_like .03 .03 .06 .04 .05 .03 .04 .00 .01 -.01 .09 .04 .06 .05 -.03 -.06 .02 .02n_status .09 .05 .13 .07 .08 .04 .09 .05 .07 .05 .11 .03 .19 .01 .16 .04 .08 .04n_event .05 .04 .07 .00 .09 .03 .04 .10 -.01 .11 .16 -.01 -.09 .03 .19 .03 .07 .01n_concentration .02 .06 .02 .08 .06 .09 .02 .08 .05 .06 .04 .13 .02 .07 .06 .14 .03 .09n_group .05 .05 .07 .07 .04 .06 .08 .04 .08 .02 .07 .06 -.01 .05 .03 .01 .05 .04n_work .01 .03 .00 .03 .00 .03 .01 .03 -.02 .03 -.02 .04 .00 .04 .03 .02 .00 .03n_education -.01 .03 -.02 .03 .01 .02 .00 .05 -.02 .03 -.01 .04 .00 .04 .00 .04 -.02 .04n_tags .03 .01 .03 .01 .04 .01 .03 .01 .02 .02 .02 .03 .00 .01 .05 .03 .02 .01n_diads .02 .00 .00 .01 .04 .01 .02 .03 .01 .01 .02 .04 .04 -.01 .06 .05 .02 .01
them and the curiosity, as explained in Chapter 2. We also find moderate correlationsbetween other variables, such as number of dyads and tags (r = .47); number offriends and groups (r = .43); number of work and education (r = .38).
Table 3.3: Summary of dataset big5_90
Labels n Mean SD Min Max
age 3,240 26.36 8.92 15 110network_size 4,659 215.41 208.64 1 3097n_like 686 209.85 371.58 1 3349n_status 448 141.92 144.18 1 959n_event 56 35.73 79.33 1 553n_concentration 171 1.51 .71 1 4.00n_group 621 34.93 47.33 1 350n_work 2,535 1.09 .49 1 11.00n_education 2,736 1.22 .64 1 6.00n_tags 2,472 30.75 102.16 1 1372n_diads 1,667 63.47 143.20 2 1456ex 5,434 3.52 .76 1.17 5.00op 5,434 3.91 .52 1.06 5.00
We also performed a transformation in the dataset, changing the variables ex andop to a factor(ordinal) type. For this, we grouped them into 3 categories: slightly, forex and op levels from 1 to 2.33; moderately, from 2.34 to 3.67; and extremely, from 3.68to 5. Our goal is to develop a classification model besides the regression models, asit will be described in Section 4.1. The data distribution, that is, the extent of usersby level of ex and op (Table 3.5) is not uniform; as we can see, the class slightly isunder represented in our set, which will be discussed later. Table 3.6 shows side byside the correlation values obtained with both approaches, where the best scores arehighlighted in bold. We found that the correlation values obtained are slightly betterwhen we deal with ex and op as factor variables, although not that much different.
1R could not compute the correlation for 5 variables, which are here represented by NA.

Chapter 3. Methodology 16
Table 3.4: Pairwise correlation analysis of dataset big5_90. Significant correlations at p< 0.05 level are shown in bold
age
netw
ork_
size
n_lik
e
n_st
atus
n_ev
ent
n_co
ncen
trat
ion
n_gr
oup
n_w
ork
n_ed
ucat
ion
n_ta
gs
n_di
ads
ex op
age 1network_size -.11 1n_like -.21 .14 1n_status -.16 .24 .23 1n_event .09 .25 -.13 .37 1n_concentration .09 .04 -.02 .15 -.05 1n_group -.10 .43 .36 .27 .15 -.05 1n_work -.02 .06 -.06 .13 -.01 .05 .02 1n_education .03 .08 -.17 .01 -.09 .21 -.06 .38 1n_tags -.02 .22 .03 .32 .40 -.03 .18 .20 .33 1n_diads .04 .33 -.07 .41 .09 .08 .17 .22 .35 .47 1ex .00 .21 -.03 .16 .19 .06 .03 .03 .00 .05 .06 1op .01 .05 -.06 .04 .03 .14 .01 .02 .04 .03 .05 .23 1
Table 3.5: Distribution of the levels for ex and op
Slightly Moderately Extremelyex 440 2543 2451op 19 1782 3633
Table 3.6: Comparison between the correlation matrix for ex and op as factor and nu-meric variables, respectively
Factor Numericex op ex op
age .00 -.01 .00 .01network_size .23 .07 .21 .05n_like -.02 NA1 -.03 -.06n_status .12 NA .16 .04n_event .37 NA .19 .03n_concentration -.02 NA .06 .14n_group .02 NA .03 .01n_work .03 .05 .03 .02n_education .01 .04 .00 .04n_tags .05 .02 .05 .03n_diads .05 .06 .06 .05ex 1 .25 1 .23

Chapter 3. Methodology 17
3.4 PCA - Principal Components Analysis
In order to better understand how is the data structured and simplify the modelgeneration, we performed a PCA analysis for the dataset big5_90 with the help ofFactoMineR package, taking ex and op as supplementary variables (as these are theones we want to predict), and also normalizing the variables to have standard de-viation equals to 1. Table 3.2 shows its summary. Fig. 3.3 depicts a matrix witheigenvalues. Fig. 3.4 depicts the correlation between variables and PCs.
Fig. 3.2: Summary of the PCA analysis
Fig. 3.5 displays the first two principal components, which explain approxi-mately 40% of the variance in our dataset. The two supplementary variables arein blue. Fig. 3.6 shows only the five variables that have the highest contribution toexplain the data.
The Proportion of Variance Explained (PVE) helps us to identify the variablesthat most influence the variance of each Principal Component. PVE is a positivequantity and the cumulative sum of PVEs will be 100%. A scree plot (Fig. 3.7),which displays the PVE on the vertical axis and the number of principal componentsfound, could help deciding how many principal components should be chosen.

Chapter 3. Methodology 18
Fig. 3.3: matrix with eigenvalues
Fig. 3.4: Correlation between variables and PCs
Fig. 3.5: Variables factor map

Chapter 3. Methodology 19
Fig. 3.6: Variables factor map depicting the 5 most important ones
Fig. 3.7: Scree plot for Principal Components and Variance

Chapter 3. Methodology 20
3.5 Correlation for Population
We were also interested in finding if there is any correlation between the size ofthe city of the user (whether hometown or current location) and their degrees ofextroversion and openness. To do so, we performed a specific query in order to getthis information from the DB. As preprocessing, we removed NA values, besides thecases in which the population was 0. It can be explained by the fact that not alwaysthe users type a valid or correct city name. We also removed duplicated cities for thesame user.
After the preprocessing, we binded this information with their degrees of extro-version and openness (from the previous complete dataset). Then, we got a dataframe with 266.697 entries for hometown, and 198.320 entries for location. The re-sults below (Tables 3.7 and 3.8) show that there is not a significant correlation be-tween the size of the city of the user and his degree of extroversion and openness.
Table 3.7: Correlation between ex, op, and population of hometown
p.ho
me
ex op
p.home 1ex .01 1op .03 .16 1
Table 3.8: Correlation between ex, op, and population of location
p.lo
c
ex op
p.loc 1ex .00 1op .00 .16 1
After those preliminary analysis, it was time to generate the models based onthe correlations and previous analysis performed. We separately generated a linearregression for extroversion, then another one for openness.

21
Chapter 4
Models, Results and Discussion
4.1 Regression Model
In order to understand the causal relationship between the variables and performfurther prediction of the levels of ex and op, we built some regression models, multi-ple and multivariate. We separate our dataset into train (75%) and test (25%) sets.
Fig. 4.1: Multiple regression for extroversion
Figs. 4.1 and 4.2 show the summary of the multiple linear regression model. Firstof all, it is possible to see that for extroversion there are more significant p-values(p < .05), for the predictor variables age, network_size, n_group, n_education, andn_tags. For openness, the predictor variables network_size and n_education containsignificant p-values. The p-values of the model in general (< 2× 10⁻¹⁶ for extrover-sion and .000458 for openness) would lead us to consider this model as statisticallysignificant.

Chapter 4. Models, Results and Discussion 22
Fig. 4.2: Multiple regression for openness
We then used the test set to predict the values for ex and op in order to validateour model. The results show a correlation accuracy between the actual and the pre-dicted values of .16 for extroversion and .04 for openness. Thus, this model wouldneed to be improved to be used for predict the levels of ex and op of the users at asignificance level.

Chapter 4. Models, Results and Discussion 23
4.2 Principal Component Regression
In order to compare different models, we also performed a PCR - Principal Compo-nent Regression, a regression technique based on the principal component analysis.In order to corroborate our findings of the best dataset to use in the model gener-ation, we performed the PCR on the biggest dataset (big5_20) and in the datasetwhich obtained the best correlation results as already related previously (big5_90).We set it to compute a ten-fold cross-validation error. As it can be seen in the Figs.4.3 and 4.4, the last one obtained slightly better results if we look at the percentageof variance explained of each variable, thus justifying its use in the further steps.
Fig. 4.3: Results of the PCR for extroversion with the dataset big5_20
Fig. 4.4: Results of the PCR for extroversion with the dataset big5_90
Now using the dataset big5_90, the graph of the RMSEP (Fig. 4.5) shows that wedo not get an error lower than 72%. Nevertheless, from the fourth component, theerror significantly decreases, and the summary shows that with 5 components it ispossible to explain 63.7% of all the variance, so we decided to select 5 componentsto build our model.
Listing 4.1: PCR code for extroversion
smp_ s i z e <− f l o o r ( 0 . 7 5 ∗ nrow ( big5 _90_models ) )s e t . seed ( 3 )t r a i n _ ind <− sample ( seq_ len ( nrow ( big5 _90_models ) ) , s i z e = smp
_ s i z e )

Chapter 4. Models, Results and Discussion 24
Fig. 4.5: Root-Mean-Square Error of Prediction by number of components
c o l s <− c ( 1 : 1 1 , 13)t r a i n <− big5 _90_models [ t r a i n _ ind , ]y_ t e s t _ex <− big5 _90_models[− t r a i n _ ind , 12]# t h e o t h e r v a r i a b l e s o f t h e d a t a s e tt e s t _ex <− big5 _90_models[− t r a i n _ ind , c o l s ]s e t . seed ( 1 )model_ pcr _ex <− pcr ( t r a i n $ex~ . , data = t r a i n , s c a l e = TRUE,
v a l i d a t i o n = "CV" )pcr _pred_ex <− predic t ( model_ pcr _ex , t e s t _ex , ncomp = 5)#MSEmean ( ( pcr _pred_ex − y_ t e s t _ex ) ^2)# 0 .596actxpred _ex <− cbind ( y_ t e s t _ex , pcr _pred_ex )cor _ accur _ pcrex <− cor ( actxpred _ex )# 0 .0164
Listing 4.2: PCR code for openness
model_ pcr _op <− pcr ( t r a i n $op~ . , data = t r a i n , s c a l e = TRUE,v a l i d a t i o n = "CV" )
pcr _pred_op <− predic t ( model_ pcr _op , t e s t _op , ncomp = 5)mean ( ( pcr _pred_op − y_ t e s t _op ) ^2)# 0 .275actxpred _op <− cbind ( y_ t e s t _op , pcr _pred_op )cor _ accur _pcrop <− cor ( actxpred _op )# 0 .135

Chapter 4. Models, Results and Discussion 25
First of all, we divided the dataset into training (75%) and test (25%) sets. Then,we performed again the PCR on the training set and evaluate its test set perfor-mance, defining the amount of components we wanted to use: 5. The MSE foundwas .60 for extroversion and .28 para openness. Then, we put together in a newdataframe the predicted and the actual values for both, and the correlation analysisfound for extroversion and openness were .01 and .14, respectively.
Chapter 4. Models, Results and Discussion 26
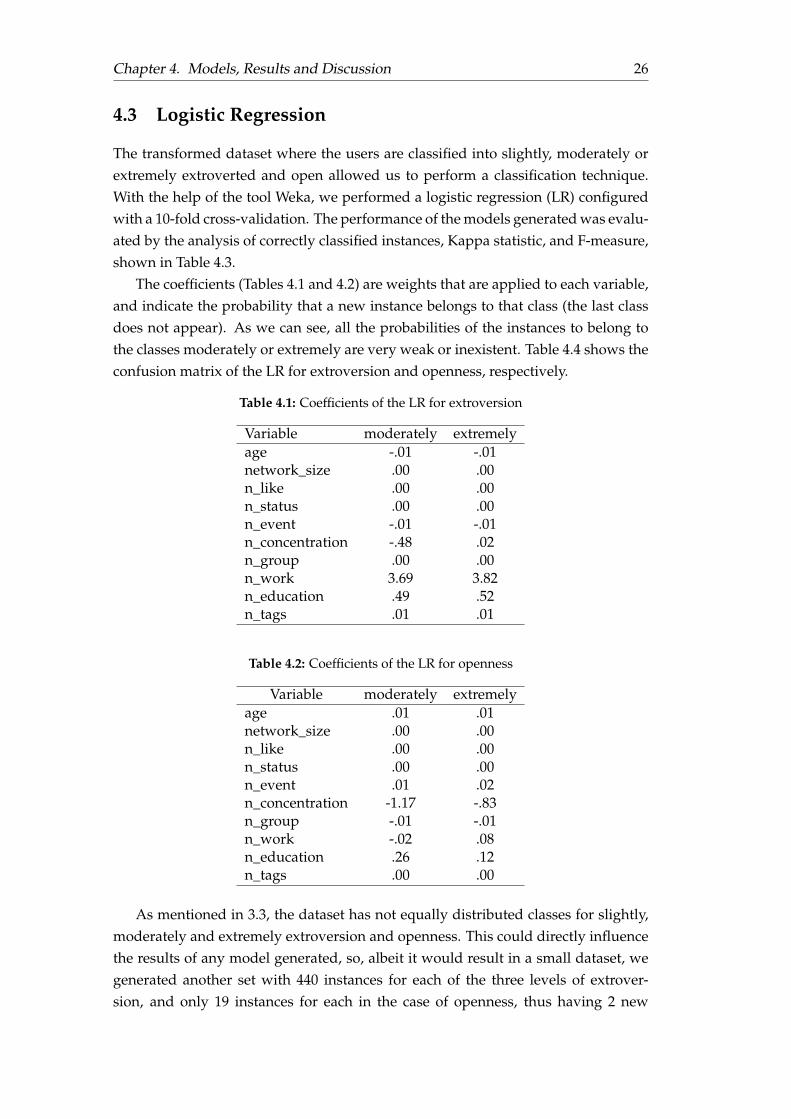
4.3 Logistic Regression
The transformed dataset where the users are classified into slightly, moderately orextremely extroverted and open allowed us to perform a classification technique.With the help of the tool Weka, we performed a logistic regression (LR) configuredwith a 10-fold cross-validation. The performance of the models generated was evalu-ated by the analysis of correctly classified instances, Kappa statistic, and F-measure,shown in Table 4.3.
The coefficients (Tables 4.1 and 4.2) are weights that are applied to each variable,and indicate the probability that a new instance belongs to that class (the last classdoes not appear). As we can see, all the probabilities of the instances to belong tothe classes moderately or extremely are very weak or inexistent. Table 4.4 shows theconfusion matrix of the LR for extroversion and openness, respectively.
Table 4.1: Coefficients of the LR for extroversion
Variable moderately extremelyage -.01 -.01network_size .00 .00n_like .00 .00n_status .00 .00n_event -.01 -.01n_concentration -.48 .02n_group .00 .00n_work 3.69 3.82n_education .49 .52n_tags .01 .01
Table 4.2: Coefficients of the LR for openness
Variable moderately extremelyage .01 .01network_size .00 .00n_like .00 .00n_status .00 .00n_event .01 .02n_concentration -1.17 -.83n_group -.01 -.01n_work -.02 .08n_education .26 .12n_tags .00 .00
As mentioned in 3.3, the dataset has not equally distributed classes for slightly,moderately and extremely extroversion and openness. This could directly influencethe results of any model generated, so, albeit it would result in a small dataset, wegenerated another set with 440 instances for each of the three levels of extrover-sion, and only 19 instances for each in the case of openness, thus having 2 new

Chapter 4. Models, Results and Discussion 27
datasets with 1320 and 57, respectively. We wanted to check how the logistic regres-sion would behave, however the results were not significant, so we decided to omitit in this work and discarded it.
Table 4.3: Logistic Regression (LR) results for extroversion and openness
CorrectlyClassifiedInstances
KappaStatistic
AverageF-measure
LR for Extroversion 51.18% 0.09 0.47LR for Openness 66.78% -0.001 0.54
Table 4.4: LR confusion matrix for Extroversion (a) and Openness (b)
(a) (b)a b c classified as a b c classified as1914 627 2 a = moderately 3629 4 0 a = moderately1582 867 2 b = extremely 1782 0 0 b = extremely379 61 0 c = slightly 19 0 0 c = slightly
4.4 Comparison
As we saw in the previous chapter, we performed regression and classification anal-ysis for extroversion and openness. When we look at the results obtained, the multi-ple regression models allow us to check the predictor variables that are more signifi-cant in each of them, where we did found some interesting similarities. For instance,the variables network_size is significant for both ex and op. However, the accuracycorrelation for the regression models and the kappa for the logistic regression didnot obtain satisfactory results.
In the Principal Component Analysis, we can see that the correlation accuracy forthe model generated is not significant; it could be that the dataset is not distributedin some way that allows the combinations of variables into components to then havesome applicable model.
Regarding the logistic regression performed through Weka, this classificationanalysis also showed not to be valuable for the dataset we are working on. Here,it is important to highlight that the considerable amount of NA values can have con-tributed to the low values found for accuracy; and when those values were omitted,the amount of the dataset was not considerably big to guarantee the confidence ofthe models
Similarly to the results found in Kosinski et al., 2014 with the same data source,extroversion obtained a better result than openness, which means that the Facebookprofile of a person could better explain how extroverted the person is, but not hisopenness to new experiences. In addition, to predict ex and op we followed the samesteps described in Menk and Sebastiá, 2016 to predict the curiosity, however we did

Chapter 4. Models, Results and Discussion 28
not achieve the same results, perhaps due to the lack of data, such as the placesvisited
4.5 Limitations
The first and most important limitation we found during the development of thiswork was the huge amount of null values. The users who participated on myPerson-ality project were offered to answer the 0-100 IPIP proxy questionnaire to measurethe five traits of their personality. In exchange, they were asked to disclose the accessand storage of their Facebook profiles, but it was not mandatory. As a result, around40% of the more than 7 million participants have shared their online profiles only.It led us to find several NA values for their Facebook features, which have possiblyinfluenced the weak results on the models we generated.
The data related to the level of education of the users may not reflect the reality.The variable n_education is a result of the sum of the schools that the user has insertedinto their Facebook account. It is literally the number of education institutions listedon the individual’s profile. For instance, John1 might put his high school, under-graduate university, and Master university; in this case, he has 3 for n_education.Mary1 might put her primary, secondary and undergraduate school. She also has 3for n_education, however John has a postgraduate level, while she has a graduatelevel. That means it is not possible to determine the level of education (undergradu-ate, postgraduate etc.) of the person through this variable.
Another work motivated us to investigate about ways to predict the curiosity ofthe user (Menk and Sebastiá, 2016). One of the strong correlations they found wasregarding the places visited, where the more places visited, the more curious tend isa person. We were also interested in check this correlation in our work, but we werenot able to do so, because the project myPersonality does not have any informationabout the places the person visited.
1John and Mary are assumed names

29
Chapter 5
Conclusion and Future Work
5.1 Conclusions
Online data can tell a lot about ourselves. In recent days, the prediction of per-sonality has been performed increasingly faster, easier and more accurately. Fasterbecause the lengthy forms are no longer required; easier because the predictions canbe performed by only sharing data from social networks; and more accurately dueto the increasing extent of intimate data available on social networks.
In order to contribute in this scenario, this work focused on analyzing two ofthe Big Five traits of human personality, extroversion and openness to experience,which are strongly correlated to the curiosity. We aimed to predict those traits basedon the Facebook profile of the users, by using Facebook and psychometric data frommyPersonality project.
We first looked at the current digital world, which is in quickly expansion. Suchhuge amount of information available online opens a new challenge and also anopportunity in making sense of that data, and somehow use it for our well-being,though also for economic purposes.
Thus, its use for mapping personality’s people is a reality. We reviewed the wayspersonality can be measured and, as we were interested in the curiosity, we wantedto be able to predict it through a different perspective: the traits extroversion andopenness to experience, two traits of Big Five, since studies have shown strong cor-relations between them and the curiosity.
The project myPersonality was the way we find to develop our idea; more than 7million people took an online questionnaire to measure their big five traits, and partof those users shared their Facebook profile information for research purposes.
So, we first investigate the correlations between extroversion and openness andthe Facebook features, such as number of friends, number of education etc., besidesto perform a principal component analysis to help the understanding the compo-sition of the data. Then, we built some prediction models, by means of classifica-tion and regression techniques, with the help of the tools R and Weka, respectively.Although both models did not show significant results, the multiple regression al-lowed us to identify some significant variables, such as the number of friends (net-work_size) and the number of education. Similarly to other project that analyzed the

Chapter 5. Conclusion and Future Work 30
five traits, the models we generated shown a weak correlation and would need to beimproved in order to predict extroversion and openness accurately and confidently.
5.2 Future Work
As future work, regarding the issue about the education level, mentioned in 4.5, theinformation related to the education could be deeper analyzed in order to classifythe users into levels of education, which could be used for further predictions.
Another study that could be performed is regarding the correlation existent be-tween curiosity, measured by the CEI-II questionnaire and extroversion and open-ness, measured by the Big5 questionnaires (IPIP proxy for Costa and McCrae’s NEO-PI-R domains in the case of myPersonality project). It could be developed a formulain order to convert the two variables ex and op into a single variable, curiosity, tak-ing into account the weighted correlation between each of them and the curiosity. Itwould be interesting to analyze the correlations with this only variable, but also itcould ease the comparison between other questionnaires that measure this humanfacet, and the comparison between other projects that also aim to predict the curios-ity.
People may have several profiles online, whether on Facebook or other socialnetworks, such as Linkedin, Twitter etc. Future projects could inspect the possibilityto get different profiles and merge them into a single online-user profile, which couldimprove future prediction models.
In this thesis, we focused on two of the five traits of personality. Future workscould include the other traits, in order to search for further correlations. It also couldbe investigated other models of personality instead of the BigFive, and establishcorrelations between them.

31
Appendix A
Big Five Questionnaire (100 items)used in myPersonality
The Big Five Personality Questionnaire
Below, there are phrases describing people’s behaviors. Please use the rating scale todescribe how accurately each statement describes you. Describe yourself as yougenerally are now, not as you wish to be in the future. Rate yourself as you honestly seeyourself, in relation to other people you know of the same sex as you are, and roughlyyour same age. If you are unsure of which response to choose (e.g. you act one way in acertain situation. and another way in a different situation), choose the response whichfeels most "natural" to you.
So that you can describe yourself in an honest manner, your answers to individualquestions cannot be seen by others, only the overall calculation of your personalitytraits.
Phrase:Stronglydisagree
DisagreeNeither agreenor disagree
AgreeStrongly
agreeI am the life of the party 1 2 3 4 5I leave things unfinished 1 2 3 4 5I rarely look for a deepermeaning in things 1 2 3 4 5I cut others to pieces 1 2 3 4 5I am not easily frustrated 1 2 3 4 5I keep in the background 1 2 3 4 5I am always prepared 1 2 3 4 5I have difficulty understandingabstract ideas 1 2 3 4 5I suspect hidden motivesin others 1 2 3 4 5I seldom feel blue 1 2 3 4 5I talk to a lot of differentpeople at parties 1 2 3 4 5I pay attention to details 1 2 3 4 5I avoid philosophicaldiscussions 1 2 3 4 5I make people feel at ease 1 2 3 4 5I am very pleased with myself 1 2 3 4 5I know how to captivate people 1 2 3 4 5I waste my time 1 2 3 4 5

Appendix A. Big Five Questionnaire (100 items) used in myPersonality 32
Phrase:Stronglydisagree
DisagreeNeither agreenor disagree
AgreeStrongly
agreeI do not like art 1 2 3 4 5I have a sharp tongue 1 2 3 4 5I often feel blue 1 2 3 4 5I make friends easily 1 2 3 4 5I complete tasks successfully 1 2 3 4 5I can say things beautifully 1 2 3 4 5I treat all people equally 1 2 3 4 5I rarely get irritated 1 2 3 4 5I find it difficultto approach others 1 2 3 4 5I do just enough workto get by 1 2 3 4 5I enjoy thinking about things 1 2 3 4 5I respect others 1 2 3 4 5I dislike myself 1 2 3 4 5I warm up quickly to others 1 2 3 4 5I do things according to a plan 1 2 3 4 5I am not interested intheoretical discussions 1 2 3 4 5I am easy to satisfy 1 2 3 4 5I feel comfortable with myself 1 2 3 4 5I start conversations 1 2 3 4 5I shirk my duties 1 2 3 4 5I tend to vote for liberalpolitical candidates 1 2 3 4 5I get back at others 1 2 3 4 5I am filled withdoubts about things 1 2 3 4 5I would describe myexperiences as somewhat dull 1 2 3 4 5I make a mess of things 1 2 3 4 5I have a vivid imagination 1 2 3 4 5I contradict others 1 2 3 4 5I rarely lose my composure 1 2 3 4 5I have little to say 1 2 3 4 5I don’t put my mind onthe task at hand 1 2 3 4 5I have a rich vocabulary 1 2 3 4 5I accept people as they are 1 2 3 4 5I am often down in the dumps 1 2 3 4 5I retreat from others 1 2 3 4 5I carry out my plans 1 2 3 4 5I believe that too much taxmoney goes to support artists 1 2 3 4 5I hold a grudge 1 2 3 4 5I am relaxed most of the time 1 2 3 4 5I don’t talk a lot 1 2 3 4 5I follow through with my plans 1 2 3 4 5I do not like poetry 1 2 3 4 5I insult people 1 2 3 4 5I fear for the worst 1 2 3 4 5I cheer people up 1 2 3 4 5I get chores done right away 1 2 3 4 5I enjoy hearing new ideas 1 2 3 4 5I make demands on others 1 2 3 4 5

Appendix A. Big Five Questionnaire (100 items) used in myPersonality 33
Phrase:Stronglydisagree
DisagreeNeither agreenor disagree
AgreeStrongly
agreeI panic easily 1 2 3 4 5I keep others at a distance 1 2 3 4 5I find it difficult toget down to work 1 2 3 4 5I tend to vote for conservativepolitical candidates 1 2 3 4 5I believe that I am betterthan others 1 2 3 4 5I feel threatened easily 1 2 3 4 5I am hard to get to know 1 2 3 4 5I need a push to get started 1 2 3 4 5I do not enjoy goingto art museums 1 2 3 4 5I trust what people say 1 2 3 4 5I am not easily botheredby things 1 2 3 4 5I don’t mind being thecenter of attention 1 2 3 4 5I don’t see things through 1 2 3 4 5I am not interested inabstract ideas 1 2 3 4 5I have a good word for everyone 1 2 3 4 5I get stressed out easily 1 2 3 4 5I don’t like to drawattention to myself 1 2 3 4 5I make plans and stick to them 1 2 3 4 5I enjoy wild flights of fantasy 1 2 3 4 5I am concerned about others 1 2 3 4 5I have frequent mood swings 1 2 3 4 5I am skilled in handlingsocial situations 1 2 3 4 5I finish what I start 1 2 3 4 5I get excited by new ideas 1 2 3 4 5I am out for my ownpersonal gain 1 2 3 4 5I seldom get mad 1 2 3 4 5I feel comfortable aroundpeople 1 2 3 4 5I am exacting in my work 1 2 3 4 5I believe in the importanceof art 1 2 3 4 5I believe that others havegood intentions 1 2 3 4 5I remain calm under pressure 1 2 3 4 5I avoid contact with others 1 2 3 4 5I mess things up 1 2 3 4 5I carry the conversationto a higher level 1 2 3 4 5I sympathize withothers’ feelings 1 2 3 4 5I worry about things 1 2 3 4 5
34
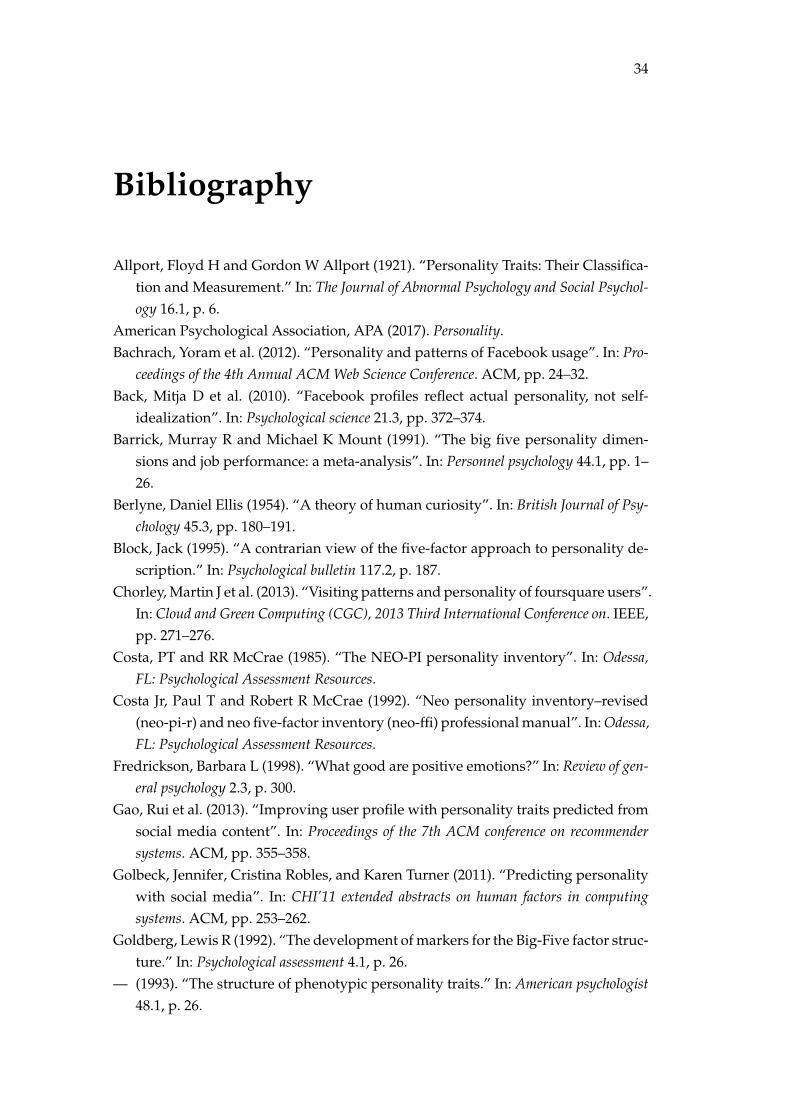
Bibliography
Allport, Floyd H and Gordon W Allport (1921). “Personality Traits: Their Classifica-tion and Measurement.” In: The Journal of Abnormal Psychology and Social Psychol-ogy 16.1, p. 6.
American Psychological Association, APA (2017). Personality.Bachrach, Yoram et al. (2012). “Personality and patterns of Facebook usage”. In: Pro-
ceedings of the 4th Annual ACM Web Science Conference. ACM, pp. 24–32.Back, Mitja D et al. (2010). “Facebook profiles reflect actual personality, not self-
idealization”. In: Psychological science 21.3, pp. 372–374.Barrick, Murray R and Michael K Mount (1991). “The big five personality dimen-
sions and job performance: a meta-analysis”. In: Personnel psychology 44.1, pp. 1–26.
Berlyne, Daniel Ellis (1954). “A theory of human curiosity”. In: British Journal of Psy-chology 45.3, pp. 180–191.
Block, Jack (1995). “A contrarian view of the five-factor approach to personality de-scription.” In: Psychological bulletin 117.2, p. 187.
Chorley, Martin J et al. (2013). “Visiting patterns and personality of foursquare users”.In: Cloud and Green Computing (CGC), 2013 Third International Conference on. IEEE,pp. 271–276.
Costa, PT and RR McCrae (1985). “The NEO-PI personality inventory”. In: Odessa,FL: Psychological Assessment Resources.
Costa Jr, Paul T and Robert R McCrae (1992). “Neo personality inventory–revised(neo-pi-r) and neo five-factor inventory (neo-ffi) professional manual”. In: Odessa,FL: Psychological Assessment Resources.
Fredrickson, Barbara L (1998). “What good are positive emotions?” In: Review of gen-eral psychology 2.3, p. 300.
Gao, Rui et al. (2013). “Improving user profile with personality traits predicted fromsocial media content”. In: Proceedings of the 7th ACM conference on recommendersystems. ACM, pp. 355–358.
Golbeck, Jennifer, Cristina Robles, and Karen Turner (2011). “Predicting personalitywith social media”. In: CHI’11 extended abstracts on human factors in computingsystems. ACM, pp. 253–262.
Goldberg, Lewis R (1992). “The development of markers for the Big-Five factor struc-ture.” In: Psychological assessment 4.1, p. 26.
— (1993). “The structure of phenotypic personality traits.” In: American psychologist48.1, p. 26.

BIBLIOGRAPHY 35
Goldberg, Lewis R et al. (1999). “A broad-bandwidth, public domain, personality in-ventory measuring the lower-level facets of several five-factor models”. In: Per-sonality psychology in Europe 7.1, pp. 7–28.
Goldberg, Lewis R et al. (2006). “The international personality item pool and the fu-ture of public-domain personality measures”. In: Journal of Research in personality40.1, pp. 84–96.
Gosling, Samuel D et al. (2011). “Manifestations of personality in online social net-works: Self-reported Facebook-related behaviors and observable profile informa-tion”. In: Cyberpsychology, Behavior, and Social Networking 14.9, pp. 483–488.
IDC, EMC Digital Universe with Research & Analysis by (2014). Data Growth, Busi-ness Opportunities, and the IT Imperatives.
IPIP (2017). International Personality Item Pool.John, Oliver P and Sanjay Srivastava (1999). “The Big Five trait taxonomy: History,
measurement, and theoretical perspectives”. In: Handbook of personality: Theoryand research 2.1999, pp. 102–138.
John Oliver P., Robins Richard W. Pervin Lawrence A. (2008). Handbook of personality:Theory and research. 3rd ed. Pearson. ISBN: 978-1-59385-836-0.
Kashdan, Todd B et al. (2009). “The curiosity and exploration inventory-II: Devel-opment, factor structure, and psychometrics”. In: Journal of research in personality43.6, pp. 987–998.
Kosinski, Michal, David Stillwell, and Thore Graepel (2013). “Private traits and at-tributes are predictable from digital records of human behavior”. In: Proceedingsof the National Academy of Sciences 110.15, pp. 5802–5805.
Kosinski, Michal et al. (2014). “Manifestations of user personality in website choiceand behaviour on online social networks”. In: Machine learning 95.3, pp. 357–380.
Kosinski, Michal et al. (2015). “Facebook as a research tool for the social sciences:Opportunities, challenges, ethical considerations, and practical guidelines.” In:American Psychologist 70.6, p. 543.
Litman, Jordan, Tiffany Hutchins, and Ryan Russon (2005). “Epistemic curiosity,feeling-of-knowing, and exploratory behaviour”. In: Cognition & Emotion 19.4,pp. 559–582.
Marcus, Bernd, Franz Machilek, and Astrid Schütz (2006). “Personality in cyberspace:personal Web sites as media for personality expressions and impressions.” In:Journal of personality and social psychology 90.6, p. 1014.
McCrae, Robert R and Paul T Costa (1987). “Validation of the five-factor model ofpersonality across instruments and observers”. In: Journal of personality and socialpsychology 52.1, p. 81.
Menk, Alan and Laura Sebastiá (2016). “Predicting the Human Curiosity from Users’Profiles on Facebook”. In: Proceedings of the 4th Spanish Conference on InformationRetrieval. ACM, p. 13.

BIBLIOGRAPHY 36
Ortigosa, Alvaro, Rosa M Carro, and José Ignacio Quiroga (2014). “Predicting userpersonality by mining social interactions in Facebook”. In: Journal of computer andSystem Sciences 80.1, pp. 57–71.
Phillips, Sarah (2007). A brief history of Facebook.Poropat, Arthur E (2009). “A meta-analysis of the five-factor model of personality
and academic performance”. In: Psychological bulletin 135.2, p. 322.Reis, Harry T and Charles M Judd (2000). Handbook of research methods in social and
personality psychology. Cambridge University Press.Segalin, Cristina et al. (2015). “What your Facebook Profile Picture Reveals about
your Personality : A Feature-based Approach”. In: ACM - Association for Comput-ing Machinery.
Seligman, Martin EP (2012). Positive psychology in practice. John Wiley & Sons.Solinger, Carrie et al. (2014). “Beyond Facebook Personality Prediction”. In: Interna-
tional Conference on Social Computing and Social Media. Springer, pp. 486–493.Spielberger, Charles D and Laura M Starr (1994). “Curiosity and exploratory behav-
ior”. In: Motivation: Theory and research, pp. 221–243.Srivastava, Sanjay (2006). “Measuring the Big Five personality factors”. In: Retrieved
October 11, p. 2009.