
Industrial research versus development investment: The implications of financial constraints
27
Industrial research versus development investment: The implications of financial constraints Dirk Czarnitzki, Hanna Hottenrott and Susanne Thorwarth DEPARTMENT OF MANAGERIAL ECONOMICS, STRATEGY AND INNOVATION (MSI) Faculty of Business and Economics OR 0905
-
Upload
independent -
Category
Documents
-
view
0 -
download
0
Transcript of Industrial research versus development investment: The implications of financial constraints

Industrial research versus development investment:The implications of financial constraints
Dirk Czarnitzki, Hanna Hottenrott and Susanne Thorwarth
DEPARTMENT OF MANAGERIAL ECONOMICS, STRATEGY AND INNOVATION (MSI)
Faculty of Business and Economics
OR 0905

Non-technical Summary
Industrial research and development (R&D) activities constitute an important driver of
economic competitiveness. The impact of R&D on productivity at the firm level stems from
the implementation of newly generated knowledge and technological discoveries into new
products, processes or services. Particularly the ‘R’ component of R&D has been found to
drive productivity at the firm level. That is firms that invest a larger fraction of their total
R&D on research (relative to development) are more productive both in terms of the
production of new knowledge, e.g. patens as well as overall factor productivity.
However, economic theory suggests that two types of market failure affect private
investments in research. First, private rates of return from research activities are smaller than
social rates of return because of the incompleteness of appropriability of the knowledge that is
being created by investment. Second, especially for (basic) research firms may face
difficulties in attracting external investors or get bank loans for financing these activities.
Complexity, specificity and outcome uncertainty of such investment projects may make it
particularly difficult for outsiders to judge the expected return of ‘R’ projects. Hence, for
firms with limited internal liquidity R&D investments may therefore be constrained. If
information asymmetries are larger for ‘R’ than for ‘D’ financing constraints may be more
binding for ‘R’ projects. Underinvestment in ‘R’, however, may result in a noticeable
slowdown in productivity growth and consequently have particularly detrimental effects on
technological progress and economic development.
Previous studies on financing constraints for R&D do not explicitly distinguish between the
different components of R&D. This article explicitly takes the heterogeneity of the two
components into account. We argue that financing development ‘D’ externally should be less
critical than it is for industrial research ‘R’.
First, our results show that firms’ investment in ‘R’ are more sensitive to liquidity than
investments in ‘D’ indicating that firms have to rely even more on internal funds for financing
the former type of activities. This may be due to the fact that the latter occurs later in the
R&D process and is closer to yielding returns. That is, firms cut ‘R’, before they reduce ‘D’ if
they have to allocate scarce internal funds. This has implications for R&D policy. If financial
constraints for R&D are driven by the ‘R’ component, industrial research projects may
deserve special support. Second, we show that public subsidies directed at ‘R’ indeed
alleviate financing constraints.
Industrial Research versus Development Investment: The Implications of Financial Constraints*
Dirk Czarnitzki a, b, c, d, Hanna Hottenrott a, b, c and Susanne Thorwarth a, b, c
a K.U.Leuven, Dept. of Managerial Economics, Strategy and Innovation b Centre for R&D Monitoring (ECOOM) at K.U.Leuven
c Centre for European Economic Research (ZEW), Mannheim d Centre for Industrial Economics, University of Copenhagen (Denmark)
August 2009
Abstract
Previous literature provided evidence on financing constraints for investment in R&D activities due to capital market imperfections and special features of R&D investments. Moreover, it has been shown that a shift in capital structure towards more debt, results in a reduction of R&D investments. This article complements this literature by compartmentalizing R&D activities in its components, ‘R’ and ‘D’. In particular, we distinguish research from development as these activities do not only differ in their nature, but also to a large extent take place sequentially. Our results show that ‘R’ investment is more sensitive to the firms’ operating liquidity than ‘D’ indicating that firms have to rely even more on internal funds for financing their research compared to development activities. Moreover, we find that (basic) research subsidy recipients’ investment is less sensitive to internal liquidity.
Keywords: Research and Development, Liquidity Constraints, Innovation Policy JEL-Classification: O31, O32, O38 Contact: Dirk Czarnitzki, K.U.Leuven, Dept. of Managerial Economics, Strategy and Innovation, Naamsestraat 69, 3000 Leuven, Belgium; Email: [email protected]; Phone: +32 (0) 16 326 906; Fax: +32 (0) 16326732 Hanna Hottenrott, K.U.Leuven, Dept. of Managerial Economics, Strategy and Innovation, Naamsestraat 69, 3000 Leuven, Belgium Email: [email protected]; Phone: +32 (0)16 32 57 93; Fax: +32 (0)16 32 57 99 Susanne Thorwarth, K.U.Leuven, Centre for R&D Monitoring, Dekenstraat 2, 3000 Leuven, Belgium Email: [email protected]; Phone: +32 (0)16 32 57 93; Fax: +32 (0)16 32 57 99 * We thank IWT Flanders for providing their ICAROS database. Czarnitzki gratefully acknowledges financial support from the Flemish Science Foundation (grant G.0534-07N).

1
1 Introduction
R&D activities and resulting innovation constitute an important driver of economic
competitiveness and hence sustainable economic growth. As has been illustrated by numerous
studies, the impact of R&D on productivity at the firm level stems from the implementation of
newly generated knowledge and technological discoveries into new products, improvement of
existing products and production processes or cost reductions of producing existing products
or services (see e.g. Stiglitz 1969, Griliches 1980, Schankerman 1981, Griliches and Mairesse
1984, 1990, and Hall and Mairesse 1995). Consequently, R&D has been recognized as
important input factor to industrial production.
However, Griliches (1986) points out that basic research is a main driver for productivity at
the firm level. He shows that expenditures for basic research significantly contribute to
productivity growth of U.S. manufacturing firms in the 1970s (also Mansfield 1980). He finds
in his cross-sectional analysis that firms that invest a larger fraction of their total R&D on
basic research are more productive, hence stressing the importance of this component.
Recently, this finding has been complemented by Czarnitzki et al. (2009) who show that
research expenditures exhibit a significant premium over development expenditures with
regard to patent productivity in a panel of Belgian firms.
Moreover, economic theory suggests that the social rates of return are larger than the private
rates of return from research activities because of the incompleteness of appropriability of the
knowledge that is being created by investment (Arrow 1962, Usher 1964).1
1 Empirically, numerous studies have confirmed positive spillover effects from industrial R&D. See Griliches (1992) for a survey. However, to date there is no study on social returns that explicitly disentangles ‘R’ and ‘D’ investments with regard to spillover effects.
2
When Arrow (1962) wrote about economic welfare and the allocation of resources for
invention, he was in particular referring to private research activities - or generally speaking
the production of new knowledge - that may suffer from financing constraints due to market
failure. Hence, he was mainly referring to the ‘R’ component of R&D. Thus, especially for
basic research, which is used as an informational input into subsequent inventive activities,
firms may face particular difficulties to attract external investors or receive bank loans for
financing these activities. Firms with limited internal liquidity may therefore have to constrain
their research to currently available funds and postpone or abandon projects that they would
conduct if additional financing was available. This reduces incentives to invest in long term
research projects and may bring overall industrial research in the economy way below optimal
levels.
Hence, underinvestment in ‘R’ due to financing constraints may therefore result in noticeable
slowdown in productivity growth and consequently have particularly detrimental effects on
technological progress and economic development.
Previous literature has provided vast evidence for the conjecture that capital market
imperfections, in particular information asymmetries, influence lending and investment
decisions of firms. Moreover, information asymmetries may be particularly severe in the case
of research and development (R&D) activities. Complexity, specificity and outcome
uncertainty of such investment projects may make it particularly difficult for outsiders to
judge the expected return. Additionally, firms may be reluctant to reveal details of the projects
to potential investors. Besides information asymmetries, the intangibility of the asset that is
being created by the investment and the uncertainty of returns may make raising funds
externally more costly for R&D than for other types of investments (e.g. Mansfield 1977,
Berger and Udell 1998, Harhoff 1998). Financing R&D externally may thus be more costly

3
compared to financing of other types of investment (e.g. Meyer and Kuh 1957, Stiglitz and
Weiss 1981, Myers and Majluf 1984, Anton and Yao 2002).
Yet, most articles, surveys, evaluations and reports concerning allocation of resources to
R&D do not explicitly distinguish between the different components of R&D2. Previous
studies on financing constraints for knowledge creating activities usually analyzed industrial
R&D in aggregate form. However, characteristics usually attributed to R&D activities in
general, such as intangibility and outcome uncertainty are very likely to be more applicable
for ‘R’ compared to ‘D’. While not empirically discussed, Kamien and Schwartz (1978)
developed a theoretical model to show that firms conducting fundamental or radical R&D
projects are more likely to encounter financial constraints than firms performing
predominantly routine R&D. Although the authors do not explicitly differentiate between ‘R’
versus ‘D’, their concept of radical versus routine R&D may also apply to distinction between
‘R’ and ‘D’, since fundamental innovations usually involve basic research, require
significantly more resources and are much riskier in terms of default and expected returns.
This article aims to complement previous studies by explicitly taking the heterogeneity of the
two components of R&D into account. By compartmentalizing industrial R&D activity into
its components, we argue that financing development ‘D’ externally should be less critical
than it is for industrial research ‘R’. Our empirical study, indeed, reveals that ‘R’ investment
is more sensitive to the firms’ operating liquidity than ‘D’ indicating that firms have to rely
2 Link (1981) is one of the few studies that analyze determinants of inter-firm differences in the composition of R&D expenditures. Also Mansfield (1981) studies the effects of firm size on the composition of R&D investments and finds that increases in size of firm – measured in firms’ sales – are associated with more than proportional increases in the amount spent on basic research. This may already hint to financing constraints for firms with lower levels of internally available funds.

4
even more on internal funds for financing their research compared to development activities.
Looking at aggregated R&D expenditures of the firm would not have revealed this effect.
Moreover, we find that (basic) research subsidy recipients invest more into ‘R’ than other
firms, and that their investment is also less sensitive to internal liquidity.
This paper proceeds as follows. Section 2 outlines the motivation for this research as well as
the conceptual framework of our analysis and section 3 describes the data. The econometric
set-up and our model specifications are described in section 4. Section 5 presents the results
before we conclude in section 6.
2 Conceptual Framework
Although the presence of financing constraints for R&D has been shown in numerous
empirical studies,3 R&D has usually been analyzed in aggregate form. If external financing
for R&D is constrained, firms engaging in R&D may have to rely to a larger extent on
internal financial resources than firms that mainly invest in capital goods (e.g. Carpenter and
Petersen 2002, Chiao 2002, David et al. 2008). Theoretical and empirical literature has
illustrated that firms foremost use internal funds to finance innovation projects as compared to
debt indicating such a gap in the cost of capital (Leland and Pyle 1977, Bhattacharya and
Ritter 1983, Hall 1990, 1992, Himmelberg and Peterson 1994, Harhoff 1998, Bougheas et al.
2003, Czarnitzki and Hottenrott 2009).
However, research activities that usually precede development activities may show
fundamentally different characteristics. Attributes typically related to R&D activities in
general, such as intangibility and uncertainty are very likely to be more applicable for
research ‘R’ compared to development ‘D’. Research projects are usually characterized by
5
being “far from the market” and may suffer from stronger externalities decreasing the
expected profitability. Moreover, development takes place at a later stage of the R&D process
building on previously generated knowledge, which may be tangible to a certain extent, for
example in the form of patents or other intellectual property rights. Thus, the gap in financing
costs may be larger in the case of research activities as this is the part of the R&D process that
is even more prone to information asymmetries.
Consequently, firms may be limited in the financing of their R&D by the funds that are
internally available. At the same time, internal financial resources are affected by the firms’
debt payment obligations. The higher the obligations relative to the internal funds of the firm,
the less liquidity remains for activities that have to be financed internally such as R&D. Thus,
increases in firms’ levels of debt may put pressure on the firm to use its cash flow to service
interest and repayment at the expense of long-term investments such as R&D (Hall 1990,
1992, Long and Ravenscraft 1993, Bhagat and Welch 1995, Ogawa 2007). Moreover, high
leverage may reduce access to further credit due to increasing default risk. Accordingly,
higher debt payment obligations may also have stronger effects on ‘R’ than on ‘D’
investments as firms have to rely even more on their internal funds for the former component
of R&D. We argue that effects for investment in ‘R’ should be particularly more sensitive to
debt compared to investments in ‘D’ as the latter occurs later in the R&D process and is
closer to yielding returns. That is, firms will be more likely to cut ‘R’ than to reduce ‘D’ if
they have to allocate internal funds for serving debt.
This article therefore explicitly aims at disentangling the effects of liquidity and debt on R&D
using firm-level panel data. We estimate separate equations for investment in ‘R’ and
3 See Hubbard (1998) and Hall (2008) for extensive surveys of the literature.
6
investment in ‘D’ to identify differences in the reliance of firms on internal funds for both
components of R&D reflecting constraints in the access to external financing.
We expect a positive relationship between firms’ liquidity and the firms’ expenditures in
R&D. For ‘R’, however, we expect the effect to be stronger due to the nature of ‘R’ activities
versus ‘D’ activities. The former is likely to be more prone to information asymmetries,
secrecy issues as well uncertainty of outcomes. These factors may make it more costly to
finance externally if not impossible at all. Thus, a firm has to rely more on internal funds for
‘R’ than for ‘D’ and may therefore show a larger sensitivity to the availability of internal
funds.
While the differences in funding gaps for ‘R’ versus ‘D’ have not yet been uncovered
explicitly in an empirical study on financial constraints at the firm-level, this phenomenon has
long been understood by technology policy. In Flanders, for instance, different subsidy
schemes exist. Firms can submit project proposals for subsidy requests, and possible grants
are based on a percentage of the eligible costs that consist of project-related payroll costs,
direct costs (operating costs and depreciation of the equipment) and to a limited extent
indirect (general) costs. The percentage to which total project cost can be subsidized depends
on the type of research project: industrial “basic and strategic” research may receive up to
50% of the accepted total costs, “experimental development and prototyping” up to 25% of
the accepted total costs and “mixed research projects” up to 38% of the accepted total costs.
Consequently, we supplement our initial analysis with a policy variable. We investigate
whether firms that received grants for “basic and strategic” research projects are less
constrained in their investment into ‘R’. For ‘D’ we do not expect an impact of public basic
research funding on the level of constriction.

7
3 Data
The data for our analysis stems from the Belgian part of the OECD R&D survey. The survey
is harmonized across OECD countries and is conducted every second year in order to
compose the OECD Main Science and Technology Indicators with the collected data. This
R&D survey is a permanent inventory of all R&D-active companies in Flanders. Our analysis
is based on six consecutive waves of the R&D survey data covering the period from 1999
until 2007. Each wave provides information on firm level data for two consecutive years.
The definition of research and development used in most economic research encompasses
several kinds of activities. According to the definition of the OECD Frascati Manual (1993,
2002) which frames the methodology for collecting and using statistics about R&D in OECD
countries, the term R&D covers three activities: basic research, applied research and
experimental development.4 The first two can be summarized to be the ‘R’ of R&D, while the
latter one constitutes the ‘D’ component of R&D.
In order to construct the financial indicators we supplemented our data with information on
the firms’ financial background with accounting and balance sheet data from the BELFIRST
database. For the policy analysis, we supplement our panel data with public R&D project
funding information that has been provided by the IWT Flanders, which is the innovation and
technology policy agency of the Flemish government administering innovation subsidies.
4 According to this international definition is basic research ‘experimental or theoretical work undertaken primarily to acquire new knowledge of the underlying foundation of phenomena and observable facts, without any particular application or use in view’. Whereas applied research also is original investigation undertaken in order to acquire new knowledge, it is, however, directed towards a specific practical outcome. Development activities are rather ‘systematic work, drawing from existing knowledge gained from research and/or practical experience, which is directed to producing new materials, products or devices […]’ (OECD, 2002, p.30).
8
Our sample comprises firms that at least once invested in R&D and are observed at least twice
in the reference period as we estimate panel data models that allow controlling for unobserved
heterogeneity. On average, we observe each firm about 4 times in our panel. After eliminating
data with missing values in the variables of interest, our final sample consists of 3,686 firm-
year observations referring to 952 different firms.5
3.1 Variables
Firms’ R&D expenditures serve as dependent variable for our analysis. The peculiarity of the
survey, however, provides information not only about aggregate R&D spending, but also
about ‘R’ and ‘D’ separately. Thus we are able to disentangle a firm’s R&D expenditures
(R&D) into its components research (RESEARCH) expenditures on the one hand and
development (DEVELOPMENT) expenditures on the other hand.
We derive indicators for the capital structure of the firms in our sample from balance sheet
information accounted according to local Belgian GAAP on an annual basis.
We employ the firms’ stock of working capital as a measure of operating liquidity to
overcome limitations of cash flow as indicator for firms’ liquidity.6 Working capital (WCAP)
is the net amount of short term assets, i.e. the difference between current assets minus current
liabilities of a firm. The higher the working capital the more secured is a firm’s liquidity and
accordingly its financial flexibility. This variable can take positive or negative values. A
positive working capital means that short term liabilities are covered by current assets (cash,
accounts receivable and inventory) whereas a negative working capital indicates that a firm’s
5 Table A1 in the appendix provides details on the distribution of firms across industries. 6 The appropriateness of cash flow as an indicator for the availability of internal funds and the interpretation of sensitivity of R&D investment to changes in cash flow has been seriously questioned in the literature (Hao and Jaffe 1993, Fazzari and Petersen 1993, Hall and Kruiniker 1995, Kaplan and Zingales 1997, 2000).

9
current assets are not sufficient to cover its current liabilities. Hence, it serves as indicator for
a firm’s short-term liquidity.
In addition, we use firm’s debt as further variable controlling for credit market access. The
overall liabilities of the firm (DEBT) consist of current liabilities payable within one year and
non-current liabilities payable later than one year. The overall debt-to-equity ratio (leverage)
of the firms in our sample is about 60%. However, we employ debt-to-tangible assets- ratios
rather than debt-to-equity as the former type is more meaningful in terms of reflecting the
firms’ liabilities relative to the firms’ collateral value.
As common in the financial constraints literature, we scale the dependent variables as well as
WCAP and DEBT by firms’ assets (see e.g. Fazzari et al. 1988, Fazzari and Petersen 1993,
Harhoff, 1998, and others). We use lagged tangible assets (K) calculated as the value of a
firm’s total fixed assets minus current assets and financial assets (as already captured by
WCAP), goodwill and other intangible assets.
As common in firm level studies, we also control for firm size. Larger firms may be able to
realize economies of scope while conducting research and development activities. Therefore
we include the log of the firms’ tangible assets ln(K) as well as its squared value [ln(K)] 2.
The dummy variable GROUP taking the value 1 if a firm belongs to a group (0, otherwise)
controls for different governance structures. Group members may conduct more R&D
activities since firms associated with a group can make use of intra-firm spillovers, internalise
externalities as well as fund R&D from intra-group sources. To control for age-related effects,
since younger and newly established firms may invest relatively more into research and
development than older firms, we also use the log of age, ln(AGE). We also allow for a non-
(log)-linear relationship by including [ln(AGE)2].

10
For the supplemental regression including the policy variable, we create a dummy variable
indicating that the firm received government funding for basic or strategic research (SUBR).
This variable will be interacted with WCAP to evaluate whether possible financial constraints
are alleviated by basic research funding.
Furthermore, a set of time dummies is included to take business cycle effects into account.
Finally, 16 sector dummies on basis on the European standard industry classification NACE
are included to capture different technological opportunities.
All variables in monetary units are measured in million Euros in prices of the year 2000. We
used the GDP deflator for price adjustment. To avoid a simultaneity bias which can arise if
there are feedback effects from the dependent variable to current explanatory variables, we
use lagged values of all time variant exogenous variables (except AGE).7
Table 1 shows the descriptive statistics for all variables. Average R&D expenditures are
around 3 million Euros for each firm per year where roughly two thirds are spent for
development and one third for research. On average, liabilities amount to about 77 million
Euros. The median, however, is much lower (about 5 million €).
Firms in our sample have about 270 employees on average. However, the size distribution of
firms is skewed and at the median the number of employees is only 54. The sample comprises
very young firms of 2 years as well as established firms of up to 125 years of business
activity. The average firm age is about 26 years. Further, 60% of the firms in our sample are
part of a group.
7 For the variable DEBT, we use a two period lag as debt is measured at the end of the year t-2, so that its signal to lenders is effective in t-1. This 2-period lag then indicated credit market access in t-1 when also the available working capital is measured.

11
Table 1: Descriptive Statistics (3,686 obs.) Variable Unit Median Mean Std. Dev. Min Max
R&D i,t million € 0.16 2.86 18.36 0 471.35RESEARCH i,t million € 0.04 1.07 7.33 0 217.58DEVELOPMENT i,t million € 0.07 1.79 13.39 0 424.21DEBT i,t-2 million € 5.33 76.94 386.6 0.01 7,764.43WCAP i,t-1 million € 2.00 12.54 42.65 -155.02 634.90Ki,t-1 million € 1.39 15.94 85.69 0 1,805.05EMPi,t-1 headcount 54 271.34 745.79 1 11,575AGEi, t years 19 25.75 19.25 2 125GROUPi dummy 1 0.58 0.49 0 1RSUBit dummy 0 0.07 0.25 0 1
Note: time and industry dummies omitted.
4 Econometric Analysis
We estimate censored panel regression models as not all of our firms in the sample perform
R&D in each period. Especially small firms may conduct R&D only on an irregular basis. In
particular, we estimate random effects models that can be written as
( )( )2
max 0, , 1, 2, , , 1, 2, ,
| , 0,it it i it
it i i u
y x c u i N t T
u x c N
β
σ
= + + = =… …
∼
where y denotes the dependent variable, x the set of regressors, c a firm-specific time-constant
effect, and u the usual random error term. The parameters to be estimated are denoted by the
vector β. We first estimate the model as random effects Tobit that requires the assumption of
no correlation between c and x (see Wooldridge, 2002: 540-541, for further technical details).8
In addition, we follow Wooldridge (2002) and relax the assumption of uncorrelatedness
between x and c by modifying the model. Let .i i ic x aψ ξ= + + Then we can write
8 Note that it is not useful to estimate a fixed effects Tobit model, as the maximum likelihood estimator is not consistent (see e.g. Cameron and Trivedi 2005).

12
( )
( )( )
2
2
max 0,
with
| , 0, ,
0, .
it it i i it
it i i u
i a
y x x a u
u x a N
a N
ψ β ξ
σ
σ
= + + + +
∼
∼
The appropriateness of the Wooldridge model, i.e. that the assumption of uncorrelatedness
between the firm-specific effect and the regressors is not valid, will be tested by the joint
significance of the x-variables’ “within” means.
We estimate separate models for our three dependent variables of interest. The basic model
for R&D investment is specified as:9
( )*
2, 2 , 10 1 2 3 , 1 4 , 1
, 1 , 1
23 322
5 6 78 24
&ln ln
ln ln
it i t i ti t i t
it i t i t
i,t i,t i k ik s s i itk s
R D DEBT WCAP K K
K K K
AGE ( AGE ) GROUP IND t c u
β β β β β
β β β β β
− −− −
− −
= =
= + ++ + +
+ + + + + + +∑ ∑
and
*& if 0&
0 otherwise
itit i itit
itit
R D x c uR DK
Kβ
⎧+ + >⎪= ⎨
⎪⎩
.
The equations for the two components of internal R&D, i.e. RESEARCH and
DEVELOPMENT are specified analogously.
9 Although the model contains a time-invariant firm-specific effect we also include the time-invariant regressors GROUP and the industry dummies, as the firm-specific effect is treated as a random component in the estimation. Including time invariant regressors are used to decrease the error term variance (see Wooldridge, 2002: 541).

13
5 Estimation Results
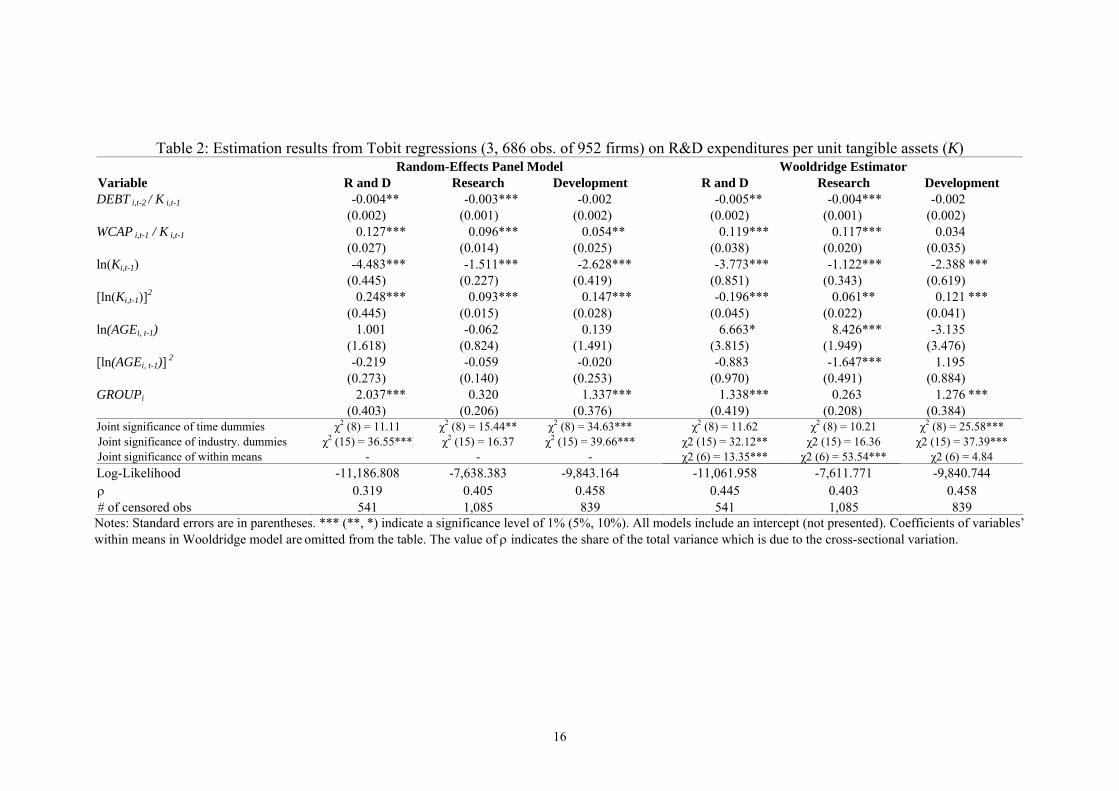
The results of the random effects panel and its modification by Wooldridge are presented in
Table 2. The first column presents the results for total in-house R&D investment, column 2
and 3 present the results for Research and Development investments separately.
For the total R&D investment, we find the expected results: the working capital variable is
positively significant and debt is negatively significant. Thus, firms are financial constrained
by their internal resources. In addition, with higher values of debt, investment is even reduced
further. We interpret this as indication that the higher the default risk, the less likely potential
investors are to provide further capital for R&D investment.
If we split R and D into its two components, we find interesting differences between R and D.
Debt is only negatively significant for R but not D, and the positive, significant coefficient of
WCAP/K is larger in the R equation than in the D equation. Thus, the results from the
disaggregated models for R and D reveal that these liquidity effects constraining R&D stem to
a large extent from research activities only. In order to evaluate the magnitude of the impact
of WCAP on investment, we calculate marginal effects. We are interested in studying how
E(y|x) changes if x changes, i.e. we take the censoring into account.10 We calculate the
marginal effects under the assumption that ci = 0 at the mean of the covariates, and obtain
standard errors using the delta method (cf. e.g. Greene, 2000, for technical details). The
marginal effect of WCAP amounts to 0.064 (SE = 0.014) in the R equation and to 0.024 (SE =
0.011) in the D equation, which yields a significant difference between the two effect at the
5% level. Thus we can conclude that the firms have to rely even more on internal resources
for financing R within their R&D project, or in other words suffer more from financial
10 Note that the coefficients in a Tobit model indicate ( )*E y | x / x∂ ∂ .
14
constraints for R than for D. This may be due to the fact that ‘D’ occurs later in the R&D
process and is closer to the market, i.e. closer to yielding returns. Hence, firms may cut ‘R’,
before they reduce ‘D’ if they are constrained by the credit market and have to rely on scarce
internal funds.
With respect to the control variables we find a non-linear relationship between the dependent
variables and firm size as measured by lnK. The minimum value of this U-shaped curve is
around the 75% percentile of the lnK distribution for all models. Thus, smaller firms in terms
and larger firms in terms of lnK invest relatively more into R&D, R and D than medium-sized
firms. As expected, we also find that firms associated with a group invest more than stand-
alone companies. The age variables are insignificant in all models.
When we turn to the Wooldridge models, we find very similar results as in the random effects
models. Therefore, we discuss these only briefly. First, the tests that x and c are uncorrelated
are rejected in the R&D and R equation, but not in the D equation (tests on joint significance
on within means in Table 2). Although the random effects model is rejected in two cases, the
results on WCAP and DEBT remain basically the same, except that debt becomes insignificant
in the R&D equation. This may be caused by relatively high correlations between the time
varying xit and the within firm means that are employed to relax the assumption that x and c
are not correlated.
In Table 3, we present the regression on R and D investment again, but there we have
augmented the regression with the SUBR dummy, i.e. the indicator for the receipt of public
subsidies for “basic and strategic” research, and its interaction with WCAP. If one compares
the results on the main regressors of interest with Table 2, it shows that the magnitude of the
coefficients is quite stable, and thus the earlier results persist. The coefficient of SUBR is
positively significant in the R equation. Thus recipients of such subsidies are able to invest
significantly more into R due to the subsidy itself. Even more interesting, however, we find

15
that the interaction of SUBR with WCAP is negatively significant. That is, the subsidy receipt
offsets the slope of WCAP basically. Testing whether the coefficients of WCAP and
WCAP*SUBR are significantly different from each other in absolute values (note the opposite
signs), we cannot reject H0 (= stating that they are equal). Thus in general, firms depend
highly on their internal resources, but for subsidy recipients this effect is offset. On the one
hand, this may indicate that the grants are typically large enough to conduct the desired
research project at full scale. On the other hand, it may also hint at the so-called certification
effect of subsidies. Lerner (1999) argued that U.S. SBIR11 awardees achieve better access to
external capital due to the fact that they received an SBIR award, as it involves a thorough
peer-evaluation procedure of the submitted research proposal. For instance, venture capitalists
and banks may use that as positive signal on the quality of the investment project.
11 The Small Business Innovation and Research program is the largest policy scheme for supporting commercial research and innovation in U.S. history, and is in place since 1982.
16
Table 2: Estimation results from Tobit regressions (3, 686 obs. of 952 firms) on R&D expenditures per unit tangible assets (K) Random-Effects Panel Model Wooldridge Estimator Variable R and D Research Development R and D Research Development DEBT i,t-2 / K i,t-1 -0.004** -0.003*** -0.002 -0.005** -0.004*** -0.002 (0.002) (0.001) (0.002) (0.002) (0.001) (0.002) WCAP i,t-1 / K i,t-1 0.127*** 0.096*** 0.054** 0.119*** 0.117*** 0.034 (0.027) (0.014) (0.025) (0.038) (0.020) (0.035) ln(Ki,t-1) -4.483*** -1.511*** -2.628*** -3.773*** -1.122*** -2.388 *** (0.445) (0.227) (0.419) (0.851) (0.343) (0.619) [ln(Ki,t-1)]2 0.248*** 0.093*** 0.147*** -0.196*** 0.061** 0.121 *** (0.445) (0.015) (0.028) (0.045) (0.022) (0.041) ln(AGEi, t-1) 1.001 -0.062 0.139 6.663* 8.426*** -3.135 (1.618) (0.824) (1.491) (3.815) (1.949) (3.476) [ln(AGEi, t-1)] 2 -0.219 -0.059 -0.020 -0.883 -1.647*** 1.195 (0.273) (0.140) (0.253) (0.970) (0.491) (0.884) GROUPi 2.037*** 0.320 1.337*** 1.338*** 0.263 1.276 *** (0.403) (0.206) (0.376) (0.419) (0.208) (0.384) Joint significance of time dummies χ2 (8) = 11.11 χ2 (8) = 15.44** χ2 (8) = 34.63*** χ2 (8) = 11.62 χ2 (8) = 10.21 χ2 (8) = 25.58*** Joint significance of industry. dummies χ2 (15) = 36.55*** χ2 (15) = 16.37 χ2 (15) = 39.66*** χ2 (15) = 32.12** χ2 (15) = 16.36 χ2 (15) = 37.39*** Joint significance of within means - - - χ2 (6) = 13.35*** χ2 (6) = 53.54*** χ2 (6) = 4.84 Log-Likelihood -11,186.808 -7,638.383 -9,843.164 -11,061.958 -7,611.771 -9,840.744 ρ 0.319 0.405 0.458 0.445 0.403 0.458 # of censored obs 541 1,085 839 541 1,085 839
Notes: Standard errors are in parentheses. *** (**, *) indicate a significance level of 1% (5%, 10%). All models include an intercept (not presented). Coefficients of variables’ within means in Wooldridge model are omitted from the table. The value of ρ indicates the share of the total variance which is due to the cross-sectional variation.

17
Table 3: Estimation results from Tobit regressions (3,686 obs. of 952 firms) on R&D expenditures per unit tangible assets (K) with SUBR Random-Effects Panel Model Wooldridge Estimator Variable Research Development Research Development DEBT i,t-2 / K i,t-1 -0.003*** -0.002 -0.004*** -0.002 (0.001) (0.002) (0.001) (0.002) WCAP i,t-1 / K i,t-1 0.103*** 0.053** 0.123*** 0.033 (0.014) (0.025) (0.021) (0.036) SUBR i,t-1 0.819*** 0.120 0.270 -0.047 (0.292) (0.525) (0.312) (0.564) SUBR i,t-1 x (WCAP i,t-1 / K i,t-1) -0.084** 0.004 -0.086** 0.004 (0.036) (0.062) (0.035) (0.062) ln(Ki,t-1) -1.475*** -2.625*** -1.307*** -2.401 *** (0.226) (0.419) (0.342) (0.620) [ln(Ki,t-1)]2 0.091*** 0.147*** 0.067*** 0.123 *** (0.015) (0.028) (0.022) (0.041) ln(AGEi, t-1) -0.086 0.145 8.543*** -3.261 (0.819) (1.491) (1.944) (3.477) [ln(AGEi, t-1)] 2 -0.054 -0.021 -1.704*** 1.181 (0.139) (0.253) (0.489) (0.885) GROUPi 0.324 1.341*** 0.346* 1.298 *** (0.205) (0.376) (0.208) (0.386) Joint significance of time dummies χ2 (8) = 14.90* χ2 (8) = 34.61*** χ2 (8) = 10.72 χ2 (8) = 25.42*** Joint significance of industry dummies χ2 (15) = 16.21 χ2 (15) = 39.55*** χ2 (15) = 16.25 χ2 (15) = 37.28*** Joint significance of within means - - χ2 (7) = 71.59*** χ2 (7) = 5.11 Log-Likelihood -7,633.656 -9,843.119 -7598.082 -9,840.563 ρ 0.399 0.458 0.392 0.458 # of censored obs 1,085 839 1,085 839
Notes: Standard errors are in parentheses. *** (**, *) indicate a significance level of 1% (5%, 10%). All models include an intercept (not presented). Coefficients of variables’ within means in Wooldridge model are omitted from the table. The value of ρ indicates the share of the total variance which is due to the cross-sectional variation.

18
It is noteworthy that the findings on the subsidy dummy should be interpreted with
some care. It is known that firms may self-select themselves into subsidy schemes (see
e.g. the survey by David et al., 2000) and thus we may overestimate the effect of SUBR.
Although our panel regressions control for unobserved heterogeneity among firms and
that should take care of the potential selection bias to a certain extent, correcting for
selection properly would require instrumenting the SUBR variable. Unfortunately, there
is currently no econometric panel Tobit model available that would allow for this. We
experimented with pooled cross-sectional regressions, but it turned out that it is
important to control for firm-specific effects in this study (see the high share of total
variance explained by mere cross-sectional variation).
6 Conclusion
Previous literature provided vast evidence for liquidity constraints of industrial R&D
investments due information asymmetries. Complexity, specificity and uncertainty of
returns may make it particularly difficult for outsiders to judge the potential value and
firms may be reluctant to reveal details of the projects to potential investors.
Furthermore, the intangibility of the asset that is being created (knowledge) may limit
firms’ access to external funds for R&D. Hence, firms have to rely on internal liquidity
to fund their R&D activities.
Although the presence of financing constraints for R&D has been shown in numerous
empirical studies, R&D has usually been viewed as an inseparable process (possibly due
to limited data availability). However, characteristics usually attributed to R&D
activities in general, such as intangibility and uncertainty are very likely to be more
applicable to ‘R’ than to ‘D’. Research projects are usually characterized by being “far
from the market” and may induce higher externalities decreasing the likelihood of
19
profitability. Moreover, development takes place at a much later stage of the R&D
process building on previously generated knowledge.
This article aimed to complement previous studies by explicitly taking the heterogeneity
of the two components of R&D into account. By compartmentalizing industrial R&D
activity into its components, we argue that financial constraints affect ‘R’ more than
‘D’.
Our empirical study indeed reveals that ‘R’ investment is more sensitive to the firms’
operating liquidity than ‘D’ investments, indicating that firms have to rely even more on
internal funds for financing their research compared to their development activities.
Looking at aggregated R&D expenditures of the firm would not have revealed this
effect. Thus, estimating different investment equations for R&D and ‘R’ and ‘D’
separately illustrates that financing constraints may be more binding for ‘R’ than for
‘D’.
Governments, as for example in Flanders, are aware of the need for special support of
industrial research, and grant higher shares of total cost in terms of subsidies to “basic
and strategic” research than for experimental development or prototyping. We find that
research subsidy recipients indeed invest more into ‘R’ than other firms, and that their
investment is also less sensitive to internal liquidity.
This has interesting consequences for policy. While policy makers also seek to increase
the outcome of funded projects, it may happen that very challenging research projects
are not awarded a subsidy, as submitted project applications are often evaluated by peer-
review according to criteria such as “technological content” and “expected economic
value” or similar criteria. As highly basic research projects may score low on the latter

20
criterion, government agents may behave similar as private lenders when it comes to
project selection. Therefore, even funding for R&D may still inhibit investment into R.
As one rough check, we analyzed the submitted grant requests and the grant rate of
those projects submitted under the three different schemes present in Flanders:
“(strategic) basic research” (= ‘R’ in our terms), “mixed projects” and “experimental
development and prototyping” (= ‘D’ in our terms). As Table 4 shows there is slight
evidence that basic research projects are indeed rejected more frequently. While the
total grant rate amounts to 81%, `R’ projects are only granted at a rate of 75%, but `D’
projects at a rate of 82%. However, this evidence is not clear cut as “Mixed Projects”
are granted most frequently with 91%.
Table 4: Grant rate of submitted project proposal by type in Flanders
Total (Strategic) Basic Research Mixed projects
Experimental Development and
Prototyping Number of submitted projects 3506 1389 829 1288
Grant rate 81% 75% 91% 82% Note: The data were kindly provided by IWT Flanders (own calculations). A “grant” may imply a, typically downward, adjustment of accepted total project cost by the agency compared the originally submitted project budget.
It would be highly interesting to find comparable figures from other countries to
evaluate national policies across countries to learn more about policy practices, and
eventually learn more about the implications of our findings for levels of ‘R’ and ‘D’ in
the European Union. This could be especially interesting on the background of the EC
Lisbon agenda (see e.g. European Commission, 2005) that, among other issues, states to
raise the R&D/GDP ratio to 3% in the European Union. If many countries favor projects
that are more of a ‘D’ nature a shift to funding a higher proportion of ‘R’ projects may
yield higher total R&D in Europe as firms are more constrained in ‘R’ according to our
econometric results.
21
References
Anton, J. and D. Yao (2002), The Sale of Ideas: Strategic Disclosure, Property Rights, and Contracting, Review of Economic Studies 69(3), 513-531.
Arrow, K. (1962), Economic Welfare and the Allocation of Resources for Invention, in: Nelson, R. (Ed.), The Rate and Direction of Inventive Activity.
Bhagat, S. and I. Welch (1995), Corporate research and development investments – international comparisons - , Journal of Accounting and Economics 19, 443-470.
Bhattacharya, S. and J. Ritter (1983), Innovation and Communication: Signaling with Partial Disclosure, Review of Economic Studies 50(2), 331-346.
Berger, A. and G. Udell (1998), The economies of small business finance: the roles of private equity and debt markets in the financial growth cycle, Journal of Banking and Finance 22, 613-673.
Bougheas, S., H. Görg, and E. Strobl (2003), Is R & D Financially Constrained? Theory and Evidence from Irish Manufacturing, Review of Industrial Organization 22(2), 159-174.
Cameron, A.C. and P.K. Trivedi (2005), Microeconometrics: Methods and Applications, New York: Cambridge University Press.
Carpenter, R. and B. Petersen (2002), Capital Market Imperfections, High-Tech Investment, and New Equity Financing, Economic Journal 112, 54-72.
Chiao, C. (2002), Relationship between Debt, R&D and Physical Investment, Evidence from U.S. Firm-Level Data, Applied Financial Economics 12, 105-121.
Czarnitzki, D. and H. Hottenrott (2009), R&D Investment and Financing Constraints of Small and Medium-Sized Firms, Small Business Economics, forthcoming.
Czarnitzki, D., K. Kraft and S. Thorwarth (2009), The Knowledge Production of ‘R’ and ‘D’, Economics Letters, forthcoming.
David, P., J. O’Brien and T. Yoshikawa (2008), The implications of debt heterogeneity for R&D investment and firm performance, Academy of Management Journal 51, 165-181.
European Commission (2005), Common Actions for Growth and Employment: The Community Lisbon Programme, Brussels.
Fazzari, S., R. Hubbard, and B.C. Petersen (1988), Financing Constraints and Corporate Investment, Brookings Papers on Economic Activity 1, 141-206.
Fazzari, S.M. and B.C. Petersen (1993), Working Capital and Fixed Investments: New Evidence on Financing Constraints, RAND Journal of Economics 24(3), 328-342.
Greene, W.H. (2000), Econometric Analysis, Upper Saddle River: Prentice-Hall.
Griliches, Z. (1980), R&D and the Productivity Slowdown, American Economic Review 70, 343-348.
Griliches, Z. and J. Mairesse (1984), Productivity and R&D at the Firm Level, in: Z. Griliches (ed.), R&D, Patents, and Productivity. Chicago: University of Chicago Press.

22
Griliches, Z. (1986), Productivity, R and D, and Basic Research at the Firm Level in the 1970’s, American Economic Review 76(1), 141-154.
Griliches, Z. and J. Mairesse (1990), R&D and Productivity Growth: Comparing Japanese and U.S. Manufacturing Firms, in: C. Hulten (ed.), Productivity Growth in Japan and the United States, Chicago: University of Chicago Press.
Griliches, Z. (1992), The Search for R&D Spillovers, Scandinavian Journal of Economics 94, Supplement, 29-74.
Hall, B.H. (1990), The Impact of Corporate Restructuring on Industrial Research and Development, Brooking Papers on Economic Activity 1, 85-136.
Hall, B.H. (1992), Investment and Research and Development at the Firm Level: Does the Source of Financing Matter? NBER Working Paper 4096, Cambridge.
Hall, B.H. and H. Kruiniker (1995), The Role of Working Capital in the Investment Process, unpublished manuscript, Berkeley.
Hall, B.H., and J. Mairesse (1995), Exploring the Relationship Between R&D and Productivity in French Manufacturing Firms, Journal of Econometrics 65, 263-293.
Hao K.Y. and A.B. Jaffe (1993), Effect Of Liquidity On Firms' R&D Spending, Economics of Innovation and New Technology 2(4), 275 – 282.
Harhoff, D. (1998), Are There Financing Constraints for R&D and Investment in German Manufacturing Firms? Annales d' Economie et de Statistique 49/50, 421-456.
Hubbard, R. (1998), Capital-Market Imperfections and Investment, Journal of Economic Literature 36, 193-225.
Himmelberg, C. and B. Peterson (1994), R&D and Internal Finance: A Panel Study of Small Firms in High-Tech Industries, Review of Economics and Statistics 76, 38-51.
Kamien, M.I. and N.L. Schwartz (1978), Self-Financing of an R&D Project, American Economic Review 68(3), 252-261.
Kaplan, S. and L. Zingales (1997), Do investment-cash flow sensitivities provide useful measures of financing constraints? Quarterly Journal of Economics 112(1), pp. 169-215.
Kaplan, S. and L. Zingales (2000), Investment-Cash Flow Sensitivities Are Not Valid Measures Of Financing Constraints, Quarterly Journal of Economics 115(2), 707-712.
Leland, H. and D. Pyle (1977), Informational Asymmetries, Financial Structure, and Financial Intermediation, Journal of Finance 32, 371-387.
Lerner, J. (1999), The Government as Venture Capitalist: The Long-Run Impact of the SBIR Program, Journal of Business 72, 285-318.
Link, A.N. (1982), An Analysis of the Composition of R&D Spending, Southern Economic Journal 49(2), 342-349.
Long, W.F. and D.J. Ravenscraft (1993), LBOs, Debt and R&D intensity, Strategic Managemant Journal 14, 119-135.

23
Mansfield, E., A. Romeo, E. Villani, S. Wagner and F. Husic (1977), The Production and Application of New Industrial Technology, Norton: New York.
Mansfield, E. (1980), Basic research and productivity increase in manufacturing, American Economic Review 70, 863-873.
Mansfield, E. (1981), Composition of R&D Expenditures: Relationship to Size of Firm, Concentration and Innovative Output, Review of Economics and Statistics 63(4), 610-614.
Myers, S. and N. Majluf (1984), Corporate Financing and Investment Decisions When Firms Have Information that Investors Do Not, Journal of Financial Economics 13, 187-221.
Meyer, J.R. and E. Kuh (1957), The Investment Decision: An Empirical Study, Cambridge.
OECD (1993, 2002), Frascati Manual: Proposed Standard Practice for Surveys on Research and Experimental Development, Luxembourg.
Ogawa, K. (2007), Debt, R&D investment and technological progress: A panel study of Japanese manufacturing firms' behavior during the 1990s, Journal of the Japanese and International Economies 21(4), 403-423.
Schankerman, M. (1981), The Effects of Double-Counting and Expensing on the Measured Returns to R&D, Review of Economics and Statistics 63(3), 454-458.
Stiglitz, J. (1969), Theory of Innovation – Discussion, American Economic Review 59, 44-46.
Stiglitz, J. and A. Weiss (1981), Credit rationing in markets with imperfect information, American Economic Review 71, 393-410.
Usher, D. (1964), The Welfare Economics of Invention, Econometrica 31, 279-287.
Wooldridge, J.M. (2002), Econometric Analysis of Cross Section and Panel Data, MIT Press: Cambridge, Massachusetts.

24
Appendix
Table A1: Industry classifications Industry NACE rev. 2008 Description Frequency %
1 10, 11, 12 Food and Tobacco 273 7.41 2 13, 14, 15 Textiles, Clothing and Leather 224 6.08 3 16, 31 Wood and Furniture 111 3.01 4 17, 18 Paper 99 2.69 5 19, 20 Chemicals 292 7.92 6 21 Pharmaceuticals 76 2.06 7 22 Rubber and Plastic 148 4.02 8 24, 25, 33 Metal 309 8.38 9 27, 28 Machines and Equipment 464 12.59
10 26 ICT 269 7.30 11 29, 30 Transport 127 3.45 12 41 Building and Construction 108 2.93 13 1, 5, 23, 37, 35, 32 Miscellaneous Industry 237 6.43 14 45, 46, 47, 49, 55, 58 Commerce and Transport 257 6.97 15 59, 64, 68, 69, 71 - 79 Other Services 452 12.26
16 61, 62 Software Development and Communication 240 6.51
3,686 100.00