Industrial and environmental applications of nuclear analytical ...
148
IAEA-TECDOC-1121 XA9953276 _2?J" Industrial and environmental applications of nuclear analytical techniques Report of a workshop held in Vienna, 7-11 September 1998 INTERNATIONAL ATOMIC ENERGY AGENCY /A November 1999 30-50
-
Upload
khangminh22 -
Category
Documents
-
view
2 -
download
0
Transcript of Industrial and environmental applications of nuclear analytical ...

IAEA-TECDOC-1121XA9953276 _2?J"
Industrial and environmentalapplications of nuclear
analytical techniquesReport of a workshop
held in Vienna, 7-11 September 1998
INTERNATIONAL ATOMIC ENERGY AGENCY /A
November 1999
3 0 - 5 0

The originating Section of this publication in the IAEA was
Physics SectionInternational Atomic Energy Agency
Wagramer Strasse 5PO Box 100
A-1400 Vienna, Austria
The IAEA does not normally maintain stocks of reports in this series However, electroniccopies of these reports can be obtained from
INIS ClearinghouseInternational Atomic Energy AgencyWagramer Strasse 5PO Box 100A-1400 Vienna, Austria
Telephone (43) 1 2600-22880 or 22866Fax (43) 1 2600-29882E-mail CHOUSE® IAEA ORGWeb site http //www laea org/programmes/mis/inis htm
Orders should be accompanied by prepayment of 100 Austrian Schillings in the form of acheque or credit card (MasterCard, VISA)
INDUSTRIAL AND ENVIRONMENTAL APPLICATIONS OFNUCLEAR ANALYTICAL TECHNIQUES
IAEA, VIENNA, 1999IAEA-TECDOC-1121
ISSN 1011-4289
©IAEA, 1999
Printed by the IAEA in AustriaNovember 1999

FOREWORD
The IAEA has programme the utilisation of nuclear analytical techniques (NATs), inparticular for industrial and environmental applications. A major purpose is to help thedeveloping Member States apply their analytical capabilities optimally for socio-economicprogress and development. A large number of institutions in Europe, Africa, Latin Americaand Asia have established X ray fluorescence (XRF) and gamma ray measurement techniquesand facilities for neutron activation analysis (NAA) have been initiated in institutions in theseregions. Moreover, there is a growing interest among many institutes in applying moreadvanced analytical techniques, such as particle induced X ray emission (PIXE) andmicroanalytical techniques based on X ray emission induced by conventional sources orsynchrotron radiation to the analysis of environmental and biological materials and industrialproducts.
In order to define new areas of application of NATs and to extend the range of thesetechniques, a number of initiatives have recently been taken. It includes a workshop onindustrial and environmental applications of nuclear analytical techniques, organized by theIAEA in Vienna, 7-11 September 1998.
The main objectives of the workshop were as follows: (1) to review recent applicationsof NATs in industrial and environmental studies; (2) to identify emerging trends inmethodologies and applications of NATs; (3) to demonstrate analytical capabilities of selectedNATs.
The following topics were reviewed during the workshop: (1) XRP and acceleratorbased analytical techniques; (2) portable XRF systems and their applications in industry,mineral prospecting and processing, (3) portable gamma ray spectrometers; and (4) NAA andits applications in industry and environmental studies. Micro-XRF and micro-PIXE methodsand their applications in the above fields were also discussed, including aspects of synchrotronradiation induced X ray emission.
The major part of the drafting of the final version of the reviews was done byJ. Kucera. The IAEA officers responsible for this publication were A. Tajani, Agency'sLaboratories, Seibersdorf, and U. Rosengard, Division of Physical and Chemical Sciences.

EDITORIAL NOTE
In preparing this publication for press, staff of the IAEA have made up the pages from theoriginal manuscripts as submitted by the authors. The views expressed do not necessarily reflectthose of the IAEA, the governments of the nominating Member States or the nominatingorganizations.
Throughout the text names of Member States are retained as they were when the text wascompiled.
The use of particular designations of countries or territories does not imply any judgement bythe publisher, the IAEA, as to the legal status of such countries or territories, of their authorities andinstitutions or of the delimitation of their boundaries.
The mention of names of specific companies or products (whether or not indicated asregistered) does not imply any intention to infringe proprietary rights, nor should it be construed asan endorsement or recommendation on the part of the IAEA.
The authors are responsible for having obtained the necessary permission for the IAEA toreproduce, translate or use material from sources already protected by copyrights.

CONTENTS
1. INTRODUCTION..................................................................................................................1Reference to Section 1 ....................................................................................................2
2. X RAY FLUORESCENCE ANALYSIS..............................................................................^2.1. Wavelength-dispersive X ray fluorescence analysis................................................22.2. Energy-dispersive X ray fluorescence......................................................................3
2.2.1. Conventional energy-dispersive X ray fluorescence......................................32.2.2. Total reflection X ray fluorescence................................................................62.2.3. Micro X ray fluorescence technique ..............................................................82.2.4. Portable X ray fluorescence......................................................................... 10
Reference to Section 2 ..................................................................................................133. PORTABLE GAMMA RAY SPECTROMETERS ............................................................14
3.1. Recent developments in instrumentation...............................................................143.2. Advantages and limitations of portable gamma ray spectrometers........................ 143.3. Present and emerging applications......................................................................... 14
3.3.1. Environmental measurements and decommissioning operations................. 153.3.2.Nuclear safeguards........................................................................................ 153.3.3.New indoor and field applications................................................................16
References to Section 3................................................................................................. 164. NEUTRON ACTIVATION ANALYSIS ............................................................................17
4.1. Recent developments in methodology and instrumentation ..................................184.2. Advantages and limitations of NAA...................................................................... 194.3. Present and emerging industrial and environmental applications..........................20References to Section 4.................................................................................................21
5. ION BEAM ANALYSIS .225.1. Recent developments in instrumentation and methodology ..................................225.2. Advantages and limitations to other techniques of analysis ..................................235.3. Present and emerging applications of IBA.............................................................24References to Section 5.................................................................................................25
6. CONCLUSIONS AND RECOMMENDATIONS ..............................................................25
ANNEX — PAPERS PRESENTED AT THE WORKSHOP
Current applications of XRF and micro-XRF techniques in environmentaland industrial fields..............................................................................................................29R. van Grieken, J. Injuk
Current environmental and industrial applications of XRF technique atthe University of Costa Rica................................................................................................ 3 9M.A. Salazar
Environmental and industrial applications of XRF and related techniquesat the Institute of Nuclear Science, University of Nairobi, Kenya.......................................51A.L. Kinyua, C.K. Gatebe, M.J. Mangala, DM. Maina, A.K. Korir, K. Odhiambo,R. Kwach, S. Bartilol, N. Njau L, E.A. Mukolwe
Portable X-ray fluorescence analysis ........................................................................................67P.J. Potts

Accelerator-based analytical techniques using ion and photon beams — environmentaland industrial applications...................................................................................................81K.G. Malmqvist
Portable gamma ray spectrometers and spectrometry systems .................................................95P Shebell
Portable gamma spectrometers for environmental and industrial applications at theInstitute of Preventive and Clinical Medicine in Bratislava..............................................103M Fulop
Selected industrial and environmental applications of neutron activation analysis................ 117J Kucera
Reactor neutron activation for multielemental analysis..........................................................131A.VK Reddy
List of Participants.................................................................................................................. 147

1. INTRODUCTION
What are nuclear analytical techniques (NATs)?
In principle, NATs may be considered to be based on the utilisation of certainproperties of the nucleus itself, in contrast to non-nuclear techniques which utilise theproperties of the atom as a whole, primarily governed by the properties of electron shells. Thisfeature of NATs might be taken as a basis for the very narrow definition. It should be pointedout, however, that a contradictory "narrow definition" was recently given by de Goeij andBode [1.1]. On the other hand, the term NAT is frequently associated with the phenomena ofionising radiation and isotopes. Thus, besides nuclear excitations, nuclear reactions and/orradioactive decay, the utilisation of the processes involved in electron inner shell excitations isalso regarded as pertinent to NATs. Moreover, some of the NATs of the latter category, suchas synchrotron radiation-induced X ray emission and PDCE can only be performed usingnuclear instrumentation, namely various accelerators. According to the above "narrow"definitions, there also are techniques which certainly fall into the category of NATs butsometimes are not considered in this context. Examples are mass spectrometry, nuclearmagnetic resonance (NMR) and the use of stable isotopes, because in these techniquesionising radiation is neither produced nor utilised.
Whereas in non-nuclear techniques isotopes of the same element generally cannot bedistinguished, in some NATs specific isotopes are measured instead of elements. However,since the naturally occurring poly-isotopic elements have constant isotope ratios, directquantitative information on the particular elements is obtained. Since isotopes of a givenelement may be discriminated, analytical information may be obtained by using elementenriched in a particular stable isotope or labelled with a radioisotope, e.g. in isotope dilutionanalysis. Thus, both nuclear and isotope techniques should be considered under the commonterm NAT.
It appears from the above discussion that fundamentally as well as practically no sharpborderline is useful between nuclear and non-nuclear analytical techniques. Massspectrometry deals with ionised atoms, and rarely with the bare nucleus; however, the signal isdetermined by the mass differences of the nucleus. Some NATs are based not only on nuclearproperties, but on a combination of nuclear and electronic properties, either within a singletechnique or within two techniques. Examples of the first category are NMR and Mossbauerspectrometry, where the nuclear signal is fine tuned by the electron energy levels, also givinginformation on the chemical state. Examples of the second category are modern chemicalseparation methods coupled to radioactivity detection or mass spectrometry. PDCE as one ofthe varieties of ion beam analysis, deals with electron shell ionisation and thus is formally anon-nuclear technique. However, since PDCE requires almost the same equipment as other ionbeam techniques, it is mostly incorporated in the domain of nuclear physics and mostfrequently is considered as a NAT. To a lesser extent this is also the trend for the various newmodes of XRF [1.1].
The various possible definitions of NATs and their discussion justify the selection ofNATs that are included in the present publication. During the workshop, both the invitedexperts and the IAEA staff members presented reviews of the selected NATs concerningmainly recent developments, advantages and limitations, and present and emergingapplications in industry and the environment. The reviews were edited to achieve a similarformat of the individual parts in order to express that the participants agreed on the issues

discussed. In Annexes, presentations of the individual experts are given. They describe inmore detail typical or illustrative applications of NATs or such applications that can beconsidered typical for a certain country or region. No editorial work has been performed inthis part of the publication.
REFERENCE
[1.1] DE GOEIJ, J.J.M., BODE, P., "Nuclear analytical techniques: Strong and weak points,obstacles and opportunities", Harmonization of Health Related EnvironmentalMeasurements Using Nuclear and Isotopic Techniques (Proc. Symp. Hyderabad, India,1996), IAEA, Vienna (1997) 3-15.
2. X RAY FLUORESCENCE ANALYSIS
2.1. WAVELENGTH-DISPERSIVE X RAY FLUORESCENCE ANALYSIS
X ray spectromerry is based on the generation of characteristic X rays from a sampleby an energetic beam of photons or ions. When X ray photons are used as the excitationsource, the technique is called X ray fluorescence (XRF) analysis. In XRF, fluorescencespectra can essentially be measured in two ways. In wavelength dispersive XRF (WD-XRF),the collimated characteristic X rays are spatially resolved by Bragg diffraction from suitablecrystals or multilayer devices and the intensity is then measured with gas proportionalcounters or scintillation detectors. The critical part of a WD-XRF instrument is therequirement for highly precise repositioning of the crystal and detector, which is routinelydone with a repeatability of one thousandth of a degree [2.1-2.7], In the alternative energydispersive XRF (ED-XRF), the characteristic X ray spectrum is measured directly with a solidstate detector. In many ways, the ED-XRF detector technology is directly related to similardevelopments in nuclear technology.
The first WD-XRF instrument of modern design was described in 1948, andincorporated a high-intensity, sealed X ray tube, and a Bragg spectrometer with a Geigercounter detector. Since then, WD-XRF has become the real working horse in industry for theanalysis of solid materials, such as metals, cement, chemicals, glass, ores and geologicalmaterials in general. Usually, solid samples are analysed in the form of metal discs, pelletisedpowders or fused glass discs. There are now some 15 000 WD-XRF units in operationworldwide, in comparison with only 2000 ED units including instruments incorporated inelectron microscopes. Enormous numbers of element determinations are undertaken daily byWD-XRF. In contrast, some 60% of the present XRF literature deals with ED-XRF, reflectingthe fact that WD-XRF is widely used for routine and established applications in industry,rather than in research.
WD-XRF has some advantages over ED-XRF: the spectral resolution of WDspectrometers is better for low-Z elements and commercial systems are generally fullyautomated, and offer better precision in analytical measurements. There have been somegradual but significant improvements in WD-XRF instrumentation over the years; however,no radical and fundamental changes have been noted recently, contrary to what is the case forED-XRF. Also, the price of WD-XRF instruments can be prohibitive for small to mediumenterprises and can vary from some US $ 300 000 for sequential instruments (in whichmeasurements are made by scanning the characteristic lines of selected elements one after

another) to US $ 500 000 or more for dedicated simultaneous systems. In view of the currentstatus of XRF and the fact that the IAEA has to date focused mostly on the ED-XRF mode,WD-XRF will not be considered in detail in this review.
2.2. ENERGY-DISPERSIVE X RAY FLUORESCENCE
ED-XRF emerged around 1965 with the development of Si(Li) semiconductordetectors capable of spectrally resolving X ray fluorescence lines of neighbouring elements. Inmost of the developing countries, the use of ED-XRF was started with the implementation ofIAEA technical co-operation (TC) projects, accompanied by the provision of equipment andexpert services. Although it has never been as widely accepted in industry as WD-XRF, thetechnique is now being utilised in the determination of major and trace elements in solid andliquid samples, both of organic and inorganic origin, pertaining especially to industry,agriculture, geological, water and particulate matter, but mainly in research and universitylaboratories worldwide. This is reflected in the relatively large fraction of the literaturededicated to developments in ED-XRF.
2.2.1. Conventional energy-dispersive X ray fluorescence
Although ED detectors were originally used in X ray tube excitation XRF instruments(using both direct tube and secondary target excitation configurations) and in electron beaminstruments, they are now also widely used in combination with excitation by radioisotopes(including in portable instruments), charged particle and synchrotron radiation beams, and inspecial geometries such as total-reflection XRF (TXRF) and microbeam XRF. Specificsections below will be dedicated to these configurations.
2.2.1.1. Recent developments in conventional ED-XRF
There has recently been significant progress in the instrumentation for ED-XRF.Polarised beam excitation, allowing lower detection limits, has recently become commerciallyavailable as well as pen-size X ray tubes for use in portable instruments [2.8]. Major progresshas, however, been made in detector technology. The conventional liquid-nitrogen cooledSi(Li) detector has a best spectral resolution of around 135 eV (FWHM @ 5.9 keV). Si(Li)detectors with ultra-thin entrance windows have become available; which allow the detectionof the soft X rays from low-Z elements like carbon, nitrogen and oxygen. Thermo-electricallycooled Hgt detectors have been available for a while, mostly for use in portable instruments,and their resolution seems difficult to improve below 280 eV [2.9].
The new Si PIN diodes for low-Z elements and the CdZnTe detectors for higherenergies, operating slightly below room temperatures, are emerging and exhibit a resolutionaround 200 eV [2.10-2.12]. A potential important development, however, has been theintroduction of experimental superconducting tunnel junction (STJ) [2.13-2.14] andmicrocalorimeter detectors [2.15-2.16], which have a spectacular resolution of 30 and 10 eV,respectively. However, these devices must operate below 1 K and rely on superconductortechnology. If these detectors were to become commercially available, they wouldrevolutionise ED-XRF and supplant WD spectrometer systems. One can only say that, atpresent, the development in the field of ED-detectors is so fast, that one cannot reliablypredict their future role and advantages.

2.2.1.2. Advantages and limitations of conventional ED-XRF
For qualitative analysis, modern ED-XRF can cover a wide range of elements, betweenboron and uranium. In typical environmental samples, some dozen elements can be assessedsimultaneously [2.17]; this is only superseded by neutron activation analysis (NAA), which isinherently much slower, and by inductively coupled atomic emission (ICP-AES) or massspectrometry (ICP-MS). The latter technique is, however, often prohibitively expensive. Forquantitative analysis, ED-XRF offers a large dynamic range, from the mg kg"'-level to 100%m/m, and when preconcentration of samples is incorporated, this range can be extended downto the jag kg"'-level [2.18]. In principle, ED-XRF can analyse a wide variety of samples, but,by its nature, it is more suitable for solid samples, while more common techniques like atomicabsorption spectrometry (AAS) and ICP-AES work preferably on liquid samples.
Conventional ED-XRF is not optimal for very low-Z and high-Z elements. Thecommonly-used Si(Li) detectors have relatively poor spectral resolution usually necessitatingthe use of sophisticated computer programs for spectrum evaluation (but powerful andaccurate procedures have been developed). These detectors need to be cooled by liquidnitrogen. Also, the methodology for accurate analysis of samples of variable thickness, withsignificant matrix effects, requires rather complicated methodologies, both for ED-XRF andWD-XRF, but these procedures were developed a long time ago.
2.2.1.3. Present and emerging industrial and environmental applications
a) IndustryIn contrast to WD-XRF, ED-XRF has not been extensively adopted by many industrial
laboratories for routine everyday analysis. This is related to the somewhat inferior precision ofED-XRF measurements in comparison with WD-EXRF and absence of complete automationon most commercial ED-XRF instrumentation. However, the successful advent of benchtopED-XRF units, dedicated to specific applications or elements, e.g. sulphur in oil, has beennoted in the past years. Where conventional ED-XRF is widely used in industry, it isnowadays mostly in combination with WD-XRF, for example in instruments with dedicatedapplications in some cement and petrochemical industrial laboratories. Furthermore manyspecial analyses are done every day by IAEA sponsored laboratories, using ED-XRF, for localindustries and small to medium enterprises.
b) Atmospheric aerosolsDuring the last couple of years, there has been a significant re-emergence of interest in
atmospheric aerosols. This is due to:(i) the role that aerosols (might) play in climate change by scattering incoming sunlight and
by enhancing cloud formation, in compensating for the heating of the Earth by the well-known greenhouse gases.
(ii) the recently proven detrimental health effects of micrometer-sized particles(iii) the role of aerosols in depositing micropollutants and nutrients on land and in the ocean.
ED-XRF remains the method of choice for the monitoring of aerosols, mostly for heavymetals. Not surprisingly, there is a huge and expanding literature on this field. No othertechnique is capable of analysing directly loaded aerosol filters. The popular AAS and ICP-AES techniques require dissolution of particle loaded filters, implying dilution and the risk ofincomplete decomposition of refractory phases. ED-XRF is, therefore, extensively used e.g.

by the US Environmental Protection Agency for monitoring air quality. Suitable filter typesfor ED-XRF are cellulose filters, Teflon filters and polycarbonate membranes, but not glassfibre filters (in view of their inorganic impurities). WD-XRF is now also used increasingly forair pollution monitoring, because it can determine important elements which are difficult byED-XRF, such as cadmium and mercury. Because of the higher exciting beam intensitiesavailable in WD-XRF, the choice of the filter material capable of resisting the exciting beam,is somewhat more critical. For very low concentrations (e.g. for aerosols from remote areas)and for size-fractionated aerosols, particle induced X ray emission (PDCE) and TXRF mightbe more suitable X ray analysis techniques.
c) Liquid samplesLike WD-XRF, ED-XRF can be used for the direct analysis of liquid samples,
prepared in special cups with very thin bottom, which must be analysed in air or under heliumatmosphere. The detection limits are then mostly in the mg kg"1 range. This technique isvaluable for a number of industrial applications, including the analysis of brines, and processand waste waters and for the determination of elements such as Cl and S. However, forenvironmental waters and for monitoring heavy metals, the detection limits are some threeorders of magnitude too high. Therefore, a range of chemical preconcentration methods havebeen proposed over the years, for the analysis, e.g. of natural waters in combination with ED-XRF. These include extraction methods, use of ion exchange columns and ion exchangemembranes, chelation followed by immobilisation, precipitation and co-precipitation. Thereare quite a few complications, though, in each of these approaches and apparently no panaceaexists for the simultaneous determination of many elements and their possibly differentchemical species, with high sensitivity, simplicity and low-cost. Nevertheless, there is clearlyrenewed interest in applying ED-XRF to e.g. dilute industrial water samples and for waterpollution monitoring. Physical preconcentration can simply involve the evaporation a watervolume on to a thin carrier and measuring the residue. For water samples with a low saltcontent, a high enrichment can, of course, be achieved, but higher salt loads and the formationof finite crystals can lead to unpredictable matrix effects so complicating this approach. Yet,there seems to be a considerable interest at present in applying evaporation preconcentrationin combination with micro-XRF, for the analysis of clean reagents, reactor cooling water,industrial process waters and environmental waters.
d) Biological materialAlthough conventional ED-XRF is able to determine directly a number of elements in
some biological materials, e.g. human hair and teeth (and has been used much in this context),the concentrations of the environmentally or lexicologically relevant elements in soft tissuesare usually too low so that some prior preconcentration step is needed. This implies an addedrisk of contamination, so that TXRF, but also other techniques such as ICP-AES and -MShave distinct advantages.
e) Geological materialIn nearly all geochemical and environmental relevant materials, such as minerals and
ores, soils and sediments, many elements are present at levels that can directly be assessedwith conventional ED-XRF (although WD-XRF might be superior in low-Z element detectionand in achieving higher precision, as was discussed above). The only sample preparationrequired is usually grinding followed by pelletising or fusion with a suitable flux, in order toreduce mineralogical effects and improve the accuracy. Sediments are very interesting asintegrating monitors of water pollution by heavy metals, and this field continues to be an idealapplication for ED-XRF.

2.2.2. Total reflection X ray fluorescence
2.2.2.1. Recent developments in methodology and instrumentation
TXRF is a specialised excitation mode for ED-XRF analysis. In TXRF, the excitingbeam is highly collimated in the vertical plane, and it impinges at a very small angle on a flat,polished sample or support (usually quartz or Plexiglas) carrying a minute amount of sample.If the angle of incidence, of this incident beam, is below the critical angle (a few minutes of adegree), the beam will practically not penetrate into the flat sample or support but be totallyreflected. In this way, practically no scattered X rays are generated, and the backgroundmeasured by a Si(Li) detector (positioned at right angles to the sample) will be extremely low,so that very advantageous detection limits can be achieved. Although TXRF was originallydeveloped in the 70s, its importance has grown much in the 90s, mainly because of the wideavailability of commercial TXRF instruments and the growth of applications in the electronicindustry [2.19].
The TXRF module that has been provided by the IAEA to laboratories in developingcountries is manually calibrated, with some practical inconvenience but with a very low cost.The IAEA's laboratory has now developed a complete computerised instrument capable ofproviding more reliable results [2.20]. Compact instruments are also commercially availablefrom several manufacturers [2.21], commonly using a line-focus X ray tube. A rotating anodesource can also be used to provide higher excitation intensities [2.22].
Various laboratories have investigated improvements in excitation optics forconventional TXRF instruments but one of the most significant recent improvements in TXRFis the use of synchrotron radiation (SR) X ray beams as the excitation source. As an example,this technique has the capability of determining elements from Fe to Zn down to 108 atomscm"2 on silicon wafers [2.23]. A further important development is the introduction ofwindowless Si(Li) detectors, which permit the determination of low-Z elements, such as C, N,O, F [2.24].
Some related techniques have recently been developed. In Grazing emission X rayfluorescence (GEXRF) spectrometry, the sample is irradiated at approximately right angleswith an uncollimated polychromatic beam and only the part of the fluorescence radiationemitted at grazing angles about the flat carrier or sample, is detected by a WD spectrometer[2.25-2.26]. Performance should be comparable to TXRF, but the WD-detection systemshould allow measurement of low-Z elements with better resolution and sensitivity than canbe done with a conventional Si(Li) detector in TXRF.
2.2.2.2. Advantages and limitations of TXRF
TXRF allows the direct analysis of liquid samples by simply spotting an aliquot onto apolished carrier. Since the detection limits for the analysis of dilute liquids can be as low asthe ng/L-level, ultratrace elements can be assessed simultaneously. In this way, TXRF iscomparable to ICP-AES and ICP-MS. In view of the extreme detection limits in TXRF, therisk of significant contamination is, of course, relatively high, and all manipulations must becarried out in a clean hood.
Solid samples can also be analysed, either after microgram of material amounts havebeen deposited on a polished carrier (e.g. air particulate or minute amounts of paint) or, more

commonly, after a suitable dissolution step. In the latter way, again, TXRF has a similarcapability to AAS, ICP-AES and ICP-MS. The residue of a dissolved solid sample, depositedon carrier, should be of more than microgram quantities so that the detection limits of TXRFare not jeopardised.
In view of the small amounts of sample involved, matrix effects are minimal andquantification in TXRF is simply carried out by adding an internal standard and by the use ofrelative sensitivity factors.
The possibility of performing surface analysis of flat samples, such as wafers, near-surface depth profile mapping (by scanning around the critical angle), and assessment of thedensity, thickness and composition of surface microlayers is an important advantage of TXRFparticularly for applications in the electronics industry.
2.2.2.3. Present and emerging industrial and environmental applications
In the environmental field, TXRF has successfully been applied to the analysis ofdifferent waters, such as rainwater, drinking water, river water, seawater and even wastewater[2.27]. If the total dissolved content of water sample is relatively high, the sample preparationcannot consist of simply spotting a droplet of water on a carrier. It is then necessary to applyspecific preparation methods to remove the salt content. This is a significant complication forthe versatile analysis of waters.
TXRF is also suitable for the analysis of airborne particulate matter, where thecollection of air dust is carried out by filtration (and subsequent filter dissolution) or by directimpacting of the aerosol on the quartz or Plexiglas carrier [2.28]. TXRF is capable ofdetermining numerous elements down to detection limits of 0.2 ng m"3, even when a simpleand low-cost TXRF module is used.
Some inorganic materials, like soils, sediments, sewage sludge and incinerator slaghave been analysed by TXRF after digestion and preferably after matrix removal.
Pollution monitoring can be done through the analysis of plants and vegetables, wherenitric acid digestion or cold plasma ashing of the freeze-dried and pulverised components arepreferred. Tissue samples can be analysed after ashing or digestion, but often it is moreconvenient to analyse directly thin sections obtained by microtome cutting.
In the semiconductor industry, the method is booming; it has already achievedimportance for the surface contamination control of wafers, where the analysis is done with nochemical preparation, to detection limits of around 108 atoms cm"2. Multielementdeterminations of about 20—25 elements can be performed simultaneously with commerciallyavailable second generation instruments. The unique capabilities of TXRF for depth profiling(e.g. of ion implants) and measuring the composition, density and thickness of surfacemicrolayers, as mentioned above, are becoming of high importance in the electronics industry.This interest will certainly increase further, now that TXRF is increasingly used incombination with SR-sources to achieve even greater sensitivities, and windowless Si(Li)detectors are used so that also low-Z elements can be determined.

2.2.3. Micro X ray fluorescence technique
2.2.3.1. Recent developments in methodology and instrumentation
The recent evolution and production of new sophisticated X ray optics have given abig stimulus to the development of microanalytical techniques. In particular, laboratory tube-excited XRF microprobes are now becoming widely used due to the low cost of the systemscompared to those based on SR-XRF or PDCE. Because of the much higher X ray beamintensities and the possibility of tuning the energy of the beam exciting the sample, SR-XRFmicroprobes have much greater potential for high sensitivity trace element determinations aswell as chemical state analysis using X ray absorption techniques.
In microanalytical systems, the incoming beam is collimated and/or focused down todimensions in the range of few micrometres by means of optical elements which can compriseglass capillaries, lenses or, in case of SR-XRF sources, sometimes, mirrors. Glass capillaryoptical elements produce a very fine focused photon beam through repeated total reflection onthe inner walls of the tube [2.29]. Glass capillaries can also be used for SR- XRF and since theinitial beam is much more intense, it will be possible to produce very small foci with veryhigh photon flux. At the present there are four different types of X ray capillaries available:monocapillary concentrators which can be parallel-bore, conical, or ellipsoidal and monolithicpolycapillary lenses (also known as Khumakov lenses).
Parallel bore capillaries are used to transport X rays from a suitable X ray source out tothe sample, eliminating the 1/r2 losses that occur when X rays are propagated away from anisotropic point source. Conical capillaries work in a similar way but when transporting theradiation from the source to the sample they also 'squeeze' the X ray beam down to thecapillary output diameter. Ellipsoidal capillaries are a recent innovation. In case of an idealellipsoidal capillary, an X ray originating from one of the two focal points will be transmittedto the other focal point. To achieve best resolution in the transmitted beam, in the case ofparallel-bore and conical capillaries, the sample must be placed as close to the end of thecapillary as possible, and at the point of focus in the case of ellipsoidal capillaries.
Monolithic polycapillary X ray lenses consist of a very large number of parallel-borecapillaries bundled together so that each transmits X ray photons from the source to the same'focal point'. The main advantage of the polycapillary lens in comparison with monocapillariesis that a much larger solid angle of X ray photons is transmitted from the source, substantiallyincreasing the intensity available for excitation on the sample. Polycapillary devices arecompact and very sophisticated and for this reason, only very few laboratories in the worldcan produce them.
A typical micro-XRF system consists of an X ray source, a focusing or collimatingdevice, a motorised sample stage with a microscope and an X ray detector. Most micro-XRFsystems incorporate a conventional Si(Li) detector. Several manufacturers offer micro-XRFinstrumentation based on capillary optics with spatial resolutions of between 10-250 um.
The SR-XRF microprobes can presently use a probe size down to at least a fewmicrometers and produce sub-mg/kg detection limits for many elements. One addedadvantage of the very high available intensity from SR snirces is the possibility to performsimultaneous X ray crystallography (micro-XRD). In adc.aon, the SR facilities offer several

other techniques for obtaining chemical and structural information, such as EXAFS (extendedX ray absorption fine structure) and XANES (X ray absorption near edge structure) [2.30].
2.2.3.2. Advantages and limitations of micro-analytical techniques
Since micro-XRF is based on the excitation of the characteristic X rays byelectromagnetic radiation, the scattered X ray background contribution to spectra isconsiderably lower than the Bremsstrahlung contribution to electron probe X raymicroanalysis (EPXMA) spectra. This feature combined with relatively high total X ray yieldsfor excitation by photons results in extremely advantageous detection limits, in the order ofio-14
g.Another advantage of micro-XRF based on X ray tube excitation is the possibility of
performing measurements in air so permitting the analysis of biological materials withoutsophisticated sample preparation procedures. Another important advantage of micro-XRF incomparison with EPXMA and PDCE is the considerably lower energy dissipation by theexciting beam, which results in reduced thermal damages and often negligible losses of thevolatile elements. The much larger penetration power of photons, relative to charged particlesin particular in light matrix, enables one to analyse thicker layers which might improverepresentativeness of results from the material under investigation. Finally, the simplicity andrelatively low cost of micro- XRF systems can be another advantage compared to EPXMAand PIXE. In contrast, a major disadvantage of the technique is the lower degree ofautomation and the poorer spatial resolution that is not the case for SR-XRF where thefocused photon beam is used for the analysis at a lateral resolution of a few micrometers[2.31]. Because of the restricted access to facilities offering these analytical characteristics,micro-SR-XRF can only be used for carefully selected samples. There is also a more generallimitation of XRF in accurately quantifying analytical results in unknown matrices. This isbecause the correction for attenuation of the primary photons as well as of the characteristic Xrays produced in the specimen will be uncertain. This is true also for SR-XRF. However, sincerelatively thin specimens are normally used for micro-SR-XRF this is less of a problem.
2.2.3.3. Present and emerging industrial and environmental applications
There is a strong interest from industry in the application of micro-analyticaltechniques. Many analytical problems can be solved with a lateral spatial resolution ofbetween 10 and 100 um. Demonstrated applications to date include control of film thicknessand composition in the plating and microelectronics industries, control of elementalsegregation in the metallurgical industry, evaluation of micro-corrosion and other processcontrol problems affecting material production.
Environmental applications of micro-XRF mainly involve the characterisation ofindividual particles. EPXMA and micro-PIXE as well as micro-SR-XRF are also used in thisapplication for the determination of elemental composition. It has also been shown possible toperform micro-XRD for structural information on the material present in these singleparticles. Another example is the study of variations in the trace element composition of woodby analysing individual tree rings by micro-XRF.
A recent trend is to apply micro-XRF to the analysis of water after evaporation of asmall aliquot of the sample onto a foil. Compared to all older work involving the evaporationof water samples on a filter or a thin film for conventional ED-XRF, three innovations are

involved here: (1) the new carrier foils, on which a few microlitres are spotted, are muchthinner now (0.15-0.3 um versus 3-7 um in earlier work, so that less scattered X raybackground is produced) but still sufficiently strong, (2) the foils are provided with dimples ora surface texture so that the residue water residue is collected in a very small spot only, and(3) a micro X ray beam is used so that supporting foil material outside the sample deposit doesnot contribute to the scatter background. Some quantification problems remain, particularlyfor lighter elements, but detection limits in the ug/L-range have been claimed for bothenvironmental and industrial waters.
As well as these applications, it is worth mentioning art and archaeometry, whereinstruments using capillary optics have been used for local and non-destructive analysis offragile and precious artistic objects.
Regarding micro-SR-XRF, high-resolution measurements lend themselves towardsanalysis of very small structures. Micro-SR-XRF has been used for archaeological studies toanalyse corrosion in ancient glass objects [2.32]. These results have also been compared withthose obtained by nuclear microprobe-based micro-PIXE analysis on the same specimen. Thefact that PDCE is a better choice for low-Z elements and SR-XRF for high-Z was confirmed.
Geochemistry is another field where micro-SR-XRF has important potential. Thepossibility of tuning the photon energy to optimise the excitation of specific elements andsuppress the excitation of others can be very useful, for instance, for the detection of noblemetals in minerals. The non-destructive character and high penetration power of both theexcitation and the fluorescence X rays makes micro-SR-XRF ideal for analysing unopenedfluid inclusions in minerals. The composition of the fluid inclusion can reveal information onconditions during mineral genesis, of basic geological interest, but also on the conditions forthe formation of economically important ores.
In investigation of heavy metal uptake using a microprobe at mm resolution facilitatesa detailed study of the distribution. Micro-SR-XRF has been used to investigate leaddistributions in human tibia and deciduous teeth [2.33].
2.2.4. Portable X ray fluorescence
2.2.4.1. Recent developments in methodology and instrumentation
Portable XRF is a category of instrumentation that can be carried into the field andused to analyse samples directly in a non-destructive manner. The technique is unusual in thatit is not necessary to remove samples to the laboratory; furthermore, after quantification,results can be displayed immediately after acquiring a spectrum. Instrumentation normallycomprises a hand-held analyser unit incorporating up to three radioactive excitation sourcesand an ED X ray detector. The analytical reference face of this unit is placed on or heldagainst the object to be analysed. Spectrum counting times are normally between 50 and 200 sand spectral data is acquired and analysed in a portable data acquisition and analysis unit.Nominally, all the elements above K in the periodic table can be measured, taking account ofthe detection limit performance of the instrument. However, to achieve full elementalcoverage, three excitation sources are usually required (almost always 55Fe, 109Cd and 241Am).A recent innovation has been the development of miniaturised X ray tubes, which are likely tohave an important role as an alternative excitation source in this category of instrument. Three
10

types of detector are commonly used in portable XRF instrumentation. The Si(Li) detector(which represents the 'industry standard' in terms of energy resolution, but requires cryogeniccooling), the simple proportional counter detector (which is simple, robust and relativelycheap, but offers poor energy resolution such that care is required in assessing its applicabilityto an analytical problem), and the relatively new Hgk detector [2.34] (which offers slightlyinferior resolution to the Si(Li) detector, but does not require cryogenic cooling). However,ED X ray detector technology is a rapidly developing field and several other semiconductormaterials and configurations are likely to make a significant impact on future generations ofportable instrumentation, including Si PIN [2.35], CdZnTe and possibly Ge detectors.
2.2.4.2. Advantages and limitations of portable XRF
Portable XRF has some unique analytical capabilities that are unmatched by otheranalytical techniques. It is one of the few techniques that is capable of the direct elementalanalysis of samples in situ without the need to remove samples to the laboratory. The onlyrival in this respect is portable spark-source optical emission spectroscopy, which has beendeveloped primarily for alloy identification and sorting, and is hi any case inappropriate fornon-conducting materials. Portable XRF has, therefore, some important advantages. The firstis that decisions can be made interactively in the course of a sampling programme. That is,selection of the next sample to be analysed can be made on the basis of the analytical resultsjust acquired. This capability is important in assessing contaminated sites, for example, wherethe objective might be to locate "hot-spots' to characterise the source of contamination.Another example is hi directing underground mining operations in locating ore veins. Asecond important advantage is that because samples can be analysed in situ and non-destructively, it is possible to analyse rare and valuable objects that cannot be removed fromtheir storage or display location, in particular for reasons of security. Examples include goldand precious metal bullion, unique museum artefacts, paintings and other works of art,illuminated manuscripts etc. A third advantage is in the direct analysis of objects in the fieldthat cannot be sampled or where there are logistical difficulties in returning samples to thelaboratory for analysis. Examples would be:(a) Archaeological or architectural samples that can neither be removed to the laboratory, nor
have material removed from them.(b) Artefacts contaminated with toxic material, where it is judged too hazardous to move or
disturb the sample.(c) The analysis of remote samples where it is judged better to take the instrument to the
sample rather than the other way round.No alternative analytical technique can satisfy these requirements.
Having outlined the unique advantages of the portable XRF technique, it is alsoappropriate to summarise its limitations. Most of the limitations relate to sample presentationand the relatively small mass of material on the surface of the sample from which the XRFsignal originates. When samples are analysed directly by portable XRF (as in the applicationssummarised above), it is usually not possible to undertake any sample preparation. In somecircumstances, the accuracy of analytical results will be affected by the nature of the surfacebeing analysed. Quantitative results can only be obtained directly if the analyser is placed on aflat (polished) surface. Measurements made on samples with irregular or broken surfaces willsuffer discrepancies because the irregular surface will not lie exactly in the analytical plain ofthe instrument. Discrepancies that arise from surface irregularity effects can be correctedusing an empirical correction based on measuring scatter peak intensities [2.36]. As in all
11

XRF applications, the detected analytical signal originates from a depth within the sample ofbetween a few tens of um to several mm (depending on the energy of the fluorescencephoton). Where portable XRF measurements are used to infer information about the bulkcomposition of the sample, care must be taken to avoid surface effects (e.g. unwantedweathering or corrosion products or surface deposits) which might affect the interpretation ofresults. Furthermore, it will normally be important to undertake replicate determinations sothat sampling effects (e.g. statistical variations in the minerals present in the excited volume)can be quantified. Unless replicate determinations are made, sampling precision cannot bedetected.
2.2.4.3. Present and emerging industrial and environmental applications
The most popular current applications of portable XRF instrumentation is in assessingthe environmental impact of lead contamination associated with both contaminated soil [2.37]and paint. In the case of contaminated land, the main reason for use of the instrumentation isthat portable XRF detection limits are 5 to 10 times lower than 'action' limits for lead in soil.For many of the other toxic metals of environmental interest, the portable XRF detectionlimits are too high to permit adequate determination down to the action level, althoughinstrumentation may be of value in characterising gross contamination. In the case of paint,portable XRF can provide a rapid assessment of the presence of lead-bearing paint and canalso detect lead paint that is covered by more recent coats. Given the considerablecontemporary interest in environmental issues, not the least resulting from the US Superfundprogramme which has stimulated research into the remediation of highly contaminated site,there is likely to be a continuing expansion in the application of portable XRF toenvironmental studies, particularly of lead contamination.
A number of studies have also been published describing the portable XRF analysis ofarchaeological samples, museum artefacts, works of art etc. Traditional analytical methodsnormally involve the removal of small amounts of material from the artefact for analysis byhigh sensitivity techniques. Where such an approach can be justified because of the quality ofresults (better detection limits, capability of determining specific elements) traditionaltechniques are likely to continue to be used. However, it seems probable that in a majority offuture studies, the removal of material for analysis will become unnecessary because of thenon-destructive capabilities of the portable XRF technique and the fact that in situ analysis byportable XRF is likely to facilitate easier access to a wide variety of valuable objects.
However, arguably the most important area of application that has not yet been fullyexploited is industrial applications. It is not simple to generalise, but typical investigations arelikely to be in the raw materials industry in:(i) Trouble-shooting and optimising plant operation(ii) Checking the composition of waste materials.(iii) Detecting contamination resulting from plant malfunction.In the mining and mineral exploration industries, there is also a clear role for the portableXRF technique in characterising mineralisation as a contribution to both exploration projectsand in directing mining operations.
The final area of application to which the portable XRF technique is likely to make asignificant application is health and safety. Instrumentation has the capability of identifyingwork place dusts and contaminants, as well as the site analysis of air filters. All these
12

capabilities are likely to be of interest to regulatory authorities and industrial health and safetyconsultants.
REFERENCES
[2.1] COMPTON, A.H., ALLISON S.K., X-rays in Theory and Experiment, Van Nostrand,New York (1935).
[2.2] BIRKS, L.S., X-ray Spectrochemical Analysis, 2nd edn, Interscience, New York,(1969).
[2.3] DYSON, N.A., x-rays in Atomic and Nuclear Physics, Longman, London, (1973).[2.4] JENKINS, R., An introduction to X-Ray Spectrometry, Heyden, London (1974).[2.5] BERTIN, E.P., Principles and Practice of X-Ray Spectromic Analysis, 2nd edn, Plenum
Press, New York (1975).[2.6] JENKINS, R., DE VRIES, J.L., Practical X-Ray Spectrometry, 2nd edn, Springer-
Verlag, New York (1967).[2.7] TERTIAN, R., CLAISSE, F., Principles of Quantitative X-Ray Fluorescence Analysis,
Heyden, London (1982).[2.8] Swedish Patent 95018111-5; US Patent 5,633,908.[2.9] PONPON, J.P., SffiSKIND, M., Nucl. Instr. Methods Phys. Res., 380 A (1996) 173.[2.10]HUBER, A.C., PANTAZIS, J.A., JORDANOV, V., Nucl. Instrum. Methods B99
(1995)665-668.[2.11] CESAREO, R., et al., J. Trace Microprobe Technol. 14 (1996) 711-725.[2.12] JORDANOV, V., PANTAZIS, J.A., HUBER, A.C., Nucl. Instrum. Methods A 380
(1996)353-357.[2.13] KISHJMOTO, M., et al., Nucl. Instrum. Methods Phys. Res. A 370 1 (1996) 126.[2.14] UKJJBE, M., et al., KEK Proc. 96 4 (1996) 114.[2.15] SILVER, E., X-Ray Spectrom. 25 3 (1996) 115.[2.16] LABOV, S.E., et al., Nucl. Instrum. Methods Phys. Res. A 370 1 (1996) 65.[2.17]NGUYEN, T.H., BOMAN, J., LEERMAKERS, M., X-Ray Spectrometry 27 (1998)
265-276.[2.18]DRISCOLL, J.N., FIELD, Int. Environmental Technol. 8/5 (1998) 10-12.[2.19] SCHWENKE, H., KNOTH, J., hi Handbook of X-ray Spectrometry — Methods and
Techniques (VAN GRIEKEN, R. MARKOWICZ, A., eds), Marcell Dekker, New York(1992) 453^90.
[2.20] BERNASCONI, G., DARGIE, M., JAIB, M.M., TAJANI, A., X-Ray Spectrometry 264(1997)203-210.
[2.21] TORBOLI, A., Lab. 2000 9 7 (1995) 48.[2.22] PETTERSON, R.P., BOMAN, J., Nucl. Instrum. Methods Phys. Res. A 371 3 (1996)
553.[2.23] PIANETTA, P., paper presented 45th Annual Denver X-ray Conf., Denver (1996).[2.24] STRELI, et al., paper presented at Eur. Conf. on Energy Dispersive X-ray
Spectrometry, Lisbon (1996).[2.25] CLAES, M., VAN GRIEKEN, R., paper presented at Eur. Conf. on Energy Dispersive
X-ray Spectrometry, Lisbon (1996).[2.26] de BOKX, P.K., et al., paper presented at 6th Conference on TXRF, Eindhoven and
Dortmund (1996).[2.27] KLOCKENKAEMPER, R., von BOHLEN, A., X-Ray Spectrom. 25 (1996) 156.[2.28] VALKOVIC, V., et al., Nucl. Instrum. Meth. Phys. Res. B 113 (1996) 363-367.[2.29] JANSSEN, K.H., ADAMS, F., JONES, K.W., Anal. Chim. Acta 283 (1993) 98.
13

[2.30] JONES, K.W., in Handbook Of X-Ray Spectrometry - Methods And Techniques (VanGrieken, R., Markowicz, A., eds), Marcell Decker, NY (1992) 411-452.
[2.31] JANSSEN, K., et al., Microchim. Acta (Suppl.) 13 (1996) 87.[2.32]AERTS, A., JANSSEN, K., ADAMS, F., WOUTERS, H., Proc. 24th Microbeam
Analysis Society (J. Friel, ed.), NY (1994) 45.[2.33] JONES, K.W., et al., X-ray Microscopy HI, Springer-Verlag (1992).[2.34] POTTS, P., et al., Analyst 120 (1995) 1273-1278.[2.35] YOKHIN, B., paper presented at Pittsburgh Conference (PITTCON '96), Chicago
(1997).[2.36] POTTS, P., et al., J. Anal. Atomic Spectrom. 12 (1997) 768-776.[2.37] ARGYRAKI, A., et al., Analyst 122 (1997) 743-749.
3. PORTABLE GAMMA RAY SPECTROMETERS
3.1. RECENT DEVELOPMENTS IN INSTRUMENTATION
The development of commercially available portable gamma ray spectrometers overthe past decade can be summarised in terms of five basic approaches: (1) stand alone orintegrated spectrometers linked to a notebook or lap-top computer via parallel or serialinterface employing either HPGe or Nal(Tl) detectors; (2) Add-on cards inserted in a lap-topcomputer employing either HPGe or Nal(Tl) detectors; (3) Nal (Tl) detector dedicated PMTbase systems combined with a MCA add-on card or with a portable MCA unit; (4) a CdZnTe(CZT) detector in combination with a stand alone unit consisting of pre-amplifier, amplifier,ADC and MCA; (5) Fully integrated system with a dedicated detector
Due to the rapid development of miniaturised nuclear instrumentation, fully integratedsystems with a dedicated detector will appear more frequently. This means that all theelectronics including display and battery pack will be contained in a single light-weight unit.However, it appears that such instruments are being designed for specific applications andtherefore they cannot be applied for research. Concerning detectors, efforts are continuing tofabricate CZT crystals with large active volumes (>10 cm3). However, it is unlikely that thesedevices will ever be able to match the efficiency of either HPGe or Nal(Tl) detectors.
3.2. ADVANTAGES AND LIMITATIONS OF PORTABLE GAMMA RAYSPECTROMETERS
The advantage of portable spectrometers is the ability to bring existing techniques forgamma ray analysis to the field, as well as providing the opportunity to develop specialisedtechniques exclusively for field applications. Moreover, the quality of currently availableportable systems is such that these units can also be used for research in the laboratory.
3.3. PRESENT AND EMERGING APPLICATIONS
Portable gamma ray systems are primarily used for in situ measurements. Typicalapplications include cargo inspection, non-destructive testing, environmental, industrial,security, and surveillance applications.
14

TABLE I. ADVANTAGES AND DISADVANTAGES OF PORTABLE SPECTROMETERSUTILISING THE VARIOUS DETECTORS
Advantages Disadvantages_____
• excellent resolution (~2 keV@ 1332 keV) • need for cooling• broad energy range (5 keV to 10 MeV) • systems can be large and cumbersome
• large active volumes (up to 400 cm3)
• portable systems can be used forlaboratory applications
Nal(Tl)
• room temperature operation • moderate resolution (8% @ 662 keV)
• broad energy range (5 keV to 10 MeV) • PMT and scintillators are fragile
• can be machined in a variety of size andshapes
CZT
• room temperature operation • small active volumes (~0.05 cm3)
• good resolution (1.5 keV @ 122 keV) • limited energy range (<1 MeV)
3.3.1. Environmental measurements and decommissioning operations
In situ measurements are playing a vital role in many environmental surveillance andsite decommissioning operations. They usually involve measurements at a site for extendedperiods, often from a vehicle or other temporary shelters. They also involve low levelmeasurements for environmental surveillance, or relatively hot samples in the case ofdecommissioning operations
3.3.1.1. In situ spectrometry of soil using portable gamma ray spectroscopy systems (Beckmethod).
A common technique for assessing soil contamination involves use of a "downward-looking" uncollimated HPGe detector positioned 1 m above the ground. The activity per unitmass for a given radionuclide can be derived from the peak count rate using parameters thatdescribe the soil characteristics (moisture, composition, and density) and the depth profile ofthe radionuclide distribution. In general, the calibration of HPGe or Nal(Tl) spectrometers forthe assessment of the radionuclide concentration in soil is done in two steps: (1) thespectrometer is calibrated for fluence rate using certified point sources, and (2) the fluencerate from the source geometry is calculated using the assumed soil and source distributionparameters. A comprehensive discussion of this technique may be found in Refs [3.1, 3.2].
3.3.2. Nuclear safeguards
Portable spectrometers are being used for nuclear safeguards applications. Regulatoryagencies routinely make in situ measurements using portable spectrometers during inspection
15

at nuclear sites. Data collection times are often short, and sometimes must be conducted inhostile environments. A spectrometer utilising a CZT detector can be useful for cargoinspections looking for enriched uranium and plutonium. Both U and Pu emit low energyphotons, and therefore the excellent resolution and compact size of a CZT make it a sensiblechoice for such applications.
3.3.3. New indoor and field applications
Future applications for portable systems will include indoor spectrometry as well asextending current field techniques to a greater variety of objects (drums, boxes, and wastecontainers) and field geometries (limited half spaces, pits, and trenches). New analysistechniques are being developed which will improve the overall accuracy and extend theapplicability of in situ measurements. A few such techniques are briefly described below.
3.3.3.1. In situ measurements using an unfolding method for estimation of depth distribution
An unfolding technique for an estimation of the depth distribution has been developedthat involves a combination of two methods: peak to valley method and change of track lengthdistribution of photons in soil, registered by a collimated and uncollimated detector. The depthdistribution is obtained by unfolding four various responses of in situ measurements. Thisapproach, however, has only been applied to measurement of 137Cs.
3.3.3.2. In situ measurements of radionuclide activity in soil with areas of elevated activity(hotspots).
A method is being developed that utilises a collimator to measure small sections ofground to facilitate a selective searching procedure for hotspot detection. Since scanning acontaminated area looking for hotspots is time consuming and expensive, it is essential that ameasurement strategy be developed to determine the optimal grid size for a given hotspotdiameter.
3.3.3.3. In situ measurements for dosimetry
The determination of ambient dose requires knowledge of the photon energy spectrum.There are two ways of estimating the energy spectrum: the calculation of the angulardistribution of the gamma ray energy spectrum by considering the source and shieldinggeometry (only the gamma dose from the radionuclide of interest is determined), and thedeconvolution of the spectrometer's pulse height spectrum. In this case the total gamma dosefrom radionuclides and cosmic radiation are determined.
REFERENCES
[3.1] INTERNATIONAL COMMISSION ON RADIATION UNITS ANDMEASUREMENTS, Gamma-ray Spectrometry in the Environment, Technical ReportICRU 53, ICRU, Bethesda, MD (1994).
[3.2] BECK, H.L., DECAMPO, J., GOGOLAK, C., In Situ Ge(Li) and Nal(Tl) Gamma-RaySpectrometry, Rep. HASL-258, USDOE Environmental Measurements Laboratory, NY(1972).
16

4. NEUTRON ACTIVATION ANALYSIS
Neutron activation analysis (NAA) is based on irradiation of a sample with neutrons,preferably in a nuclear reactor, and subsequent counting of the induced radioactivity, mostfrequently employing a gamma ray spectrometer with a HPGe detector. For irradiation thewhole reactor neutron spectrum can be used or thermal neutrons can be eliminated, using Cdor B filters to achieve selective activation with epithermal and/or fast neutrons (the so calledepithermal NAA - ENAA and fast NAA - FNAA, respectively). FNAA can also be performedusing 14 MeV neutrons produced by the (d,t) reaction in neutron generators, or with fastneutrons produced in several nuclear reactions of deuterons or protons accelerated in acyclotron. For a limited number of applications isotopic neutron sources based on either thespontaneous fission of 252Cf or nuclear reactions, such as the (a,n) reactions (e.g. 241Am-Be)or the (y,n) reaction (e.g.124Sb-Be) may be sufficient, although they provide a neutron fluencerate which is of several orders of magnitude lower than that obtained in nuclear reactors.
hi many cases NAA can be performed nondestructively, this analysis mode beingtermed instrumental NAA (INAA). In the cases where the induced radionuclides of traceelements are masked by matrix activity, a radiochemical separation (i.e. a post-irradiationprocedure) is mostly used to eliminate matrix activity or to separate the radionuclides ofinterest in the so called radiochemical NAA (RNAA).
For the determination of element concentrations in NAA three types of standardisation(calibration) can be used:
• relative (using synthetic, mostly multi-element standards)
• single-comparator, most frequently employing the so called ko-standardisation
• absolute (parametric).
Since unacceptable uncertainties are still associated with the values of nuclearparameters, namely activation cross sections ao, resonance integrals 70, y ray emissionprobabilities 7, and isotope abundances 0 (in order of decreasing importance), the absolutestandardisation is used only rarely and will not be dealt with in the present report.
In the relative standardisation method, a chemical standard with a known mass of theelement is co-irradiated with the sample of a known mass and both are counted, usually in thesame geometrical arrangements with respect to the HPGe detector, so that the absoluteefficiency of the detector need not be determined. When short-lived radionuclides are to bemeasured both the standard and sample may be irradiated separately using the same reactorconditions, usually with a monitor of the neutron fluence rate.
In the case of relative standardisation, the analysis results are traceable to the materialsused in the preparation of standards. Depending on the purity and stoichiometry of thecompounds used, traceability to the mole can be established.
The concept of the ko-standardisation in NAA, one of the most frequently used single-comparator (monostandard) methods, is based on co-irradiation of the sample and a neutronfluence rate monitor and the use of an experimentally determined composite nuclear constantko. Details of the ko-standardisation have extensively been described in the literature [4.1].
17

In the case of ko-standardisation, the analytical results are linked to the ko-factors,absolute detector efficiency and neutron spectrum characteristics. The ko-factors have beenreliably determined in two independent measurements which were related to purity andstoichiometry of various materials. The absolute detector efficiency calibration is routinelyperformed using internationally recognised radioisotope standards. For determining theneutron spectrum characteristics, internationally recognised certified reference materials forneutron dosimetry are available.(high purity metals or Al alloys containing certified amountsof Au, Co, In, U etc.)
4.1. RECENT DEVELOPMENTS IN METHODOLOGY AND INSTRUMENTATION
Although NAA is sometimes considered as a mature NAT without any dramaticimprovements during the last decade, new developments were recently achieved along severallines: reactor-based irradiation facilities of a new type, enhancement of the INAA capabilitiesby a combination of selective activation and special counting procedures. In RNAA thetendency is to achieve greater simplicity and to develop methods for the determination ofindividual chemical yields for each separation to attain a very high reliability of determinationeven at the ultratrace element level. New, INAA and RNAA procedures have also beendeveloped for the determination of not only elements, but also selected radionuclides that aredifficult to measure by other methods. Advances have been made in pre-irradiation separationin NAA for speciation analysis, and also continuous improvements in NAA hardware(counting devices) and software.
Since some types of samples, including geological and waste material, can beinhomogeneous by nature so that representative direct subsampling is difficult withoutextensive grinding to an acceptable particle size and homogenisation [4.2], a specialirradiation facility was put into operation allowing analysis of large (up to 50-kg size) samples[4.3]. Prompt gamma neutron activation analysis (PGNAA — i.e. on-line measurement ofgamma rays emitted by compound nuclei) appears to be increasingly important for thedetermination of the low Z elements, especially in biological materials. Since the use of coldneutrons increases sensitivity of this technique, the number of cold neutron sources inexperimental reactors is growing. Moreover, PGNAA takes much less time than classicalNAA.
It has been shown that in cases where irradiation in the whole-reactor neutronspectrum followed by conventional gamma ray spectrometry does not provide sufficiently lowdetection limits, a combination of selective activation with epithermal neutrons (ENAA) andselective counting techniques, namely Compton suppression spectrometry, may considerablyimprove the detection limits and thus extend the multi-elemental capability of INAA. Usingthis approach, low detection limits similar to those that can be achieved by RNAA wereobtained for some elements [4.4].
Traditional alpha spectrometry of the radioisotopes of uranium and thorium (used inmany fields involving dating, disequilibrium studies, geological and marine tracing,radioecology etc.) can be advantageously combined with the INAA determination of U and Th(as 238U and 232Th) so as to allow those two nuclides to function as internal standards.Alternatively, if INAA is combined with traditional tracer-added alpha-spectrometry, anindependent data set can be obtained for quality control purposes [4.5]. Another
18

methodological development concerns the determination of a number of radionuclides,namely 235U, 238U, 230Th, 232Th, 237Np, 231Pa, I29I and 99Tc [4.6].
The use of NAA after pre-separation of particular chemical forms before irradiation,sometimes termed "chemical or molecular NAA" is growing, because it allows the utilisationof NAA in the field of speciation. Since facilities, techniques, apparatus and reagents have allbeen greatly improved with respect to minimising contamination, pre separation can often becarried out without prejudicing the results [4.7].
A growth in the range of NAA capabilities and accuracy has also been facilitated byrecent improvements in both hardware and software. In terms of hardware we note theavailability of bigger, higher efficiency detectors, increased usage of well-type detectors andimprovements in the data-handling capacity of electronics, e.g. "loss-free" systems. Softwareis becoming to be more powerful and there has also been a growing awareness of the need tovalidate results and undertake inter-comparison of different software programs.
The use of ko-NAA continues to spread [4.8] and it has been shown how ko factors canbe used to validate and check relative standards in NAA [4.9].
4.2. ADVANTAGES AND LIMITATIONS OF NAA
The advantageous features of neutron activation analysis have recently beensummarised [4.10]. Therefore, only the most important issues are given here as follows:
• sensitivity and applicability for minor and trace elements in a wide range of matrices
• the virtual absence of an analytical blank, if no contamination occurs during samplehandling (which usually only involves inserting a sample in an irradiation vial) prior toirradiation
• the relative freedom from matrix and interference effects
• the possibility to perform analysis in many cases nondestructively - by DSTAA• the capability of ENAA for multi-element determination, often allowing 30 to 40 elements
to be determined in many matrices• an inherent potential for accuracy compared to most of the other analytical techniques.
Since the theoretical basis of NAA is simple and well understood, the sources ofuncertainty can be modelled and well estimated
• the totally independent principle as a nuclear-based property in contrast to the electronicnature of many other analytical techniques
• the isotopic basis which often offers a choice of analytically independent routes forelement determination
• in the cases where the induced radionuclides of trace elements are masked by matrixactivity RNAA can provide interference-free detection limits close to the theoretical ones
• trace and ultra-trace (radio) chemistry can be performed under controlled conditions byinactive carrier additions
• the chemical yield of the separation can be obtained simply using carrier budgeting or theradiotracer method.
19

It is worthwhile elaborating upon some of the above listed advantages of NAA, especially inrelation to other analytical methods. No other analytical technique has the capability toprovide multielement data non-destructively, often with good detection limits and in avirtually matrix-independent manner. This is largely due to: (i) neutron being a non-chargedparticle easily penetrates the sample and reacts with nuclei; (ii) the gamma rays emitted by theinduced nuclides with energies above 100 keV have also a high penetrating power. Both itsinherent potential for accuracy and totally independent principle as a nuclear-based propertymake NAA invaluable as a reference or referee method. The possibility of determining aparticular element using various isotopes, together with the possibility to perform the analysisby INAA and RNAA and to perform other additional checks on the consistency of the results,form the basis for a unique ability to verify the analytical data produced by the technique (theso called self-verification principle of NAA) [4.10—4.11]. It should be pointed out thatalthough the isotopic basis is also employed by a few other analytical techniques, particularlyin mass spectrometry, only in NAA a particular isotope can be selected to provide independentanalytical data. It is also worthwhile noting that RNAA is the only destructive analyticaltechnique in which the separation yield can easily be monitored.Limitations of NAA can be summarised as follows:
• As stated above, NAA needs a neutron source. The nuclear reactor is the best neutronsource, however its maintenance is an economical constraint. For various reasons, manyexperimental reactors have been shut down worldwide during last ten years and often havenot been replaced. Use of isotope and other neutron sources does not often provide thesensitivity required.
• Determination of elements forming long-lived isotopes is time consuming and results in alow throughput of samples
• INAA is insensitive to the nature of chemical species present unless pre-irradiationseparation is carried out. However, this is advantageous when the total concentration hasto be measured irrespective of the chemical state
• For certain elements like Pb, and many elements with low Z, NAA does not providesufficient sensitivity
• Work with samples irradiated in a nuclear reactor requires adherence to radioprotectionmeasures and for these purposes dosimetry services are also needed
• It is prohibited to irradiate liquid samples in some experimental reactors, because anexcessive pressure may be created in irradiation vials.
4.3. PRESENT AND EMERGING INDUSTRIAL AND ENVIRONMENTALAPPLICATIONS
There are several application fields in which NAA has a superior, and in some caseseven indispensable position compared to the other analytical methods. The nondestructiveINAA is especially useful if materials to be analysed are difficult to take into a solution foranalyses using some other techniques. A large number of elements determined may result inthe so called panoramic analysis in which data for over 60 elements can be obtained, i.e. bothvalues of elements determined and element upper limits. This is frequently required inanalysing high purity materials. In such cases, use of the ko-standardisation method whichdoes not require irradiation of element standards is extremely useful as was demonstrated bypanoramic analysis of silicon, silicon wafers and other materials used in the manufacturing ofelectronics components [4.12-4.13]. Panoramic analysis is also in demand for determination
20

of impurities in the raw materials and solvents used in the production of polymers and foranalysis of industrial slurries [4.14]. Other advantageous applications of INAA are in thechemical industry for analysis of catalysts (solids and slurries), and for the determination ofhalogens and other elements in plastics and photographic materials.
Besides high purity materials, the determination of extremely low element levels byRNAA is frequently required for example in the analysis of biological samples. Normalreference concentrations of many essential or toxic elements, such as As, Co, Cr, Hg, Mn, andV in various human and animal tissues and body fluids, especially in blood and its derivativesand in urine, are below the }ig/kg level (dry weight). Using RNAA, it is much easier toprevent sample contamination prior to irradiation than in other analytical techniques involvingsample dissolution and a further chemical treatment. This has been demonstrated, for instance,in determining normal values of vanadium in human blood, serum and urine [4.15]. Anotherimportant environmental application of INAA is the multielemental analysis of atmospheric,combustion and indoor aerosols, especially in the case of atmospheric aerosols collected inremote (unpolluted) regions.
The inherent potential of NAA for both accuracy and precision, and its totallyindependent principle compared to other analytical techniques plays a very important role inquality control of chemical analysis, namely in the certification of reference materials ofchemical composition, including homogeneity testing. It appears that the share of NAA in thecertification of element contents, and especially in homogeneity testing, exceeds that of anyother analytical techniques.
In view of the above features, NAA has found extensive applications in many otherscience and technology fields within the last decade (Cf. Annex X). The trends in variousfields can be summarised as follows. A decline is apparent in NAA applications ingeochemistry, mineral exploration, and in the material science, especially in the developedcountries, due to a strong competition with other more productive trace analytical techniques,namely ICP-MS. The role of NAA biomedical, environmental and health-related studies,including nutritional studies seems to be firmly established. The role of NAA as a reference(or referee) methods in quality control of chemical analysis and in the preparation of certifiedreference materials is one of its most important and also cost-effective uses, becauseinaccurate analyses are the most expensive.
REFERENCES
[4.1] DE CORTE, F., The ko-standardization method: A move to the optimization of neutronactivation analysis, PhDThesis, University of Gent (1987).
[4.2] ACHARYA, R.N., BURTE, P.P., NAIR, A.G.C., REDDY, A.V.R., MANOHAR, S.B.,J. Radioanal. Nucl. Chem. 220 (1997) 223.
[4.3] OVERWATER, R.M.W., BODE, P., DE GOEU, J.J.M., HOOGENBOOM, I.E., Anal.Chem. 68 (1996) 341-348.
[4.4] LANDSBERGER, S., PESHEV, S., J. Radioanal. Nucl. Chem. Art. 202 (1996) 201-224.
[4.5] BYRNE, A.R., BENEDIK, L., Anal. Chem. 69 (1997) 996-999.[4.6] BYRNE, A.R., Proc. 13th Radiochemical Conf. Marianske Lazne, Czech Republic,
1998; Czech J. Phys. (in press).[4.7] INTERNATIONAL ATOMIC ENERGY AGENCY, Enhancement of Research Reactor
Utilization for Neutron Activation Analysis, IAEA, Vienna (in press).
21

[4.8] Proc. 2nd Workshop on k0-INAA, Ljubljana, 1996, J. Stefan Institute, Ljubljana (1997).[4.9] HEYDORN, K., DAMSGAARD, J., J. Radioanal. Nucl. Chem. 179 (1991) 8791.[4.10] BYRNE, A.R., Fresenius J., Anal. Chem. 345 (1993) 144-151.[4.11] BYRNE, A.R., KUCERA, J., "Role of the self-validation principle of NAA in the
quality assurance of bioenvironmental studies and in the certification of referencematerials", Harmonization of Health-Related Environmental Measurements UsingNuclear and Isotopic Techniques (Proc. Int. Symp. Hyderabad, 1996), IAEA Vienna(1997)223-238.
[4.12]DE CORTE, F., DE WISPELAERE, A., VAN DEN BOER, ML, BOSSUS, D., VANSLUIJS, R., Anal. Chim. Acta 254 (1991) 127-143.
[4.13JVERHEIKE, M.L., JASPERS, H.J.J., HANSSEN, J.M.G., THEUNISSEN, M.J.J., J.Radioanal. Nucl. Chem. 113 (1987) 397-404.
[4.14] BOSSUS, D., VAN SLUIJS, R., Proc. 13th Radiochemical Conf. Marianske Lazne,Czech Republic, 1998; Czech J. Phys. (in press).
[4.15] KUCERA, J., BYRNE, A.R., "Quality assurance of neutron activation analysis oftraces of vanadium in workplace air, the environment and human tissues'"Harmonization of Health-Related Environmental Measurements Using Nuclear andIsotopic Techniques (Proc. Int. Symp. Hyderabad, 1996), IAEA Vienna (1997)349-359.
5. ION BEAM ANALYSIS (IBA)
By bombarding a specimen by light ions (protons, deuterons, alpha particles) of a fewMeV/amu, normally produced by a small particle accelerator, close ion-nucleus encountersoccur. By detecting the various signals produced during these interactions with atoms andnuclei in the specimen, the elemental/isotopic composition can be revealed. Ion penetration insolid matrices is normally tens of micrometers and depending on the radiation detected, theanalytically depth probed can vary from sub micrometer to tens of micrometers. The mostcommon techniques are Particle-Induced X ray Emission (PIXE) [5.1], RutherfordBackscattering Spectrometry (RBS) [5.2] and nuclear reaction analysis (NRA) [5.3]. Theanalytical characteristics vary from trace element analysis to depth profiling of near surfacelayers.
5.1. RECENT DEVELOPMENTS TN INSTRUMENTATION AND METHODOLOGY
Since these techniques rely almost entirely on the use of accelerators and relativelycomplex equipment, the crucial development lies in instrumentation. A few clear trends canbe identified regarding instrumentation during the last decade.
Firstly, the equipment used for production of ions is gradually shifting towardsdedicated compact tandem accelerators, attained more or less entirely for applied physicsstudies, including Ion Beam Analysis, accelerator-based mass Spectrometry and ion beammodification of materials. The previously common larger accelerators, originally designed forlow-energy nuclear physics, are being phased out due to age and high running andmaintenance costs. The availability of these new accelerators has made it more feasible to setup new IBA facilities also in environments with less advanced infrastructure. Such a facilitynow only requires a small staff of a few technicians and with proper training, for instance,students and external users can perform experiments with little guidance, leaving theresearchers responsible time to develop new techniques and procedures. The more user-
22

friendly systems also make these techniques easier to implement in an industrial environmentwhere specialist experience is not available.
Secondly, it is possible to purchase almost turnkey systems, including a combinedaccelerator and analytical set-up. These systems clearly represent a step in the directiontowards commercially available self-contained instruments, similar to electron microscopes orwave-length dispersive X ray spectrometers for example.
Finally, there has been a strong interest in the development of micro-analyticalsystems. The first nuclear microprobe was developed in the early seventies but during the lastdecade the technique has matured with a proliferation of such systems (>80 systemsworldwide). The systems needed for collimating, focusing and manipulating the beam are nowcommercially available from several sources and also turnkey "desktop" versions can bedelivered including a very compact accelerator.
The methods involved in IBA depend heavily on the technical specification of theavailable equipment as discussed above. The particle energy range and the ion speciesavailable will determine which IBA techniques can be used. The most common techniquesboth in environmental and industrial applications are still PEXE and RBS, due to the highcross-section and high accuracy, respectively. No real quantum leap in the development canbe observed in these techniques recently but there is a steady evolution. With the increasedinterest in nuclear microprobes - a combination of microanalysis and microscopy - There hasbeen a considerable increase in the simultaneous use of several techniques, e.g. PDCE, RBS,NRA, secondary electron imaging, ionoluminescence, scanning transmission microscopy, iontomography etc.. The demands on data acquisition capability have increased and been mainlyfulfilled because of the rapid development of computers during the last decade.
With the present technology for ion beam optics and ion sources, the best lateralresolution of a nuclear microprobe is about 1 micrometer. The ion current is also limited towithin the range about a few pA to a few nA, depending on the ion beam size. This hasinitiated an on-going development of detection systems with larger solid angles both for Xrays and charged particles. The progressive development in detector technology, for instance,the improved energy resolution and detector cooling by Peltier elements, has also been verybeneficial for the DBA field.
The limitations of IBA in being capable of only determining information on elementalcomposition have been compensated, for instance, by the development of the use of IBAcombined with thermal analysis: ion beam thermography, IBT. The only existing system, sofar, has been entirely designed for the characterisation of atmospheric aerosols by making useof backward and forward ion scattering, PDCE and NRA while gradually heating the sampleon a thin aluminium foil [5.4].
5.2. ADVANTAGES AND LIMITATIONS TO OTHER TECHNIQUES OF ANALYSIS
With the wealth of other analytical techniques available it is very difficult tosummarise pros and cons. Some of the characteristics of the DBA methods are due to thepenetration patterns of the impinging ions. The relatively shallow, but still significant,penetration depth of the ion beam can sometimes be an advantage and sometimes not - itdepends on the particular analytical problem. One important advantage of IBA is thatdeterminations can often be performed without any preparation of a solid sample, a property
23

IBA methods have in common with several other nuclear techniques. Another advantageconnected to the use of nuclear microprobes is the micro-analytical capability. In addition, thewell-known reaction cross-sections etc. often make it possible, in principle, to performstandard-less quantitative analysis. However, for accurate quantification it is highlyrecommended that accepted reference materials are used or an intercomparison is made withan independent analytical technique. For bulk analysis, suitable reference standards arecommercially available — for microanalysis there is a general problem due to lack ofadequate reference materials.
Among the more important disadvantages, one can identify beam-induced sampledeterioration, limited mass analysed (representativity), somewhat limited sensitivity (not anultratrace technique), and very limited chemical speciation capability. The users should beaware of these limitations and actively seek for alternative methods to either complement orreplace IBA when justified by the analytical problem.
5.3. PRESENT AND EMERGING APPLICATIONS OF IBA
The fields of environmental studies and industrial applications are quite different.Most studies on environmental effects are carried out by agencies, institutes and universities.The development of the PDCE technique has been closely linked to general environmentalapplications and in particular atmospheric aerosols. The development of D3T described abovefollowed along these lines. The recent renewed interest in atmospheric particles related torespiratory human health effects and for the modelling of climate change, has put the use ofdata from IBA studies in focus.
Several IBA research groups have been active for a long time in this field ofapplication and have become well established, in particular when combining the DBA withother complementary methods and when collaborating closely with atmospheric chemists andphysicists. The accumulated data on composition of atmospheric aerosols produced by manyIBA groups world wide, is now very important as a input into enhanced models for globalclimate change. When combining these data with results from other groups working withXRF, INAA and other analytical techniques, pertinent information can be obtained forunderstanding a sustainable global future will be at hand.
The applications in industry of any accelerator-based technique are clearly limited byavailability of instrumentation. Only a few semiconductor industries have in-house particleaccelerators and the commercially available turnkey systems that might improve this situationhave only recently been introduced. Investment costs are not prohibitively high but therequirement for highly skilled expert staff represents a serious problem. The normal route forinteraction between industry and IBA facilities is by consulting or participation hi joint R&Dprojects. These are mostly on material science, environmental issues, quality control or veryspecific analytical problems that have emerged during industrial activities. When scrutinisingthe recent literature on industrial applications the dominance of applications using RBS oncomplex, epitaxially-grown materials is evident. Part of the explanation for this is the fact thatmuch of the collaboration is performed on the basis of 'commercial confidentiality' and is notpublished. Also in the field of economic geology, IBA techniques have had a major impact, inparticular, by supplying trace element data by using the nuclear microprobe on mineralsamples [5.4].
24

The development of a specific technique for using the concept of "geogas" in oreprospecting is based on the emission of minute amounts from deep underground deposits tothe earth surface [5.5]. Small particles are collected on thin foils and after several weeks ofexposure these foils are analysed using a millimetre ion beam. PDCE can then reveal thecomposition of the material deposited. By a complex interpretation procedure utilisinggeophysical principles it is possible to judge the mineral deposits in deep ground. This is atechnique with a good potential for evaluating rock conditions (in particular rock crackcharacteristics) to investigate the suitability of sites for underground long-term storage ofhighly radioactive waste.
A slightly different industrial application is the use of focused ion beams forcharacterisation of the fibrous structure of newsprint paper and to characterise thecharacteristics of printing [5.6].
REFERENCES
[5.1] "Particle-induced X-ray emission spectrometry (PDCE), Chemical Analysis, Vol. 133(Johansson, S.A.E., Campbell, J.L., Malmquist, K.G., eds), J.W. Wiley & Sons, NewYork (1995).
[5.2] CHU, W.K., NICOLET, M.A., MAYER, J.W., Backscattering Spectrometry, AcademicPress, New York (1977).
[5.3] KRISTIANSSON, P., MARTINSSON, B.G., Nucl. Instr. Meth. B132 (1977) 159.[5.4] RYAN, C.G., GRIFFIN, W.L., Nucl. Instr. Meth. B77 (1993) 381.[5.5] MALMQUIST, L., KRISTIANSSON, P., Proc. 8th Int. PDCE Conf., Lund, 1998, Nucl.
Instr. Meth. B (in press).[5.6] KRISTIANSSON, P., MALMQUIST, L., SJOLAND, K.A., SUNNERBERG, G., Nucl.
Instr. Meth. B104 (1995) 584.
6. CONCLUSIONS AND RECOMMENDATIONS
(1) Most of the NATs discussed in the present report, namely SR-XRF, DBA, and NAAtechniques require access to sophisticated and expensive (in terms of both investmentsand maintanence costs) nuclear instrumentation, such as accelerators and experimentalreactors. More effective use of these facilities can be achieved in the Member States,especially in the developing countries in the framework of bi- or multilateral co-operation. This approach may lead to the establishment of national or regional centreswhich would concentrate not only experts in NATs, but their existence should alsoattract attention of the potential users of NATs.
(2) An interdisciplinary approach is recommended to be employed or further extended inthe Member States to fully exploit the analytical potential of NATs, in particular for theSR-XRF, DBA and NAA techniques. This can again be best realized in the national orregional centres with the added advantage that a more cost-effective and greaterutilisation of facilities and their infrastructure should be achieved. Such centres shouldalso run educational and training courses, organise specialised seminars and conferenceson both regional and international scales to pool and expand knowledge and expertise inthe relevant fields. It can also be presumed that funding of such centres by both national
25

and international bodies will be much more effective than establishing scattered andnarrow-oriented institutions with incomplete instrumentation and/or infrastructure.
(3) The existence of such centres seems to be of particular importance for NAA. There is areal danger that because experimental reactors in the Member States, especially in thedeveloped countries have been shut down and because a number of experts have retired,the strength of NAA may be depleted and the expertise gathered during the last threedecades may be lost in the coming years.
(4) A more specific recommendation can be given for the other NATs discussed in thisreport. Users of TXRF in the Member States should be aware of the fact that acomputer-controlled system was developed by the IAEA Laboratories at Seibersdorf.This module can significantly increase the performance of TXRF compared to manuallyadjusted instruments that are still in use in many laboratories.
(5) The IAEA Laboratories at Seibersdorf have also developed a modular table-topcapillary-based micro-XRF system and acquired sufficient experience in methodologyand applications of the technique. Thus, it seems reasonable and justified to implementthe micro-XRF instruments in selected XRF laboratories, especially in the developingcountries which have already acquired basic XRF facilities and experience in theconventional ED-XRF technique. Once micro-XRF facilities are established, the XRFlaboratories can provide the unique analytical services to other countries in the region.
(6) Portable XRF is a rapidly moving field, both in the further development ofinstrumentation as well as new applications. There is, therefore, a need for exchangingtopical information among the Member States so that they can be made aware and takeadvantage of the most recent developments. Furthermore, it is important thatlaboratories in the Member States appreciate both the advantages and disadvantages ofportable XRF instrumentation. In particular, there is a danger that on the one hand,analytical results will be misused unless the limitations of what is essentially a surfaceanalytical technique are taken into account when results are used to estimate the bulkcomposition of a sample. On the other hand, there is the danger that users may not takefull advantage of the quantitative capabilities of the technique if sufficient care is nottaken over the acquisition and correction of data. Both these points suggest that themutual exchange of information and expertise between the centres in the developed anddeveloping countries has a role in the adoption of this technique.
(7) hi general, it is recognised that the existence of the above mentioned centres can alsocontribute to the faster development and implementation of new applications of NATsin specific fields, and significantly facilitate validating their results by developingsuitable reference materials and organising interlaboratory comparisons and/orproficiency testing.
26

Annex
PAPERS PRESENTED AT THE WORKSHOP
XA9953277CURRENT APPLICATIONS OF XRF AND MICRO-XRFTECHNIQUES IN ENVIRONMENTAL AND INDUSTRIAL FIELDS
R. VAN GRIEKEN, J. INJUKDepartment of Chemistry,University of Antwerp,Antwerp, Belgium
Abstract
A general overview of current applications of X-ray Fluorescence methods are given,including detection limits for different methods and sample preparation procedures.
1. INTRODUCTION
There are few analytical techniques that can, even today, compete with X-rayfluorescence (XRF) regarding its simplicity of instrumentation, limited sample preparationrequirements, speed of analysis and range of elements, especially for solid samples. Generallyspeaking, the XRF methods rival the accuracy of wet chemical techniques for the elementalanalysis of Be to U. Most popular is XRF in: a) industries producing metals, semi-conductors,polymers, chemicals, mining and crude oil, cements and ceramics, building materials, motorvehicles and glass, b) environmental sciences, c) forensics, d) pharmaceuticals e) paints, g)films and coatings. The main drawback to the technique is in its relatively poor elementalsensitivity, with normal detection limits in the ppm-range.
Most XRF spectrometers today operate in the wavelength-dispersive mode (WDXRF)but the number of energy-dispersive (EDXRF) spectrometers is significant as well. WD-instruments are estimated at 15,000 world-wide, whereas there are some 3000 units of forEDXRF. Total-reflection (TXRF) devices are only efficient and available in the ED-version,and there may be about 300 presently in operation, while only a handful instruments areworking in the grazing emission mode (GEXRF). There are at least 50 micro-XRFinstruments in operation around a world at present, but this number is increasing rapidly.
The common EDXRF mode provides simultaneous determination of differentelements, but its use in trace analysis is limited by insufficient sensitivity for low-Z elementsand inter-element spectral effects. Such simultaneous detection offers a more rapid analysisthan WD. On the other hand, the WDXRF version has a much better spectral resolution, itsdetection limits are usually lower and it permits the measurement of very light elements. Bothtechniques are multi-element and provide non-destructive analysis. TXRF is nowadays wellestablished technique for microanalysis: less than 1 ug of a solid sample or 10 ul of a solutionare required for an analysis in a ppt-range. TXRF can be applied to aqueous solutions, acids,airborne particular matter, biological materials, ultra-pure metals, wafers in the semiconductorindustry (where contaminations at IxlO10 atoms.cm"2 can be detected), etc. A precondition isthat the sample must be present as a very thin layer. The disadvantages of the technique aremainly related to the ED-system, such as a limited dynamic range of the detector and its poorspectral resolution. GEXRF is newly established technique that takes advantages of thegrazing emission and the WD leading to better resolution and sensitivity for light elements.For the high-Z elements, GEXRF is not expected to be better than TXRF: detection limits inthe range of ng are anticipated. Micro-XRF is a sort of microscopical variant of bulk EDXRF,where a microscopic X-ray beam is used to excite locally a small area (e.g., 10x10 um2).Considering fundamental algorithms, quantification is accurate and precise. It promises to be
29

one of the best microprobe methods for inorganic analysis of various materials: it operates atambient pressure and in contrast to particle-induced X-ray emission (PDCE) and electronprobe X-ray micro-analysis (EPXMA), no charging occurs. In many instances, no samplepreparation is necessary other than placing the material in a sample chamber.
2. WAVELENGTH-DISPERSIVE X-RAY FLUORESCENCE (WDXRF)
WDXRF is a well-established analytical technique for the determination of theelemental composition of raw materials, semi-finished products and final products inindustrial environments. Recently, fewer publications have been reported on WDXRF,although enormous numbers of element determinations are daily undertaken, but mostly inindustrial practice.
The market demand for quality in the microelectronics wafer industry stimulated on-line WDXRF analysis, which can measure both composition and layer thickness withsufficient accuracy and speed. Such a system can be fully integrated into the production line,and the only part of the instrument that is in the clean room area is its loading bay (Reader andNieuwenhuizen, [19]). Hence, in the recent period, a rapid growth in the use of automaticdiffraction systems (polychromatic or monochromatic) for industrial quality control was seen(Rich. Seifert & Co., Ahrensburg, Germany). Reported typical applications and developmentsin the field of semiconductors involve phase analysis of thin films, texture analysis, strainevaluation in multilayer structures, reflectivity and topography measurements. In the field ofthe automotive industry, WDXRF is frequently used on highly stressed material surfaces todetermine their behaviour of engine or gear parts and to improve material properties.Furthermore, in the iron and steel industry, quantitative determinations of total Fe and traceelements, as well as FeaOs and FesC^ in iron ores or FeO in sinters are necessary foroptimising various process parameters.
WDXRF has been confirmed as a valuable method in various environmental studies.In a case of multi-element analysis of plants, it is possible to perform a complete evaluation ofthe plants: their growth, nutrient deficiency, food value, resistance to disease, etc. Garivait etal., [7]. In the past decade, most geochemical analyses on routine basis were carried out byWDXRF. Recent published examples are the complete study of the mineralogy and mineralchemistry of the island Ponza (Gulf of Gatea, Italy) by Belkin et al. [2] and a case study of themineralogical composition of the mine coals in Alberta (Canada) and theirs impact on plantperformance and stack gass opacity, by Gentzis et al. [8].
Monitoring of environmental waters for trace heavy metals represents an ongoingchallenge. In this prospect, a passive monitoring system for control trace metals in riverwaters was built. A woven textile fibre, based on polyacryloamidoxime as a chelating agent,was used as collector and further analysed by both EDXRF and WDXRF. For fieldexperiments, small cloth pieces, of 3.5x4 cm2 are placed inside a 3.5-cm conventional plasticslide holder, which can be transferred directly into water and used as a collector. Detectionlimits in the sub-mg I"1 range and a precision better than 6% suggest a good ability of themethod to concentrate heavy metals.
30

3. ENERGY-DISPERSIVE X-RAY FLUORESCENCE (EDXRF)
EDXRF has traditionally being used in the field or in the laboratory for a variety ofindustrial and environmental applications. This technique is ideally suited for field screeningwork as a result of the minimisation of sample preparation and its potential portability.
Monitoring and control of stack gas emission from industrial furnaces is of greatimportance nowadays. For this purpose, an automated EDXRF monitoring system wasdeveloped (Spectro Analytical Instruments, Kleve, Germany) which enables a continuousemission sampling and a fast, non-destructive and robust determination of heavy metals in theemitted stack gases. In this setup, aerosols are collected through a heated-titanium probe ontoa quartz-fibre filter and analysed "on-line" by EDXRF. Elements like As, Cd, Co, Cr, Cu, Hg,Mn, Ni, Pb, Sb, Sn, Tl and V could be detected with a Rh-anode tube for excitation and asilicon drift chamber as the detection system. The non-destructive method allows storage ofthe samples for further investigations and comparison with other methods like ICP-OES andAAS.
X-ray techniques have already contributed to non-destructive in situ measurements inthe metal processing industry. A few methods are, however, used to measure on-line themicrostructural parameters such as stress, phase composition and texture. It is well known thatthe texture or preferred orientation is one of the most important microstructural characteristicsof materials; it correlates with the elastic, plastic and magnetic properties of materials. On-linetexture X-ray sensors can be used for example to evaluate the mechanical or magneticproperties of sheets and therefore serve for quality control and assurance of the final product.Universal X-ray equipment serves to test X-ray sensor designs suitable for texture analysis.Experimental testing with the laboratory sensor (developed at the Department of MetallurgicalEngineering, McGill University, Montreal, Canada) gave good results for two sets ofspecimens: (1) a set of cold-rolled and annealed, interstitial-free steels and (2) a set of hot-rolled alloy aluminium sheets.
A totally automated on-line EDXRF has been used in nuclear power plants for severalyears to monitor metals in their feedwater at the ppb-level (DETORA Analytical. Inc.,Alliance, OH). The first systems of this type comprised radioisotope source for excitation andproportional counter type detectors.
A very important environmental application of EDXRF is the analysis of airborneparticulate matter (about 50 publications per year). It seems to be the method of choice, sinceaerosol loaded filters are an ideal target for EDXRF. As the part of the sample actuallyanalysed has a surface of only few cm2, it must be representative for the entire sample.Therefore, a critical step is in the selection of an appropriate filter material. Teflon andpolycarbonate (Nuclepore) filters are ideal because of their high purity and because they aresurface collectors. Whatman-41 cellulose filters have been used widely because of their lowcost, but they are rather thick (namely around 9 mg.cm"2 versus 1.1 mg.cm"2 for Nuclepore),which leads to more X-ray scatter and higher detection limits, and they partially collectparticulate matter within their depth, so that X-ray absorption corrections become morecomplicated. Glass fibre filters should be avoided in any case due to their high inorganicimpurity. High-purity quartz fibre filters have recently been proposed. Table 1 gives detectionlimits obtained by WDXRF on Nuclepore filters and by EDXRF on Teflon filters.
31

With liquid samples there are two options for analysis: a) direct analysis with orwithout internal standard and b) preconcentration. With the latter approach, the samples canbe physically evaporated and concentrated to determine ppb-levels or chemicalpreconcentration can be applied. A variety of methods can be used for the preconcentration ofaqueous samples to lower the detection limits from the ppm to ppb level. These includeextraction, precipitation, co-precipitation, use of ion exchange membranes and ion exchangeresins. One of the most effective methods involves concentration of e.g. a litre of water on acation exchange resin and direct analysis of the resin by EDXRF.
TABLE 1. Detection limits (ng.cm"2) for wdxrf on nuclepore filters and for secondary-target edxrf on teflonfilters, detection limits are based on the measurement of ka x-rays, unless otherwise indicated in parentheses.
ElementNaMgAlSiPSClKCaTiVCrMnFeCoNiCuZnGa
Detection limitWDXRF EDXRF'3106071688623142132665-
--13045-1513653020161212-5654
ElementGeAsSsBrRbSrZrMoAgCdInSnSbTeICsBaHgPb
Detection limitWDXRF EDXRF*.--16-20---8 (La)-5 (La)7 (La)---5 (La)-21 (Ma)
3422338556688101324407 (La)8 (La)
* Ti-secondary target for elements Al-Ca; Mo-secondary target for elements Ti-Sr; Hg and Pb; Sm-secondarytarget for elements Zr-Ba
With this procedure, a Pb contamination of 10 ppb was easily determined in drinking water[6]. Anion exchange filters may be used to concentrate or selectively remove a particularcomponent. An example is the determination of Cr+3 and Cr+6. In acid medium, an anionexchange filter paper will collect Cr+6, while Cr+3 passes through. Subsequently, the toxic Cr+6
can be directly analysed on the filter paper.Many soil (sludge) samples have been analysed by EDXRF so far, and reported detectionlimits for e.g. As, Pb, Cd and Hg were at a few ppm [6]. Following recent requirements forrapid, field-based methods for environmental analysis, quite original EDXRF techniques wereevaluated at the Los Alamos National Laboratory (Los Alamos, New Mexico) usinglaboratory, transportable, and portable instruments (Goldstein et al, [9]). Fundamentalparameters provide reasonably accurate standardisation and detection limits are belowbackground soil abundances for all elements of concern, with the exception of As. Results forcertified materials indicate that the accuracy is typically better than ± 10 %, although someelements, like Se, Cd and Hg, have few or no suitable reference material to evaluate theaccuracy. Comparison between portable and fixed based instruments is giving, typicalh,consistent results. The benefits of using EDXRF for a geochemical mapping were recerdescribed by Civici and Van Grieken [4]. Using experimental systems with source -dsecondary target excitation and pressed pellet samples, 20-30 major and trace elements weredetermined. Detection limits and precision were evaluated and compared with required values.
32

The results showed that all determined elements meet the analytical requirements forgeochemical mapping programs.
A correlated study on the concentration of 22 elements (P, S, Cl, K, Ca, Ti, V, Cr, Mn,Fe, Co, Ni, Cu, Zn, As, Se, Br, Rb, Sr, Y, Hg and Pb,) in various environmental samples (coal,water, sediment, soil, fish, trees, leaves, and spinach) from a coal mining area in Vietnam, wasprovided by Nguyen et al. [16]. This work illustrates how suitable EDXRF is for variousenvironmental applications. Analyses were performed on dried, powdered samples, on watersamples, and on digestion solutions of solid samples.
TABLE 2. Detection limits (jig. g"1) for different powdered samples analysed by edxrf (ag - tube, 300 s analysistime, dry weight)ElementSClKCaTiCrMnFeCoNiCuZnSeBrRbSrBaHgPb
Leaves702082.51.51.21.11.10.70.50.50.40.30.20.20.10.40.20.2
Fish74153210.90.90.80.70.60.50.40.30.20.040.030.40.20.2
Hair180207511110.80.80.70.60.20.20.070.050.50.30.2
Coal620606030986.55.63.81.51.51.40.40.40.20.20.90.80.7
Sediment930908050131210862220.60.60.30.31.811
For coal samples, a mixture of HNOs-FbSCVHaOa was recommended for digestion; for mostother samples, a mixture of HNOs-HbOi can be used, while for digestion of sediments andsoils a mixture of HNOs-HCl was found to be the best. For sea water, the pretreatmentprocedure involves addition of HNOa and an internal standard, followed by overnight heatingat 80°. Analytical results obtained from coal, waste water, river water, tap water, sedimentsand tree samples could be used not only to evaluate the impact of coal mining and coalcombustion on the environment in Vietnam, but also to understand better the geology,elemental solubility, fractionation and transport mechanisms in geo-chemical research, and, ingeneral, can give valuable guides in order to minimise the impact of coal mining on humanhealth. In Table 2, mean detection limits for different powdered samples, as analysed byEDXRF are given. The application of EDXRF in monitoring Hg concentrations inenvironmental samples has not been widely used as the concentration of Hg in theenvironment is often below the detection limit of the technique. Suitable sample preparationmethods for such studies involve the use of HNOs-^Oa and ^SCU-HNOs-^Oa mixtures.By performing an analysis on digested samples, the detection limit of EDXRF could besignificantly decreased from 0.2 ppm to 0.058 ppm. This method was satisfactorily applied toenvironmental samples like coal, vegetation, fish, sediments and human hair (Nguyen et al.,[16]).
33

Portable EDXRF instrumentation has experienced a fast development in recent times.Radioisotopes, that have been frequently used in such instruments, are now replaced with apen-size small tube and a tiny ED detector (X-ray pen, Swedish Patent 95018111-5; U.S.Patent 5,633,908). Such device consists of a small X-ray source, a transmission tube, and aconical capillary that goes through a hole in the middle of the solid-state ED detector (driftchamber or diode). Small size transmission or microfocus tubes with low-power exigency areavailable from most manufactures. Such reductions in the size of detectors and X-ray tubeshave made it possible to bring a XRF spectrometer at depths down to 50 m to measure e.g.heavy metal contaminants in the underground soils (Naval Research Laboratory, Washington,DC). XRF spectra are collected from a sensor which fits within the penetrometer pipe andproduces high quality spectra in 100 s. The unit uses a miniature X-ray tube developedexclusively for this device and a commercial PIN diode detector. Detection limits have beenobserved as low as 100 ppm, even though the X-rays are transmitted through a ruggedwindow. A major benefit of portable instrumentation is its unique capability for a non-destructive and in situ analysis of various geological, archaeological or architectural samples,artefacts and remote samples. On the other hand, its weak points are related to the lack ofsample preparation, sampling precision and an accuracy being affected by a nature of theanalysed surface.
Microsample X-ray analysis (MXA) is rather new technique developed by ProcessAnalytics (Orem, USA). Basically, it is slightly adapted EDXRF instrumentation: collimationreduces the area that incident X-rays strike to a 2 mm diameter and hence, eliminates mostscattering from a film sample support. The technique requires a thin film sample supportdesigned to concentrate a small amount of solution (e.g. 50 ul) into a small spot. Prior toanalysis, all liquids are dried into small residues (this eliminates scattering of X-rays from thematrix of the sample). The achievable limits of detection are in the sub-ppb region. Fortransition metals at the 50 ppb level, the method precision is from 2 - 9%, while the requestedanalysis time is less than 15 min.
4. TOTAL-REFLECTION X-RAY FLUORESCENCE (TRXRF)
Over the past decade, TXRF has been increasingly used world-wide for multielementalanalysis in a variety of disciplines, including geology, biology, material and environmentalsciences, medicine, forensics and art history (Klockenkamper, [14]).
Because of its simplicity, TXRF is a method of choice for quality control of ultrapurereagents, as needed in electronics, cosmetics and pharmaceutical industries. Some high-purity-grade acids, bases and solvents, including high-purity water, can be analysed almost directly,down to 1 ng-ml"1 (Prange et al., [18]). Further applications are concerned with high-puritymetals, like aluminium or iron, and ultra-pure non-metals like silicon or silica(Klockenkamper, [14]). These solid products can be analysed in the sub-ug.g"1 region after anappropriate matrix separation. TXRF has been confirmed as especially useful for thedetermination of metal traces in light and heavy crude oils, in motor oils, and in diesel fuels.High-purity Si and SiO2 are extremely important products for the semiconductor industry. Thedetermination of impurities at the sub-ug.g"1 level is possible by a dissolution of the materialsand a separation of Si as SiF4, which is volatile (Reus, [20]).
Polished wafer disks are the basic materials for semiconductor devices. Since they are< ptically flat and even, they are an ideal target for TXRF. Several commercial instrumentshave been developed for wafer applications, and today more than 100 are in operation in the
34

USA and Japan. Numerous reports have appeared in the last decade and Hockett [10] gaveoverviews on different applications. In 1995, a new TXRF instrument, especially suitable forsemiconductor research, was introduced by Yamada et al. [24]. It operates with an Au anodeand with three different monochromators that can be changed within a few seconds to reachoptimal analytical conditions. As regards its efficiency, Au L-excitation line appears to be abetter choice than the conventional W L-line: the peak intensities for most elements are higherwith simultaneously lower background.
By the use of SR and special X-ray tubes, which are more powerful than a commercial one, itis now possible to determine light elements, such as Na, Mg and Al, on Si-wafers down to 100fg (Streli et al., [22]). Furthermore, with the SR, monochromatised with a multilayer, it ispossible to determine 13 fg of Ni on Si-wafers (Wobrauschek, [25]).
Especially in the environmental sector, TXRF demonstrates strength, due to itsmultielemental capability for small sample amounts and its short analysis time. The analysisof water samples and air dust is routinely utilised, as well as the analysis of organic tissue,plant material and vegetable foodsraff (Klockenkamper and Von Bohlen, 1996). In case ofrainwater or drinking water (both tap and mineral), the detection limit of ng.ml"1 is directlyassessable. For river water, seawater and waste waters, a sample preparation is recommendedfor separation of the suspended matter and for removal of the salt content. Recently, someinternational programs have been carried out for pollution control of environmental waterbodies. Some European rivers were tested systematically for contaminants and appropriateactions were taken for their regeneration. Trace contaminants in the Atlantic Ocean werestudied at several deep water stations, while heavy metal traces and pollutant transfers wereinvestigated in the North Sea (Injuk et al., [13]).
Effective monitoring of air pollution assumes small sampling volumes and smallcollection times, as it is offered by TXRF. Collection of air dust can be carried out byfiltration or impaction. If Nuclepore filters are used, the sampled material can be moved byultrasonic treatment with a HNOs solution. The mixture of dissolved and paniculate mattercan be easily analysed by TXRF after internal standardisation. If membrane filters are used,the loaded filters (together with a standard), can be subjected to a pressure digestion withHNOs and analysed by TXRF as usual. Another possibility is to collect air directly on glass orplexiglass carriers that are ordinarily fitted for TXRF devices. Under such conditions, variouselements can be determined down to < 0.1 ng. These detection limits are 3 orders ofmagnitude less than with conventional EDXRF. Consequently, the sampling time can bereduced to 1 h and the sampling volume to 0.5 m3. Such analytical performances allowmonitoring air pollution in the course of a day (Injuk and Van Grieken, [12]).
TXRF in not only suitable for analysis of inorganic materials, such as ashes, sludges,sediments and soil, but also organic materials like fruits, cereals, grasses and vegetables canbe analyzed after digestion and preferably after matrix removal (Klockenkamper, [14]).
5. GRAZING EMISSION X-RAY FLUORESCENCE (GEXRF)
The new GEXRF technique has already been applied to the determination of sub-monolayer quantities of an absorbate as well as to measure ion implantation profiles. Urbachand de Bokx [23] dealt with wafer analysis and have developed a special algorithm for thecalculation of layered samples. A good agreement between their theoretical and practical
35

results was found. Furthermore, De Bokx et al. [3] analysed with GEXRF elementalcontaminants on Si wafers and reached a detection limit of 6x10¹¹ atoms.cm"2 for Mg.
In the field of environmental analysis, only direct analysis of tap water has beenperformed until now, and preliminary results showed for F and Mg detection limits of 300 and1.9 ng.ml"1, respectively [5].
6. MICRO-X-RAY FLUORESCENCE (MICRO-XRF)
The field of micro-XRF is currently subject to a significant evolution ininstrumentation (lead-glass capillaries and polycapillary X-ray lenses; air-cooled micro-focusX-ray tubes; compact ED detector systems with a good resolution even at a high count-rateand no longer requiring liquid nitrogen cooling). This evolution allows the use of micro-XRFfor a wide variety of investigations in material sciences, in various environmental studies andfor traditional artefacts of a fine structure and design. Very often, micro-XRF is employed inthe control of coating composition, thickness and homogeneity of various materials. Layersystems can be easily examined with a high sensitivity down to 5 nm. Furthermore, the smallspot size allows measuring the coating thickness in different spots (homogeneity).
Most applications that have appeared in the literature are focused on demonstrating thespatial resolution of micro-XRF using line scans or mapping capabilities Adams et al [1]. Thestromatolite analysis done by Hosokawa et al. [11] is a good example of the ability of aninstrument to map multiple elements simultaneously over a wide area (200 x 200 mm2), hiaddition, the rough surface of the sample had no effect upon the images because of the largesolid angle of Hp-Si detector (0.4 sr). Also, by carrying out the measurement in air, sampledecomposition due to loss of water of crystallisation was avoided. Another set of a data,associated with the analysis of a synthetic ruby (like for its crystalline homogeneity and Crdistribution) showed that it is useful to take diffraction mapping images as well as thecommon fluorescence mapping ones. By using diffracted mapping images, it was possible todetermine the orientation of the crystal grains (Hosokawa et al., [11]). Other possibleapplications include the investigation of the bonding condition inside a plastic packaged light-emitting diode (LED). Elemental distributions of Au, As, Fe, Ni, Cu and Ga, in addition to thetransmitted image, were observed non-destructively. hi spite of the 1 mm thickness of theplastic package, the bonding conditions of 25 um Au wire were easily observed. The micro-XRF technique was also applied to several industrial wastewater streams and for examinationof rolled and annealed aluminium samples.
hi the field of environmental studies, X-ray microprobe has been successfullyemployed so far e.g., an inorganic component investigation was employed for a wood sub-ringstructure. The use of transmitted and scattered radiation revealed subtle changes in the wooddensity related to the changes in the temperature during the growth period (Kuczumow et al.,[15]). Another detailed study of the leaves, taken from a garden in a neighbourhood of a metalrefinery, clarified the air pollution from the refinery; elements like S, K, Ca, Ti and Fe werefound to be "heavily" deposited on the leaves (Hosokawa et al., [11]). For air paniculatematter, a significant improvement resides in the use of microanalytical mapping. At currentmicro-XRF facilities, only particles with a diameter above 10 urn can be readily analysed.Rindby et al. [21] have studied a cluster of fly-ash particles, that were deposited on a plantleaf, and then subjected to chemical treatment simulating the effect of acid rain. These typesof samples are considered to be very inhomogeneous in terms of chemistry and topology and
36

an analytical problem is to identify these two types of variations. Therefore, a quantitativemethod was developed, which is based on analysis of correlation graphs between theintensities from different fluorescent lines. This method is capable of distinguishing chemicalvariations from those variations that are due to the topography.
From the present view, it is clear that progress in the field of X-ray microanalysis withX-ray sources is advancing at a rapid rate. Commercial laboratory instrumentation usingcapillary optics combined with rapid scanning and compositional mapping capability isexpected to grow. Already new systems from companies such as Horiba, EDAX and XCOhave appeared (Pella and Lankosz, [17]).
During the 1980s, synchrotron facilities around a world have begun to implement X--ray microbeam capabilities on their beam lines for localised elemental analysis. A particularadvantage in comparison with the conventional X-ray sources is the extremely high brillianceachieved with synchrotron radiation (SR) sources. SR can be 8-12 orders of magnitude morebrilliant than the best conventional sources, and the achievable X-ray microbeam intensity isultimately set by source brilliance. The most recent state of the art application using a micro-SR-XRF will not be discussed here and readers are referred to the review of Adams et al. [1]for more information.
REFERENCES
[1] ADAMS, F., K. JANSSENS AND A. SNIGIREV, Microscopic X-Ray FluorescenceAnalysis and Related Methods with Laboratory and Synchrotron Radiation Sources.Journal of Analytical Atomic Spectrometry. 13 (1998)319-331.
[2] BELKIN, H.E., B. DE VTVO, A. LIMA AND K. TOROK, Eur. J. Mineral. 8 (1996)1401-1420.
[3] DE BOKX, P.K, C. KOK, A. BAJLLEUL, G. WIENER AND H. P. URBACH, Grazing-Emission X-Ray Fluorescence Spectrometry: Principles and Applications.Spectrochimica Acta. B52 (1997) 829-840.
[4] CF/ICI, N. AND R. VAN GRIEKEN, Energy-Dispersive X-Ray Fluorescence inGeochemical Mapping. X-Ray Spectrometry. 26 (1997) 147-152.
[5] CLAES, M., R. VAN GRIEKEN AND P. DE BOKX, Comparison of Grazing EmissionXRF with Total Reflection XRF and Other X-Ray Emission Techniques. X-RaySpectrometry. 26 (1997) 153-158.
[6] DRISCOLL, J.N., Field Analysis of Metals in the Environment by XRF. InternationalEnvironmental Technology. 8/5 (1998) 10-12.
[7] GARTVAIT, S., J.P. QUISEFIT, P. DE CHATEAUBOURG AND G. MALINGRE,Multi-Element Analysis of Plants by WDXRF Using the Scattered Radiation CorrectionMethod. X-Ray Spectrometry. 26 (1997) 257-264.
[8] GENTZIS, T., F. GOODARZI AND A. fflCKINBOTHAM, Mineralogical Compositionof the Highvale Mine Coals and its Impact on Plant Performance. Energy Sources. 17(1995)681-699.
[9] GOLDSTEIN, S., A.K. SLEMMONS, AND H.E. CANAVAN, Energy-Dispersive X-RayFluorescence Methods for Environmenal Characterization of Soils. EnvironmentalScience and Technology. 30/7 (1996) 2318-2321.
[10] HOCKETT, R.S. Advances in X-Ray Analysis. TXRF Semiconductor Applications, 37(1994)565-575.
37

[11] HOSOKAWA, Y., S. OZAWA, H. NAKAZAWA AND Y. NAKAYAMA, An X-RayGuide Tube and a Desk-Top Scanning X-Ray Analytical Microscope. X-RaySpectrometry. 26 (1997) 380-387.
[12JINJUK, J. AND R. VAN GRIEKEN, Optimisation of Total-Reflection X-RayFluorescence for Aerosol Analysis. Spectrochimica Acta. Part B, 50 (1995) 1787-1803.
[13] INJUK, J., R. VAN GRIEKEN AND G. DE LEEUW, Deposition of atmospheric traceelements into the North Sea: coastal, ship, platform measurements and model predictions.Atmospheric Environment. 32 (1998) 3011-3025.
[14] KLOCKENKAMPER, R. Total Reflection X-Ray Fluorescence Analysis. John Wiley &Sons, Inc. New York, NY (1997).
[15] KUCZUMOW, A., A. RINDBY AND S. LARSSON, Tree Sub-Ring Structure Analysesby X-Ray Microprobe Analysis. X-Ray Spectrometry. 24 (1995) 19-26.
[16]NGUYEN, T.H., J. BOMAN, M. LEERMAKERS AND W. BAEYENS, MercuryDetermination in Environmental Samples Using EDXRF and CV-AAS. X-RaySpectrometry. 27 (1998) 277-282.
NGUYEN, T.H., J. BOMAN, M. LEERMAKERS, EDXRF and ICP-MS Analysis ofEnvironmental Samples. X-Ray Spectrometry. 27 (1998) 265-276.
[17] PELLA, P.A. AND M. LANKOSZ, Highlights of X-Ray Spectrometry for Microanalysis.X-Ray Spectrometry.6 (1997) 327-332.
[18] PRANGE, A., K. KRAMER AND U. REUS, Determination of Trace Element Impuritiesin Ultrapure Reagents by Total-Reflection X-Ray Spectrometry. Spectrochimica Acta.46B(1991) 1385-1392.
[19] READER, A. AND K. NffiUWENHUIZEN, Solid State Technology. September (1996)S16-S19.
[20] REUS, U. Total-Reflection X-Ray Fluorescence Spectrometry: Matrix RemovalProcedures for Trace Analysis of High-Purity Silicon, Quartz and Sulphuric Acid.Spectrochimica Acta. 44B (1989) 533.
[21] RINDBY, A., P. VOGLIS AND A. ATTAELMANAN, Analysis of Inhomogeneous andIrregularly Shaped Samples by the Use of XRF Micro-beam Correlation Analysis, X-RaySpectrometry. 25 (1996) 39-49.
[22]STRELI, C., P. WOBRAUSCHEK, V. BAUER, P. KREGSAMER, R. GORGL,P. PIANETTA, R. RYON, S. PAHLKE AND L. FABRY, Total Reflection X-RayFluorescence of Light Elements with Synchrotron Radiation and Special -X-Ray Tubes,Spectrochimica Acta. B52 (1997) 861-872.
[23] URBACH, H.P. AND P. K. DE BOKX, Calculation of Intensities in Grazing-Emision X-Ray Fluorescence, Physical Review. B53 (1996) 3752-3763.
[24] YAMADA, T., T. SHOJI, M. FUNABASHI, T. UTAKA AND T. ARAI, Developmentof a High Sensitivity TXRF with a Novel Monochromator Having Three SelectableCrystals, Advances in X-Ray Analysis. 38 (1995) 313-337.
[25] WOBRAUSCHEK, P., R. GORGL, P. KREGSAMER, C. STRELI, S. PAHLKE,L. FABRY, M. HAULER, A. KNOCHEL AND M. RADTKE, Analysis of Ni on Si-wafer surfaces using Synchrotron Radiation Excited Total-Reflection X-RayFluorescence Analysis, Spectrochimica Acta. B52 (1997) 901-906.
38

CURRENT ENVIRONMENTAL AND INDUSTRIAL APPLICATIONS OFXRF TECHNIQUE AT THE UNIVERSITY OF COSTA RICA
M. ALFONSO SALAZARUniversity of Costa Rica Applied Nuclear Physics Laboratory, XA9953278San Jose, Costa Rica
Abstract
A review of the application of nuclear analytical techniques in Costa Rica is given.
1. INTRODUCTION
Neutron Activation Analysis was the first nuclear analytical technique introduced inCosta Rica in 1974. Using Cf252 neutron sources the analysis were done over very fewmatrices, basically due to the low activity of the sources and the conditions of the laboratory.NAA activities ended in 1988. Now a days, the old neutron sources, including an Am-Besource, have been used to perform neutron-alpha reactions to follow tracks of Boron in fruitleaves, detecting the alpha particles from the reaction B10(n,a)Li7 and using nuclear trackdetectors.
The X-ray Fluorescence (XRF) technique was introduced in Costa Rica by the year of1979. After an expert meeting in San Jose, Costa Rica in 1977, the International AtomicEnergy Agency decided to support a project at the University of Costa Rica to start with theuse of XRF, including the basic instruments. By that year Dr. Peter Kump was sent to train thepeople at the local laboratory. Luz Maria Moya and Alfonso Salazar, professors of the Schoolof Physics, were working with him.
The instruments used at the beginning were the isotope sources of Cd109 and Fe55, aSi(Li) detector from Ortec and a multichannel analyzer from Canberra. Pre-Columbianceramics were studied at that time, in a joint project with the Archeology Department. In thisstudy, special attention was dedicated to the trends of three elements, Strontium, Zirconiumand Rubidium, comparing the results from different archeological regions and looking fornatives commerce routs.
Since the beginning the Agency supported several fellowships for training. Mr. Salazarattended two courses, one held at the Ruder Boskovic Institute, Zagreb Croatia (1985) underthe supervision of Dr. V. Valkovic, and the other at Argonne National Laboratory, Chicagoand Florida State University, Florida, USA (1988) working with Dr. W. Nelson in theapplication of PDCE for aerosol analysis. Ms. Moya participated in a training course inBangkok, Thailand.
The laboratory has been visited by several Agency supported experts in the x-ray field.After Dr. Peter Kump, we worked with Dr. Vlado Valkovic during the installation of the x-raytube in 1986, with Dr. Jon Tiss for alloy analysis in 1989 and with Mr. Ronny Ayala duringthe installation of the Total Reflection system in 1990. Dr. Woubrachek helped us to calibratede total reflection system hi 1995.
Three graduated students have worked with us during the last fifteen years; two areworking in another institution (Institute Tecnologico de Costa Rica) but they are doing onlyteaching. The third one is finishing his Ph.D. degree at the University of Minnesota and willreturn to Costa Rica next year to join the XRF group.
Professor Luz Maria Moya retired in 1986. Mr. Manuel Zapata from Cuba joined ourlaboratory, and worked preferentially with Total Reflection x-ray Fluorescence. He spent oneand half year at the laboratory and left at the end of last year.
39

At present time, Mr. Alfonso Salazar M. carries out the applications of the x-rayfluorescence analysis, with the assistance of four students, three from Physics and one fromChemistry.The applications of the x-ray fluorescence analysis have been done throughout severalresearch projects sustained mainly by the University of Costa Rica. Some aerosol analysisprojects have received complement help from the government.The laboratory has also made analysis of alloys. This job is normally done for privatecompanies, who are principally interested in knowing the composition of the samples.The most relevant applications that have been carried out are related with environmentalstudies and with alloy composition.
• Element composition of pre-Columbian gold pieces of the Central Bank Museum of CostaRica.
• Heavy metals analysis of aerosol particles from San Jose metropolitan area using PDCEand x-ray direct irradiation.
• Determination of trace elements in sediment and coral samples from the Caribbean coast.• Alloys composition using Mo secondary target (sell service).• Trace element in rain water using total reflection x-ray fluorescence.
2. ENERGY DISPERSIVE X-RAY FLUORESCENCE
Energy dispersive x-ray fluorescence has been a useful technique in the analysis ofdifferent material, solid and liquid. The multichannel x-ray spectrometer provides the meansof measuring many elements simultaneously. The great advantage of this technique is givenessentially by its nondestructive property. A wide range of well-analyzed calibration standardsand the use of appropriate algorithms relating x-ray emission intensity and elementalcomposition is allowing the use of this x-ray method in a wide variety of analyticaldisciplines.
The different types of the samples require the adjustment of the irradiation setup;different sample preparation and counting time. The characteristic x-rays of the elements areaffected by sample density, the element composition, the thickness, the inter-element effectsor the so called matrix effects. It is also important to take into account the geometry of theirradiation system, the peak-background ratio, dead time and the calibration curve needed foran appropriate quality of the analytical results.
The Applied Nuclear Physics Laboratory (LAFNA) is using three types of irradiationsetups. The Mo type x-ray tube has two windows for primary irradiation of the samples. Onewindow is settled for the use a secondary target and for direct irradiation, and the otherwindow is used for the total reflection system.
The primary radiation that is coming directly from the x-ray tube, besides the Mophotopeak, also introduces bremsstralung x-rays. This produces a very high background andthe radiation is not monochromatic. The algorithms used by the QXAS software are based onmonochromatic primary radiation. There are two ways to get almost monochromatic x-rays:• Using a secondary target between the radiation from the tube and the sample, normally on a
45 degree setup. The sample is then irradiated with the characteristic x-rays of the target.Any kind of metal can be used as a secondary target, it only depends on the elements ofinterest. With each target it's necessary to calculate a calibration curve using severalstandards. For trace analysis of heavy metals in different samples, we normally have used aMolybdenum secondary target, and for the analysis of gold pieces a Tin secondary target isused.
40

• Using a filter between the sample and the x-ray from the tube, the bremsstralung radiationis reduced. A 0.5 mm foil of Molybdenum or Zirconium reduces the bremsstralung and letsonly the Mo photopeaks through, as monochromatic radiation. The background on thespectra and the dead counting time reduces this technique to the analysis of thin samples.With this setup a very low tube current has to be used, usually down to 5 mA. For aerosolanalysis it is a very good technique. The loaded Nuclepore filters are presented directly tothe XRF unit, with the loaded side towards the instrument. Calibrating the system withappropriate standards, no correction for the X ray absorption in the aerosol material isusually necessary.
We have also introduced in the laboratory the Total Reflection X-ray Fluorescence(TXRF) technique. It is a more accurate and sensitive analytical technique. All samples to beanalyzed need to be in an aqueous solution and a drop less than 10 nl is put on a quartzsample carrier for irradiation. The primary x-rays impinge on the sample with a scatteringangle less than 5 min. The reduction of background is almost 100% and the secondary x-raycomes from the elements present in the sample. The minimum detection limit goes as low as50 ng/L. A TXRF module designed by Dr. Peter Wobrauchek has been mounted at thelaboratory. For rain water analysis one of the advantage is that the sample need very littlechemical preparation. This is the main application that we are giving to TXRF method.Digestion of the sample is needed for most biological samples. Recently the laboratoryreceived a microwave digestion system, which has been tested with some samples with goodresults, but so far it is not in routine use.
PIXE (Proton Induced X-ray Emission) analysis was carried out also at thelaboratory, due to special cooperation between LAFNA and the PIXE Laboratory of FloridaState University (FSU). PEXE analysis is a very sensitive technique for trace element analysis,especially used for aerosol composition studies. Small amount of material on a tiny area isvery easy to irradiate with high energy protons. Aerosol samples collected in Costa Rica wereirradiated at FSU Van der Graaff accelerator. Complement spectra and data analysis was donein Costa Rica. During six years of cooperation, several aerosol studies were done, selectingsites in the San Jose urban area and at the countryside. The aerosol sample is collected using astreaker system with two filters, one of 8 urn at the main entrance and one of 0.4 jam. Thefilter disk rotates on a moving system to collect a 1x8 mm2 sample. The sample collection isdone every hour during a complete week, giving 160 samples. The sample disk is mounted ina vacuum chamber for high energy proton irradiation. The x-ray spectrum is evaluated using aHEX code, developed by the PIXE Laboratory at Florida State University. The data obtainedfor more than fourteen elements are analyzed by statistical commercial software. Elementprofile and origin can be established with this procedure for pollution studies on the sitesselected.
2.1 EQUIPMENT
Irradiation system: Since 1986 The laboratory has an X ray tube, ISO DEBYEFLEX2002 from Seifert, with a Molybdenum anode. The model has four separated parts, a highvoltage generator, a control chassis, a regulation chassis and the tubehousing with a SN60 Mo,K-Anode. The cooling system was changed, in 1990, to a unit from Electro Impulse Inc.Model 36332. The tube has two windows, one is used for the 45 degree setup and the other forthe total reflection system. There are three Si(Li) detectors from Canberra, Models SL 30170and SL 30165. One is not operating because a damage on the Be window. The electronics iscompleted with two High Voltage supplies, Canberra models 3102, and two spectroscopy
41

amplifier, Canberra models 2020. The sample support for the secondary target setup consistsof an Aluminum base with three colhmators of pure Al. They are oriented for the source-secondary target, the secondary target-sample and the sample-detector.
Direct irradiation with regenerative monochromatic filter uses the same base, onlywith two collimators, one from source to sample and from sample to detector. Thin foil filter,of Mo, is used between source and sample.
Besides the X ray tube, an annular 109Cd source of 25 mCi (April 97) is used when theX ray tube is out of operation. Recently it has not been used very frequently.
The total reflection module consists of several components. A height adjustable steelsupport with connecting base plate. The X ray tube housing is mounted downright a 6 degreesdeviation from the vertical line, thus the X ray beam propagates in the horizontal plane. Onthe Al base there are the brass collimator, the cut-off reflector, the beam stopper, theadjustable quartz reflector holder. The total reflection is accomplished by adjusting the threemicrometers by hand, looking at the two lines of the x-ray formed by Zn-S screen. Thisprocedure makes one of the biggest difficulties of the system considering the radiation hazardduring calibration and mechanical sensitivity. For the Mo anode with characteristic radiationenergies of 17.48 keV and 19.6 keV, the cut off angle is 1.6 mrad. If the Zn-S screen islocated at 0.5 m, the angle can be reached if the two beam lines are separated from each otherby 1.6 mm. A view of the irradiation facility is given in the picture.
Counting system: The X ray spectra and general data is collected using: a) A Nucleusn, personal computer analyzer (PCA-IT), installed on 486DX2 IBM compatible personalcomputer. The PCA card contains a 100 MHz Wilkinson analog to digital converter (ADC).An input from a shaping amplifier is the only external signal necessary for pulse heightanalysis (PHA).The software utilizes a windowing technique with pull down menus for userfriendly operation, b) ACCUSPEC, personal compute analyzer from Canberra. It consists ofboth hardware and software components which are installed in an IBM PC compatible system.An acquisition interface board with an on-board Analog-to-Digital Converter. This system isnot m operation because memory problems with computer has not been solved. All the spectracollected is transferred to the AXIL system.
Sampling and sample preparation: The laboratory has used some basic equipmentfor sampling and sample preparation. Most of the X ray fluorescence applications has beendone with samples that need little preparation. It is necessary to follow some simple rules insampling and sample preparation, like: a) take large samples if it is possible, b) avoidcontamination of the sample, c) avoid losses of the elements during transportation and rorage,d) take account of parameters that may influence the sample composition and e) us^ simplesample preparation procedure before any chemical method.
42
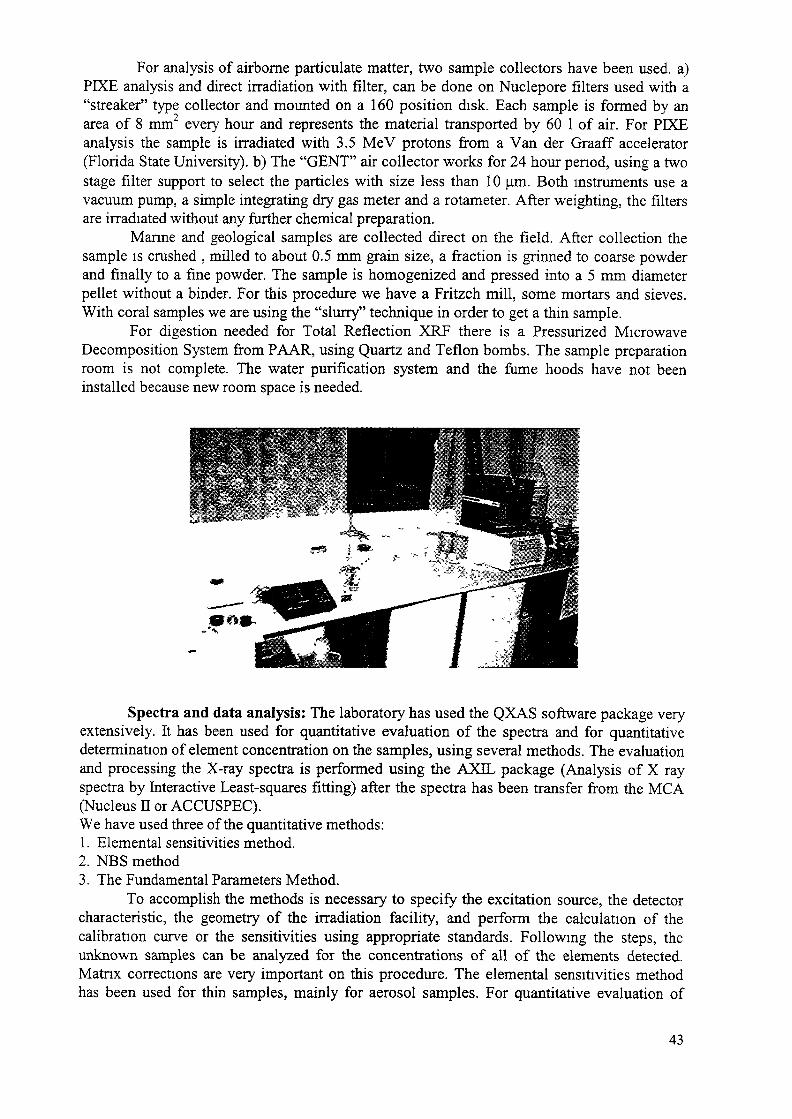
For analysis of airborne participate matter, two sample collectors have been used, a)PIXE analysis and direct irradiation with filter, can be done on Nuclepore filters used with a"streaker" type collector and mounted on a 160 position disk. Each sample is formed by anarea of 8 mm2 every hour and represents the material transported by 60 1 of air. For PIXEanalysis the sample is irradiated with 3.5 MeV protons from a Van der Graaff accelerator(Florida State University), b) The "GENT" air collector works for 24 hour period, using a twostage filter support to select the particles with size less than 10 fj,m. Both instruments use avacuum pump, a simple integrating dry gas meter and a rotameter. After weighting, the filtersare irradiated without any further chemical preparation.
Manne and geological samples are collected direct on the field. After collection thesample is crushed , milled to about 0.5 mm grain size, a fraction is grinned to coarse powderand finally to a fine powder. The sample is homogenized and pressed into a 5 mm diameterpellet without a binder. For this procedure we have a Fritzch mill, some mortars and sieves.With coral samples we are using the "slurry" technique in order to get a thin sample.
For digestion needed for Total Reflection XRF there is a Pressurized MicrowaveDecomposition System from PAAR, using Quartz and Teflon bombs. The sample preparationroom is not complete. The water purification system and the fume hoods have not beeninstalled because new room space is needed.
Spectra and data analysis: The laboratory has used the QXAS software package veryextensively. It has been used for quantitative evaluation of the spectra and for quantitativedetermination of element concentration on the samples, using several methods. The evaluationand processing the X-ray spectra is performed using the AXIL package (Analysis of X rayspectra by Interactive Least-squares fitting) after the spectra has been transfer from the MCA(Nucleus H or ACCUSPEC).We have used three of the quantitative methods:1. Elemental sensitivities method.2. NBS method3. The Fundamental Parameters Method.
To accomplish the methods is necessary to specify the excitation source, the detectorcharacteristic, the geometry of the irradiation facility, and perform the calculation of thecalibration curve or the sensitivities using appropriate standards. Following the steps, theunknown samples can be analyzed for the concentrations of all of the elements detected.Matnx corrections are very important on this procedure. The elemental sensitivities methodhas been used for thin samples, mainly for aerosol samples. For quantitative evaluation of
43

marine and geological samples using thick samples, the Fundamental Parameters method hasbeen implemented. Alloys have been quantify by the NBS method.
Statistical studies of the elements data have been carried out with a commercialsoftware (STATISTICA for Windows, v 4.5). Factor Analysis has been used for aerosolsource profiles.
2.2 XRF APPLICATIONS IN COSTA RICA
2.2.1 Glass-fiber filter for analysis of aerosol particles using energy-dispersive X rayfluorescence
Energy dispersive x-ray fluorescence was used to analyze aerosol particles depositedon glass-fiber filters. The blank filter contained several elements that interfered with traceelements found on the particles. The loaded filters were studied for composition and particledistribution of the few elements that can be analyzed, which include lead. Samples wereprovided by the Costa Rican Health Ministry. The study was carried out with 109Cd isotopesource. The filters have dimensions of 20x25 cm2 and were used exclusively for monitoringairborne particulate matter density. The study was a complement in order to evaluate thoseelements not present in the blank filter.The homogeneity of the matter and the element distribution on the filter are calculated whenonly a fraction of the total filter is irradiated. The distribution for eighteen differentmeasurement points on the filter, showed good homogeneity of the particle distribution on thefilter. Three small areas for each filter were analyzed. Figures 1 and 2 shows the traceelements detected on the blank filter and the loaded filter. Copper and lead were the only twoelements possible to analyze under the conditions imposed by the filter. The results of thisexperience were used by the Health Ministry to measure the lead levels present. At that time(1990) gasoline with lead was sold in Costa Rica.
400 BOOChannel
Figure 1. Trace elements identified on a blank glass-fibre filterCounting time: 3000 s.
400 «0Chwuael
Figure 2. Trace elements identified on a loaded filter. Countingtime: 3000s
2.2.2 Time variation of trace elements in airborne particles from San Jose, Costa Rica
The measurements were carried out in cooperation with Dr. J.W. Nelson and Mr. P. Thonnardfrom the Florida State University. Trace elements in airborne particles are important toidentify possible pollution sources. Evaluating the concentration of several elements allows toestablish a reasonable understanding of wind cleaning processes in San Jose. Three differentsites were chosen. The sites were selected based on the facility to collect meteorologicalinformation and to identify possible pollution sources by sight. These places chosen were:
44

(a) Site 1: The wheeled intersection Hispanidad, San Pedro de Monies de Oca, 2 km east ofSan Jose downtown, where the sampler was placed about 5 m from the street with hightraffic. The samples were colleted between may 15 to 22,1995.
(b) Site 2: The Institute Costarricense de Electricidad (ICE) building, besides La Sabanametropolitan park, 1.5 km west of San Jose downtown, in front of a big park, but alsosurrounded of high traffic. The samples were collected between February 12 to 16, 1995.
(c) Site 3: The outside of the Laboratorio de Fisica Nuclear building, located on an open fieldat the University campus, located 2.5 km east from downtown. There is no car influenceover this place. The samples were collected between November 22 to 25, 1994.
During the last ten years two political decisions contributed to understand the roll ofairborne particles in atmospheric pollution on the city of San Jose. First, the reduction onimport taxes over used cars has contributed to increase the amount of cars, which give moreparticles into the air. Second, the elimination of any lead compound in gasoline hascontributed to reduce respiratory problems. . During the period of sample collection, no leadwas detected (1995).
The samplers used were circular streaker of one-week duration, which collectsairborne particles every each hour, for a total of one hundred and sixty samples.
Elemental concentrations of aerosol contents were determined using PIXE analysis,performed at PIXE Lab., Florida State University, Fl. USA. Data reduction was done using thecomputer software Hex code both at FSU and at the Laboratorio de Fisica Nuclear Aplicada,Universidad de Costa Rica. Commercial statistics and data analysis software is used for factoranalysis in order to establish groups of the trace elements.
Up to 14 elements are measured on particles collected on a nuclepore filter usingPIXE. The results show that about 85% of the particles are formed by soil dust andautomobile combustion, with some elements from the marine breeze. The average values forall elements (except Si) are less than 1 |ag/m3.The concentration levels go down during thenight due to less anthropogeny activity. San Jose is not an industrial city so industrycontribution to pollution is very low. The figure shows the time variation of the concentrationof some elements (Si, Al, Ca and Fe) measured on the filter.
Variation of Si, Al, Ca, and Fe concentration as afunction of collecting time, at aerosol
T Sampling site: LAFNA, SabanillaConcentration
2.5 -
Silicium
AluminiumCalcium11 ran
10 20 30 40 50 60 70 80 90 10 11 12 13 14 15 16 170 0 0 0 0 0 0 0
Time (h)
2.2.3 Irradiation of aerosol filters using regenerative monochromatic filter
In order to continue the monitoring of trace elements in aerosol particles, newpossibilities for irradiating the filters were studied. When the sample is irradiated directly with
45

the main beam of the x-ray tube, the trace element peaks sit on a very high background andtend to be obscured by the large statistical fluctuations in this background. The reduction ofthe bremsstrahlung in regions containing the trace element peaks is done using a selectivefilter, according with anode material.
A Molybdenum foil of 0.5 mm is used between the x-ray tube and the sample toattenuate the bremsstrahlung continuum at lower energies than the Mo K lines. Trace elementsin the energy range from 3 to 13 KeV will be efficiently excited by the Mo K lines, while thebackground beneath these trace element peaks will be extremely low. This backgrounddepends of the tube current and to achieve a good peak-background ratio a 5 mA is used. Thismonochromatic excitation is very useful only with thin samples. If an intermediate thick orthick sample is placed a distance of 2.5 cm from the x-ray window, the counting dead time isover 10%.
For aerosol analysis this excitation method is appropriate. A new sample collector isnecessary in order to have more aerosol mass on the filter. This is achieved using a "GENT"type collector. This system has a filter holder with two positions on cascade. The filters (8 um,0.4 um) are separated 5.0 cm. The collecting time goes to 24 hours, with an air flow rate of 171/m. The particle distribution on the filter was measured on several spots.
The minimum detection limit( MDL) shows that the sensitivity is appropriated toevaluate the heavy metals on aerosol filters. The samples have been collected from the sameplaces selected before for PDCE analysis.
Aerosol particles on a NucleporeDirect irradiation with Mo filter
10Energy (KeV)
15 20
2.2.4 Gold and Silver relation in pre-Columbian gold pieces of the Costa Rican CentralBank Museum
The Central Bank Museum is classifying pre-Columbian gold pieces made by thenatives handicraft work. They are interested to look at the relation between the gold and silverconcentration in order to find out commercial routes and the origin of manufacturing. Thesepieces have mainly anthropomorphic forms, representing human and animal figures. Theyhave only a few flat parts where irradiation is possible. Several measurement were done overdifferent spots of the figures at different distances from the source, with a range of 2-4 mm.When the concentration of all the elements are normalized to 100%, we found that individualconcentration varies less than 2% in absolute value. These procedure permits to assure theresults, because some of the pieces have a very irregular form.
The irradiation system was calibrated using a Tin secondary target. Its excitationenergy is high enough to get the silver K peaks and the gold L peaks. Copper is the third
46

element present in this kind of sample. A few samples have some others elements due to thecontamination during the treatment. Pure metal standards and the NBS software were appliedto evaluate the concentrations. The results show good similarities with a evaluation made byDr. David A. Scott from the GCI Museum Laboratory, Ca. He also analyzed pre-Columbiangold pieces from Costa Rica and Panama.
Pre-Columbian gold necklacewith male anthropomorphus figure
_ 4000 i| 3000 -| 2000 -3o 1000 -'*""' n -
Aui Au
- Cu 11lldl A &u , , #9 ^n source0 12 15 18 21
Energy (KeV)24 27 30
2.2.5 Calcium-Strontium ratio for marine sediment and coral samples
The Center for Atmospheric and Oceanographic Studies of the University of CostaRica has been collecting marine sediment and coral samples from the Caribbean coast ofCosta Rica. They have been interested in the study of the composition of the marine sedimentand the coral. Pollution studies have shown that the contamination of the sea water modifiedthe growth of the coral, and altered radically the habitat. The study involves calcium-strontiumratios and the evaluation of some other trace elements.
After the samples are collected and classified, they are cleaned, dried and pulverized.Pressed pellets are made from the fine powder of both samples. The irradiation system isbased on Molybdenum secondary target, with a tube current of 30 mA and voltage of 40 kV.The concentration is calculated for each one of the elements observed using thick samples andthe Fundamental Parameters method of the QXAS software.
Thin film of Coral powder
w0oCO
"̂c0o
3000 -
2500 -
2000-
1500 -
1000 -
500 -
0 -
Ca
-
__
Sr1
(1Mo
1 segundarytarget
Ca Sr A Afl FP Rr J rt / V Iii re ur I I /v./ IL i A i -, —,-' V _J "^ L _rf^V/Vj
0 5 10 15 20
Energy (KeV)
47

2.2.6 Trace elements in rainwater by total reflection X-ray fluorescence (TXRF)
Costa Rica is a tropical country with high rain precipitation during six months of theyear. The amount of trace elements found in aerosol is affected by the rain. Rainfall is a formof deposition for trace-element input from the atmosphere to terrestrial and aquaticenvironments. The determination of trace elements in rainwater is becoming importantbecause many heavy metals contribute to the hazards and destruction of forest, lakes andcoastal waters.
Total-reflection X-ray fluorescence is a special variant of energy-dispersive XRF, withsubstantially improved detection limits. The rain water is collected manually on 1-Lpolyethylene bottle. When the sample is taken to the laboratory, an aliquot is used for pHdetermination and the rest is acidified to pH about 1.7 with concentrated HC1, sealed inpolyethylene bags and stored in a refrigerator until analysis. The conditions of the laboratoryis going to be improved to get a good purification of all components of the sampler.
The analytical technique used to quantify the trace-element concentration is based onthe direct measurement of rain water sample. An amount of 50 pL of Co-standard solution (10ppm) is added to 20 mL of rainwater and mixed thoroughly. An aliquot of 25 uL is transferredto a siliconized quartz sample carrier and vacuum-dried for measurement. We chose thisprocedure in order to avoid chemical treatment of the samples.
The TXRF system has been calibrated using pure standards from Merck. The detectionlimit for the elements measured with direct deposition goes down to 10-50 ng/L. Theapplication of the TXRF has been limited by the absence of personal with chemistryknowledge. Some difficulties with sample preparation has reduced the number of samplesanalyzed.
100000
Total Reflection X-rayFluorescence. Sensitivity Curve
10000 -c
100018 23 28 33
Atomic Number38
REFERENCES
[1] BERTIN EUGENE P. Principles and Practice of X-Ray Spectrometric Analysis. PlenumPress. N.Y. 1975
[2] JENKINS RON, GOULD R.W., GEDKE D. Quantitative X-ray Spectrometry. MarcelDekker Inc., N.Y. 1981
48

[3] DEBERTIN KLAUS, HELMER R.G. Gamma and X-ray Spectrometry withsemiconductor Detectors. North Holland, Amsterdam. 1988
[4] IAEA. Manual for QXAS Quantitative X-ray Analysis System (Version 1.2 1995-1996)[5] IAEA. Sampling, storage and sample preparation procedures for X-ray fluorescence
analysis of the environmental materials. IAEA-TECDOC-950. 1997[6] BOUMANS P. Total Reflection X-ray Fluorescence Spectrometry. Spectrochimica Acta,
Part. B: Atomic Spectroscopy. Proceedings of the Fourth Workshop on TXRF, Geesthacht,F.R.G., 1992.
[7] ADAMS, F.C.; VAN GRIEKEN, R.E. Absorption correction for x-ray fluorescenceanalysis of aerosol loaded filters. Analytical Chemistry, Vol. 4, 123-127,1975
[8] V. VALKOVIC. Sample preparation technics in trace element analysis by X-ray emissionspectroscopy. Technical document. IAEA, 1983
[9] VOGT, JAMES R., PARKINSON T.F.,CARTER, R.L. Nuclear Methods inEnvironmental Research. Published by University of Missouri-Columbia, 1980
[10] IAEA. Sampling and Analytical Methodologies for Energy Dispersive X.ray FluorescenceAnalysis of Airborne Particulate Matter.Division of Life Sciences IAEA, 1993.
49

ENVIRONMENTAL AND INDUSTRIAL APPLICATIONS OFXRF AND RELATED TECHNIQUES AT THE INSTITUTE OFNUCLEAR SCIENCE, UNIVERSITY OF NAIROBI, KENYA
A.M. KINYUA1, C.K.GATEBE1, M.J. MANGALA1, XA9953279D.M. MAINA1, A.K. KORIR1, K. ODHIAMBO2, R. KWACH3,S. BARTILOL1, N. NJAU L3, E.A. MUKOLWE3
1 Institute of Nuclear Science,University of Nairobi
2 Department of Environmental Science,Kenyatta University
3 Kenya Meteorological DepartmentNairobi, Kenya
Abstract
A comprehensive review of the application of nuclear analytical techniques, in Kenya,to different areas are given. High levels of Mercury in beauty creams are reported.
1. SUMMARY
For the past one year, the Institute staff and students have hosted and participated inregional and national conference/workshops, locally and abroad. Theseworkshops/conferences have dealt on issues such as harmonization of health relatedenvironmental measurements using nuclear techniques, scientific writing, repair andmaintenance of nuclear and other scientific laboratory instrumentation, computer networkingand research on African grassland fires. Research activities undertaken in 1997 include:Traditional medicines in anticonvulsant therapy and the implications of trace elements in healthand diseases, for an award of a Ph.D. degree and Non-destructive analysis of mercury in beautycreams for the award of M.Sc. degree. The aim of the latter study was to develop a fasteranalytical technique for mercury analysis especially for organic samples. This is because otherwell known chemical analytical procedures take too long, owing to the lengthy samplepreparation procedures which require expensive and toxic reagents. In addition, this studyrevealed that the mercury in the beauty creams sold in Kenya was in levels that were above thelocal and WHO acceptable limits. These mercury levels were not constant hi different batches ofsame products sampled at different periods. The results have far reaching implications on thequality control processes during the manufacture and it is possible that some of the products inthe market could be having higher levels of mercury than those sampled during this work. Theinterest on the study of traditional medicines was inspired by the fact that for a long timebioinorganic scientists have attempted to extract the active curative ingredients from plantswithout success. This work addressed the important therapeutic role being played by theessential trace elements. Various elements were identified in various levels in the plant-derived preparations and in medicinal plant extracts which are often used in the preparation ofherbal medicines in Kenya for anticonvulsant therapy. The analytical techniques used in thisstudy were EDXRF, AAS, Colorimetry, ICP-MS and PDCE. When administered traditionalanticonvulsants depresses the central nervous system (CNS). Rats treated with one traditionalanticonvulsant used by one traditional healer registered longer pentobarbital sleeping time
51

(71.2+18.1) minutes while the control group had a sleeping time of (39.3+9.3) minutes. Thisstudy showed the important role being played by the essential trace elements present in sometraditional medicines and medicinal plant extracts available in Kenya. Some of thesemedicines made our forefathers survive for many years without modern allopathic drugsbecause they provided the essential therapeutic agents with minimum side effects. Futurechallenges of this work include: the speciation determination of the essential trace elements inthe medicinal plant extracts and preparations; determination of the existence of radicals suchas NO which is now known to be important in cognition and neurotransmission; thedetermination of metabolic pathways and mechanisms on the possible roles being played byessential trace elements in drug functions. Some current studies by our M.Sc. students includethe following projects: Analyses of food crops grown along Nairobi river for their heavymetal content using EDXRF technique. This study by Sirengo S.J. aims to: (i) determine theheavy metal content of Nairobi River waters and the soils on which the food crops are grown,and (ii) determine the available heavy metals for plant. The second study: Trace elementanalysis of local pollen, honey and its by-products using EDXRF technique is another studyby Wamwangi M.D. and aims at: (i) determining the trace elements distribution in the pollen,raw and local refined honey and its by-products; (ii) determining the different trace elementprofiles of the honey samples from selected areas of the country, and (iii) determining theextent of trace element contribution on the quality of local refined honey. The third study:Trace element analysis of environmental samples from Webuye Town using x-ray fluorescenceanalysis technique is by Akinala J.M. This study aims at determining trace element levels in:(i) the industrial effluent discharges from Pan African Paper Mills; (ii) water and sedimentsamples from river Nzoia, (iii) particulate matter settling on buildings and land in WebuyeTown; (iv) plants and fungi (Lichens & Mosses). The fourth study is: The determination ofradio-nuclides in food-stuffs and environmental samples found in Nairobi by gammaspectroscopy. This study is by Maina J.W.A. and has the following objectives: (i) calibrationof the newly acquired hyperpure germanium detector for gamma measurements; (ii) analysisof food and environmental samples from Nairobi for the presence of gamma emitters forbaseline data on radioactivity levels in the country, and (iii) assessing the radiation exposurefrom natural and man made sources for the evaluation of activity levels in cereals, milkproducts and fertiliser applications.
Other studies by staff include the following: Characterisation and Transport ofAerosols Sampled at a high altitude on Mt Kenya. This is a Ph.D. Project by C.K. Gatebe. Heis registered at the University of Witwatersrand, Johannesburg, South Africa and is supportedby IPPS, START, UON, University of Witwatersrand and DAAD. The work aims at thedevelopment of an air transport climatology model for Kenya and to characterize aerosolssamples obtained from Mt Kenya. This is a remote site located next to the equator while theair sampling was by use of a Streaker Sampler and was started in June 1997 and continues todate. A number of good samples have been collected and analysed at PDCE International,Tallahassee, USA. Other samples are being analysed at Schonland Research Center forNuclear Sciences, University of Witwatersrand, Johannesburg. Good progress has been madeand initial results show that there is inter-hemispheric transport of aerosols across the equator;Investigation of Kenya aerosols by size characterisation, chemical constituents and depositionin the perspective of air pollution and climate change. This is a Ph.D. project by M.J. Gatari.He is registered at the University of Gothenburg, Sweden and is supported by IPPS. At presenthe is undertaking the necessary coursework to strengthen this investigation. The Physics ofRadon Daughters in Relation to Smoke Aerosols and their Role in Human Dosimetry. This isalso a Ph.D. Project by D.M. Maina. He is registered at the University of Witswatersrand,South Africa. The aim of this project is i) to measure the size distributions of smoke particles;ii) to measure the size and activity distribution of radon daughters attached to smoke particles;
52

and iii) determine the exposure due to these radioactive aerosols. The distribution of smokeparticles using a Differential Mobility Aerosol Analyser has already been done at ChalmersUniversity, Sweden while the radon measurements are being done using E-PERM System atthe Institute of Nuclear Science, University of Nairobi. Other studies by our staff membersinclude: Suspended particulate matter (SPM) sampling at the Nairobi Industrial Area andWorkplaces, analysis of water samples and effluents collected from factories- sugar and atannery; mercury (Hg) analysis of beauty creams sold in Nairobi; and heavy metal and sulphuranalysis of waste engine oils. Air sampling exercise in the industrial area was done twice a weekfor a period of two months (November and December, 1996) and twice monthly for a period ofsix months (January-June 1997). Each sample was collected after approximately 24 hours usingthe 'Gent' Stacked Filter Unit (SFU). The SPM values were found to vary from 16 to 83 (igm~3
during the sampling period. The results of the analysis of dust collected inside a workplaceindicated that there was poor filtration of the air being drawn into the building.Recommendations on the improvement of the air filtration and conditioning unit within thebuilding plus a reduction of emissions emanating from a neighboring tyre factory were made tothe proprietors.
EDXRF analysis of beauty creams showed that there was mercury present in significantamounts (0.14 - 3.0%) in various cosmetic brands being sold in Nairobi. The health implicationson the presence and of these high levels of mercury in some of these beauty creams is alsodiscussed.
The presence of sulphur (0.9 - 439 ug/ml) in the water samples from the River Nyandoshowed that industrial waste from the sugar and agro-chemical factories upstream did affect thewater quality of the river. These high levels were registered at a waste treatment pond of anagrochemical factory. Heavy metal analysis of the water samples collected from River Nyandoshowed phosphorus and lead being below detection limits which ranged from 30-180 g/ml and30-150 ng/ml respectively. The occurrence of the high levels of sulphur suggests some randomrelease of industrial wastes into the river plus poor effluent control measures by the industries.Other parameters measured include conductivity, salinity and BOD which indicated the need toimprove on the effluent control measures by the industries. The analysis of waste engine oilsshows high levels of heavy metals and sulphur. The heavy metals were mainly from wear andtear of engine parts.
From the above studies, it is evident that XRF can be utilized in many fields and whencomplemented with other techniques, the analytical results are useful for multidisciplinaryresearch studies. Our laboratory has for many years collaborated with other institutions on anumber of research projects. Some examples are shown below as a testimony of the utility ofnuclear analytical techniques for industrial and environmental studies. It is hoped that this willenhance human resource development, introduce new analytical techniques and regionalcollaboration.
2. INTRODUCTION
The utility of nuclear techniques in Kenya dates way back before Kenya'sindependence in 12th December 1963. This was at institutions such as the former RoyalTechnical College (presently the University of Nairobi), some agricultural research institutesand the Medical Research Laboratory which was formed in 1958. Documentation of theseactivities is not available but can be speculated that some work was being carried out in tracertechniques in agriculture, quality control and basic nuclear science experiments. Otheractivities were in medical-radiology at the former King George Hospital (now KenyattaNational Hospital).
53

The United Nations General Assembly in 1977 passed a Resolution, (32/50-1977),which, among other things, stated that: "the use of nuclear energy for peaceful purposes is ofgreat importance for the economic and social development of all countries". The followingyear, Kenya formulated a project on the establishment of a Nuclear Science Laboratory. Thiswas financed by the Government and the International Atomic Energy Agency (IAEA) toserve as a nucleus for the introduction and development of nuclear science and technology inthe country. It was implemented in 1979 with creation of the Centre for Nuclear ScienceTechniques (CNST) under the Faculty of Engineering at the University of Nairobi. Since then,CNST developed into an Institute of Nuclear Science in 1993. The major emphasis of theInstitute has been the training of postgraduate students on the use of nuclear techniques inmaterial analysis, environmental pollution monitoring and basic nuclear science research. Thisled to the introduction of an M.Sc. Programme in nuclear science which has benefitedresearch institutions in the country and others from East, West and Central African region.
Since 1978, various Technical Co-operation (TC) projects and Co-ordinated ResearchProjects (CRP) funded by the IAEA have been implemented in the country. Some examplesof these projects are: radiation protection and dosimetry; environmental pollution monitoringusing nuclear analytical and related techniques; non-destructive testing of materials; nuclearinstrumentation; nuclear waste management; isotope techniques in the efficient use offertilizers; improvement of dairy productivity; pesticide research and the use of radio-nuclidesin quality control and production of medical kits.
Apart from these TC and Co-ordinated Research projects, Kenya also participates inthe African Regional Co-operative Agreement (AFRA). These activities are co-ordinated bythe IAEA and include: nuclear techniques in plant breeding and biotechnology; localpreparation and use of radio-immunoassay reagents, non-destructive testing, repair andmaintenance of nuclear instrumentation.
3. OVERVIEW OF SOME CURRENT ACTIVITIES
3.1 AIR POLLUTION STUDIES(i) SPM measurements at Nairobi Industrial Area
Air sampling exercise at this site was done in November 1996 - August 1997 andcontinues to date. This site is located some 13 km from the city centre and to the south easternside. Surrounding the sampling site are residential estates with high population densitiesparticularly to the western and northeastern sides where there are also two main soccerstadiums within ~3 km. The Jomo Kenyatta International Airport is approximately 5 km to thesouthwestern side of this site. It is difficult to estimate the population density around this site,since the information was not available by the time of compiling the data. However, it can beestimated to be around 2500 persons per square kilometer. Within this area are found variousindustries (metal, chemical, motor assembly and food processing).
Sampling of SPM was done using a 'Gent1 Stacked Filter Unit (Maenhaut, [31]; Gatebeet al., [8]). Nucleopore filter membranes (0.4(om, and Sum) were weighed in an airconditioned laboratory controlled at 50% relative humidity and 20'C. A 241Am a-emittingsource (5uCi) was used to remove the static build-up within the filter. Prior to weighing, allfilters were left to equilibrate for at least 24 hours. Before the start of each sampling exercise,the SFU was properly cleaned with ethanol to remove any particles, which may havepreviously embedded inside. Filters were handled with care using plastic tweezers to avoidgrease from fingers and heavy metal contamination. Information recorded was: (i) volume ofair sucked by the pump and (ii) average weather conditions like temperature, humidity andwind direction. During the sampling, the sampler was run at flow rate of Im3/hour for 24
54

hours. The fine and coarse mass concentrations were obtained through gravimetricmeasurements of nucleopore filter membranes with 1 ug sensitivity (Ainsworth, type 24N)weighing balance. Before weighing, the filters were equilibrated for 24 hours at 50% relativehumidity and at 20°C temperature. Electrostatic charges were controlled by use of 24IAmradioactive source(SuCi). The filter membranes were then weighed before and after airfiltration.
The EDXRF system utilized in this analyses has previously been described (Kinyua,[17]). It consists of 28 mm2 x 5 mm thick ORTEC Si(Li) detector with beryllium windowthickness of 25 jam, a Canberra amplifier/pulse processor with pile-up rejector Model 2020,and a Canberra SI00 PC based multichannel analyzer system. The detector resolution (fullwidth at half maximum-FWHM) was 190 eV at Mn K« line at 5.9 keV, while the pulse shapetime constant was 10 us. The excitation source used was 109Cd (20mCi). Ten samples werealso analysed using a tandem accelerator facility at Schonland Research Centre for NuclearScience, University of Witwatersrand, South Africa. The samples which had earlier beenanalysed with EDXRF, were cut into an area of 2.7cm2 using a punch. A Proton beam(collimated with a rectangular collimator) with an energy of 3.2 MeV, and a beam current oflOnA was used. Irradiation times were 600 seconds. The PIXE system was calibrated by alarge number of Micromatter Standards (mono and bi-elemental) of known area density (5%uncertainties certified). The fitting of the x-ray spectra and quantitative analysis wereperformed using the AXIL-PC software and WITS-HEX (Lipworth et al., [30]).
For both PIXE and EDXRF analytical systems, the detection limits were evaluatedbased on three sigma criterion (Wobrauschek, [46]). Table 1 shows the analytical results ofSRM-2676d and the detection limit for the EDXRF based on the above criterion. Table 2shows an intercomparison of the analytical results of the analysis of coarse and fine filters byboth PIXE and EDXRF techniques. There was some good agreement in some of the resultsespecially the major elements such as iron. The differences noticed in some of the results aremainly due to loss of the sample material during transportation, preparation andinhomogeneity. However, the precision of the elemental concentration measurements istypically less than 10% for elements with concentration near the detection limit. Table 4shows some analysis of standards by both XRF systems utilized in this work.
TABLE l(a) EDXRF analysis of a Standard Reference Material - MIST 2676d: metals on filter mediaElement Expt. Value (fig/filter) Certified Filter Number
Value(ug/filter)MnZnPbMnZnPbMnZnPb
16.06 ±0.4182.05 ±1.5226.55 ± 0.7210.54 + 0.2155.54 + 0.8317.76 ±0.34
2.84 ±0.0513.33 ±0.1810.84 + 0.15
19.83 ±0.3899.31 ±1.7729.77 ±0.61
9.83 ±0.1449 .47 ±0.7314.82 ±0.26
2.09 ± 0.0310.17±0.13
7.44 + 0.10
mmmnnniii
Results over the eight months of sampling shows almost similar trends for most of theelements (Kinyua et al., [24]). The concentration of potassium(K), calcium(Ca), and iron(Fe)varied from 0.2 to 2 ug/m3, with Ca showing a higher level than Fe and K over the entire
55

TABLE l(b) Experimental Detection Limits for SPM analysis by EDXRFElementCaMnFeCuZnPb
Atomic Number202526293082
Detection Limits(u.g/filter)2.15 + 0.210.41 +0.030.33 + 0.010.18 + 0.030.15 + 0.020.19 + 0.02
Detection Limits(ng/mJ)*89.5 +8.517.0+1.013.5 + 0.57.5 + 1.56.0+ 1.08.0+1.0
Nb * - based on 24 hrs sampling time at a flow rate of 1m /hour using Gent SFU
TABLE 2 Comparison of EDXRF and PUCE Analysis of Aerosols Samples(^g/m3)
KMnFeZnPbKMnFeZnKMnFeZnKMnFeZnKMnFe
Fine FilterEDXRF0.09560.06290.1650.1770.07410.1870.07520.1370.08520.600.1070.1510.1330.200.06780.09920.06370.02210.06610.0671
(0.4um)PIXE0.1670.0140.1490.1370.0470.075DL0.0610.0360.1590.0150.1450.1470.106DL0.0480.0240.068DL0.05
Coarse FilterEDXRF0.5440.07650.9090.1190.09440.5170.07520.3220.0280.03050.1870.5490.1090.07510.06190.640.06790.4090.120.231
(S^m)PIXE0.6670.1081.1540.153DL0.3170.0210.2470.0260.2290.0470.540.0450.3190.0640.6930.0550.072DL2.219
Period
Night 1It
t t
t t
f t
Day 2it
f f
f t
Day 4it
it
It
Night 4It
11
11
Day 5it
11
NB DL - Detection limit
period. Zinc(Zn) is conspicuously high in all the months varying from 1.0 to 8 ug/m3. Thispoints out to the presence of industry(ies) dealing with/or producing Zn or its products.Comparison of these results with the ones from the suburban sites shows higher concentrationlevels for most elements (Gatebe et al., [8]). This indicates some enrichment from theindustries around the sampling site at the industrial area. With this data it will now be possibleto sensitize the government on the need to monitor closely the impact of the emissions fromindustries on our air quality.
(ii) Workplace monitoring for Air Quality-Voucher Processing CentreThe Voucher Processing Unit Centre is a modern three storey building for banking
activities located in the Industrial Area. The first two floors have several computer hardwareand installations used for processing of the bank's financial transactions. The top floor of the
56

building houses the air conditioning unit for the Centre. The air conditioner used has inletducts located on the same side with the diesel power generator exhaust whose outlets face thePrisons Staff Quarters, Avon Tyre Factory bay and an unpaved road next to the premises.There are other various industrial activities near this building. The aim of the study was firstto characterize the dust particles collected by analysis of the elemental contents and if possibledetermine the origin of dust and also to recommend to the client the ways to eliminate it so asto protect the workers and the sensitive equipment installed. The exercise was successfullycompleted. Among other recommendations, the client was advised to include determining theair particulate levels inside and outside the building by way of PM-10 system. This campaignfor air particulate monitoring in this area is still going on.Sample characteristics and other general observations included:[1] Dust samples from the Computer Server room were "black" in appearance.[2] Dust samples from the air conditioner located on top floor and from the back-up power
supply room were brown in colour.[3] The dusty "black" samples were fine powder that can easily be transported in air.
However, due to the small quantities collected, it was not possible to determine theparticle sizes.
Construction activities, unpaved roads around the Voucher Processing did contributeto increased dust particles in the workplace. Other air polluting activities include, industrialand traffic emissions (Gatebe et al., [8]). There were no significant reductions in the levels ofheavy metals; iron (Fe), zirconium (Zr) and zinc (Zn) for samples collected from the airconditioner room and those from the computer server room. This implied poor filtration of theair. Carbon and sulphur in the samples analysed seemed to be of the same origin. It wastherefore concluded that the air filtration system in the premises was not efficient because theroom entrances and exits are not properly constructed hence allows the dust into the building.Secondly, the openings for the cable installation on the ground floor are not properly sealedagainst the dust inlets. It was therefore recommended that a closed/or open-loop air filtrationsystem for the premises be installed. This system is capable of filtering out air particles sizes lessthan lOum or less depending on the filter membrane installed. It was also recommended thatsome dialogue and negotiations on the possible ways and means to reduce the particulate matterin air by way of clean production practices be initiated between the bank, the neighboring firmsand relevant authorities.
(iii) Characterization and transport of aerosols at Mt. KenyaAerosol samples are being collected using a two-stage streaker sampler (Annegarn et
al., [2]). It has a size selective inlet with an upper cut-off point of 10 jimad defined byimpaction onto a fixed substrate, followed by impaction through a rectangular orifice onto arotating substrate. This is followed in turn by a filter stage with an upper cut-off point of 2.5jLimad. The impaction stage consists of a mylar foil mounted on an identical plastic frame tothat used for filter stage, allowing for the same convenience of handling, analysis and storage.The frame rotates at 1 revolution per 32 days. The mylar foil and filter passes over 0.5x3 mmand 1x7 mm impaction slit and sucking orifice respectively, leaving behind a streak of dust.Aerosol samples were collected at Mt. Kenya using a two-stage streaker sampler (Gatebe etal., [11]; Annegarn et al., [2]). The sample which is reported is for the period 12 August to 9September 1997. Elemental analysis of the mylar foil (coarse stage) and nucleopore (finestage) was performed by Particle Induced X-ray Emission (PIXE) analysis (PAL, [38]). Thesample was analysed in 1 mm segments corresponding to a 4 hr increment, yielding 168 stepsper frame, for 28 days. Elements between sodium and uranium were analysed. Five elements,silicon, sulphur, chlorine, potassium and iron (accounting for about 95 % of the total observedinorganic aerosol loading) were chosen for analysis of source regions of the air masses
57

impacting on the site during the sampling period. A 36-hour moving maximum function wasused to remove the diurnal variations, followed by a 36-hour moving average for smootheningthe resultant maximum curve (Gatebe, [10]).
Of the 21 elements identified in the aerosols reaching Mt. Kenya, silicon, sulphur,chorine, potassium and iron account for -95% of the total mass transport (Table 3). Silicon isthe major elemental contributor to the total inorganic aerosol loading, accounting for 38 % inthe coarse mode (particle size >2.5 (jrnad) and 61% in the fine mode (size <2.5 jimad) ofmaterial transported to Mt. Kenya. Fine-fraction sulphur constitutes the second highestconstituent (22 %) of the total fine mass. Chlorine in the coarse mode (6 %) constitutes asignificantly less important contribution and fine-fraction potassium (4 %) and iron (3 %) aneven smaller contribution to the total loading.
TABLE 3 Percentages of weight fraction of the elements present in the sample on Mt. Kenya at 4420 mabove mean sea level *
Coarse FractionSiFeCaNaAlClPKZnTiPbMnCuSr, As, V, Ni,Cr&Br
% Mass37.814.113.010.86.56.56.33.31.61.60.60.50.1<0.1
Fine FractionSiSClKFeCaNaTiBrZnVCu, Cr, Mn, P, Ni, Pb, Se & As
% Mass61.021.65.83.92.61.80.60.30.20.10.1<0.1
*-(Gatebe et al., [11])
Iron accounts for 3 % of the total mass transport to the site in the fine fraction and 14% in the coarse mode and reached its highest concentration of ~0.1 ngm'3 from 23-25 August.Usually iron is mainly associated with dust from crustal material (Priest et al., [39]; Maenhautet al., [32]). However, in this case despite the fact that transport pathways for iron, silicon andsulphur are similar, the variation of the element (Fe) with time is more similar to that ofsulphur than silicon. This suggests that the two elements S and Fe may have similar source orsource regions and that fine iron may be anthropogenic as well as crustal particularly assteelworks are to be found in the industrial region over which the air passed. Potassium is alsoused as a signature of biomass burning component (Crutzen and Andreae, 1998). The highestconcentration of potassium was < 0.3 |agm"3. From the transport pathway associated with thepeak occurrence of potassium, it is clear the source of burning was over the horn of Africaregion. For the observations considered, there is little evidence of pyrogenic products reachingKenya from the usual Angola, Zambia, Zimbabwe, Malawi and Tanzania areas of southernAfrica region identified as the primary source of intensive fire activities from August toOctober (Cahoon et al., [4]; Andreae, [1]).
3.2 WATER POLLUTION STUDIES
(i) River NyandoThis is one of the most recent work undertaken to assess river water quality. This site
is at Muhoroni which is about 400 km from Nairobi in western Kenya. It is located nea .e
58

Victoria in the sugar belt of Kenya. Along the River Nyando a lot of sugar and other agro-chemical industries are based. Discharge of industrial effluents into this river is a commonphenomenon and hence the need for this study. Water samples were collected using one litrepolyethylene plastic bottles, which had been thoroughly washed with water and 10 % nitricacid then rinsed with copious amounts of double distilled water (Maina et al., [33]). The waterbottles were immersed while closed, then opened at a depth of about 20 cm from the surfaceto avoid contamination by surface debris (Maina et al., [33]).
3.2.1 Total Reflection X-ray Fluorescence
Total Reflection X-ray Fluorescence system was used for analysis (Korir, [26]). Thesystem consists of a Vienna Prototype TXRF Module attached to the line focus of the Type DHousing of Mo target water cooled Siemens Model FK 60-04 X-ray tube. The high voltagegenerator used was the Kristalloflex 71 OH from Siemens with a maximum of 53.5 kV andcurrent of 40 mA. The x-ray detector used was Canberra Si(Li) Model 2008 of resolution 174eV (at Mn-Ka line), active crystal volume of 30 mm2 and thickness 5mm. For this study, thex-ray tube was operated at 40 kV and 20 mA. No other extra spectral modification of the Moprimary beam was done due to the low intensity. The TXRF module was optimized for theMo-K lines with the cut off at 20.0 keV. The angle of incident with the sample used wasabout 0.6 mrad. The counting dead time for most samples averaged 1%. X-ray spectra werecollected for 2000s by way of an MCA emulation software - SI00 from Canberra. Thequantitative analysis was done with QXAS (IAEA, [12]) after calibration of the spectrometerusing a set of multi-element standard solutions with Co as internal standard (Kregsamer,[28]). The sample carriers used were the SUPRASIL discs, 30 mm in diameter and 3 mmthick.
3.2.2 Sample preparation for TXRF analysis
One millilitre of each sample was pipetted onto a clean vial and 1 ug of cobalt per mlof sample was added as internal standard. The content of the vial was mixed thoroughly byshaking and after which 10 ul was pipetted on a cleaned sample carrier. The samples wereseen to spread to about 6 mm in diameter. The sample substrate liquid was then dried in alow-pressure chamber at room temperature (23 °C). For each sample, 3-4 replicates weremeasured.
3.2.3 Preconcentration of water samples for TXRF analysis
The pH of 100ml of the sample with 10 ug of Co internal standard and 5 ug of Niadded as a carrier was adjusted to between 5 and 6. It was then mixed with 10 ml of freshlyprepared 2% NaDDTC solution and stirred for 15 minutes. The precipitate formed wasfiltered by a Millipore filter of porosity 0.4 urn. The filter substrate formed was then dissolvedin 1 ml of MIBK solution into a clean container. 10 ul of the solution was then spiked ontoeach of the clean sample carriers, dried and analysed.
Results of TXRF analysis of the water samples (no preconcentration with organicreagents) collected from River Nyando (along it are sugar and agro-chemical food industries)indicate that phosphorus (P) and lead (Pb) were below detection limits which ranged from 30-180 ug/ml and 30-150ng/ml respectively (Table 5). The presence of sulphur in these watersamples was an indicator of poor effluent control measures not effected by the industries.Other parameters (Table 6) measured include conductivity, pH, salinity, total dissolved solids(TDS), hardness, biochemical oxygen demand (BOD) and dissolved oxygen (DO). The pH
59

remained relatively very basic in most of the samples analysed. However, the conductivitylevels of industrial effluents were about four (4) times those of the river water while thesalinity levels were about eight (8) times. The BOD levels of the waste from the sugar factoryis about 100 times that of the river water before any industrial waste discharge points whilethat from the agro-industry is about 13 times that of the river water. Although the river seemsto recover, the industrial wastes certainly do elevate the BOD levels of the river waters andrequires constant monitoring to ensure that the limits are not exceeded.
3.2.4 Water Sample Analysis using EDXRF
The water samples were preconcentrated and filtered through a millipore paper thenirradiated using 109Cd source for 3000 seconds and the spectra data were stored in a computer.Spectra de-convolution and fitting was carried out by AXIL (Analysis of X-ray Spectra byIterative Least-Squares Fitting) modular program of the Quantitative X-ray Analysis System(QXAS) (IAEA, [12]), while quantitative analysis was by a software for Quantitative Analysisof Environmental Samples (QAES) (Kump, [27]). Quality control assessment of the techniquewas done by analysis of standard reference material from National Institute of Standards andTechnology (NIST), SRM 2676d and some in-house standards.
TABLE 4a.TXRF analysis of a In-house Water Standard
ElementTiFeNiCuZnSrPb
Experimental (ug)3.18 + 0.044.25 + 0.034.17 + 0.033.65 + 0.033.86 +0.033.43 + 0.03.46 + 0.05
Expected value (ug)4.0
t t
tt
ti
tl
it
It
TABLE 4b. EDXRF analysis of an In-house Water StandardElement Experimental (ppb) Expected value(ppb)
TiFeCuZnPb
84.1+21.5125.0 + 11.3105.0 + 8.678.7 + 6.6108.0 + 8.2
100tl
11
M
11
The results of analysis of the effluents from the River Nyando showed that waste fromthe factories was certainly affecting the water quality of the river. High levels of sulphur (0.9 -439 |ag/ml) were registered at a waste treatment pond in the factory. The occurrence of thesehigh levels during some sampling visits, suggests some random release of industrial wastes intothe river. Other parameters affected by the industrial wastes included the conductivity, salinityand BOD. This calls on the authorities to initiate some strident monitoring of the industrialwaste.
60

TABLE 5. Elemental Analytical Results in ug/ml (ppm)Sample
AlA2A3A4A5BlB2B3B4B5ClC2C3C4C5
PhosphorousDL
ii
n
it
11
1!
11
11
II
II
II
II
II
II
II
Sulphur3.6±0.5
0.90±0.021.2±0.21.1±0.21.1±0.3439±2182±2.3190±4.2259±4.7166±14169±5164±20434±2.2228±8.1165±13.1
Calcium99±2
16±0.618±0.118±0.518±0.0247±1.019±1.018±1.320±3
17±0.188±3.813±1.136±2.331±1.6
13.9±0.3
LeadDL
It
tt
H
f l
1.46 ±0.1DL
II
11
it
tt
II
M
n
ir
TABLE 6. Results of other ParametersSample
A5*B5*C5*A2**B2**C2**Al#Bl#Cl#A3##A4##B3##B4##C3##C4##
Conductivity pH(mg/1)246140237205321188134412861256201233302285192201
7.318.027.268.658.38.077.309.66.99.018.038.17.99.28.11
Salinity(mg/1)0.10.10.10.10.10.10.70.90.90.10.10.10.10.10.1
IDS(mg/1)116102109971878265471570110311011513212197
Hardness(mg/1)1241261188499911841932039298897281104
B.O.D. D.O.(mg/1) (mg/1)
1550103804203202640245023602503031030530025
4.42.04.22.83.62.61.61.81.82.42.22.02.02.22.4
Key:- Samples collected before factory discharge points#* - Samples collected after the Agro-chemical discharge point# - Samples collected after -waste treatment ponds of the sugar factory## - Samples collected after the discharge point of the sugar factory
(ii) Tannery EffluentsA recent study (Kinyua et al., [22]) on water samples collected on the up-and-down
streams of a tannery factory discharge point to Kamiti river has been done. The heavy metalanalysis was done by TXRF (Korir, [26]) while BOD and COD parameters were done as perthe standard method for the examination of water and waste water (Rad et al., [40]). Samplecollection, storage and preservation was carried out as set out previously (UNEP, [43]).Polyethylene containers were used to minimize trace metal contamination. Sample preparationfor analysis was carried out within 48 hours.
61

TABLE 7.ParameterBODCODSClKCaTiCrMnFeCuZnAsBrRbSrPb
Kamiti River Water Analysis (ppb unless otherwise stated)Upstream7mg/L28mg/L1651 ±2516652 ± 27512826±25310000 ± 15155±15<23127 ± 121590±3040 ± 1024 ±7 ppb<3442 ± 13<3291 ± 13<81
Downstream20mg/L112mg/L1852 ±4975417 ±39811246 ±3 1210099± 150236 ± 23<37143 ±192181 ±32<4841 ± 11<5661 ±20<60103 ±25<137
3186±3354430 ± 2299406 ±20115533 ± 129159±1534±10687 ±153279 ± 27<1925 ±6<3242 ±11<3052 ±15<78
3094 ± 2675593 ± 16110227± 15816332 ±136119± 10<23550± 122748 ± 25<1623 ±6<26104 ±8<2689 ±9<90
Results of recent analysis of water samples from Kamiti River (Table 7) (Kinyua, [23]) showsthat the influence of the tannery had greatly reduced compared to some previous analysis(Kinyua, [18]). This reduction was because the industry's operations had been curtailed due toits poor record on control of emissions (Muriuki, [34]).
3.3 OTHERS
iii) Beauty Cream SamplesSamples (n=100) of beauty creams were bought randomly from various retail shops in
Nairobi and its environs (Kinyua et al., [22]). Each sample was squeezed into a clean beakerthen heated on a water bath at 40-50'C until melting was complete. The melt was then pouredonto a 2.5 cm diameter Mylar (Spectro-Film grade, Somar INC., USA) supported onaluminum ring (Kinyua et al.,[21]) so as to acquire the configuration of a homogenous pellet(0.3g/cm2) when cooled. No other physical and/or chemical treatments were applied to thesample.
Results of mercury level measurements and analysis (Kinyua et al., [22]) showed that thecosmetic cream "Madonna"(green) had the highest level (ug/g) of mercury - 29000+2800followed by "Madonna" (red) cream with 18000+1700. Significant differences (pO.OOl) in theanalytical results for "Madonna" (red), "Pimplex" and "Shirley" (original) were observed for thesamples bought March and September, 1995. The creams, "Shirley" (new), "Dermovate" and"Topshirley", registered values below the detection limit (3 |ug/g).
Two significant findings of this study are: mercury is present in some of the beautyproducts being sold in Kenya. This confirms previous findings which reported levels ofmercury above lp.g/g (Wandiga and Jumba, [45]). Secondly, the level of mercury is notconstant in different batches bought during the sampling periods. For example, the mercurylevels (jag/g) during the month of March 1995 for "Madonna" (red) was 16080+1030 (n=5);"Pimplex" cream (n=5) had 4350+290 while "Shirley" (original) had 18090+890 (n=5). Forthe month of September 1995, the mercury levels (p.g/g) were: 20900±1400 (n=5), 9644+630(n=5) and 10895+690 (n=5) respectively. This has the implication on the quality controlduring manufacture of these products and it is possible that some products could be on salewith even higher levels of mercury than those shown in this work.
62

Mercury levels in some of the products analysed were above the World HealthOrganization (WHO) limit of 5 ug/L in human blood (WHO, [48]). Although the levelsabsorbed through the skin is less, the health implications on the uses of some of theseproducts need to be investigated further. This is especially when traces of mercury previouslyreported in the nails and hair of some young people in Machakos (IAEA, [13]) plus theincreased incidences of renal problems and hypertension, reportedly attributed to heavymetals especially among the youth in this country (Kinyua et al., [19]). In their studiesinvolving African women in South Africa, Barr et al., 1972, attributed damaged kidneys to theeffect of mercury in the skin lightener creams used to improve facial appearances. However,previous studies (Kinuthia et al., [25]) observed that there was no single etiological factor ofmajor significance in nephrotic syndrome in Nairobi.
The major risks to human health arises from the neurotoxic effects of mercury inadults (Bakir et al., [3]) and its toxicity to the foetus if women are exposed to methyl mercuryin their pregnancy (Cox et al., [5]). There is therefore a great need for the local authorities toimplement stringent measures to curb the sale of these products, more so especially when thelevel of mercury is high in comparison to those reported in a previous survey (Wandiga andJumba, [45]). Organic mercury has greater affinity for the brain, and in particular, posteriorcortex as well as adipose tissue beneath the skin (WHO, [48]). The technique developed isfast and has the added advantage of permitting multi-elemental analysis. Other well knownchemical analytical techniques take too long due to lengthy sample preparation procedures,and also require expensive and toxic reagents.
The EDXRF system utilized in these analyses has previously been described (Kinyua,[17]). The excitation source was 109Cd (20mCi) with a run time of 300 seconds. The spectradata deconvolution was by AXIL based software (IAEA, [12]), while quantitative analysiswas by QAES Software (Kump, [27]). The detector system was calibrated using an oilstandard reference material - NIST-SRM-1634b and some in-house standards for L-lines.Calculation of the mercury concentration in the samples was based on intensity recorded (I),being taken as equal to a product of sensitivity (S), concentration of a given element (C),absorption coefficient (A), and enhancement factor (E) (Kump, [27]). For mercury,enhancement is absent (E=l) since there is no additional excitation of mercury by otherfluorescent radiation emitted by other elements present in the sample. The absorptioncorrection factor was measured experimentally by use of pure target of molybdenum, whereasthe sensitivity curve was generated from the use of the oil standard reference material and in-house standard for other L-lines which were not present in the oil standard. The intensity (areaunder the mercury peak) was read from the spectrum fitting by AXEL.
For quality control an AAS unit was also used for this work. This is as previously beendescribed [Jumba, 1980]. The unit is a Perkin Elmer Model 2380 a microprocessor controlledunit. It measures the concentration of metallic elements and provides integrated readings inabsorbance and concentration. For this work, the AAS unit was used for intercomparison andverification of results of the mercury levels in beauty creams. A few of the samples wereextracted and analysed as previously described (Wandiga and Jumba, [45]). Aliquots (0.5g)were digested first with HaSO4 (Ihr) and then 6% aqueous potassium permanganate (2 hrs).The excess permanganate was destroyed with hydroxylamine and the aqueous extract analysedby fiameless cold vapour atomic absorption spectrometry (AAS) - Pye Unicam SP 90A, at253.7nm. The detection limit obtained was better than 4 ng.
63

REFERENCES
[I] ANDREAE, M.O. (1993). Global distribution of fires seen from space, Eos Trans. AGU.74, 129.
[2] ANNEGARN, H.J., CAHILL, T.A., SELLSCHOP, J.P.F. & ZUCCCHIATTI, A. (1988).Time sequence paniculate sampling and nuclear analysis, Physica Scripta 37, 282-290.
[3] BAKIR, F., DALMUJI, S.F., CLARKSON, H.I.(1973). Methyl mercury poisoning inIraq, Science 181,23 0-241.
[4] CAHOON, D.R., JR, STOCKS, B.J., LEVINE, J.S., COFER III, W.R. & O'Neil, K.P.(1992) Seasonal distribution of African Savannah fires, Nature 359, 812-815.
[5] COX et al., Dose-response analysis of infants prenatally exposed to methyl mercury: anapplication of a single compartment model to single strand hair analysis, Environmental£e5. 49(1989)318-332.
[6] CRUTZEN, P.J. & ANDREAE, M.O. (1990). Biomass burning in the tropics: Impact onatmospheric chemistry and biogeochemical cycles, Science 250, 1669-1678.
[7] GATEBE, C.K. AND KINYUA, A.M. (1994). Total Suspended Particulate Matter in Airof Some Urban Areas in Kenya - A Review. Int. J. BioChemiPhys. 3, 1-4.
[8] GATEBE, C.K.(1996). UNEPAVHO 1996 Air Quality Management and AssessmentCapabilities in 20 Major Cities, United Nations Environmental Programme, WorldHealth Organization, Monitoring and Assessment Research Centre, London, p. 178-182.
[9] GATEBE, C.K., A.M. KTNYUA, M.J. MANGALA, R.KWACH, L.N. NJAU, E.A.MUKOLWE, D.M. MAINA (1996). Determination of Suspended Particulate Matter ofMajor Significance to Human Health using Nuclear Techniques in Kenya. Journal ofRadioanalytical and Nuclear Chemistry, Vol. 203, No. 1, 125-134.
[10] GATEBE, C.K. (1998). Characterisation and transport of aerosols sampled at a highaltitude on Mt. Kenya, unpublished Ph.D. thesis, University of Witwatersrand,Johannesburg, South Africa.
[II] GATEBE, C.K., TYSON, P.O. ANNEGARN, H.J., HELAS, G., KINYUA, A.M. ANDPIKETH, S. (1998). Inter-Hemispheric Transport of Aerosols over Continental Africa(submitted for publication).
[12] International Atomic Energy Agency (IAEA) (1995). Quantitative X-ray Analysis System(QXAS, Version 3.2), Vienna.
[13] International Atomic Energy Agency (IAEA) (1978). Activation analysis of hair as anindicator of contamination of man by environmental trace element pollutants,IAEA/RL/50, 105.
[14] JUMBA, I.O., personal communication, 1996.[15]KAHENYA, P.N.P. (1996). A review of studies on occupational diseases in Kenya.
African Newslett on Occup. Health and Safety Supplement 2/96: 46-49.[16]KENNY, T. (1996). Northern Corridor Transport Project: Adverse social and
environmental impacts caused by the rehabilitation of the Westlands-St. Austins andKabete-Limuru roads, Kenya. Oxfam UK/Ireland Policy Department.
[17] KINYUA, A.M. (1982). X-ray fluorescence analysis of solid and liquid samples, M.Sc.Thesis, University of Nairobi.
[18] KINYUA, A. M., OWERA-ATEPO, J. B., JUMA, F. D., MANGALA, M. J., MWANGI,L. W. AND NDWARU, T.W. (1990a). Heavy Metal Analysis of Industrial Effluents inNairobi City. Proceedings of the llth KEMRI/KETRI Annual Medical ScientificConference, Nairobi, Kenya.
64

[19]KINYUA, A.M., OWERA-ATEPO, J.B., KANYIMA, J., ORIOKOT, G., JUMA, F.D.,OTIENO, L.S., MWANGI, L. W.(1990b), Trace Element Analysis of Urine obtainedfrom Patients with Renal Failure. Proc. llth Ann. Med. Sci. Conf. KEMRI/KETRI,Kenya Medical Research Institute.
[20] KINYUA, A. M. AND PACINI, N. (1991). The Impact of Pollution on the Ecology ofthe Nairobi-Athi River System in Kenya, Int. J. BioChemiPhys. l(l),5-7.
[21] KINYUA, A. M., MAINA, D. M., MANGALA, M. J., GATARI, M. J.(1994). EnergyDispersive X-ray Fluorescence (EDXRF) in Non-destructive Testing of Oil Samples.Proceedings of 1 st African Regional Conference on Non-destructive Testing (ARCNDT),Kenya NDT Society, 76-82.
[22] KINYUA, A.M., MAINA, D.M., MAINA, C., MANGALA, M.J., JUMBA, I.O.,GATEBE, C.K. AND GATARI, M.J. (1997a). Non-destructive analysis of Mercury(Hg)by Energy Dispersive X-ray Fluorescence (EDXRF) Technique in Beauty Creams sold inKenya. IAEA-SM-344/49 Proceedings of International Symposium on Harmonization ofHealth Related Environmental Measurements using Nuclear and Isotopic Techniques,Hyderabad, India, 4-7 November 1996, p. 361-368.
[23] KINYUA, A.M., MANGALA, M.J., KORIR, A.K., ODHIAMBO, G.O. ANDBARTILOL, S.(1997b). Analysis of River Kamiti water samples (unpublished results).
[24] KINYUA, A.M., GATEBE, C.K., MANGALA, M.J., MAINA, D.M., KORIR, A.K.,BARTILOL, S., KWACH, R., NJAU, L.N. MUKOLWE, E.A., ODHIAMBO, K.,KONJI, V.N., KWASA, T., MWARE, A., BOR, P.K. AND WACHIRA, J.K. (1997c).Heavy Metal Analysis of Suspended Paniculate Matter(SPM) and other Samples fromsome Workplaces in Kenya using Nuclear and Related Analytical Techniques, CRPKEN/9478, International Atomic Energy Agency (IAEA).
[25] KINUTHIA, D.M.W., ONGERI, S.K., ABDULLAH, M.S, OTIENO, L.S., REES, P.,HUTCHEON, R.(1981). Clinicopathological aspects of nephrotic syndrome in patients atKenyatta National Hospital 1973-1977, EastAfri. Med. J. 58(11), 818-827.
[26] KORIR, A.K. (1998). M.Sc. Thesis, University of Nairobi.[27JKUMP, P. (1993). Quantitative Analysis of Environmental Samples(QAES), Ljubljana,
Slovenia.[28] KREGSAMER, P.K.(1995), Manual for QXAS, Quantitative X-ray analysis system
(Version 3.2), IAEA.[29] LALOR, G.C., H. ROBOTHAM, M.DAVIS, A. JOHNSON, J. PRESTON, C. GRANT
(1993). The Development of Air Pollution Studies in Jamaica. Applied Research on AirPollution Using Nuclear-Related Analytical Techniques, a Report on the second ResearchCoordination Meeting, Menai, Australia, 27-31, March, 1995, NAHRES-26, InternationalAtomic Energy Agency, Vienna, 12-1.
[30] LIPWORTH, A.D., H.J. ANNEGARN, M.A. NEON (1993). Advanced, enhanced HEXprogram for PIXE, Nuclear Instruments and Methods in Physics Research 75, 127-130.
[31] MAENHAUT, W. (1993) The 'Gent' Stacked Filter Unit (SFU) Sampler for the collectionof Atmospheric Aerosols in Two size Fractions; Description and instructions forinstallation and use, Report No. NAHRES-19, International Atomic Energy Agency,Vienna, 249-263.
[32] MAENHAUT, W., SALMA, L, CAFMEYER, J., ANNEGARN, H.J. AND ANDREAE,M.O.(1996) Regional atmospheric aerosol composition and sources in eastern Transvaal,south Africa, and impact of biomass burning, J. Geophys. Res., 101, 23631-23650.
[33] MAINA, D.M., KINYUA, A.M., MANGALA, M.J. AND GATARI, M.J. (1997).Assessment of heavy metal pollution of L. Victoria (in press).
65

[34] MURIUKI, A.W. (1995). Report of Air Emissions in and around Kamiti Tanners Ltd.,Directorate of Occupational Health and Safety Services, Ministry of Labour, Governmentof Kenya.
[35] NJUGUNA, S.G. (1978). A study of the effects of pollution on a tropical river in Kenya.M.Sc. Thesis, University of Nairobi.
[36] ODHIAMBO, G.O. (1997). The Impact of Muhorni Sugar Factory on the Water Qualityof River Nyando, Kisumu District, Final year project, Dept. of Environmental Science.Kenyatta University.
[37] OKETCH, T.G.N. (1994). Air Quality Based Service flow rates for Urban arterials, Astudy of some arterials in Nairobi, Kenya. M.Sc. Thesis, International Institute forInfrastructural, Hydraulic and Environmental Engineering, Netherlands.
[38] PAL, (1998). PIXE Analytical Laboratories, Tallahassee, USA.[39] PRIEST, P, NAVARRE, J-L., RONNEAU, C. (1981). Elemental background
concentration in the atmosphere of an industrialized country, Atmos. Environ. 15,1325-1330.
[40] RAD, M.C., GREENBAG, A.F. AND TARAS, M.J. (eds) (1975). Standard Method forthe examination of water and waste water, 14 Edition, American Waterworks Associationand Water Pollution Control Federation, Alpha-AWWA-WPCF, p.959.
[41] SCHWELA, D.(1997). Health Effects of Air Pollution, Healthy Cities-Air ManagementInformation System-AMIS, WHO/UEH.
[42] SUESS, M.J. AND CRAXFORD, S.R. (1976). (Ed.) WHO Manual on Urban Air QualityManagement, WHO Regional Publications, Europeans Series No. 1.
[43] UNEP (1987). Guidelines for determining inputs of inorganic contaminants intoestuaries. Reference Methods for Marine Pollution Studies No. 41.
[44]UNEP/WHO (1992). Urban Air Pollution in Megacities of the World, BlackwellPublishers, UK, ISBN 0-631-18404.
[45] WANDIGA, S.O. AND JUMBA, I.O., Determination of mercury in body beauty soapsand creams sold in Kenya and Norway, Kenya J. Sci. and Tech. A3 (1982) 89-91.
[46] WOBRAUSCHEK, P. (1995). Total Reflection X-ray Fluorescence analysis withPolarized Radiation, J. Trace andMicroprobe Techniques, 13(2), 83-96.
[47] WHO (1987). Air Quality Guidelines for Europe, Regional Publications, European SeriesNo. 23, Copenhagen
[48] World Health Organization (WHO), Trace Elements in Human Nutrition and Health,Geneva (1996) 206-209.
66

PORTABLE X-RAY FLUORESCENCE ANALYSIS XA9953280
P.J. POTTSDepartment of Earth Sciences,The Open University,Milton Keynes, United Kingdom
Abstract
Different applications of portable XRF instruments are described. Measurementmethods are described and detection limits for field portable XRF instruments are given
1. INTRODUCTION
X-ray fluorescence is a well established technique which is used for the chemicalanalysis of materials in many laboratories around the world. In conventional instrumentation,samples are normally excited by a high power (3 to 4 kW) X-ray tube and fluorescence spectraare detected by one or more wavelength dispersive spectrometers. These latter devices serveas X-ray monochromators, the X-ray spectrum being diffracted off a crystal or multilayerdevice into an X-ray counter. The analytical power of WD-XRF instrumentation is derivedfrom its multielement capability, the wide range of elements that can be determined (byconvention from Na to U in the periodic table and in some routine applications down to C),and the low detection limits, which for some elements fall below the ug g"1 level. A secondcategory of instrumentation is based on the use of energy dispersive X-ray spectrometers, himany laboratory ED-XRF instruments, samples are again normally excited by an X-ray tube,but the fluorescence spectrum is detected by the interaction of X-ray photons with a solid statesemi-conductor crystal - most commonly a lithium-drifted silicon detector. ED-XRFinstruments have an unrivalled capability to finger print samples, since the full spectrum isdetected simultaneously and can be displayed and interpreted during data acquisition. ED-XRF instrumentation is also very effective for quantitative analysis, although detection limitsare often 5 to 10 times worse than WD-XRF, mainly because the spectrum resolutioncharacteristics of ED detectors are substantially worse than those of WD spectrometers,especially in the lower energy region of the X-ray spectrum (below 8 keV). To compensate forthis deficiency, there is considerable advantage in using a polarised excitation geometry, sincethe scattered background in the fluorescence spectrum can be considerable reduced in thisway, with a corresponding favourable improvement in detection limit performance.
In addition to the two main categories of laboratory XRF instrument described above,a number of hybrid instruments have been developed, some incorporating an XRD detector topermit the simultaneous determination of phases (e.g., in the analysis of cement), somecombining ED and WD spectrometers to exploit the best characteristics of both in a singleinstrument, some optimised for specific applications (for example S in oil). However, one ofthe most exciting developments in recent years has been the introduction and application ofportable XRF instrumentation, based largely on ED-XRF technology.
2. PORTABLE INSTRUMENTATION
When considering portable analytical instrumentation, it is important to distinguishbetween instrumentation that can be installed and operated in a mobile laboratory, and can,therefore, be used for the on-site analysis of samples and true portable instrumentation thatcan analysis samples in the field in situ. Portable XRF can be used in both types of application
67

but the important advantage enjoyed by portable X-ray fluorescence is the capability for thedirect, non-destructive analysis of samples in the field. Few techniques offer this capability inrespect of non-organic species, the closest rival being spark source optical emissionspectrometry. This latter technique can be used effectively for the analysis of metallurgicalsamples, in applications such a scrap metal sorting, but which is ineffective in the analysis ofnon-conducting samples and inappropriate for the analysis of museum and archaeologicalsamples or works of art, because it cannot satisfy the non-destructive criteria.
3. DESCRIPTION OF PORTABLE XRF INSTRUMENTATION
Although portable XRF instrumentation is largely based on ED-XRF technology, anumber of design compromises are necessary to satisfy the portability criteria. Instrumentationcomprises an X-ray excitation source, X-ray detector and a data acquisition and analysis unitand an overview of the design of a hand-held portable analyser is shown in Figure 1. Theanalytical characteristics of these principal components will now be summarised.
excitation sourceson rotating holder
handle w power andsignal cable
ANALYSERUNIT
energy dispersivedetector (Hgh)
analytical referenceplane -j
SAMPLE
FIG. 1 Hand-held portable X-ray fluorescence analyser showing the overall configuration of components.
3.1 EXCITATION SOURCE
By far the most widely used excitation source in portable XRF instrumentation is oneor more radioisotopes that decay emitting X-ray or gamma ray radiation capable of excitingthe range of X-ray fluorescence lines of interest. In fact very few radioactive sources havesuitable characteristics (in terms of emission energies and long half lives) for use in portableXRF. Furthermore, several sources are required to excite effectively the full range of elementsif appropriate for an application. The sources most commonly used are 55Fe, 109Cd and 241 Amand their decay characteristics are listed in Table 1. Additionally, 238Pu has been used in someearlier instruments. Miniature X-ray tubes are becoming available and have the potential toextend the capabilities of P-XRF instrumentation. However, the requirement for additionalpower consumption is an important consideration in assessing their successful application toportable battery-powered instrumentation for use at remote sites.
68

TABLE 1 Decay characteristics of radioactive excitation sources used in portable XRF_____Source Half life Emission Element range that WD-XRF
(years) characteristics Energy can be determined tube anode(keV)___________(K-lines)_______equivalent
5SFe109Fe241 Am
2.71.24433
5.9/6.5 (Mn K-lines)22.2/25.0 (Ag K-lines)59.9
(Cl)-VCr-MoRu-LREE
CrRh(Ag)W(lOOkV)
LREE = light rare earth elements
In terms of analytical capabilities, 55Fe is capable of exciting the K-lines of elementsbelow Cr in the periodic table. The fluorescence Cr K lines suffer a severe overlapinterference from the Mn Ka line emitted from the source and scattered off the sample andmore reliable determinations can normally be made using the 109Cd excitation source. Thedetermination of lower atomic number elements is increasingly affected by attenuation of thecorresponding fluorescence radiation in air. As a consequence, detection limits for elementsbelow K increase substantially. The 109Cd source has a wide range of applicability, beingcapable of determining the K-lines of elements typically hi the range Cr - Mo. Best sensitivityis shown for elements in the range Rb - Nb. Immediately higher atomic number elementssuffer enhanced backgrounds due to scatter of Ag K lines off the sample. The sensitivity withwhich elements of lower atomic number than Rb can be excited by the 109Cd source falls offsignificantly, hi addition, the L-lines of higher atomic number elements (e.g. Pb) can beexcited by this source. The 59.9 keV gamma emission from the 241Am source extends theanalytical capability to the K lines of elements in the range from Mo up to the light rare earthelements (LREE). Higher atomic number elements than the LREE suffer enhancedbackground interferences caused by scatter in the sample of the source 59.9 keV lines.
An approximate correlation can be drawn between the analytical characteristics ofthese sources and conventional X-ray tube excitation sources. The Fe source behaves in a
] AQ ____
similar manner to a Cr anode tube and the Cd source to a Rh (or Ag) anode tube. Theprinciple difference is that in radioactive source excitation, there is no continuum(bremsstrahlung) component to the excitation spectrum, offering a potential improvement inportable XRF detection limits due to the absence of a background enhancement due tocontinuum scatter. This benefit must be balanced by the reduced intensity available from thesources in comparison with X-ray tubes because of practical limitations on the maximumactivity that can be incorporated in portable instrumentation. The excitation capabilities of an241 Am source are not as readily matched to an X-ray tube since modern WD-XRF X-ray tubegenerators often have a maximum rating of 75 kV, inadequate to excite efficiently 60 keVradiation. Perhaps the closest equivalent is a tungsten anode tube powered at 100 kV.
The other principal difference hi comparison with conventional X-ray tube sources isthat it is not possible to 'turn-off a radioactive source, a factor that has safety implications forthe design of interlocked shielding mechanism for when the source is not in use.
3.2 DETECTORS
Portable XRF instrumentation invariably incorporates energy dispersive detectors ofwhich three types are widely used. Some characteristics of these detectors are listed in Table2, particular features being as follows:
3.3 PROPORTIONAL COUNTER
The proportional counter is well known as the detector commonly used on WDspectrometers where it essentially serves as a single channel analyser to measure the intensity
69

of the monochromatic diffracted beam. However, in portable XRF applications, theproportional counter is used as an energy dispersive detector, the output signal being fed into amultichannel analyser, rather than a pulse height analyser. Proportional counters are simple,light-weight and robust devices. The major draw-back is the energy resolution. By convention,energy resolution is measured as the full width at half maximum (FWHM) of the peakdetected at 5.9 keV (corresponding to Mn Ka radiation), usually measured from a 55Fe source.The industry standard is the 140 eV (or better) achievable with a Si(Li) detector, by contrast,gas proportional counters can only achieve about 900 eV. As a consequence, spectrum overlapinterferences require serious considerations and applications are often restricted to samplesthat give relatively simple XRF spectra using matrix matched calibration samples which offersome compensation for spectrum interference effects.
3.4 Si(Li) DETECTOR
The Si(Li) detector is the best established energy dispersive detector, widely used inlaboratory XRF instrumentation as well as SEM and electron microprobe systems. To achieveoptimum resolution performance, Si(Li) detectors must be cooled , most commonly to liquidnitrogen temperatures using a dipstick connected to an integral liquid nitrogen container.Although detector systems can be designed for portable in situ field measurements, therequirement to provide liquid nitrogen is not particularly convenient. As an alternative,electronic Peltier cooling can be used to provide a reasonable degree of cooling, although withthe penalty of additional power consumption. As referred to above, Si(Li) can achieve FWHMresolutions of better than 140 eV, but with Peltier cooling, this is likely to be degraded to 180to 200 eV.
3.5 MERCURY (H) IODIDE DETECTOR
Contemporary research on alternative energy dispersive detectors has seen thedevelopment of thallium-drifted mercury(IT) iodide as a practical semiconductor detector. Oneadvantage of this material is the low degree of electronic cooling required to achieve stableoperation. Another is the high stopping power offers improved higher energy X-ray detectionefficiency from physically small detector crystals. Typical energy resolution is about 280 eV(FWHM at 5.9 keV) - not as good as can be achieved with a Si(Li) detector, but more thanadequate to allow the successful analysis of complex multielement materials, particularly forhigher atomic number elements that give fluorescence lines above 8 to 10 keV.
TABLE 2 Characteristics of detectors used in portable XRF instrumentation_____________Detector Advantages Disadvantages Typical energv
resolution (FWHM5.9 keV)
gas simple,proportional light,counter robust
Si(Li)
Hg(II)I2
industry standardtechnology. Bestenergy resolution ofcurrent solid statedevices
compact,no external coolingrequired,adequate resolution
Poor energyresolution limitsapplications
relatively fragile,liquid nitrogencooling for optimalresolution
relatively fragile,longevity?
900 eV
<140 eV (liq N2 cooling)180-200 eV (Peltier)
ca. 280 eV
70

3.6 DATA ACQUISITION AND SPECTRAL ANALYSIS
Being based on ED-XRF technology, portable XRF instrumentation incorporates a fullmultichannel analyser data acquisition system, which for the higher resolution detectors wouldnormally extend to 2048 channels. The rate of data acquisition is controlled by the sourceactivity an source-sample-detector geometry, so deadtime performance is largely fixed bydesign. Spectrum analysis requirements are similar to other ED-XRF systems in the need tomeasure fluorescence line intensities and correct/compensate for overlap interferences. Thereare several well established methods of doing this, including digital filtering/fitting libraryspectra, fitting model peaks and backgrounds, region of interest integration. In view of itssimplicity, region of interest integration is often used on portable instruments - data areintegrated over a certain number of channels centred on the fluorescence line of interest.Overlap corrections can then be applied by subtracting the appropriate proportion of an un-interfered peak of the interferent from the analyte peak intensity. To give satisfactory results, aprocedure is required to monitor drift in the spectral acquisition system and to recalibrateperiodically the channel versus spectral energy calibration function.
3.7 MATRIX CORRECTION
There are some special considerations in assessing the most appropriate matrixcorrection procedures for portable XRF instrumentation. Principal among these is the problemthat for a significant proportion of samples, it is not possible to analyse all matrix elements.This limitation arises from the attenuation in air of fluorescence X-rays from low atomicnumber elements such that it is unlikely that elements below potassium in the periodic tablecan be determined with adequate sensitivity. This limitation is particularly relevant in theanalysis of silicate materials, including soils, sediments and rocks. One approach toaccommodate this limitation is to use a fundamental parameter matrix correction procedure inwhich the difference is assumed to be SiO2, or some other compound that is judged to bestrepresent the X-ray attenuation properties of the unanalysed constituents of the sample.Another approach is to use matrix matched calibration samples that will compensate for bothmatrix effects and, to some extent spectrum overlap interferences. These approaches areusually more acceptable for portable as opposed to laboratory XRF because the fitness-for-purpose criteria in terms of accuracy and precision in many portable XRF applications are notas stringent as those for laboratory XRF.
3.8 ANALYTICAL PERFORMANCE
In order to demonstrate the analytical performance of portable XRF instrumentation,results are presented from an investigation in the authors laboratory using one specificinstrument, a Tracer Northern Spectrace TN9000 instrument, which incorporates 55Fe, 109Cdand 241 Am excitation sources and a Hg(IT)l2 detector. This instrument was used in a laboratoryassessment of the analysis of silicate rocks using a wide range of reference materials preparedas compressed powder pellets.
3.9 DETECTION LIMITS
Representative detection limits are listed in Table 3, where a comparison is madebetween (i) the manufacturer's portable XRF detection limits for a 'siliceous matrix', (ii)measured portable XRF detection limits derived from the analysis of a wide range ofrepresentative silicate rock reference materials and (iii) conventional laboratory ED-XRF inwhich silicate rock reference materials were excited with a Ag-anode X-ray tube. Thesiliceous matrix data represent ideal 'instrumental' detection limits achievable on favourable
71

samples. The 'working1 silicate rock reference material data represent detection limits that canbe achieved in day-to-day performance in the analysis of rock (and soil) samples.
TABLE 3 Comparison of detection limits obtained by field portable XRFSource
55Fe
lwCd
241 Am
Element
KCaTiVCrMnFeCoNiCuZnGaRbSrYZrNbPb-LBa-KLa-KCe-K
Portable XRF'instrumental"(siliceous matrix)(manufacturer'sdata)15070555090200110100655040355443415988
Portable XRF"working"(silicate rock)(referencematerial)36022512049108035442435411680635813149963921-14
LaboratoryXRF (excited)rock)
2430
1412876333337_--
ED-Ag-lube(silicate
'Instrumental': 200 s count time per source on a siliceous matrix (Spectrace TN9000, Manufacturers data).Working': 200 s count time per source on a silicate rock matrix (based on an analysis of silicate rock referencematerials), taken from Potts et al. [3].Laboratory ED-XRF: 800 s count time, Si(Li) detector, Ag tube excited (Potts 1987).
Comparison with laboratory XRF show that detection limit performance by portable XRF isnot dissimilar for a range of elements excited by the l09Cd source, if differences in count timeare taken into account (200 s for P-XRF compared with 800 s for the laboratory ED-XRFdata). An exception to this general observation is the poorer P-XRF detection limits for thelower atomic number elements, where detector resolution, source excitation intensity andattenuation in air are all factors that count against P-XRF performance. The portable XRF datalisted in Table 3 are representative of count times of 200 s per source but in practicalsituations, a shorter count time would normally be used, depending on fitness-for-purposecriteria. If the count time is halved, the detection limit is expected to increase by a factor of V2(i.e., 1.4), a conversion that can be used to estimate detection limits if shorter count times areselected.
3.10 PRECISION
From the same evaluation of the performance of portable XRF instrumentation in theanalysis of silicate rock reference materials, an review of results was undertaken to assessprecision and accuracy. Precision data in the repetitive analysis of a dolerite rock (Whin Sill)are listed in Table 4 using count times of 100 s and 200 s per source. Taking into account theaffect of concentration, these data indicate that repeatabilities in the order of 1 to 3 % (relativestandard deviation) can readily be achieved by portable XRF instrumentation.
72

TABLE 4 Precision (repeatability) in the analysis of Whin Sill dolerite (powder pellet)element
KCaTiVMnFeRbSrYZrNbBa
expected (ug g'
83026454014560349132093380274223420618350
100 s count time
analysed(Hg g'')130467015217799470.51531.010402038.8513.937.5240.414.2385.3
s(ug
512.2794.9382.060.6375.213968.322.26.38.13.827.7
(n=10)
g1) RSD(%)3.91.12.112.924.51.321.44.316.83.426.87.2
200 s count
analysed(us g'1)1309370239.917445.1484.31523.210407942.0508.431.4234.513.6392.9
time (n=8)
s(Ug g'1)210.2313.0311.2484.3206.315854.011.14.47.54.07.7
RSD(%)1.60.451.84.013.51.59.52.214.03.229.42.0
Data abstracted from Potts et al. [3].
3.11 ACCURACY
Accuracy can be assessed visually from graphs of expected versus analysed values fora wide range of geological reference materials shown in Figure 2. These results demonstratethat quantitative results can be achieved with confidence by the technique, taking into accountdetection limit performance.
•a 800•g
Zirconium
I>400
Strontium
400 800 1200PXRF analysed value
200 400PXRF analysed vatue
Potassium (KjO)
4 8 12PXRF analysed value
400 tooPXRF analysed value
FIG. 2. An example of the accuracy of P-XRF results in •which expected results are plotted against analysedvalues for a series of silicate rock reference materials, prepared as compressed powder pellets. Results are
plotted for the elements K, Cu, Sr, andZr (taken from Potts et al. 1995).
4. QUANTIFICATION AND INTERPRETATION OF P-XRF DATA
4.1 SAMPLE SURFACE IRREGULARITY EFFECTS
The results in the previous sections show that portable XRF is capable of achievingexcellent accuracy and precision under well controlled conditions in the laboratory. All the
73

results presented above were derived from standard compressed powder pellets. Although notalways recognised as such, one of the factors that affects the quality of laboratory XRF data issample presentation in terms of the requirement to prepare samples for analysis with perfectlyflat surfaces which are positioned accurately in the analysis position in relation to the source-sample-detector X-ray optics. This too can be achieved by portable XRF by carefullypositioning a flat sample in the 'analytical plane1 of the instrument over the analyser window.However, these stringent requirements for sample presentation are not usually met in thedirect field analysis of real samples by portable XRF. In particular, real samples (especiallyrocks, archaeological samples, museum artefacts and even soil surfaces levelled for analysis)are unlikely to be perfectly flat and indeed may have significant curvature and surfaceroughness effects. In these circumstances, portable XRF results will suffer from inversesquare law phenomena whereby the intensity observed from a point source varies inproportion to the inverse square of the distance between source and detector.
When fitness-for-purpose criteria indicate that results of the highest accuracy arerequired (as in provenancing geological or archaeological samples, for example), surfaceirregularity effects may represent a serious limitation. For many samples, analytical results arelikely to be lower than expected (mean surface of sample lies above the analytical plane of theanalyser). Exceptionally they might be greater (part of the sample protrudes towards theanalyser window).
A detailed investigation of this problem was undertaken by Potts et al. [4] with a viewto seeking a correction. Results demonstrating the magnitude of the problem are shown inFigure 3. Data in this diagram show the apparent concentration of Sr obtained by analysingbroken surfaces of an irregularly shaped silicate rock sample. An estimate of the 'air gap' (thatis the distance between the mean surface of the sample and the analytical plane of theinstrument) could be made from a separate series of measurements in which the distancebetween the analyser plane and a flat polished surface of the same rock type was accuratelyvaried between 0 and about 13 mm. At each height, corresponding to a known air gap, theintensity of the 241Am scatter peak was measured. By comparing the same scatter peakintensity measured off the broken surface of the sample, an estimate of the effective air gapcould be made.
i1'-
*-;(ftC0) 4
• •
" , 0 0
__ Ideal __ __
* Corrected results
Analysed resultsc
0 2 4 6 8Estimated air gap (mm)
FIG 3. Apparent P-XRF concentration ofSr obtained from determinations made over theirregular surface of a silicate rock -with varying surface roughness. The degree of surface roughness was
estimated as the effective air gap (in mm). Uncorrected results are compared -withcorrected data based on 55Fe scatter peak intensities (taken from Potts et al. [4]).
74

Results in Figure 3 show that even with the broken surface of the rock sample restingon the analyser, considerable discrepancies could arise in analytical results. The simulated airgaps observed in this sequence of measurements on broken surfaces was between about 0 and7 mm, the latter values being achieved by deliberately raising one edge of the rock. Ifquantitative results are required, a correction is clearly required to compensate for thesediscrepancies. The correction proposed by Potts et al. [4] involved measuring the scatter peakintensities from the irregular sample surface and comparing it with an 'ideal' measurement,observed from a perfectly flat sample, where the surface lies exactly in the analytical plane ofthe instrument. It was found that if fluorescence intensities were multiplied by the ratio of thescatter peak intensity from the flat surface ratioed to the same intensity from the sample beinganalysed, the influence of surface irregularity effects could largely be eliminated. There are,however, some limitations to this approach. One is that the scatter peak intensity is itselfmatrix dependent. In the case of the Fe scatter peak, this matrix dependency was not verygreat, so a 'typical' silicate rock could be used to derive the reference intensity. In the case ofthe I09Cd source, a more significant matrix dependence was observed so that a reference rockof matched matrix composition must be chosen as the reference sample. Results for 241 Amwere obscured by the fact that the reference samples investigated for matrix dependency(powder pellets of geological reference materials) were not infinitely thick with respect to59.9 keV radiation.
The other major limitation of this approach is that other factors affect scatter peakintensities when sample to analyser distances are changed. The most serious of these is theadditional air attenuation which affects the 5.9 keV Fe scatter peak and the change inintensity which occurs when the mean scatter angle increases as the effective air gap becomeslarger. These factors mean that increasing errors affect results if this correction procedure isapplied to sample surfaces with effective air gaps that exceed 3 to 4 mm. However, it shouldbe noted that experience in the analysis of rock materials indicates that except for samples ofunusual shape, the effective air gap rarely exceeds these values.
Results obtained when the proposed correction procedure based on normalising to 55Fescatter radiation are plotted on the same graph as uncorrected results in Figure 3. These dataindicate a significant improvement in results when compared with the expected composition,though with the correction becoming increasingly unreliable above about 4 mm.
4.2 EXCITED VOLUME AND STATISTICAL EFFECTS ASSOCIATED WITHSAMPLING
Like all XRF techniques, the fluorescence signal is derived from and excited volumewhose depth is dictated by the critical penetration depth of the fluorescence line of interest.This parameter is normally defined as the depth below the surface of the sample from which99% of the analytical signal is derived. Beyond this depth, there is a high probability thatfluorescence photons will be absorbed within the sample. By its nature, the critical penetrationdepth varies with photon energy, since higher energy photons have higher penetrating powersthan lower energy photons. Data hi Table 5 gives estimates of the critical penetration depth ofa range of characteristic X-rays, varying from about 30 um for the K Ka line (3.3 keV) to noless than 8.6 mm for the Ba K-lines at 32.2 keV. The simplistic implication of these data arethat the potassium signal is derived from the mass of sample represented by a cylinder 25 mmin diameter (the diameter of the analytical window) by 30 (im deep, whereas Ba is derivedfrom a much larger mass, the height of the cylinder representing the excited volume nowbeing over 8 mm. However, the interpretation is complicated by the fact that contributionsmade by various layers within the excited volume will decrease approximately exponentiallywith depth, down to the critical penetration depth and that the surface of the sample adjacent
75

to the analytical window is not likely to be excited uniformly by the excitation source. As anexample ofthe latter phenomenon, the excitation capabilities of a near point source are plottedin Figure 4, showing how different regions on the sample adjacent to the analyser windowcontribute to the detected signal. An annular source would be expected to show differentcharacteristics.
TABLE 5 Critical penetration depths____________________________________Element, energy of K Ca Ti Fe Rb Zr Ba CeK-line (keV)______3.31 3.69 4.51 6.40 13.39 15.77 32.19 34.72Critical penetration 0.030 0.035 0.047 0.16 0.82 1.2 8.6 9.6depth (mm)_____________________________________________
Critical penetration depth represents the depth within an silicate rock ofandesitic composition from which 99%ofthe X-ray fluorescence signal originates.
Despite these complications, the overall effect is that P-XRF elemental data will bederived from a relatively small mass of sample. There are two important analyticalconsequences which derive from these observations. The first is that for some elements,analytical results will be affected to a disproportionate extent by the composition of thesurface. For this reason, turf and other vegetation must be removed prior to the analysis of soiland the presence of weathering, fallout contamination or lichen growing on the surface of rockmaterials or corrosion products on metals and alloys which have been exposed to theenvironment for any length of time, will disproportionately affect results if the aim is toestimate the bulk composition of the sample. Conversely, if the aim is to characteriseweathering or corrosion products, P-XRF may be able to contribute useful results.
A second important consequence concerns the effect that statistical variations in therandom distribution of phases within the analysed volume will have on the overall precisionof results derived by averaging replicate measurements. This effect has been demonstrated byreplicate determinations made on the surface of flat and polished blocks of a range of silicaterocks containing an assemblage of minerals of increasing coarseness. The hypothesis is thatalthough all minerals in this assemblage may be randomly distributed in the bulk sample,there will be significant differences in the proportion of minerals in the excited volume of anyindividual P-XRF measurement. The precision, based on replicate measurement at randompositions on the surface may then be dominated by sampling precision (reflecting statisticalvariations in the distribution of individual minerals). To assess the magnitude of this effect,replicate measurements were made on polished blocks ofthe five rock types listed in Table 6(Potts et al., 1997). These varied from a fine grained dolerite in which in which grains weremainly less than 1 mm across, occasionally up to 2 mm, through various medium-grainedgranite (with a grain-size of typically 1 to 4 mm), through to an coarse grained granite havinga ground mass of quartz and plagioclase grains up to 7 mm long and exceptionally potassiumfeldspar grains of up to 35 mm long. Results of replicate measurements were then averagedand the standard deviation calculated. These data were then recalculated for each sample toestimate the number of replicate measurements that would have to be made to achieve aspecified overall analytical precision (calculated as the standard deviation ofthe mean) of 2, 5,10 and 20%. A simplified summary ofthe results is listed in Table 7 and shows that for thefine grained dolerite, target precisions of 10 and 20% relative can be achieved from a singledetermination, 2 measurements must be averaged to achieve a precision of 5% relative, but anaverage of 8 measurements are required to achieve a precision (standard deviation ofthe meanof 2%.
76

TABLE 6 Estimate of the number of individual determinations that must be averaged to achieve a measurementprecision of 2, 5, 10 and 20% (relative standard deviation of the mean) in the direct analysis of a range of rocksamples of varying grain size.Targetprecision
Typicalgrain-sizeTargetprecision20% STD10% STD5% STD2% STD
Dolerite Quartz Microgran Medium- Coarse-andesite ite grained granite grained
granite1-2
1128
mm 1-3mm
Number
11420
(-5) 1-4 mm
of replicates to be
11423
1-3 mm 3-1 (-35) mm
averaged
11317
(representative data)
62182512
STD = standard deviation of the mean. Data abstracted from Potts et al. (1997)
Corresponding figures for the number of determinations that must be averaged for themedium-grained rocks to achieve 20, 10 5 and 2% precision are typically 1, 1, 4, 20 analyses,respectively. For the coarse-grained granite, no less than 512 determinations would need to beaveraged to achieve 2% relative precision (in terms of standard error of the mean), indicatingthat such a requirement has extended beyond the practical limits of the performance of thetechnique.
Although this precision assessment is specific to the samples investigated, the resultsare presented to serve as a guide to the influence of sampling precision on P-XRFmeasurements, relevant to soils and sediments, as well as rock samples. An importantpractical issue is that the contribution of sample mineralogy to overall measurement precisioncannot be detected from a single measurement, or from replicate measurements on the samespot. It is essential that the analytical procedure includes a requirement to undertake replicatemeasurements on different positions on the same sample so that an assessment can be made tojudge whether the overall measurement precision is acceptable in comparison with therelevant fitness-for-purpose criteria.
5. AN OVERVIEW OF APPLICATIONS
It is not the intention of this section to undertake a comprehensive review ofapplications of the technique published to date but to give an indication of the categories ofmeasurement to which the technique is appropriate. A general overview is listed in Table 7.One of the more common applications is in environmental studies, particularly related to theremediation of contaminated land. It is appropriate, therefore, to examine the capabilities ofthe P-XRF technique in this area. These capabilities are influenced by two factors. One is thedetection limit performance of the P-XRF instrumentation; the other is the targetconcentrations of contaminants at which decisions on remediation must be made for therelevant category of land use. Corresponding data are listed in Table 8 in which a comparisonis made between the P-XRF detection limits and ICRCL action levels published by the UKGovernment Department of the Environment. To be generally applicable, P-XRF detectionlimits should be between 5 and 10 times lower than the action level and an evaluation of thesedata shows that this condition is easily satisfied for Pb and almost so for Zn. For the othertoxic elements, P-XRF does not have a sufficiently low detection limit to evaluatecontamination at the appropriate action level. However, the technique may provide valuabledata in assessing substantial levels of contamination of these other elements, particularly inthe location of'hot spots' that may provide information on the source of contamination.
77

TABLE 7 Representative applications of P-XRF
Remediation of contaminated landLand associated with abandoned lead mining activitiesContaminated soil painted with leaded paint from adjacent wooden buildingsSoil contaminated with arsenic around sheep dips
Analysis of paintIn-situ analysis to see if lead paint used (can detect layers beneath the surface)
Archaeological provenancingRoman granite columnsBritish stone axesCoinage metal
Analysis of museum samples and valuable artefacts(To research historic techniques and provide information for restoration)
Paintings / works of artMedieval illuminated manuscriptsBuilding stone
Industrial useRecover for recycling of precious metal catalystsOthers
Health and SafetyAnalysis of dust deposits to assess hazards in the work place.Workplace analysis of air filters
Geochemical exploration and miningField use in the exploration for ore bodiesLocating ore seams in working mines
Investigation of surface processesWeathering of building stone and geological samplesCorrosion products on metals (e.g., Cl on steel)
78

TABLE 8 P-XRF detection limits compared with ICRCL trigger levels for various toxic elements ofenvironmental interest.__________________________
Element P-XKF ICRLC action leveldetection limit (jig g"1)
g ' ' )
AsCdCr (total)CuHgNiPbZn
60108080Hg1163963
(i)10600--500-
--13070-300
(ii)401000-
-2000-
P-XRF detection limits: 200 s count timeICRCL data for As, Cr, Pb are trigger concentrations for:
(i) domestic gardens and allotments and(ii) parks, playing fields and open spaces.
ICRCL data for Cu, Ni and Zn are trigger concentrations for any use of land where plants are grown.
For the reasons outlined above, one of the principal environmental applications of theP-XRF technique is in the analysis of lead in contaminated land. To this extent, the use of P-XRF is compatible with draft EPA method 6200 for contaminants in soils. It is also relevantto note the detailed evaluation undertaken by Argyraki et al. [1] of the performance of P-XRFin the analysis of lead in soil at a medieval smelter site in comparison with conventionallaboratory analysis of samples collected from the site. P-XRF data was obtained by removingturf to a depth of about 30 mm with a spade and analysing directly the exposed soil.Laboratory results were obtained by using a screw auger to remove a 100 mm column of soilfrom the same sites. On returning to the lab, these soil samples were sieved, dried anddisaggregating with a pestle and mortar. Lead was then determined by ICP-AES using amixed acid (nitric and perchloric) leach. Providing the field analyses were corrected for themoisture content of the soil (noting the laboratory results were representative of a driedsample) and were further corrected for surface irregularity effects using the scatter rationcorrection described above, no significant bias was detected between the two sets of results.These results give confidence to the capabilities of P-XRF in contributing to lead/soilcontamination studies, provided account is taken of the sampling limitations summarisedabove.
ACKNOWLEDGEMENTS
The author is very grateful to a number of colleagues who have contributed to the P-XRF developments described in this work, including Olwen Williams-Thorpe, Peter Webb(The Open University), Mike Ramsey and Ariadni Argyraki (Imperial College) and RichardKilworth. The author is also very grateful to the International Atomic Energy Agency for theopportunity to visit Vienna and present this work at a recent IAEA workshop.
REFERENCES
[1] ARGYRAKI, A., RAMSEY, M.H. AND POTTS, P.J. (1997), Evaluation of portable X--ray fluorescence instrumentation for in situ measurements of lead on contaminated land.Analyst, 122, 743-749.
[2] POTTS P.J. (1987), A handbook of silicate rock analysis. Blackie (Glasgow), 622pp.
79

[3] POTTS P.J., WEBB, P.C., WILLIAMS-THORPE O. AND KILWORTH, R. (1995)Analysis of silicate rocks using field-portable X-ray fluorescence instrumentationincorporating a Mercury (II) iodide detector: A preliminary assessment of analyticalperformance. Analyst, 120, 1273-1278.
[4] POTTS P.J., WEBB, P.C. AND WILLIAMS-THORPE O. (1997a), Investigation of acorrection procedure for surface irregularity effects based on a scatter peak intensities inthe field analysis of geological and archaeological rock samples by portable X-rayfluorescence spectromerry. Journal of Analytical Atomic Spectrometry, 12. 769-776.
[5] POTTS P.J., WILLIAMS-THORPE O. AND WEBB, P.C. (1997b) The bulk analysis ofsilicate rocks by portable X-ray fluorescence: Effect of sample mineralogy in relation tothe size of the excited volume. Geostandards Newsletter: The Journal of Geostandardsand Geoanalysis, 21, 29-41.
80

ACCELERATOR-BASED ANALYTICAL TECHNIQUES USINGION AND PHOTON BEAMS — ENVIRONMENTAL ANDINDUSTRIAL APPLICATIONS
XA9953281K.G. MALMQVISTLund Institute of Technology,Lund University,Lund, Sweden
Abstract
An overview of different Ion Beam Analysis (IBA) techniques is given. Examples ofapplications of the PEXE techniques to varoious types of samples are presented.
1. INTRODUCTION
The use of particle or electron accelerators for analytical purposes has significantlydeveloped over the last decades. Compact, dedicated and commercially available electrostaticaccelerators have been installed in many laboratories all over the world, mainly intended foruse with nuclear analytical techniques. Several large electron accelerator facilities forproduction of synchrotron radiation have been established. This access to intense X-raysources in the keV region has lead to a rapid development in synchrotron radiation induced X-ray fluorescence techniques. The obvious disadvantage to require an accelerator facility isbalanced by the powerful analytical properties of these techniques. The applications arenumerous in many fields. Here we will concentrate on environmental and industrialapplications.
2. ION BEAM ANALYSIS
The term Ion Beam Analysis (IBA) denotes techniques based on use of MeV ions fromparticle accelerators to induce reactions suitable for elemental and structural characterisation(see Fig. 1). Some of the more important techniques will be presented briefly.
focusedbeam
gamma raybackscattered ion \
secondary electron
Auger electron1
ionoluminescence
excitationvolume
thick sample
FIG. 1: Processes in MeV ion-solid interaction
81

2.1 PARTICLE-INDUCED X-RAY EMISSION (PKE)
An impinging MeV ion has a high probability to eject an inner shell electron from itsorbit and the resulting vacancy is rapidly filled by an electron from one of the outer shells. Thetransition leads to a release of energy that is equal to the energy gap between the adjacentshells, and characteristic of the parent atom. Measurement of characteristic X-rays using ahigh-resolution energy-dispersive X-ray detector provides information on the elementalconstituents of the sample. The PEXE technique and its applications are comprehensivelycovered in a recent book [1].
PDGE is multielemental, sensitive (detection limits often at ppm level), quantitativelyaccurate (5-10%), and the PDCE energy spectrum is relatively easy to interpret With mostelements being associated with a characteristic peak (see fig. 2). The analytical properties alsoinclude rapidity, relatively smoothly varying sensitivity and near non-destructiveness.
1QO500 600
Channel Number
FIG. 2: X-ray spectrum from P1XE analysis of a sample of atmospheric aerosols.
2.2 RUTHERFORD BACKSCATTERING SPECTROMETRY (RBS)
The classical Rutherford scattering and other non-Rutherford modes of scattering areused both for mass normalisation and for measurements of depth distributions of elements.The RBS scattering probability can be calculated exactly and hence the accuracy is very high.
Rutherford Backscattering Spectrometry [2] is since many years a well-known techniquebased on the elastic scattering of incoming MeV ions by nuclei in the sample. The depth of thescattering nucleus in the sample can be determined from the energy loss suffered by thebackscattered ion as it passes into and out of the sample. In Fig. 3 an example of a RBSspectrum from analysis of a thin specimen is shown. Its ability of depth profiling is importantin many applications. For 2-3 MeV protons, penetration of the Coulomb barrier of many lightelements occur. Therefore, the Rutherford scattering formula can be severely effected by thepresence of nuclear resonances that are not described by simple classical theory. This problemis being addressed using the experimental determination of cross-sections for light elements atthe backward angle.
82

100
50
(a)
*, A
(c)
50
J(100 800 300 400
CHANNEL500
FIG. 3: Energy spectrum from RBS analysis of a thin sample of atmospheric aerosols
2.3 NUCLEAR REACTION ANALYSIS
The possibility of using nuclear reactions to determine light elements by specificnuclear reactions is quite common in addressing materials science problems. The relativelylow cross-sections for most nuclear reactions makes this technique most suitable fordetermination specific isotopes with enhanced resonant cross sections. In an enhancedversion, photon-tagged NRA [3] (pNRA), the background can be significantly suppressed bythe use of fast (ns) electronics coincidence measurements and hence it can be used also withlow ion beam currents. Some light elements, such as boron, fluorine, beryllium and sodium,can be determined using pNRA.
2.4 NUCLEAR MICROPROBE
Many applications require analytical procedures applicable to microscopic structures.The development of finely focussed ion beams to a microanalytical tool in the nuclearmicroprobe has extended the use of ion beam analysis in industrial and environmental studieseven more. The nuclear microprobe is an instrument combining PDCE, RBS, NRA withimaging methods such as scanning transmission ion microscopy (STIM), secondary electronimaging (SET) and ionoluminescence (IL). This instrument constitutes a powerful tool forcharacterisation of microscopic specimens (see Fig. 4)
2.5 SYNCHROTRON RADIATION INDUCED X-RAY FLUORESCENCE (SXRF)
X-ray fluorescence analysis (XRF) is a widely applied analytical technique that makesuse of X-rays, both as a means of excitation and as analytical signal and it will be covered indetail in other chapters. With the development of advanced light sources based on synchrotronradiation in the keV region the SXRF analytical technique has been developed. The much
83

StereozoomMicroscope
TransmissionMicroscope
SEM
RBS
CCM
NRA
<D STIM
o RFS
Micrometer stageGoniometer for CCM
FIG. 4: Schematic arrangement of a nuclear microprobe
higher X-ray intensity available and the polarised light produced together enhance theanalytical characteristics of SXRF. The advantages of X-ray spectrometry based on excitationby photons instead of charged particles is higher ionisation cross sections (see Fig. 5) and lessradiation-induced damage [4].
10000
1000
100
10
X, 20 keV
X, 60 keV
A t10 20 30 40 SO
Atomic Number60 70
FIG. 5: Comparison of cross-section for K X-ray production using different means of excitation.
The major disadvantage of using photons is that, in contrast to charged particles, electrics' ormagnetic fields cannot be used to focus to small beam dimensions. However, because of . -~wtechnological advancements in designing X-ray optics, for instance, glass capillary focusing
84

devices (see Fig. 6), intense photon beams of a few micrometers in diameter can be producedto irradiate a specific location on the sample surface [5], much similarly to the ion beam in thenuclear microprobe.
FIG. 6 Different geometries for designing capillary focusing devices using total reflection of X-rays.
When comparing the relative merits of a micro-SXRF facility and a nuclear microprobe itshould be noted that also the SXRF can be supplemented by alternative techniques providinginformation additional to elemental composition, by using the techniques EXAFS (extendedX-ray absorption fine structure) and XANES (X-ray absorption near edge structure) and, ifenough intensity is available, e.g. using a wiggler beam line, micro XRD (X-ray diffraction).The first two techniques are based on observed distortions due to chemical effects nearabsorption edges and the latter makes use diffraction patterns from interaction will crystallinematerial [6].
3. ENVIRONMENTAL APPLICATIONS
The energy-dispersive X-ray detection techniques, whether based on ions or photons,have been instrumental in many environmental studies in a variety of fields. Hear we will onlydiscuss the use of PDCE and SXRF.
3.1 AIR POLLUTION STUDIES
For broad-beam excitation both PEXE and SXRF has been used for trace elementanalysis of collected aerosol samples. The more wide-spread and easier access to PDCEfacilities has resulted in a more extensive use as routine analytical technique of large numberof samples . A good example of this is the network operated in the USA by the PEXE group atthe University of California, Davis [7]. Furthermore, the advantages of simultaneous use ofseveral IB A techniques have facilitated the acceptance of PEXE as a standard technique in thisfield. Specially designed aerosol collection apparatus (see Fig. 7) has enhanced the usefulnessof the analyses.
85

impact-ion for)filter strip
filter mouth pieceirapaction nozzle
aerosolpath
housing forelectronics, steppingmotor, flowaeter
etc
Fig 7 Specially designed equipment for unattended aerosol field sampling over extended periods producingsamples well suited for rapid PIXE analysis.
In order to improve the characterisation of the aerosol composition a combination of thermalanalysis and IBA has been developed into a technique called Ion Beam Thermography (IBT)(ref). By using simultaneous controlled heating and IBA analysis (see Fig. 8) of a sample IBToffers the capability of, in addition to elemental analysis, also produce chemical speciation,crucial to the basic understanding of atmospheric aerosols.
1STAerosolparticles
Alumbwumfoft
FIG. 8: a) Collection of aerosols on aluminium foils electrostaticallyb) Heating of specimen in low vacuum chamber during IBA
86

When using millimetre size photon or ion beams the aerosol composition is averaged of alarge number of particles. It is important also to study single aerosol particles in detail. Themost common and feasible way of doing this is to use an automatic electron microprobe thatby scanning and imaging identifies individual particles and analyses one after another.However, the limited sensitivity of this technique calls for the use of the more sensitive SXRFand PIXE techniques based on finely focused beams. An alternative, but less quantitativetechnique is the laser microprobe (LAMMA) [8]. In practise, micro-SXRF and micro-PDCEhas been used only for a limited number of samples but with good results [9].
3.2 PLANT STUDIES
Plants are interesting from many aspects of environmental monitoring in that theyoften selectively preconcentrate, for instance, heavy metals. By analysing the various parts ofthe plant conclusions can be drawn regarding the metal loading in the environment. Someplants also show hyperaccumulation of specific elements as demonstrated in a study wherespecific plant species were shown to accumulate nickel from serpentine soil [10].
Forest decline is a particularly serious environmental problem in central Europe.Acidification of forests is a major threat, not only to forestry, but to the ecological system as awhole. Microprobe analysis based on ion and photon beams has played an important role inseveral studies of effects on trees and plants. By following the changes in the trace elementcontent along a tree core it is expected that changes hi the environment can be followed. BothX-ray fluorescence and PIXE based on millimetre size beams have been applied to thisproblem. Valkovic' et al. [11] And Pernestahl et al. [12] used PIXE for this kind of analyses.
One common objection to use mm-size beams to probe change in trees is the difficultiesto interpret the results without a more detailed knowledge of elemental transport routes andmechanisms. This problem has been addressed in nuclear microprobe to investigate themicroscopic elemental distribution in wood and bark from a young tree [13]. The conclusionfrom this study was that interpretation of macroscopic tree core analyses must be exercisedwith great care.
Fine roots of trees and plants are very sensitive to changes in the soil chemistry. Adetailed understanding of how pH and metal availability affect the roots would helpsignificantly in understanding the problem of forest decline. Using a nuclear microprobeseveral studies of roots [14], have produced accurate quantitative maps of root cross sectionsshowing the distribution of aluminium and other elements.In a continuation of one of these studies, the results from high resolution analysis of rootsfrom onions cultivated in an Al-enriched growth medium indicate that aluminium is storedrather in the intra-cellular space than inside the cells. These findings, which seem to beconfirmed by independent studies using different analytical methods could be very importantfor future work in this field [15].
Other examples of studies include heavy metal uptake in lichens and bracken in order todetermine environmental parameter such as heavy metal load in soil in the vicinity ofdeposited sewage [16], [17]. Results from one of these studies indicate that a fungus from theroots of bracken from a polluted forest can concentrate specific heavy metals. No significantaccumulations of heavy metals were observed elsewhere in the root, either in the plant orother fungal tissue.
3.3 CALCIFIED TISSUES FOR ENVIRONMENTAL MONITORING
The special properties of biominerals to preserve incorporated trace elements overlong time spans can be used when monitoring heavy metal exposure. Environmental lead
87

exposure to young children has been monitored by PDCE analysis of teeth [18]. A mm sizebeam of protons was used for analysis of extracted healthy teeth grown in the first years afterbirth. It was possible to demonstrate that lead levels were significantly higher in teeth fromchildren living in urban compared to rural areas. By instead using a microprobe at jamresolution it would be possible to study the detailed distribution of elements in calcifiedmaterial in greater detail. Jones and co-workers used micro-SXRF to investigate leaddistributions in human tibia and deciduous teeth [19]. In Fig 9 results from a line scan across adeciduous tooth are presented as relative concentrations of several elements including lead. Inan early study Lindh et al. used a nuclear microprobe to investigate the lead distribution inosteons in femur sampled from exposed workers [20].
axSJ*.>- H^l
M(C- g'
wW
0 |
3000
S 500056 40COcc
I 2000
-DenTWE- -PULP- - DENTINE-
CALCIUM
•DEfflWE-
2OSTANCEfmmi
F/g. 9: SXRF analysis results from a line scan across the fresh surface of a cleeved deciduous tooth.The lateral resolution was 10 micrometers.
If these analytical techniques are applied to organisms that annually grow new material,there is a potential that the calcified material can be used as an environmental monitor withtime resolution. It has been shown possible to observe elemental variations in the shells ofbivalves. Several groups working with nuclear microprobes have performed studies to revealaspects of environmental chemical changes in shells. Examples are ontogenetic distribution ofelements in the shells of living oysters [21] and mussels [22] as a function of growing times indifferent environments. The pearl mussel Margaritifera margaritifera (L.) is a freshwaterbivalve. The shell grows in the warm period of the year and ceases during the winter. Theannual growth increments can be measured and nuclear microprobe analysis was performed asshown by Fig. 10 [23]. The thick black lines correspond to the line scans performed with thenuclear microprobe.The PEXE results were quantified using standard reference material of similar composition. InFig. 11 tht easure annual variation of the elements manganese and strontium in a mussel>hell is sh . Although the interpretation of such elemental variations is very difficult,
88

because of biovariablity and complex relations between environmental parameters andanalytical results, the micro-PDCE is a very promising tool in this field.
1958I /1970
1985
/1973
1987
Fig. 10: Mussel shells with indicated annual growth segments and traces ofline scans in the nuclear microprobe.
•woo
o
Detectionlimit Mn
IflB tssi «GJ
Fig. 11. Results from PIXE analysis in the study shown in Fig. 10.
4. INDUSTRIAL APPLICATIONS
Compared to the environmental field use of ion and photon beams from accelerators areclearly less common in industrial applications. The applications of the ion beam techniques onindustrially relevant problems are mainly in the field of materials science. Extensive routine
89

use of RBS in semiconductor industry is based on its capability of monitoring the compositionof thin layers (see Fig. 12) during material processing, e.g. epitaxy. Several nuclear reactionsoffer opportunities for studying single selected elements in various materials such as metals orpolymers.
50
to -35>~ 30
20oz
10
Energy (MeV)06 0.8 1.0 1.2 1.4 16 "i
1 1 1 i
Expenmenal data
W(pollution)
————|——————i————=~J——————i——————i——————I————200 300 400 500 600 700 800 900
Channel
FIG 12 An example of results from RBS analysis on multi-layer materials: Thin ZrO2 layer on top of silicon.
With a very wide interpretation the field of economical geology is a part of the industrialapplications and then broad beam PDCE analysis as well as nuclear microprobes and micro-SXRF have had extensive use. For prospecting of mineral ores one good example is thegeogas technique [24]. Thin polymer foils are buried into shallow ground and then exposed tominute amounts of material transported from great depth to the surface (see Fig. 13). Somesmall particles are collected on the foils and after several weeks the collectors are recovered.By analysing these foils using millimetre ion beam PDCE can reveal the composition of thematerial deposited. By general geophysical understanding and a complex interpretationprocesses it is possible to judge the mineral deposits in deep ground.
The fields of mineralogy and petrology are very important also for prospecting of ores.In the CSIRO laboratory in North Ryde, Australia, an ion beam analysis laboratory has beenrunning micro PDCE for more than a decade, primarily serving the mineral industry withanalyses for applied geology [25] At the ion beam laboratories in Heidelberg, Germany andGuelph, Canada, the PIXE programmes are also more or less dedicated to geology. Thestandard samples used for EMP analysis also lend themselves to micro PDCE analysis:approximately 30 um thick polished sections mounted on a glass backing. Since the ion beamin the NMP penetrates deeper than the EMP, the analytical properties will be somewhatdifferent. There is a potential risk of penetrating into an underlying region of completelydifferent composition, and hence, the results of the analysis of such standard samples have tobe evaluated with care. This disadvantage is even more pronounced for the SXRF analysis.However, this capability to see "below the surface" could also be used in investigatingunopened liquid inclusions, which cannot be analysed with the traditional EMP technique.
90

Foil
Protectingcups
Mineralization
FIG 13 Schematics ofgeogas mineral exploration Large arrays of collectors are formed in geologicallyinteresting areas Revealed mineralisation can be on several hundred meters of depth
The depth resolution available when combining micro PTXE with micro RBS makesinformation on the underlying structures obtainable. The distribution of elements in mineralgrains can be used to facilitate the understanding and modelling of the formation andtransformation of the mineral.
Ore genesis is one field in the earth sciences in which PDCE has been applied. It isespecially suited for the study of trace element partition between co-existing minerals, whichgives information about the chemical and physical conditions (e.g. temperature) during theore-forming processes. Diamond genesis can be studied through the analysis of small grains,which have been trapped during the growth of the diamond [26]. As these inclusions havebeen shielded from any outside influence they carry important information on the physical andchemical parameters of the environment during the formation of the diamonds.
A slightly different industrial application is the use of focused ion beams forcharacterisation of the fibrous structure of newsprint paper and to characterise the printingcharacteristics [27]. The energy-loss technique, STIM, has been used to characterise thefibrous structure for different pre-treatment of the paper and PDCE is used to performelemental analysis of the inks for printing.
91

5. CONCLUSION
The accelerator-based analytical techniques based on keV photons and MeV ions are in manyways complementary to each other and to many other analytical techniques used inenvironmental and industrial applications. Both SXRF and PIXE have the most analyticalpotential when used in their micro-analytical modes. With a careful selection of applicationstheir respective merits more than account for the need for access to accelerator facilities. Theion beam facilities are of about the same complexity and cost as many other advancedanalytical techniques and the more expensive and complex synchrotron radiation facilities areincreasing in number and becoming more user friendly actually allowing access to largenumber of simultaneous users. Hence, the future of both techniques seems bright.
REFERENCES
[I] Particle-Induced X-ray Emission Spectrometry (PIXE), eds. S.A.E. Johansson, J.L.Campbell and K.G. Malmqvist, J.W. Wiley & Sons, New York, Chemical Analysis, vol133, (1995).
[2] CHU W.K., MICOLET M.-A. AND MAYER J.W., Backscattering spectrometry,Academ. Press, N.Y., (1977).
[3] KRISTIANSSON P. AND MARTINSSON B.G., Photon-tagged nuclear reactionanalysis for trace element determination, Nucl. Instr. Meth. B132 (1997) 159.
[4] JANSSENS, L. VINCE, B. VEKEMAN, A. AERTS, F. ADAMS, K.W. JONES ANDA. KNOCHEL, Microchim. Acta (suppl.) 13 (1996) 87.
[5] JANSSEN, F. ADAMS, K.W. JONES, Anal. Chim. Acta 283 (1993) 98.[6] Jones in "Handbook of X-ray spectrometry - methods and techniques" eds. Van Grieken
and Markowicz, M. Dekker, N.Y. (1992) 411[7] CAHILL T., Nucl. Instr. Meth., B75 (1993) 217.[8] JAMBERS AND VAN GRIEKEN R., TRAC- trends in analytical chemistry 15 (3)
(1996)114.[9] ARTAXO, RABELLO M.L.C, WATT F., GRIME G. AND SWIETLICKI E., Nucl.
Instr. Meth .B75 (1993)521[10] MESJASZ-PRZYBYLOWICZ, W.J. PRZYBYLOWICZ, V.M. PROZESKY AND C.A.
PINEDA, Quantitative-micro PIXE comparison of elemental distribution in Nihyperaccumulating and non-accumulating genotypes of Senecio coronatus, Nucl. Instr.Meth. 8130(1997)368
[II] VALKOVIC V., RENDIC D., BIEGERT E.K. AND ANDRADE E., Environ. Int. 2(1979) 27.
[12] PERNESTAL K., JONSSON B., HALLGREN J-E. AND LI H-K., Int. J. PIXE 1 (1991)281.
[13] LOVESTAM, JOHANSSON E.-M., JOHANSSON S.A.E. AND PALLON J., Ambio,19(1990)87.
[14] HULT M., BENGTSSON B., LARSSON N.P-O. AND YANG C., Scanning Microsc.6/2(1992)581
[15] SCHOFIELD, PALLON J., FISKESJO G., AND MALMQVIST K.G., Planta (1998), inpress.
[16] WATKINSON S.C. AND WATT F., The Bryologist 95 (1992) 181.[17] WATT F., GRIME G.W., BROOK A.J., GADD G.M., PERRY C.C., PEARCE R.B.,
TURNAU K. AND WATKINSON S.C., Nucl. Instr. Meth. B54 (1991) 123.
92

[18] MOLLER B., CARLSSON L-E, JOHANSSON G.I., MALMQVIST K.G.,HAMMARSTROM L. AND BERLIN M., Scand. J. Work. Environ. Health 8 (1982)267.
[19] JONES, SCHIDLOVSKY G., SPANNE P., DEJUN X., BOCKMAN R.S.,RABINOWTZ M.B., HAMMOND P.B., BORNSCHEIN R.L., AND HOELTZEL D.A.,X-ray Microsocopy III, Springer-Verlag (1992)
[20] LINDH U., Anal. Chim. Acta, 150 (1983) 233.[21] CARRIKER, C.P. SWANN AND J.W. EWART, Marine Biology, 69 (1982) 235.[22] COOTE W.J. TROMPETTER, Nucl. Instr. Meth. B77 (1993) 501.[23] LINDH U., NYSTROM J. AND MUTVEI H., in: Environmental archives disclosed by
nuclear microscopy of mussel shells,, thesis, J. Nystrom, Acta Universitatis, Uppsala(1995).
[24] MALMQVIST L. AND KRISTIANSSON P., The geogas technique - an ideal industrialapplication of PIXE, Proc.8* PIXE Conf., Lund, June 1998, submitted
[25] RYAN C.G. AND GRIFFIN W.L., Nucl Instr Meth, B77 (1993) 381.[26] GRIFFIN L., RYAN C. G., COUSENS D. R., SIE S. H. AND SUTER G. F., Nucl. Instr.
Meth. 649(1990)318.[27] KRISTIANSSON P, MALMQVIST L., SJOLAND K.A. AND SUNNERBERG G., The
Lund nuclear microprobe in newsprint research, Nucl. Instr. Meth. B104 (1995) 584
93

PORTABLE GAMMA-RAY SPECTROMETERS AND XA9953282SPECTROMETRY SYSTEMS
P. SHEBELLEnvironmental Measurements Laboratory,New York, N.Y.,United States of America
Abstract
The current state-of-the-art in portable gamma-ray spectrometers and portablespectrometry systems is discussed. A comparison of detector performance and features ofcommercially available systems are summarised. Finally, several applications of portablesystems are described.
1. GENERAL
The basic components for any gamma-ray spectrometer system, portable or other wise,include a spectrometer, a spectroscopy amplifier, bias supply, data processing equipment,system power supply, and ancillary equipment: cables, tripods, shielding, etc. The issue ofportability is primarily one of size and weight. For gamma-ray spectrometers andspectrometers systems, it is also desirable to have low power detectors that operate at ambienttemperatures. Ultimately the issue of portability must be balanced by the requirements forsystem performance. Most gamma-ray detectors can be made small and compact, but theefficiency, dynamic range and energy resolution can vary significantly. The focus of thisreport will be to discuss readily available portable spectrometers and spectrometry systems inthe context of their portability and performance.
2. GAMMA-RAY SPECTROMETERS
Presently, two types of gamma-ray detectors are readily available and commonly usedin gamma-ray spectroscopy: semiconductor and scintillator. These two detector types offer avariety of possible detector choices. However, only three detectors are currently being usedwith portable gamma-ray spectrometry systems: high purity germanium (HPGe), thallium-activated sodium iodide (Nal(Tl)), and cadmium zinc telluride (CdogZn o ]Te or CZT)
2.1 PORTABLE HPGE DETECTORS
HPGe detectors are solid state devices that were developed in the mid 1970's. Thereare two basic types of HPGe detectors: normal and reverse electrode. They are morecommonly referred to as "p-type" and "n-type" respectively. The designation specificallyrefers to impurity concentration. The n-type or reversed electrode detector has a thin outercontact layer, which gives them good sensitivity to low energy photons. HPGe detectors arecharacterised by their efficiency relative to a 7.6 cm x 7.6 cm Nal(Tl) crystal for the 1332 keVphoton at a source-to-distance of 25 cm. Currently HPGe detectors range from 10 % to 170%relative efficiency. The small bandgap1 (0.7 eV) of germanium prohibit room temperatureoperation of HPGe
1 An energy region separating the conduction and valence band in insulators and semiconductors.
95

G e C ry s t a I
j———— 1
D e w a r I—T
Pream pl i f ie r
Fig 1 A schematic drawing of a portable HPGe detector indicating some key components
detectors. Leakage across the bandgap is sufficiently reduced by cooling the Ge crystal withliquid nitrogen (LN2). An HPGe detector is made portable by mounting the crystal andpreamp. assembly to a small dewar, typically 1.2, 3 or 5 1. capacity. Fig. 1 is drawing of aportable HPGe detector.Despite the small dewars, portable HPGe detector can be heavy andrather large. A moderately sized detector can be over 40 cm long and weigh as much as 10 kgswhen filled with LNi- For continuous or prolonged operations portable HPGe detectors need adaily3 supply of LN2. Moreover, a room temperature detector requires a 'cool-down' periodonce the dewar has been filled. For a moderately sized crystal (100-200 cm3), the cool-downperiod can range from 4-6 hrs. For larger detectors, the cool-down period can last 8 hrs. Thiscan be a inconvenience for some emergency response applications. HPGe detectors require abias voltage of 3000 to 5000 V. A complete spectrometry system using an HPGe detectorconsists of a preamplifier (usually incorporated as part of the detector), a shaping orspecrroscopy amplifier, a multichannel analyser (MCA), and a laptop computer. A blockdiagram of a typical HPGe spectrometer system is shown in Fig. 2. Despite their size and needfor LNa, portable HPGe detectors are preferred for many in situ applications because of theirbroad energy range, large active volume, and superior energy resolution.
Preamp "*" ADC Merror,
MCA
"A——
Bias SuppK Computer
Fig 2 A schematic diagram of a HPGe spectrometry system
2.2 Nal SPECTROMETERS
Advantages of a Nal scintillator include high luminescence, room temperatureoperation and the ability to be machined in a variety of size and shapes. Typically the sizesrange from 3 cm x 3 cm to 7.6 cm x 7.6 cm. Crystal sizes greater than 7.6 cm x 7.6 cm arereadily available but are not recommended for portable systems. The crystals (and PMTs) aresomewhat fragile and can be damaged by mechanical or thermal shock. Moreover, their
2 Other cooling options are available, but would not be considered portable.' Detectors mounted to 3 and 5 1. dewars that can last several days between refills.
96

luminescence varies with changes in ambient temperature. Compared to HPGe detectors,Nal(Tl) have poor energy resolution. The energy resolution for a Nal(Tl) is typically expressedas a percent of the gamma-ray energy, for HPGe detectors the energy resolution is about 2keV across the entire spectrum4. At 662 keV a Nal(Tl) detector will have an energy resolutionof about 8% to 10%. Most portable Nal spectrometers employ an 'inline' design whereby thecrystal and PMT are hermetically sealed in light-tight metallic cylinders. They usually requirea bias voltage of about 600-800 V. A block diagram of a typical Nal spectrometer system isshown in Fig. 3.
Fig. 3. A schematic drawing of portable NaI(TI) spectrometry system (left). A picture of a portablespectrometry system (right) (Courtesy ofAmplek. Inc.. Bedford, M4)
2.3 CZT SPECTROMETERS
With a bandgap of 1.5 eV, the semiconductor CZT can operate a room temperature.This means good resolution without LN2. Unfortunately, problems with crystalinhomogeneiry, excessive charge trapping, and mechanical cracking have hamperedfabrication of crystals with large active volumes. Currently the largest active volume availableis about 1 cm3; typical volumes for commercially available spectrometers are closer to 0.05cc. CZT detectors are recommended for moderate to low energy applications. Fig. 4 shows adiagram of a CZT detector. Table 1 summarises the properties of HPGe, Nal(Tl), and CZTspectrometers.
BeWindow
FET
BeO
DetectorTemperature
Monitor
CoolerMounting
Stud
Fig. 4. A schematic drawing of a CZT detector (Courtesy ofAmptek, -Inc., Bedford, MA).
4 Resolution for HPGe detectors is expressed in terms of full with at half-maximum (FWHM). The resolution fora 40% relative efficiency detector at 122 keV can be less than 1 keV, at 1.33 MeV the resolution can be less than2keV.
97

TABLE 1. Comparison of portable spectrometers
Detectors
TypeResolution
Energy Range (typ.)Size & Shape:Crystal
Size & Shape:Detector
Operating temp.Cost (USD) (est.)
High PurityGermanium (HPGe)
Solid state2-3 keV
40*keV-10MeVCoaxial and planar
(30 - 400 cc)
Cylindrical shape40-50 cm long
5-15 kg77 K
( 10- 100k)
Sodium IodideNal (Tl)
Scintillator8% @ 662 keV
5**keV-3MeVCylindrical (typ.)
3 cm x 3 cm,5 cm x5 cm,
7.6 cm x 7.6 cmCylindrical shape
20-40 cm long1-5 kg300 K10k
CdZnTe(CZT)
Solid state1.5keV@ 122
keV< 1 MeV
Rectangular(-0.05 cc)
Rectangular— 10 cm long
-1-2 kg300 K
5k"this refers to p-type detectors, n-type has good efficiency down to about 5 keV**for thin Nal crystals
Clarke and Williams [3] reported a more recent entry to field of portablespectrometers. They examine the performance of a CsI(Tl) scintillator (1.8 cm x 1.8 cm x4cm) with integral p-i-n diode (1.8 cm x 4cm). Advantages of this detector include roomtemperature operation and no bias supply. However, no commercial version of this portabledetector is readily available.
For a more complete discussion of the principles of gamma-ray detection and gamma-ray detectors we refer the reader to Debertin and Helmer [1] and Knoll [2].
3. PORTABLE SPECTROMETER SYSTEMS
3.1 INTEGRATED SYSTEMS
An integrated system is a complete, fully functional spectrometry system. While theyare intended for general purpose surveys, some systems have been optimised for very specificapplications such as the measurement of the isotopic composition of Pu or the enrichment ofU. Most systems utilise Nal scintillator with a multichannel analyser with a built-in display.Some are hand-held and all weigh just a few kilograms. A brief summary of availableintegrated systems can be found in Table 2.
3.2 MODULAR SYSTEMS
Modular Systems provide the flexibility to construct a portable, laboratory gradespectrometry system for field applications. The portability of the HPGe systems results fromsmall LNi dewars and compact, battery powered (MCAs). A configuration can be as simple asa HPGe detector, a set of cables and a portable MCA. A more typical configuration willconsist of a detector, cables, and portable MCA and a laptop computer. Fig. 5 is a blockdiagram of a typical modular system. Note that the bias supply and amplifier are physicallyhoused with MCA. A modular HPGe system can be quite heavy and rather cumbersome. Forexample a complete HPGe spectrometry system with a 40% relative efficiency detector
98

TABLE 2. A comparison of integrated spectrometry systems
Integrated
Systems
ScoutS 12(Quantrad)
PN-114(PrincetonElectron Systems)EasySpec(Canberra)
GDM 40 PRS(GammaData)
Gamma-X(Amptek)
"ROVER"(Amptek)GR-130(Exploranium)
Detector
Nal(Tl)(I"xl",2"x2",3"x3")
Nal(Ti)(I"xl"-3"x3") or CdZnTe (CZT)
Nal(Tl)(l"xl", 2"x2",3"x3")
Nal(Ti) 3"x3"
Nal(Tl)(30x30 mm up to 152 x76 cm)
CZT
Nal(Ti) 74 cc, 0-3000 keV or 0-ISOOkeV
ADC
80MhzWilkinsonIk resolution66MhzWilkinsonIk resolution80MhzWilkinson2 k resolutionMCA 8000A(SuccessiveApproximationFCT <5 us16k resolutionMCA 8000A
256 channelsresolution
Spectrumcapacity
251 spectraw/time anddateconfigurable2048 bytes
90 spectraw/time anddate1600 spectra(256 ch.@ 2bytes)
Up to 30000readings or200 full 256-channelspectra
Size & Weight
11. 5x5x1 9 cm0.82 w/o detector
28x28x8.9 cm6kg
19x10x5 cm1.3kg
46x34x15 cm12kg
17x7x2 cm
10x23x9 cm2.2kg
OperatingTime
12VLead acid2.5 hrs5 A-hlead acid7 hrsNiMH
8 hrs
16-24 hrs2 AA cells
+30 hrs2 D cells
Other
Has GPS capability
Needs computer
Needs computer
Hand-held surveyinstrument

mounted to a 1.2 1 dewar with a ruggedized MCA and a laptop computer weighs about 20 kg.A brief summary commercially available battery powered MCAs can be found in Table 3.
Fig. 5. A schematic drawing of a HPGe portable spectrometry
4. CURRENT APPLICATIONS OF PORTABLE SYSTEMS
Portable gamma-ray systems are primarily used for in situ measurements. Typicalapplications include cargo inspection, non-destructive testing, environmental, industrial,security, and surveillance applications.
4.1 ENVIRONMENTAL MEASUREMENTS AND DECOMMISSIONING OPERATION
In situ measurements are central to most environmental surveillance and sitedecommissioning operations. They usually involve measurements at a site for extendedperiods, often from a vehicle or other temporary shelters. They also involve low levelmeasurements for environmental surveillance, or relatively hot samples in the case ofdecommissioning operations.
4.2 IN-SITU SPECTROMETRY OF SOIL USING PORTABLE GAMMA-RAYSPECTROMETRY SYSTEMS.
The Environmental Measurements Laboratory (EML) has been using portable andtransportable spectrometry systems for nearly 30 years. The laboratory developed thetechnique of in situ gamma-ray spectrometry for a real-time assessment of gamma emittingradionuclides in surface soil. Currently, the method typically involves the use of a"downward-looking" uncollimated HPGe detector positioned 1 m above the ground. Theactivity per unit mass for a given radionuclide can be derived from the peak count rate usingparameters that describe the soil characteristics and the depth profile of the radionuclidedistribution. The in situ technique is well suited for quickly determining levels ofcontamination over large areas. A single uncollimated in situ gamma-ray measurementprovides a position-weighted average over the detector's field of view, which is typicallyseveral hundred square meters. A comprehensive discussion of the technique may be found inBeck et al. [4] and ICRU Report 53 [5].
For general environmental applications the specific activity for the source is usuallylow and the gamma-rays of interest can range from 63 keV to 2.6 MeV5. The spectrum is
5 The 63 keV photon is from Th234, a progeny of U238. The 2.6 Mev photon is Tl208, a progeny of Th2
100

TABLE 3. A comparison of portable MCAsPortable MCAs
MCA 8000A(Amptek)
M3CA(Aquila Tech.Group)Inspector(Canberra)
Nal Inspector(also CdTe)Vista (5002, 5004,5008, 5016)(Aptec)
OYDESSEY 6(Aptec)
NOMAD™Plus(EG&G)
Dart(EG&G)
Bias Supply
N/A
300-3500 V200-1200 V125 uA0-5000 V, 100uA0-1 300V500 uA0-1 300V500 uA0-5000 V0-200uA
0-5000 V@100uA0-2000 V@250 uA
0-5000 V@100uA0-2000 V@250 uA0-5000 V, 100uA0-1250 V750 uA
1Amplifier
N/A
Course Gain:1,2,4,8,16,32,642 selectable TCGain: x2 to x 1500STC I/ 4ns
Gain: x2 to x 1500STC 0.5 / 1 usNo informationavailable
Built-in highperformancespectroscopy amplifierforHPGeorNal(Tl)detectorsGain x4tox 1000STC 1 / 6us
Gain: x3 to x 1000STC 1 / 6 us
ADC
SuccessiveApproximationFCT <5 us16k resolution100 MHzWilkinson4k resolution100 MHzWilkinson8k resolution
100 MHzWilkinsonFixed Conversion800 ns to 5 usdepending onmodel 2k-16k res.Flash, 16k
SuccessiveApproximation16K resolutionFCT <5 usSuccessiveApproximation8K resolutionFCT <1 2 us
Size & Weight
17x7x2 cm0.3kg
10x22x9 cm
29x27x53.2kg
29x27x53.2kg35 x 25 x 6 cm5kg
Brief case size
46x33x1 5 cm8kg
9x14x30 cm2.3kg
OperatingTime16-24hrs
6 hrs
6 hrs
2 -4 hrs
6-8 hrs
6 - 7 hrs
Other
Needs computer,Does not provide biasvoltage or aspectroscopy amp
Optimized for Nal orCdTe scintillators4 model No. to choosefrom depending onperformancerequirementsIncludes computerW/ full I/OHoused in an ABSplastic alloy carryingcaseHoused in a Zero-Haliburton aluminumcase with removablelidDoes not require acomputer for datacollection

usually complex, the gamma emitting progeny of radium and thorium combine for 33individual lines having at least 1% intensity. It is recommended that for the analysis ofenvironmental spectra a HPGe detector be used with an ADC capable of least 4K resolution,with 8K preferred. While HPGe detectors are preferred for environmental applications, theyare not strictly necessary, especially if one is interested in Cs137 or Co60. In situ measurementsof the Mishelyak River were performed using an integrated system featuring a Nal detector(Wollenberg et al. [6], Drozhko et al. [7]). The count rate associated with most environmentalapplications is modest (< 0.5 kcps) and can be handled many, if not all, portable MCAs. Atypical set-up that EML uses for environmental work consists of a 40% relative efficiency p-type HPGe detector mounted to a 1.2 L dewar, and a battery powered MCA with an ADC with16k resolution. Data storage and data acquisition is accomplished with laptop computerrunning MCA emulation software. The limiting factor of this set-up is battery power. Thecomputers will last for 2 hours, while MCA is a little better lasting about 7 hrs.
4.3 NUCLEAR SAFEGUARDS
Nuclear safeguards applications prevent unauthorized proliferation of nuclear material.Regulatory Agencies routinely make in situ measurements during inspection trips at variousnuclear sites. Data collection times are often short, and sometimes must be conducted inhostile environments. A CZT detector can be useful for cargo inspections looking for enricheduranium and plutonium. Both U and Pu have low energy photons, the excellent resolution andcompact size of a CZT make it a sensible choice for such applications.
REFERENCES
[1] DEBERTIN, K. AND HELMER, R.G., Gamma- and X-Ray Spectroscopy withSemiconductor Detectors, North-Holland, 1988
[2] KNOLL, G. F. Radiation Detection and Measurements, 2nd Ed. Wiley, New York, 1989.[3] CLARK, X. X., WILLIAMS R. R., An in situ gamma ray spectrometer with CsI/p-I-n
detector, Rev. Sci. Instrum. 66 (3) (1995).[4] BECK, H.L., DECAMPO, J., AND GOGOLAK, C. In Situ Ge(Li) and Nal(Tl)
Gamma-Ray Spectrometry, Report HASL-258, U.S.D.O.E. Environmental MeasurementsLaboratory, NY (1972)
[5] International Commission on Radiation Units and Measurements, "Gamma-RaySpectrometry in the Environment", Technical Report ICRU 53, Bethesda, MD (1994).
[6] WOLLENBERG, H., TSANG, C.-F., FRANCOS, W., SOLBAU, R. D., LOWDER, W.M., STEVENSON, K. A., FOLEY, M. G., DRZHKO, E. G., ROMANOV, G..GLAGOLENKO, Y. U., POSOCHOV, Y. G., YVANOV, L., SAMSONOVA, L. M.,PETROV, A., TER-SAAKIAN, S.A., VASIL'KOVA, N. A., GLAGOLEV, A. V. JointRussian-American Field Test at the Chelyabinsk-65 (Mayak) Site: Test Description andPreliminary Results, Lawrence Berkeley Laboratory Report LBL-36825, (1995).
[7] DRZHKO, E. G., GLAGOLENKO, Y. U., MOKROV, Y. G., POSTOVALOVA, G. A.,SAMSONOVA, L. M., GLAGOLEV, A. V., TER-SAAKIAN, S.A., GLINSKY, M. L.,VASIL'KOVA, N. A., SKOKOV, A. V., WOLLENBERG, H. A., TSANG, C.-F.,FRANGOS, W., SOLBAU, R. D., STEVENSON, K. A., LOWDER, W. M., FOLEY, M.G., Joint Russian-American hydrogeological studies of the Karachai-Mishelyak system,South Urals, Russia, Environmental Geology 29, (1997)
102

PORTABLE GAMMA SPECTROMETERS FOR ENVIRONMENTALAND INDUSTRIAL APPLICATIONS AT THE INSTITUTE OFPREVENTIVE AND CLINICAL MEDICINE IN BRATISLAVA
XA9953283M. FULOPInstitute of Preventive and Clinical Medicine,Bratislava, Slovakia
Abstract
A survey of methods for in-situ measurements of gamma radioactivity in soil is done.Mathematical models for depth distribution of gamma radioactivity in soil are given.
1. INTRODUCTION
At IPCM there is a research centre for radiation protection, where methods for fieldgamma spectrometry are developed. Field gamma spectrometry is used for determination ofphoton energy spectra and for the rapid identification of radionuclides. When the sourceand/or shielding geometry is taken into account, the determination of radionuclide activity andexposure rate is performed. Applications have included:
- In situ measurement of gamma-ray emitting radionuclides in soil- Measurement of radionuclides in bulky samples
- Searching for lost, buried or shipped radionuclides
- Gamma-ray dosimetry based on field spectrometry
2. INSTRUMENTATION
Field gamma-ray measurements are performed using a conventional coaxial HPGedetector with a 12.5% relative efficiency (compared to a 3x3 inch NalfTl] full energy peak netarea at 1.33 MeV) and a resolution of 1.9 keV (FWHM @ 1.33 MeV). The useful energy ofthe detectors range from 40 keV to more than 10 MeV. hi order to allow operation of thedetector in any orientation without LN2 spillage, a multi-attitude cryostat has been used. Thecryostat is a Dewar with a capacity of 7.0 litres LN2 and a holding time of 5 days. This allowsthe Dewar to be operated in the horizontal position, pointing vertically upward or downward,without loss of LN2. Field measurements are made using a computer based spectroscopysystem. High voltage, preamplifier and spectroscopy system are supplied through a portablepower supply. The detector is supported by a tripod and the front of the detector is 1 m abovethe ground. The orientation of the detector is downward facing. A cylindrically-shapedcollimator was used to modify the angular distribution of photons impinging on the detectorsurface. The collimator is a lead cylinder with an outer/inner diameter of 19/10 cm and aheight of 10 cm. Detector calibrations field gamma-ray spectrometry have been performed bycalculations and by using point like gamma-ray sources.
103

3. ENVIRONMENTAL AND INDUSTRIAL APPLICATIONS
3.1 IN SITU MEASUREMENT OF GAMMA RADIONUCLIDE ACTIVITY IN SOIL
Soil contamination by gamma-ray emitting radionuclides can be measured in twoways:- soil sampling method (soil samples are measured in the laboratory)- in situ spectrometry of the ambient gamma-ray radiation.The conventional soil sampling method has two disadvantages:- the samples may not be representative for a large area- the determination of the depth distribution of a radionuclide requires measurement of
several samples taken at different depths.In situ measurement of radionuclide activity in soil are more sensitive and provide morerepresentative data than data obtained by soil sample collection and subsequent laboratoryanalysis. In emergency situations when the time to assess the contamination is critical, a directmeasurement of ambient gamma-ray radiation for rapid assessment of the deposited activity isused. In order to obtain accurate measurements of radionuclides in the soil, the Ge detectorshould be placed on relatively even and open terrain. Areas with large obstructions such asboulders or man made structures should be avoided. When working in wooded areas, thedetector should be positioned as far as possible away from tree trunks. When measuringfallout radionuclides, the terrain under study should be undisturbed since natural wind andwater erosion processes as well as any human activity, e.g. plowing would upset thedistribution of deposited radionuclides. Although these site criteria can be difficult to fulfillfor aged fallout, there is generally no problem for a fresh deposition event. For measurementsin most undisturbed terrain's, one generally can assume a uniform distribution with depth fornatural emitters and a negative exponential distribution with depth for fallout radionuclides. Apositive exponential distribution of radionuclide activity in profile of deposited soil can beused. It is a common practice to place the detector 1 m above the soil surface. At this height, atripod-mounted detector can be easily handled and still provide a radius of view for gammaemitting sources out to about 10m. The "field of view" actually varies, being somewhat largerfor sources at upper layers of soil. Depending upon source energy, the detector effectively seesdown to a depth of 15-30 cm. For most applications a more sensitive and representativemeasurement can be made by using a bare detector so that the full half-space is seen.
3.2 IN SITU SPECTROMETRY BY BECK
An excellent synthesis of the state of art of in situ measurements has been presented inthe ICRU report 53 [1]. The primary advantage of the in situ method by Beck [2] is the abilityto obtain information about the average activity of radionuclides in or on the soil.Furthermore, one can use this information about the radionuclide activity to determine theirindividual contribution to the ambient exposure. Beck's approach is characterised byexpressing the conversion factor (from peak count rate to radionuclide activity) in terms ofthree quantities:
N0
104

where:
Nf/No = angular correction factor of the detector for a radionuclide distribution in the soil
No/<D = peak count rate to flux density for parallel beam of photons that is incident-normal tothe detector face.
O/A = primary photon flux density arising at the detector to radionuclide activity (inventoryBq m"2, or concentration Bq kg"1) for a given radionuclide distribution in the soil.
and d>/A depend on the gamma-ray flux density reaching the detector, thereforethe accuracy of the technique is a function of numerous parameters affecting the flux density.Some of these parameters include spatial and depth distribution of the contaminant which canvary significantly with time. For example, in early stages of an accident situation, thecontamination is mainly on the surface. The gamma-ray fluence rate, in this situation, is verysensitive to variations in parameters such as roughness of the soil surface, vegetation, roadsetc.. Later, as the radionuclides migrate into the soil, the contribution to the total fluence rate,from large distances, decreases [3].
3.3 CALCULATIONS OF BECK'S COEFFICIENTS
Calculation of the constants Nf/No and O/A for a realistic model of in situmeasurement takes into account:- roughness of soil surface- aged fallout (not exponential radionuclide activity distribution in soil profile)- mixed ground levelThe calculations are based on analytical equations of photon attenuation in soil and in air,and/or by interpolation of Beck's conversion factors [2,4].
3.4 METHODS OF CALCULATING THE DEPTH DISTRIBUTION OF THERADIONUCLIDE CONCENTRATION IN SOIL.
The most important disadvantages of in situ spectrometry by Beck is that the accuracyof the analysis depends on separate knowledge of the radioactivity distribution as a function ofsoil depth. Several groups have been trying to obtain this information by calculation usingdata from in situ measurements. The calculations are based on the energy dependence ofgamma-ray attenuation in soil, scattering of photons in soil and track length distribution ofphotons in soil. This method of calculation can be applied independently for radionuclidesemitting gamma-rays with more than one energy. The ratio of fluence rates of unscatteredphotons of 137Cs whose decay product I37mBa emits photons with energies of 0.662 and 0.032MeV was used in post Chernobyl measurements [5]. The method is applicable a short timeafter the deposition of about 50 kBq m"2 137Cs. Several methods based on the ratio of theunscattered and scattered radiation in the whole energy region, total to peak ratio method [6],or forward scattered, peak to valley ratio method [7] exist. The peak to valley ratio is anattractive and quite sensitive method, when forward scattered photons of exactly determinedenergies are measured [8]. Photons with different track length distributions in soil can bemeasured by collimated and uncollimated detector. By restricting the solid angle, at which thedetector registers gamma-rays, the average depth where the detected rays were emitted ischanged [9].
105

3.5 IN SITU MEASUREMENTS BY UNFOLDING METHOD
The in situ measurements by the unfolding method utilises a combination of twomethods: the peak to valley method and the change of track length distribution of photons insoil, registered by collimated and uncollimated detector [8]. The detector response N(i) to thei:th characteristic of the gamma-ray field above ground, with a homogenous distribution ofradionuclides in the horizontal direction, is described by the integral equation:
i= 1,2,...,n (1)
where:-2C, (kg m") = depth in the soil in units mass-per-area,
a(i,Q (Bq'1 m"2) = the detector response in gamma-field of plane source of unitactivity per-area in soil,
A(Q d^ (Bq m"2) = activity of the plane source to be determined.
Quantities presented in terms of soil mass-per-area characterise the related field in airbetter than the linear depth of the source element in ground. The unknown activity A(z) as afunction of depth is obtained by unfolding equation (1). The method is based on the unfoldingof four various responses a(i,Q of in situ measurements at the same place. The measurementsconsist of collimated and uncollimated detector responses in full energy peak net areas of0.662 MeV primary and 0.62-0.655 MeV forward scattered photons. Fig. 1 shows the pulsehigh distribution in the energy interval 0.55-1.0 MeV measured by an uncollimated HPGedetector. The background continuum in the valley between the Compton edge and the 0.662MeV photo peak is compounded from contributions of photons from natural sources and 137Csscattered in the detector and in the detector housing material.
550 600 650 700 750 800 850E n e r g y ( k e V )
900 950 1000
Fig 1 P u l s e h e i g h t s p e c t r u m of H P G e de t ec to r
106

The contribution from natural sources to the background continuum in the energyregion from 0.62 to 0.655 MeV can be obtained by the ratio of integral counts in the channelscorresponding to the energy regions 0.62-0.655 keV and 0.670-0.705 keV. This ratio isconstant in field spectra, because the shapes of the HPGe continua are relatively constant.This is because Compton scattered gamma-rays from natural emitters in the soil dominate inHPGe spectrum and the spectrum is relatively invariant to the amount of U, Th and K in thesoil or to the size of the individual total absorption peaks in the continuum [2]. The detectorresponse a(i,Q to the i:th characteristic of the gamma-ray field with a flux <f>(i,<^,9,E) per-unit-activity of plane radionuclide at the depth £ in the soil can be described as follows:
o(i,0 = fc>(i£,9,E)R(i,9,E)d9dE (Bq"1 m"2) (2)
where R(i,9,E) is the detector response in peak of the total absorption of a parallel photonbeam of energy E at angle 9. eqn. (2) can be simplified by assuming that R(i,9,E) is constantin the energy range from 0.62 to 0.662 MeV:
9)d9 (3)
where O(i,<^,9) d9 is the photon flux at angle 9 integrated over the energy and R(i,9) is theangular dependence of the detector response for a parallel, 0.662 MeV, photon beam. Thephoton flux <J> has been calculated by using our Monte Carlo code SOILSC. A homogeneousand isotropic plane source of thickness 0.5 cm was simulated up to 85 g cm"2 of soil depths,starting with the plane source on the ground. The plane source radii were asumed to be 100 mto represent an infinite plane soil contamination with radionuclide 137Cs. Photon interactionprocesses of photoelectric absorption and Compton scattering [13] had been taken intoaccount by the Monte Carlo program. The calculation results for angular distribution ofphoton fluences O( 1,^,9) d9 100 cm above the soil with a density of 1 g cm"3 and a planeI37Cs source located at various depths are given in Table 1 (primary photons) and O(2,^,9) d9in Table 2 (scattered photons with energies in the interval 0.62 - 0.655 MeV). The incidentdirections of photons are expressed as cosines of a normal vector to the soil surface. The depthof the plane source is related to the centre of the source layer with a thickness of 0.5 cm.Responses of uncollimated and collimated detector to primary photons are given by theequations:
o(3,0=fe>(l£,9)R(2,9)d9
Where: R(l,9) and R(2,9) = angular dependence of response in peak of total absorption ofuncollimated and collimated detector to a parallel 0.662 MeV photon beam, respectively.Responses of uncollimated and collimated detector to 0.62 - 0.655 MeV photons consist oftwo components, photons that are scattered in soil and in detector housing material
o(2,Q = >(2£,9) R(l,9) d9 + 3>(1,C,9) R(3,9) d6
o(4,0 = Jb(2,^,9) R(2,9) d9 + fc>(l£,9) R(4,9) d6
Where: R(3,9) and R(4,9) = angular dependence of response in the energy interval 0.62-0.655MeV of an uncollimated and an collimated detector to a parallel 0.662 MeV photon beam,respectively. The angular responses R(i,9) of the detector have been measured by using a point
107
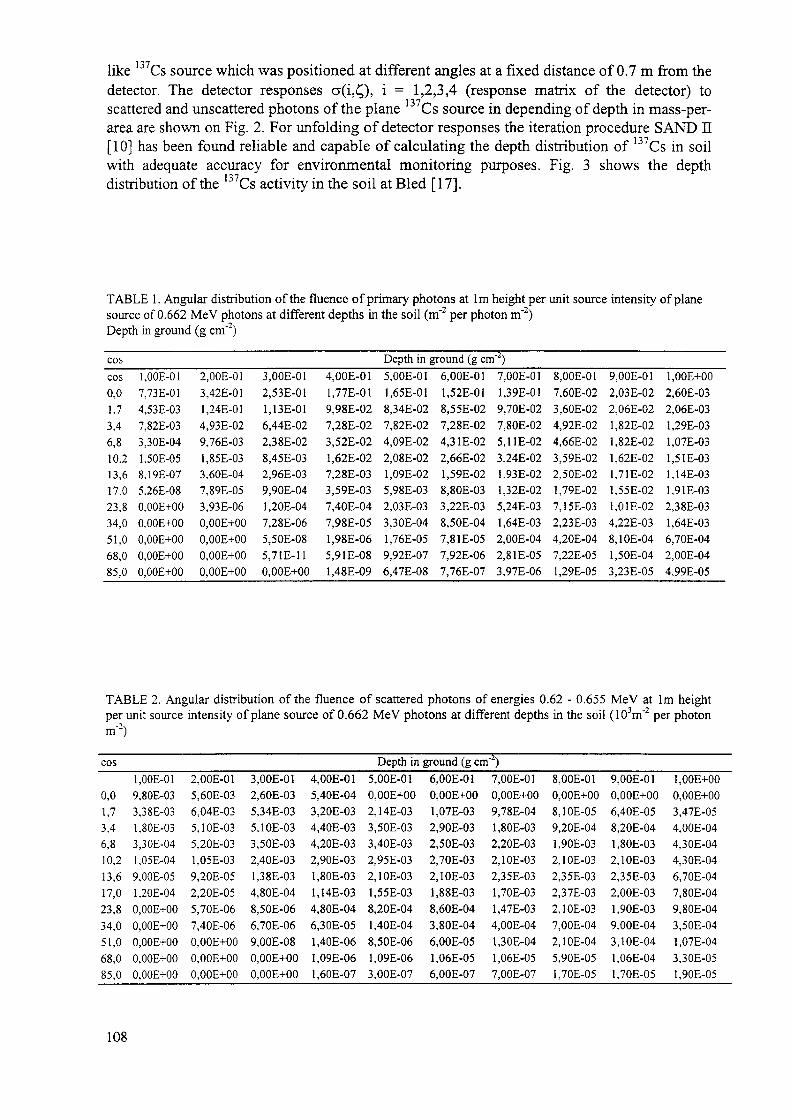
137like Cs source which was positioned at different angles at a fixed distance of 0.7 m from thedetector. The detector responses a(i,Q, i = 1,2,3,4 (response matrix of the detector) toscattered and unscattered photons of the plane 137Cs source in depending of depth in mass-per-area are shown on Fig. 2. For unfolding of detector responses the iteration procedure SAND II[10] has been found reliable and capable of calculating the depth distribution of Cs in soilwith adequate accuracy for environmental monitoring purposes. Fig. 3 shows the depth
137distribution of the u Cs activity in the soil at Bled [17].
TABLE 1. Angular distribution of the fluence of primary photons at 1m height per unit source intensity of planesource of 0.662 MeV photons at different depths in the soil (m"2 per photon m"2)Depth in ground (g cm"2)
cosCOS
0,01.73,46,810.213,617.023,834,051,068,085,0
Depth in ground (g cm )1, OOE-017,73E-014,53E-037,82E-033,30E-041.50E-058.19E-075.26E-080,OOE+00O.OOE+000,OOE+000,OOE+00O.OOE+00
2.00E-013,42E-011.24E-014,93E-029.76E-031.85E-033.60E-047,89E-053,93E-060,OOE+000,OOE+000,OOE+000,OOE+00
3,2,1,6,2,8,2,9,1,7,5,5,0,
OOE-0153E-0113E-0144E-0238E-0245E-0396E-0390E-0420E-0428E-0650E-0871E-11OOE+00
4,OOE-011.77E-019,98E-027,28E-023,52E-021.62E-027,28E-033.59E-037,40E-047,98E-051.98E-065,91E-081,48E-09
5,OOE-011.65E-018,34E-027,82E-024.09E-022,08E-021.09E-025,98E-032,03E-033,30E-041.76E-059,92E-076,47E-08
6,OOE-011.52E-018,55E-027,28E-024,3 IE-022,66E-021.59E-028,80E-033,22E-038,50E-047,8 IE-057.92E-067J6E-07
7,OOE-011.39E-019.70E-027,80E-025,1 IE-023,24E-021.93E-021.32E-025,24E-031.64E-032,OOE-042,8 IE-053,97E-06
8,OOE-017,60E-023,60E-024,92E-024,66E-023.59E-022,50E-021J9E-027,15E-032,23E-034,20E-047,22E-051.29E-05
9,OOE-012,03 E-022,06E-021.82E-021.82E-021.62E-021,7 IE-021.55E-021,0 IE-024,22E-038.10E-041,50E-043,23E-05
1, OOE+002,60E-032,06E-031,29E-031.07E-031,5 IE-031.14E-031.9 IE-032.38E-031.64E-036.70E-042,OOE-044.99E-05
TABLE 2. Angular distribution of the fluence of scattered photons of energies 0.62 - 0.655 MeV at 1m heightper unit source intensity of plane source of 0.662 MeV photons at different depths in the soil (103m"2 per photon
cos
0,01,73,46,810,213,617,023,834,051,068,085,0
1, OOE-019.80E-033,38E-031.80E-033,30E-041.05E-049.00E-051.20E-040,OOE-rOO0,OOE-000,OOE+000,OOE+000,OOE+00
2,OOE-015.60E-036,04E-035,10E-035,20E-031,05E-039,20E-052,20E-055,70E-067,40E-060,OOE+000,OOE+00O.OOE+00
3.00E-012,60E-035,34E-035.10E-033,50E-032.40E-03I.38E-034,80E-048,50E-066JOE-069,OOE-08O.OOE+000,OOE+00
4,OOE-015,40E-043,20E-034,40E-034,20E-032.90E-031.80E-031.14E-034,80E-046.30E-051.40E-061.09E-061.60E-07
5023322181813
Depth in,OOE-01,OOE+00,14E-03,50E-03,40E-03,95E-03,10E-03,55E-03,20E-04,40E-04,50E-06,09E-06,OOE-07
ground (g cm"2)6, OOE-010,OOE+001.07E-032,90E-032,50E-032.70E-032.10E-031.88E-038,60E-043,80E-046,OOE-051.06E-056,OOE-07
7,OOE-01O.OOE+009,78E-041,80E-032,20E-032,10E-032,35E-031.70E-031.47E-034,OOE-041.30E-041,06E-057,OOE-07
8,OOE-010,OOE+008,10E-059.20E-041.90E-032,10E-032,35E-032,37E-032,10E-037,OOE-042,10E-045.90E-051.70E-05
9,OOE-010,OOE+006,40E-058,20E-041,80E-032,10E-032,35E-032,OOE-031,90E-039,OOE-043,10E-041.06E-041,70E-05
1, OOE+000,OOE+003,47E-054,OOE-044,30E-044,30E-046JOE-047,80E-049,80E-043,50E-041,07E-043.30E-051.90E-05
108

s0.1
0.01-
0.001
IQ 0.0001
0 0000110 20 30 40 50 60 70 80
Depth (g cm'2)
Fig.2 Response matrix of HPGe detector
2 50E+ • •
200E+•2
1 50E+ • •
Activity (kBq m"2)
100E+
500E-
OOOE+00 09 1 7 34 51 68 10 13 17 20 23 27 30 34 42 51 59
Depth (g/cm 2)
Fig.3 Distribution of Cs in soil at the airport Bled
85
This was calculated by unfolding method. Fig. 4 shows the same as Fig. 3, but the depthdistribution in the soil was measured at Hinterrhein [18] Our experiences indicate that 137Csconcentration in soil 10 years after Chernobyl accident would be measurable using a middlesized HPGe detector (20-30% relative efficiency), and a counting time of the order of 1 hour.Even with smaller detectors (12-15% relative efficiency), Cs concentration of 5 kBq m are
11*7 1measurable and the depth distribution of Cs activities above 10 kBq m in the soil can beestimated by the presented method when a counting time of the order of 3 hours is used.
3.6 INHOMOGENEOUS DISTRIBUTION OF RADIONUCLIDES IN SOIL - HOTSPOTS
For site characterisation for environmental restoration, or in emergency removal actions it isnecessary to identify areas within a defined boundary that have levels of radionuclidecontamination greater than given limit. The method utilises a collimator for limiting the field
109

of view of a detector to measure a small section of ground, allowing for a more selectivesearching procedure of detecting a hotspot. Monitoring of an area with hotspots is timeconsuming and expensive, therefore a careful planning of the data collection should beundertaken in order to:- provide sufficient data to make the required decisions within a reasonable uncertainty- collect only minimum amount of necessary data.
a-ea
6.00E+00
5.00E+00 -
4.00E+00
3.00E+00 --
< 2.00E+00 --
1,OOE*00 --
O.OOE+00 -#——•——*——•——•——*——•-0.0 0.9 1.7 3.4 5,1 6.8 10.2 13,6 17.0 20,4 23,8 27,2 30,6 34,0 42.5 51.0 59.5 68.0 85.0
Depth (g/cm )
Fig.4. Distribution of 137Cs in soil at Hinterrhein
There are several steps in the planning procedure, to be considered, in order to obtainreasonable type, quantity and quality of data for environmental decision making [11]:State the problem:There are two approaches to this problem. One is hypothesis testing where decisions are madeby comparing an average radionuclide activity to a given limit. The second is to calculate theprobability of detecting a hotspot. The diameter of the smallest hotspot, which can be detectedby using an ionisation chamber or a sensitive survey ratemeter, should be estimated. The casestudy states that if a hotspot is found, a further study will have to take place in order todetermine the extent of contaminated area.Specify limits of the decision:Limits on the probability of finding a hotspot and the area to be covered should be stated.In situ spectrometry design alternatives:Development of general sampling and analysis design alternatives. For each designalternative, the mathematical expressions, needed for solving the design problem, should beformulated. For each design alternative, the optimal grid size for a given probability of findinga hotspot, or standard deviation of radionuclide activity in soil should be chosen. One can usetwo monitoring plans: simple monitoring (a grid for in situ measurements with a constantdensity of nodes) and sequential monitoring (with higher density of nodes at locality of ahotspot).
110

For a continuous distribution of activity ao of a radionuclide in soil. An equation forcalculation of the standard deviation of activity, determined by in situ measurements with acollimated detector, was derived [12]:
crstpK z A x 1 -
24 2R2
Where : R = distance from detector to soil surfaces = detection efficiency£ = detector collimation factor [12]p = soil densityt = time of measurementAx = grid density (density between two nodes)K2 = factor of radionuclide distribution in soil profile [12]
Kz
K,
= —(l-e~fA) = radioactive waste on landfill
= radioactive fallout
K, = = deposition of earth with a radionuclide
The standard deviation of activity depending on grid size (distance between nodes of the grid)and for various distances of the detector from the soil surface is shown in Fig. 5.
200
'o>
-O 100
i
o-
Distance between grid nodes (m)
Fig. 5. Standard deviation of activity of 1S7Cs in soil measured by collimated detectorat various distances from the soil surface
111

The activity a<, of 137Cs in soil was 500 Bq kg"1 and the solid angle of the detector withcolhmator (FWHM) was 90°. The standard deviation of activity depending on grid size(distance between nodes of the grid) and for various solid angles of the detector withcolhmator (FWHM) is shown on Fig 6. The distance from the detector to the soil surface was1 m
4. BULKY SAMPLES WITH RADIONUCLIDES.
- Industrial waste on landfill- Radioactive waste in containers- Indoor gamma spectrometryA combination of field gamma spectrometry and calculation of photon transport in samplematerial by analytical equations and/or by the Monte Carlo code MCNP (13) is used forestimation of radionuchde activity in the measured sample.
For cietecrtoirsola.cj angie I
1-2O grad 2-40 grad3-eO grad 4 — Q O gradS-1OO grad 6—120Detectotr to g rrouincL distance K—1m
Fig 6 Standard deviation ofactivity of
2 3 4Distance t>e1rtveeTi g^nwJ iicxies (in)
-s in soil moasiarcd by collimateci detector
5. SEARCHING FOR LOST, BURIED OR SHIPPED RADIONUCLIDE
- Identification of radionuchdes- Lost radionuchdes- Buried or shipped radionuchdes
Field gamma spectrometry is used for a rapid identification of radionuchdes and whenmeasurements are performed at various distances between source and detector, the sourceactivity can be deduced.
6. GAMMA DOSIMETRY BASED ON FIELD SPECTROMETRY
At present the most popular technique for evaluation of semiconductor gamma-rayspectra is the net area calculation of the total absorption peak hi dosimetry of gammaradiation, the peak net area method allows one to calculate dosimetnc values only forsufficiently discrete gamma spectra without consideration of contribution of scattered photonsto the total gamma dose The gamma dose due to scattered photons is often a great part of thetotal dose (14) Further, continues spectra are often typical cases in gamma-ray dosimetry dueto single and multiply scattering, in internal and external bremsstrahlung investigation etc
112

Therefore for determination of ambient dose it is necessary to know photon energy spectrumin locality of interest. There are two ways to estimate the photon energy spectrum:- The calculation of the angular distribution of the gamma-ray energy spectrum by
considering the source and shielding geometry [2, 14]. Only gamma dose fromradionuclide of interest is determined. For photon transport calculation we used theMCNP code.
- Calculation of the photon energy spectrum from measured detector pulse height spectrum[15, 16]. hi this case the total gamma dose from radionuclide and cosmic radiation isdetermined.
6.1 IN SITU SPECTROMETER AS A GAMMA DOSIMETER
The evaluation of the photon energy spectrum from detected pulse spectra can beperformed by unfolding the detector responses in channels of the multichannel analyser. Theresponse matrix was created by combining point source measurements with an estimation ofthe scaling and loading coefficients and by a confirmatory least squares technique of factoranalysis [15]. In Fig.7 the response matrix of our semiconductor detector to 0.040 - 1.8 MeVphotons is shown. The calculation of photon energy incident spectra was performed by aniteration procedure SANDII.
Channel (Me
Fig.7. Pulse spectra from the HPGe detector
102H
10
i-
10 -
-210 -
id3
AE=8keV
0 200 400 600 8OO 1000 12OO 1400Photon energy <keV)
Fig. 8. Pulse heigh spectrum of the HPGe detector
In order to demonstrate the application of the method, four gamma-ray sources 133Ba,137Cs, 60Co and 1S2Eu on the ground and at various distances from the detector were measured,hi Fig.8 the pulse height spectrum of the HPGe detector is shown. The value of kerma in air(or any other dosimetric parameter) can be obtained by an integration of multiplication ofphoton flux density and photon to kerma conversion factor over the photon energy.
113

7. CONCLUSION
Development of methods of field gamma-ray spectrometry at the Institute of Preventive andClinical Medicine has been stimulated during the last several years by our participation onRegular Workshops on Mobile Radiological Laboratories. Measurements on these RegularWorkshops have provided good occasions for verification and inter-comparison of methodsamong laboratories for field gamma-ray spectrometry in European countries. The RegularWorkshops on Mobile Radiological Laboratories are organised annually in different countries.For example in 1996 the Regular Workshop took places in Slovenia (16 Mobile Laboratoriesfrom 9 countries), in 1997 in Switzerland (17 labs from 8 countries) and in 1998 in SlovakRepublic (20 labs from 7 countries). The Regular Workshops on Mobile RadiologicalLaboratories became important action for laboratories for monitoring of radionuclides inenvironment. Also organisation of the Regular Workshops with so many participating mobilelaboratories is difficult and pretentious. Therefore organisations of the Regular Workshops onMobile Radiological Laboratories should be performed in co-operation with a supervisor andsponsor of an international authority such as IAEA.
REFERENCES
[I] International Commission on Radiation Units and Measurements: Gamma-RaySpectrometry in the Environment, Technical Report ICRU 53, Bethesda, MD (1994).
[2] H. L. BECK, J. DECAMPO AND C. GOGOLAK: In Situ Ge(Li) and Nal(Tl) Gamma-Ray Spectrometry, Report HASL-258, U.S.D.O.E. Environmental MeasurementsLaboratory, NY (1972)
[3] J.-P. LAEDERMAN, F. BYRDE AND C. MURITH: In-situ gamma-ray spectrometry:influence of topography on the accuracy of activity determination. Journal ofEnvironmental Radioactivity, 38 (1997) 1
[4] I.K. HELPER, K.M. MILLER: Calibration factors for the Ge detectors used for fieldspectrometry, Health Physics, 55 (1988) 1
[5] K. RYBAEEK, P. JACOB: In situ determination of deposited radionuclide activities:Improved method using derived depth distribution from the measured photon spectra,Health Physics 62 (1992) 6
[6] O. KARLBERG: In-situ gamma spectrometry of the Chernobyl fallout on urban and ruralsurfaces, Studsvik Nuclear, Report NP-89/108 (1990)
[7] P. ZOMBORI, A. ANDRASI, I. NEMETH: A new method for the determination ofradionuclide distribution by ib situ gamma-ray spectrometry, Budapest, KFKI-1992-20/K(1992)
[8] FULOP, P. RAGAN: In-situ spectrometry of 137Cs in soil by unfolding method, HealthPhysics, 72(1997)6
[9] KORUN, R. MARTINEIE: In-situ y-ray spectrometry, Acta Chimica Slovenica, 42(1995)3
[10JDIERCKX: Unfolding method in neutron spectra measurements by foil activationtechniques, Nucl. Instrum. and Meth., 105 (1972) 1
[II ] Data Quality Objectives, U. S. Department of Energy Office of EnvironmentalManagement (EM-76), Pacific Northwest National Laboratory, (1996)
[12JLIPKA, S. KRNAE: Standardisation of procedures for monitoring of radionuclides insoil, (in Slovak), HZ 86/10/94, FEI Slovak University of Technology, Bratislava (1994)
[13]F. BRIESMEISTER: MCNP-A general Monte Carlo code for neutron and photontransport, Version 4.2, Los Alamos, NM: Los Alamos National Laboratory; TechnicalReport LA-7396-M; (1990)
114

[14] SAITO, P. JACOB: Gamma-ray fields in the air due to sources in the ground, RadiationProtection Dosimetry, 58 (1995) 1
[15] KRNAC, P. RAGAN: HPGe spectrometer as a gamma-ray dosimeter in situ, RadiationProtection Dosimetry, 58 (1995) 3
[16]Kamboj, B Kahn: Evaluation of Monte Carlo simulation of photon counting forgermanium detectors, Health Physics, 70 (1996) 4
[17] 9th Regular Workshop on Mobile Radiological Laboratories, Ljubljana, Slovenija (1996)[18] 10th Regular Workshop on Mobile Radiological Laboratories, Gordola,
Switzerland, (1997)
115

SELECTED INDUSTRIAL AND ENVIRONMENTAL XA9953284APPLICATIONS OF NEUTRON ACTIVATION ANALYSIS
J. KUCERANuclear Physics Institute,Academy of Sciences of the Czech Republic,Rez, Czech Republic
Abstract
A review of the applications of Instrumental Neutron Activation Analysis (INAA) in theindustrial and environmental fields is given. Detection limits for different applications are alsogiven.
1. INTRODUCTION
In the last three decades, neutron activation analysis (NAA), namely its non-destructive mode (instrumental neutron activation analysis - INAA), has been found to be veryuseful for the determination of trace and minor elements in many industrial and especiallyenvironmental applications. This is due to advantageous features of the technique in bothmodes, i.e. INAA and radiochemical NAA - RNAA, which have recently been discussed indetail [1-3] and have also been mentioned in Ch. 4 of this document. Therefore, only twospecific advantages are mentioned here which concern an inherent potential for accuracy andthe completely independent principle compared to the other trace element analyticaltechniques. This makes NAA indispensable for quality control of chemical analysis, namelyfor the preparation of certified reference materials, i.e. for both homogeneity testing andcertification analyses. Besides chemical metrology itself, these advantageous features are alsovery important in industrial and environmental applications, because use of inaccurateanalysis results in any decision process would incur vast financial and other losses.
2. INDUSTRIAL APPLICATIONS
In industrial applications of NAA, the most appreciated advantages involve low up toextremely low detection limits of elements, and the nondestructive and multielementalcharacter of analysis. The matrices analysed mostly include high purity and high-techmaterials, plastics, often also geological materials, and in general, such materials that aredifficult to convert quantitatively into a solution for subsequent analysis by other analyticaltechniques. Numerous NAA procedures have been developed for process research, testing,process control, and product-quality improvement since the sixties [4-7].
In the last ten years, most frequent industrial applications or most frequently analyzedindustrial-related matrices in which predominantly trace and ultra-trace concentrations ofelements were determined by various NAA procedures involve: alloys, catalysts, ceramics andrefractory materials, coatings, electronic materials, detection of explosives, fissile and othersafeguard materials, fertilizers, graphite, high purity and high-tech materials, integrated circuitpacking materials, on-line, flow analysis, oil products and solvents, pharmaceutical products,plastics, process control applications, semiconductors, pure silicon and silicon processing,silicon dioxide and NAA irradiation vials, textile dyes, thin metal layers on various substrates,while in geology and geochemistry analysis of the following specimens was most frequentlyperformed by NAA: asbestos, borehole samples, bulk coals and coal products, coal and oil
117

shale components, crude oils, kerosene, petroleum, cosmochemical samples, cosmic dust,coral, diamonds, exploration and biogeochemistry, meteorites, ocean nodules, rocks,sediments, soils, glacial till, ores and separated minerals [8-12]. However, it should berealized that in the competition with other trace element analytical techniques, namely ICP-MS, only those applications have remained viable until now which have also economicadvantages of low cost and speed or where NAA has an indispensable position. Someexamples are given in this report.
2.1. INAA FOR SILICON INTEGRATED CIRCUIT TECHNOLOGY
Very pure silicon wafers are needed for fabrication of integrated circuits, becauseconcentrations of impurities in silicon are considered to be critical even at levels of 102 pg/g.However, during a large number of process steps, contamination may easily occur in thewafers and their top structure, often adversely affecting the properties of the product of aprocess step. A stringent control of contamination is therefore required throughout the entiremanufacturing process as exemplified by various producers, for instance, in the PhilipsResearch Laboratories, Eindhoven, The Netherlands. For this purpose, INAA proved to beextremely useful as demonstrated by contents of the impurities found and limits of detectionof other elements in a very pure silicon wafer given in Table 1.
TABLE 1. Content of the impurities found (bold values) and detection limits of other elements in a Si wafer (forexperimental details see [13])
Element,content, pg g"1
Na < 500K<150
Ca< 10000Sc < 0.03Ti < 3000
Cr<2Mn< 15000
Fe < 300Co < 0.5Ni<150Cu560Zn<15Ga<1.5
Ge<1000As 33
Element,content, pg g"1
Se<2Br2.4
Rb< 10Sr < 250Zr<150Mo<6
Ru<1.5Pd<60Ag<3Cd<15In<4
Sn < 200SblSOTe<4
I < 8000
Element,content, pg g"1
Cs < 0.5Ba<60
La < 0.15Ce < 0.9P r < 6
Nd<10Sm<0.03Eu < 0.07
Gd<6Tb<0.1Ho<3Er<40Tm<3Yb<2
Lu < 0.04
Element,content, pg g"1
Hf<0.3Ta<0.5
W25Re < 0.3Os<0.7Ir< 0.004
P t<4Aul.6
Hg < 0.6Tl < 3000Th < 0.2
U < 1
In this case, the matrix is very favourable since the half life of the induced radioisotope(3ISi) is only 2.6 hours, and induced radionuclides of the elements of interest (mostlytransition metals and Au which are highly undesirable in semiconductor silicon) are muchlonger-lived and therefore extremely low detection limits can be obtained.
Bulk analysis of the quartz used in the furnace for Si wafer processing is anotherexample where INAA is highly suitable, and is routinely done either by the chipmanufacturers or their quartz suppliers. Other materials that need bulk analysis insemiconductor industry include SiC (used in vertical furnaces), thin films of silicon dioxides,
118

Ti, TIN, W, etc., and also determination of U and Th as precursors of a-particle emitters invarious plastic packaging materials is highly required [3]. Besides NAA, other techniquesbased on neutron interactions with matter, such as neutron depth profiling (NDP) and promptgamma activation analysis (PGNAA), e.g. for depth profiling of boron in thin silicon oxidefilms prepared by chemical vapour deposition (CVD) and for measuring bulk hydrogencontent of thin films produced in CVD process, respectively, play also an important role in thesemiconductor industry [3].
2.2. APPLICATIONS OF INAA IN CHEMICAL INDUSTRY
Recently, numerous applications of INAA were reported from DSM Geleen, a Dutchcompany producing chemicals and materials [14]. Although INAA was introduced at DSMResearch primarily for the determination of trace elements in high-purity silica, nowadays theuse of this technique is much more diversified to meet special analytical requirements of thechemical plant.
One of many applications is panoramic analysis of liquid hydrocarbons (LHCs), theemphasis being placed on the determination of mercury and arsenic. LHCs, such as gas oil andnaphtha, are used in very large amounts in huge chemical plants. Since oil and natural gas,from which LHCs are derived, contain significant amounts of Hg and As as contaminants,both elements are contained in LHCs. These elements can cause extensive damage to processequipment, affect adversely the performance of catalysts and pose a potential hazard to plantworkers and to the public if released into the environment. INAA proved to especially usefulfor this purpose for the following reasons:• both elements and/or their compounds are volatile and can thus be lost during sample
preparation for other analytical techniques, while no special sample preparation is neededin INAA
• possible matrix variations can cause problems to other analytical techniques, but not toNAA
• more other analytical techniques would be needed to deliver full panoramic quantitativeinformation, resulting in much higher costs.
Another kind of samples for which INAA is especially suitable are Ziegler-Nattacatalysts, based on the elements Ti, Cl, Mg, Al and V. Determination of these elements isquite difficult to carry out by other analytical techniques, because very often the catalysts arepresent in a slurry of organic materials which is difficult to handle with other analyticaltechniques, and because the catalysts readily decompose upon contact with ambient air andmoisture, making sample preparation for other analytical techniques very difficult. A surveyof typical samples at DSM Research analyzed at DSM Research by INAA and elements beingdetermined is given in Table 2.
TABLE 2. Typical samples analyzed at DSM Research by INAA [14]
Sample type________Elements to be determined_______ConcentrationLiquid hydrocarbons panoramic analysis P-g/kg to mg/kg
Catalyst slurries Ti, Cl, Mg, Al, V mg/kg to %Catalytic systems Co, Pd, Mn, As, Rh, Fe, Ni P-g/kg to %
Plastics Cu, I, F mg/kg to %heavy metals (Cr, Cd, Hg, Ni, Zn, Cu, As) M-g/kg
_______________________Br, Sb________________%
119

Determination of halogens and other impurities, such as Mn and Sb in polymers alsoappears to be a very important application of NAA in chemical industry [3,14]. On the otherhand, fluorine compounds are added to some plastics to improve the behaviour of thepolymer during processing and determination of this element by INAA is one of the bestpossibilities.
NAA is also in demand in photographic industry [3]. A very important process of themanufacturing of the photographic films is the precise doping of the silver halide crystals withultra low level impurities, such as Ir, Rh and Au. Determination of these dopants was found tobe best performed by NAA with a pre-irradiation separation. Most photographic films arechemically mixed halides, e.g. AgBrCl, AgBrI, etc. The mole ratio of the halides determinesthe sensitivity of colour films. The halide ratio in these mixed halides can be readily andreliably measured by INAA using a 252Cf neutron source. Gelatine used as the emulsion inwhich Ag halides are dispersed is required to be of high purity. Presence of trace impuritiessuch as Hg and Se is highly inhibitive to the photoactive process and latent image formation.A nuclear reactor based NAA (as in most of the above applications) of the gelatine was foundto provide superior quality trace analytical data when compared with other techniques, such ashydride generation, and cold vapour atomic absorption spectrometry [3].
2.3. OTHER INDUSTRIAL APPLICATIONS
Determination of rare earth elements (REE), most of which can easily and reliably beperformed by INAA, in geological materials is frequently required. Ratios of individual REEor the pattern of their contents normalized to those of Cl chondrites are extremely usefulindicators in geochemistry of the origin and processes involved in the evolution of geologicalformations, structures, rocks, etc.
Related to NAA are analytical techniques used in the geochemistry and geophysics forwell logging, i.e. to measure properties of reservoirs of gas and oil from inside the well casing.In this type of well logging, a probe consisting of a pulsed source of fast neutrons and y-raydetectors, is pulled through the formations traversed by the borehole. As the logging probe ispulled slowly (e.g. at 2 m/s) along the borewell, the formations are irradiated and measured atthe interface. Spectra are collected during the source pulse (mixed energy neutron field) andafter the pulse (thermal neutron field). The data from the mixed energy neutron field isseparated into capture and inelastic scattering events. These resolved spectra are mapped toelemental constituents; of particular interest are inelastic scattering by carbon and oxygen (oiland water). More information about this technique and other applications of nucleartechniques in the exploitation of mineral resources can be found in proceedings of an IAEAspecialized symposium on these topics [15] and in proceedings of a topical meeting onIndustrial Radiation and Radioisotope Measurements and Applications [16].
Of the emerging techniques, analysis of large samples (kg-size) by NAA should bementioned. Most analytical techniques deal with portions in the order of uL to mL, and of mgto grams, whereas the amount of sampled material may easily be in the order of litres tokilograms, due to aspects of representativity and ease of operation. Thus it is usually necessaryto reduce the particle size and to homogenize the sample before the subsampling takes place;sometimes the material characteristics are such that homogenization to a representativesample of a few mg is almost impossible. Further, in all these sample preparation processes,contamination and/or element loss may occur, while care is needed to avoid segregation.Therefore, a facility has been developed at the Interfaculty Reactor Institute, Delft, TheNetherlands for INAA of kg-size samples. The maximum dimensions of the samples that canbe handled in the facilities for irradiation and counting are 1 m in length, 15 cm in diameter,and about 50 kg in mass [17]. Applications of large sample INAA should be sought for in the
120

first place with materials difficult to dissolve, which may be considered macroscopicallyhomogeneous but which are grossly too inhomogeneous for direct subsampling withoutextensive homogenization. Examples are materials from the waste recycling industries, e.g.plastics, shredded materials from electronic devices, domestic waste, waste from constructionsites, etc. Also, the geological market segment might be interested in large sample INAA,particularly for analysis of samples (rocks, drill-cores, as well as sediments) withinhomogeneously distributed depositions [17].
3. ENVIRONMENTAL APPLICATIONS
Applications of reactor-based NAA in environmental studies are by far more extensivecompared to industrial applications. It is therefore hardly possible to provide a comprehensiveand exhaustive review of such applications in this type of report. Therefore, the importance ofemploying NAA in environmental applications will be demonstrated mostly using examplesof air pollution monitoring and biological monitoring of environmental pollution.
3.1. AIR POLLUTION STUDIES
Large amounts of pollutants are yearly discharged into various compartments of theenvironment world-wide, although many countries have already establishing measurestowards decreasing pollution of the environment. Many pollutants enter primarily theatmosphere in the form of inorganic or organic gases and inorganic or organic particulates.The major sources of atmospheric pollution are generally recognized to be industry, powergeneration and home-heating, transport, and waste incineration. The material discharged intothe atmosphere is dispersed in aerosols, tiny liquid or solid particles. The processes involvedin the formation of the atmospheric aerosol are schematically depicted in Fig. 1 [18]. Thesolid component of this aerosol, which has diameters in the range from about 1 nm to ,,giant"particles of several hundred |im, is frequently referred to as airborne particles or air paniculatematter (APM). However, most of their mass is in the size range from about 0.1 um to 10 um.Depending on the particle size and the atmospheric conditions, APM resides in the air forvarious periods of time, typically from a few days to a few weeks, and can be transported bythe winds over distances of thousands of kilometres. Eventually, APM is removed byprecipitation in rainfall or by gravitational fallout. Therefore, there is a continual transfer ofcontaminants from the atmosphere into the hydrosphere or into the soil, so that the airprovides a route for the contamination of the rest of the biosphere.
Because of the variability in production and the relatively short lifetime, theconcentrations, size distributions and chemical composition of APM vary widely in time andspace. Although aerosols form only a small part of the total mass of the atmosphere (about 1part in 109), they play an important role in atmospheric chemistry, have effects on human andanimal health and welfare, and they influence climate [19]. The climatic effect of aerosols isin the direction of cooling (under most circumstances) and is of a magnitude comparable tothat of the greenhouse gas warming [20,21]. However, there is still a large uncertaintyassociated with the estimate of climate forcing which reflects the unsatisfactory knowledgeregarding the sources, distributions, and properties of atmospheric aerosols.
APM larger than 1 jam show a high sedimentation velocity and can moveindependently of the wind, while APM smaller than 1 um show a low sedimentation velocityand move with the wind. It is probable, therefore, that APM smaller than 1 um exert a stronginfluence on human health and the environment [22]. The potential negative effects ofaerosols on human health have been recognized many years ago. Recently, renewed interest inthe health risks of aerosols has been generated by the finding of a correlation between the
121

increased mortality and the concentration of airborne particles in metropolitan areas in theUnited States [23]. The US studies, together with similar research in the European Union,Brazil and elsewhere, consistently link higher levels of APM to increased risks of respiratory-,cardiovascular-, and cancer-related mortality, as well as pneumonia, lung functions loss,hospital admissions, asthma, and other respiratory problems. In most studies, the correlationsexamined were those between mortality and PM 10 particles (smaller than 10 pm equivalentaerodynamic diameter - HAD), but other studies indicated that the association with increasedmortality was even higher when PM 2.5 particles were examined instead of those with PM 10.This is probably due to the relationship between the diameter of the APM and its precipitationin the human lungs. The respiratory air passages begin at the nasal cavity, pass through thetrachea, bronchi and bronchioles, and end at the alveoli. The diameter of these passages andthe velocity of air flow through them also decrease in this order. Larger APM are thereforeunable to penetrate into the narrow branches of passages, but smaller particulates can easilyreach the alveoli (Cf. Fig. 2). Clearly, therefore, it is important to investigate the sizedistribution of APM in addition to simple quantitative observations on their total mass. Forthese purposes, various sampling techniques of APM exist which has already been reviewed[23,24]. Details of INAA methodology and a survey of reference materials available forquality assurance of air pollution studies have also been described [24].
3.1.1. Data reporting and treatment
Results for the element concentrations in APM are usually expressed in a mass of anelement per cubic meter of air, i.e. in ng m"3, pg m~3, etc. Therefore, it should be emphasisedthat at least the same attention should be given to the appropriateness and quality assurance ofsampling of APM, i.e. calibration and control of the air flow through a collection device,checking of tightness of the device to avoid possible leakages, etc., as to its analysis, becauseotherwise larger uncertainties of results may be expected due to the sampling process thanthose of analysis. In addition, the concentration of an element in APM can be calculated as amass fraction. However, in this case the exact mass of the material collected must be known.This means that proper weighing procedures must be followed [24].
A first exploratory step in the interpretation of the element concentrations determinedis to compare the level of pollution in the impact (polluted) and clean (background) regions,and to evaluate time trends, especially if sampling was performed in regular intervals for asufficient period of time. More broadly, this type of the data treatment concerns evaluation ofspatial and seasonal variability of elemental composition of APM.
A useful way of the data evaluation is the use of enrichment factor (EF) calculations.An EF is defined as the double ratio of the concentration of the element of interest, cx, inAPM to that of a reference element, cr, in APM divided by the ratio of the same elements in areference material (e.g. the earth crust, soil, seawater, etc.) according to the relation
£*EF = Cr' «rm (1)
cx
In general, for EF calculations in APM, aluminium or scandium is taken is taken as thereference element both in APM and the reference material for which the earth crust is mostfrequently employed. Evaluating of EF presumes that the atmosphere is always loaded with
122

APM originating both from the natural (soil erosion, sea aerosol) and anthropogenic (man-made) sources. An EF value close to one is indicative that the main source is of the crustaland/or marine origin, while values of EF exceeding ten (sometimes these values can reachseveral thousands) are indicative of significant anthropogenic contribution.
In order to develop rational and effective strategies for improving air quality, it isnecessary to have an understanding of the relationship between the pollutant sources and theirimpact at receptor sites. Qualitative information of this kind can be inferred from theincreased occurrence of specific elements which serve as markers for particular sourceemissions. Examples of marker elements are given in Table 3 [24]. More sophisticatedapproaches involve source or dispersion models which predict the concentration of pollutantsat a receptor site using diffusion models with emission inventories and meteorological data.The predicted element concentrations can then be compared with the measured ones.
________TABLE 3. Characterization of emission sources according to marker elements [24]___________Source_______________________Elements_____Coal-fired plants As, Se, SOil-fired plants V, Ni, rare earthsMotor vehicles Br, PbRefuse incineration Ag, Zn, Sb, Cd, Sn, PbLimestone/concrete Ca, MgSoil Al, Fe, Mn, Sc, Si, TiWood burning C (elemental and volatile), KRefineries Rare earthsSulphide smelters________________In, Cd, As, Se, S__________
There is a number of mutlivariate statistical techniques which can be used for thesepurposes. Receptor modelling infer source contributions at receptor sites using statisticalmodels with the data measured at the receptor site. Principal component analysis (PCA) isfrequently employed for identifying pollutant sources. PCA attempts to explain the variance ofa large set of intercorrelated variables (measured element concentrations in APM) with asmaller set of independent variables (the principal components). PCA is one of method ofqualitative and quantitative techniques for data analysis which are collectively termed factoranalysis. An introduction to data analysis of airborne particle composition has recently beenpublished within the framework of one the IAEA Research Co-ordinated Programmes in thisfield [25] and there are numerous literature sources on this topic, as well, for instance [26,27].Moreover new techniques are being developed, such as APCA, "Source profiles by uniqueratios technique" (SPUR), "Positive matrix factorization" (PFA) [28,29]. Chemical massbalance (CMB) methods are designed to apportion the APM mass of each samplequantitatively amongst a number of contributing sources. This is possible if each source ischaracterized by a specific chemical pattern (source profile) and as many variables areavailable as sources.
Studies of elemental composition of APM in remote (background) and impact regionsreveal the extent of environmental pollution due to various anthropogenic activities, timetrends, geographical variations of pollution, and how various pollution sources, e.g.combustion processes, industrial activities, transport, etc. contribute to the overall level ofpollution. However, in order to be able to control the level of pollutants and/or theirabatement, it is very important to study the elemental composition of APM in the place of itsorigin.
123

Since the combustion processes are the main sources of anthropogenic APM in manycountries, a study has recently been started in the author's laboratory on elementalcomposition of APM originating from the combustion of lignite using an experimentalfluidized bed combustor with the thermal output of 100 kW. The samples analyzed includedbottom ash, coarse fly ash collected by a hot cyclone (five fractions were obtained with theparticle size range of < 40 up to > 200 fim) and fine fly ash separated by a cascade impactorinto eleven fractions with the aerodynamic cut-off diameters from 0.016 to 14.3 um. UsingINAA (and PIXE for some elements), significant enrichment was found for many traceelements, including toxic ones, such as As, Cd, Ni and Pb, in the finest particles compared tobottom ash [30]. In the presence of additives, such as limestone and lime hydrate, the volumeconcentrations of most of these and also matrix elements in combustion aerosols decreased[31]. This is especially important for the abatement of the toxic elements in power plants,because namely the ultrafine particles easily penetrate through the common separationdevices. Thus, use of the INAA (and PIXE) data on elemental composition of combustionaerosols helped in explaining of the mechanism of the abatement of both trace and matrixelements on lignite combustion with the additives. It has been shown that both a reduction ofthe total mass of emitted particles and specific absorption of some elements, namely As, in theadditives employed were responsible for the abatement of the pollutants, and consequently fora reduction of the environmental pollution due to combustion of lignite [32].
3.2. BIOLOGICAL MONITORING OF ENVIRONMENTAL POLLUTION
Biomonitoring, i.e. the use of biological indicators to detect changes in the physicaland chemical properties of the abiotic environment, represents an interesting alternative todirect measurements of the physical and chemical properties of the environment. Biologicalindicators are those tissues, organisms or populations of which their occurrence, vitality andresponses change under the impact of environmental conditions [33]. Biomonitoring takes oneof two approaches: i) direct monitoring which is based on measuring the quantity of pollutantsin suitable organisms rather than in samples from the environment; ii) indirect monitoringwhich is based on interpreting of biological signals due to changes of the environment such asthe study of morphological, physiological and cytological responses of organisms, changes ofabundances of certain species, etc. Only the former approach is discussed in the present report.
Although data provided by physical and chemical monitoring are indispensable forevaluating the changes of the environment, application of an (ideal) biomonitor can showseveral advantages compared to the use of direct monitoring techniques:
• the concentration of pollutants in the monitor tissue or organism are often higher than inthe system to be monitored. This may facilitate accurate sampling and analysis, which arevery difficult at the low levels occurring in many compartments of the environment;
• sampling of the tissue or organism used as a biological monitor is in general easier thanmost direct sampling procedures and no long term use of expensive sampling equipment isrequired;
• the intricated equilibria existing in many parts of the environment can easily be distorted bysampling itself, which may lead to erroneous results. When using biological monitors, thisdistortion is minimized;
• most tissues and organisms reflect external conditions averaged over a certain time,depending on e.g. the biological half-life of a specific substance in that organism. This isimportant when monitoring levels may change rapidly in time;
124

• concentrations of pollutants in organisms may give insight into the bio-availability of thatpollutant. This information may be as relevant as the absolute concentration in a certainpart of the environment;
• biological monitors are already present in the environment and monitoring continuously.In direct biomonitoring of atmospheric element pollution, the relevant information is
deduced from concentrations of elements in the monitor tissues. They have to meet specificrequirements which have been described elsewhere [34].
Many human, animal and plant species can be used for air pollution monitoring,because they can meet most of the requirements. Human and animal species and/or tissuesusually reflect complex changes of the environment, i.e. air, water, soil pollution, and elementintake from their diet, so that their use for studying only air pollution may be rather difficult tointerpret. Nevertheless, some of them proved to be very useful, such as analysis of humanand/or animal hair and other ectoderm derivatives, for instance nails. Certain plant speciesappear to be especially suitable to indicate elemental air pollution and therefore their use asbiomonitors of air pollution is also briefly discussed.
3.2.1. Hair
The feasibility of human hair as a material easily accessible for non-invasive samplingin individuals or population groups, to demonstrate criminal, occupational or environmentalexposure to toxic elements has received a great deal of attention in the literature. Besidesmany papers scattered in various journals, two monographs, one chapter in anothermonograph, and two review articles have been published [35-39]. Hair analysis is alsofacilitated by the availability of the generally recognized washing procedure which has beensuggested in one of the IAEA Research Co-ordinated Programmes in the mid- seventies [40].It this is very important to use a standardized hair cleaning, because there is no single washingprocedure which would completely remove the external contamination without influencing theendogenous element contents. While a generally accepted washing procedure exists for hair(for monitoring of environmental pollution) and thus comparable data on elemental haircomposition are available from many countries, no such standardized washing is widely usedfor nail cleaning which can also be used for biological monitoring as another ectodermderivative.
Numerous examples of application of hair analysis for studying environmentalpollution can be found in the above (and other) literature sources. Therefore, the usefulness ofhair analysis for these purposes will only be shown in one example which demonstrates acorrelation between arsenic content in hair of children living in various distances from apollution source and the expected degree of arsenic contamination of the air (Cf. Fig. 3 [41]).Noteworthy, a similar correlation was obtained when urinary arsenic levels of children weredetermined (Cf. Fig. 4 [41]). This demonstrates that urine is also a very suitable indicator toassess environmental exposure, however, the arsenic (and many other elements) determinationin urine is much more difficult compared to hair, because RNAA is required for this purposeto eliminate high matrix activity.
Similarly to human hair, the hair of some rodents, such as the Common Hare (Lepuseuropaeus] and the Common Vole (Microtus arvalis) proved to be a very useful indicator ofenvironmental pollution. This can be supported by the finding that similar haematologicalchanges were found in hares as in children living in regions burdened with industrialemissions [42].
125

TABLE 4 Detection limits of 45 elements in selected environmental matrices by INAA*
Element
AgAlAsAuBaBrCaCdCeClCoCrCsCuDyEuFeGaHfHgI
InKLaLuMnMoNaNiNdRbSbScSeSmSrTaTbTiThUYb
WZn
Coal
mg/kg0520
0050001
2000510005
0 1550
001505
0051
0050015
300 5005005
200220
00312
0 121025
0030005
100130
0050053000030 10 103022
Coal fly ash
mg/kg1 535
02500110003500
41 53000 1350 15
0050041503
0 151
150051000072 55
2 54
40410
0 10010
400210002035000 10503
10510
Atmosphericparticulate
matter, ng m J
0045
00150005
30 1300 1
0 1515
0031
0031
0010005
100200100204
00310
00502505035
102 50205
00150003
0 10005
2001002
60015003005005003
1
Soil,sedimentmg/kg
0730
0450015004500
51
4000051 50 115
00500375100 1
120
0053000 15
18
2510605
7500750005
300350
0070 14000050 5031 515
Spruceneedlesmg/kg005
150050001
3004300030250
00102
0015040030005
100080015005
100220
001005
10 30 3101
05001
00010 15
00055
001005150
00150010030050050 5
*Experimental conditions Short- and long-time irradiation of 100-200 mg samples (except for APM which massamounts to 0 5- 1 mg) in a neutron fluence rate of 5 JO13 cm2 s 'for I mm and 10 h respectively, followed bygamma-ray spectrometric measurements using a HPGe detector (rel efficiency 21%) For other details see Ref[50]
126

3.2.2. Other biomonitorsRecently, a review has been published on using herbaceous plants, trees, bryophytes,
and lichens for biomonitoring of air pollution [34]. Of these recognized biomonitors,bryophytes, especially some moss species, lichens, needles of coniferous trees, and tree barkshowed many advantages which are important for their application in this field as can beinferred from frequency of their use in various national and international programmes.
Mosses have been very popular in both local and long-term, large-scale studies inNordic countries since seventies and use of these bioindicators have also been included in theConvention on Long-Range Transboundary Air Pollution [43,44]. In the Netherlands, nationaltrace-element air pollution monitoring survey using epiphytic lichens has been started in 1982and continues on international scale until now. These studies followed by a specificmultivariate statistical procedure known as "Target Transformation Factor Analysis" havesuccessfully been employed for apportionment of emission sources within and outside thecountry [45-47]. To obtain the relevant information of this kind, multielement analysis isrequired and INAA proved to be very effective tool for this purpose. Currently, theInternational Atomic Energy Agency is also conducting Co-ordinated Research Programme on"Applied Research on Plants as Biomonitors of Trace Atmospheric Pollution" using nuclearand related analytical techniques in which more than 10 countries participate.
On the other hand, it should be realized that without extensive calibration under allrelevant conditions, the use of even the most suitable biomonitors frequently yields onlyqualitative information on the atmospheric level of pollutants as a function of time or place[48].
There are many more biomonitors and other matrices suitable for the assessment of theenvironmental pollution. For instance, from nation-wide surveys of natural surface soils inNorway it has become evident that the long-range atmospheric transport of heavy metalsapparent in the moss survey is also reflected in the chemical composition of surface soil [43].A similar relationship as for the level of pollution of the atmosphere and that of surface soil isusually found between surface waters and sediments and/or water suspended matter.Stratigraphic distribution of elements and other biomarkers in undisturbed lake sediments mayeven be used to trace the history of atmospheric and water pollution several hundred yearsback [49]. While for water analysis other analytical techniques are predominantly used, suchas AAS, electrochemical methods, ICP-MS (because water is almost an ideal matrix for thesetechniques), for soil and sediment analysis INAA offers many advantages as it follows fromdetection limits for 45 elements in selected environmental matrices shown in Table 4.
REFERENCES
[1] A.R. BYRNE, FRESENIUS J. Anal. Chem., 345 (1993) 144-151.[2] A.R. BYRNE, J.KUCERA, Proc. Int. Symp. Harmonization of Health Related
Environmental Measurements Using Nuclear and Isotopic Techniques, Hyderabad, India,4-7 November 1966, IAEA Vienna 1997, pp. 223-238.
[3] IAEA TECDOC on Enhancement of Research Reactor Utilization for Neutron ActivationAnalysis, IAEA Vienna, to be published
[4] W.W. MEINKE, B.F. SCRIBNER (Eds.), Trace Characterization; Chemical andPhysical, NBS Monograph 100, U.S. Department of Commerce, U.S. GovernmentPrinting Office, Washington DC, 1966.
[5] R.F. BUNSAH (Ed.), Modern Analytical Techniques for Metals and Alloys, Part 2.,Interscience, New York 1970.
127

[6] M. ZIEF AND R. SPEIGHTS (Eds.), Ultrapurity: Methods and Techniques, MarcelDekker, New York, 1972.
[7] T. BRAUN AND E. BUJDOSO (Eds.), Proceedings, Int. Conf. on Modem Trends inActivation Analysis, Paris, 1972, Elsevier, Amsterdam, 1972.
[8] W.D. EHMAN, S.W. YATES, Anal. Chem., 58 (1986) 49R-65R.[9] W..D. EHMAN, S.W. YATES, Anal. Chem., 60 (1988) 42R-62R.[10] W.D. EHMAN, J.D. ROBERTSON, S.W. Yates, Anal. Chem., 62 (1990) 50R-70R.[11] W.D. EHMAN, J.D. ROBERTSON, S.W. YATES, Anal. Chem., 64 (1992) 1R-22R.[12] W.D. EHMAN, J.D. ROBERTSON, S.W. YATES, Anal. Chem., 66 (1994) 229R-251R.[13]M.L. VERHEIJKE, H.J.J. JASPERS, J.M.G. HANSSEN, M.J.J. THEUNISSEN, J.
Radioanal. Nucl. Chem., Articles, 113 (1987) 397-404.[14]D.A.W. BOSSUS, R. VAN SLUIJS, Proc. 13th Radiochemical Conference, Marianske
Lazne, Czech Republic, 19-24 April 1998, in press in Czech. J. Physics.[15] Nuclear Techniques in the Exploration and Exploitation of Energy and Mineral
Resources, Proc. IAEA Symp., Vienna, 5-8 June 1990, IAEA, Vienna, 1991.[16] Industrial Radiation and Radioisotope Measurements and Applications (IRRMA), 1996,
Proc. IRRMA Meeting, Appl. Rad. Isotopes, 48 (1997) 1273-1708.[17]R.M.W. OWERWATER, P. BODE, J.J.M. DE GOEIJ, ANAL. Chem., 68 (1996) 341-
348.[18] J. O. BUFFLE, H. P. VAN LEEUWEN (Eds.), Environmental Particles, Vol. 1., Lewis
Publishers Inc., Boca Raton, Chelsea, Michigan, USA.[19] R. J. CHARLSON, J. HEINTZENBERG (Eds.), Aerosol Forcing of Climate, John Wiley
& Sons, Chichester, 1994.[20] J. T. HOUGHTON et al. (Eds.), Climate Change 1994: Radiative Forcing of Climate and
an Evaluation of the 1992 Emission Scenario, Intergovernmental Panel on ClimateChanges (IPCC), Cambridge University Press, Cambridge, UK.
[21] S.E. SCHWARTZ, J. Aeosol Sci. 27 (1996) 359-382.[22] K. OIKAWA, Trace Analysis of Atmospheric Samples, A Halsted Press Book. Kodansha
Ltd., Tokyo, John Wiley & Sons, New York, London, Sydney, Toronto, 1977.[23] T. REICHHARDT, Environ. Sci. Technol., 29 (1995) 360A.[24] Sampling and Analytical Methodologies for Instrumental Neutron Activation Analysis of
Airborne Particulate Matter, Training Course Series No.4, IAEA, Vienna, 1992.[25] P. K. HOPKE, Applied Research on Air Pollution Using Nuclear-Related Analytical
Techniques, NAHRES-19, IAEA. Vienna, 1994, p. 215.[26] P. K. HOPKE, Receptor Modelling in Environmental Chemistry, J. Wiley & Sons Inc.,
New York, 1985.[27] H. MARTENS AND T. NAES, Multivariate Calibration, John Wiley & Sons, Chichester,
UK, 1989.[28] P. PAATERO, AND U. TAPPER, Chemom. Intell. Lab. Syst, 18 (1993) 183.[29] P. PAATERO, AND U. TAPPER, Environmetrics 5 (1994) 111.[30] J. SMOLIK et al., Environ. Sci. Technol., submitted (1998)[31] J. SMOLIK et al., J. Aerosol. Sci. 29, Suppl. 1, S451-S452 (1998).[32] J. KUCERA et al., Proc. Int. Conf. Nucl. Anal. Methods in the Life Sciences (NAMLS),
October 26-30, 1998, Beijing, China, p. 71, Biol. Trace El. Res., submitted (1998)[33] M. KOVACS, (Ed.), Biological Indicators in Environmental Protection, Akademiai
Kiado, Budapest 1992.[34] J. KUCERA, Applied Research on Air Pollution Using Nuclear-Related Analytical
Techniques, NAHRES-19, IAEA, Vienna, 1994, p. 265.[35] V. VALKOVIC, Trace Elements in Human Hair, Garland Publ. Inc., New York. 1977.
128

[36] S. A. KATZ, A. CHATT, Hair Analysis, Application in the Biomedical andEnvironmental Sciences, VCH Publishers, Inc., New York, Weinheim, 1988.
[37] T. SUZUKI, Hair and Nails: Advantages and pitfalls when used in biological monitoring,In: T. W. Clarkson, L. Friberg, G. F. Nordberg, P. R. Sater (Eds.), Biological Monitoringof Toxic Metals, Plenum Press, New York and London, 1988, pp. 623-640.
[38] K. BENCZE, FRESENIUS J. Anal. Chem., 337 (1990) 867.[39] K. BENCZE, FRESENIUS J. Anal. Chem., 338 (1990) 58.[40] YU. S. RJABUCHIN, Report IAEA/RL/50, IAEA, Vienna, 1978.[41] V. BENCKO, Toxicology, 101 (1995) 29.[42] J. KUCERA, Chemosphere, 34 (1997) 1975.[43] E. STEINNES, Proc. Int. Symp. Appl. of Isotopes and Radiation in Conservation of the
Environment, Karlsruhe, 9-13 March 1992, IAEA Vienna, 1992, IAEA-SM-325/174.p.387.
[44] Convention on Longe-Range Transboundary Air Pollution (LRTAP), Field and LRTAPlaboratory manual, National Board of Water and Environment, Environmental DataCentre, Helsinki, 1989.
[45] M.DE BRUIN, P. M. VAN WIJK, J. Radioanal. Nucl. Chem., 123 (1988) 227.[46] J. E. SLOOF, H. TH. WOLTERBEECK, Water, Air, and Soil Pollution 57-58 (1991)
785.[47] J. E. SLOOF, H. TH. WOLTERBEECK, Lichenologist 23 (1991) 139.[48] M. DE BRUIN, Applying biological monitors and neutron activation analysis in studies
of heavy-metal pollution, IAEA Bulletin 4/1990, 22.[49] J. VESELY et al., J. Paleolimnol, 8 (1993) 211.[50] J. KUCERA, L. SOUKAL, J. Radioanal. Nucl. Chem., Articles, 121 (1988) 245.
129

REACTOR NEUTRON ACTIVATION FOR MULTIELEMENTAL ANALYSIS
A.V.R. REDDYRadiochemistry Division,Bhabha Atomic Research Centre, XA9953285Trombay, Mumbai, India
Abstract
Neutron Activation Analysis using single comparator (Ko NAA method) has been used for obtainingmultielemental profiles in a variety of matrices related to environment. Gold was used as the comparator.Neutron flux was characterised by determining f, the epithermal to thermal neutron flux ratio and a, the deviationfrom ideal shape of the neutron spectrum. The f and a were determined in different irradiation positions inAPSARA reactor, PCF position in CIRUS reactor and tray rod position in Dhruva reactor using both cadmiumcut off and multi isotope detector methods. High resolution gamma ray spectrometry was used for radioactiveassay of the activation products. This technique is being used for multielement analysis in a variety of matriceslike lake sediments, sea nodules and crusts, minerals, leaves, cereals, pulses, leaves, water and soil.Elementalprofiles of the sediments corresponding to different depths from Nainital lake were determined and used tounderstand the history of natural absorption/desorption pattern of the previous 160 years. Ferromanganese crustsfrom different locations of Indian Ocean were analysed with a view to studying the distribution of some traceelements along with Fe and Mn. Variation of Mn/Fe ratio was used to identify the nature of the crusts ashydrogenous or hydrothermal. Fe-rich and Fe-depleted nodules from Indian Ocean were analysed to understandthe REE patterns and it is proposed that REE-Th associated minerals could be the potential Th contributors to thesea water and thus reached ferromanganese nodules. Dolomites (unaltered and altered), two types of serpentinesand intrusive rock dolerite from the asbestos mines of Cuddapah basin were analysed for major, minor and traceelements. The elemental concentrations are used for distinguishing and characterising these minerals. From ourinvestigations, it was concluded that both dolomite and dolerite contribute elements in the serpentinisationprocess. Chemical neutron activation analysis is applied to determine the concentration of REEs in quartzites andother minerals from the Cuddapah basin to understand the REE patterns and mineralogical processes. Acomprehensive programme of analysing air, water and soil samples around the mining area is under progress toobtain the correlations between the environmental load with toxic elements and possible health implications vis-a-vis human beings and plant materials. Elemental concentrations of a few varieties of cereals, pulses and leaveswere measured. The obtained values were utilised to examine the role of major and minor elements in terms ofdietary and curative value of these leaves, cereals and pulses. Trace elements in the leaves could be determinedmore reliably using radiochemical neutron activation by separating the bulk elements like Na, K and Br, withenhanced sensitivity. A programme to determine nutrient elements and their availability for the plants throughsoil and water, and nature of species present is initiated. In each set of the experiments, the precision andaccuracy were evaluated by determining the concentration of the elements in standard materials. In the studies ofminerals USGS standard reference materials AGV-1 and W-l, for nodules and crusts NOD-A-1, for sedimentsSOIL-7 and for leaves SRM-1571 were analysed along with the samples of interest. CNAA and RNAA wereapplied for trace element analysis of the SOIL-7 and SRM-1571.
1. INTRODUCTION
Environment concerns with water, air, land and their interrelationship viz. humanbeing, fauna and flora. Natural environmental changes may be invisible in a short span oftime, but are likely to appear over long periods of time. Rapid industrialisation, deforestationand use of fertilizers, pesticides etc. in modern agriculture, in addition to the urbanisation andvehicular emissions have resulted in serious environmental changes. This reflects in theimbalance of elemental concentrations. The impact of imbalance of elemental concentrationscould be understood in the context of health aspects by looking into trace/ toxic elementcontent in our environment. The effect of toxic elements on the environment depends not onlyon the total concentration but also on then" physico chemical state in which they exist. Theoverall problem of environmental protection is intrinsically linked to man's understanding andinteraction with natural biospheric processes. This needs information on the factors that affect
131

the stability of the biological systems and various ways the anthropogenic loads interact within these systems. To understand this environmental problem, the natural systems like land,water and air are to be studied. In view of this, it is essential to determine the concentration ofelements present in varied matrices like water, food, plant materials, minerals, soil, sediments,particulate matter and air and if possible the chemical states of these elements.
The elements are mainly grouped [1] based on their influence on the environment as(i) As, Be, Cl, Mn, Pb, Sb, Se, Tl and V which characterise the overall ecological situation,(ii) indicator elements that often introduce matter into ecologically important materials: Al,Ba, Fe, Zr, REEs and (iii) toxic elements: As, Cd, Cr, Hg, Ni, Pb and others. Since theseelements are present in trace to major concentrations in different environmentally importantmaterials, there is a need for multi-element analysis. Due to relative simplicity, inherentselectivity and sensitivity, Instrumental Neutron Activation Analysis (ENAA) occupies animportant position among the various analytical methods [2]. Advent of high resolution HPGebased gamma ray spectrometers and on line computer analysis techniques enhanced thesimultaneous multielement analysis capability in many cases with or without radiochemicalseparations [2]. Single comparator NAA known as KQ NAA [3-5] is now an established semi-absolute method with multielemental analytical capability. It has several advantages ascompared to the more frequently used comparative method.
In the present paper, principle of KQ NAA method, determination of a and f, results onthe elemental concentrations of standard reference materials, and analysis of sediments,nodules, minerals, plants, leaves, cereals and soil are described. Additionally application ofChemical Neutron Activation Analysis (CNAA) for REE determination in quartzite mineralsand Au and Pd determination in matrices containing uranium, copper or iron andRadiochemical Neutron Activation Analysis (RNAA) for the determination of trace elementsin leaves are described. Future out look and the thrust areas are also mentioned. Possibleapplication of other nuclear analytical techniques such as RBS, NRA, PDCE, XRF and PGNAare outlined.
2. EXPERIMENTAL
2.1 SAMPLING
2.1.1 Sediments from Nainital lake
The core samples were collected at different locations in the lake using gravity corer,its inner and outer diameters being 6.0 and 5.2 cm respectively. The length of the coreobtained varies from 45 to 51 cm with the help of adjustable piston rod within the siliconpacking. Obtained cores were extruded vertically and sliced at 2 cm intervals, were oven driedand homogenised. The textural composition of core samples were mainly clay and slits [6].
2.1.2 Ferromanganese Nodules and Crusts
The samples from different locations and water depth of the Indian Ocean, collectedduring the Scandi Surveyor and the 35th Sagar Kanya cruises, were obtained from NationalInstitute of Oceanography, Goa, India. The geographical locations and water depth of thesenodule samples are given in ref.[7] and that of crusts are given in ref.[8]. Samples wereground to uniform size and oven dried before using for analysis.
132

2.1.3 Serpentines and Quartzites
The altered and unaltered dolomites, dolerite and two serpentines were collected in theunderground asbestos mines making traverses across the formations around Brahmanapallevillage of Pullivendla Taluq, Cuddapah district, Andhra Pradesh, India. They were carefullycrushed to bring down to the size of 100 mesh (ASTM) sieve. The homogenised materialswere subjected to cone and quartering method to prepare the samples for the analysis. Thegeological set up of these mines are described in ref [9].
2.1.4 Leaves, Cereals, and pulses
The leaf samples (L1-L10) were collected in and surrounding areas of Tirupati,Andhra Pradesh, India. On an average 20-50 leaves from the very bottom to top part of theplant were collected giving equal weightage to the tender as well as old leaves. For seeing theeffect of soil and environment on the mineral content, Neem leaves were collected both fromTirupati (L10) and Anushaktinagar, Mumbai (LI 1), India. Leaf samples were washed withdeionised water and then with double distilled water. The samples were air dried in a cleandrying chamber and dried at 80°C over night in an oven. They were crushed to a homogeneousfine powder by pulverisation before sampling. The samples of cereals (C1-C5) and pulses (Pl-P7) were collected from different representative places of Tirupati. They were crushed to ahomogeneous fine powder by pulverisation and were dried overnight at 105° C. Samples areprepared from this powder [10].
2.1.5 Gold Standard
A known amount of gold foil (99.999% pure) was dissolved in aqua regia. It wasevaporated to dryness and was made up in 0.1M HNOs This solution was used as a standardgold solution.
2.2 IRRADIATION
Samples weighing about 25- 50 mg of each were sealed in polypropylene tubes (2mm ID).The sealed tubes containing samples along with gold (5-15^g) were doubly sealed inalkathene, placed in a standard bottle and irradiated in a suitable irradiation position ofAPSARA reactor, BARC, Trombay, Mumbai. The duration of irradiation was varied from 5minutes to 7 hours depending on the half life of the nuclide of interest. The neutron flux isaround ~1012 n.cm^.s"1. The sub-cadmium to epi-cadmium flux ratio (f) and the deviationfrom the ideal epithermal neutron flux distribution (a) which are important input parametersin KO NAA method, were determined experimentally for each position using cadmium ratiomethod and/or multi isotope detector method [11,12]. The values of f and a are given in refs.[11,5]. For the nuclides of short half lives eg.,28Al, 27Mg, the cooling period was minimumand it was about a few hours to days for long lived nuclides.
2.3 RADIOACTIVE ASSAY
After providing necessary cooling time, polypropylene tubes containing sample andcomparator were washed under running tap water, wiped and mounted on a standard perspexplate. Samples were assayed for gamma activity of the activation products using an 80 ccHPGe detector coupled to a PC based 4K channel analyser in an efficiency calibrated positionwith reproducible sample to detector geometry. The resolution of the detector was 2.1 keV at
133

1332 keV. Gamma ray standards, e.g., 152Eu, l25Sb, 134Cs and 133Ba were used for efficiencycalibration of the detector in a stable source to detector geometry [13]. Efficiency values wereperiodically checked using 152Eu standard sources. The sample to detector distance wasmaintained between 12 and 15 cm depending upon the level of activity to avoid pile-up andcoincidence effects. The activities of radionuclides were followed as a function of time toensure purity and identity.
2.4 CALCULATIONS
Peak areas corresponding to different gamma lines were obtained either by using theS AMPO programme in the case of complex gamma ray spectra or summing the counts underthe peak and subtracting the linear Compton background in relatively simple spectra. Thepeak area was converted to specific count rate (Asp) by the equation:
A s p = (CL/LT). [(PA A)/( l -e- t) . e l - e ) ] ( 1 )
where, t = time of irradiation, T= cooling time, CL = clock time, LT = live time, X=decayconstant of the radionuclide of interest, PA = peak area and w = weight of the element inmicrograms (nig).
The concentration of the ith element (Q) in ppm was calculated using the relation,
Q (ppm) = [ Ap, i / (Asp*. K^ai) ] (2)
where, AP: j = the specific count rate of the ith nuclide normalised per gram of the sample,Asp* = the specific count rate of the 198Au per mg of the comparator and the symbol * refers tothe parameters of the comparator. Kanai is the specific count rate ratio of the individualelement in the sample to comparator and is calculated using the following equation:
Kan^ = K o.exp [(f + Qo(a) / (f + Q0*(a))] B / 8* (3)
where, e = the detection efficiency of the detector for the gamma ray energy used, f = the sub-cadmium to epi-cadmium neutron flux ratio, a = the deviation from the ideal epithermalneutron flux distribution and Qo(cc) = the ratio of cross sections and is equal to Io(ct) / 0th ,where, Io(cx) = infinitely dilute resonance integral corrected for the non-ideal epithermalneutron flux distribution and ath = the thermal neutron cross section. Equation (3) is thesimplified form of Kanai as the contribution due to neutron self shielding is negligible. The selfshielding correction factor for thermal (Gth) and epithermal (Ge) are approximately equal to1, as the sample sizes chosen for irradiation were small Relevant nuclear data were takenfrom the compilations of Browne and Firestone [14] and from the IAEA compilations [15].
2.5 RESULTS AND DISCUSSIONS
2.5.1 KO values
KO is a ratio of four constants of corresponding to the element of interest and thecomparator and is given by eqn.(4)
KO = (6 ere, M* y ) / (6 *CTth* My*) (4)
134
where 9 is the isotopic abundance, o>th is the thermal neutron cross section, M is the atomicmass of the element and y is the emission probability of the gamma line used. We havemeasured KO factors for fifteen isotopes and obtained a good agreement between thecalculated and measured KO values. A library of KO values for 111 isotopes spanning fromfluorine to uranium was made by using the latest nuclear data [14,15] and are given in ref.[11]. The accuracy and consistency of the nuclear data play a significant role in thestandardisation of reactor neutron activation analysis. Out of the these nuclear constants, dataon cross sections and gamma ray emission probabilities are sometimes reported with largeuncertainties. Therefore, the accuracy and consistency with respect to the above mentionedconstants should be judged individually, consistency being the prime concern.
2.5.2 Determination of f and a
Sub-cadmium to epi-cadmium neutron flux ratio (f) was determined for all theirradiation positions of APS ARA reactor using cadmium cut off method where as for PCF atCirus and tray rod position at Dhruva reactor this ratio was determined by multi isotopemethod. Another important parameter a, the extent of deviation from ideal shape of neutronspectrum for each irradiation position was determined using multi isotope/element method.Details of measurements and calculations are given elsewhere [11].
2.5.3 Analysis of Standard Reference Materials
Since there is a large variation in the nature of the samples and the concentration of theelements present, it is essential to validate this analytical technique. In this context, a varietyof the standard reference materials were analysed. Some of the SRMs analysed by thistechnique are USGS standard reference materials AGV-1 and W-1, NOD-A-1, SOEL-7 andSUM-1571. A good agreement between the measured values and the reported data wasobtained. Percentage deviation of the measured and certified values are plotted in Fig. 1. Theover all accuracy is between 2 to 10%. In our studies, as a control of the method of analysis,an appropriate standard was analysed along with the samples in each set of experiments.
2.5.4 Sediments from Nainital lakes
The knowledge of sedimentation rates and the elemental concentration levels insediments from lakes and other water bodies might provide clues to unfold the chronology ofthe input of pollutants to the water bodies. Eight sets of sediments corresponding to depthsfrom 6 to 51cm were analysed. The IAEA lake sediment standard SL-3 was analysed as acontrol of the method. Using the experimentally determined sedimentation rate of 0.32 cm/y[6], sedimentation age was calculated for these eight samples and was found to be in the rangeof 19 to 160 years. The data from different sections of the sediment core are given in Table 1and represent the history of natural absorption/desorption pattern of the previous 160 years.The elemental concentration of As, Cr, Br, Zn and Cs are found to be more or less constantfrom bottom to top which could be taken as an indication that there is no anthropogenicpollution of trace elements to Lake Nainital. Samples from different locations of Lake Nainitalwere analysed and the data show similar trend of elemental concentrations as a function of thedepth. A positive correlation of Fe-REE-Th is observed. Thorium is thought to becoprecipitated with REEs as Th(OH)4 from water bodies and is absorbed in Fe phases The
135

condrite normalised REE [16] Ce shows negative anomaly and Eu shows moderate andnegative anomaly indicating a reduced atmosphere in the bottom sediments.
020
015-
010-
005-
000
'/o DEVIATION
-005-
-010-
-015-
-020-
aV
• •
* * * •A
A
• *
NaMgAI K CaSc Ti V CrMnFeCoAs LaCeNdSmEuYb
ELEMENTS
Fig 1 Comparison of measured and certified elementalconcentrations of some standard reference materials
2.5.5 Ferromanganese encrustations from Indian Ocean
Ferromanganese oxide encrustations are common depositional features on exposed rockoutcrops in the deep sea. They are mostly found on mid-oceanic ridges, seamounts and raisedareas of sea floors of world oceans and significantly differ in their composition andmineralogy [17]. Multielemental analysis together with a varying Mn/Fe ratio is relevant inunderstanding their distribution in Mn and Fe phases. Three ferromanganese crusts fromdifferent locations of the Indian Ocean and another crust from the Lau basin of the PacificOcean were analysed by KO NAA method for studying the influence of different oceanicconditions on the trace element distributions in ferromanganese crusts. The precision andaccuracy of the method were confirmed by measuring the elemental concentrations in a USGSnodule standard NOD A-l. The measured concentrations of elements ferromanganese oxideencrustations (Cl, C2, C3 and C4) are given in Table 2. Cobalt was found to be highlyenriched in the Afanasiy Nikitm seamount crust. The hydrothermal oxide deposit from MidIndian Ocean Ridge (MIOR) exhibits a negative Ce anomaly and is associated with a lowconcentration of trace elements, whereas hydrogenous crusts are enriched in most elementsand exhibit a positive Ce anomaly. The crust from north Rodriguez Triple Junction of theMIOR was characterised as of mixed hydrothermal and hydrogenous type, while the crustsfrom the Afanasiy Nikitin seamount and a topographically elevated region exhibithydrogenous properties. The rare earth elements were found to be highly enriched in the crustof the Afanasiy Nikitin seamont and elevated region compared to the crust from MIOR. Thethorium content was remarkably high for hydrogenous crusts. A Co-Sb correlation wasobserved particularly in seamount crust.
136

TABLE 1. Elemental concentrations of Sediment samples (in ppm unless % is indicated). N. D. = not detected
ElementDepth(cm)Na%
K%
Sc
Cr
Mn%
Fe%
Co
Zn
Ga
As
Br
Rb
Sr
Cs
Ba
La
Ce
Nd
Sm
Eu
Dy
Yb
Lu
Hf
Th
SI510.54+0.013.22±0.1514.60±0.45113.82
±4.500.1 72+0.015.23±
0.1832.2711.81N. D.
8.96±0.5220.39±
0.850.85±.02115.38±6.50N.D.
21.34+1.52645.23+15.2042.16+
2.4450.32±3.2125.97±1.516.19±
0.181.09±
0.083.79±0.204.12+0.210.61±0.04
N.D.
12.31±1.01
S2450.42+0.022.28±0.1212.07±0.5590.58±
3.600.128+0.014.18±0.2720.60+1.0175.23±
4.0313.52+0.8219.91±
1.31N.D.
100.23±5.40496.10
+22.0012.44±
0.82881.00
±30.1029.31±1.1433.98±2.1014.97+1.055.03+0.321.12±
0.081.76±0.126.45±0.410.96±0.041.83+
0.0713.04±1.10
S3390.48+0.022.45±0.1812.70±0.8191.90±
4.200.126±0.014.01±
0.2121.65±1.20110.90±5.10N.D.
13.50±0.801.13+0.06128.20
+7.10350.20±15.2114.28±
0.83794.00
±18.0031.40±1.3044.15+2.7020.2 1±1.145.63+
0.411.001
0.073.65±0.172.63±0.140.95±0.051.97+
0.1011.2710.91
S4330.40±0.022.42+0.0211.3210.6291.601
5.070.11710.014.141
0.0920.001
0.54105.32+4.3118.6411.0110.771
0.251.001.03
N.D.
190.00114.2114.141
0.94798.00
+45.1232.04±
2.1042.04±2.1117.9111.155.711
0.120.97±
0.063.30±0.183.28+0.151.0810.062.8810.1113.8111.00
S5270.4910.022.7410.0614.8510.7296.001
4.170.14210.015.0010.0.0922.2811.12126.9314.17N.D.
17.46+1.071.4010.06136.64
15.39232.10116.2014.731
0.62752.10
+32.0037.06+1.9647.4211.43N.D.
7.2610.221.151
0.044.1010.213.8710.250.8910.052.351
0.0711.2810.85
S6190.4410.032.4410.0213.8310.71103.49
15.020.11910.014.2210.1320.4510.4297.381
5.729.391
0.7317.10
11.101.3810.06110.6914.13332.05+17.0011.0510.52780.00125.1033.171
2.0143.7012.1319.6411.185.861
0.140.891
0.053.7010.182.5810.161.0410.062.461
0.1413.5711.02
S7120.4610.032.3910.1212.3810.52104.23
14.110.12910.014.1110.2421.76+0.90111.4516.3210.5210.8516.511
1.051.3010.10
N.D.
375.10120.1014.05+0.43821.00130.1033.1311.4835.0012.2118.4711.236.461
0.710.961
0.044.3010.242.2110.13N.D.
2.5110.0811.4811.03
S860.42±0.022.30±0.1112.1310.9085.831
3.120.13610.013.881
0.0723.8611.0166.071
2.729.8410.7218.171
1.241.8510.11100.74
13.52532.00
110.2313.8510.61838.00
135.5032.551
2.0341.60+2.7011.5611.125.6110.260.961
0.074.2110.232.2410.120.7210.052.85+0.1713.8811.12
137

TABLE 2. Elemental Concentrations of ferromanganese Oxide Encrustations (in mg.kg"1 unless % is indicated).
ElementNa%
KScCr
Mn%Fe%CoAsSbCsHfWThLaCeNdSmEuTbHoYbLu
Ce*Mn/Fe
Cl1.12 ±0.075798 ± 2469.83 ±0.41
N.D.16.5 ±0.919.2 ±0.9
12300 ±396121 ±9
80.4 ±3.1301±26N.D.
101.4 ±6.581.2 ±5.4
239.4 ±11. 22037 ±106184.3 ±9.737.6 ±2.28.21 ±0.483.2 ±0.33
2.78 ± 0.3416.85 ±0.892.68 ±0.14
+0.610.86
C20.80±0.043814±15110.76±0.38
51.70+21.2+1.416. 9 ±0.72331+98163.5+1216.2+0.7851 ±64
4.64±0.3482.7±3.6114.2±8.3
286.0 ±12.21530±78
222.5±13.248.5±2.5
12.20±0.683.83±0.333.46±0.39
21.85+1.133.43±0.22
+0.4071.25
C32.79 ±0.132316+1177.11 ±0.2870.6 ± 6.412.1+0.721.9±0.8879 ±39247 + 1412.2 ±0.6
136±97.67 ±0.5312.2 ±0.53.7 + 0.2
20 1.4 ±8.2169 ±9
125.3 ±7.138.2 ±2.3
11. 32 ±0.632.62 + 0.33
N.D.13.94 ±0.832.24 ± 0.09
-0.370.55
C41.51+0.091280±76
16.69±0.78N.D.N.D.
37.2+1.474+5
449+228.73+0.4
83±9N.D.N.D.N.D.
14.7+0.911.12+0.6
N.D.N.D.N.D.N.D.N.D.
1.51 ±0.08N.D.
--
N. D. - not detected, Ce* = Cerium anomaly calculated as log[3Ce/(2La+Nd)J as given in ref.[16]
2.5.6 Ferromanganese Nodules from Indian Ocean
The ferromanganese nodules are mostly found at the interface of Ocean waters and theunderlying sediment on the ocean bed and are associated with minor and trace constituents ofalkali, alkaline earth metals, transition metals, REEs and other heavy elements.Characterisation of nodules might provide information on physical, chemical and biologicalactivities taking place in the ocean. A total of five ferromanganese nodules from differentlocations and water depth of Indian Ocean were analysed along with SRM NOD PI. Themeasured concentrations of various elements in the nodule samples are presented in Table 3.A few elements, namely, Sc, Sb, Hf, W and Th have been estimated for the first time in theIndian Ocean nodules.
The Fe enriched hydrogenous nodules were associated with higher concentration ofmost of the minor and trace elements. Slow growth rate, high retention time and favourabledepositional environment are attributed to their enrichment. Hydrogenous nodulescharacterised by low Mn/Fe ratio, found at shallow region of the Indian Ocean, indicateslower mobility of Fe component compared to the Mn in the oceanic environment, leading tothe precipitation of Fe as its oxyhydroxide. Cobalt was found to have strong affinity towardsFe. . Tungsten and thorium are found positively correlated with iron and are reasonablyenriched in the hydrogenous nodules compared to the diagenic one. Rare earth elements areprobably incorporated on iron oxyhydroxide phase by adsorption processes. The REEabundance increases with the increase in the Fe content and is in good agreement to the earlier
138

reports on the nodules of Pacific Ocean. It has been shown that the rare earth elements (REEs)are adsorbed but not co-precipitated with the iron oxyhydroxide phase.
TABLE 3.Elemental Concentrations of ferromanganese nodules of Indian Ocean (in ppm unless % is indicated).
ElementsNa%K%Mn%Fe%ScCoAsSbCsHfWThLaCeNdSmEuTbHoYbLuCe*Mn/Fe(La/Lu)*ZREECe/La
Nl2.44±0.210.57±0.0415.3±0.616.510.715.65±0.323220±16376±818.9±0.7321±76.52±0.3767.1±4.342.5±2.4142.2±6.4951 ±34137.4±7.228.2±1.16.74±0.563.24±0.334.78±0.6419.32±0.593.48±0.13+0.240.930.761296.366.68
N22.56±0.230.58±0.0419.1±0.921.2±0.822.92±0.815362+214110+921.610.83791166.61±0.3577.8+6.850.5+3.3257.5110.21862183196.619.842.812.111.1410.664.82+0.346.8910.9132.4311.086.22+0.24+0.210.900.812420.407.24
N31.75+0.180.4010.0318.610.813.910.713.7210.362180+96771619.510.82161128.5410.4649.213.948.512.9204.817.91246148167.717.642.112.18.70+0.833.3110.376.5310.8724.22+1.034.6210.13+ 0.181.340.821707.986.08
N42.0810.140.5010.0416.910.711.310.415.3310.7821741106611517.9+0.6267197.1410.4946.6+4.547.212.9184.418.6948+39138.419.734.4+1.17.55+0.723.09+0.295.7810.6421.4110.983.8210.13+ 0.161.500.881346.855.14
N52.3210.130.4810.0417.2+0.45.510.310.92+0.421128149391412.210.67181243.40+0.2242.514.424.6+1.498.618.2502+2388.3+7.220.310.94.7610.382.6210.332.9710.329.8510.631.5810.11+ 0.243.110.98730.985.09
Ce* = Cerium anomaly, calculated using the relation Log[3Ce/(2La+Nd)J, as given in ref.[16] (La/Lu)*(Lasampie / LaNASC) / (Lusampie / LuNASC)
2.5.7 Dolomites, Dolerite and Serpentines
Serpentines are a class of secondary minerals derived by alteration in magnesium richsilicate minerals. It is reported that serpentine and associated asbestos are formed due tohydrothermal solutions accompanying the dolerite intrusives into dolomite host rock. Theblack and green serpentines are potential sources of asbestos. With an aim to understand theprocess of serpenisation, investigations on the composition of two types of dolomites(unaltered and altered dolomites) and two types of serpentines along with intrusive rockdolerite obtained in the asbestos mines of Brahmanapalle in Cuddapah basin, Andhra Pradesh,India were carried out .As many as 23 elements are measured. The elemental concentrationsfor the serpentines as well as the unaltred and altered dolomites and dolerite obtained fromfour independent determinations are given in Table 4. The major elements present in the fivevarieties are Mg, Ca, Al and Fe. From the variation of Mg concentration, it is clear that bothdolomite and dolerite contribute Mg to serpentines. Absence of Ca in black serpentine couldbe that it is replaced by Mg in the serpentinisation. The REEs decrease in the order: dolerite—> black serpentine —> yellow serpentine —> dolomite .Elements like Ti, V, Cr and a fewREEs are absent in unaltered dolomite where as these elements are present in serpentines and
139

dolerite. From these observations, it is clear that these elements were contributed in theserpentinisation only by dolerite.
TABLE 4. Elemental Concentrations of Intrusive rock (Dolerite), two Serpentines and Dolomities (in mg.kg"1
unless % or ng.g"1 is indicated).
S.N
123456789101112131415161718192021
ElementNaMg%Al%ClCa%ScTi%VCrMnFe%CoAsBaLaCeSmEu*DyYbAu*
Dolerite
1325.47179.519.22+1.11.89+0.11N.D.8.7511.1527.1311.120.48+0.03209.50+14.12N.D.292111607.9410.2030.5111.85N.D.N.D.13.7211.0541.3212.162.97+0.15990.05160.10N.D.2.9910.00N.D.
Blackserpentine162.3717.4622.7211.864.0010.17400.10+11.20N.D.25.2911.070.7010.04172.4218.5353.66+3.2327221545.0010.3837.3112.334.99+0.18N.D.10.9410.6824.25+1.511.7710.08350.23120.119.1910.572.22+0.1013.2011.01
Yellowserpentine93.2815.0218.1110.580.11+0.005255.2312.920.5510.020.1610.01N.D.N.D.N.D28.691.0.090.2210.014.3610.2313.4111.16545.001531.82+0.04N.D.0.48+0.03100.1615.100.2710.01N.D.N.D.
Altereddolomite86.9015.878.2810.180.1110.005288.6719.1218.1011.320.5010.02N.D.N.D.N.D.144.02+9.45N.D.5.6310.316.21+0.11222.02+17.063.07+0.06N.D.0.2310.0150.2812.12N.D.N.D.20.2511.52
Unaltereddolomite654.67+18.1512.9117.40.1710.01132.3315.2125.4611.760.2210.01N.D.N.D.N.D.145.31+3.59N.D.4.7310.260.7610.05158.58+9.231.2810.088.3210.670.22+0.0220.0611.13N.D.N.D.10.1210.85
N. D. - not detected, '" '- ng.
2.5.8 Edible and Medicinal Leaves, Pulses and Cereals
The role played by micro nutrients and trace elements in the biochemical functions ofhuman life and their impact on human life are important. These are supplied through foodchain. Additionally carbohydrates, proteins and minerals are provided through food items likecereals, pulses and leaves. The investigations are aimed at measuring the concentrations ofminerals required for human beings viz: major elements like Ca, P, K, Mg, Na, Fe and traceelements like Zn, Co, I, Cu, Mn, Mo, F, Se, Ni, Cr, Cd, Si, V and Sr. Phosphorous could notbe measured by gamma spectrometric based NAA. It is also important to know the variationof these elements in these items from different places and environment. A comprehensiveprogramme of determining the elemental profiles in soil, water, seeds and leaves is initiated.
Elemental concentrations of a few varieties of leaves which are used either as a naturalingredient in ayurvedic medicine preparations or as reliable items for human diet and SRM-1571 are determined by KO NAA method. The leaves analysed, their local names andscientific names are given in Table 5 Data obtained on one of the varieties studied (Neem),collected from two different places are given in Table 6. These data have been used to see theeffect of soil condition on the trace element concentrations in these leaves. Elementalconcentrations of a few varieties of cereals and pulses which are used as natural ingredientsfor human diet are determined. The cereals and pulses analysed, their local names andscientific names are given in Table 7. Al, Cl, Mg, Mn, Na, K and Ca were determined using
140

short irradiation times, where as Br, Zn, Co, Fe, La, Sm, Cr, Rb, Se, Sn and Hg required longirradiation times and the elemental concentrations for 17 elements measured in cereals andpulses, in the present studies are given in Tables 8 and 9. An attempt has been made to analysethe results on the measured concentrations of major and minor elements in terms of theaverage intake and the dietary value of these leaves, cereals and pulses. The data obtained onthe major and minor elemental concentration of the cereals and pulses can be used to evaluatethe potentiality of these grains in their use for average intake and the dietary values. Aprogramme is initiated on evaluating the uptake of elements by plants from different soils.
2.5.9 Palladium and gold determination by CNAA
Measurement of trace elements in presence of large amounts of Fe, Cu and U by NAAis very difficult due to the spectral interferences and also becomes complicated due to thefission product contribution from the fission of uranium. In such cases, it becomes imperativeto preconcentrate elements of interest and decontaminate from the major elements andmeasure the concentrations by NAA. A reliable Chemical Neutron Activation Analysis(CNAA) method was developed to measure the trace amounts of Au and Pd present inmatrices that may contain uranium, copper and iron [18,19]. Pd and Au were preconcentratedon a mini column containing anion exchanger Dowex 1X8 (100-200 mesh ) in Cl" form. Thecolumn was irradiated and the activities produced were measured using a this window HPGEand a Si(Li) systems. Concentrations were evaluated by comparison method. Standardaddition method was used to arrive at the lowest detection limits. Under the ideal interferencefree conditions, an absolute detection limit of 0.12ng for Pd and 0. Ing for Au were achieved.This is being used routinely to measure trace amounts of Au and Pd in different matrices.
Table 5 Sample Description of the leaves
Sample Local NameIdent.
Scientific Name Medicinal Uses
LI Kadi patta Murraya koenigii (L.)spr
L2 Chauli(small) Amaranths polygamusL.
L3 Kanuga. Pongamia pinnata (L.)pierre
L4 Drum stick Moringa oleifera Lam
L5 Eucalyptus Eucalyptus globulusLabill
L6 Methi Amaranthus hybridus L.
L7 Ambadi Hibiscus cannabinus L.L8 Chauli Amaranths gangetilus L.
Dysentery, Bruised, Snake bite,EruptionsDiarrhoea, Seminal debility,Leucorrhaea and Monorrhagia andAntidote for Snake poisonFlatulence, Dyspersia, Diarrhoea,Cough, Leprosy, Gonorrhoea, Foululcers, Sores, Rheumatic pains andBleeding pilesDental caries, Swellings, Hydrocele,Headache and ParalysisRheumatism, Burns, Mosquitorepellent, Infections of the UpperRespiratorytract, Chronicbronchitis,Asthma, Phthis, Insect and Verminrepellent and Some skin diseases.Gonorrhoea, Eczema, Scorpion-sting,Snake bites, Cough, DysenteryPurgative, HealingAstringent, Menorrhagia, Diarrhoea,Dysentery, Haemorrhage, Ulceratedconditions of throat and mouth
141

L9 Pudma Mentha spicata L
L10 Neem Azadirachta mdicaAjuss
Fewer, Bronchitis, aphthae andantidote to poisonUlcers, Boils,czema,Smallfox,Bloodpurification, Skin diseases and as aantiseptic solution_________
TABLE 6 Elemental concentrations of Orchard Leaf (NIST SRM-1571) and Neem leaves
Element
NaMgAlClKCaScTiV
MnZnAsBrSrSbI
CsBaLaSmEu
Units
l-ig/g%
Hg/g"g/g%%
ng/gug/gHg/gl-ig/gHg/g^g/gug/gug/gug/gug/gHg/gHg/gHg/gng/gng/g
SRMMeasured88 7+6 8
0 59±0 02330 5±7 5
650 0±30 01 42±0 091 89±0 0386 5±5 156 9+4 2
0 52±0 0287 0±8 229 3±4 383+0685±07
34 1±1 526±03
---
1 I3±0071300±100202±23
1571Reported82 0±6 0
0 62±0 02310-410
6901 47+0 032 09±0 03
900--
91 0+4 025 0±0 3100+0295±1 1
37 Oil 029±03
---
1 1±0 0711412024±3
Neem LeafTirupati(LlO)
10041650 49 ±0 0311621725300+4002 8410 093 06+ 034
--
1 66+0 06169711 16
--
7 07+0 51150+10 1
-3 09+0 6
-74 98+3 410 3310 005
--
Mumbai(Lll)541 5+1770 76±0 03
3093+21 3830015001 111006
4 0210 051--
4 26+0 08365+21
--
3 8610 241383144
--
1 8910 13----
- not detected
TABLE 7 Sample Description of the cereals (C1-C5) and pulses (P1-P7)
Sample IdentificationClC2C3C4C5PIP2P3P4P5P6P7
Local NameWheatPaddyBajraRagi
JowarMethiMoong
ChanadalTil
ChanhHorse Gram
TurDal
Scientific NameTnticum aestivun L
Oryza sativa LPenmsetum typhoides (Burm f) Staff & Hubb
Eleusuie Coracana(L ) GaertnSorghum vulgare Pers
Tngonella foenum graecum LPhaseolus aureus Roxb
Cicer arietinum LSesamum indicum L
Vigna sinensis (L ) HasskDohchos biflorus L
Cajanus cajan(L ) Mill
142

TABLE 8. Elemental Concentrations of Cereals~(in mg.kg"1 unless % is indicated)
ElementNa
Mg%
Al
Cl%
K%
Ca%
Mn
Br
Zn
Co
Fe
La
Sm
Rb
Cr
As
Cl42.3±2.3
0.24±0.0252.6+0.43
0.1 7±0.0040.43±0.011N.D.
40.88±3.83
2.63±0.38
191.81±14.121.33±0.09
1915.30±98.710.1 72±0.032N.D.
N.D.
N. D.
N.D.
C2195.9±
12.80.92±0.
0321801.88±47.7
0.33+0.033
0.48+0.0950.11+0.04
151.6±7.99
2.38+0.52
92.60+5.59
0.5 1±0.02
816.75+54.280.46+0.0530.14±0.003
165.94+10.72
55.70±2.23
0.1 44±0.032
C384.77+
2.870.703+0.014
995.27+98.46
0.262+0.0060.54±0.051N.D.
32.9±1.87
0.38±0.022
154.22+10.120.96±0.04
467.11+11.56N.D.
N.D.
115.12±8.58
N.D.
N.D.
C4114.8+
1.40.44+0.034N.D.
0.1 06±0.0020.57±0.28
0.35±0.023
267.3±6.99
0.97±0.082
61.79±2.52
0.37±0.02
489.57±21.12
4.8±0.06
N.D.
71.59+4.51
N.D.
N.D.
C5106.62+
3.550.69±0.019
886.8±50.6
0.14+0.0060.65±0.263
0.048±0.00319.72+
2.041.65+0.077
77.62±4.65
2.71+0.14
1376.21 +50.21
N.D.
0.1 6±0.01
N.D.
N.D.
N.D.
N D Not detected
TABLE 9. Elemental concentration of Pulses (in mg.kg"1 unless % is indicated)
ElementNa
Mg%
Al
Cl%
K%
Ca%
Mn
PI391.2+
23.60.87±0.04
N.D.
0.273±0.0081.62±0.04
0.297+0.01320.6±
0.8
P227.65+
3.510.88±0.035N.D.
0.108+0.0011.32+0.03
0.173±0.01515.53+
0.4
P3167.88±12.780.87±0.025
649.6±41.290.1 9±0.0031.24+0.1520.24±0.014
31.12+1.19
P4230.68+4.161.15±0.05
778 .3±6.93
0.095+0.0020.93±0.111.16±0.018
22.57±1.9
P5149.05±
8.50.79+0.030
1079.3±67.73
0.064±0.0016
1.91±0.01504+
0.08643.9+
1.25
P654.53+
0.92051±0.023
586.81+37.8
0.07±0.0011.55±0.042
0.344+0.035
48.82±0.86
P752.58±5
.80.34±0.025
185.6+10.6
0.04±0.002
1.6±0.2
0.115+0.01710.1±0.6
143

Br
Zn
Co
Fe
La
Se
Sm
Rb
0.63±0.02
167.12112.023.02±0.21
1261.16±88.40N. D.
54.38±3.15
0.08910.004
203.52111.24
0.510.009
155.29±10.052.1410.11
855.90±25.23N. D.
N. D.
N. D.
83.4+5.32
13.22±0.4
86.56+2.130.74±0.04
1181.45+63.35
0.17410.023
30.22±0.93
N. D.
77.1113.45
5.71"0.34
82.9413.161.7810.04
934.51+29.5314.451
0.7628.31
1.350.03310.002125.61+7.53
2.27+0.12
96.5411.84
0.45+0.02
806.04+25.430.25+0.0258.77±0.364
0.084±0.025
191.67111.20
2.8110.24
127.9118.12
0.7510.05
1466.65132.280.02710.0012N. D.
N. D.
N. D.
5.1210.25
60.93±2.35
0.54±0.02
912.64±35.210.74±0.03244.2±4.85N. D.
51.915.84
2.5.10 Rare Earth Elements (REE) in quartzites by CNAA
Trace amounts of uranium are present in the quartzites of Cuddapah basin, estimationof REEs in quartzites by NAA becomes erroneous due to the contribution from the fission ofuranium. A preconcentration chemical procedure was developed and tested to estimate REEsin quartzites. This procedure was standardised using radiotracers in the separation of REEsfrom synthetic mixtures to arrive at the chemical yields and applied to quartzites. Quartziteswere brought into solution by digesting with HC1 in presence of HF. Boric acid was added toremove the excess fluoride and the solution was brought to 1MHC1 .REEs and U werecoprecipitated as oxalates by adding calcium chloride. The precipitate was dissolved in 9MHC1 and loaded on an anion exchange ( Dowex 1X8, Cl" form) column to adsorb uranium.The effluent containing REEs was subjected to NAA.
2.5.11 Determination of trace elements in leaves by RNAA
In many naturally occurring materials like biological and minerals, Na is a majorelement .In leafy materials, in addition to sodium, Br and K are present as major constituents.In NAA activation products of these elements make the measurements nearly impossible. Inview of this, it is essential either separate these major element prior to activation (CNAA) orafter the activation (RNAA). If the matrix does not contain fissionable materials, then it wouldbe better if the chemical separations are carried out after the activation. Trace elements aredetermined in leaf samples and in SRM-1571 by RNAA with enhanced sensitivity [20].Irradiated sample was digested in perchloric acid medium to expel radiobromine.Radiosodium and radiopotassium were separated from the solution by passing it over HAPcolumn in 8M HNOs for Na removal and 1M HNOs for K removal. For the first time elementsTi and V were measured in SRM-1571. These were compared with the results obtained byCNAA on the same standard. A similar programme of measuring the trace elements in bloodsamples after removing radiosodium is initiated. Preliminary data indicate that trace elementslike Cr, Fe and Zn could be measured reliably.
144

3. FUTURE OUTLOOK
3.1 ENVIRONMENTAL MONITORING AROUND CUDDAPAH BASIN
Cuddapah basin is rich in minerals like asbesots, lime stone, barytes and uraniumbearing rocks. Mining of these minerals load the environment with particulate matter which isa health concern. A comprehensive programme of monitoring air, soil, water and plantsaround this area is initiated in collaboration with Department of Mineral Chemistry, S.V.U.P.O. Centre, Cuddapah.
3.2 ENVIRONMENTAL MONITORING AROUND AGRA
Agra is an industrially developing area. A programme of monitoring the soil, waterand dew in and around Agra is initiated to evaluate the impact of the pollutants by DayalbaghEducational Institute, Agra and we are extending the required analytical services.
3.3 NUCLEAR ANALYTICAL TECHNIQUES
Apart from utilising NAA for analysing varied matrices, nuclear anlytical techniquesusing ion beam analysis are being developed with a view to utilise them for materialcharacterisation. We are setting up facility for RBS, NRA and PDCE at the Folded Tandem IonAccelerator (FOTIA) hi B.A.R.C. where low energy ion beams will be made available. Themain areas of research and development envisaged are depth profiling of low Z materials indifferent industrially important materials using NRA, high tech materials using RBS and multielemental analysis in biolgically and environmentally important materials using PIXE. It isalso proposed to set up PGNA for analysing low Z materials in environmental samples.
ACKNOWLEDGEMENTS
I am grateful to Shri R. N. Acharya and Dr. A.G.C. Nair for their suggestions andconstructive criticism throghout the preparation of this text. My thanks are due to mycollegues Shri R.N. Acharya, Dr. A.G.C. Nair, Shri P.P. Burte and Dr. S.B. Manohar for theiractive participation in this work. My thanks are also due to collaborators from differentuniversities: Dr. L.K. Reddy, Dr. G.R.K. Naidu, Prof. Satya Prakash, Prof. V. Chakraborttyand Dr. S.K. Jha from E.A.D, BARC. My thanks are due to Dr. D.D. Sood, formerly Director,RC&I Group, BARC for his encouragement.
REFERENCES
[1] G.M. KOLESOV, Analyst, 120, 1457 (1995).[2] A. CHATT AND R.E. JERVIS (Guest Ed), Proc. of the Second Intl. Symp. on Nuclear
Analytical Chemistry, NAC-n, J. Radioanalytical Nucl. Chem, 179(1) (1994).[3] A. SMONITS, F.DE CORTE AND J. HOSTE, J. Radioanal. Chem., 24, 31 (1975).[4] F. DE CORTE, A. SMONITS, A. DE WISPELAERE AND A. ELEK, J. Radioanal.
Chem., 133,43-130(1989).[5] R.N. ACHARYA, P.P. BURTE, A.G.C. NAIR, A.V.R. REDDY AND
S.B. MANOHAR, J. Radioanal. Nucl. Chem., 220(2), 223 (1997).
145

[6] R.N. ACHARYA, S.K. JHA, P.P. BURTE, A.G.C. NAIR, U.S. KUMAR,A.V.R. REDDY, T.M. KRISHNA MOORTHY AND S.B. MANOHAR, Proc. 5th Nat.Symp on Environment, p.209, February 1996, SINP, Calcutta, India.
[7] R.K. DUTTA, R.N. ACHARYA, A.V.R. REDDY, A.G.C. NAIR,V. CHAKRABORTTY, S.N. CHINTALAPUDI AND S.B. MANOHAR, to becommunicated, J. Radioanal. Nucl. Chem.
[8] R.K. DUTTA, R.N. ACHARYA, V. CHAKRABORTTY, A.G.C. NAIR,A.V.R. REDDY, S.N. CHINTALAPUDI AND S.B. MANOHAR ,J. Radioanal. Nucl.Chem (in press).
[9] P.V. NAGENDRA KUMAR, R.N. ACHARYA, K. HARIKRISHNA, N. SURESHKUMAR, L.K. REDDY, N.B.Y. REDDY, A.G.C. NAIR, A.V.R. REDDY AND S.B.MANOHAR, Ninth Annual Conference of Indian Nuclear Society (INSAC-98),Mumbai, June 1-3, p.4 (1998).
[10] BALAJI, R.N. ACHARYA, A.G.C. NAIR, P.P. BURTE, A.V.R. REDDY, G.R.K.NAIDU AND S.B. MANOHAR, (to be communicated)
[11] R.N. ACHARYA, A.G.C. NAIR, P.P. BURTE, A.V.R. REDDY ANDS.B. MANOHAR, B.A.R.C. Report, BARC/ 1995/E/0071995.
[12] F. DE CORTE, L. MOENS, K. SORDO-EL HAMMAMI, A. SIMONITS ANDJ. HOSTTE, J. Radioanal. Chem, 52, 305 (1979).
[13] S.S. RATTAN, S.P. DANGE, T. DATTA, S.B. MANOHAR, P.P. BURTE,S. PRAKASH AND M.V. RAMANIAH, BARC Report
[14] Table of Radioactive Isotopes, E. Browne and R.B. Firestone: Ed.V.S. Shirley, John-Wiley and Sons (1986).
[15] Hand book of Nuclear Activation Data , Technical Report Series, No.273, IAEA,Vienna(1987).
[16] H. ELDERFEELD AND M. J. GREAVES, Earth PlanetSci. Lett., 55, 163(1981).[17] G. P. GLASBY, Marine Chemistry, 1, 105 (1973).[18] A.G.C. NAIR, A.V.R. REDDY, R.N. ACHARYA, P.P. BURTE AND
S.B. MANOHAR, 16th Conference of Council of Chemists, Mangalore, India, p. 166(1997).
[19] A.G.C. NAIR, A.V.R. REDDY, R.N. ACHARYA, P.P. BURTE ANDS.B. MANOHAR, Communicated to J. Radioanal. Nucl. Chem.
[20] A.G.C. NAIR, R.N. ACHARYA, A.V.R. REDDY AND S.B. MANOHAR, 33rdConvention of Chemists, Coimbatore, India, (1997).
146

FULOP, M.
KINYUA, A.
KUCERA, J.
MARKOWICZ, A.
MALMQVIST, K.G.
POTTS, P.J.
REDDY, A.V.R.
ROSENGARD, U.
SALAZAR, A.
TAJANI, A.
SHEBELL, P.
Van GRIEKEN, R.
List of Participants
Institute of Preventive and Clinical Medicine,Limbova 14, 833 01 Bratislava, Slovakiaemail: [email protected]
Institute of Nuclear Science,University of Nairobi,P.O. Box 30197, Nairobi, Kenyaemail: [email protected]
Nuclear Physics Institute,Academy of Sciences of the Czech Republic,CZ-250 68 Rez, Czech Republicemail: [email protected]
International Atomic Energy Agency,P.O. Box 100, A-1400 Vienna, Austriaemail: [email protected]
Lund Institute of Technology,Lund University, P.O. Box 118, SE-221 00, Lund, Swedenemail: [email protected]
Department of Earth Sciences, The Open University,Walton Hall, Milton Keynes, MK7 6AA, United Kingdome-mail [email protected]
Radiochemistry Division, Bhabha Atomic Research Centre,Trombay, Mumbai-400 085, Indiaemail: [email protected]
International Atomic Energy Agency,P.O. Box 100, A-1400 Vienna, Austriaemail: [email protected]
Applied Nuclear Physics Laboratory, University of Costa Rica,San Jose, Costa Ricaemail: [email protected]
International Atomic Energy Agency,P.O. Box 100, A-1400 Vienna, Austriaemail: [email protected]
Environmental Measurements Laboratory,201 Varick St. New York, NY 10014, United States of Americaemail: [email protected]
Department of Chemistry University of Antwerp,B-2610 Antwerp, Belgiumemail: [email protected]
147