Habits of Inequality: A Radical View of Institutions and Inequality
NBER WORKING PAPER SERIES
INDUCED INNOVATION AND SOCIAL INEQUALITY:EVIDENCE FROM INFANT MEDICAL CARE
David M. CutlerEllen Meara
Seth Richards
Working Paper 15316http://www.nber.org/papers/w15316
NATIONAL BUREAU OF ECONOMIC RESEARCH1050 Massachusetts Avenue
Cambridge, MA 02138September 2009
We are grateful to the National Institutes on Aging for research support and to seminar participantsat the American Economics Association Annual Meetings, The American Society of Health EconomistsMeeting, and Dartmouth for helpful comments. The views expressed herein are those of the author(s)and do not necessarily reflect the views of the National Bureau of Economic Research.
© 2009 by David M. Cutler, Ellen Meara, and Seth Richards. All rights reserved. Short sections oftext, not to exceed two paragraphs, may be quoted without explicit permission provided that full credit,including © notice, is given to the source.
Induced Innovation and Social Inequality: Evidence from Infant Medical CareDavid M. Cutler, Ellen Meara, and Seth RichardsNBER Working Paper No. 15316September 2009JEL No. I1,I12,J1,J15
ABSTRACT
We develop a model of induced innovation where research effort is a function of the death rate, andthus the potential to reduce deaths in the population. We also consider potential social consequencesthat arise from this form of induced innovation based on differences in disease prevalence across populationsubgroups (i.e. race). Our model yields three empirical predictions. First, initial death rates and subsequentresearch effort should be positively correlated. Second, research effort should be associated with morerapid mortality declines. Third, as a byproduct of targeting the most common conditions in the populationas a whole, induced innovation leads to growth in mortality disparities between minority and majoritygroups. Using information on infant deaths in the U.S. between 1983 and 1998, we find support forall three empirical predictions. We estimate that induced innovation predicts about 20 percent ofdeclines in infant mortality over this period. At the same time, innovation that occurred in responseto the most common causes of death favored the majority racial group in the U.S., whites. We estimatethat induced innovation contributed about one third of the rise in the black-white infant mortality ratioduring our period of study.
David M. CutlerDepartment of EconomicsHarvard University1875 Cambridge StreetCambridge, MA 02138and [email protected]
Ellen MearaDepartment of Health Care PolicyHarvard Medical School180 Longwood AvenueBoston, MA 02115-5899and [email protected]
Seth RichardsDepartment of EconomicsUniversity of Pennsylvania3718 Locust WalkPhiladelphia, PA [email protected]

2
Technological change is a source of substantial aggregate welfare improvements.
Several studies suggest that technological change accounts for up to a third of aggregate
economic growth (Jorgenson 2000). Yet overall welfare gains do not imply equal benefit
for all individuals. If technological change is biased towards some industries or groups,
some parts of the population will benefit more than others.
In this paper, we investigate biased technological change using a particular
example – medical technology for treating at risk infants. Infant mortality provides a
useful setting to learn about induced innovation because the outcome is easy to measure
(deaths) and disparities in outcomes are so widely noted. Further, there has been
enormous technological progress. In the early 1960s, about 25 of every 1,000 infants
died before their first birthday, most before leaving the hospital. Much of this death was
in premature infants – infants born before normal gestation, and typically low birth
weight, or under 2500 grams.
The situation of newborns dying so young created a moral imperative to reduce
those deaths. The highly publicized death of John F. Kennedy’s infant son shortly after
his premature birth attracted further attention to the magnitude of deaths to infants.
Clinicians treating infants began to innovate, starting what would spur the development
of neonatal intensive care units (Baker 1996; Anspach 1997). Grant money followed,
and physicians and scientists became energized. Treatment progress was impressive. In
the four and a half decades since 1960, mortality for low birth weight babies declined 70
percent, almost entirely as a result of improved medical care (Cutler and Meara, 2000).
The first part of our empirical analysis shows the link between humanitarian need
and technological change. We look at the role of induced innovation using data on death
3
by cause. We investigate whether causes of death with higher mortality rates early in the
time period experienced larger reductions in infant mortality over time. Our results
support this prediction. Every death per 1,000 births attributed to a particular cause in
1983-85 is associated with a 20 percent greater reduction in mortality from that cause
over the subsequent 13 years.
We then go on to examine the impact of these changes on social inequities in
health. We focus specifically on the ratio of black to white infant deaths, which
characterizes the relative rate of progress for blacks compared to whites. Since there are
nearly four times as many white than black births, leading causes of death will inherently
be those which whites suffer from relatively more. When progress was made on leading
causes of death, therefore, it benefited white newborns more than black newborns. Using
counterfactual simulations, we show that racial gaps in birth weight-specific mortality
have widened over time as a direct result of the research progress that was made. As a
result, medical need has led to improved aggregate outcomes, but with a disproportionate
share of those benefits accruing to majority groups.
The paper is structured as follows. The first section presents a simple model of
induced innovation in medicine that shows why research would be allocated to more
common diseases and how induced innovation could increase disparities in health
outcomes. The second section describes infant mortality trends in recent decades and
presents a case study of a particular cause of death, respiratory distress syndrome (RDS).
Section three presents the data, and section four empirically tests for induced innovation.
Section five then translates these estimates into the social consequences of induced
innovation. The last section concludes.

4
II. A Model of Induced Innovation
In this section, we use a simple framework to explore how the obvious and
painful suffering of people near death could lead to technological change, and how that
change might affect different population groups. For simplicity, we consider the setting
we employ in our empirical analysis: survival of low birth weight infants.
A significant body of recent research has considered models of endogenous
innovation. In most of these models, innovation is posited to respond to profits – either
greater demand for some industries (Schmookler, 1966; Romer, 1990; Grossman and
Helpman, 1991; Aghion and Howitt, 1992; Kremer, 2002; and Acemoglu and Linn,
2004) or differential factor costs (as in Newell, Jaffee, Stavins, 1999; and Popp, 2002).
The medical sector is not well characterized by pure profit motives, however.
Most hospitals are not-for-profit and much innovation is done by independent, university-
based researchers. We posit an alternative framework in which the humanitarian desire
to improve health drives innovation. Lichtenberg (2001) and Bhattacharya and Packalen
(2008) similarly model the allocation of public spending and innovation in the non-profit
sector.
We consider a set of diseases that might result in death, abstracting from quality
of life. Let the mortality rate for a particular diagnosis i at a point in time t be denoted dit.
We consider two periods, a base period t = 0 and a later period t = 1, where individuals
from time 0 are no longer in the relevant population. The death rate is given by
∑n
=i
ti
t d=D1
, where n is the number of distinct diseases.

5
Medical research on a particular condition will improve survival according to a
(probabilistically) known innovation possibility function. We model this as a function
fi(ri), that converts research between periods 0 and 1 into a survival probability at time 1.
We assume straightforwardly that fi(0) = 0, fi < 1, fi ’ > 0, and fi’’ < 0. The death rate for
condition i at time 1 is then di1 = di
0 · (1 – fi(ri0)), and the aggregate death rate in period 1
is ( ).)(11
01 ∑ −⋅n
=iiii rfd=D
Note that this formulation assumes no spillovers across diseases – that is, research
conducted on one disease affects mortality only for that condition. We argue below that
this assumption is conservative in our setting.
We consider a social planner wishing to maximize social welfare. This might be
the National Institutes of Health, which funds a large share of basic biomedical research,
or university researchers on their own, thinking about valuable projects to explore. The
social planner wishes to minimize mortality in period 1, with a total research budget fixed
at R.
The planner would then solve the following problem:
( )∑ −n
=iiii rfd
1
0 )(1 s.t. ∑n
=ii R<r
1. (1)
The first-order condition is straightforward:
di0 · fi'(ri*) = dn
0 · fn'(rn*), for all i. (2)
Equation (2) states that the expected marginal benefit of research should be the
same across all diseases. Provided the fi functions are not too different across conditions,

6
this means that more common diseases deserve research that is less productive on the
margin, and thus get more research funding.1
Disparities in health outcomes will be related to research innovation. Because
more medical research is done for more common diseases, the socially optimal allocation
of research dollars will tilt towards diseases that are relatively more common in larger
population groups.
To see this, consider the case where there are two groups, a majority group a and
a minority group b (in our empirical example, whites and blacks). Let the initial death
rates per condition for two groups be 0,iad and 0
,ibd and their respective sums across
conditions be Da0 and Db
0. At time 1, the death rates are given by
1,iad = 0
,iad · (1 – fi(ri)) and 1,ibd = 0
,ibd · (1 – fi(ri)),
and the mortality ratio at each time is given by Dbt/Da
t. This ratio increases over time if
Db1/Db
0 > Da1/Da
0, which in our model expands to
( ) ( )∑∑ −−n
=i a
iaii
n
=i b
ibii D
drf>
Dd
rf1
0
0,
10
0, )(1)(1 , (3)
or
0)(1
0
0,
0
0, >
Dd
Dd
rfn
=i b
ib
a
iaii∑ ⎟
⎟⎠
⎞⎜⎜⎝
⎛− . (4)
Thus the mortality ratio rises when increases in survival probabilities (fi(ri)) are correlated
with higher initial shares of deaths per condition among the majority group
⎟⎟⎠
⎞⎜⎜⎝
⎛− 0
0,
0
0,
b
ib
a
ia
Dd
Dd
.2
1 In our work, we do not observe differences in the innovation function, so we consider it similar across diseases. Bhattacharya and Packalen (2008) attempt to model this empirically, assuming a structural model of research opportunity for pharmaceuticals that declines as drugs get older.
7
Such a correlation can be present for several reasons. The difference in the initial
shares of deaths attributed to a given condition across groups may arise because a
particular disease is more prevalent in the majority population than in the minority
population, or more fatal for the majority group. For example, among infants born
prematurely, black infants tend to have less severe illness than do white infants along a
number of dimensions, holding gestation constant (Hulsey et al. 1993; Richardson et al.
1994; Richardson et al. 1999; Berman et al. 2001). In particular, at any given gestation,
black infants are less likely to have RDS, and, on illness severity measures, black infants
score better than whites even given the presence of a condition like RDS (Hulsey et al.
1993; Richardson et al. 1994). Thus, death rates from RDS are greater among whites
than among blacks, even within narrow birth weight categories. As a result, research on
RDS will disproportionately benefit whites over blacks. Thus, if research favors common
causes of death, we can expect (fi(ri)) to be positively correlated with higher death rates in
a majority group.
In this model, the increasing disparity occurs as a consequence of the differences
in population sizes, not because deaths are valued differently by the social planner. To
see this more formally, consider two diseases, one with a greater prevalence among
whites and the second with a greater prevalence among blacks. Let e10 be the prevalence
of disease 1 among whites in the base period, and θe10 be the prevalence among blacks,
where θ<1. Conversely, let e20 be the prevalence of disease 2 among blacks and θe2
0 be
the prevalence among whites. To simplify notation, suppose that each case of the disease
is fatal, so that death rates are equal to prevalence rates.
2 Note that in the model, increases in survival probabilities (fi(ri)) are assumed to be constant for the two groups.

8
The overall mortality rate from disease 1 is ba
b1a
N+NNθe+Ne
=d00
101 , where Na and Nb
are the number of white and black births respectively. Similarly, the mortality rate for
disease 2 is ba
b2a2
N+NNe+Nθe
=d00
02 . Combining these mortality rates with equation (2)
gives a formula for the marginal product of research on each disease in equilibrium:
( )( ) ⎟⎟
⎠
⎞⎜⎜⎝
⎛⋅⎟⎟⎠
⎞⎜⎜⎝
⎛
ba
ba'
'
θN+NN+θN
ee
=rfrf
01
02
22
11 (5)
If θ<1 and Na > Nb, the second expression on the right hand side of equation (5) is
less than 1, and hence the overall expression on the right hand side is less than the ratio of
disease incidence in the two groups. As a result, disease 1 should receive relatively
greater funding than if the populations were the same, with the disparity rising as the
population disparity rises.
The induced innovation hypothesis has several predictions, which we test in the
empirical section of the paper. First, the theory predicts that initial death rates and
subsequent research effort should be positively correlated. Second, innovation should be
associated with more rapid mortality declines. As a result, induced innovation leads to
growth in mortality disparities between minority and majority groups.
II. Background on Infant Mortality and Neonatal Medicine
Infant mortality, or death during the first year of life, used to be much more
common than it is today. In 1915, for example, infant mortality was 150 babies per 1,000
born alive. With improved nutrition and advances in public health, that rate fell to 26 per
1,000 in mid-century.

9
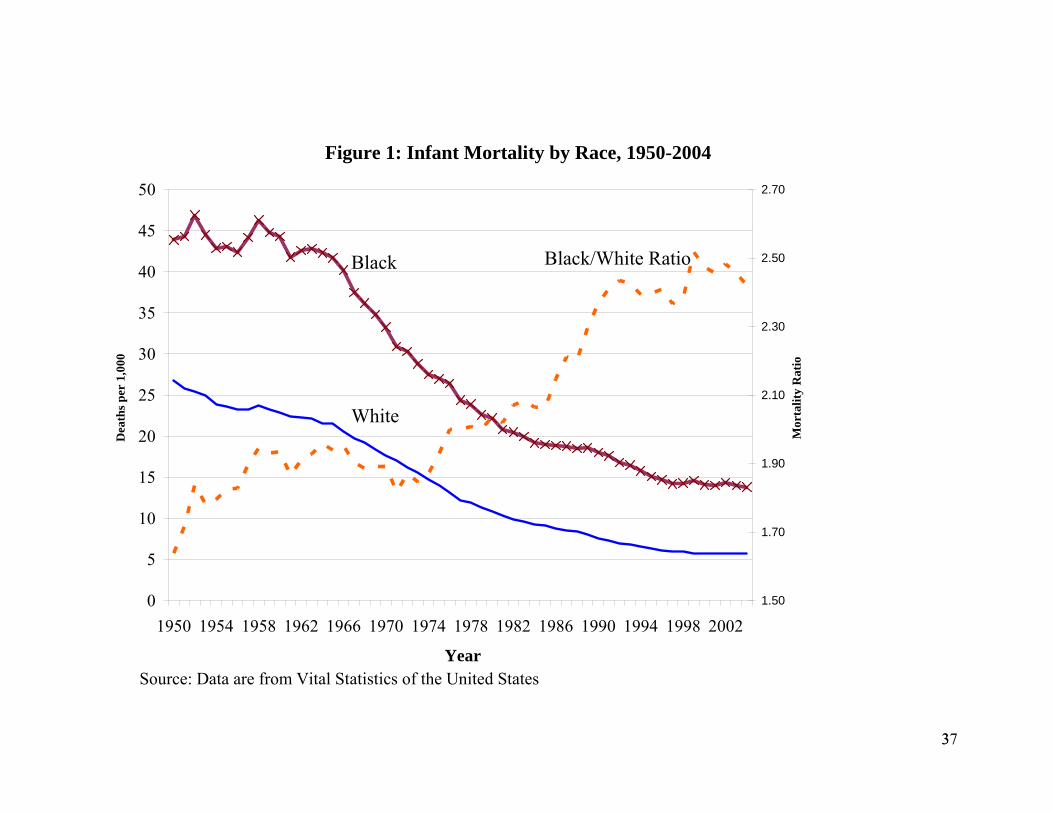
The latter half of the 20th century witnessed continued declines in infant mortality.
Figure 1 demonstrates that white infant mortality rates fell from 26 deaths per 1,000 live
births in 1950 to 5.7 in 2004. Black infants experienced higher rates of mortality at every
point in time, but infant mortality fell dramatically for blacks as well, from 43.9 deaths
per 1,000 live births in 1950 to 13.8 deaths per 1,000 births in 2004. The economic value
of this improvement is immense. Using the common estimate of $7 million per life, the
value of reduced mortality is roughly $210,000 per black birth and $140,000 per white
birth. With about 3 million black and white births per year in the United States, this
translates to roughly $550 billion per year.
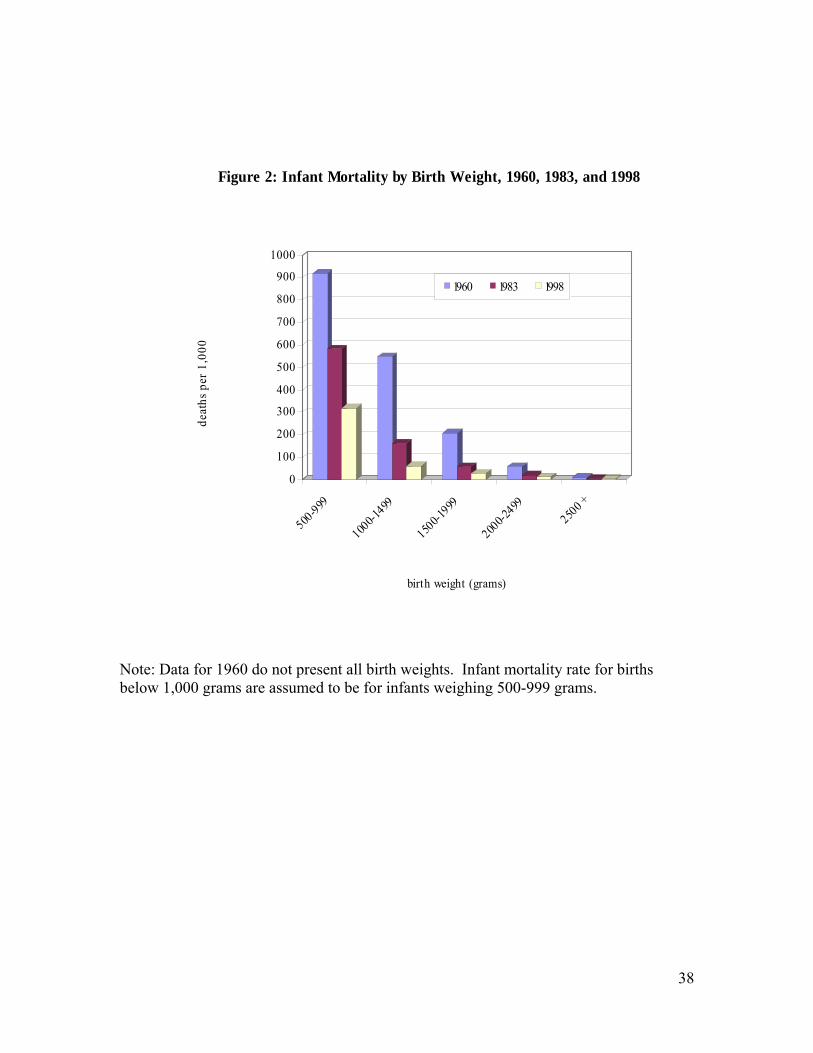
A good share of the reduction in infant mortality in the past half century has come
from reduced mortality of low birth weight infants, consistent with the concentration of
deaths among babies born low birth weight. In 2004, nearly 70 percent of infant deaths
occurred among the 8 percent of babies born weighing under 2500 grams. Figure 2
depicts the gain in survival by birth weight. Mortality for the lightest infants (500-999
grams) fell from nearly 90 percent in 1960 to 30 percent in 1998. Mortality among
infants weighing 1,000 to 1,499 grams fell from 50 percent to below 10 percent. Over
half of improved survival for all infants between 1960 and 2005 was a result of lower
mortality in low birth weight infants.3
Unlike early in the century, when improved nutrition and public health were the
keys to improved survival, advances in medical care were much more important in the
last few decades. Low birth weight infants die of many causes, but respiratory-related
3 Compared with the actual infant mortality rate of 6.86 per 1000 live births in 2005, the infant mortality rate would have been 14.79 in 2005 based solely on improved rates of survival among low birth weight infants. Compared to the 1960 mortality rate of 25.14, this represents 57 percent of the actual improvement in survival from 1960 to 2005.

10
conditions and congenital anomalies are particularly important. Among the very lightest,
or Very Low Birth Weight births (< 1500 g), respiratory-related conditions were the most
common cause of death in 1980. An infant’s lungs do not develop the capacity to
transfer oxygen into the blood until about 23 to 25 weeks of gestation, and even after that
time difficulties breathing are common. In the 1970s and 1980s, RDS and the related
bronchopulmonary dysplasia, which often resulted as a consequence of treatment with
ventilators, were the primary causes of mortality among Very Low Birth Weight infants,
and an important condition for low birth weight infants. At that time, RDS caused about
10,000 deaths per year. A major part of medical care for premature infants is helping
them breathe. Other major causes of infant death include sudden infant death syndrome,
congenital anomalies (especially heart defects), infections, and pneumonia.
Starting in the 1960s and continuing today, neonatal intensive care emerged as a
field of medicine to treat those conditions. Neonatal intensive care embodies hundreds of
small innovations often adopted from care for adults, but adapted to very light infants.
The innovations range from improving the technology for ventilation, improving the
ability to monitor newborn blood and respiratory function, to the development of
synthetic surfactant that can be administered to infants with RDS. These innovations do
not guarantee survival, but they increase its chances. Cutler and Meara (2000) show that
improved care during the neonatal period for critically ill infants collectively accounted
for essentially all of the reduction in neonatal mortality after 1960.
Even as overall infant mortality fell from 1950 on, the ratio of black to white
infant death rates rose. In 1950, the ratio of black to white infant mortality was about 1.6.
In the early 1980s, it was just above 2.0. By the late 1990s, the ratio was about 2.5. The
11
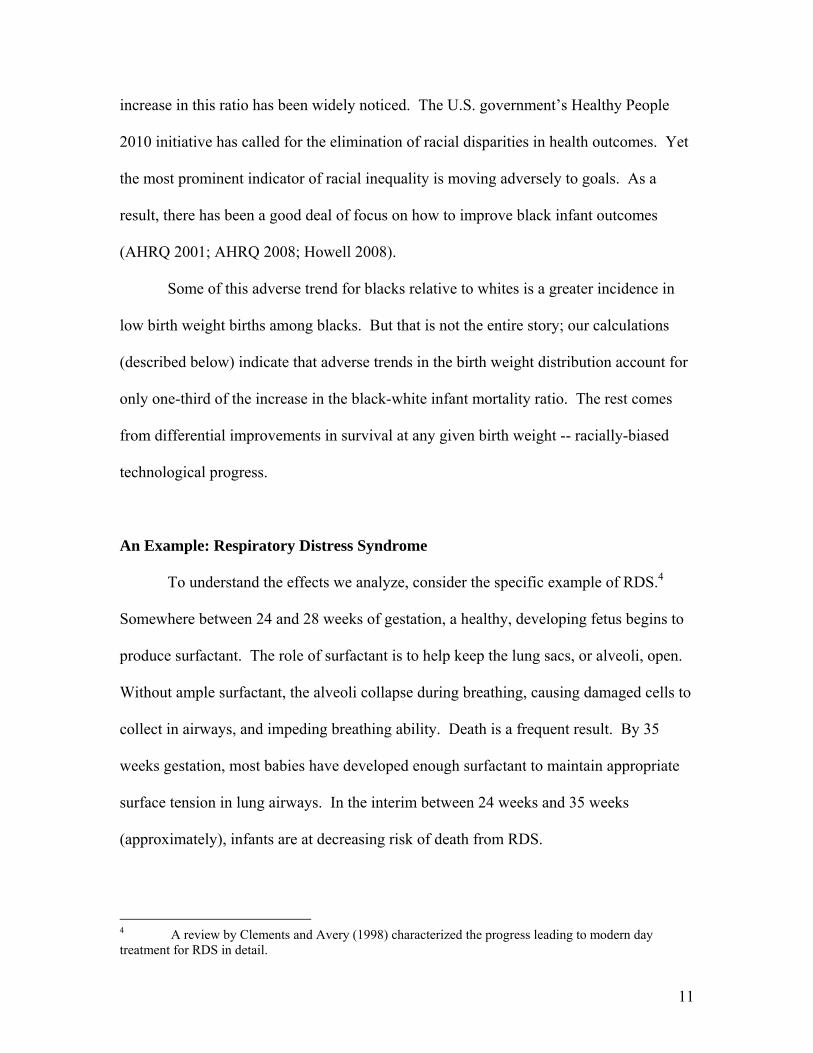
increase in this ratio has been widely noticed. The U.S. government’s Healthy People
2010 initiative has called for the elimination of racial disparities in health outcomes. Yet
the most prominent indicator of racial inequality is moving adversely to goals. As a
result, there has been a good deal of focus on how to improve black infant outcomes
(AHRQ 2001; AHRQ 2008; Howell 2008).
Some of this adverse trend for blacks relative to whites is a greater incidence in
low birth weight births among blacks. But that is not the entire story; our calculations
(described below) indicate that adverse trends in the birth weight distribution account for
only one-third of the increase in the black-white infant mortality ratio. The rest comes
from differential improvements in survival at any given birth weight -- racially-biased
technological progress.
An Example: Respiratory Distress Syndrome
To understand the effects we analyze, consider the specific example of RDS.4
Somewhere between 24 and 28 weeks of gestation, a healthy, developing fetus begins to
produce surfactant. The role of surfactant is to help keep the lung sacs, or alveoli, open.
Without ample surfactant, the alveoli collapse during breathing, causing damaged cells to
collect in airways, and impeding breathing ability. Death is a frequent result. By 35
weeks gestation, most babies have developed enough surfactant to maintain appropriate
surface tension in lung airways. In the interim between 24 weeks and 35 weeks
(approximately), infants are at decreasing risk of death from RDS.
4 A review by Clements and Avery (1998) characterized the progress leading to modern day treatment for RDS in detail.
12
The first observations about the biological process of RDS were made as early as
1903. However, it was not until after 1950 that surfactant was discovered in lung
extracts and eventually connected to what is now known as RDS. Between the late 1950s
and the early 1990s, a wave of government, industry, and academically sponsored
research helped to uncover the treatments for RDS. The first scientists experimented in
uncontrolled settings and reported the use of animal surfactant from rabbits and cows.
This early research, reported by 1980, spurred other researches to launch controlled
clinical trials using animal surfactant. Synthetic surfactant was developed later on, with
continuing trials to determine the appropriate timing of treatment and optimal delivery of
the drug. The effort was immense; an estimated 30,000 infants across North America,
Europe, and Japan were enrolled in clinical trials of surfactants by 1990. The results of a
subset of these, over 35 randomized controlled trials of 6,000 infants, have been reported.
Surfactant was approved for wide use by the FDA in August, 1990.
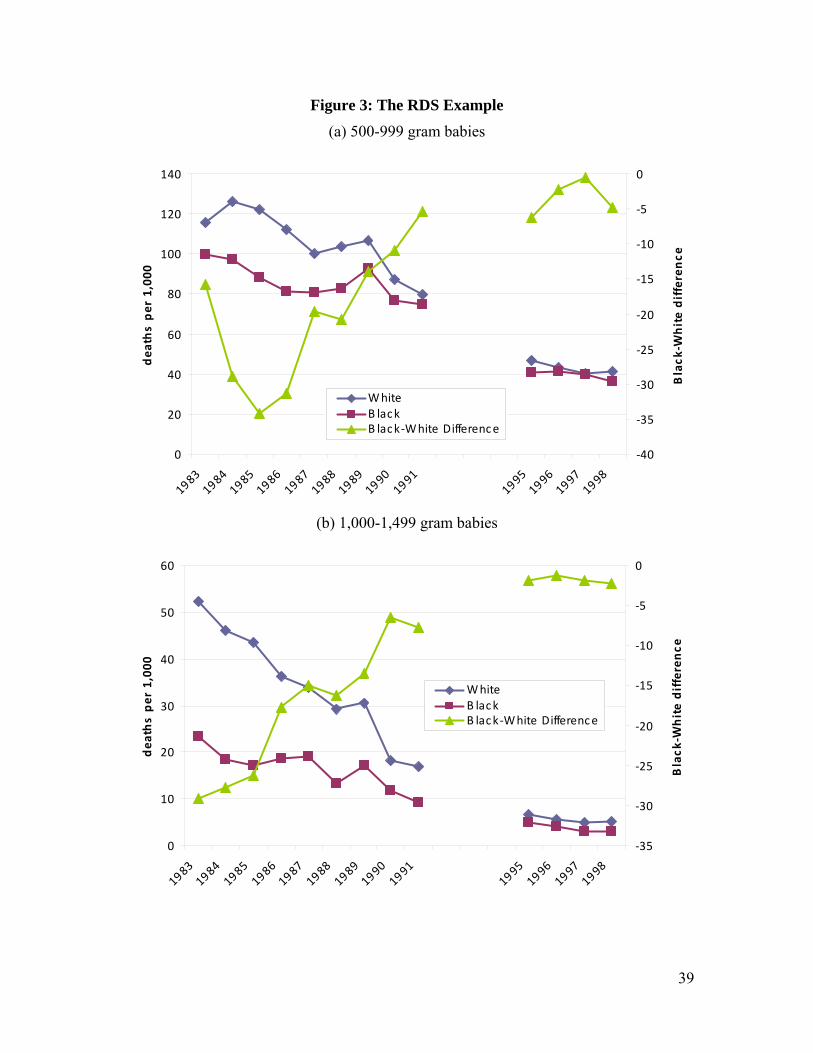
Figure 3 shows the resulting trend in RDS mortality. To hold constant need, we
present RDS mortality for two specific weight ranges: 500-999 grams, and 1,000-1,499
grams. These ranges correspond to the greatest respiratory impairment.
Both blacks and whites had high mortality rates from RDS in the early 1980s.
The rate for whites was about 120 deaths per 1,000 births for the lighter infants, and 50
deaths per 1,000 births for the heavier ones. The rate for blacks was high as well,
although a bit lower in each case. As noted above, black infants experience faster
maturation of lungs than white infants (Richardson et al. 1999; Berman et al. 2001).
Because surfactant was so promising, a large share of very low birth weight
babies was enrolled in clinical trials of the drug in the 1980s. Thus, the decline in RDS
13
mortality in the 1980s is likely due to surfactant. The approval of surfactant in 1990
coincided with a further immediate decline in death rates and a continuing decline over
the next few years. Between 1983 and 1998, RDS-related mortality for black and white
babies combined fell 63 percent among those weighing 500 to 999 grams, and by 87
percent among those weighing 1,000 to 1,499 grams. Because RDS was more important
for white babies than black babies, however, the reduction in RDS mortality led to
significantly greater survival improvements for whites than for blacks. Thus, even with
equal declines in mortality across racial groups, there was an increase in the racial gap in
outcomes. Between 1983 and 1998, we estimate that about 20 percent of the increase in
the ratio of black to white infant mortality resulted from improvements in RDS survival.
III. Data
To understand the sources of innovation in infant medical care, and the
consequences of those innovations, we use data on mortality by race and cause, and on
medical innovation. We describe the sources in turn.
The mortality data we employ come from cohort linked birth / infant death
(LBID) files produced by the National Center for Health Statistics (NCHS, various
years). These files contain a nearly universal sample of births and infant deaths in the
United States, formed by compiling data from birth and death certificates.5 Deaths that
occur within one year of birth are matched back with their birth certificates to create the
linked records. The files are organized by annual, calendar year birth cohorts, so deaths
5 In 1983 and 1984, some states created records for only half of births, randomly selected, but all deaths were entered. Birth records have weights to adjust for the sampling.

14
may be from the same year or the following year as long as they occur within 365 days of
birth.
The earliest LBID data is from 1960. However, only published tabulations of
those data exist, and the published tabulations do not have the detail we need. The next
year of linked data are from 1983, and are available in micro data. We thus use data from
1983-85 as our early time period. We pool years to improve death rate estimates for
relatively rare conditions. Fortunately, changes in infant mortality were ongoing in this
time period, and the profile of deaths by cause in 1983-85 is similar to that for 1960. As
figure 2 shows, mortality among low birth weight infants roughly halved between 1983
and 1998. Changes in the coding of cause of death after 1998 led to substantial
differences in cause-specific death rates among low birth weight births after that year, so
our later time period uses data from 1996-98.
From these records, we use information on birth weight, the mother’s race and
Hispanic ethnicity, singleton or plurality of birth, and the underlying cause of death. We
include births only to black or white mothers, excluding births to Hispanic mothers to
limit the effect of increasing immigration over time. We further exclude plural births to
limit the effect of secular changes in multiple births due to fertility treatment and a
contemporaneous rise in maternal age, which increases the risk of multiple births
(Blondel and Kaminski 2002).
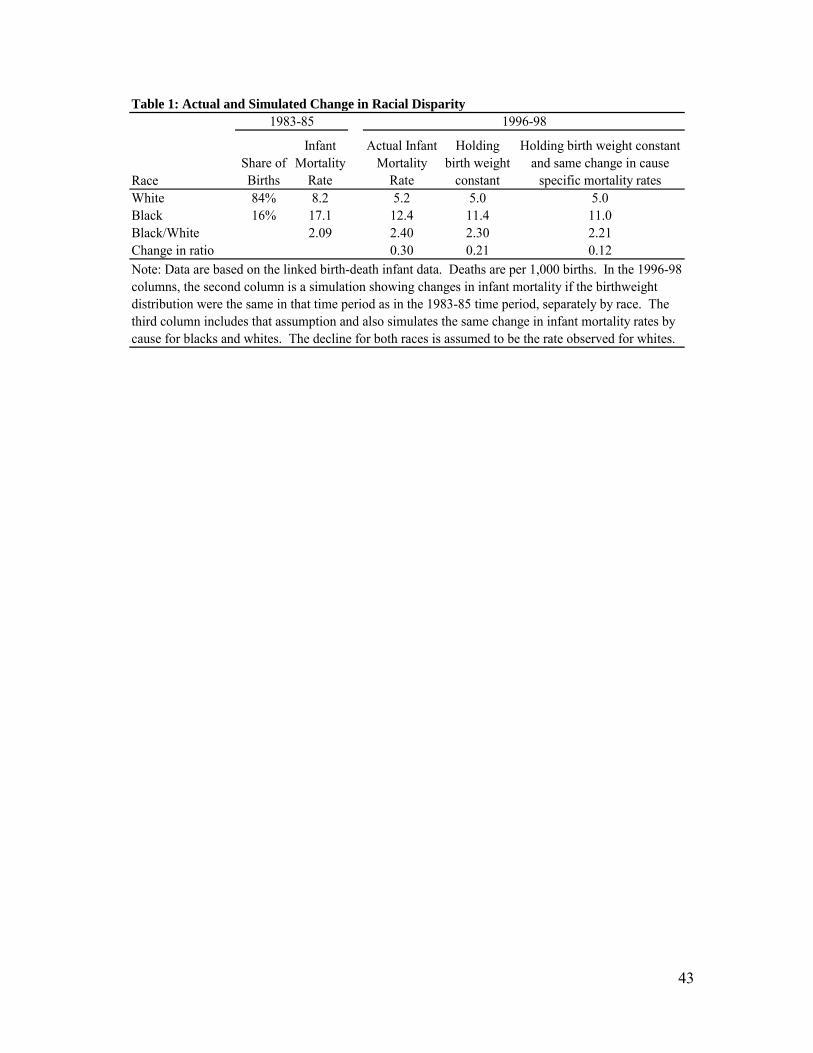
Summary statistics for the mortality data are shown in Table 1. In 1983-85, the
infant mortality rate for whites was 8.2 per 1,000 births and the rate for blacks was 17.1
per 1,000 births, for a corresponding black-white ratio of 2.09. Because blacks are a
smaller share of the population than whites (84 percent of births are for whites, excluding

15
Hispanics), however, there are many more white deaths than black deaths. Over 70
percent of infant deaths are among white infants.
The next column of the table shows the substantial reduction in infant mortality
over time. The infant mortality rate for whites fell by 37 percent between 1983-85 and
1996-98; the comparable reduction for blacks was 23 percent. As a result, the black-
white infant mortality ratio rose to 2.4, a 30 percentage point increase.
Our model does not address changes in the birth weight distribution over time.
We thus purge from the increase in the black-white mortality ratio the contribution of
unequal changes in birth weight by race. The fourth column of Table 1 shows a
simulation of infant mortality rates in 1996-98 if the race-specific distribution of births by
500 gram intervals had not changed over the time period. In both cases, infant mortality
rates would be lower, reflecting a trend towards more low birth weight infants over time.
But the changes are not large. Relative to the 30 percentage point increase in the
unadjusted black-white infant mortality ratio, the adjusted increase is 21 percentage
points.
In the final column, we modify the simulation further to give both races the same
percent reduction in deaths for each cause within 500 gram weight groups. This
eliminates changes in mortality ratios that would arise due to differential reductions in
mortality for a given cause, for example because access to care differs. The only reason
mortality changes differ in this scenario is because the causes of death differ for black
and white babies, and relatively more progress is made on some causes of death. This
simulation implies a 12 percentage point increase in the black-white ratio of infant
mortality. It is this aspect of rising mortality ratios, the part that arises from induced

16
innovation, that we will explore with the model and empirical analysis that follow. The
difference between the 21 percentage point growth in black-white mortality ratios and
this 12 percentage point increase, or 9 percentage points, represents changes that occurred
because of differential reductions in cause-specific mortality. That is, for some causes of
death, the rate at which infant deaths fell was faster for whites than for blacks.
A faster survival gain for whites may relate to several underlying factors. If a
disease manifests itself differently among white versus black infants, then efficacy of
treatment may vary across races because induced innovation focuses more on the
majority group, whites. If differential efficacy of treatments occurs, then we have
underestimated the role of induced innovation by ignoring this portion of the rising
mortality ratio, since we have no way to disentangle this from two other potential sources
of differential survival gains: access and quality of care. Differences in survival gains
might also reflect differential access to care, or differential quality of care conditional on
access. These latter two explanations do not relate to induced innovation.
Causes of death
For each infant who dies, the LBID data reports an underlying cause of death.
We use this to calculate death rates for specific conditions, separately by race. The
causes of death are grouped into categories based on an NCHS categorization of the
International Classification of Diseases -9th Revision (ICD-9) codes (the 61 Cause
Recode); the data appendix has details, including a full list of the condition categories.
After making adjustments to the causes, we identified 69 independent conditions, and one
residual category.
17
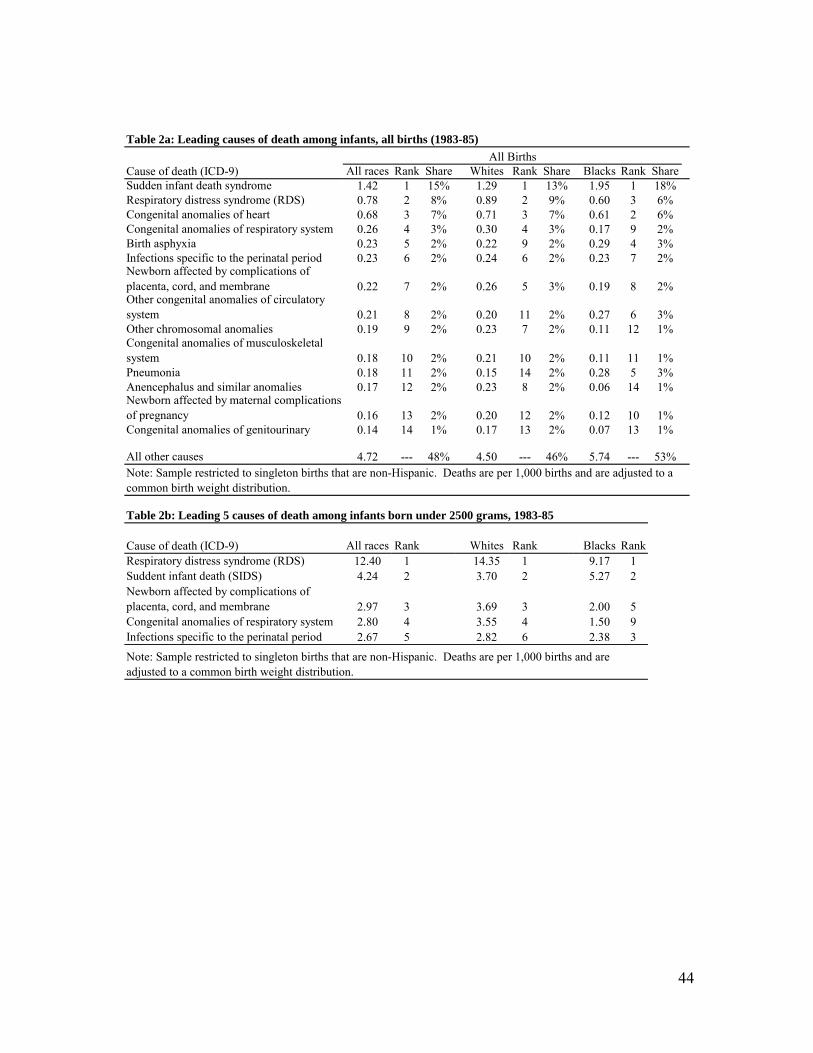
Death rates by leading cause of death are shown in Table 2a. To highlight the
role of differing causes within birth weights, we show mortality rates as if blacks and
whites had the same distribution of births in each weight category. The 14 conditions
listed in the table account for half of all infant deaths in 1983-85. The top three causes,
Sudden Infant Death Syndrome (SIDS), RDS, and congenital heart anomalies (heart
defects), stand out in magnitude, accounting for nearly 30 percent of deaths. SIDS
primarily occurs outside of the hospital setting and affects children of all birth weights.
The other causes are predominant in low birth weight babies.
The ranking of the conditions is different for blacks and whites. Respiratory
conditions tend to be a greater cause of death for whites than blacks. In contrast, issues
that arise because of conditions at the time of delivery such as birth asphyxia, or
complications relating to the placenta or umbilical cord are more likely to cause deaths
among blacks. For example, RDS is the second most important causes of death for
whites (accounting for 9.1 percent of deaths), but the third most important cause for
blacks (accounting for 5.6 percent of deaths). Among low birth weight infants, death
rates due to RDS in 1983-85 (14 per 1000) were over 50% higher than they were for
black infants (9 per 1000), as table 2b shows. Thus, any advance in RDS led to more
rapid reductions in infant mortality among whites.
Measures of Innovation
We construct two measures of innovation related to infant conditions: the number
of NIH grants associated with each condition, and the number of peer-reviewed journal
publications associated with each condition. Each of these has been used as a measure of

18
innovation in past studies. The grants data come from the Computer Retrieval of
Information on Scientific Projects (CRISP) database of biomedical research grants,
maintained by the National Institutes of Health. Each entry includes a thesaurus of key
words, allowing us to search for relevant grants. A complete list of our search terms is
available from the authors upon request. In cases when the use of multiple search terms
returned duplicate grants, we removed duplicates from the final counts. We created
counts of grants for two periods, 1975-82 and 1983-98, to capture new innovative effort
during our study period as well as earlier research that may have produced clinically
useful results between 1983 and 1998.6
The publications data come from the MEDLINE database of medical journal
articles, maintained by the National Library of Medicine. This database has an index of
hierarchical subject headings, so identifying articles that are relevant to a particular cause
of death can be accomplished by searching on the appropriate headings, when available.
First, we identified subject headings denoted as “major” topics, and searched on these
major topics that closely matched causes of death.7 In some cases, there were no “major”
topic subject headings matching the cause of death (or category) sufficiently, so we
searched for terms in the titles and abstracts of articles. A complete list of our search
commands is available from the authors upon request. For all causes, we counted articles
that were published during the study period (1983 to 1998).
6 We elected to start counting grants in 1975 due to data availability at the start of this study (at that time data were not available earlier), and because we felt that eight years offered ample time for grant activity to begin to disseminate through various channels. In practice, our results show little sensitivity to the choice of time period, except that earlier grants are somewhat stronger predictors of mortality changes compared with later grants. 7 We identified the appropriate headings by searching the database of subject headings for terms from the NCHS categories and ICD-9 entries.
19
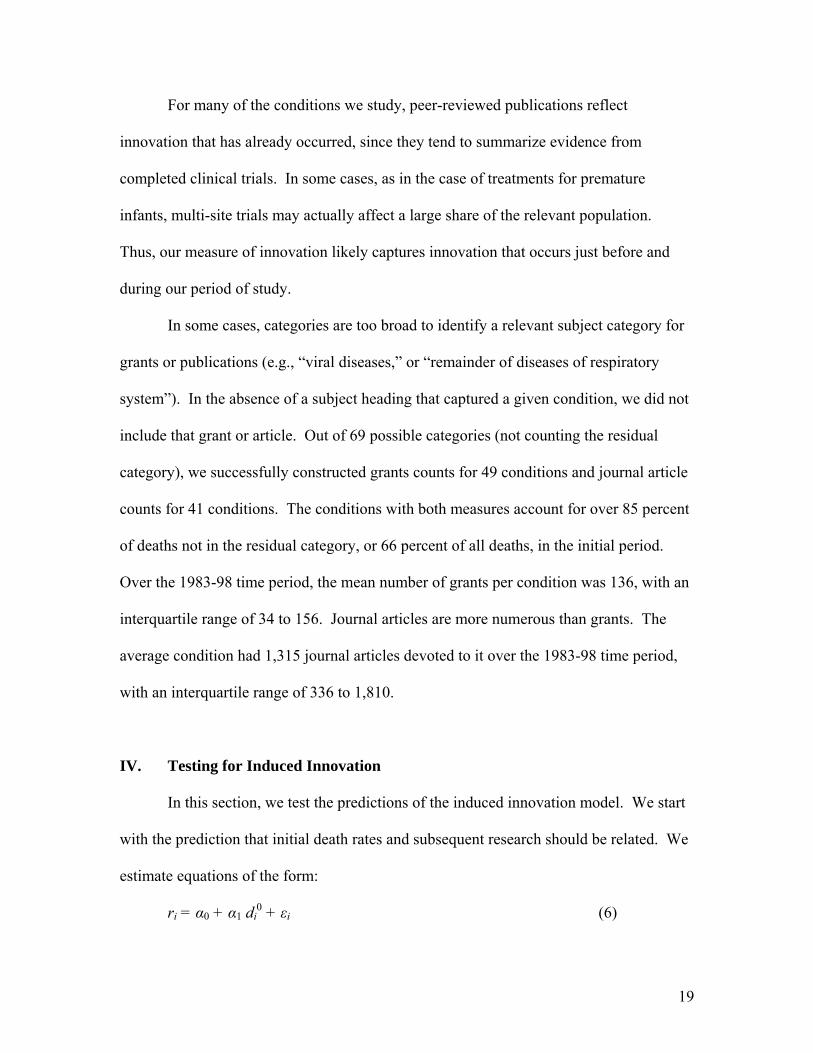
For many of the conditions we study, peer-reviewed publications reflect
innovation that has already occurred, since they tend to summarize evidence from
completed clinical trials. In some cases, as in the case of treatments for premature
infants, multi-site trials may actually affect a large share of the relevant population.
Thus, our measure of innovation likely captures innovation that occurs just before and
during our period of study.
In some cases, categories are too broad to identify a relevant subject category for
grants or publications (e.g., “viral diseases,” or “remainder of diseases of respiratory
system”). In the absence of a subject heading that captured a given condition, we did not
include that grant or article. Out of 69 possible categories (not counting the residual
category), we successfully constructed grants counts for 49 conditions and journal article
counts for 41 conditions. The conditions with both measures account for over 85 percent
of deaths not in the residual category, or 66 percent of all deaths, in the initial period.
Over the 1983-98 time period, the mean number of grants per condition was 136, with an
interquartile range of 34 to 156. Journal articles are more numerous than grants. The
average condition had 1,315 journal articles devoted to it over the 1983-98 time period,
with an interquartile range of 336 to 1,810.
IV. Testing for Induced Innovation
In this section, we test the predictions of the induced innovation model. We start
with the prediction that initial death rates and subsequent research should be related. We
estimate equations of the form:
ri = α0 + α1 di0 + εi (6)

20
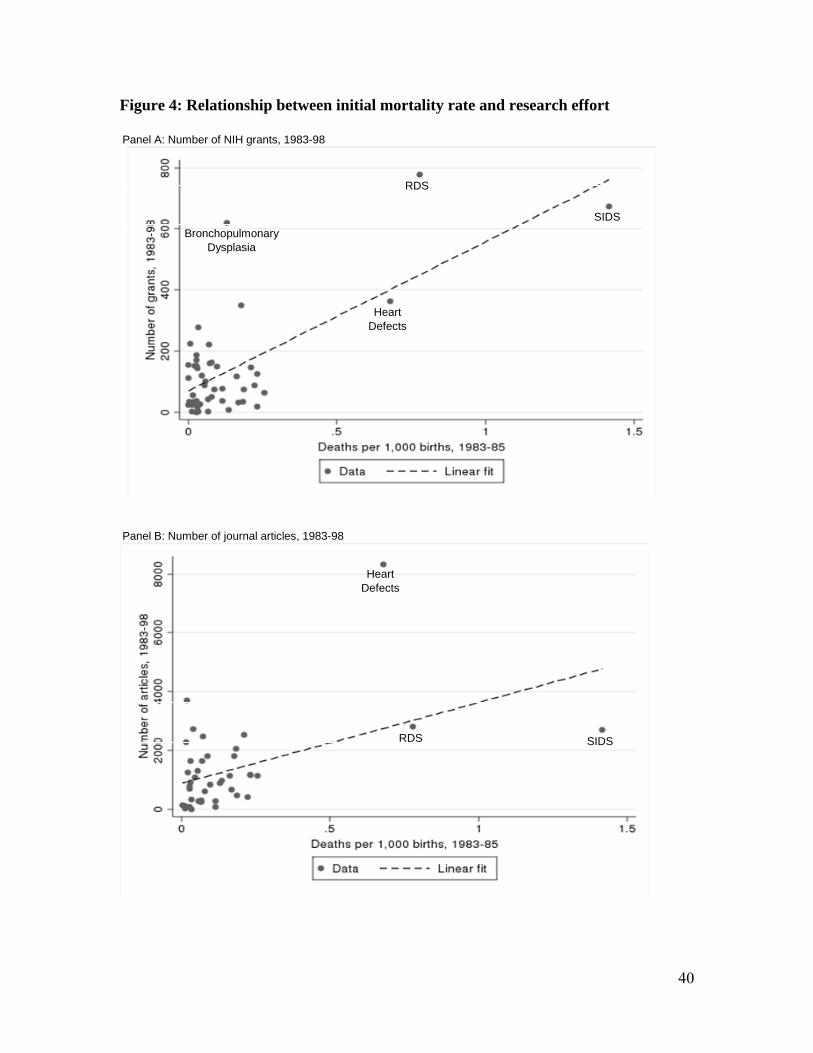
Figure 4 shows the relation between initial mortality rates and research
graphically. The upper panel shows that conditions with higher mortality rates in 1983-
85 have more journal articles devoted to them in the subsequent 15 years. The lower
figure shows that the same is true about the number of NIH grants. In both cases, a good
part of the line is defined by conditions with very high mortality rates. That is not
necessarily problematic, although we examine the sensitivity to this in our results below.
The magnitude of these relations, and potential other correlates, are shown in
Table 3. The first column shows the relation graphed in figure 4(a). Each death per
1,000 births due to a particular cause in 1983-85 is associated with nearly 500 NIH grants
on that disease from 1983 to 1998. The second column explores the sensitivity of this
result to SIDS, RDS, and heart defects. Without those three conditions, the coefficient
estimate is still positive, but smaller and not statistically significant. At least some of our
results are related to the fact that very big causes of death get more research effort. Since
there is no obvious reason to exclude these causes of death from our analysis, our
subsequent findings include those data.
The third column shows that each death per 1,000 births is associated with over
2,700 articles in the 1983-98 time period. As with the grant data, the coefficient falls and
is no longer statistically significant when SIDS, RDS, and heart defects are excluded. As
the fifth, sixth, and seventh columns show, the initial death rate is proxying for grant
activity – generally with a lag. Every additional grant in the 1975-82 time period is
associated with eight additional articles in the 1983-98 time period. More recent grants
have a smaller impact on articles, although this may be a function of the specific timing
of grants in this interval.

21
The second part of the analysis looks at the impact of initial mortality and
research on subsequent mortality changes. The theory predicts that declines in mortality
should be negatively correlated with higher initial mortality rates, and that this
relationship should be mediated by research activity. To look at the relation between
initial mortality and subsequent mortality changes, we estimate equations of the form:
iiii ε+dβ+β=dd 010
01 )/(ln (7)
Because of the heteroskedasticity induced by very low mortality rates, we express the
dependent variable in logarithms. We also weight the regressions by the theoretical
standard error.8
To control for changes in the birth weight distribution over time, we measure both
initial and final mortality using a constant birth weight distribution, equal to the birth
weight distribution at baseline in 1983-1985.
Taken literally, our theoretical model implies β0 = 0; a condition with no deaths
should have no research, and hence no change in the death rate. In reality, the constant
term captures a variety of departures from the model, such as a reduction in overall
mortality risk over time that results independent of research (due to improved nutrition,
for example), innovations that affect all conditions, and spillovers in research across
conditions. Also, to the extent that research allocation is non-optimal (for example, due
to political pressure) or the fi are not equal, β1 would be diminished and β0 would differ
from zero.
8 In particular, we weight the regressions by the inverse of the standard error of the dependent variable, the ln change in mortality. This is calculated using the Delta method and the asymptotic variances of the individual mortality rates.

22
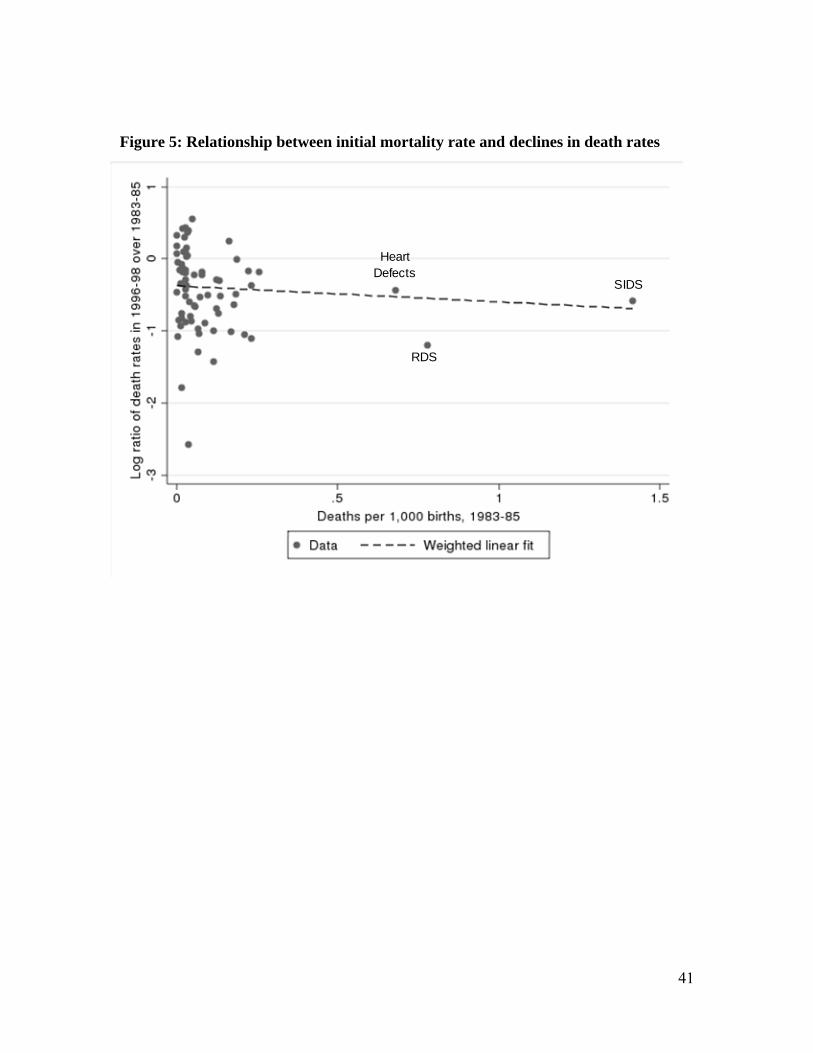
Figure 5 shows the relation between initial mortality and the decline in subsequent
mortality. There is a negative relationship between the two, again with a large
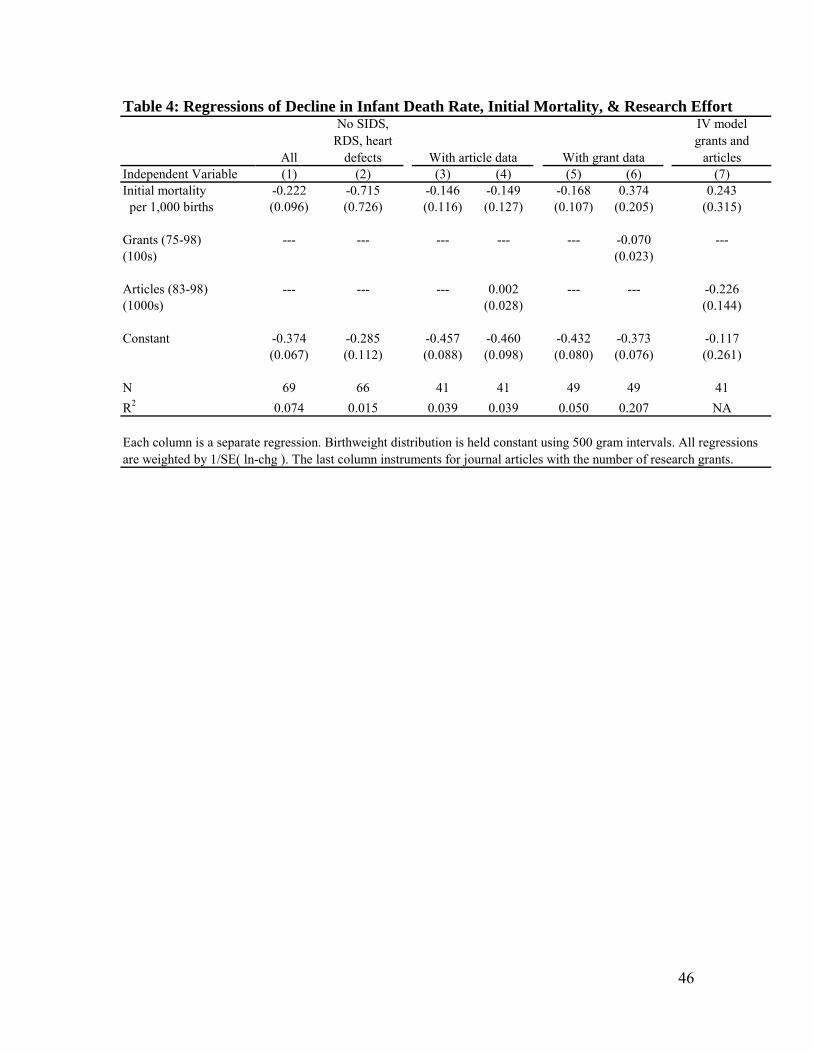
component played by SIDS, RDS, and heart defects. The first column of Table 4 shows
the corresponding regression coefficient. Across all 69 conditions, initial mortality is
negatively and statistically significantly related to mortality changes. The coefficient on
initial mortality implies that each additional death per 1,000 births is associated with a 20
percent greater mortality reduction. The constant term is negative and implies a 31
percent reduction in mortality over time. The relatively large magnitude indicates that
induced innovation is not the only effect in the data. As the second column shows, the
coefficient on initial mortality is actually larger excluding SIDS, RDS, and heart defects,
but the standard errors are larger as well. The big causes of death are a large part of our
story.
The theory suggests that the relation between initial mortality and subsequent
mortality declines will be mediated by the amount of research devoted to the disease. We
test this in the next columns. The third column shows the same regression as in column
(1), but limited to the 41 conditions for which we have journal article data. The
coefficient on initial mortality is negative, although smaller than the corresponding
coefficient in column (1). The fourth column shows very little relationship between
articles and changes in mortality. The coefficient on journal articles is near zero and
insignificant, and the coefficient on initial mortality remains negative.
The next two columns show the analogous results using research grants as the
measure of innovation. Initial mortality rates are negatively related to changes in
mortality, and this relationship is mediated by the number of research grants. Controlling

23
for the number of research grants, the initial mortality rate is positively related to
subsequent mortality changes, although not statistically significantly so.
Grants and research articles are both noisy measures of innovation. Assuming the
errors in each are uncorrelated, we can use one to instrument for the other and obtain
more efficient estimates. The last column of the table instruments for journal articles
with the number of research grants.9 The coefficient on research articles is now large and
negative, and the coefficient on initial mortality is positive. The constant is much lower
as well; more of the results are explained by the number of journal articles related to the
condition.
The results in Table 4 permit two estimates of the magnitude of induced
innovation. One estimate comes from the constant term. The difference between the
average rate of mortality reduction and the constant term in equation (7) indicates the
average mortality reduction due to induced innovation. The second measure is the
change in predicted final death rates attributable to the relation between initial mortality
and subsequent mortality. Because of the non-linear model,10 the first estimate
understates the inducement effect, while the second overstates it.
The constant term in the first column of Table 4 implies a decline of 31 percent in
mortality ( i.e. -.31 = e-.374-1) compared with the total reduction in the death rate of 37
percent. This suggests that about 6 percent, or one-sixth of the actual improvement in
mortality is due to induced innovation. The contribution of induced innovation implied
by the constant term in column 7, the instrumental variables regression that includes
9 The F-statistic on the instrument is 4.43. 10 In a linear model, these would be the same, but our model is not linear. The regression equation implies E[di
1] = di0 exp(β0) exp(β1 di
0), so the relative change di1/ di
0 – 1 equals exp(β0) exp(β1 di0) – 1. The
two measures of induced innovation are thus D1/D0 – [exp(β0) – 1], the impact calculated based on the constant term, and E[exp(β1 di
0)] – 1, the impact of the slope coefficient.

24
research articles devoted to the condition, is even larger. Using the estimate of β1 to
calculate predicted mortality, in contrast, generates a 7.5 percent decline in mortality (i.e.
E[exp(β1 di1)]-1), about one-fifth of the actual change.11 In column 7, using the implied
change in mortality from the coefficient on research articles, the magnitude of the role for
induced innovation rises to two thirds of the change.12 Conservatively choosing
estimates that are closer to our lower bound, we estimate that about one fifth of the
reduction in infant mortality over time is a result of induced innovation.
The role of competing risks
One potential concern about our estimates is the possibility of competing risks. If
vulnerable infants saved from one disease are still likely to die of another, decreased
mortality for one cause of death will not result in as great a reduction in total mortality.
Alternatively, if research in one disease leads to progress in another, we will understate
the impact of research on improved outcomes. However, infants differ from adults in the
sense that, unlike older adults who are at risk of multiple conditions (hypertension, high
cholesterol, and diabetes are all related to obesity, for example), infants saved from one
condition are much less likely to develop other conditions. In contrast to older adults,
infants face lower risks of disease incidence as they age, mitigating the disease risk
problem.
To test for competing risks though, we return to the RDS example. RDS is
important both because of its contribution to the overall evaluation and because
respiratory distress is so central to infant mortality. We take advantage of the time series
11 For this estimate, the death rate for the residual category was held constant. 12 For this estimate, the death rates for all categories without publications data were held constant. The implied change in mortality is a 24 percent decline.
25
variation to look for competing risks. If a substantial portion of infants in low birth
weight groups who died from RDS were at risk from other diseases as well, we would
expect years with large drops in the RDS death rate to have smaller reductions in deaths
from other causes.
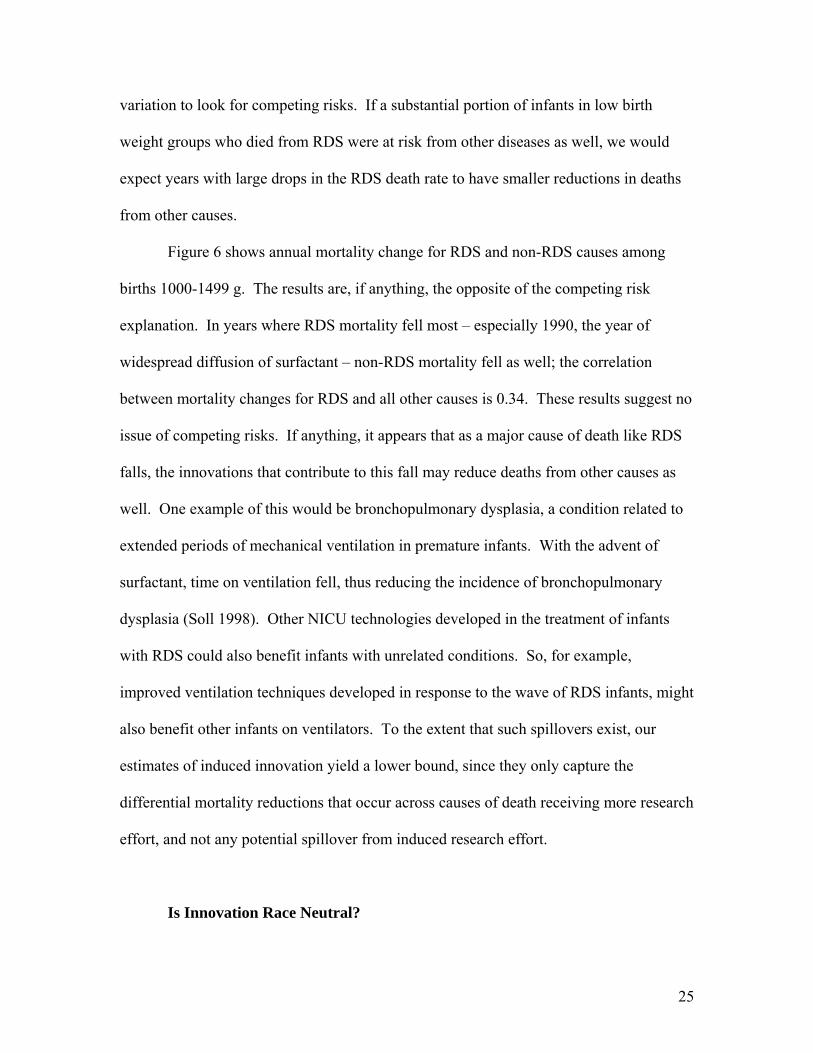
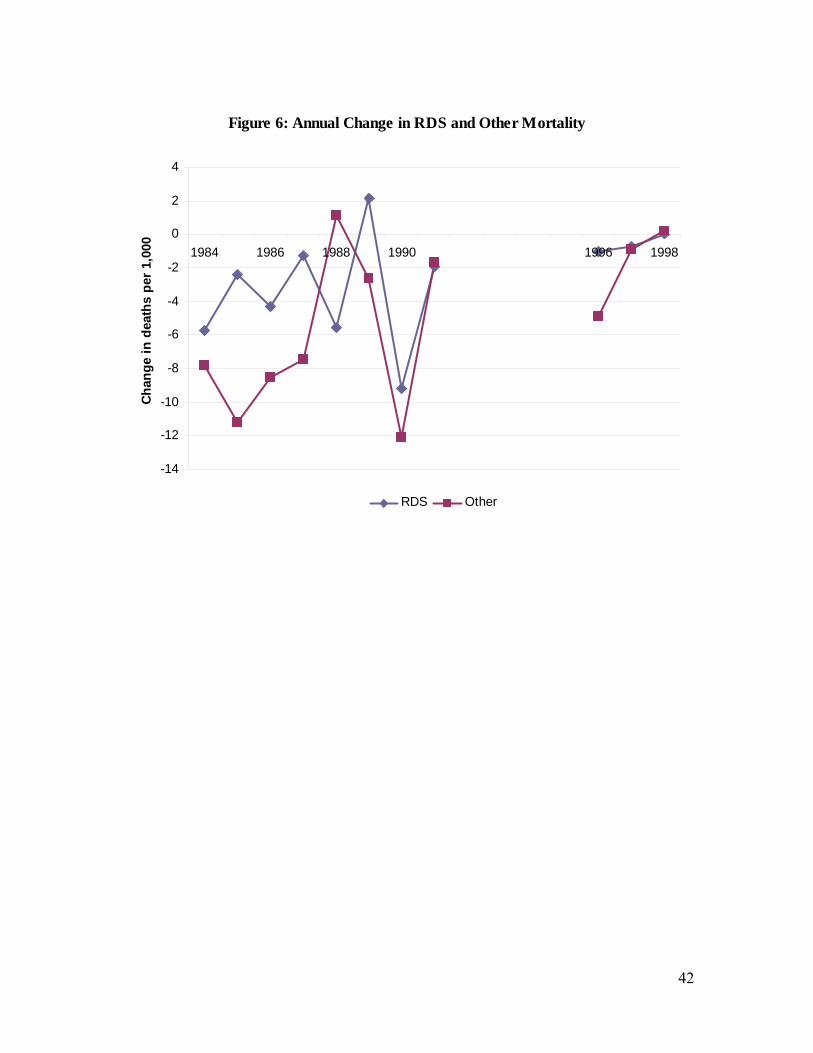
Figure 6 shows annual mortality change for RDS and non-RDS causes among
births 1000-1499 g. The results are, if anything, the opposite of the competing risk
explanation. In years where RDS mortality fell most – especially 1990, the year of
widespread diffusion of surfactant – non-RDS mortality fell as well; the correlation
between mortality changes for RDS and all other causes is 0.34. These results suggest no
issue of competing risks. If anything, it appears that as a major cause of death like RDS
falls, the innovations that contribute to this fall may reduce deaths from other causes as
well. One example of this would be bronchopulmonary dysplasia, a condition related to
extended periods of mechanical ventilation in premature infants. With the advent of
surfactant, time on ventilation fell, thus reducing the incidence of bronchopulmonary
dysplasia (Soll 1998). Other NICU technologies developed in the treatment of infants
with RDS could also benefit infants with unrelated conditions. So, for example,
improved ventilation techniques developed in response to the wave of RDS infants, might
also benefit other infants on ventilators. To the extent that such spillovers exist, our
estimates of induced innovation yield a lower bound, since they only capture the
differential mortality reductions that occur across causes of death receiving more research
effort, and not any potential spillover from induced research effort.
Is Innovation Race Neutral?

26
In our model, medical innovation is race-neutral: doctors and research funders
seek to reduce the major causes of death, whether they affect blacks or whites. This may
not be right, however. For example, research might be tilted toward conditions that
whites suffer from, ignoring conditions that are common among blacks.
One way to test this is to differentiate black and white deaths in the equation for
subsequent mortality changes. Consider equation (8), an expanded version of equation
(7):
iiiii ε+dbβ+dwβ+β=dd 02
010
01 )/(ln (8)
where dw and db refer to race-specific deaths as a share of all births. Thus, dw and db are
not standard death rates since the race-specific number of deaths are divided by the sum
of black and white births. One can thus view dw as capturing the death rate from the
bundle of causes that kill white infants and db as capturing the death rate from the bundle
of causes that kill blacks. A theory of racially biased innovation suggests that black
deaths should count less than white deaths, i.e., |β|<|β| 12 .
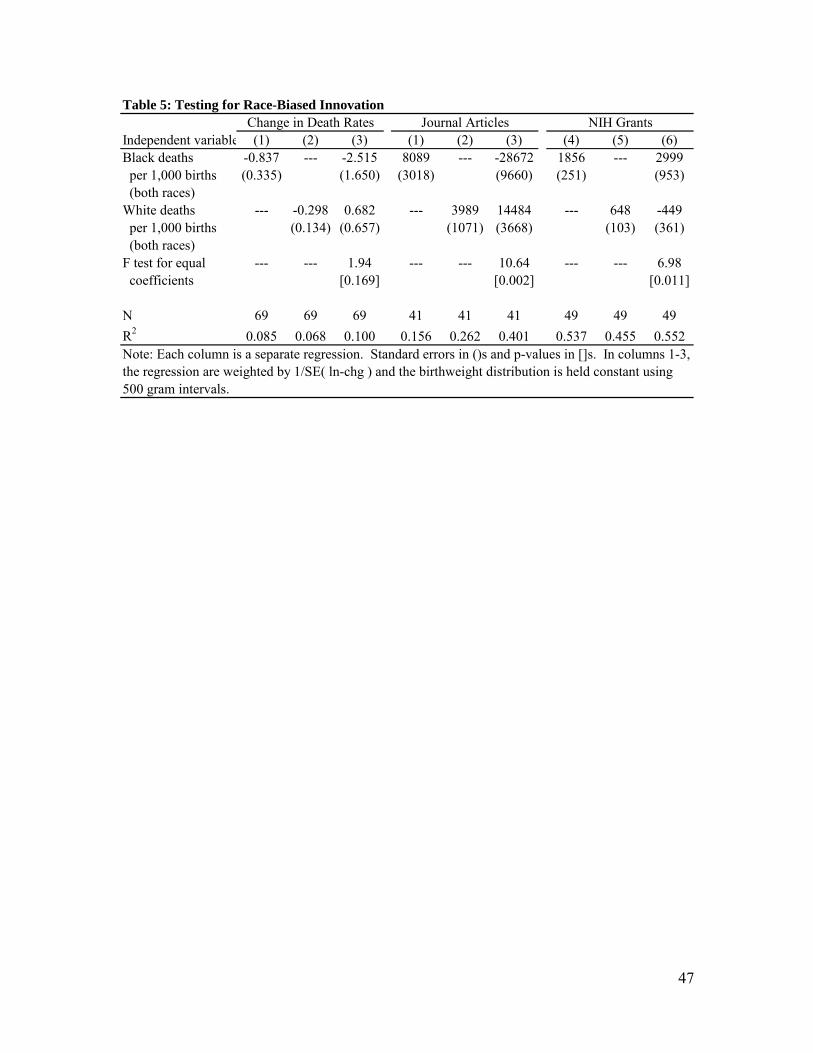
Table 5 shows results of regressions separating black and white deaths. The first
three columns present results for the impact of initial mortality on subsequent changes in
mortality. Independently, black deaths count more than white deaths for subsequent
mortality changes (column 1 versus column 2), although the standard errors on each are
large. The regression has difficulty determining the relative weight to put on the two
when included in the regression jointly (column 3), but the coefficient on black deaths is
negative while the coefficient on white deaths is positive. However these coefficients are
not statistically different from each other.
27
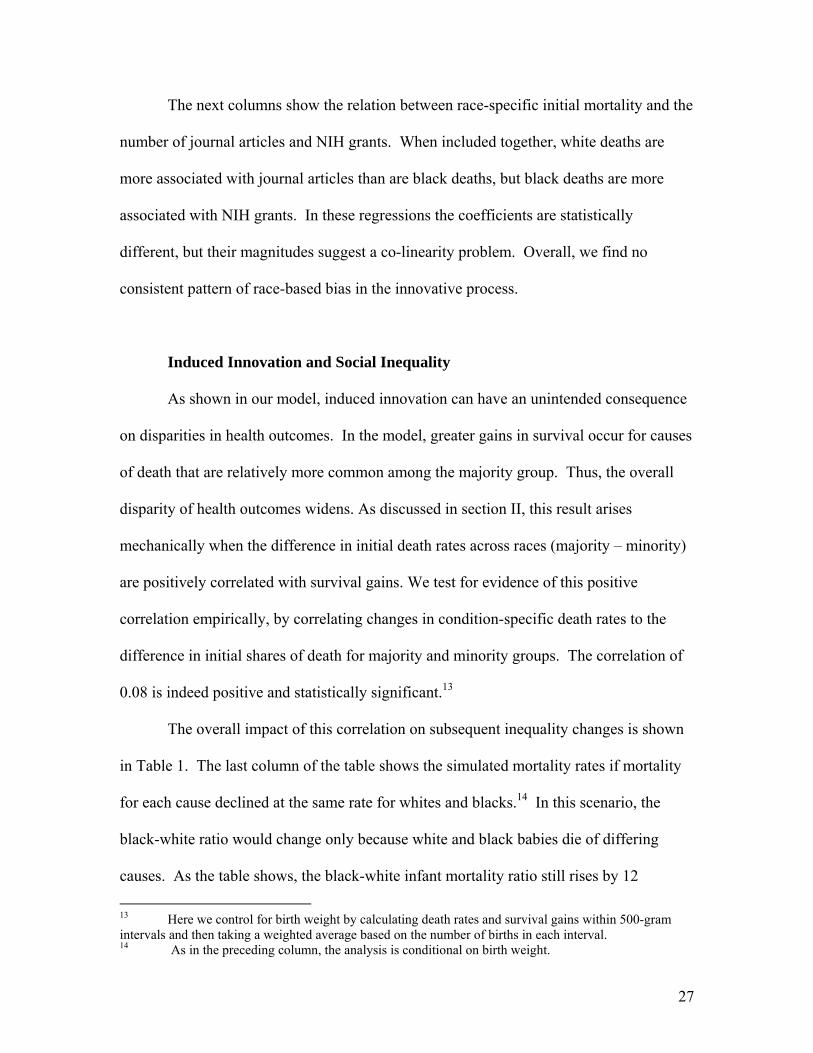
The next columns show the relation between race-specific initial mortality and the
number of journal articles and NIH grants. When included together, white deaths are
more associated with journal articles than are black deaths, but black deaths are more
associated with NIH grants. In these regressions the coefficients are statistically
different, but their magnitudes suggest a co-linearity problem. Overall, we find no
consistent pattern of race-based bias in the innovative process.
Induced Innovation and Social Inequality
As shown in our model, induced innovation can have an unintended consequence
on disparities in health outcomes. In the model, greater gains in survival occur for causes
of death that are relatively more common among the majority group. Thus, the overall
disparity of health outcomes widens. As discussed in section II, this result arises
mechanically when the difference in initial death rates across races (majority – minority)
are positively correlated with survival gains. We test for evidence of this positive
correlation empirically, by correlating changes in condition-specific death rates to the
difference in initial shares of death for majority and minority groups. The correlation of
0.08 is indeed positive and statistically significant.13
The overall impact of this correlation on subsequent inequality changes is shown
in Table 1. The last column of the table shows the simulated mortality rates if mortality
for each cause declined at the same rate for whites and blacks.14 In this scenario, the
black-white ratio would change only because white and black babies die of differing
causes. As the table shows, the black-white infant mortality ratio still rises by 12
13 Here we control for birth weight by calculating death rates and survival gains within 500-gram intervals and then taking a weighted average based on the number of births in each interval. 14 As in the preceding column, the analysis is conditional on birth weight.

28
percentage points in this scenario. Thus, about one-third of the increase in the black-
white mortality disparity, (.12/.30), is a result of induced innovation. Another one-third,
(.21-.12)/.30, results from the differentially greater reduction in mortality for whites
relative to blacks within causes. The remaining one-third, (.30-.21)/.30, is a result of
differential growth of low birth weight babies among blacks. Notably, the magnitude of
rising black-white mortality ratio is comparable to that of the role of induced innovation
in mortality reductions documented earlier. In other words, black-white infant mortality
ratios in the US are responsive to induced innovation, growing with induced
improvements in survival for infants.
A Falsification Exercise: Education-Based Disparities
One concern about our findings is that we may be measuring the impact of being
in an economically disadvantaged group, not necessarily a minority population group. It
may be that the economically disadvantaged are doing worse over time, regardless of
whether they are majority or minority groups. Since blacks are both a population
minority and economically disadvantaged, we cannot completely differentiate between
these theories with our data.
We test this using data on deaths by maternal education, restricting the sample to
non-Hispanic whites. Women with some college education represent a minority of births
(40 percent), but are better off economically. Thus, if the effect we find is a result of
economic disadvantage, babies of women with some college should fare better over time
than babies of women who never attended college. If the result is due to population size,
babies of women who attended college should fare no better than babies of less educated

29
women. Table 6 displays numbers similar to those in table 1, but dividing mothers into
groups based on college attendance. As the second column of the table shows, women
who never attended college have a 53 percent higher mortality rate in 1983-85 than
women who attended some college. That ratio increased to 88 percent in 1996-98.
About one-third of that increase is a result of adverse trends in the birth weight
distribution for women who did not attend college relative to women who did. Our
model does not explain such effects. The entirety of the remainder is a result of more
rapid declines in mortality within cause for women with some college education. Indeed,
as the last column shows, there is no increase in the mortality ratio, or if anything a slight
decrease, when mortality reductions by cause are assumed to be the same. Thus, our
results do not suggest that the causes of death predominant among the economically
advantaged are declining by more than the causes among the economically
disadvantaged. Indeed, the two seem about the same.
The reason why women with some college education benefitted more from
progress within causes of death than women without any college education is not clear. It
may reflect differences in access to care or the quality of that care, which we do not
explore. Overall, however, these results support the conclusion that it is induced
innovation resulting from minority status itself that leads to less rapid mortality declines
for blacks, and hence lagging health outcomes.
VII. CONCLUSIONS
The dynamics of the medical sector have been a subject of much debate. Most of
medical care cost increases are a result of technological progress (Newhouse, 1992), and

30
some studies suggest that health benefits emanate from the same source (Cutler, 2004;
Cutler, Rosen, and Vijan 2006).
For at least the last two decades, economists have speculated about the underlying
source of these technological innovations (Weisbrod, 1991). The idea that progress is a
result of perceived need has been common in the literature, although not tested to any
great extent. We test the importance of induced innovation by considering care for a
group that is particularly needy: low birth weight infants.
We reach two primary conclusions. First, there is a strong impact of induced
innovation on technological change. Disease conditions with higher initial mortality rates
had more grant effort devoted to them, saw more journal articles about them, and
experienced a greater reduction in subsequent mortality. Induced innovation explains
about 20 percent of the reduction in mortality over time.
But endogenous technology also benefits majority groups over minority groups.
Majority groups are of necessity a larger share of total deaths than are minority groups.
Thus, conditions that affect them more will receive more research attention. Our results
show that this leads to a significant increase in the disparity between blacks and whites as
innovation allows premature white newborns to “catch up” to their black counterparts,
who, for a given gestation and birth weight, tend to have better health.
Our results do not arise because medical research is racially biased; our best
estimates suggest that it is not. Rather, growing disparities result from the seemingly
benign tendency of ‘treating what we see’. If we want disparities to fall over time, our
results suggest that we will need to treat based on factors beyond the headline numbers.

31
References
Acemoglu, Daron, and Joshua Linn, “Market Size and Innovation: Theory and Evidence from the Pharmaceutical Market”, Quarterly Journal of Economics, 119 (2004), 1049-1090.
Agency for Healthcare Research and Quality, Excellence Centers To Eliminate Ethnic/Racial Disparities (EXCEED): Program Brief. Agency for Healthcare Research and Quality, Rockville, MD. 2001, (accessed July 9, 2009 at http://www.ahrq.gov/research/exceed.htm). AHRQ Publication No. 01-P021.
Agency for Healthcare Research and Quality. 2007 National Healthcare Disparities Report. Rockville, MD: U.S. Department of Health and Human Services, Agency for Healthcare Research and Quality; February 2008. AHRQ Pub. No. 08-0041.
Aghion, Philippe and Peter Howitt, “A Model of Growth through Creative Destruction”, Econometrica, 60 (1992), 323-351.
Berman, Susan K, Milenko J. Tanasijevic, Juan G. Alvarez, Jack Ludmir, E. Lieberman and D. K. Richardson, “Racial Differences in Predictive Value of the TDx FLM S/A Assay,” American Journal of Obstetrics and Gynecology, 175 (1996), 73-77.
Bhattacharya, Jay, and Mikko Packalen, “Is Medicine an Ivory Tower? Induced Innovation, Technological Opportunity, and For-Profit Vs. Non-Profit Innovation”, NBER Working Paper No. 13862, March 2008.
Blondel, Beatrice, and Monique Kaminski, “Trends in the Occurrence, Determinants, and Consequences of Multiple Births, Seminars in Perinataology, 26 (2002), 239-249.
Centers for Disease Control and Prevention, “Racial/Ethnic Disparities in Infant Mortality --- United States, 1995—2002,” Morbidity and Mortality Weekly Report, 54 (2005), 553-56.
Cutler, David M., Your Money or Your Life, (New York: Oxford University Press.) Cutler, David M. and Ellen Meara, “The Technology of Birth: Is It Worth It?” in Alan
Garber, ed., Frontiers in Health Policy Research, Volume 3. (Cambridge, MA: MIT Press, 2000, 33-67.)
Cutler, David M., Allison B. Rosen, and Sandeep Vijan, “The Value of Medical Spending in the United States,” 1960-2000, The New England Journal of Medicine, 355 (2006), 920-927.
Grossman, Gene and Elhanan Helpman, Innovation and Growth in the Global Economy. (Cambridge, MA: Harvard University Press, 1991.)
Howell, Elizabeth A., “Racial Disparities in Infant Mortality: A Quality of Care Perspective,” Mount Sinai Journal of Medicine: A Journal of Translational and Personalized Medicine, 75 (2008), 31-35.
Hulsey Thomas C., Greg R. Alexander, Pierre Y. Robillard, David J. Annibale, and Andrea Keenan, “Hyaline Membrane Disease: the Role of Ethnicity and Maternal Risk Characteristics.” American Journal of Obstetrics and Gynecology, 168 (1993), 572-576.
Kremer, Michael, “Pharmaceuticals and the Developing World”, Journal of Economic Perspectives, 16 (2002), 67-90.
Lichtenberg, Frank, “The Allocation of Publicly Funded Biomedical Research,” in Ernst Berndt and David Cutler, eds., Medical Care Output and Productivity. (Chicago: University of Chicago Press, 2001.)

32
Jorgenson, Dale W. and Kevin.J. Stiroh, “Raising the Speed Limit: U.S. Economic Growth in the Information Age,” Brookings Papers on Economic Activity, 2000 (2000), 125-212.
National Center for Health Statistics, Linked Birth Infant Death Data, Various Years. (Hyattsville, MD.)
Newell, Richard, Adam Jaffee, and Robert Stavins, “The Induced Innovation Hypotehsis and Energy-Saving Technological Change,” Quarterly Journal of Economics, 114 (1999), 907-940.
Newhouse, Joseph P., “Medical Care Costs: How Much Welfare Loss?” Journal of Economic Perspectives, 6 (1992), 3-21.
Popp, David, “Induced Innovation and Energy Prices,” American Economic Review, 92 (2002), 160-180.
Richardson, Douglas K. and John S. Torday, “Racial Differences in Predictive Value of the Lecithin-sphingomyelin Ratio,” American Journal of Obstetrics and Gynecology, 170 (1994) 1273-1278.
Romer, Paul M., “Endogenous Technological Change,” Journal of Political Economy, 98 (1990), S71-S102.
Schmookler, Jacob, Invention and Economic Growth. (Cambridge, MA: Harvard University Press, 1966.)
Soll, Roger, “Synthetic Surfactant for Respiratory Distress Syndrome in Preterm Infants,” Cochrane Database of Systematic Reviews, 1998, Issue 3.
Weisbrod, Burton, “The Health Care Quadrilemma: An Essay on Technological Change, Insurance, Quality of Care and Cost Containment”, Journal of Economic Literature, 29 (1991), 523-552.
33
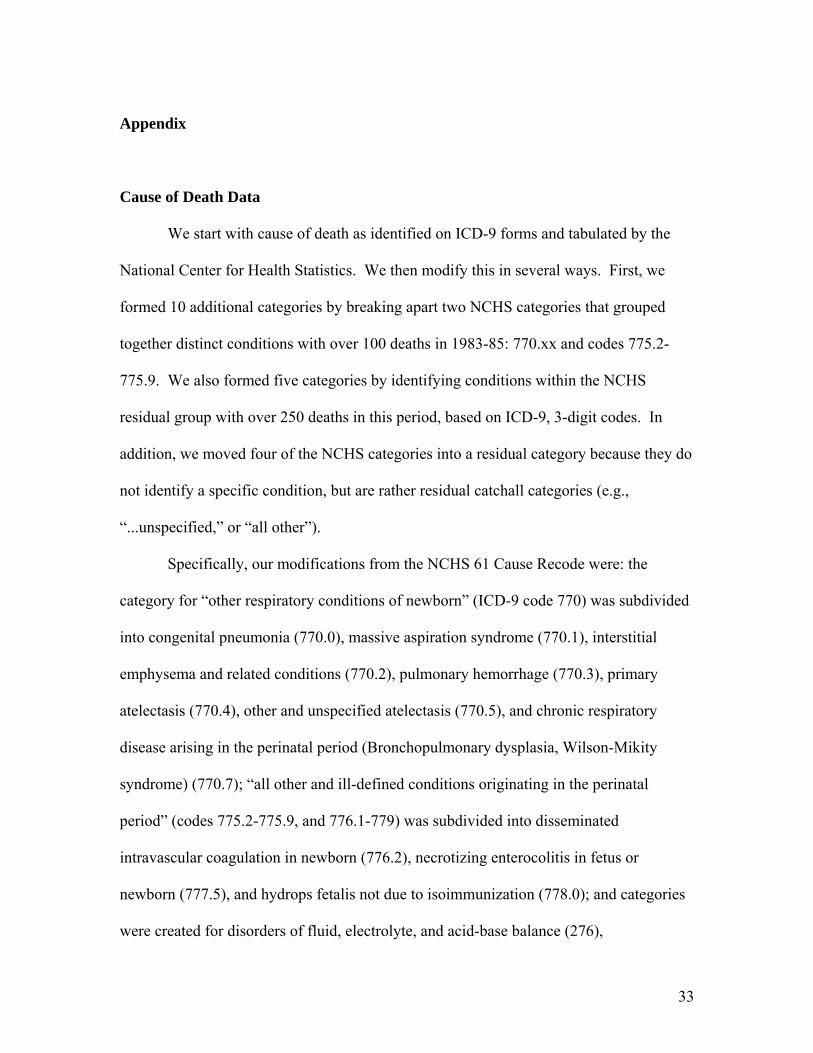
Appendix
Cause of Death Data
We start with cause of death as identified on ICD-9 forms and tabulated by the
National Center for Health Statistics. We then modify this in several ways. First, we
formed 10 additional categories by breaking apart two NCHS categories that grouped
together distinct conditions with over 100 deaths in 1983-85: 770.xx and codes 775.2-
775.9. We also formed five categories by identifying conditions within the NCHS
residual group with over 250 deaths in this period, based on ICD-9, 3-digit codes. In
addition, we moved four of the NCHS categories into a residual category because they do
not identify a specific condition, but are rather residual catchall categories (e.g.,
“...unspecified,” or “all other”).
Specifically, our modifications from the NCHS 61 Cause Recode were: the
category for “other respiratory conditions of newborn” (ICD-9 code 770) was subdivided
into congenital pneumonia (770.0), massive aspiration syndrome (770.1), interstitial
emphysema and related conditions (770.2), pulmonary hemorrhage (770.3), primary
atelectasis (770.4), other and unspecified atelectasis (770.5), and chronic respiratory
disease arising in the perinatal period (Bronchopulmonary dysplasia, Wilson-Mikity
syndrome) (770.7); “all other and ill-defined conditions originating in the perinatal
period” (codes 775.2-775.9, and 776.1-779) was subdivided into disseminated
intravascular coagulation in newborn (776.2), necrotizing enterocolitis in fetus or
newborn (777.5), and hydrops fetalis not due to isoimmunization (778.0); and categories
were created for disorders of fluid, electrolyte, and acid-base balance (276),
34
cardiomyopathy (425), primary pulmonary hypertension (416.0), cardiac arrest (427.5),
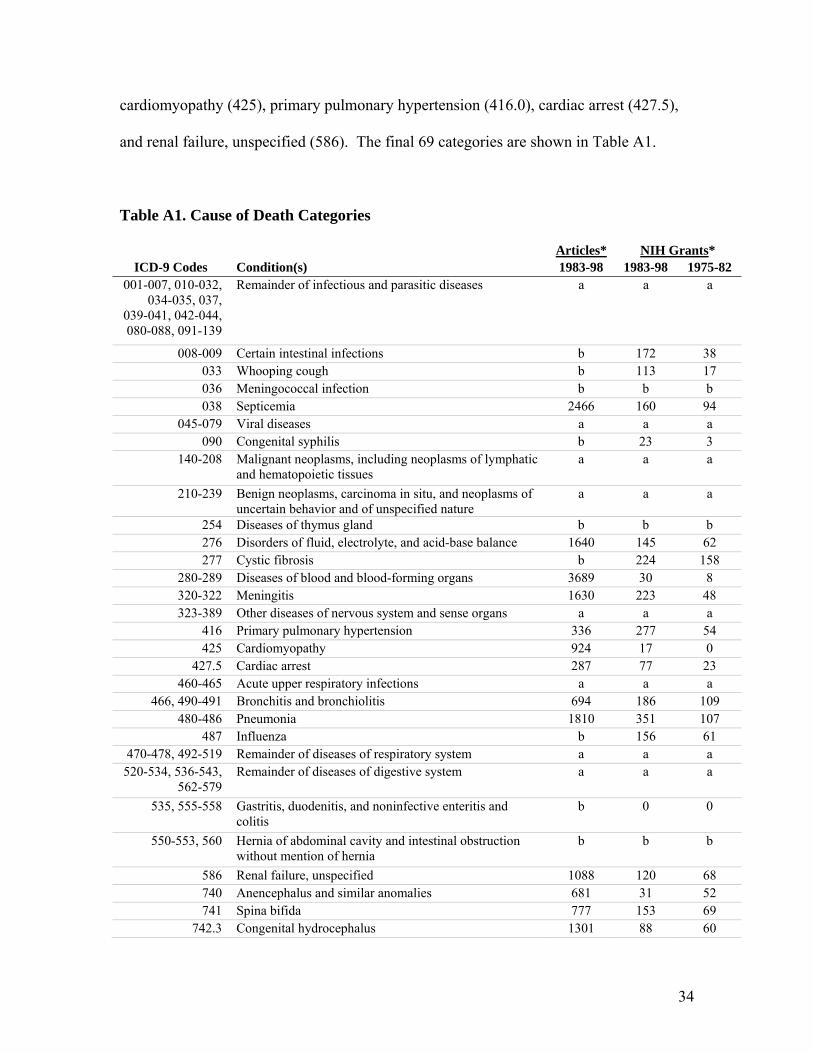
and renal failure, unspecified (586). The final 69 categories are shown in Table A1.
Table A1. Cause of Death Categories
Articles* NIH Grants* ICD-9 Codes Condition(s) 1983-98 1983-98 1975-82
001-007, 010-032, 034-035, 037,
039-041, 042-044, 080-088, 091-139
Remainder of infectious and parasitic diseases a a a
008-009 Certain intestinal infections b 172 38 033 Whooping cough b 113 17 036 Meningococcal infection b b b 038 Septicemia 2466 160 94
045-079 Viral diseases a a a 090 Congenital syphilis b 23 3
140-208 Malignant neoplasms, including neoplasms of lymphatic and hematopoietic tissues
a a a
210-239 Benign neoplasms, carcinoma in situ, and neoplasms of uncertain behavior and of unspecified nature
a a a
254 Diseases of thymus gland b b b 276 Disorders of fluid, electrolyte, and acid-base balance 1640 145 62 277 Cystic fibrosis b 224 158
280-289 Diseases of blood and blood-forming organs 3689 30 8 320-322 Meningitis 1630 223 48 323-389 Other diseases of nervous system and sense organs a a a
416 Primary pulmonary hypertension 336 277 54 425 Cardiomyopathy 924 17 0
427.5 Cardiac arrest 287 77 23 460-465 Acute upper respiratory infections a a a
466, 490-491 Bronchitis and bronchiolitis 694 186 109 480-486 Pneumonia 1810 351 107
487 Influenza b 156 61 470-478, 492-519 Remainder of diseases of respiratory system a a a
520-534, 536-543, 562-579
Remainder of diseases of digestive system a a a
535, 555-558 Gastritis, duodenitis, and noninfective enteritis and colitis
b 0 0
550-553, 560 Hernia of abdominal cavity and intestinal obstruction without mention of hernia
b b b
586 Renal failure, unspecified 1088 120 68 740 Anencephalus and similar anomalies 681 31 52 741 Spina bifida 777 153 69
742.3 Congenital hydrocephalus 1301 88 60

35
Articles* NIH Grants* ICD-9 Codes Condition(s) 1983-98 1983-98 1975-82
742.0-742.2, 742.4-742.9, 743
Other congenital anomalies of central nervous system and eye
b 52 0
745-746 Congenital anomalies of heart 8334 364 375 747 Other congenital anomalies of circulatory system 2525 147 61 748 Congenital anomalies of respiratory system 1137 64 5
749-751 Congenital anomalies of digestive system 2717 27 3 752-753 Congenital anomalies of genitourinary system 980 8 0 754-756 Congenital anomalies of musculoskeletal system 2047 34 12
758 Down's syndrome 1242 153 156 758.1-758.9 Other chromosomal anomalies 474 74 1
760 Newborn affected by maternal conditions which may be unrelated to present pregnancy
b b b
761 Newborn affected by maternal complications of pregnancy
1144 119 25
762 Newborn affected by complications of placenta, cord, and membranes
419 87 3
763 Newborn affected by other complications of labor and delivery
b 34 0
764 Slow fetal growth and fetal malnutrition b b b 767 Birth trauma 1815 74 47
768.2-768.4 Fetal distress in liveborn infant 289 101 38 768.5-768.9 Birth asphyxia 1161 19 1
769 Respiratory distress syndrome 2803 776 509 770 Congenital pneumonia 26 3 3
770.1 Massive aspiration syndrome 256 3 7 770.2 Interstitial emphysema and related conditions 319 42 12 770.3 Pulmonary hemorrhage 86 37 2 770.4 Primary atelectasis 73 37 13 770.5 Other and unspecified atelectasis b b b 770.7 Chronic respiratory disease arising in the perinatal
period (Bronchopulmonary dysplasia, Wilson-Mikity syndrome)
879 621 29
771 Infections specific to the perinatal period 1162 125 37 772 Neonatal hemorrhage 825 150 54
773-774 Hemolytic disease of newborn, due to isoimmunization, and other perinatal jaundice
2287 55 54
775.0-775.1 Syndrome of "infant of a diabetic mother" and neonatal diabetes mellitus
b b b
776 Hemorrhagic disease of newborn 153 34 20 776.2 Disseminated intravascular coagulation in newborn 106 23 10 777.5 Necrotizing enterocolitis in fetus or newborn 624 163 28
778 Hydrops fetalis not due to isoimmunization 1 2 4 798 Sudden infant death syndrome 2703 673 387
E911-E912 Inhalation and ingestion of food or other object causing obstruction of respiratory tract or suffocation
c c c
E913 Accidental mechanical suffocation c c c

36
Articles* NIH Grants* ICD-9 Codes Condition(s) 1983-98 1983-98 1975-82
E800-E910, E914-E949
Other accidental causes and adverse effects c c c
E967 Child battering and other maltreatment c c c E960-E966, E968-E969
Other homicide c c c
* Data are not available for all categories. See the discussion on page 19 for further information. Specific reasons for the absence of data are as follows: a. Overly broad category. b. Lack of appropriately targeted search terms. In some cases, in the MEDLINE database, we were unable to effectively restrict searches to infant conditions despite the presence of an “infant” qualifier. c. Not a medical condition.
373
Figure 1: Infant Mortality by Race, 1950-2004
0
5
10
15
20
25
30
35
40
45
50
1950 1954 1958 1962 1966 1970 1974 1978 1982 1986 1990 1994 1998 2002
Year
Dea
ths p
er 1
,000
1.50
1.70
1.90
2.10
2.30
2.50
2.70
Mor
talit
y R
atio
Black
White
Black/White Ratio
Source: Data are from Vital Statistics of the United States
38
0
100
200
300
400
500
600
700
800
900
1000
deat
hs p
er 1
,000
500-999
1000-1
499
1500-1
999
2000-2
499250
0 +
birth weight (grams)
Figure 2: Infant Mortality by Birth Weight, 1960, 1983, and 1998
1960 1983 1998
Note: Data for 1960 do not present all birth weights. Infant mortality rate for births below 1,000 grams are assumed to be for infants weighing 500-999 grams.
39
Figure 3: The RDS Example
(a) 500-999 gram babies
0
20
40
60
80
100
120
140
1983
1984
1985
1986
1987
1988
1989
1990
1991
1995
1996
1997
1998
dea
ths per 1,000
‐40
‐35
‐30
‐25
‐20
‐15
‐10
‐5
0
Black
‐White difference
WhiteB lackB lack ‐White Difference
(b) 1,000-1,499 gram babies
0
10
20
30
40
50
60
1983
1984
1985
1986
1987
1988
1989
1990
1991
1995
1996
1997
1998
dea
ths per 1,000
‐35
‐30
‐25
‐20
‐15
‐10
‐5
0
Black
‐White difference
WhiteB lackB lack ‐White Difference
40
Figure 4: Relationship between initial mortality rate and research effort
Panel A: Number of NIH grants, 1983-98
RDS
Heart Defects
SIDSBronchopulmonary
Dysplasia
Panel B: Number of journal articles, 1983-98
Panel B: Number of NIH grants, 1983-98
RDS SIDS
Heart Defects
41
Figure 5: Relationship between initial mortality rate and declines in death rates
RDS
HeartDefects
SIDS
42
Figure 6: Annual Change in RDS and Other Mortality
-14
-12
-10
-8
-6
-4
-2
0
2
4
1984 1986 1988 1990 1996 1998
Chan
ge in
dea
ths
per 1
,000
RDS Other
43
RaceShare of Births
Infant Mortality
Rate
Actual Infant Mortality
Rate
Holding birth weight
constant
Holding birth weight constant and same change in cause
specific mortality ratesWhite 84% 8.2 5.2 5.0 5.0Black 16% 17.1 12.4 11.4 11.0Black/White 2.09 2.40 2.30 2.21Change in ratio 0.30 0.21 0.12
1996-98Table 1: Actual and Simulated Change in Racial Disparity
Note: Data are based on the linked birth-death infant data. Deaths are per 1,000 births. In the 1996-98 columns, the second column is a simulation showing changes in infant mortality if the birthweight distribution were the same in that time period as in the 1983-85 time period, separately by race. The third column includes that assumption and also simulates the same change in infant mortality rates by cause for blacks and whites. The decline for both races is assumed to be the rate observed for whites.
1983-85
44
Cause of death (ICD-9) All races Rank Share Whites Rank Share Blacks Rank ShareSudden infant death syndrome 1.42 1 15% 1.29 1 13% 1.95 1 18%Respiratory distress syndrome (RDS) 0.78 2 8% 0.89 2 9% 0.60 3 6%Congenital anomalies of heart 0.68 3 7% 0.71 3 7% 0.61 2 6%Congenital anomalies of respiratory system 0.26 4 3% 0.30 4 3% 0.17 9 2%Birth asphyxia 0.23 5 2% 0.22 9 2% 0.29 4 3%Infections specific to the perinatal period 0.23 6 2% 0.24 6 2% 0.23 7 2%Newborn affected by complications of placenta, cord, and membrane 0.22 7 2% 0.26 5 3% 0.19 8 2%Other congenital anomalies of circulatory system 0.21 8 2% 0.20 11 2% 0.27 6 3%Other chromosomal anomalies 0.19 9 2% 0.23 7 2% 0.11 12 1%Congenital anomalies of musculoskeletal system 0.18 10 2% 0.21 10 2% 0.11 11 1%Pneumonia 0.18 11 2% 0.15 14 2% 0.28 5 3%Anencephalus and similar anomalies 0.17 12 2% 0.23 8 2% 0.06 14 1%Newborn affected by maternal complications of pregnancy 0.16 13 2% 0.20 12 2% 0.12 10 1%Congenital anomalies of genitourinary 0.14 14 1% 0.17 13 2% 0.07 13 1%
All other causes 4.72 --- 48% 4.50 --- 46% 5.74 --- 53%
Table 2b: Leading 5 causes of death among infants born under 2500 grams, 1983-85
Cause of death (ICD-9) All races Rank Whites Rank Blacks RankRespiratory distress syndrome (RDS) 12.40 1 14.35 1 9.17 1Suddent infant death (SIDS) 4.24 2 3.70 2 5.27 2Newborn affected by complications of placenta, cord, and membrane 2.97 3 3.69 3 2.00 5Congenital anomalies of respiratory system 2.80 4 3.55 4 1.50 9Infections specific to the perinatal period 2.67 5 2.82 6 2.38 3Note: Sample restricted to singleton births that are non-Hispanic. Deaths are per 1,000 births and are adjusted to a common birth weight distribution.
All Births
Note: Sample restricted to singleton births that are non-Hispanic. Deaths are per 1,000 births and are adjusted to a common birth weight distribution.
Table 2a: Leading causes of death among infants, all births (1983-85)

45
Independent Variable (1) (2) (3) (4) (5) (6) (7)Initial mortality 488 135 2748 984 2456 -77 251 per 1,000 births (73) (222) (797) (1923) (1142) (1222) (1220)
Grants (83-98) --- --- --- --- 0.59 --- -2.68(1.63) (1.76)
Grants (75-82) --- --- --- --- --- 8.24 11.17(2.85) (3.40)
Sample All
Without SIDS, RDS, heart
defects All
Without SIDS, RDS, heart
defects All All All
N 49 46 41 38 41 41 41R2 0.484 0.008 0.234 0.007 0.236 0.371 0.409
Journal Articles (1983-98)
Note: Each column is a separate regression. Standard errors are shown in ()s. Initial mortality is mortality in 1983-85 for singleton, non-Hispanic births.
Table 3: Regressions of Research Effort and Initial Infant Mortality RatesGrants (1983-98)
46
All
No SIDS, RDS, heart
defects
IV model grants and
articlesIndependent Variable (1) (2) (3) (4) (5) (6) (7)Initial mortality -0.222 -0.715 -0.146 -0.149 -0.168 0.374 0.243 per 1,000 births (0.096) (0.726) (0.116) (0.127) (0.107) (0.205) (0.315)
Grants (75-98) --- --- --- --- --- -0.070 ---(100s) (0.023)
Articles (83-98) --- --- --- 0.002 --- --- -0.226(1000s) (0.028) (0.144)
Constant -0.374 -0.285 -0.457 -0.460 -0.432 -0.373 -0.117(0.067) (0.112) (0.088) (0.098) (0.080) (0.076) (0.261)
N 69 66 41 41 49 49 41R2 0.074 0.015 0.039 0.039 0.050 0.207 NA
Each column is a separate regression. Birthweight distribution is held constant using 500 gram intervals. All regressions are weighted by 1/SE( ln-chg ). The last column instruments for journal articles with the number of research grants.
Table 4: Regressions of Decline in Infant Death Rate, Initial Mortality, & Research Effort
With article data With grant data
47
Independent variable (1) (2) (3) (1) (2) (3) (4) (5) (6)Black deaths -0.837 --- -2.515 8089 --- -28672 1856 --- 2999 per 1,000 births (0.335) (1.650) (3018) (9660) (251) (953) (both races)White deaths --- -0.298 0.682 --- 3989 14484 --- 648 -449 per 1,000 births (0.134) (0.657) (1071) (3668) (103) (361) (both races)F test for equal --- --- 1.94 --- --- 10.64 --- --- 6.98 coefficients [0.169] [0.002] [0.011]
N 69 69 69 41 41 41 49 49 49R2 0.085 0.068 0.100 0.156 0.262 0.401 0.537 0.455 0.552
Table 5: Testing for Race-Biased Innovation
Note: Each column is a separate regression. Standard errors in ()s and p-values in []s. In columns 1-3, the regression are weighted by 1/SE( ln-chg ) and the birthweight distribution is held constant using 500 gram intervals.
Change in Death Rates Journal Articles NIH Grants

48
RaceShare of Births
Infant Mortality
Rate
Actual Infant
Mortality Rate
Holding birthweight
constant
Holding birthweight constant and same change in cause-
specific mortality ratesNo College 60% 9.5 5.9 5.7 4.9College attendee 40% 6.2 3.2 3.3 3.3Ratio (No college:college) 1.53 1.88 1.73 1.49Change in ratio 0.35 0.21 -0.03
Table 6: Actual and Simulated Change in Educational Disparity1983-85 1996-98
Note: Data are based on the linked birth-death infant data for white births. Deaths are per 1,000 births. In the 1996-98 columns, the second column is a simulation showing changes in infant mortality if the birthweight distribution were the same in that time period as in the 1983-85 time period, separately by education group. The third column includes that assumption and also simulates the same change in infant mortality rates by cause for both groups. The change is assumed to be the rate observed for the high education group.
Copyright © 2022 FDOKUMEN