IndoorCare: Low-Cost Elderly Activity Monitoring System ...
22
Sensors 2021, 21, 6051. https://doi.org/10.3390/s21186051 www.mdpi.com/journal/sensors Article IndoorCare: Low‐Cost Elderly Activity Monitoring System through Image Processing Daniel Fuentes 1 , Luís Correia 1 , Nuno Costa 1 , Arsénio Reis 2 , José Ribeiro 1 , Carlos Rabadão 1 , João Barroso 2 and António Pereira 1,3, * 1 Computer Science and Communication Research Centre, School of Technology and Management, Polytechnic Institute of Leiria, 2411‐901 Leiria, Portugal; [email protected] (D.F.); [email protected] (L.C.); [email protected] (N.C.); [email protected] (J.R.); [email protected] (C.R.) 2 INESC TEC, University of Trás‐os‐Montes e Alto Douro, Quinta de Prados, 5001‐801 Vila Real, Portugal; [email protected] (A.R.); [email protected] (J.B.) 3 INOV INESC Inovação, Institute of New Technologies, Leiria Office, Campus 2, Morro do Lena‐Alto do Vieiro, Apartado 4163, 2411‐901 Leiria, Portugal * Correspondence: [email protected] Abstract: The Portuguese population is aging at an increasing rate, which introduces new problems, particularly in rural areas, where the population is small and widely spread throughout the territory. These people, mostly elderly, have low income and are often isolated and socially excluded. This work researches and proposes an affordable Ambient Assisted Living (AAL)‐based solution to monitor the activities of elderly individuals, inside their homes, in a pervasive and non‐ intrusive way, while preserving their privacy. The solution uses a set of low‐cost IoT sensor devices, computer vision algorithms and reasoning rules, to acquire data and recognize the activities performed by a subject inside a home. A conceptual architecture and a functional prototype were developed, the prototype being successfully tested in an environment similar to a real case scenario. The system and the underlying concept can be used as a building block for remote and distributed elderly care services, in which the elderly live autonomously in their homes, but have the attention of a caregiver when needed. Keywords: computer vision; image analysis; internet of things; monitoring of elderly; low cost 1. Introduction and Motivation Portugal has an aging population with a tendency to increase [1], particularly, in rural areas, where the migration of the active population to large urban centers, in search of better job opportunities and quality of life, has led the remaining resident population in rural environments, mostly elderly, suffering social exclusion, and often ending up living in isolation. As the economic factor is sometimes a barrier for technology adoption, especially by the elderly population with limited financial resources [2], cost‐effective solutions to monitor the elderly and the isolated population in general have been researched for a while. The Ambient Assisted Living Joint Programme [3] is a European initiative and is an example of the needs that exist in support for the elderly. Since then, more and more research has been carried out [4], and every year new solutions appear make their contribution. In this article, a low‐cost solution for monitoring the movement of elderly people living alone in their homes, based on the AAL paradigm, is presented with the name IndoorCare. The system is based on a distributed architecture, where low‐cost IoT devices acquire and process video images to export non‐personal/private data through a gateway Citation: Fuentes, D.; Correia, L.; Costa, N.; Reis, A.; Ribeiro, J.; Rabadão, C.; Barroso, J.; Pereira, A. IndoorCare: Low‐Cost Elderly Activity Monitoring System through Image Processing. Sensors 2021, 21, 6051. https://doi.org/10.3390/s21186051 Academic Editor: Mario Munoz‐ Organero Received: 28 July 2021 Accepted: 7 September 2021 Published: 9 September 2021 Publisher’s Note: MDPI stays neutral with regard to jurisdictional claims in published maps and institutional affiliations. Copyright: © 2021 by the authors. Licensee MDPI, Basel, Switzerland. This article is an open access article distributed under the terms and conditions of the Creative Commons Attribution (CC BY) license (http://creativecommons.org/licen ses/by/4.0/).
-
Upload
khangminh22 -
Category
Documents
-
view
4 -
download
0
Transcript of IndoorCare: Low-Cost Elderly Activity Monitoring System ...

Sensors 2021, 21, 6051. https://doi.org/10.3390/s21186051 www.mdpi.com/journal/sensors
Article
IndoorCare: Low‐Cost Elderly Activity Monitoring System
through Image Processing
Daniel Fuentes 1, Luís Correia 1, Nuno Costa 1, Arsénio Reis 2, José Ribeiro 1, Carlos Rabadão 1, João Barroso 2
and António Pereira 1,3,*
1 Computer Science and Communication Research Centre, School of Technology and Management,
Polytechnic Institute of Leiria, 2411‐901 Leiria, Portugal; [email protected] (D.F.);
[email protected] (L.C.); [email protected] (N.C.); [email protected] (J.R.);
[email protected] (C.R.) 2 INESC TEC, University of Trás‐os‐Montes e Alto Douro, Quinta de Prados, 5001‐801 Vila Real, Portugal;
[email protected] (A.R.); [email protected] (J.B.) 3 INOV INESC Inovação, Institute of New Technologies, Leiria Office, Campus 2, Morro do Lena‐Alto do Vieiro,
Apartado 4163, 2411‐901 Leiria, Portugal
* Correspondence: [email protected]
Abstract: The Portuguese population is aging at an increasing rate, which introduces new problems,
particularly in rural areas, where the population is small and widely spread throughout the
territory. These people, mostly elderly, have low income and are often isolated and socially
excluded. This work researches and proposes an affordable Ambient Assisted Living (AAL)‐based
solution to monitor the activities of elderly individuals, inside their homes, in a pervasive and non‐
intrusive way, while preserving their privacy. The solution uses a set of low‐cost IoT sensor devices,
computer vision algorithms and reasoning rules, to acquire data and recognize the activities
performed by a subject inside a home. A conceptual architecture and a functional prototype were
developed, the prototype being successfully tested in an environment similar to a real case scenario.
The system and the underlying concept can be used as a building block for remote and distributed
elderly care services, in which the elderly live autonomously in their homes, but have the attention
of a caregiver when needed.
Keywords: computer vision; image analysis; internet of things; monitoring of elderly; low cost
1. Introduction and Motivation
Portugal has an aging population with a tendency to increase [1], particularly, in
rural areas, where the migration of the active population to large urban centers, in search
of better job opportunities and quality of life, has led the remaining resident population
in rural environments, mostly elderly, suffering social exclusion, and often ending up
living in isolation.
As the economic factor is sometimes a barrier for technology adoption, especially by
the elderly population with limited financial resources [2], cost‐effective solutions to
monitor the elderly and the isolated population in general have been researched for a
while. The Ambient Assisted Living Joint Programme [3] is a European initiative and is
an example of the needs that exist in support for the elderly. Since then, more and more
research has been carried out [4], and every year new solutions appear make their
contribution.
In this article, a low‐cost solution for monitoring the movement of elderly people
living alone in their homes, based on the AAL paradigm, is presented with the name
IndoorCare. The system is based on a distributed architecture, where low‐cost IoT devices
acquire and process video images to export non‐personal/private data through a gateway
Citation: Fuentes, D.; Correia, L.;
Costa, N.; Reis, A.; Ribeiro, J.;
Rabadão, C.; Barroso, J.; Pereira,
A. IndoorCare: Low‐Cost Elderly
Activity Monitoring System
through Image Processing.
Sensors 2021, 21, 6051.
https://doi.org/10.3390/s21186051
Academic Editor: Mario Munoz‐
Organero
Received: 28 July 2021
Accepted: 7 September 2021
Published: 9 September 2021
Publisher’s Note: MDPI stays
neutral with regard to
jurisdictional claims in published
maps and institutional affiliations.
Copyright: © 2021 by the authors.
Licensee MDPI, Basel,
Switzerland. This article is an open
access article distributed under the
terms and conditions of the
Creative Commons Attribution
(CC BY) license
(http://creativecommons.org/licen
ses/by/4.0/).

Sensors 2021, 21, 6051 2 of 22
to a server. Then, the server aggregates all this information and makes it available, in a
simple way, to the user or caregiver. This proposed solution is based in technologies
increasingly used in the area of smart everything [5] and provides a non‐invasive
monitoring system to a caregiver or a family member. The IndoorCare system records the
person’s physical movements over time and allows that information to be analyzed later
by the caregiver to assess the person’s health. One other advantage of a solution such as
this is to allow the detection of any anomalous situations, such as emergencies or possible
falls, in time.
The paper is organized as follows: Section 2 presents an overview of the related work;
Section 3 describes the solution’s architecture; Section 4 presents the prototype that was
developed to validate the concept; Section 5 presents the system’s evaluation and
optimizations; and Section 6 presents the work’s general conclusions.
2. Related Work
There are several solutions and projects focused on the detection, spatial location,
and monitoring of the daily activity of people in indoor environments. In this section, we
discuss some of the founding technologies for this type of solution, namely image analysis
and infrared sensors.
There are several articles that analyze the AAL solutions that have been appearing in
recent years [6,7] and some that expose the challenges that must be resolved in the future
[8], especially in a post COVID‐19 era [9]. There are also recent studies that focus on the
analyses and comparison, in various ways, of the created applications and architectures
of recent AAL solutions, exposing the trends in the solutions’ implementation that most
works have followed [10]. On a more practical level, there are several interesting
implementations that have used various methods to monitor and interact with older
people; these solutions typically use IoT devices to perform this monitoring [11], whether
using sensors attached to the person [12], monitoring furniture [13], using video systems
that analyze in real time what is happening [14,15], using face recognition to detect people
and who they are [16], or even through the analyses of the sound [17]. The use of computer
vision together with artificial intelligence is an increasingly common practice, using the
best that these technologies allow to better monitor the elderly in their homes [18]. In
addition, there is a growing need to transfer the information processing from data centers
to the periphery of the systems, namely to the source where the data is acquired, to reduce
the traffic sent by the equipment at the edge. This concept is called fog computing, and in
addition to being a great advantage for computer vision solutions, it is also already being
used in monitoring solutions for the elderly that use wearable devices, among others [19].
The extraction of information based on image analysis is a relatively recent topic that
has enabled the development of technologies that allow the automatization of the
information gathering process. Image recognition solutions, such as the Open‐Source
Computer Vision Library (OpenCV) [20], combined with ubiquitous computing, using
microcomputers, such as Raspberry Pi [21] or Arduino [22], allow the creation of
environments that can act intelligently, according to the information extracted and
collected.
The OpenCV software library uses image analysis to recognize the various types of
information in an image, such as: detection of hand gestures, as set out in [23]; human
facial recognition [24], where in this particular paper [25] the authors implemented a
prototype using the Java CV library [26], which analyzes the camera stream from a IP
security camera and detects human presence; and recognition and extraction of vehicle
registration information [27] or surveillance security systems [28], in which the authors
coupled common web cameras to devices of small processing power, e.g., Raspberry Pi,
which acquires the image from the camera and uses a cloud platform to process the image
for movement detection.
The research in the area of human monitoring and human location has resulted in
several interesting works, such as the one presented in [29], where the authors propose a

Sensors 2021, 21, 6051 3 of 22
system that uses two modes of monitoring, inside the residence (indoor) and outside the
residence (outdoor). For the detection of the indoor position, the users must wear RFID
(Radio‐Frequency Identification) tags, which are detected and read whenever the user
enters a new division, similarly to the RFID tagging systems used in logistic solutions to
track items. For the detection of the outdoor position, the user must wear a GPS (Global
Positioning System) device for position tracking. The GPS mode (outdoor) is activated
automatically whenever the user leaves the room three meters away.
In ref. [30], the authors used infrared (IR) sensors to calculate the number of people
inside a building, installing sensors on the doors’ tops to detect transit movement between
rooms, so they could calculate how many people were in each division.
In the work developed in ref. [31], the authors propose a solution that addresses some
of the problems enunciated in this work. A system is proposed that constantly monitors
the security of a home. It uses several Raspberry Pi devices, connected to surveillance
cameras, and uses the OpenCV library for image analysis. The system can detect various
types of events, such as opening and closing doors and windows, movement in the rooms,
and breaking windows.
Table 1 summarizes and explains why the solutions previously presented are
considered interesting for the development of this solution.
Table 1. Comparison between the solutions presented in the related work section.
Reference Case Study Why Was Chosen
[23] Hand gesture detection Image data extraction using OpenCV
[24] Video processing on Raspberry PI OpenCV on Raspberry PI
[25] Human facial recognition OpenCV on Raspberry PI
[27] Extraction of vehicle information OpenCV on Raspberry PI
[28] Surveillance system Image acquisition on Raspberry PI
[29] Indoor/outdoor person detection Uses RFID tags to detect humans
[30] Indoor human detection Uses infrared sensor to detect humans
[31] Indoor monitoring Uses IoT devices with AI
IndoorCare Indoor human monitoring Uses IoT devices with Computer Vision
The work that identifies most of the requirements for this intended solution is ref.
[31], mainly because of the image analysis using computer vision, artificial intelligence,
and IoT devices. Although the solution works as intended, according to the authors, it
requires too many processing resources from the IoT devices, which means that a robust
IoT device must be used, thus increasing the solution’s cost. The objective of this work is
to develop a solution that can monitor a person’s movements inside the house, in the
various rooms, also using computer vision, as in ref. [31], using IoT devices, while keeping
the cost reasonably low.
3. IndoorCare System Architecture
The solution IndoorCare, proposed in this article, is based on some principles used
in other solutions, namely using only one device per room for human detection [29],
detecting the presence of people through motion capture analysis [30], and using low‐cost
microcomputers to analyze and process the collected information [31]. The system has a
distributed and multi‐agent architecture [32], which implements the client–server model,
having a gateway module to ensure information security, as presented in Figure 1.

Sensors 2021, 21, 6051 4 of 22
Figure 1. IndoorCare conceptual architecture.
The architecture comprises three modules, highlighted in Figure 1, where each
module has a specific agent, a software‐based entity, which performs the various tasks on
the equipment to ensure proper operation of the system:
The monitoring module, which translates to the several IoT devices at home that
capture images and pre‐process the data obtained from the images, in order to send
this information to the presentation module.
The gateway module, responsible for ensuring WiFi network availability and data
communication security from the clients to the server (presentation module).
The presentation module, which is the server that receives the data from the
monitoring modules. It provides a presentation layer for the users (caregivers) to
visually perceive the dynamics of the elderly person’s activities inside the house over
time.
The option to use image acquisition equipment and computer vision, instead of
infrared sensors, although the latter in theory are cheaper, was because with computer
vision it is possible to analyze several subzones within the same zone with a single IoT
device, while with affordable infrared sensors, typically, one sensor is necessary to detect
motion in each subzone. Although there are infrared sensors with this capability, such as
the temperature detection cameras used to detect possible cases of COVID‐19 [33], these
are not low‐cost IoT devices as their cost is in the range of thousands of euros per device.
In Figure 2 are detailed all the components of each of the modules and how they
communicate with each other.

Sensors 2021, 21, 6051 5 of 22
Figure 2. IndoorCare detailed architecture.
3.1. Monitoring Module (IoT Device)
The IoT devices present in the elderly person’s home are responsible for processing
the information they acquire; namely, image analysis through OpenCV, generating
processed data ready to be sent to the server. This functionality is in line with the Edge
Computing concept [34], where the processing is executed close to the data source, in this
case at the home of the elderly, being a paradigm increasingly used in the IoT universe
and in smart systems.
The monitoring module works as a black box system that receives video feeds, and
outputs the extracted data from the image analysis in the form of movement events. No
other information is fed to the user/caregiver. This module encompasses the devices
installed in the distinct areas (zones) of the elderly home to perform the movement
detection. The software agent defined for this module and presented in Figure 2 is
responsible for the image acquisition and hotspot calculation, using the available
resources on the IoT device. A hotspot is defined as an area where movement is detected
in the image, and for which the device must compare several image frames to be able to
confirm if there is movement in a zone or not.
Each equipment has a unique identifier (ID) that identifies with which zone the
device is associated. The ID is also used to identify the hotspot’s information in the
server’s database and establish a relation between the device and its location in the house.
3.2. Gateway Module (Gateway)
This module is responsible for the confidentiality and integrity of the data
transmission between the monitoring module and the presentation module. The module’s
agent, also presented in Figure 2, ensures that all communications go through an
encrypted tunnel, from the network access point to the server. The agent guarantees the
data encryption, as well as the server’s address validation.
3.3. Presentation Module (Server)
This module acts as the server element of the client–server model in the
communication and receives data from the clients, which are represented by the
monitoring module. The data are saved, processed, and presented to the caregiver user.
The software agent in this module, as presented in Figure 2, implements the features for

Sensors 2021, 21, 6051 6 of 22
data reception, decryption, saving, and presentation on a web platform. The user
interaction is minimalistic and the agent basically combines the data streams from the
several clients into a unique event feed.
To create the event stream from the data, the agent uses the subzones, as previously
defined in the server’s configuration, to check whether there is movement within them,
using the hotspots sent by the clients. A subzone corresponds to a part of the image (the
entire zone) acquired by a particular IoT device and corresponds to a specific area inside
the elderly person’s home.
This module provides a web portal for the caregiver to monitor the elderly and
browse the daily activities inside the house, via Northbound [35] access. It also provides
communication using Application Programming Interfaces (API) [36] via Southbound
[35] for communication with the IoT devices and gateways.
3.4. Communication
As seen previously in Figure 1, there are three different types of communications:
Caregiver with the server;
Gateway with the server;
IoT devices with the server.
In Northbound communication, between the caregiver and the server, as it typically
occurs in a web environment (via the Internet), the most suitable communication protocol
will be HTTP (Hypertext Transfer Protocol), in its secure version (HTTPS) [37]. This is one
of the most used protocols for accessing online platforms and is widely used in the IoT
environment for the same purpose.
In Southbound communication, between the server, gateways, and IoT devices, since
it is a communication between IoT and network devices (if supported by the hardware),
several protocols focused on the IoT environment can be used:
HTTP (Hypertext Transfer Protocol): The most used client–server communication
protocol on the Web which is also widely used in the IoT world due to its simplicity
and efficiency in delivering information.
COAP (Constrained Application Protocol): A communication protocol designed for
devices that have limited processing capabilities, much like HTTP, but that uses
much less data to send messages.
MQTT (Message Queuing Telemetry Transport): One of the lightest communication
protocols, it uses the Publisher/Subscriber model to exchange messages and is widely
used in scenarios where network connectivity is not ideal.
These are just a few examples of communication protocols that can be implemented
in this architecture, with HTTP still being one of the most used [38].
4. Implemented Prototype
In this section is presented the prototype developed to validate the proposed
architecture. Low‐cost IoT devices, widely used by the community, were used to
implement the solution to validate the fulfilment of the objectives set out in the previous
section.
In Figure 3, the general architecture of the prototype is illustrated, showing the
modules and devices used.

Sensors 2021, 21, 6051 7 of 22
Figure 3. Prototype conceptual architecture.
The implemented prototype incorporates all the modules described in the
architecture to demonstrate the intended functionality with the proposed system. Links
at the right side are the interaction that takes place between the server, gateways and IoT
devices (Southbound). The link at the left side represents the user/caregiver interaction
with the web platform to access the IndoorCare system (Northbound). It should be noted
that in this prototype, at the gateway level, only the basic static mechanisms were
implemented for the system to work correctly, namely the VPN connection and server
address validation.
4.1. Equipment Used
The equipment selection for this prototype project considered the costs in order to
keep the solution effective and as low cost as possible, targeted at people with modest
economic resources.
For the client IoT devices, we opted to use Single Board Computers (SBC) with an
Operating System (OS) based in Linux, specifically the from the Raspberry PI family [39],
due to its low price and good technical characteristics. To capture and analyze the images,
we chose the Raspberry Pi Zero W [40] combined with a Fisheye 160° camera (including
a 5 V 2.1 A power supply and Micro SD card), as presented in Figure 4. The total cost per
device was around EUR 45 + VAT.
Figure 4. Raspberry PI Zero W #1 (a) and #2 (b).

Sensors 2021, 21, 6051 8 of 22
This equipment is reasonably compact and has a set of ideal characteristics, such as
a single‐core processor at 1 GHz, 512 MB of RAM, and built‐in WiFi, thus enabling the
creation of client equipment capable of collecting, processing, and sending images to the
system server over a WiFi network. It should be noted that initially the cameras used were
normal Raspberry Pi Camera Modules [41], which were replaced by fisheye cameras only
after testing the system, as described in Section 5,
For the server equipment, to receive, store, process, and present data on a web portal,
we opted for the Raspberry Pi 3 B [42] (including a 5 V 2.1 A power supply and a Micro
SD card). The total cost was around EUR 50 + VAT. The characteristics of this equipment,
despite being an IoT device, meet the requirements for server equipment, as it has a quad‐
core processor at 1.4 GHz and 1 GB of RAM. Although this device has a reasonable
performance, in a real or production environment, a more robust computational node
should be used, namely a dedicated server (PC) or an online VPS (Virtual Private Server).
For network gateway equipment, we chose a Mikrotik Routerboard RB951Ui‐2ND
[43], mainly because of the possibility to create internal scripting for network
management, and the ability of this scripting to communicate with platforms via REST
API. This device had a total cost around EUR 30 + VAT. This equipment can work as a
WiFi access point for the client devices, allowing the creation of a secure bridge Virtual
Private Network (VPN) [44] between client and server equipment, thus ensuring client–
server end‐to‐end confidentiality.
One major concern is the device intrusion that can lead to the visualization of the
images captured by the camera by unauthorized persons. A way to guarantee the privacy
of the residents is by physically blurring the lens of the equipment. Figure 5 shows the
differences between a focused and an unfocused lens, and it is possible to notice that in
the image with the lens out of focus, objects and people are not perceptible, thus ensuring
the privacy required by the GDPR [45].
Figure 5. Focused (a) and unfocused (b) lens.
4.2. System Operation
To acquire the location of an individual person from video camera images, it is
necessary to analyze and extract information from the images. We used the OpenCV
software library [20] and the ImUtils library [46] to recognize movement in the images
and Python [47] as the programming language for the software agent. It is possible to
compare two images, one that serves as base reference for comparison and the other to
check for changes, converting the captured images to arrays of pixels and comparing the
different values of their respective positions. To perform the comparison, the absolute
value in the subtraction of each of the respective pixels is obtained, thus creating an image
that presents the differences found in the pixel array, which in this case shows the
complete changes that occurred between the images. Then, a threshold is applied to the
resultant image, by defining a change limit between pixels, where the pixels below the
threshold are discarded and those above are saved, to create an image, commonly known

Sensors 2021, 21, 6051 9 of 22
as threshold, which contains only the pixels where there is a significant difference or, in
this case, movement detection.
In Figure 6, on the right side, the threshold which corresponds to the movement
detected on the left side of the image is displayed, with the movement area defined by a
blue rectangle.
Figure 6. Motion detection in the image.
To effectively calculate the threshold, as stated in [24], it is necessary at an early stage
to convert the color image to a grayscale image, so the only differentiating factor is the
pixel brightness. Then, it is necessary to blur the image so that there are no sudden
changes in the pixel tones. Figure 7 shows the different types of blurs supported by
OpenCV: Gaussian Blur, Median Blur, and Normalized Block Blur [48].
Figure 7. Some types of image blurring.
Each blur type uses a different approach, yielding different results. The tests
performed consisted of acquiring images where there was always the same human
movement, walking from one end of the room to the other. Several threshold values were
tested with the different types of blurs, which led to the following conclusion:
Median Blur and Normalized Block give less false positives in the motion detection;
Gaussian Blur detects more movement, as it provides more image detail after
blurring.
In the prototype, Median Blur was used, but any other blur could be used as well.
Figure 8 describes the algorithm implemented by the Monitoring Agent to collect and
compare images, find hotspots, and send them to the server (explained in the
communication subsection). The device starts up and initially acquires an image to use as
a base. In the following instant, the device acquires another image, and then creates a
threshold for it. It analyzes if there is movement or not and if so, creates a hotspot entry
and saves it into the log. Every 30 s the IoT device tries to upload all the hotspots it finds
in that period of time.

Sensors 2021, 21, 6051 10 of 22
Figure 8. Client operation algorithm.
On the server side, the Presentation Agent receives and inserts the data into a
database, after which it is processed and presented to the user/caregiver. To detect
movement in an area, it is necessary to create sub‐areas that will work as baselines for
comparison with the detected hotspots by the devices. The server prototype provides the
management feature to define and manage zones and subzones, as exemplified in Figure
9.
Figure 9. Management of zones and subzones.
This management feature allows the administrator/system installer to create the
zones and the respective subzones that the caregiver want to supervise. It should be noted

Sensors 2021, 21, 6051 11 of 22
that to be able to acquire an image of the IoT device used as a monitoring module, a
physical action on the equipment is required, namely the junction of two GPIO pins to
activate the device’s configuration mode. In Figure 10 are displayed two zones used in the
system’s prototype and its subzones, each one identified by an ID. Any hotspot detected
within one of the delimited areas corresponds to movement in that subzone.
Figure 10. Two zones and several subzones defined for the prototype.
Following the hotspot detection, this information must be transmitted to the
caregiver through a simple and effective interface, mainly because if the interface is too
complex, the caregiver may not feel comfortable using it. An example of a simplistic visual
interface is the timeline feed of events shown in Figure 11, which is a summary of the
events that occurred each day at a certain time. The timeline provides a perception feed
of the activity in the elderly home spaces under monitoring, by combining the feeds from
the zones into a unique feed, formatted as a timeline grid. For the human caregiver/user,
it is very simple and effective to check for specific events [49] and general activity in the
house. In the timeline, each blue vertical stripe represents a hotspot detection in that
respective subzone, signaling that movement was detected at that time in that area.
Figure 11. Event timeline.

Sensors 2021, 21, 6051 12 of 22
With the timeline display, the caregiver can follow the daily life of the elderly and
check his routine in a simple and non‐intrusive way.
4.3. Communication
To be able to send the “converted images” transformed into data to the server, it is
necessary for the client to be able to structure this information in such a way that it will
be well interpreted at the destination. XML (Extensible Markup Language) [50] is a
markup language that allows structuring information in a simple and easily readable way
by human beings. It is one of the standards used in the communication of information
between information systems and has great flexibility, allowing the creation of the most
varied message structures. Another format also widely used in information
communication is JSON (JavaScript Object Notation) [50], a compact message format that
has less overhead than XML and has been also widely implemented in the industry.
In this prototype, we chose to use XML only because it allows easier reading of
messages and facilitates the query of logs, but JSON could also be used. The messages sent
in XML from the IoT devices to the server have the following fields:
datetime: date and time of registration of hotspots, will be grouped in intervals of 30
s for better organization on the server.
loggerid: the unique identifier of the IoT device that is collecting the information.
framewidth: the original width of the image that generated the hotspot.
frameheight: the original height of the image that generated the hotspot.
matrixwidth: the scale of the matrix width used in this device (to normalize the
different resolutions of different cameras).
matrixheight: the height scale of the matrix used in this device (to normalize the
different resolutions of different cameras).
hotspot: with the x and y coordinates of a hotspot detected at that moment, there may
be several at the same moment.
Figure 12 presents an example of one of these messages, sent periodically to the
server.
Figure 12. Example of an XML message used.
Client devices calculate hotspots and store this information in a log to be sent every
30 s. In case of communication failure, the Monitoring Agents themselves save the
information that was not successfully sent to the server in the log and in the next iteration
they try to resend all the pending information.
Initially, it was decided to encrypt the data using symmetric encryption on the
clients, but this required unnecessary processing by the IoT devices, so the solution was
to delegate this task to the gateway, which would be responsible for creating the VPN
bridge with the server and ensure information security and confidentiality.

Sensors 2021, 21, 6051 13 of 22
4.4. Movement Data History
One of the advantages of the way the system is designed and implemented is that
there is a history of every hotspot detected, and so the processing of movement in the
subzones is carried out in the server, and new subzones can be added or rearranged long
after the system’s first initialization.
In Figure 13 is presented an example of how this works. On the left side there are five
subzones defined and all the hotspots registered since the system startup; on the right side
there is a new subzone defined (2F) after the system initialization. Because a hotspot
history exists for each zone, every movement that occurred in that subzone, even before
its creation, can be fully visualized in the timeline.
Figure 13. Hotspot’s history.
Doing this allows the visualization of all the movement in the new/rearranged
subzones, which were not contemplated in the system before, because all the data history
related to the detected movement of the entire zone is saved.
5. Tests and Optimizations
Due to the current COVID‐19 pandemic, it was not possible to carry out tests in real
situations with the elderly. All tests performed were simulated in the same house
division/area, with specific tests focused on the correct functioning of each module.
During the tests, some optimizations were made, namely in the agent present in the IoT
devices.
5.1. Client Testing
The tests performed on the IoT devices consisted of analyzing the code of the agent
developed in python and its ability to perform the necessary operations, namely:
Acquire images from a camera connected to the IoT device;
Process the image using OpenCV for motion detection;
Creation of hotspots for later upload to the server;
Sending collected hotspots to the server.
In Figure 14 is shown the output of the Monitoring Agent, while in debug mode,
displaying the image coordinates, where the movement was detected, and the XML
message generated to be sent to the server.

Sensors 2021, 21, 6051 14 of 22
Figure 14. Monitoring Agent output in debug mode.
Another test involving the IoT devices was to verify if the hotspots generated by the
devices were accurate or not; that is, if the motion detected by the devices was consistent
with the motion points that appeared on the server’s timeline. In Figure 15 is shown the
timeline of the event stream, as displayed by the server, showing movement detection,
while on the right side of the figure are shown the outputs of the equipment and the zones
they are monitoring.
Figure 15. Timeline of events and the respective devices.
The tests performed on the system confirmed that the points collected by the device
and the movements present in the timeline matched.
Sensors 2021, 21, 6051 15 of 22
5.2. Server Testing
The tests carried out on the server focused on the reception and processing of data
from the servers and their presentation to the user/caregiver, including:
Reception of the hotspot in the IoT devices;
Hotspot data processing and timeline generation;
Creation and editing of zones and subzones.
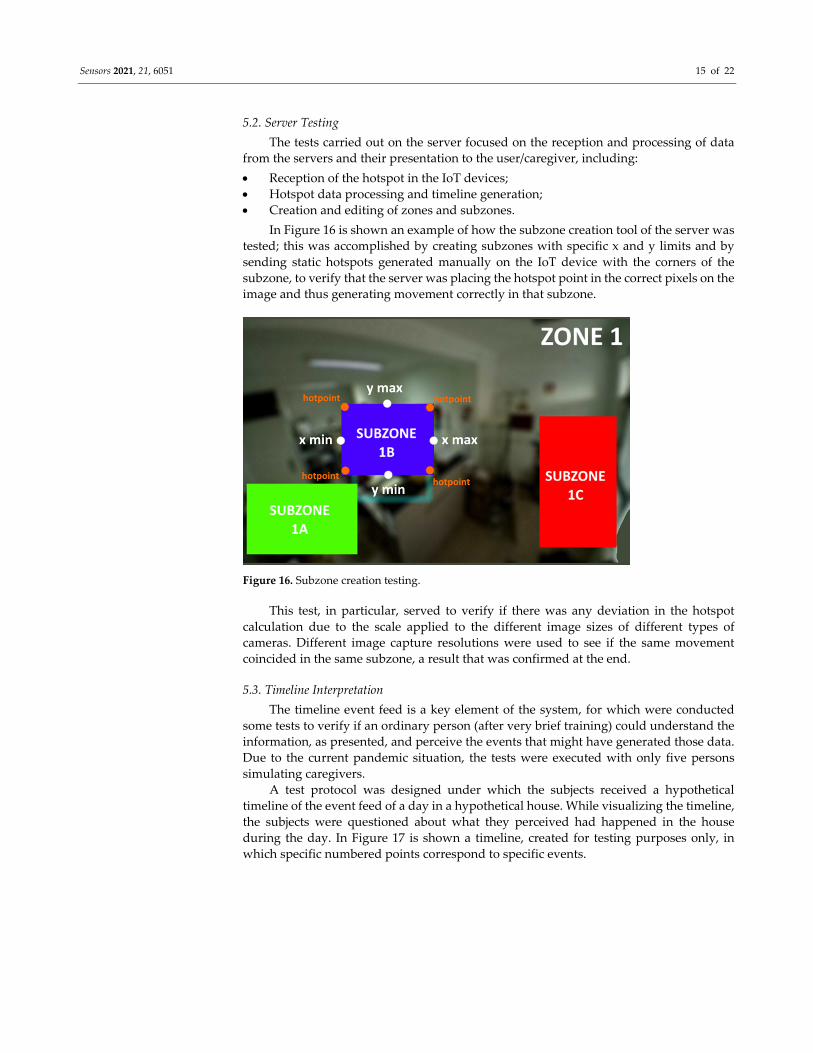
In Figure 16 is shown an example of how the subzone creation tool of the server was
tested; this was accomplished by creating subzones with specific x and y limits and by
sending static hotspots generated manually on the IoT device with the corners of the
subzone, to verify that the server was placing the hotspot point in the correct pixels on the
image and thus generating movement correctly in that subzone.
Figure 16. Subzone creation testing.
This test, in particular, served to verify if there was any deviation in the hotspot
calculation due to the scale applied to the different image sizes of different types of
cameras. Different image capture resolutions were used to see if the same movement
coincided in the same subzone, a result that was confirmed at the end.
5.3. Timeline Interpretation
The timeline event feed is a key element of the system, for which were conducted
some tests to verify if an ordinary person (after very brief training) could understand the
information, as presented, and perceive the events that might have generated those data.
Due to the current pandemic situation, the tests were executed with only five persons
simulating caregivers.
A test protocol was designed under which the subjects received a hypothetical
timeline of the event feed of a day in a hypothetical house. While visualizing the timeline,
the subjects were questioned about what they perceived had happened in the house
during the day. In Figure 17 is shown a timeline, created for testing purposes only, in
which specific numbered points correspond to specific events.

Sensors 2021, 21, 6051 16 of 22
Figure 17. Timeline interpretation.
The events were then presented, but not numbered, and the subjects had to match
the event with the event number on the timeline. These events were as follows:
“Mr. João spent the morning watching television on the sofa and then went to lunch.”;
“Mr. João went to drink water in the kitchen.”;
“Mr. João went to the bathroom.”;
“Mr. João was watching TV for almost 2 h.”;
“Someone knocked on the door and Mr. João went to see who it was.”.
The results, with a test group of five individuals, are quite positive, with all the
individuals confirming that they were able to perceive what happened by reading the
timeline. The only exceptions were events 1 and 5, which are very similar in the timeline,
and two of the five individuals misinterpreted these two.
5.4. Hotspot Detection Optimization
During the tests on IoT devices, it was noticed that when using an outline rectangle
for the movement detection, as the example in Figure 18 shows, the calculation of hotspots
sometimes covered two or more subzones, leading to quite a few false positives in
subzones where the movement was not happening.
Figure 18. Movement detection optimization.
To reduce the number of false positives, it was decided to create a central point in the
motion detection rectangle that would represent the midpoint of all the movement that
occurred in that specific area of the image. By performing this optimization, and after

Sensors 2021, 21, 6051 17 of 22
several tests, it was concluded that when using this midpoint technique, the number of
false positives decreased significantly, creating a timeline with much less scattered
movement points.
Another advantage of this optimization was the significant decrease (about 50%) in
the network traffic to send a hotspot data message, mainly because the messages are in
XML and the overhead becomes much smaller, when, in this case, only a pair of X + Y
coordinates are transmitted per movement, instead of the two pairs of coordinates to send
the rectangle.
5.5. Automatic Background Adaptation
The analysis of whether there is movement or not is performed by comparing an
image with a previous image (base image), in order to verify if there are differences
between them. There is a problem when the base image no longer corresponds to the
actual scenario, and small changes were introduced due to non‐motion pixel changes.
These changes, although not caused by motion, were detected as motion because the
pixels in the image changed since the base image.
One of the identified problems was the constant change in the environment that the
client was analyzing, either due to the presence of new objects or changes in lighting
scenario, such as a light being turned on. To address this problem, in the IoT device was
implemented a compensation algorithm that modified the baseline image when required.
In Figure 19, two of the problems encountered while testing the system are presented. The
first one is when an object enters the background scenario, and it does not exist in the base
image. The second is when the scenario lighting changes, and all the pixels change,
creating movement in the entire image.
Figure 19. Creation of the new base image.
After several tests, an algorithm was created based on the work of [51], to optimize
movement detection, that changed the baseline image based on two conditions:
When no significant movement is detected for more than X seconds (X is variable),
which allows the baseline image to be updated to ambient lighting throughout the
day.
When significant movement is detected for more than Y seconds (Y is variable),
which happens in at least three different cases: when there is a sudden change in the
ambient lighting, when new objects are introduced in the scenario, and when there
is real movement in the image.
Regarding the second assumption, when a new base image is created, and if the
movement detection continues, then it is because there is real movement detected. In case
of a change in lighting or a new object in the scene, after the new base image is created the
movement stops.

Sensors 2021, 21, 6051 18 of 22
5.6. Cameras with Fisheye Lens
During the initial development of the system, cameras with regular lenses were used,
with an about 72° viewing angle, which greatly limited the area to be monitored,
especially if viewed from above (ceiling of the room). Later, fisheye lenses, with an
approximately 160° viewing angle, were installed on the IoT devices, allowing a much
larger monitoring area. In Figure 20, there is a lens comparison with normal lenses (72°)
on the left and fisheye lenses (160°) on the right.
Figure 20. Angle viewing of lens: 72° (Left) vs. 160° (Right).
The equipment is positioned exactly in the same place and the only difference is the
camera lens. On the right side, the amount of area is much bigger, which allows a better
use of the image for motion detection. With this type of lens, it is also possible to place the
equipment on the ceiling of the room and monitor the entire area, as seen in Figure 8.
With this optimization, and after several tests, the fisheye lens installed in the ceiling
proved to be the ideal place to position the IoT device and monitor the room. This setup
also produced fewer false positives in the movement detection in the subzones, mainly
because the line of sight between the camera and the subzone is less likely to be
obstructed.
5.7. Movement Detection Performance
To test the system’s performance in real motion detection, various sizes of minimum
motion area were tested to check how this would influence the system’s execution. Figure
21 shows the test scenario with a defined sub‐area (a) to detect the movement of the door
(b). Three sizes of minimum area were used to detect the same movement of the door (c),
which were 20 px, 50 px, and 100 px. These sizes were defined in particular for this test
and another set could be defined; the purpose was only to check whether the minimum
detection area influenced the detection of the same movement.
Figure 21. Movement detection of a closed (a) and open door (b) and the used movement area
sizes (c).

Sensors 2021, 21, 6051 19 of 22
The graph in Figure 22 shows the results obtained from the tests carried out. As can
be seen, when using a smaller motion detection area, the system can recognize the same
motion/movement in that subzone more often than when the area is larger.
Figure 22. Movement detection with multiple minimum area sizes.
This result is expected and is reflected in previous tests, since the detection of the
changed pixels is sometimes very fragmented, creating several small detection areas that
are discarded if the minimum size of these to be considered valid is too high.
6. Conclusions and Future Work
In this work, an effective and low‐cost indoor monitoring system was proposed to
help caregivers take care of the elderly by monitoring their daily lives from a distance.
This system brings the advantages of knowing where the elderly person is and the activity
dynamics in the house, while fully respecting the elderly person’s privacy, thus creating
a daily movement record of the elderly person.
The test results of the prototype show that it is possible to use low‐price and low‐
performance IoT equipment, namely a Raspberry Pi Zero W, to build a system that
performs monitoring in a specific zone in the house and its associated subzones. In
addition, the tests also indicate that the usage of the timeline event feed model is very
effective to display the activity inside a home and that it is very simple to interact with.
As future work, an optimization that can be made in terms of processing on the
Raspberry Pi is the implementation of gray areas, i.e., areas that will never have points of
interest for motion detection. The detections that happen in these subzones (e.g.,
reflections) are not sent to the server, leading to less false positives and a smaller amount
of information to be sent to the server. Other improvements in this type of system include
the implementation of automatic alerts, which could be of two types: a “Non‐movement
alert”, which would inform the caregiver when something abnormal happens in the
elderly’s routine; or a “Too long alert”, which would be used to inform the caregiver that,
after movement was detected in an specific area, it suddenly stopped, informing the
caregiver that something may be happening.
Author Contributions: Conceptualization, D.F., L.C. and A.P.; data curation, D.F. and L.C.; formal
analysis, A.R., C.R., J.B. and A.P.; funding acquisition, A.R., J.B., C.R. and A.P.; investigation, D.F.
and L.C.; methodology, A.P.; resources, A.R., C.R., J.B., J.R., N.C. and A.P.; software, D.F. and L.C.;
supervision, A.R., J.B., N.C. and A.P.; validation, N.C., A.R., J.R., C.R., J.B. and A.P.; writing—
original draft, D.F., L.C., N.C., A.R. and A.P.; writing—review and editing, D.F., L.C., J.R., A.R., C.R.,
J.B. and A.P. All authors have read and agreed to the published version of the manuscript.
Funding: This work was supported by Project “Digitalization of end‐of‐line distributed testers for
antennas (“D‐EoL‐TA)”, operation number: POCI‐01‐0247‐FEDER‐049698, financed by the Program
COMPETE 2020, Portugal 2020, by National Funds through the Portuguese funding agency, FCT‐
Fundação para a Ciência e a Tecnologia, within project UIDB/04524/2020, and was partially
supported by Portuguese National funds through FITEC‐Programa Interface, with reference CIT

Sensors 2021, 21, 6051 20 of 22
“INOV‐INESC Inovação‐Financiamento Base” and by Portuguese Fundação para a Ciência e a
Tecnologia‐FCT, I.P., under the project UIDB/50014/2020.
Institutional Review Board Statement: Not applicable.
Informed Consent Statement: Not applicable.
Data Availability Statement: Not applicable.
Acknowledgments: The authors acknowledge the Computer Science and Communication Research
Center for the facilities granted in the implementation of part of this work, in the context of the
Smart IoT Ecosystems research line and the Mobile Computing Laboratory of the School of
Technology and Management of the Polytechnic of Leiria. The authors also acknowledge the
authorship of some of the images used in some of the visual content created using the tool
“diagrams.net” and the free content available in “iconfinder.com”, “pixabay.com”, and
“flaticon.com”.
Conflicts of Interest: The authors declare no conflict of interest.
References
1. Instituto Nacional de Estatísticas. Projeções de População Residente em Portugal. Portal do INE. Available online:
https://www.ine.pt/xpotal/xmain?xpid=INE&xpgid=ine_destaques&DESTAQUESdest_boui=277695619&DESTAQUESmodo=
2 (accessed on 17 May 2021).
2. Pereirinha, J.A.; Pereira, E. Défice Social e Pobreza Relativa: Uma análise da Adequação Do Bem‐Estar e da Segurança Económica em
Portugal; ISEG – GHES: Lisboa, Portugal, 2019.
3. Vodjdani, N. The ambient assisted living joint programme. In Proceedings of the 2008 2nd Electronics System‐Integration
Technology Conference, The University of Greenwich, London, UK, 1–4 September 2008; pp. 1–2.
4. Pinazo‐Hernandis, S.; Puente, R.P. Innovación para el envejecimiento activo en la unión europea. Análisis del programa ambient
assisted living joint programme (AAL) en el periodo 2008‐2015. Búsqueda 2015, 2, 38–50.
5. Streitz, N. Beyond ‘smart‐only’cities: Redefining the ‘smart‐everything’paradigm. J. Ambient. Intell. Humaniz. Comput. 2019, 10,
791–812.
6. Abtoy, A.; Touhafi, A.; Tahiri, A. Ambient Assisted living system’s models and architectures: A survey of the state of the art. J.
King Saud Univ. ‐Comput. Inf. Sci. 2020, 32, 1–10.
7. Alkhomsan, M.N.; Hossain, M.A.; Rahman, S.M.M.; Masud, M. Situation awareness in ambient assisted living for smart
healthcare. IEEE Access 2017, 5, 20716–20725.
8. Wan, J.; Gu, X.; Chen, L.; Wang, J. Internet of things for ambient assisted living: Challenges and future opportunities. In
Proceedings of the 2017 International conference on cyber‐enabled distributed computing and knowledge discovery (CyberC),
Nanjing, China, 12–14 October 2017; pp. 354–357.
9. Vimarlund, V.; Borycki, E.M.; Kushniruk, A.W.; Avenberg, K. Ambient assisted living: Identifying new challenges and needs
for digital technologies and service innovation. Yearb. Med. Inform. 2021, 30, 141–149.
10. Grguric, A.; Khan, O.; Ortega‐Gil, A.; Markakis, E.; Pozdniakov, K.; Kloukinas, C.; Medrano‐Gil, A.; Gaeta, E.; Fico, G.;
Koloutsou, K. Reference Architectures, Platforms, and Pilots for European Smart and Healthy Living—Analysis and
Comparison. Electronics 2021, 10, 1616.
11. Maskeliūnas, R.; Damaševičius, R.; Segal, S. A review of internet of things technologies for ambient assisted living
environments. Future Internet 2019, 11, 259.
12. Correia, L.; Fuentes, D.; Ribeiro, J.; Costa, N.; Reis, A.; Rabadão, C.; Barroso, J.; Pereira, A. Usability of Smartbands by the Elderly
Population in the Context of Ambient Assisted Living Applications. Electronics 2021, 10, 1617.
13. Bleda, A.L.; Fernández‐Luque, F.J.; Rosa, A.; Zapata, J.; Maestre, R. Smart sensory furniture based on WSN for ambient assisted
living. IEEE Sens. J. 2017, 17, 5626–5636.
14. Malekmohamadi, H.; Moemeni, A.; Orun, A.; Purohit, J.K. Low‐cost automatic ambient assisted living system. In Proceedings
of the 2018 IEEE International Conference on Pervasive Computing and Communications Workshops (PerCom Workshops),
Athens, Greece, 19–23 March 2018; pp. 693–697.
15. Stefan, I.; Aldea, C.L.; Nechifor, C.S. Web platform architecture for ambient assisted living. J. Ambient Intell. Smart Environ. 2018,
10, 35–47.
16. Almeidaa, A.; Costaa, R.; Limaa, L.; Novaisc, P. Non‐obstructive authentication in AAL environments. In Workshop Proceedings
of the 7th International Conference on Intelligent Environments; IOS Press: Nottingham, UK, 2011; pp. 63–73.
17. Navarro, J.; Vidaña‐Vila, E.; Alsina‐Pagès, R.M.; Hervás, M. Real‐time distributed architecture for remote acoustic elderly
monitoring in residential‐scale ambient assisted living scenarios. Sensors 2018, 18, 2492.
18. Colantonio, S.; Coppini, G.; Giorgi, D.; Morales, M.A.; Pascali, M.A. Computer vision for ambient assisted living: Monitoring
systems for personalized healthcare and wellness that are robust in the real world and accepted by users, carers, and society.
In Computer Vision for Assistive Healthcare; Academic Press—Elsevier Ltd: Amsterdam, Netherlands, 2018; pp. 147–182.

Sensors 2021, 21, 6051 21 of 22
19. Nikoloudakis, Y.; Panagiotakis, S.; Markakis, E.; Pallis, E.; Mastorakis, G.; Mavromoustakis, C.X.; Dobre, C. A fog‐based
emergency system for smart enhanced living environments. IEEE Cloud Comput. 2016, 3, 54–62.
20. OpenCV Team. Available online: https://opencv.org/ (accessed on 20 January 2021).
21. The Raspberry Pi Foundation. Raspberry Pi. Available online: https://www.raspberrypi.org/ (accessed on 20 January 2021).
22. Arduino. Available online: https://www.arduino.cc/ (accessed on 20 January 2021).
23. Khan, M.B.; Mishra, K.; Qadeer, M.A. Gesture recognition using Open‐CV. In Proceedings of the 2017 7th International
Conference on Communication Systems and Network Technologies (CSNT), Nagpur, India, 11–13 November 2017; pp. 167–
171.
24. Arva, G.; Fryza, T. Embedded video processing on Raspberry Pi. In Proceedings of the 2017 27th International Conference
Radioelektronika (RADIOELEKTRONIKA), Brno, Czech Republic, 19–20 April 2017; pp. 1–4.
25. Okabe, R.K.; Carro, S.A. Reconhecimento Facial Em Imagens Capturadas Por Câmeras Digitais De Rede. Colloq. Exactarum 2015,
7, 106–119.
26. Audet, S. JavaCV. Available online: https://github.com/bytedeco/javacv (accessed on 20 January 2021).
27. Suryatali, A.; Dharmadhikari, V.B. Computer vision based vehicle detection for toll collection system using embedded Linux.
In Proceedings of the 2015 International Conference on Circuits, Power and Computing Technologies [ICCPCT‐2015],
Nagercoil, India, 19–20 March 2015; pp. 1–7.
28. Patil, N.; Ambatkar, S.; Kakde, S. IoT based smart surveillance security system using raspberry Pi. In Proceedings of the 2017
International Conference on Communication and Signal Processing (ICCSP), Chennai, India, 6–8 April 2017; pp. 344–348.
29. Hutabarat, D.P.; Hendry, H.; Pranoto, J.A.; Kurniawan, A. Human tracking in certain indoor and outdoor area by combining
the use of RFID and GPS. In Proceedings of the 2016 IEEE Asia Pacific Conference on Wireless and Mobile (APWiMob), Wireless
and Mobile (APWiMob), Bandung, Indonesia, 13–15 September 2016; pp. 59–62.
30. Perra, C.; Kumar, A.; Losito, M.; Pirino, P.; Moradpour, M.; Gatto, G. Monitoring Indoor People Presence in Buildings Using
Low‐Cost Infrared Sensor Array in Doorways. Sensors 2021, 21, 4062.
31. Kumar, K.N.K.; Natraj, H.; Jacob, T.P. Motion activated security camera using raspberry Pi. In Proceedings of the 2017
International Conference on Communication and Signal Processing (ICCSP), Chennai, India, 6–8 April 2017; pp. 1598–1601.
32. El‐Sayed, H.; Sankar, S.; Prasad, M.; Puthal, D.; Gupta, A.; Mohanty, M.; Lin, C.T. Edge of things: The big picture on the
integration of edge, IoT and the cloud in a distributed computing environment. IEEE Access 2017, 6, 1706–1717.
33. Al‐Humairi, S.N.S.; Kamal, A.A.A. Opportunities and challenges for the building monitoring systems in the age‐pandemic of
COVID‐19: Review and prospects. Innov. Infrastruct. Solut. 2021, 6, 1–10.
34. Khan, W.Z.; Ahmed, E.; Hakak, S.; Yaqoob, I.; Ahmed, A. Edge computing: A survey. Future Gener. Comput. Syst. 2019, 97, 219–
235.
35. Shin, M.K.; Nam, K.H.; Kim, H.J. Software‐defined networking (SDN): A reference architecture and open APIs. In Proceedings
of the 2012 International Conference on ICT Convergence (ICTC), Jeju, Korea, 15–17 October 2012; pp. 360–361.
36. Cwalina, K.J.; Abrams, B.M.; Moore, A.J.; Anderson, C.L.; Pizzo, M.; Brigham, I.R.A. U.S. Patent No. 7,430,732 ‐ Design of
application programming interfaces (APIs); Washington, DC: U.S. Patent and Trademark Office. 30‐09‐2008.
37. Naylor, D.; Finamore, A.; Leontiadis, I.; Grunenberger, Y.; Mellia, M.; Munafò; MPapagiannaki, K.; Steenkiste, P. The cost of
theʺ sʺ in https. In Proceedings of the 10th ACM International on Conference on emerging Networking Experiments and
Technologies; Sidney, Australia, December 2014; pp. 133–140.
38. Dizdarević; J.; Carpio, F.; Jukan, A.; Masip‐Bruin, X. A survey of communication protocols for internet of things and related
challenges of fog and cloud computing integration. ACM Comput. Surv. (CSUR) 2019, 51, 1–29.
39. The Raspberry Pi Foundation. Raspberry Pi Products. Available online: https://www.raspberrypi.org/products/ (accessed on 21
January 2021).
40. The Raspberry Pi Foundation. Raspberry Pi Zero W. Available online: https://www.raspberrypi.org/products/raspberry‐pi‐
zero‐w/ (accessed on 21st January 2021).
41. The Raspberry Pi Foundation. Raspberry Pi Camera Module V2. Available online:
https://www.raspberrypi.org/products/camera‐module‐v2/ (accessed on 21 January 2021).
42. The Raspberry Pi Foundation. Raspberry Pi 3 Model B. Available online: https://www.raspberrypi.org/products/raspberry‐pi‐
3‐model‐b/ (accessed on 21 January 2021).
43. SIA Mikrotīkls. MikroTik hAP. Available online: https://mikrotik.com/product/RB951Ui‐2nD (accessed on 21 January 2021).
44. Venkateswaran, R. Virtual private networks. IEEE Potentials 2001, 20, 11–15.
45. Lozoya‐de‐Diego, A.; Villalba‐de‐Benito, M.T.; Arias‐Pou, M. Taxonomía de información personal de salud para garantizar la
privacidad de los individuos. Prof. De La Inf. 2017, 26, 293–302.
46. Rosenbrock, A. ImUtils Library. Available online: https://github.com/jrosebr1/imutils (accessed on 25 January 2021).
47. Singh, K.J.; Kapoor, D.S. Create Your Own Internet of Things: A survey of IoT platforms. IEEE Consum. Electron. Mag. 2017, 6,
57–68.
48. OpenCV Team. OpenCV: Smoothing Images. Available online:
https://docs.opencv.org/3.4/dc/dd3/tutorial_gausian_median_blur_bilateral_filter.html (accessed on 25 January 2021).
49. Karam, G.M. Visualization using timelines. In Proceedings of the 1994 ACM SIGSOFT International Symposium on Software
Testing and Analysis; Association for Computing Machinery, Seattle, USA, 17 August 1994; pp. 125‐137.

Sensors 2021, 21, 6051 22 of 22
50. Nurseitov, N.; Paulson, M.; Reynolds, R.; Izurieta, C. Comparison of JSON and XML data interchange formats: A case study.
Caine 2009, 9, 157–162.
51. Huwer, S.; Niemann, H. Adaptive change detection for real‐time surveillance applications. In Proceedings of the Third IEEE
International Workshop on Visual Surveillance, Dublin, Ireland, 1 July 2000; pp. 37–46.