
Monitoring online cutting tool wear using low-cost technique and user-friendly GUI
6
Wear 271 (2011) 2619–2624 Contents lists available at ScienceDirect Wear jou rnal h om epage: www.elsevier.com/locate/wear Short communication Monitoring online cutting tool wear using low-cost technique and user-friendly GUI J.A. Ghani ∗ , M. Rizal, M.Z. Nuawi, M.J. Ghazali, C.H.C. Haron Department of Mechanical and Materials Engineering, Faculty of Engineering and Built Environment, Universiti Kebangsaan Malaysia, 43600 Bangi, Malaysia a r t i c l e i n f o Article history: Received 20 August 2010 Received in revised form 18 January 2011 Accepted 18 January 2011 Keywords: Flank wear Low-cost monitoring Strain gauge I-Kaz TM method a b s t r a c t Cutting tool wear is known to affect tool life, surface quality and production time. Because of this an online tool wear measurement and monitoring system has been developed, using a low-cost sensor. The system is able to detect and analyze signals relating to the deflection of the tool holder from the cutting force, and the corresponding estimation of wear is displayed on the computer screen. New statistical analysis is used to identify and characterise the changes in signals from the sensors. A two-channel strain gauge is mounted at the tool holder to measure the deflection in both tangential direction and feed direction. The signal is transmitted to the signal conditioning device, then to data acquisition, and finally to the computer system. MATLAB software is used as the platform software to develop a user-friendly graphical user interface (GUI) for online monitoring purposes. Results show that this developed online monitoring system, using the strain gauge signal, is an effective method of detecting the progression of flank wear width during machining. This is an efficient and low-cost method which can be used in the real machining industry to predict the level of wear in the cutting tool. © 2011 Elsevier B.V. All rights reserved. 1. Introduction In recent years the importance of tool wear monitoring has been recognized in manufacturing industries. In practice, approximately 20% of the downtime of machine tools is reported to be due to tool failure, and the cost of cutting tools and their replacement accounts for between 3 and 12% of total production costs [1,2]. In order to improve the quality of machined parts, reduce production time and save costs, tool condition monitoring systems have been extensively studied by researchers since the late 1980s [3]. Several methods have been proposed to monitor tool wear. There are two main categories: direct methods and indirect meth- ods. Direct methods, such as machine vision systems, use a charged-couple-device (CCD) camera or optical microscope [1–4]. Direct methods have the advantage of capturing actual geometric changes arising from the wear of the tool. However, direct mea- surements are very difficult to obtain due to the continuous contact between the tool and the workpiece, and are made almost impos- sible by the presence of coolant fluids. These difficulties severely limit the application of a direct approach [5,14]. Indirect methods correlate or match appropriate sensor signals to tool wear states. The advantages are a less complicated setup and greater suitability to practical application. In indirect methods, tool condition is not ∗ Corresponding author. Tel.: +60 3 8921 6505; fax: +60 3 8925 9659. E-mail address: [email protected] (J.A. Ghani). captured directly, but estimated from the measurable signal fea- ture. This signal feature is extracted through signal processing steps to obtain a sensitive and accurate representation of its state. Indi- rect methods include those based on sensing of the cutting forces [6,7], vibrations [8,9], acoustic emission [10,11], motor current [12] and other elements [13]. Cutting force is generally considered one of the most significant variables in the turning process [14]. It has been widely recognised that variation in the cutting force can be correlated to tool wear, as a result of the variations produced by friction between cutting tool flank and workpiece [15,16]. Tool dynamometers are commonly used to record these cutting forces [13]. However, dynamometers are not suitable instruments for shop floor use due to their high cost, negative impact on machining system rigidity, geometric lim- itations and lack of overload protection [17]. Therefore, a low-cost system for measuring cutting forces is necessary. In the past, Schef- fer and Heyns [18] used a simple sensor-integrated tool holder using strain gauges, and Audy [19] also presents an overview of techniques and equipment used for measuring cutting forces using a strain gauge-based system. Many approaches to online monitoring have been explored. Zhang and Chen [20] developed software using VBA and SoftWIRE to monitor tool condition in a CNC end-milling machining process, based on the vibration signal collected through a microcontroller- based data acquisition system. They used the Fast Fourier Transform (FFT) function, and its graphic display was integrated into the software program developed by SoftWIRE. Choudhury and 0043-1648/$ – see front matter © 2011 Elsevier B.V. All rights reserved. doi:10.1016/j.wear.2011.01.038
-
Upload
independent -
Category
Documents
-
view
3 -
download
0
Transcript of Monitoring online cutting tool wear using low-cost technique and user-friendly GUI

S
Mu
JD
a
ARRA
KFLSI
1
r2taote
TocDcsbslcTt
0d
Wear 271 (2011) 2619– 2624
Contents lists available at ScienceDirect
Wear
jou rna l h om epage: www.elsev ier .com/ locate /wear
hort communication
onitoring online cutting tool wear using low-cost technique andser-friendly GUI
.A. Ghani ∗, M. Rizal, M.Z. Nuawi, M.J. Ghazali, C.H.C. Haronepartment of Mechanical and Materials Engineering, Faculty of Engineering and Built Environment, Universiti Kebangsaan Malaysia, 43600 Bangi, Malaysia
r t i c l e i n f o
rticle history:eceived 20 August 2010eceived in revised form 18 January 2011ccepted 18 January 2011
a b s t r a c t
Cutting tool wear is known to affect tool life, surface quality and production time. Because of this anonline tool wear measurement and monitoring system has been developed, using a low-cost sensor. Thesystem is able to detect and analyze signals relating to the deflection of the tool holder from the cuttingforce, and the corresponding estimation of wear is displayed on the computer screen. New statisticalanalysis is used to identify and characterise the changes in signals from the sensors. A two-channel strain
eywords:lank wearow-cost monitoringtrain gauge-KazTM method
gauge is mounted at the tool holder to measure the deflection in both tangential direction and feeddirection. The signal is transmitted to the signal conditioning device, then to data acquisition, and finallyto the computer system. MATLAB software is used as the platform software to develop a user-friendlygraphical user interface (GUI) for online monitoring purposes. Results show that this developed onlinemonitoring system, using the strain gauge signal, is an effective method of detecting the progression offlank wear width during machining. This is an efficient and low-cost method which can be used in the
o pre
real machining industry t. Introduction
In recent years the importance of tool wear monitoring has beenecognized in manufacturing industries. In practice, approximately0% of the downtime of machine tools is reported to be due toool failure, and the cost of cutting tools and their replacementccounts for between 3 and 12% of total production costs [1,2]. Inrder to improve the quality of machined parts, reduce productionime and save costs, tool condition monitoring systems have beenxtensively studied by researchers since the late 1980s [3].
Several methods have been proposed to monitor tool wear.here are two main categories: direct methods and indirect meth-ds. Direct methods, such as machine vision systems, use aharged-couple-device (CCD) camera or optical microscope [1–4].irect methods have the advantage of capturing actual geometrichanges arising from the wear of the tool. However, direct mea-urements are very difficult to obtain due to the continuous contactetween the tool and the workpiece, and are made almost impos-ible by the presence of coolant fluids. These difficulties severely
imit the application of a direct approach [5,14]. Indirect methodsorrelate or match appropriate sensor signals to tool wear states.he advantages are a less complicated setup and greater suitabilityo practical application. In indirect methods, tool condition is not∗ Corresponding author. Tel.: +60 3 8921 6505; fax: +60 3 8925 9659.E-mail address: [email protected] (J.A. Ghani).
043-1648/$ – see front matter © 2011 Elsevier B.V. All rights reserved.oi:10.1016/j.wear.2011.01.038
dict the level of wear in the cutting tool.© 2011 Elsevier B.V. All rights reserved.
captured directly, but estimated from the measurable signal fea-ture. This signal feature is extracted through signal processing stepsto obtain a sensitive and accurate representation of its state. Indi-rect methods include those based on sensing of the cutting forces[6,7], vibrations [8,9], acoustic emission [10,11], motor current [12]and other elements [13].
Cutting force is generally considered one of the most significantvariables in the turning process [14]. It has been widely recognisedthat variation in the cutting force can be correlated to tool wear, asa result of the variations produced by friction between cutting toolflank and workpiece [15,16]. Tool dynamometers are commonlyused to record these cutting forces [13]. However, dynamometersare not suitable instruments for shop floor use due to their highcost, negative impact on machining system rigidity, geometric lim-itations and lack of overload protection [17]. Therefore, a low-costsystem for measuring cutting forces is necessary. In the past, Schef-fer and Heyns [18] used a simple sensor-integrated tool holderusing strain gauges, and Audy [19] also presents an overview oftechniques and equipment used for measuring cutting forces usinga strain gauge-based system.
Many approaches to online monitoring have been explored.Zhang and Chen [20] developed software using VBA and SoftWIRE
to monitor tool condition in a CNC end-milling machining process,based on the vibration signal collected through a microcontroller-based data acquisition system. They used the Fast FourierTransform (FFT) function, and its graphic display was integratedinto the software program developed by SoftWIRE. Choudhury and
2620 J.A. Ghani et al. / Wear 271 (2011) 2619– 2624
Nomenclature
ch channelDc depth of cut, mmFz tangential force, NFx feed force, Nf feed rate, mm/revFCD Ferum Casting DuctileK kurtosisMr the rth order of momentN number of data pointss standard deviationVB flank wear width, mmV cutting speed, m/min
Stdttfltmtmcl
m(ubNmdalp
2
eiawc
2
ga0swCtCscT
Table 1Experimental design.
Experiment no. Cutting speed,Vc (m/min)
Feed rate, f(mm/rev)
Depth of, Dc ,cut (mm)
1 180 0.15 0.52 180 0.20 13 180 0.25 1.54 230 0.15 15 230 0.20 1.56 230 0.25 0.5
c
Z∞2 I-KazTM 2D coefficient
� variance of data
rivinas [21] developed a mathematical model (regression model)o predict the flank wear on a cutting tool. The wear was pre-icted taking into account the cutting conditions. Parameters forhe model were estimated from experimental data. They concludedhat the predicted results correlated well with measured values ofank wear. Chen and Li [7] developed a tool wear observer modelo monitor flank wear when machining nickel-based alloys. The
odel can be implemented in an online tool wear monitoring sys-em which predicts the actual state of tool wear in real time by
easuring the cutting force variations. The correlation betweenutting force components and flank wear width has been estab-ished through experimental studies.
This paper will describe the application of a low-cost sensor foronitoring online cutting tool wear with a Graphical User Interface
GUI), by measuring cutting tool deflection and analysing its signalsing a new statistical-based method called Integrated Kurtosis-ased Algorithm for Z-filter Technique (I-KazTM), pioneered byuawi [22]. Machining experiments were carried out, using CNCachines, to collect data which related the signal from cutting tool
eflection to gradual flank wear. Several equations of flank wearnd signal characteristic correlation were then installed on a Mat-ab GUI program, in order to monitor and predict online flank wearrogression in the turning process.
. Methodology
There are two stages involved in this study. Stage 1: machiningxperiments for data collection, and database development relat-ng to flank wear and its signal characteristic. Stage 2: developing
user-friendly GUI using Matlab GUI programming for online toolear monitoring and prediction of flank wear in the turning pro-
ess.
.1. Design and procedure of the experiment
In this study, FCD700 (JIS) grade ductile cast iron with sphericalraphite and ferrite was chosen as the workpiece material, with
composition by wt% of: 3.32% C, 2.68% Si, 0.46% Mn, 0.028% P,.018% S, 0.85% Cu and 0.09% Mg. The Brinell hardness and ten-ile strength were in the range of 241 HB and 845 MPa respectivelyith elongation of 6%. The machining tests were carried out on aNC Colchester Master Tornado T4 lathe machine, under dry cut-
ing conditions. The tool used was a coated carbide insert (ToolmexNMG120404-MB) with NC30P grade 5. The tool had a rhombic 80◦hape, 4.76 mm thickness and 0.4 mm nose radius. This grade ofarbide tool is suitable for heavy duty cutting of cast iron and steel.wo strain gauges were mounted on a simple tool holder and used
7 270 0.15 1.58 270 0.20 0.59 270 0.25 1
to detect the dynamic changes in both Fz (tangential direction) andFx (feed direction) in cutting tool deflection. The direction of radialforce, Fy, was approximately zero and was ignored [19]. Differentcombinations of machining parameters were selected using theTaguchi method. The Taguchi method is a cost-effective and time-saving method of exploring inter-relationships between variousparameters [23]. It has been extensively used to determine opti-mum parameters. An L9 (33̂) orthogonal array was chosen becauseof its minimum number of experimental trials. The three mainmachining parameters, namely cutting speed, feed rate and depthof cut, were set prior to the machining run. Three levels of cut-ting speed (Vc = 180, 230 and 270 m/min), three levels of feed rate(f = 0.15, 0.20 and 0.25 mm/rev) and three levels of depth of cut(Dc = 0.5, 1 and 1.5 mm) were used. Therefore nine combinations ofthose cutting parameters were taken into consideration as shownin Table 1. The ranges for the cutting parameters were selectedbased on the real turning operation of FCD 700 carried out in oneof the local automotive industries for producing camshafts andcrankshafts.
During the turning operation, the insert was periodicallyremoved from the tool holder, and the flank wear on the flank facewas measured using a Mitutoyo toolmaker’s microscope equippedwith a graduated scale in mm. The measured parameter to repre-sent the progress of wear was flank wear width, VB. The turningoperation was stopped and the insert was discarded when VBreached 0.3 mm. This is a standard recommended value in defininga tool life end-point criterion based on ISO 3685:1993 [24].
In order to detect the deflection effect, the distance betweenthe strain gauge and the tip of the tool insert was 45 mm. Thesensors were connected to a signal conditioning device using twowires sheathed in cable to avoid noise. The transfer cable was thencovered with aluminum foil to protect it from damage caused bychips. A beam shaped tool holder with sectional size 20 × 20 mmwas used in the study. The sensor configuration used a half bridgestrain gauge set in the signal conditioning device. The samplingrate was set at 1 kHz and zero calibration was carried out beforethe experimental machining.
The signals were captured in two channels in the time domain.Every step in the machining process provided one set of cuttingtool deflection signals. These signals were analyzed using I-KazTM
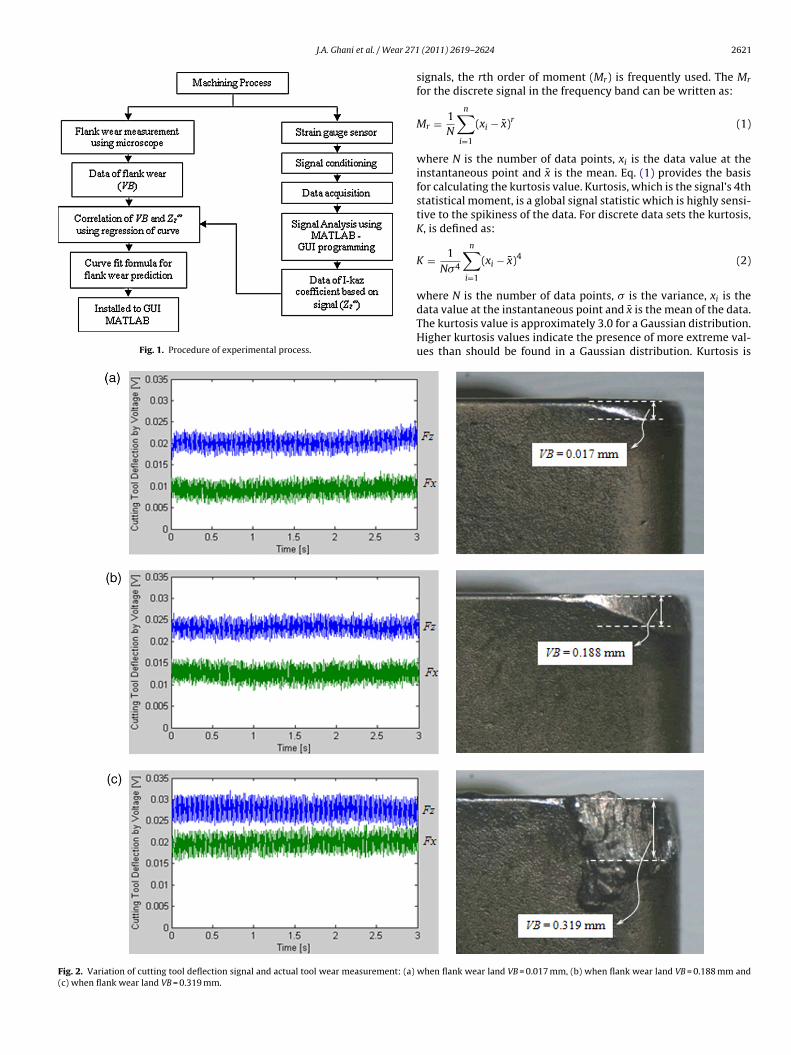
to estimate the characteristic due to flank wear. The correlationsbetween signals characteristic and flank wear data were compiledand installed in the software program to provide a database forprediction purposes. The flow chart of the experimental process isshown in Fig. 1.
2.2. Signal analysis method
The signal analysis method used was a statistical signal pro-cessing based on Kurtosis I-KazTM method. The I-KazTM methodwas pioneered by Nuawi [22], who studied random or non-deterministic signal characteristics. In order to classify random
J.A. Ghani et al. / Wear 271
Fig. 1. Procedure of experimental process.
Fig. 2. Variation of cutting tool deflection signal and actual tool wear measurement: (a)
(c) when flank wear land VB = 0.319 mm.
(2011) 2619– 2624 2621
signals, the rth order of moment (Mr) is frequently used. The Mr
for the discrete signal in the frequency band can be written as:
Mr = 1N
n∑i=1
(xi − x̄)r (1)
where N is the number of data points, xi is the data value at theinstantaneous point and x̄ is the mean. Eq. (1) provides the basisfor calculating the kurtosis value. Kurtosis, which is the signal’s 4thstatistical moment, is a global signal statistic which is highly sensi-tive to the spikiness of the data. For discrete data sets the kurtosis,K, is defined as:
K = 1N�4
n∑i=1
(xi − x̄)4 (2)
where N is the number of data points, � is the variance, xi is thedata value at the instantaneous point and x̄ is the mean of the data.The kurtosis value is approximately 3.0 for a Gaussian distribution.Higher kurtosis values indicate the presence of more extreme val-ues than should be found in a Gaussian distribution. Kurtosis is
when flank wear land VB = 0.017 mm, (b) when flank wear land VB = 0.188 mm and

2 ar 271 (2011) 2619– 2624
us
tdtKt
I
wocu
Z
wss
3
twga
cflttatFos1
tobtmosVwatsV
ooiioFTiFa
622 J.A. Ghani et al. / We
sed in engineering for detection of fault symptoms because of itsensitivity to high amplitude events.
Based on kurtosis, the method provides a graphical represen-ation of the measured signal distribution. Specifically, the timeomain signal was decomposed into two signals channels. In ordero measure the degree of scattering in the data distribution, the I-azTM coefficient calculates the distance of each data point from
he signal’s centroid. I-KazTM coefficient was defined as:
-kaz 2D coef =√
1N
(MI
4
)+ 1
N
(MII
4
)(3)
here N is the number of data points and MI4, MII
4 are the 4th orderf moment in channel I and channel II respectively. The I-KazTM
oefficient was substituted in Eq. (4) and the symbol of Z∞2 was
sed to represent the I-KazTM coefficient.
∞2 = 1
N
√KIs4
I + KIIs4II (4)
here N is the number of data points, KI and KII are the kurtosis ofignal in ch-I and ch-II, and sI and sII are the standard deviation ofignal in ch-I and ch-II respectively.
. Results and Discussion
Nine experimental machining were performed to collect cuttingool deflection signals. The signals from two strain gauge sensorsere used to measure deflection on the tool holder relating to tan-
ential direction (Fz) and feed direction (Fx) due to cutting forcection.
For every set of experiments, two sets of data were obtained:utting tool deflection signals and tool wear value from actualank wear width, measured with a microscope. The signals andool wear data were recorded from the first cutting until the cut-ing tool wear reached 0.3 mm. As an example, the raw signals andctual tool wear of the tool insert from the end of the first cut-ing, mid cutting and at the end of the last cutting are shown inig. 2(a), (b) and (c) respectively. These figures show the signalbtained when cutting FCD700 FCD ductile cast iron at a cuttingpeed of 180 m/min, feed rate of 0.25 mm/rev and depth of cut of.5 mm.
During turning of the FCD700 ductile cast iron under dry condi-ions, the amplitude of cutting signals increased with the widthf flank wear width. The amplitude of cutting signals increasedy 40% from the beginning of the cut (sharp tool) until theool was worn out. Therefore, the influence of flank wear in
achining force was very significant. Fig. 2(a) shows the thirdf fifteen steps during the cutting operation, and wear stage istill in its initial ‘break-in’ period, with a flank wear width ofB = 0.017 mm. This period lasts only a few minutes, after whichear occurs at fairly uniform rate as shown in Fig. 2(b). At
flank wear width of VB = 0.188 mm, an increase in the cut-ing tool deflection signals was observed and recorded. Fig. 2(c)hows the cutting tool deflection signals at a flank wear width ofB = 0.319 mm.
The machining test aims to collect the cutting signals data inrder to build a database that can be used for online monitoringf cutting tool wear. Based on the I-KazTM method, every machin-ng signal has its own characteristic feature due to the effect ofncreasing flank wear. Eq. (4) is used to calculate the characteristicf raw signals. In this method, components of the machining force,
z, and Fx are converted into channel I and channel II respectively.herefore, the calculation of the value of the signal characteristics called the I-KazTM 2D coefficient, indicated as Z∞2 . For example,ig. 3 shows the I-KazTM 2D coefficient versus flank wear widtht various cutting speeds and feed rates while depth of cut is kept
Fig. 3. Correlation between the I-KazTM 2D coefficient and flank wear at variouscutting parameters.
constant. It shows that trend correlation of the curve indicates adecrease in the coefficient of Z∞
2 when flank wear increases. Thisdecline in the coefficient of Z∞
2 is in accordance with the trend ofpower-law curve fit.
Fig. 3 shows that experimental data based on cutting tool deflec-tion signals can be used as an input parameter for flank wearprediction. The R-square value of the regression coefficients atVc = 180 m/min and f = 0.20 mm/rev is 0.991; when Vc = 230 m/minand f = 0.25 mm/rev it is 0.938, and when Vc = 270 m/min andf = 0.15 mm/rev it is 0.941. Comparing these R-square values, thebest regression is indicated at Vc = 180 m/min and f = 0.20 mm/rev.Based on the results of curve fitting a new equation is derived,which can be used to detect the flank wear. The equation basedon power-law curve fitting is shown as Eq. (5) below.
y = ax−n (5)
where y is the value of I-KazTM 2D coefficient, Z∞2 , a and n are con-
stants which depend on the cutting parameter, and x is the valueof flank wear, VB. Therefore Eq. (5) can be written as:
Z∞2 = a(VB)−n (6)
In this case, when cutting at Vc = 180 m/min and f = 0.20 mm/rev,the values of a and n were 5 × 10⁻¹⁰ and −0.4692 respectively.When cutting at Vc = 230 m/min and f = 0.25 mm/rev, the value ofa and n were 5 × 10⁻¹⁰ and −0.4793 respectively. Then, cuttingat Vc = 270 m/min and f = 0.15 mm/rev, the value of a and n were5 × 10−10 and −0.4738 respectively. Eq. (6) is the main formula forestimating flank wear in the turning process. The graphical userinterface displays the flank wear in real time by capturing andanalyzing the cutting force signal.
The GUI was tested with various cutting parameters to obtain areal time prediction of the flank wear width. The aim of the testingwas to compare the performance of flank wear prediction usingthe developed low-cost monitoring technique, with actual flankwear measurement. In order to compare the performance of thetwo tool wear prediction processes, some of the cutting parame-ters were selected to represent the testing, as shown in Fig. 4. Theinput parameter was the cutting tool deflection signal that was cal-culated using the mathematical model in Eq. (6). The equation wasprogrammed into the database of the online tool wear monitoringsystem. Fig. 4 shows the comparison of predicted and actual toolwear magnitude measured with different sets of cutting param-
eters: Fig. 4(a) when cutting condition Vc = 180 m/min and feedrate = 0.2 mm/rev, (b) Vc = 230 m/min and feed rate = 0.25 mm/rev,(c) Vc = 270 m/min and feed rate = 0.15 mm/rev, and all with a depthof cut of 1 mm. A plot was drawn with the actual measured flankwear values on the x-axis and the predicted values on the y-axis.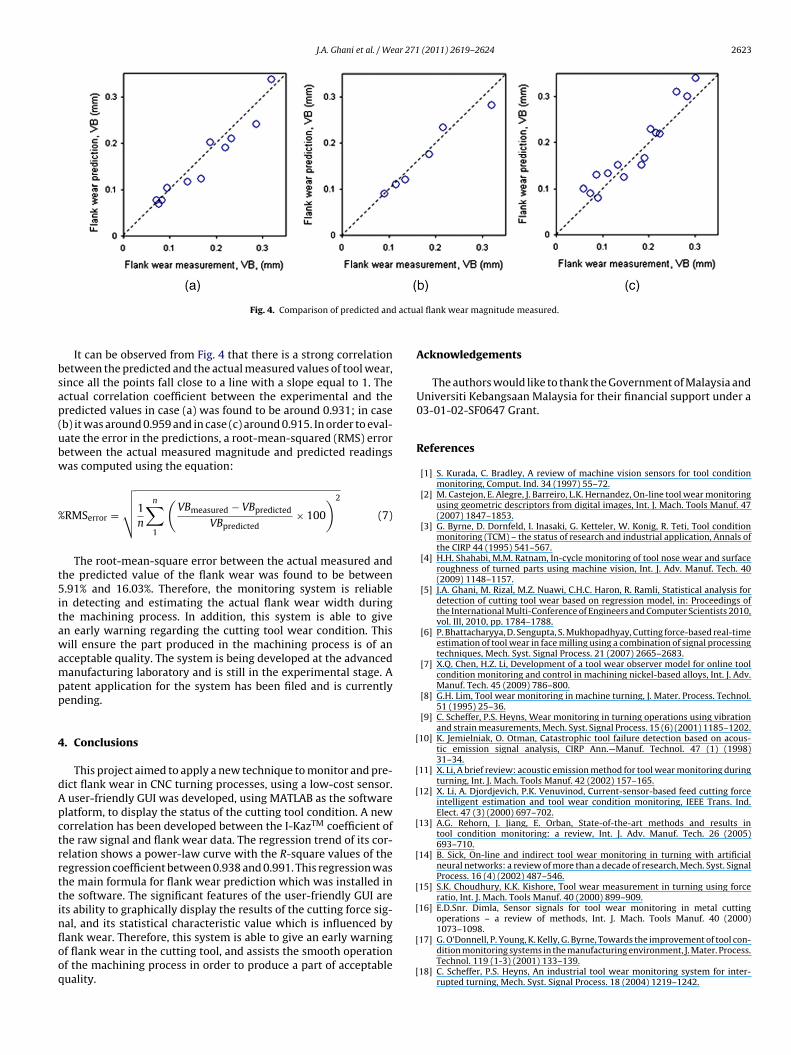
J.A. Ghani et al. / Wear 271 (2011) 2619– 2624 2623
actua
bsap(ubw
%
t5itawampp
4
dApctrrttinflooq
[
[
[
[
[
[
[
Fig. 4. Comparison of predicted and
It can be observed from Fig. 4 that there is a strong correlationetween the predicted and the actual measured values of tool wear,ince all the points fall close to a line with a slope equal to 1. Thectual correlation coefficient between the experimental and theredicted values in case (a) was found to be around 0.931; in caseb) it was around 0.959 and in case (c) around 0.915. In order to eval-ate the error in the predictions, a root-mean-squared (RMS) erroretween the actual measured magnitude and predicted readingsas computed using the equation:
RMSerror =
√√√√1n
n∑1
(VBmeasured − VBpredicted
VBpredicted× 100
)2
(7)
The root-mean-square error between the actual measured andhe predicted value of the flank wear was found to be between.91% and 16.03%. Therefore, the monitoring system is reliable
n detecting and estimating the actual flank wear width duringhe machining process. In addition, this system is able to given early warning regarding the cutting tool wear condition. Thisill ensure the part produced in the machining process is of an
cceptable quality. The system is being developed at the advancedanufacturing laboratory and is still in the experimental stage. A
atent application for the system has been filed and is currentlyending.
. Conclusions
This project aimed to apply a new technique to monitor and pre-ict flank wear in CNC turning processes, using a low-cost sensor.
user-friendly GUI was developed, using MATLAB as the softwarelatform, to display the status of the cutting tool condition. A neworrelation has been developed between the I-KazTM coefficient ofhe raw signal and flank wear data. The regression trend of its cor-elation shows a power-law curve with the R-square values of theegression coefficient between 0.938 and 0.991. This regression washe main formula for flank wear prediction which was installed inhe software. The significant features of the user-friendly GUI arets ability to graphically display the results of the cutting force sig-
al, and its statistical characteristic value which is influenced byank wear. Therefore, this system is able to give an early warningf flank wear in the cutting tool, and assists the smooth operationf the machining process in order to produce a part of acceptableuality.[
[
l flank wear magnitude measured.
Acknowledgements
The authors would like to thank the Government of Malaysia andUniversiti Kebangsaan Malaysia for their financial support under a03-01-02-SF0647 Grant.
References
[1] S. Kurada, C. Bradley, A review of machine vision sensors for tool conditionmonitoring, Comput. Ind. 34 (1997) 55–72.
[2] M. Castejon, E. Alegre, J. Barreiro, L.K. Hernandez, On-line tool wear monitoringusing geometric descriptors from digital images, Int. J. Mach. Tools Manuf. 47(2007) 1847–1853.
[3] G. Byrne, D. Dornfeld, I. Inasaki, G. Ketteler, W. Konig, R. Teti, Tool conditionmonitoring (TCM) – the status of research and industrial application, Annals ofthe CIRP 44 (1995) 541–567.
[4] H.H. Shahabi, M.M. Ratnam, In-cycle monitoring of tool nose wear and surfaceroughness of turned parts using machine vision, Int. J. Adv. Manuf. Tech. 40(2009) 1148–1157.
[5] J.A. Ghani, M. Rizal, M.Z. Nuawi, C.H.C. Haron, R. Ramli, Statistical analysis fordetection of cutting tool wear based on regression model, in: Proceedings ofthe International Multi-Conference of Engineers and Computer Scientists 2010,vol. III, 2010, pp. 1784–1788.
[6] P. Bhattacharyya, D. Sengupta, S. Mukhopadhyay, Cutting force-based real-timeestimation of tool wear in face milling using a combination of signal processingtechniques, Mech. Syst. Signal Process. 21 (2007) 2665–2683.
[7] X.Q. Chen, H.Z. Li, Development of a tool wear observer model for online toolcondition monitoring and control in machining nickel-based alloys, Int. J. Adv.Manuf. Tech. 45 (2009) 786–800.
[8] G.H. Lim, Tool wear monitoring in machine turning, J. Mater. Process. Technol.51 (1995) 25–36.
[9] C. Scheffer, P.S. Heyns, Wear monitoring in turning operations using vibrationand strain measurements, Mech. Syst. Signal Process. 15 (6) (2001) 1185–1202.
10] K. Jemielniak, O. Otman, Catastrophic tool failure detection based on acous-tic emission signal analysis, CIRP Ann.—Manuf. Technol. 47 (1) (1998)31–34.
11] X. Li, A brief review: acoustic emission method for tool wear monitoring duringturning, Int. J. Mach. Tools Manuf. 42 (2002) 157–165.
12] X. Li, A. Djordjevich, P.K. Venuvinod, Current-sensor-based feed cutting forceintelligent estimation and tool wear condition monitoring, IEEE Trans. Ind.Elect. 47 (3) (2000) 697–702.
13] A.G. Rehorn, J. Jiang, E. Orban, State-of-the-art methods and results intool condition monitoring: a review, Int. J. Adv. Manuf. Tech. 26 (2005)693–710.
14] B. Sick, On-line and indirect tool wear monitoring in turning with artificialneural networks: a review of more than a decade of research, Mech. Syst. SignalProcess. 16 (4) (2002) 487–546.
15] S.K. Choudhury, K.K. Kishore, Tool wear measurement in turning using forceratio, Int. J. Mach. Tools Manuf. 40 (2000) 899–909.
16] E.D.Snr. Dimla, Sensor signals for tool wear monitoring in metal cuttingoperations – a review of methods, Int. J. Mach. Tools Manuf. 40 (2000)
1073–1098.17] G. O’Donnell, P. Young, K. Kelly, G. Byrne, Towards the improvement of tool con-dition monitoring systems in the manufacturing environment, J. Mater. Process.Technol. 119 (1-3) (2001) 133–139.
18] C. Scheffer, P.S. Heyns, An industrial tool wear monitoring system for inter-rupted turning, Mech. Syst. Signal Process. 18 (2004) 1219–1242.

2 ar 271
[
[
[
[
624 J.A. Ghani et al. / We
19] J. Audy, An appraisal of techniques and equipment for cutting force measure-ment, J. Zhejiang Univ. Sci. A 7 (11) (2006) 1781–1789.
20] J.C. Zhang, J.C. Chen, Tool condition monitoring in an end-milling oper-ation based on the vibration signal collected through a microcontroller-based data acquisition system, Int. J. Adv. Manuf. Tech. 39 (2008)118–128.
21] S.K. Choudhury, P. Srinivas, Tool wear prediction in turning, J. Mater. Process.Technol. 153–154 (2004) 276–280.
[
[
(2011) 2619– 2624
22] M.Z. Nuawi, F. Lamin, M.J.M. Nor, N. Jamaluddin, S. Abdullah, C.K.E. Nizwan,Development of integrated kurtosis-based algorithm for z-filter technique, J.
Appl. Sci. 8 (8) (2008) 1541–1547.23] J. Ross, Taguchi Techniques for Quality Engineering, McGraw-Hill, Inc., NewYork, 1996.
24] ISO (International Organization for Standardization) (Ed.), Tool-life Testingwith Single-Point Turning Tools (ISO 3685), 2nd edition, Reference NumberISO 3685: (1993)(E).