Cost Effectiveness Analysis of Clinically Driven versus Routine Laboratory Monitoring of...
10
Cost Effectiveness Analysis of Clinically Driven versus Routine Laboratory Monitoring of Antiretroviral Therapy in Uganda and Zimbabwe Antonieta Medina Lara 1 , Jesse Kigozi 2 , Jovita Amurwon 3 , Lazarus Muchabaiwa 4 , Barbara Nyanzi Wakaholi 3 , Ruben E. Mujica Mota 1 , A. Sarah Walker 5 , Ronnie Kasirye 3 , Francis Ssali 2 , Andrew Reid 4 , Heiner Grosskurth 3 , Abdel G. Babiker 5 , Cissy Kityo 2 , Elly Katabira 6 , Paula Munderi 3 , Peter Mugyenyi 2 , James Hakim 4 , Janet Darbyshire 5 , Diana M. Gibb 5 , Charles F. Gilks 7 * on behalf of the DART Trial Team 1 Health Economics Group, Peninsula College of Medicine and Dentistry, Exeter University, Exeter, United Kingdom, 2 Joint Clinical Research Centre, Kampala, Uganda, 3 Medical Research Council/Uganda Virus Research Institute Research Unit on AIDS, Entebbe, Uganda, 4 University of Zimbabwe Clinical Research Centre, Harare, Zimbabwe, 5 Medical Research Council Clinical Trials Unit, London, United Kingdom, 6 Infectious Diseases Institute, Kampala, Uganda, 7 Faculty of Medicine, Imperial College London, London, United Kingdom Abstract Background: Despite funding constraints for treatment programmes in Africa, the costs and economic consequences of routine laboratory monitoring for efficacy and toxicity of antiretroviral therapy (ART) have rarely been evaluated. Methods: Cost-effectiveness analysis was conducted in the DART trial (ISRCTN13968779). Adults in Uganda/Zimbabwe starting ART were randomised to clinically-driven monitoring (CDM) or laboratory and clinical monitoring (LCM); individual patient data on healthcare resource utilisation and outcomes were valued with primary economic costs and utilities. Total costs of first/second-line ART, routine 12-weekly CD4 and biochemistry/haematology tests, additional diagnostic investigations, clinic visits, concomitant medications and hospitalisations were considered from the public healthcare sector perspective. A Markov model was used to extrapolate costs and benefits 20 years beyond the trial. Results: 3316 (1660LCM;1656CDM) symptomatic, immunosuppressed ART-naive adults (median (IQR) age 37 (32,42); CD4 86 (31,139) cells/mm 3 ) were followed for median 4.9 years. LCM had a mean 0.112 year (41 days) survival benefit at an additional mean cost of $765 [95%CI:685,845], translating into an adjusted incremental cost of $7386 [3277,dominated] per life-year gained and $7793 [4442,39179] per quality-adjusted life year gained. Routine toxicity tests were prominent cost- drivers and had no benefit. With 12-weekly CD4 monitoring from year 2 on ART, low-cost second-line ART, but without toxicity monitoring, CD4 test costs need to fall below $3.78 to become cost-effective (,3xper-capita GDP, following WHO benchmarks). CD4 monitoring at current costs as undertaken in DART was not cost-effective in the long-term. Conclusions: There is no rationale for routine toxicity monitoring, which did not affect outcomes and was costly. Even though beneficial, there is little justification for routine 12-weekly CD4 monitoring of ART at current test costs in low-income African countries. CD4 monitoring, restricted to the second year on ART onwards, could be cost-effective with lower cost second-line therapy and development of a cheaper, ideally point-of-care, CD4 test. Citation: Medina Lara A, Kigozi J, Amurwon J, Muchabaiwa L, Nyanzi Wakaholi B, et al. (2012) Cost Effectiveness Analysis of Clinically Driven versus Routine Laboratory Monitoring of Antiretroviral Therapy in Uganda and Zimbabwe. PLoS ONE 7(4): e33672. doi:10.1371/journal.pone.0033672 Editor: Sean Emery, University of New South Wales, Australia Received November 21, 2011; Accepted February 14, 2012; Published April 24, 2012 Copyright: ß 2012 Medina Lara et al. This is an open-access article distributed under the terms of the Creative Commons Attribution License, which permits unrestricted use, distribution, and reproduction in any medium, provided the original author and source are credited. Funding: This work was supported by the United Kingdom (UK) Medical Research Council [grant number G0600344], the UK Department for International Development (DFID) and the Rockefeller Foundation. GlaxoSmithKline, Gilead Sciences, Boehringer-Ingelheim and Abbott Laboratories donated drugs for DART. These funders had no role in study design, data collection and analysis, decision to publish, or preparation of the manuscript. GlaxoSmithKline, Gilead Sciences, Boehringer-Ingelheim and Abbott Laboratories donated drugs for DART. Competing Interests: GlaxoSmithKline, Gilead Sciences, Boehringer-Ingelheim and Abbott Laboratories donated drugs for DART. There are no patents, products in development or marketed products to declare. This does not alter the authors’ adherence to all the PLoS ONE policies on sharing data and materials, as detailed online in the guide for authors. * E-mail: [email protected] Introduction It is essential to evaluate the economic impact of antiretroviral therapy (ART) programmes using a public health approach [1], to guide policymakers how best to prioritise scarce resources for HIV/AIDS care and treatment in the public sector. This is particularly important with the current financial crisis, threats to sustained HIV programme funding and the many individuals still in urgent need of first and increasingly second-line treatment, particularly in South and Eastern Africa [2–4]. Several studies have evaluated the clinical benefit [5–11] and cost-effectiveness [12–18] of different strategies for monitoring the safety and efficacy of ART. Results have been contradictory; for example, in one modelling study of ART in resource-limited PLoS ONE | www.plosone.org 1 April 2012 | Volume 7 | Issue 4 | e33672
Transcript of Cost Effectiveness Analysis of Clinically Driven versus Routine Laboratory Monitoring of...

Cost Effectiveness Analysis of Clinically Driven versusRoutine Laboratory Monitoring of Antiretroviral Therapyin Uganda and ZimbabweAntonieta Medina Lara1, Jesse Kigozi2, Jovita Amurwon3, Lazarus Muchabaiwa4, Barbara Nyanzi
Wakaholi3, Ruben E. Mujica Mota1, A. Sarah Walker5, Ronnie Kasirye3, Francis Ssali2, Andrew Reid4,
Heiner Grosskurth3, Abdel G. Babiker5, Cissy Kityo2, Elly Katabira6, Paula Munderi3, Peter Mugyenyi2,
James Hakim4, Janet Darbyshire5, Diana M. Gibb5, Charles F. Gilks7* on behalf of the DART Trial Team
1 Health Economics Group, Peninsula College of Medicine and Dentistry, Exeter University, Exeter, United Kingdom, 2 Joint Clinical Research Centre, Kampala, Uganda,
3 Medical Research Council/Uganda Virus Research Institute Research Unit on AIDS, Entebbe, Uganda, 4 University of Zimbabwe Clinical Research Centre, Harare,
Zimbabwe, 5 Medical Research Council Clinical Trials Unit, London, United Kingdom, 6 Infectious Diseases Institute, Kampala, Uganda, 7 Faculty of Medicine, Imperial
College London, London, United Kingdom
Abstract
Background: Despite funding constraints for treatment programmes in Africa, the costs and economic consequences ofroutine laboratory monitoring for efficacy and toxicity of antiretroviral therapy (ART) have rarely been evaluated.
Methods: Cost-effectiveness analysis was conducted in the DART trial (ISRCTN13968779). Adults in Uganda/Zimbabwestarting ART were randomised to clinically-driven monitoring (CDM) or laboratory and clinical monitoring (LCM); individualpatient data on healthcare resource utilisation and outcomes were valued with primary economic costs and utilities. Totalcosts of first/second-line ART, routine 12-weekly CD4 and biochemistry/haematology tests, additional diagnosticinvestigations, clinic visits, concomitant medications and hospitalisations were considered from the public healthcaresector perspective. A Markov model was used to extrapolate costs and benefits 20 years beyond the trial.
Results: 3316 (1660LCM;1656CDM) symptomatic, immunosuppressed ART-naive adults (median (IQR) age 37 (32,42); CD4 86(31,139) cells/mm3) were followed for median 4.9 years. LCM had a mean 0.112 year (41 days) survival benefit at anadditional mean cost of $765 [95%CI:685,845], translating into an adjusted incremental cost of $7386 [3277,dominated] perlife-year gained and $7793 [4442,39179] per quality-adjusted life year gained. Routine toxicity tests were prominent cost-drivers and had no benefit. With 12-weekly CD4 monitoring from year 2 on ART, low-cost second-line ART, but withouttoxicity monitoring, CD4 test costs need to fall below $3.78 to become cost-effective (,3xper-capita GDP, following WHObenchmarks). CD4 monitoring at current costs as undertaken in DART was not cost-effective in the long-term.
Conclusions: There is no rationale for routine toxicity monitoring, which did not affect outcomes and was costly. Eventhough beneficial, there is little justification for routine 12-weekly CD4 monitoring of ART at current test costs in low-incomeAfrican countries. CD4 monitoring, restricted to the second year on ART onwards, could be cost-effective with lower costsecond-line therapy and development of a cheaper, ideally point-of-care, CD4 test.
Citation: Medina Lara A, Kigozi J, Amurwon J, Muchabaiwa L, Nyanzi Wakaholi B, et al. (2012) Cost Effectiveness Analysis of Clinically Driven versus RoutineLaboratory Monitoring of Antiretroviral Therapy in Uganda and Zimbabwe. PLoS ONE 7(4): e33672. doi:10.1371/journal.pone.0033672
Editor: Sean Emery, University of New South Wales, Australia
Received November 21, 2011; Accepted February 14, 2012; Published April 24, 2012
Copyright: � 2012 Medina Lara et al. This is an open-access article distributed under the terms of the Creative Commons Attribution License, which permitsunrestricted use, distribution, and reproduction in any medium, provided the original author and source are credited.
Funding: This work was supported by the United Kingdom (UK) Medical Research Council [grant number G0600344], the UK Department for InternationalDevelopment (DFID) and the Rockefeller Foundation. GlaxoSmithKline, Gilead Sciences, Boehringer-Ingelheim and Abbott Laboratories donated drugs for DART.These funders had no role in study design, data collection and analysis, decision to publish, or preparation of the manuscript. GlaxoSmithKline, Gilead Sciences,Boehringer-Ingelheim and Abbott Laboratories donated drugs for DART.
Competing Interests: GlaxoSmithKline, Gilead Sciences, Boehringer-Ingelheim and Abbott Laboratories donated drugs for DART. There are no patents,products in development or marketed products to declare. This does not alter the authors’ adherence to all the PLoS ONE policies on sharing data and materials,as detailed online in the guide for authors.
* E-mail: [email protected]
Introduction
It is essential to evaluate the economic impact of antiretroviral
therapy (ART) programmes using a public health approach [1], to
guide policymakers how best to prioritise scarce resources for
HIV/AIDS care and treatment in the public sector. This is
particularly important with the current financial crisis, threats to
sustained HIV programme funding and the many individuals still
in urgent need of first and increasingly second-line treatment,
particularly in South and Eastern Africa [2–4].
Several studies have evaluated the clinical benefit [5–11] and
cost-effectiveness [12–18] of different strategies for monitoring the
safety and efficacy of ART. Results have been contradictory; for
example, in one modelling study of ART in resource-limited
PLoS ONE | www.plosone.org 1 April 2012 | Volume 7 | Issue 4 | e33672
settings [15], monitoring with viral loads or CD4 cell counts
compared with clinical assessment alone led to only modest
benefits in patient survival and drug resistance. Conversely, a
recent modelling study for Cote d’Ivoire, a lower-middle income
country with a GDP per capita of $1071, found both monitoring
strategies cost-effective [17]. A recently published trial from
Uganda concluded that, compared with clinical monitoring alone,
routine CD4 count monitoring is considerably more cost effective
alone than combined with viral load monitoring [18].
Here we present a cost-effectiveness analysis, from the public
healthcare perspective, of Laboratory and Clinical Monitoring
(LCM) compared with Clinically-Driven Monitoring (CDM) of
ART alongside a randomised controlled trial conducted in
Uganda and Zimbabwe [11].
Methods
Ethics Statement
The DART trial was approved by Research Ethics Committees
in Uganda, Zimbabwe and the UK, and all enrolled participants
gave individual informed consent.
Effectiveness and resource utilisation data were collected in the
Development of Antiretroviral Therapy (DART) trial, conducted
from 2003–2008 at 3 centres in Africa: Entebbe and Kampala
(plus satellite), Uganda; Harare, Zimbabwe. The trial compared
LCM (routine 12-weekly laboratory monitoring: CD4 counts for
efficacy; haematology and biochemistry for toxicity) with CDM
(CD4 counts never available to clinicians) in ART-naıve adults
($18 years) starting therapy with symptomatic HIV disease and
CD4,200 cells/mm3. Additional diagnostic investigations and
monitoring tests (except CD4 in CDM) could be requested
according to clinical judgement at routine visits, patient-initiated
visits or hospital admission. Concomitant medicines were
provided. The trial demonstrated no impact of routine toxicity
tests on any adverse event outcome; and a small, statistically
significant benefit of CD4 monitoring on HIV disease progression
and death from the second year onwards [11]. DART also showed
that regular fixed duration ART interruptions to reduce drug costs
were harmful [19]; and that cotrimoxazole prophylaxis on ART
significantly reduced mortality [20].
Mean total cost per patient by group was estimated using
intention-to-treat. Research component costs were separated from
those for ART delivery/monitoring and excluded from analysis.
Individual patient data on healthcare resource utilisation and
health outcomes of all DART participants were analysed, except
for concomitant medications which were analysed by group.
Because of the large number of different medications used over the
6 year trial, only those used by .30% of patients, or where there
was difference of .3% in the proportion using a medication
between the two randomised groups were accounted for.
Healthcare utilisation outside of the trial (health clinic visits,
hospitalisations and concomitant medications) were elicited at
every 4-weekly visit and included. Unit costs of CD4 counts,
biochemistry, haematology, clinic and health centre visits were
estimated in primary economic costing analyses [21] for each
centre, using costs from the main Kampala centre for its satellite.
Staff costs per routine and extra patient-initiated visits at DART
clinics were estimated in a time and motion study at the centres
(patient visits: Entebbe, n = 152; Kampala, n = 171; Harare
n = 175). Financial information was obtained from trial centre
records. ART costs were based on preferential prices of non-
generic drugs for sub-Saharan Africa in 2008 [22]. Country-
specific costs for hospital bed-days were obtained from WHO [23].
All local prices were converted to 2008 US$ using exchange
rates over the trial period (e.g. $1US$ = 1,900 Uganda Shillings;
1US$ = 777,500,000 Zimbabwean dollars in 2008) and the US
Consumer Price Index [24]. Official daily Zimbabwean rates were
applied to essential medical equipment and supplies, and market
rates from independent sources to staff salaries and locally
acquired items. No adjustment for purchasing power parity was
attempted given the lack of comparable standards in price level
information sources.
Survival benefits were estimated from the difference in the area
under the Kaplan-Meier [25] survival curve between the two
groups up to the trial end. Quality-adjusted life years (QALYs)
were calculated as the weighted total time spent in four possible
health states during the trial, with each state’s utility as its weight.
Health states were defined by performance scale assessment
(1 = asymptomatic; 2 = symptomatic; 3 = bed-ridden ,50% in the
previous month; 4 = bed-ridden .50% in the previous month)
during 12-weekly routine doctor visits and currently-ongoing
WHO stage 3/4 events. Hence, health states, unlike WHO
staging, may improve from baseline. Utilities for estimating
QALYs were obtained from a longitudinal sub-study (n = 275)
conducted at the DART Entebbe centre (see Supporting
Information S1), relative to the utility of the asymptomatic HIV-
infected state. This state was assumed to be optimal, thus having a
value of 1, to HIV-infected patients, and 0.81, to the general
population [26].
Incremental cost effectiveness ratios (ICERs) defined as the ratio
of incremental mean cost to mean survival or QALY gained, were
estimated. Costs and health benefits occurring after 12 months
were discounted at 3% per annum, and adjusted for censoring due
to drop-out using the method of Li [27]. 95% confidence intervals
for differences in means and ICERs were estimated using
bootstrap percentile methods [28]. Sensitivity analyses included
generic drug prices (WHO [29]), reduced prices for second-line
therapy [22], laboratory monitoring costs from the literature [30],
and National Referral Laboratories prices.
A Markov model of transitions between discrete CD4 states and
death was used to extrapolate outcomes post-DART, from 6 to
25 years after ART initiation. An individual alive at trial closure
would be in one of three states, defined by CD4 ,100, 100–200,
and .200 cells/mm3, qualified by first-line or second-line ART
due to expected differences in costs and benefits. After every 12-
week period, the participant would have moved to a different state,
remained in the initial state or died. Overall 97.7% of expected
CD4 counts before end of trial/death/loss to follow-up were
available. For routine CD4 tests, clinic visits and ART use, full
compliance with the DART follow-up schedule was assumed.
Other costs and QALYs were analysed as random events, divided
into 12-week periods and matched to latest CD4 count range to
derive estimates of cost and benefit (‘pay-offs’) for Markov states as
a function of latest CD4 count and group. In this extrapolation,
only cotrimoxazole prophylaxis and treatment and antimalarial
drugs, were included as concomitant medications; the former were
the only concomitant medications whose use varied significantly
over years on ART and the latter were the only medications whose
use varied significantly across centres. The analysis accounted for
background mortality risks derived from counterfactual life tables
for Uganda that exclude the effect of HIV/AIDS (see Supporting
Information S2).
ICERs ,3x per capita GDP were used as an indication of cost-
effectiveness, following benchmarks suggested by WHO [31].
Under a fixed, limited healthcare budget, an alternative threshold
applies, equal to the ICER of CDM versus the ‘no ART’ option (see
Supporting Information S2). The probability of cost-effectiveness
Cost Effectiveness of ART Monitoring
PLoS ONE | www.plosone.org 2 April 2012 | Volume 7 | Issue 4 | e33672
over different threshold values, i.e., the cost-effectiveness accept-
ability curve, was derived from probabilistic sensitivity analysis.
Results
In DART, 3316 (1660 LCM; 1656 CDM) HIV-infected,
treatment-naıve, symptomatic African adults started ART (65%
female; median (IQR) age 37 (32–42); CD4 86 (31–139) cells/
mm3) and were followed for median 4.9 (4.5–5.3) years. Unit costs
are presented in Table 1. The annual cost of the first-line regimens
used in DART was US$309–585; switching to second-line
regimens resulted in approximately three-fold higher ART costs.
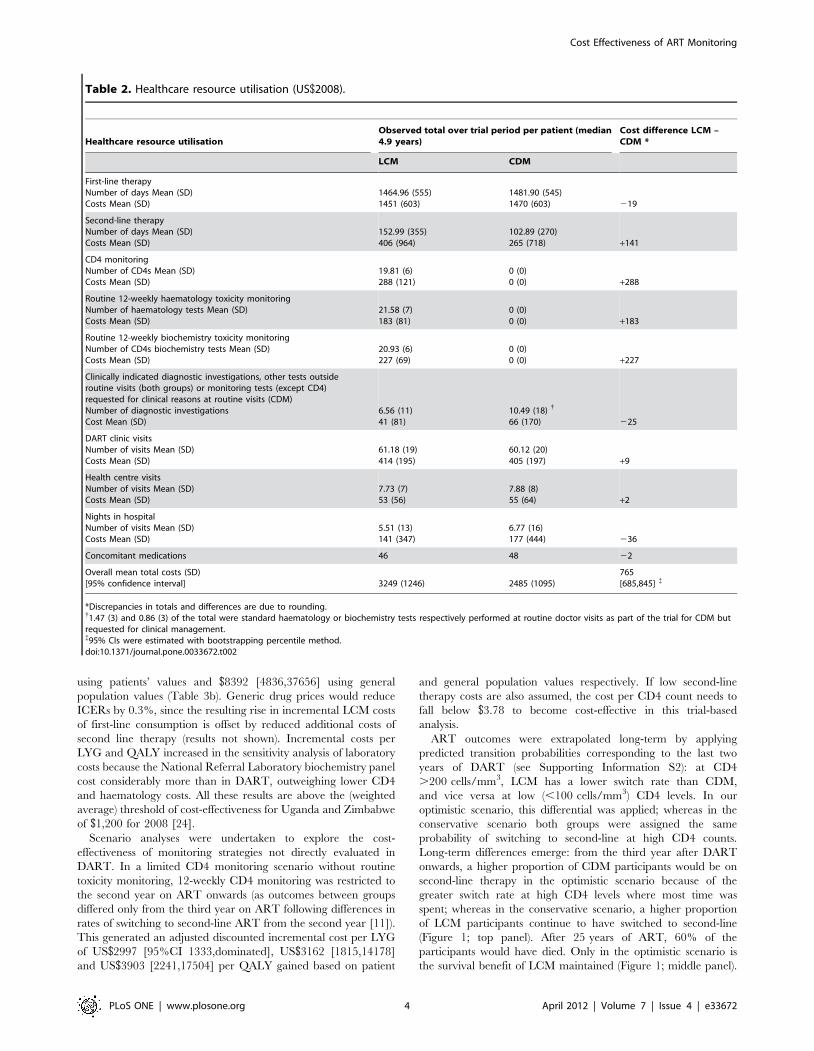
Healthcare resources consumed by patients, overall costs of
resource utilisation and cost differences between the groups are
shown in Table 2. The overall mean incremental cost of LCM is
US$765 [95%CI 685,845] per patient, a 31% increase over CDM.
The drivers of cost differences between LCM and CDM are, in
order of magnitude, routine 12-weekly toxicity monitoring, CD4
monitoring, and second-line drugs. There are small offsets with
lower costs of clinically-indicated diagnostic investigations, first-
line therapy and fewer days in hospital in LCM, likely
consequences of earlier switch to second-line therapy in LCM
[11].
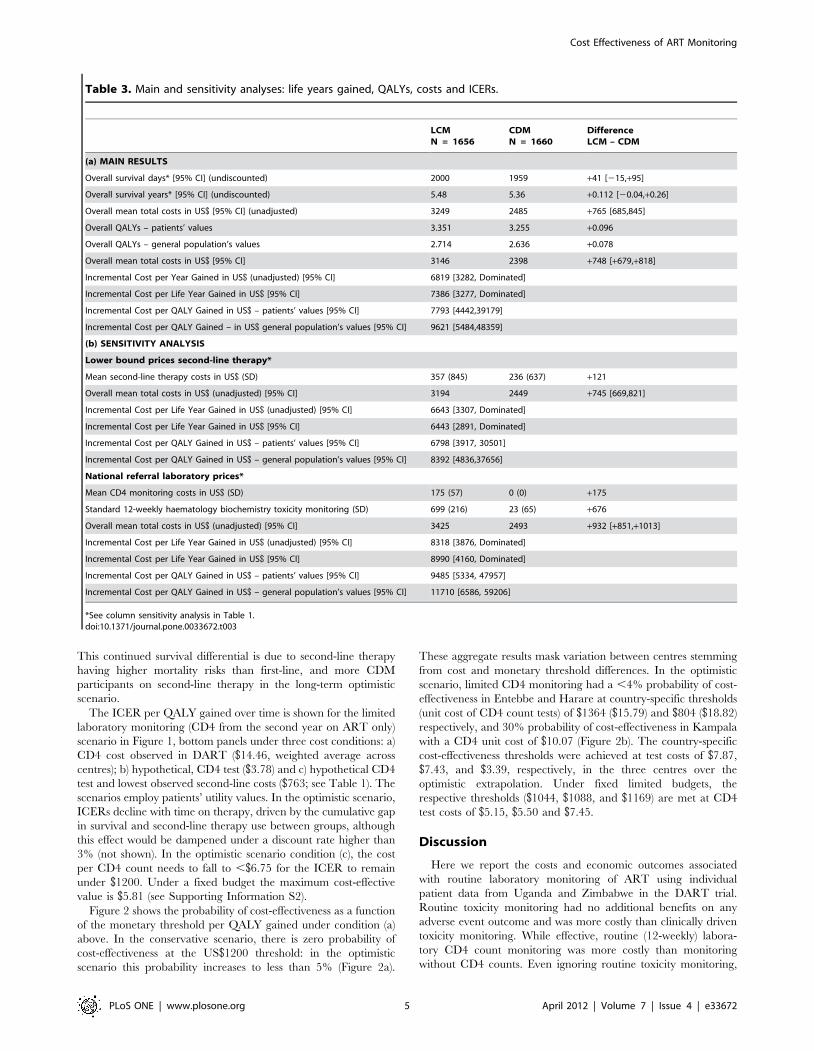
Mean survival benefit with LCM was 0.112 life-years (41 days).
The unadjusted incremental cost per life year gained (LYG) was
US$6819, with 95% CI from US$3282 to the dominated outcome
where it produces lower survival benefits alongside higher costs
than CDM (Table 3a). After adjusting for censoring due to drop-
out and discounting costs and benefits occurring after year one, the
ICER per LYG was $7386 [95%CI 3277,dominated]). The
incremental cost per QALY gained was $7793 [4442,39179] using
patients’ utility values, and $9621 [5484,48359] adjusting utilities
to the general population’s values. Across DART centres, total
mean costs of LCM and CDM ranged from $2647–3358 and
$1930–2490 respectively, with adjusted discounted incremental
costs of $8420–12340 per QALY gained adjusting utilities to the
general population’s values (data not shown).
In sensitivity analyses with prices for low-cost second-line drugs,
ICERs reduced: the adjusted incremental cost per LYG was $6443
[2891, Dominated]; and per QALY was $6798 [3917,30501]
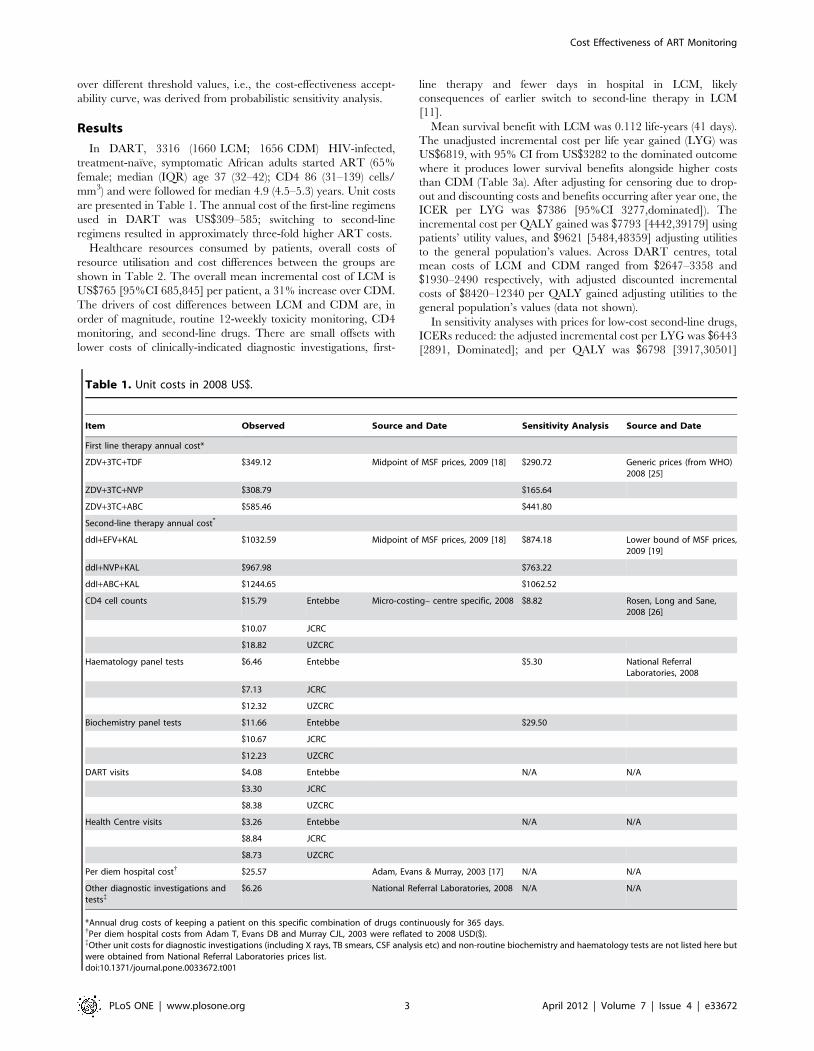
Table 1. Unit costs in 2008 US$.
Item Observed Source and Date Sensitivity Analysis Source and Date
First line therapy annual cost*
ZDV+3TC+TDF $349.12 Midpoint of MSF prices, 2009 [18] $290.72 Generic prices (from WHO)2008 [25]
ZDV+3TC+NVP $308.79 $165.64
ZDV+3TC+ABC $585.46 $441.80
Second-line therapy annual cost*
ddI+EFV+KAL $1032.59 Midpoint of MSF prices, 2009 [18] $874.18 Lower bound of MSF prices,2009 [19]
ddI+NVP+KAL $967.98 $763.22
ddI+ABC+KAL $1244.65 $1062.52
CD4 cell counts $15.79 Entebbe Micro-costing– centre specific, 2008 $8.82 Rosen, Long and Sane,2008 [26]
$10.07 JCRC
$18.82 UZCRC
Haematology panel tests $6.46 Entebbe $5.30 National ReferralLaboratories, 2008
$7.13 JCRC
$12.32 UZCRC
Biochemistry panel tests $11.66 Entebbe $29.50
$10.67 JCRC
$12.23 UZCRC
DART visits $4.08 Entebbe N/A N/A
$3.30 JCRC
$8.38 UZCRC
Health Centre visits $3.26 Entebbe N/A N/A
$8.84 JCRC
$8.73 UZCRC
Per diem hospital cost{ $25.57 Adam, Evans & Murray, 2003 [17] N/A N/A
Other diagnostic investigations andtests{
$6.26 National Referral Laboratories, 2008 N/A N/A
*Annual drug costs of keeping a patient on this specific combination of drugs continuously for 365 days.{Per diem hospital costs from Adam T, Evans DB and Murray CJL, 2003 were reflated to 2008 USD($).{Other unit costs for diagnostic investigations (including X rays, TB smears, CSF analysis etc) and non-routine biochemistry and haematology tests are not listed here butwere obtained from National Referral Laboratories prices list.doi:10.1371/journal.pone.0033672.t001
Cost Effectiveness of ART Monitoring
PLoS ONE | www.plosone.org 3 April 2012 | Volume 7 | Issue 4 | e33672
using patients’ values and $8392 [4836,37656] using general
population values (Table 3b). Generic drug prices would reduce
ICERs by 0.3%, since the resulting rise in incremental LCM costs
of first-line consumption is offset by reduced additional costs of
second line therapy (results not shown). Incremental costs per
LYG and QALY increased in the sensitivity analysis of laboratory
costs because the National Referral Laboratory biochemistry panel
cost considerably more than in DART, outweighing lower CD4
and haematology costs. All these results are above the (weighted
average) threshold of cost-effectiveness for Uganda and Zimbabwe
of $1,200 for 2008 [24].
Scenario analyses were undertaken to explore the cost-
effectiveness of monitoring strategies not directly evaluated in
DART. In a limited CD4 monitoring scenario without routine
toxicity monitoring, 12-weekly CD4 monitoring was restricted to
the second year on ART onwards (as outcomes between groups
differed only from the third year on ART following differences in
rates of switching to second-line ART from the second year [11]).
This generated an adjusted discounted incremental cost per LYG
of US$2997 [95%CI 1333,dominated], US$3162 [1815,14178]
and US$3903 [2241,17504] per QALY gained based on patient
and general population values respectively. If low second-line
therapy costs are also assumed, the cost per CD4 count needs to
fall below $3.78 to become cost-effective in this trial-based
analysis.
ART outcomes were extrapolated long-term by applying
predicted transition probabilities corresponding to the last two
years of DART (see Supporting Information S2): at CD4
.200 cells/mm3, LCM has a lower switch rate than CDM,
and vice versa at low (,100 cells/mm3) CD4 levels. In our
optimistic scenario, this differential was applied; whereas in the
conservative scenario both groups were assigned the same
probability of switching to second-line at high CD4 counts.
Long-term differences emerge: from the third year after DART
onwards, a higher proportion of CDM participants would be on
second-line therapy in the optimistic scenario because of the
greater switch rate at high CD4 levels where most time was
spent; whereas in the conservative scenario, a higher proportion
of LCM participants continue to have switched to second-line
(Figure 1; top panel). After 25 years of ART, 60% of the
participants would have died. Only in the optimistic scenario is
the survival benefit of LCM maintained (Figure 1; middle panel).
Table 2. Healthcare resource utilisation (US$2008).
Healthcare resource utilisationObserved total over trial period per patient (median4.9 years)
Cost difference LCM –CDM *
LCM CDM
First-line therapyNumber of days Mean (SD)Costs Mean (SD)
1464.96 (555)1451 (603)
1481.90 (545)1470 (603) 219
Second-line therapyNumber of days Mean (SD)Costs Mean (SD)
152.99 (355)406 (964)
102.89 (270)265 (718) +141
CD4 monitoringNumber of CD4s Mean (SD)Costs Mean (SD)
19.81 (6)288 (121)
0 (0)0 (0) +288
Routine 12-weekly haematology toxicity monitoringNumber of haematology tests Mean (SD)Costs Mean (SD)
21.58 (7)183 (81)
0 (0)0 (0) +183
Routine 12-weekly biochemistry toxicity monitoringNumber of CD4s biochemistry tests Mean (SD)Costs Mean (SD)
20.93 (6)227 (69)
0 (0)0 (0) +227
Clinically indicated diagnostic investigations, other tests outsideroutine visits (both groups) or monitoring tests (except CD4)requested for clinical reasons at routine visits (CDM)Number of diagnostic investigationsCost Mean (SD)
6.56 (11)41 (81)
10.49 (18){
66 (170) 225
DART clinic visitsNumber of visits Mean (SD)Costs Mean (SD)
61.18 (19)414 (195)
60.12 (20)405 (197) +9
Health centre visitsNumber of visits Mean (SD)Costs Mean (SD)
7.73 (7)53 (56)
7.88 (8)55 (64) +2
Nights in hospitalNumber of visits Mean (SD)Costs Mean (SD)
5.51 (13)141 (347)
6.77 (16)177 (444) 236
Concomitant medications 46 48 22
Overall mean total costs (SD)[95% confidence interval] 3249 (1246) 2485 (1095)
765[685,845] {
*Discrepancies in totals and differences are due to rounding.{1.47 (3) and 0.86 (3) of the total were standard haematology or biochemistry tests respectively performed at routine doctor visits as part of the trial for CDM butrequested for clinical management.{95% CIs were estimated with bootstrapping percentile method.doi:10.1371/journal.pone.0033672.t002
Cost Effectiveness of ART Monitoring
PLoS ONE | www.plosone.org 4 April 2012 | Volume 7 | Issue 4 | e33672
This continued survival differential is due to second-line therapy
having higher mortality risks than first-line, and more CDM
participants on second-line therapy in the long-term optimistic
scenario.
The ICER per QALY gained over time is shown for the limited
laboratory monitoring (CD4 from the second year on ART only)
scenario in Figure 1, bottom panels under three cost conditions: a)
CD4 cost observed in DART ($14.46, weighted average across
centres); b) hypothetical, CD4 test ($3.78) and c) hypothetical CD4
test and lowest observed second-line costs ($763; see Table 1). The
scenarios employ patients’ utility values. In the optimistic scenario,
ICERs decline with time on therapy, driven by the cumulative gap
in survival and second-line therapy use between groups, although
this effect would be dampened under a discount rate higher than
3% (not shown). In the optimistic scenario condition (c), the cost
per CD4 count needs to fall to ,$6.75 for the ICER to remain
under $1200. Under a fixed budget the maximum cost-effective
value is $5.81 (see Supporting Information S2).
Figure 2 shows the probability of cost-effectiveness as a function
of the monetary threshold per QALY gained under condition (a)
above. In the conservative scenario, there is zero probability of
cost-effectiveness at the US$1200 threshold: in the optimistic
scenario this probability increases to less than 5% (Figure 2a).
These aggregate results mask variation between centres stemming
from cost and monetary threshold differences. In the optimistic
scenario, limited CD4 monitoring had a ,4% probability of cost-
effectiveness in Entebbe and Harare at country-specific thresholds
(unit cost of CD4 count tests) of $1364 ($15.79) and $804 ($18.82)
respectively, and 30% probability of cost-effectiveness in Kampala
with a CD4 unit cost of $10.07 (Figure 2b). The country-specific
cost-effectiveness thresholds were achieved at test costs of $7.87,
$7.43, and $3.39, respectively, in the three centres over the
optimistic extrapolation. Under fixed limited budgets, the
respective thresholds ($1044, $1088, and $1169) are met at CD4
test costs of $5.15, $5.50 and $7.45.
Discussion
Here we report the costs and economic outcomes associated
with routine laboratory monitoring of ART using individual
patient data from Uganda and Zimbabwe in the DART trial.
Routine toxicity monitoring had no additional benefits on any
adverse event outcome and was more costly than clinically driven
toxicity monitoring. While effective, routine (12-weekly) labora-
tory CD4 count monitoring was more costly than monitoring
without CD4 counts. Even ignoring routine toxicity monitoring,
Table 3. Main and sensitivity analyses: life years gained, QALYs, costs and ICERs.
LCMN = 1656
CDMN = 1660
DifferenceLCM – CDM
(a) MAIN RESULTS
Overall survival days* [95% CI] (undiscounted) 2000 1959 +41 [215,+95]
Overall survival years* [95% CI] (undiscounted) 5.48 5.36 +0.112 [20.04,+0.26]
Overall mean total costs in US$ [95% CI] (unadjusted) 3249 2485 +765 [685,845]
Overall QALYs – patients’ values 3.351 3.255 +0.096
Overall QALYs – general population’s values 2.714 2.636 +0.078
Overall mean total costs in US$ [95% CI] 3146 2398 +748 [+679,+818]
Incremental Cost per Year Gained in US$ (unadjusted) [95% CI] 6819 [3282, Dominated]
Incremental Cost per Life Year Gained in US$ [95% CI] 7386 [3277, Dominated]
Incremental Cost per QALY Gained in US$ – patients’ values [95% CI] 7793 [4442,39179]
Incremental Cost per QALY Gained – in US$ general population’s values [95% CI] 9621 [5484,48359]
(b) SENSITIVITY ANALYSIS
Lower bound prices second-line therapy*
Mean second-line therapy costs in US$ (SD) 357 (845) 236 (637) +121
Overall mean total costs in US$ (unadjusted) [95% CI] 3194 2449 +745 [669,821]
Incremental Cost per Life Year Gained in US$ (unadjusted) [95% CI] 6643 [3307, Dominated]
Incremental Cost per Life Year Gained in US$ [95% CI] 6443 [2891, Dominated]
Incremental Cost per QALY Gained in US$ – patients’ values [95% CI] 6798 [3917, 30501]
Incremental Cost per QALY Gained in US$ – general population’s values [95% CI] 8392 [4836,37656]
National referral laboratory prices*
Mean CD4 monitoring costs in US$ (SD) 175 (57) 0 (0) +175
Standard 12-weekly haematology biochemistry toxicity monitoring (SD) 699 (216) 23 (65) +676
Overall mean total costs in US$ (unadjusted) [95% CI] 3425 2493 +932 [+851,+1013]
Incremental Cost per Life Year Gained in US$ (unadjusted) [95% CI] 8318 [3876, Dominated]
Incremental Cost per Life Year Gained in US$ [95% CI] 8990 [4160, Dominated]
Incremental Cost per QALY Gained in US$ – patients’ values [95% CI] 9485 [5334, 47957]
Incremental Cost per QALY Gained in US$ – general population’s values [95% CI] 11710 [6586, 59206]
*See column sensitivity analysis in Table 1.doi:10.1371/journal.pone.0033672.t003
Cost Effectiveness of ART Monitoring
PLoS ONE | www.plosone.org 5 April 2012 | Volume 7 | Issue 4 | e33672
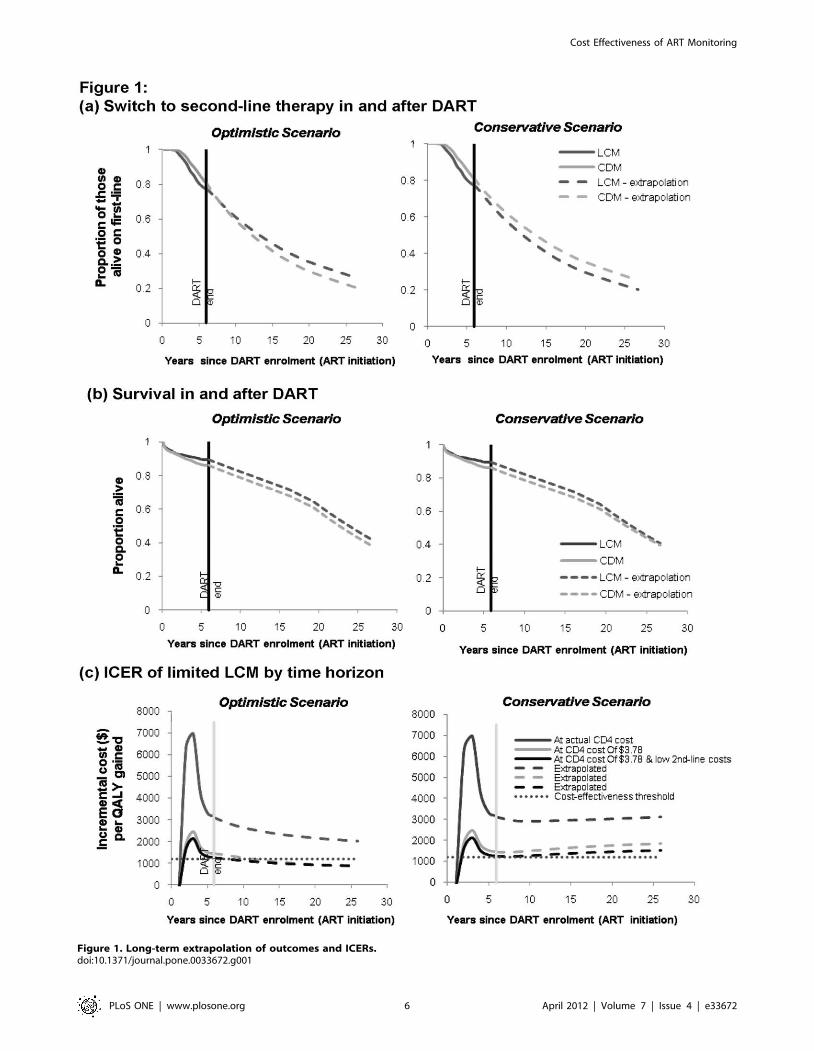
Figure 1. Long-term extrapolation of outcomes and ICERs.doi:10.1371/journal.pone.0033672.g001
Cost Effectiveness of ART Monitoring
PLoS ONE | www.plosone.org 6 April 2012 | Volume 7 | Issue 4 | e33672

based on the ICERs derived for life-years or QALYs gained, the
CD4 monitoring strategy used in DART is beyond the cost-
effective threshold of ,3x per capita GDP, which is the WHO
benchmark used for assessing cost-effectiveness of interventions in
low-income sub-Saharan African countries [30].
Since DART publication, three other randomised trials
comparing different ways to monitor adults on ART in low and
middle income countries have been presented or published: the
HBAC trial in Uganda [11,18], the PHPT-3 trial in Thailand [32]
and the ANRS/ESTHER trial in Cameroon [33]. Although
different in design, the two trials that included a clinical
monitoring arm (Uganda, Cameroon) both show small but
important benefits for CD4 laboratory monitoring and thus
support the key observation from DART on which this cost-
effectiveness analysis is predicated. Interestingly, HBAC and
PHPT-3, the two studies that compared viral load with CD4
monitoring, have both failed to show any additional benefit on
clinical outcome from virological monitoring, either in place of or
additional to CD4 monitoring [32,33].
According to our primary costing studies and models, we
estimated that the current costs of CD4 tests need to drop to below
USD$3.78 for 12-weekly CD4 monitoring to be cost-effective.
Extrapolating over the longer-term under the fixed budget rule
(instead of the arbitrary, conventional threshold used to approx-
imate the value of a life year in optimal health or without disability
[31]) that the option with most total benefits be selected suggested
laboratory monitoring at unit costs of USD$5-7 would be cost-
effective in a population starting ART with relatively severe
immunodeficiency as in DART. In patients starting ART at
higher CD4 counts, more CD4 counts would need to be done to
identify failure, and so incremental cost effectiveness ratios would
likely be higher, requiring lower unit cost of CD4 counts to achieve
cost-effectiveness. Costs could reduce either through direct kit
costs falling, or through efficiency gains for example with new
technologies such as point-of-care (POC) tests. Such technology is
now being developed and evaluated: if costs fall below $3–4 per
test and the devices can be used at health-centre level then POC
could become a very attractive option for routine ART efficacy
monitoring [34]. Another option would be to perform CD4
monitoring less frequently than 12-weekly. However, as excess
morbidity/mortality in CDM appeared to mainly be a conse-
quence of later switch to second-line, less frequent CD4
monitoring could also be less effective, reducing cost savings.
The long-term economic value of routine CD4 monitoring is
inversely related to the costs of second-line therapy: the lower the
costs of second-line therapy, the greater the likelihood of CD4
monitoring being cost-effective. Of the three other trials of ART
monitoring strategies,only the Uganda HBAC study so far has
conducted cost-effectiveness analysis [18]. It reports an ICER of
$174 per disability-adjusted-life-year (DALY) for CD4/clinical vs
clinical monitoring alone of ART [18], an order of magnitude
lower than the ICER reported here. This difference between our
findings is initially perplexing, particularly as participants receiving
CD4 or viral load monitoring also received full blood counts; of
note, toxicity outcomes were not reported in HBAC [9]. However,
the substantially increased cost of second-line versus first-line ART
is likely to have contributed to their finding, as, in contrast to
DART, more participants (n = 17) in the clinical monitoring alone
group switched to second-line, compared to those receiving CD4
(n = 4) or CD4 and viral load (n = 7) monitoring.
DART and HBAC used different clinical thresholds to
determine first-line failure and thus trigger switch to second-line
ART. The most important difference is the inclusion of single
WHO 3 events in the HBAC clinical criteria for switch (weight
loss, unexplained fever, diarrhoea, oral candidiasis), which were
not included in WHO guidelines [35], tend to be non-specific and
are most associated with high CD4 counts/suppressed viral load
[36]; in contrast clinical switch in DART was based on WHO 4
events alone (as per WHO guidelines [35]). Thus the cost
differential between CD4 and clinical monitored groups will be
exaggerated in HBAC by increased unnecessary premature
switching in the clinical monitoring group, thus reducing the
ICER. Given the influence of second-line costs on cost-
effectiveness, and given that ART will be given life-long, it is
unfortunate that HBAC was relatively underpowered to address
this critical issue, with only 28 switches in total (as opposed to 675
in DART with more in the LCM arm from the second year of the
trial).
Furthermore, the median of only 3 years of follow-up in HBAC,
compared to 5 years in DART, inevitably has implications for the
accuracy of longer term predictions based on observed data.
Although our model did not adjust for the effect of past or ongoing
opportunistic infections on the risk of death over and above that
captured by current CD4 count, any resulting bias favouring
clinical monitoring is likely to be reversed by the assumption of
higher switch rates with CDM to second-line therapy at high CD4
counts throughout the period after DART.
To be eligible for DART, all potential participants underwent
CD4 testing and needed to have CD4,200 cells/mm3 to enter
the trial. Our analysis was therefore not able to consider the costs
and benefits of CD4 testing for ART eligibility [4,13,16]. Initiating
ART earlier, with higher CD4 counts, would make LCM less cost-
effective, as fewer lives would potentially be saved by laboratory
monitoring; subgroup analysis showed that the ICER among
Figure 2. Cost-effectiveness acceptability curves.doi:10.1371/journal.pone.0033672.g002
Cost Effectiveness of ART Monitoring
PLoS ONE | www.plosone.org 7 April 2012 | Volume 7 | Issue 4 | e33672
patients with CD4,100 cells/mm3 was 30% smaller than for the
whole trial population (USD$6764 vs. USD$9621). As commented
above, this would also lower the unit cost thresholds at which
routine CD4 testing becomes cost-effective.
Our study is unique in its prospective valuation of patient
preferences for health states in a sub-sample of DART patients.
Interestingly, applying utility weights to health states in DART
defined according to performance status and any ongoing WHO
stage 3 or 4 events, as assessed by a doctor, showed that the
estimated survival difference (0.101 life years) was associated with
an almost equal gain in asymptomatic survival (0.097 life years).
DART used a simple and easy to interpret switch criterion of
CD4,100 cells/mm3 which does not require longitudinal mea-
surement of CD4 counts, or pre-ART counts. More complex
failure criteria based on prior values (CD4 fall ,pre-ART, .50%
decline from peak) may increase the proportions switching to
second-line without necessarily improving outcomes, thus reducing
the likelihood of CD4 monitoring being cost-effective; these
criteria are also more challenging to implement. Interestingly the
HBAC study used persistently declining CD4 cell counts on two
consecutive measurements to indicate treatment failure: this has
been demonstrated to have the lowest sensitivity of the three
failure criteria [37].
DART did not evaluate routine viral load testing. However, the
difference between DART groups receiving and not receiving
routine CD4 monitoring trial based was similar to one modelling
study [15] and the HBAC randomised trial of laboratory
monitoring in Uganda [9]. Both suggest limited additional benefits
with viral load monitoring, highlighting the importance of defining
the optimal threshold for virologic failure and submitting routine
viral load monitoring to a definitive evaluation [38]. On the basis
of a recent review [39] and the ICER of $5181 per DALY for viral
load/CD4/clinical monitoring vs. CD4/clinical monitoring re-
ported by the HBAC study [18], at current costs and with current
technologies, there is less evidence of cost-effectiveness for viral
load monitoring than there is for CD4 count monitoring.
A further limitation of the cost-effectiveness analysis presented
here is that it has only considered the patients on ART, and in
particular has not considered other possible impacts such as
increased HIV transmission, including of drug resistant virus, from
unsuppressed patients on ART or, in contrast, reduced transmis-
sion from having been able to put more patients on ART without
providing routine laboratory monitoring for the same fixed
budget. Modelling studies, when they have examined the evolution
and transmission of drug resistance under a public health
approach to ART, have been relatively reassuring [15,40]. A
modelling component within the Lablite project will further model
these aspects.
Our findings have implications for public sector ART
programmes in Africa, given the unmet demand for treatment,
the limited availability of laboratory services and stagnant or
declining international funding for health. Strengthening labora-
tory services is a priority: CD4 testing should focus on ART
initiation; toxicity testing can be clinically guided rather than
routine; access to quality-controlled diagnostic testing must be
widened. With fixed and constrained budgets, relative to no ART
provision [41], the number of lives/life-years saved with current
costs and approaches is greater for a clinically-driven rather than
laboratory monitoring strategy. Further, it is an equitable option as
its lower cost allows more patients to access treatment and for
follow up to be decentralised to health centres [42]. Resources
could therefore better be allocated for untreated patients to start
ART, and for laboratory diagnostic investigation of clinical events,
rather than for routine laboratory monitoring [43]. The recently
started LabLite project aims to demonstrate that such decentra-
lised ART delivery (outside research clinics) is safe and effective in
rural areas in Malawi, Uganda and Zimbabwe.
Results from the DART trial and the cost-effectiveness analysis
also raise challenging issues about how to act on research findings
when effectiveness is demonstrated but cost-effectiveness is not, as
profound underlying tensions between patients, healthcare work-
ers, funders and policy makers are exposed [44]. This paradox is a
challenge for the public sector even in high-income countries (e.g.
in the UK with the potential provision of very expensive cancer
drugs with significant toxicity but also proven, limited benefits in
the NHS), as resources universally are finite. It is even more
difficult when interventions that are routinely provided in better
resourced settings with higher GDPs, like CD4 testing, produce
benefit but are not cost-effective in low-income settings. Particu-
larly in resource-constrained settings, spending money on one
healthcare component such as ART monitoring necessarily means
fewer resources can be spent on other competing priorities
(patients still in need of ART, bed nets to prevent malaria,
vaccination programmes and so on) and we would argue our
research helps policy makers to choose how to maximise health
benefit.
In conclusion, the DART trial has clearly shown that routine
laboratory monitoring of ART is not currently cost-effective in
low-income African countries. There is no rationale for toxicity
monitoring which does not affect outcomes and is costly. Routine
CD4 monitoring has small but measurable benefits on survival; for
it to be cost-effective the costs of second-line ART and CD4 testing
need to fall substantially. Laboratories will remain important for
quality of care especially for the diagnosis of intercurrent events on
ART. Realising the survival benefits of CD4 monitoring widely in
Africa is likely to be dependent on the development of a cheap,
ideally point-of-care CD4 test. In the meantime, given competing
priorities, HIV programmes in Africa may best spend limited
resources on increasing access to first and second-line ART.
Supporting Information
Supporting Information S1 Modelling Utility Estimationin DART patients.(DOC)
Supporting Information S2 Modelling the long termsurvival and costs of patients in DART.(DOC)
Acknowledgments
We thank all the patients and staff from all the centres participating in the
DART trial.
MRC/UVRI Uganda Research Unit on AIDS, Entebbe,Uganda: H Grosskurth, P Munderi, G Kabuye, D Nsibambi, R Kasirye,
E Zalwango, M Nakazibwe, B Kikaire, G Nassuna, R Massa, K Fadhiru,
M Namyalo, A Zalwango, L Generous, P Khauka, N Rutikarayo, W
Nakahima, A Mugisha, J Todd, J Levin, S Muyingo, A Ruberantwari,
P Kaleebu, D Yirrell, N Ndembi, F Lyagoba, P Hughes, M Aber,
A Medina Lara, S Foster, J Amurwon, B Nyanzi Wakholi, K Wangati, B
Amuron, D Kajungu, J Nakiyingi, W Omony, K Fadhiru, D Nsibambi, P
Khauka.
Joint Clinical Research Centre, Kampala, Uganda: P Mugyenyi,
C Kityo, F Ssali, D Tumukunde, T Otim, J Kabanda, H Musana, J Akao,
H Kyomugisha, A Byamukama, J Sabiiti, J Komugyena, P Wavamunno,
S Mukiibi, A Drasiku, R Byaruhanga, O Labeja, P Katundu, S Tugume,
P Awio, A Namazzi, GT Bakeinyaga, H Katabira, D Abaine, J Tuka-
mushaba, W Anywar, W Ojiambo, E Angweng, S Murungi, W Haguma,
S Atwiine, J Kigozi, L Namale. A Mukose, G Mulindwa, D Atwiine,
A Muhwezi, E Nimwesiga, G Barungi, J Takubwa, S Murungi, D
Mwebesa, G Kagina, M Mulindwa, F Ahimbisibwe, P Mwesigwa, S
Cost Effectiveness of ART Monitoring
PLoS ONE | www.plosone.org 8 April 2012 | Volume 7 | Issue 4 | e33672
Akuma, C Zawedde, D Nyiraguhirwa, C Tumusiime, L Bagaya, W
Namara, J Kigozi, J Karungi, R Kankunda, R Enzama.
University of Zimbabwe, Harare, Zimbabwe: A Latif, J Hakim,
V Robertson, A Reid, E Chidziva, R Bulaya-Tembo, G Musoro,
F Taziwa, C Chimbetete, L Chakonza, A Mawora, C Muvirimi,
G Tinago, P Svovanapasis, M Simango, O Chirema, J Machingura, S
Mutsai, M Phiri, T Bafana, M Chirara, L Muchabaiwa, M Muzambi, E
Chigwedere, M Pascoe, C Warambwa, E Zengeza, F Mapinge, S Makota,
A Jamu, N Ngorima, H Chirairo, S Chitsungo, J Chimanzi, C Maweni,
R Warara, M Matongo, S Mudzingwa, M Jangano, K Moyo, L Vere, I
Machingura.
Infectious Diseases Institute (formerly the Academic Alli-ance) Makerere University, Mulago, Uganda: E Katabira,
A Ronald, A Kambungu, F Lutwama, I Mambule, A Nanfuka,
J Walusimbi, E Nabankema, R Nalumenya, T Namuli, R Kulume, I
Namata, L Nyachwo, A Florence, A Kusiima, E Lubwama, R Nairuba, F
Oketta, E Buluma, R Waita, H Ojiambo, F Sadik, J Wanyama, P
Nabongo, J Oyugi, F Sematala, A Muganzi, C Twijukye, H Byakwaga.
The AIDS Support Organisation (TASO), Uganda: R Ochai,
D Muhweezi, A Coutinho, B Etukoit.
Imperial College, London, UK: C Gilks, K Boocock, C Puddephatt,
C Grundy, J Bohannon, D Winogron.
MRC Clinical Trials Unit, London, UK: J Darbyshire, DM Gibb,
A Burke, D Bray, A Babiker, AS Walker, H Wilkes, M Rauchenberger,
S Sheehan, C Spencer-Drake, K Taylor, M Spyer, A Ferrier, B Naidoo,
D Dunn, R Goodall.
Independent DART Trial Monitors: R Nanfuka, C Mufuka-
Kapuya.
DART Virology Group: P Kaleebu (Co-Chair), D Pillay (Co-Chair),
V Robertson, D Yirrell, S Tugume, M Chirara, P Katundu, N Ndembi,
F Lyagoba, D Dunn, R Goodall, A McCormick.
DART Health Economics Group: A Medina Lara (Chair), S Foster,
J Amurwon, B Nyanzi Wakholi, J Kigozi, L Muchabaiwa, M Muzambi.
Trial Steering Committee: I Weller (Chair), A Babiker (Trial
Statistician), S Bahendeka, M Bassett, A Chogo Wapakhabulo, J Darby-
shire, B Gazzard, C Gilks, H Grosskurth, J Hakim, A Latif, C Mapuchere,
O Mugurungi, P Mugyenyi; Observers: C Burke, M Distel, S Jones, E
Loeliger, P Naidoo, C Newland, G Pearce, S Rahim, J Rooney, M Smith,
W Snowden, J-M Steens.
Data and Safety Monitoring Committee: A Breckenridge (Chair),
A McLaren (Chair-deceased), C Hill, J Matenga, A Pozniak, D Serwadda.
Endpoint Review Committee: T Peto (Chair), A Palfreeman,
M Borok, E Katabira.
Conference presentation
Data were presented at the 5th IAS Conference on HIV Pathogenesis,
Treatment and Prevention, 19–22 July 2009, Cape Town, South Africa.
Author Contributions
Conceived and designed the experiments: CFG P. Mugyenyi JH AR JD
DMG AGB AML ASW P. Munderi. Performed the experiments: P.
Mugyenyi HG EK CK P. Munderi RK FS JH AR DMG CFG AGB ASW
AML REMM JK JA LM BNW. Analyzed the data: AML REMM. Wrote
the paper: AML CFG ASW DMG JK JA LM REMM BNW RK FS AR
HG AGB CK EK P. Munderi P. Mugyenyi JH JD.
References
1. Gilks CF, Crowley S, Ekpini R, Perriens J, Souteyrand Y, et al. (2006) The
WHO public health approach to antiretroviral treatment against HIV in
resource-limited settings. Lancet 368: 505–510.
2. World Health Organization (2010) Towards universal access: scaling up priority
HIV/AIDS interventions in the health sector. Progress report 2010: 1–150. pp
1–150.
3. World Bank (2009) The global economic crisis and HIV prevention and
treatment programmes; vulnerabilities and impact. pp 1–40.
4. Kenyon C, Skordis J, Boulle A, Pillay K (2003) The ART of rationing–the need
for a new approach to rationing health interventions. S Afr Med J 93: 56–60.
5. Kent DM, McGrath D, Ioannidis JPA (2003) Suitable monitoring approaches to
antiretroviral therapy in resource-poor settings: setting the research agenda.
Clinical Infectious Diseases 37: S13–24.
6. Schreibman T, Friedland G (2004) Use of total lymphocyte count for monitoring
response to antiretroviral therapy. Clinical Infectious Diseases 38: 257–62.
7. Bisson GP, Gross R, Strom JB, Rollins C, Bellamy S, et al. (2006) Diagnostic
accuracy of CD4 cell count increase for virologic response after initiating highly
active antiretroviral therapy. AIDS 20: 1613–19.
8. Moore DM, Mermin J, Awor A, Yip B, Hogg RS, et al. (2006) Performance of
immunologic responses in predicting viral load suppression: implications for
monitoring patients in resource-limited settings. J Acquir Immune Defic Syndr
43: 436–39.
9. Mermin J, Ekwaru J, Were W, Degerman R, Bunnell R, et al. (2011) Utility of
routine viral load, CD4 cell count, and clinical monitoring among adults with
HIV receiving antiretroviral therapy in Uganda: randomized trial. BMJ 343:
d6792. doi:10.1136/bmj.d6792.
10. Weidle PJ, Wamai N, Solberg P, Liechty C, Sendagala S, et al. (2006)
Adherence to antiretroviral therapy in a home-based AIDS care programme in
rural Uganda. Lancet 368: 1587–1594.
11. DART Trial Team (2010) Routine versus clinically driven laboratory
monitoring of HIV antiretroviral therapy in Africa (DART): a randomised
non-inferiority trial. Lancet 375: 23–31.
12. Deghaye N, Pawinski RA, Desmond C (2006) Financial and economic costs of
scaling up the provision of HAART to HIV-infected health care workers in
KwaZulu-Natal. S.Afr.Med.J 96: 140–143.
13. Goldie SJ, Yazdanpanah Y, Losina E, Weinstein MC, Anglaret X, et al. (2006)
Cost-effectiveness of HIV treatment in resource-poor settings – the case of Cote
d’Ivoire. N Engl J Med 355: 1141–53.
14. Bishai D, Colchero MA, Durack D (2007) Modeling the cost effectiveness of
antiretroviral treatment strategies in low income settings AIDS 21: 1333–40.
15. Phillips AN, Pillay D, Miners AH, Bennett DE, Gilks CF, et al. (2008) Outcomes
from monitoring of patients on antiretroviral therapy in resource-limited settings
with viral load, CD4 cell count, or clinical observation alone: a computer
simulation model. Lancet 371: 1443–51.
16. Bendavid E, Young SD, Katzenstein DA, Bayoumi AM, Sanders GD, et al.
(2008) Cost-effectiveness of HIV monitoring strategies in resource-limited
settings – a southern African analysis. Arch Intern Med 168: 1910–1918.
17. Kimmel AD, Weinstein MC, Anglaret X, Goldie SJ, Losina E, et al. (2010)Laboratory monitoring to guide switching antiretroviral therapy in resource-
limited settings: clinical benefits and cost-effectiveness. J Acquir Immune Defic
Syndr 54: 258–268.
18. Kahn JG, Marseille E, Moore D, Bunnell R, Were W, et al. (2011) CD4 cell
count and viral load monitoring in patients undergoing antiretroviral therapy inUganda: cost effectiveness study. BMJ 343: d6884. doi: 10.1136/bmj.d6884.
19. The DART Trial Team (2008) Fixed duration interruptions are inferior to
continuous treatment in African adults starting therapy with CD4 cell counts,200 cells/ml. AIDS 2008: 22: 237–247.
20. Walker AS, Ford D, Gilks C (2010) Daily co-trimoxazole prophylaxis in severely
immunosuppressed HIV-infected adults in Africa started on combinationantiretroviral therapy: an observational analysis of the DART cohort. Lancet:
375: 1278–86.
21. Creese A, Parker D (1994) Cost analysis in primary health care: a trainingmanual for programme managers. World Health Organization, Geneva. pp
1–158.
22. Medicins San Frontieres (2008) Untangling the web of antiretroviral pricereductions, 11 Edition. Available: http://www.msfaccess.org/main/hiv-aids/
untangling-the-web-of-antiretroviral-price-reductions-11th-edition. Accessed2009 Feb 14.
23. Adam T, Evans DB, Murray CJL (2003) Econometric estimation of country-
specific hospital costs. cost effectiveness and resource allocation doi:10.1186/1478–7547–1-3. Available: http://www.ncbi.nlm.nih.gov/pubmed/12773218.
Accessed 2009 May 27.
24. International Monetary Fund (2009) World economic outlook database 2009.Available: http://imf.org/external/pubs/ft/weo/2009/02/weodata/index.aspx
Accessed 2010 Jun 15.
25. Hosmer DW, Lemeshow S (1999) Applied Survival Analysis. New York: Wiley.
26. Staven K, Frolan SS, Hellum KB (2005) Comparison of preference-basedutilities of the 15D, EQ-5D and SF-6D in patients with HIV/AIDS. Quality of
Life Research 14: 971–980.
27. Lin DY (2000) Linear regression analysis of censored medical costs. Biostatistics1: 35–47.
28. Efron B, Tibshirani R (1993) An introduction to the bootstrap. New York:
Chapman and Hall.
29. WHO (2008) International Drug Price Indicator Guide (2008). Available:
http://www.essentialdrugs.org/edrug/archive/200903/msg00059.php. Ac-
cessed 2009 Jun 3.
30. Rosen S, Long L, Sanne I (2008) The outcomes and outpatient costs of different
models of antiretroviral treatment delivery in South Africa. Trop Med Int
Health 13: 1005–1015.
31. Sachs JD (2001) Report of the commission on macroeconomics and health.
WHO. Geneva.
32. Jourdain G, Ngo-Giang-Huong N, S Le Coeur S (2011) PHPT-3: a randomizedclinical trial comparing CD4 vs viral load ART monitoring/switching strategies
in Thailand. 18th Conference on Retroviruses and Opportunistic Infections.
Boston, 27 February -2 March 2011, Boston USA. Abstract 44.
Cost Effectiveness of ART Monitoring
PLoS ONE | www.plosone.org 9 April 2012 | Volume 7 | Issue 4 | e33672
33. Laurent C, Kouanfack C, Laborde-Balen G, Aghokeng AF, Tcchatechueng JB,
et al. (2011) Monitoring of HIV viral loads, CD4 cell counts, and clinicalassessments versus clinical monitoring alone for antiretroviral therapy in rural
district hospitals in Cameroon (Stratall ANRS 12110/ESTHER): a randomised
non-inferiority trial. Lancet Infect Dis; 11: 825–33.34. Jani IV, Sitoe NE, Alfai ER (2011) Effect of point-of-care CD4 cell count tests on
retention of patients and rates of antiretroviral therapy initiation in primaryhealth clinics: an observational cohort study. Lancet 378: 1572–9.
35. World Health Organisation (2006) Antiretroviral therapy for HIV infection in
adults and adolescents in resource-limited settings: towards universal access.Recommendations for a public health approach. WHO Geneva.
36. Gilks CF, Walker AS, Munderi P, Kityo C, Reid A, et al. (2011) A single CD4test with threshold $250 cells/mm3 can markedly reduce switching to second-
line ART in African patients managed without CD4 or viral monitoring. 18th
Conference on Retroviruses and Opportunistic Infections, 27 February – 2
March 2011, Boston USA. Abstract 676.
37. Riwazza HE, Chaplin B, Meloni ST (2011) Immunologic criteria are poorpredictors of virologic outcome: implications for HIV treatment monitoring in
resource-limited settings. Clin Infect Dis 53: 1283–90.38. Koethe JR, Westfall AO, Luhanga DK, Clarke DM, Goldman JD, et al. (2010)
A cluster randomized trial of routine HIV-1 viral load monitoring in Zambia:
study design, implementation, and baseline cohort characteristics. PLoS ONE 5:
e9680.
39. Walensky RP, Ciaranello AL, Park J-E, Freedberg KS (2010) Cost-effectiveness
of laboratory monitoring in sub-Saharan Africa: a review of the current
literature. Clin Infect Dis 51: 85–92.
40. Phillips AN, Pillay D, Garnett G, Bennett D, Vitoria M, et al. (2011) Effect on
transmission of HIV-1 resistance of timing of implementation of viral load
monitoring to determine switches from first to second-line antiretroviral
regimens in resource-limited settings. AIDS 25: 843–50.
41. Munderi P, Watera C, Nakiyingi J, Walker S, Gilks CF (2006) Survival and
causes of death, 2 years after introduction of antiretroviral therapy in Africa: a
historical cohort comparison in Entebbe, Uganda. XVI International AIDS
Conference. Toronto, Canada; Aug 13–18, 2006. Abstract THLB0208.
42. Ubel P, DeKay ML, Baron J, Asch DA (1996) Cost-effectiveness analysis in a
setting of budget constraints - is it equitable? N Engl J Med 334: 1174–1177.
43. Phillips AN, Gilks C, Lundgren JD (2009) Cost-effectiveness of strategies for
monitoring the response to antiretroviral therapy in resource-limited settings.
Arch Intern Med 169: 904.
44. Nunes EP, Grinsztejn B, Schechter M, The DART trial (2011) The doctor’s
dilemma revisited. J Antimicrob Chemother 66(5): 964–7.
Cost Effectiveness of ART Monitoring
PLoS ONE | www.plosone.org 10 April 2012 | Volume 7 | Issue 4 | e33672