Implementation of Virtual Reality in Routine Bridge Inspection
21
Jáuregui and White 1 IMPLEMENTATION OF VIRTUAL REALITY IN ROUTINE BRIDGE INSPECTION David V. Jáuregui, PhD Assistant Professor New Mexico State University Department of Civil and Geological Engineering Hernandez Hall, Box 30001, MS 3CE Las Cruces, NM 88003 Phone: (505) 646-3514 Fax: (505) 646-6049 E-mail: [email protected] Kenneth R. White, PhD, PE Professor New Mexico State University Department of Civil and Geological Engineering Hernandez Hall, Box 30001, MS 3CE Las Cruces, NM 88003 Phone: (505) 646-3801 Fax: (505) 646-6049 E-mail: [email protected] November 5, 2002 Paper Length ~ 6500 words A paper submitted to the Transportation Research Board 82 nd Annual Meeting January 12 th – 16 th , 2003 Washington, D. C. TRB 2003 Annual Meeting CD-ROM Paper revised from original submittal.
Transcript of Implementation of Virtual Reality in Routine Bridge Inspection
Jáuregui and White 1
IMPLEMENTATION OF VIRTUAL REALITY IN ROUTINE BRIDGE INSPECTION
David V. Jáuregui, PhD Assistant Professor New Mexico State University Department of Civil and Geological Engineering Hernandez Hall, Box 30001, MS 3CE Las Cruces, NM 88003 Phone: (505) 646-3514 Fax: (505) 646-6049 E-mail: [email protected] Kenneth R. White, PhD, PE Professor New Mexico State University Department of Civil and Geological Engineering Hernandez Hall, Box 30001, MS 3CE Las Cruces, NM 88003 Phone: (505) 646-3801 Fax: (505) 646-6049 E-mail: [email protected]
November 5, 2002 Paper Length ~ 6500 words
A paper submitted to the Transportation Research Board 82nd Annual Meeting
January 12th – 16th, 2003 Washington, D. C.
TRB 2003 Annual Meeting CD-ROM Paper revised from original submittal.
Jáuregui and White 2
ABSTRACT
This paper reports on the innovative use of Quick Time Virtual Reality (QTVR) and panoramic creation
utilities for recording the field observations and measurements made during a routine inspection of a bridge. A
virtual reality approach provides the capability to document a bridge’s physical condition using different media
types at a significantly higher level of detail compared to a written bridge inspection report. The digitally recorded
data can be stored on a compact disk for easy access prior to, during, and/or after an inspection. Development of a
QTVR bridge record consists of four major steps: 1) selection of camera stations, 2) acquisition of digital images, 3)
creation of cylindrical / cubic panoramas, and 4) rendering of QTVR file. Specific details related to these steps as
applied in various bridge inspection projects are provided. The paper is concluded with a discussion of the potential
impact of QTVR to bridge management where routine inspection data is a factor in making decisions regarding the
future maintenance, rehabilitation, or replacement of a bridge.
TRB 2003 Annual Meeting CD-ROM Paper revised from original submittal.
Jáuregui and White 3
INTRODUCTION
The National Bridge Inspection Standards (NBIS) requires that bridge inspections be made at most every
two years. To satisfy this requirement, routine bridge inspections, defined as
Regularly scheduled inspections consisting of observations and/or measurements needed to determine the physical and functional condition of the bridge, to identify any changes from “Initial” or previously recorded conditions, and to ensure that the structure continues to satisfy present service requirements (AASHTO, 1994).
are usually performed. Common types of problems observed during a routine inspection include fatigue cracks,
concrete spalls and delaminations (with possibly, exposed rebar), corroded steel members, and malfunctioning and
damaged bearings (White et al., 1992; FHWA, 1995). Information descriptive of the bridge’s condition is gathered
by means of photographs, field measurements and handwritten notes; a separate evaluation is performed for the
different components of the bridge including the deck/slab, superstructure, and substructure (FHWA, 1995;
AASHTO, 1998). Field data is collected and entered into a bridge management system along with a condition rating
or state that describes the observed physical condition of the bridge.
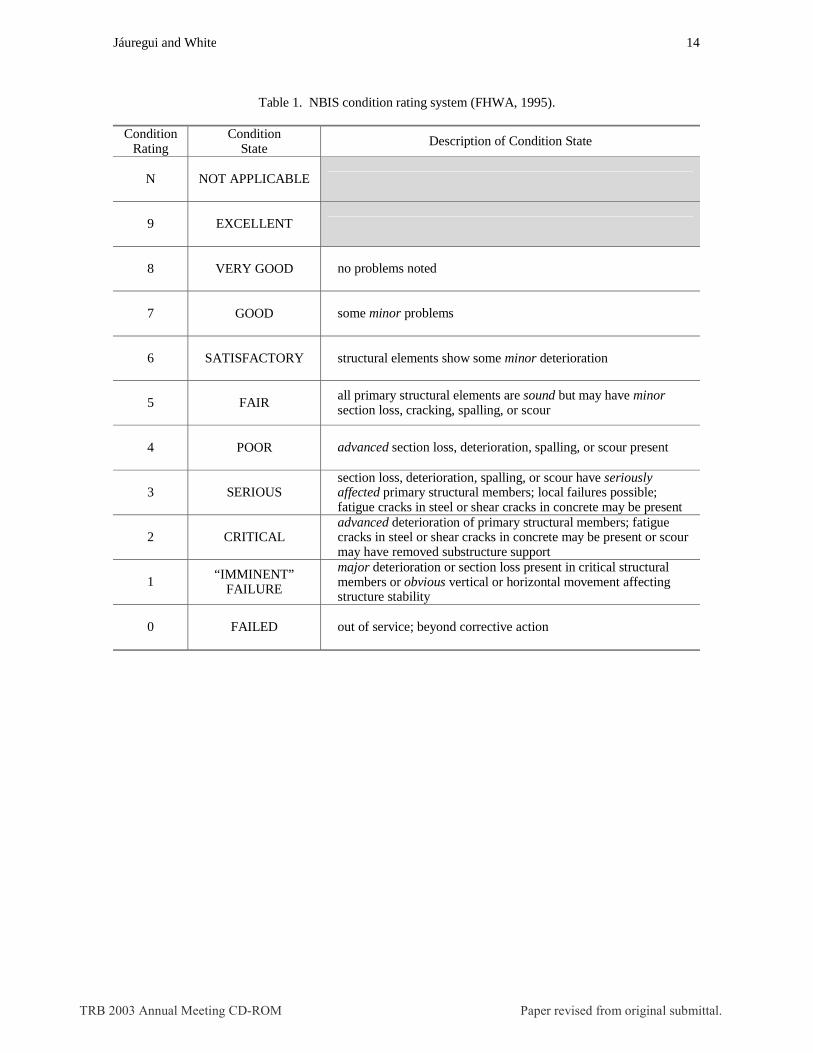
In the NBIS approach, a condition rating (ranging from 0 to 9) is assigned using the rating system given in
Table 1. An NBIS-based rating represents an average global condition state of the bridge component (i.e.,
deck/slab, superstructure, and substructure). For example, only a single rating is given to describe the superstructure
condition of a multi-girder bridge even though some girders may be more or less deteriorated than others. Because
of this limitation, many state highway departments now use the AASHTO Guide for Commonly Recognized (CoRe)
Elements (1998) in setting up data collection procedures for the PONTIS Bridge Management System (Thompson
and Shepard, 1994). Contrary to the condition state descriptions provided by NBIS, the AASHTO Guide for CoRe
Elements (1998) gives a more quantitative explanation by which to rate the individual element. For example,
condition state 4 for a concrete deck or slab (with or without coated reinforcing bars) reads
Patched areas and/or spalls/delaminations exist in the deck surface. The combined area of distress is more than 10% but less than 25% of the total deck area (AASHTO, 1998).
The Federal Highway Administration (FHWA) Non-Destructive Evaluation Validation Center (NDEVC)
performed a series of studies related to highway bridge inspection. In the first study, Rolander et al. (2000)
conducted a survey to evaluate the effect of current inspection procedures and management policies on the accuracy
and reliability of visual inspection. A total of 42 state highway departments, 72 county highway departments in
Iowa State, and 6 bridge inspection contractors participated in the survey. Findings from the study revealed that
visual inspection was the NDE technique used most often to evaluate the physical condition of existing bridges. The
TRB 2003 Annual Meeting CD-ROM Paper revised from original submittal.
Jáuregui and White 4
survey results also indicated that a professional engineer (PE) is rarely on-site during the inspections and that
inspectors are allowed access to copies of previous inspection reports both prior to and after arrival at a bridge site.
In the second study, Phares et al. (2000) studied the reliability of routine inspections for bridge condition assessment
as presently performed by state highway inspectors. Participants in the study included forty-nine inspectors from 25
states with varying levels of experience, education, and training. Each inspector performed a routine inspection of
six different bridges with no prior knowledge of previously noted conditions (i.e., review of previous inspection
reports was not permitted). Research findings showed that between 4 and 5 different condition ratings were
assigned to each primary bridge element. Statistical analysis of the results indicated that approximately 58% of the
individual ratings were assigned incorrectly. The study also revealed that individual ratings varied ±2 points from
the average inspector rating (at a 95% confidence internal) and ±1 point (at a 68% confidence interval). Based on
these findings, it was concluded that routine inspection might lead to unreliable results because of the basic
definitions of bridge condition provided in the NBIS rating system (see Table 1).
Findings from the two FHWA studies just discussed have raised several issues in need of further action to
improve routine bridge inspections, which include:
1. A professional engineer is typically not present at the bridge site during an inspection.
2. The current format of a bridge inspection report may be insufficient to
accurately describe the condition of a bridge.
3. The use of previous bridge inspection reports (prior to and during an inspection) may be inefficient.
4. The definitions of bridge condition levels given in the NBIS rating
system lack in detail and are of a subjective nature. Although some of these issues have been addressed in the AASHTO Guide for CoRe Elements (1998), the
development of techniques to improve the collection and management of bridge inspection data remains a research
need (Haque and Pongponrat, 2000). To address this need and further resolve the problems listed above, this paper
proposes the use of Quick Time Virtual Reality (QTVR). With QTVR, various forms of inspection data may be
combined and managed from a single record. In addition, design drawings can be integrated into the QTVR record
to facilitate the identification and monitoring of deteriorated and/or damaged areas. The digital information can be
stored on a compact disk, which can be easily retrieved and utilized for planning, preparing, and performing
subsequent inspections and updated, as new data is collected.
TRB 2003 Annual Meeting CD-ROM Paper revised from original submittal.
Jáuregui and White 5
THE QTVR PROCESS
There are four basic steps in the QTVR development process: 1) selection of camera stations, 2)
acquisition of digital images, 3) creation of cylindrical / cubic panoramas, and 4) rendering of QTVR file. Specific
details related to this process are discussed in the following sections.
Step 1: Selection of Camera Stations
Careful planning of the field visit and the photographs is recommended before the trip to the bridge is
made. The time invested in the planning process will greatly improve the efficiency in acquiring the images as well
as the overall quality of the photographs. The planning of the photographs primarily involves selecting the nodal
positions for the camera, which are simply the field locations at which a sweeping panoramic view of the structure is
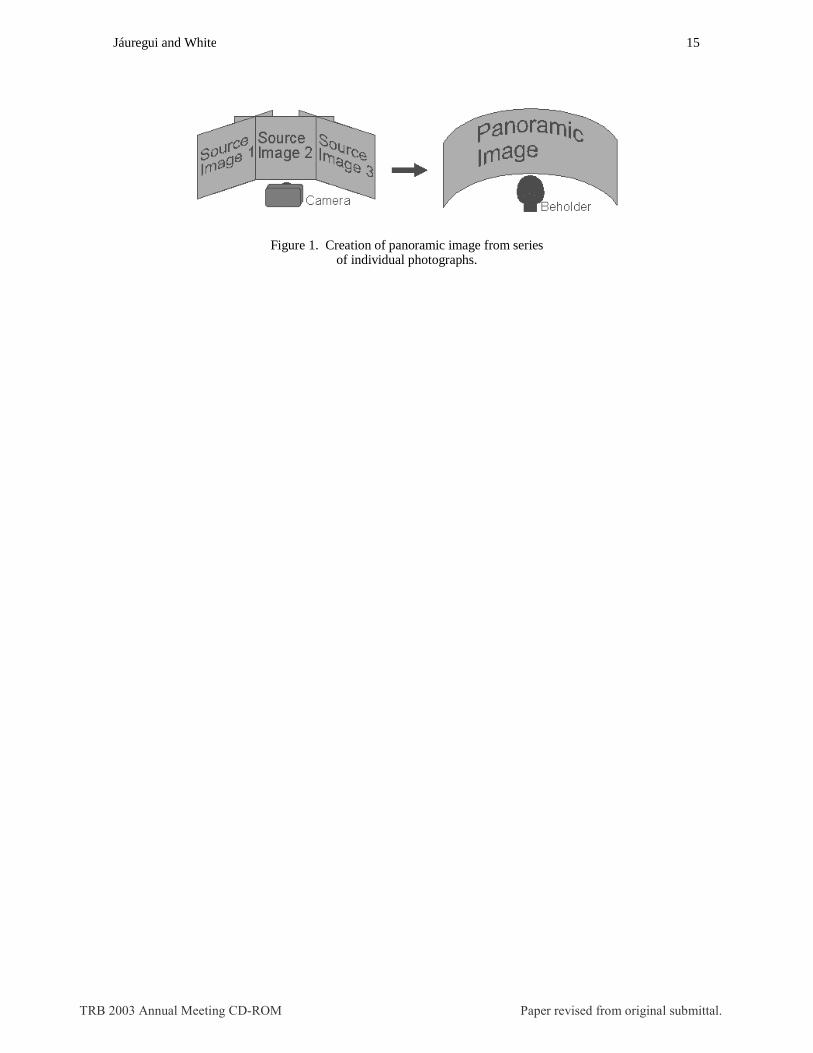
desired. At each camera station, a series of individual photographs in equal angle increments are taken and later
merged into a single panoramic image as illustrated in Figure 1. If time permits and the bridge is reasonably
accessible, a preliminary site visit should be made to identify the camera positions. In many instances, the camera
positions will be governed by accessibility and obstructions. Moreover, QTVR may not be a feasible option for
bridges that need to be closed such as those located in areas of heavy traffic or those that cross a river. A river
crossing may require a crane situated on the bridge deck to position the inspector underneath the superstructure to
take pictures, which would require the bridge to be closed. Otherwise, the camera stations would be limited to
accessible areas towards the abutment. Bridges that have other forms of moving obstructions (such as those located
in construction zones) are also not ideal candidates for QTVR. These bridges would require that the photography be
planned accordingly (during periods of either low or no construction) to avoid disrupting construction work. In
summary, these situations would require more of a time investment well beyond the normal 2-hour inspection as
well as possibly requiring bridge closure or equipment rental which all result in higher costs. As a result, QTVR is
best for bridges that are easily accessible and located remotely from heavy traffic, construction activity, and river
crossings such as interstate bridges at a grade separation. In addition, the use of QTVR would be beneficial for
bridges with exceptional geometry / design complexity and/or bridges of utmost concern to the safety of the
traveling public where the extra inspection cost can be justified.
Initially, the work should focus on acquiring “global” panoramas of the bridge both in elevation and cross-
section at ground level from the camera stations recommended below:
TRB 2003 Annual Meeting CD-ROM Paper revised from original submittal.
Jáuregui and White 6
1. End spans ~ horizontal sweep of each span from the abutment to the adjacent interior pier taken from both sides of the bridge; horizontal sweep between exterior girders looking towards the abutment from the interior pier and towards the interior pier from the abutment.
2. Interior spans ~ horizontal sweep of each span between interior piers from both sides of the
bridge; horizontal sweep between exterior girders looking from the interior pier to the other.
3. Overall superstructure ~ horizontal sweep of entire superstructure between abutments from both sides of the bridge.
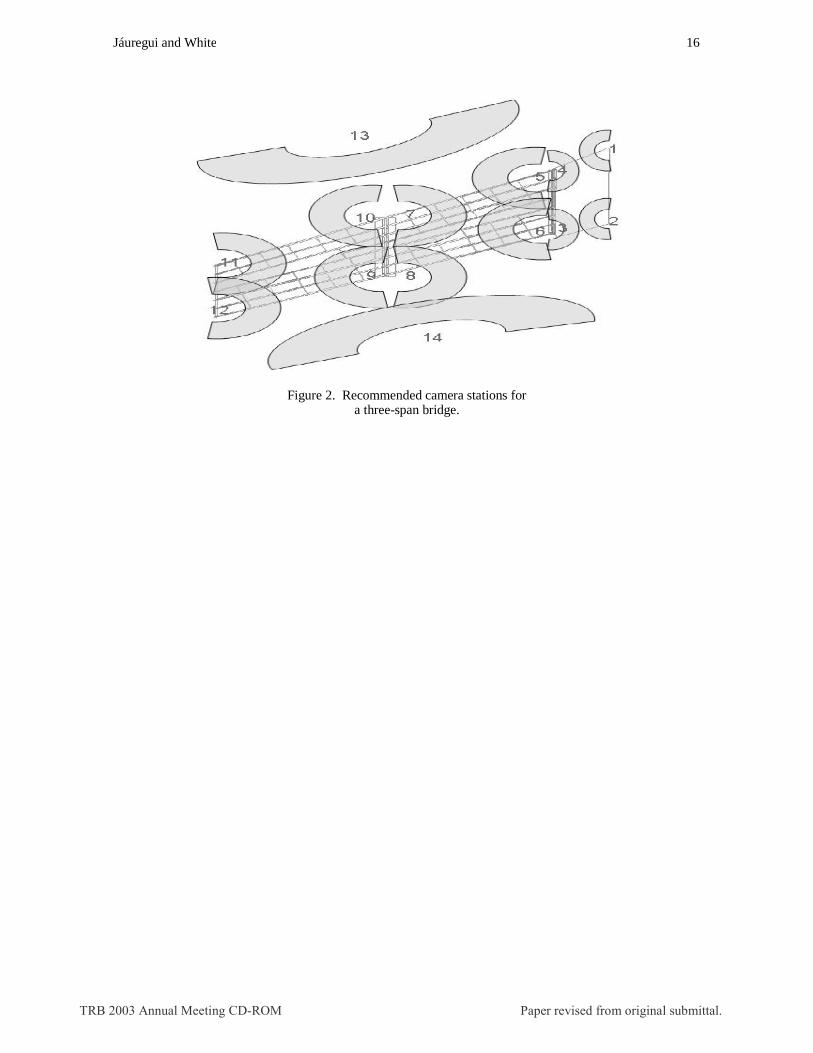
Given the photographic scheme proposed above, a three-span bridge would require a total of 14 camera stations (i.e.,
four per span plus two of the overall superstructure) as shown in Figure 2. Once the “global” pictures are taken,
plans should then be made with the assistance of an experienced bridge inspector or profession engineer to locate
and photograph local regions of the bridge that have experienced damage and/or deterioration. If the bridge is of
new construction, areas prone to damage and/or deterioration such as bearing locations and interior piers below an
expansion joint should be identified and photographed by or with the assistance of a qualified inspector.
Photographs of these potential and/or existing problem areas can later be integrated into the “global” panoramic
images to establish a baseline for future condition assessments.
Step 2: Acquisition of Digital Images
In general, the inspector should follow good photographic procedures when acquiring the digital images for
the QTVR record. The equipment used in this study to acquire images for the QTVR records is listed below (along
with associated costs at the time of purchase in 2000):
• High-resolution (2 megapixel) digital camera ~ $515 • Storage disks for camera ~ $240 • Camera tripod (with pan and tilt adjustment) ~ $190 • Camera mount (with 360° indexing at 18° increments) ~ $375 • Laptop computer ~ $2000
Given the prices listed above, the equipment cost totaled approximately $3320, which does not include the cost of
the QTVR computer software (mentioned later in the paper). A good quality tripod (with adjustable legs and a
tiltable head) is recommended in order to adjust to the rough terrain encountered at a bridge site. Many bridge
features require the use of the pan and tilt adjustment so that the inspector may look up under the superstructure as
well as pan horizontally. The mounting head on the tripod should have an indexed, graduated scale so that the
camera can be rotated horizontally in equal angle increments. This ensures that the overlap between individual
photographs is consistent. Using the indexing head, the increment is typically set at an angle of 18 degrees; for most
TRB 2003 Annual Meeting CD-ROM Paper revised from original submittal.
Jáuregui and White 7
panoramas, the total angle covered from one end to the other of the photographed region is usually less than 180
degrees or 11 images. In general, a single 180-degree panorama will require between 15 and 20 minutes to complete
the photography, depending on obstructions. For a single span bridge, for example, six “global” panoramas would
require a time investment of about 2 hours (not including the time required to take individual pictures of problem
areas). More pictures and thus, a longer investment of time will be required for multiple span and longer bridges.
Each individual picture should be taken with no moving objects and avoiding changes in lighting
conditions, if possible. It is particularly important that there is no moving object on the extreme right or left side of
the picture when it is taken since the subsequent picture will not have the same object. Since the object is not
present in the next photograph, the program cannot match pixels and thus, stitching is not possible. In general,
blurry pictures, changes in exposure, and moving objects can all cause problems when merging photographs into a
single panoramic image. A detailed discussion of the photographic procedures used in this study is given in
NMSHTD (2001).
Step 3: Creation of Cylindrical / Cubic Panoramas
There are two main groups of panoramas: cylindrical and cubic. Cylindrical panoramas simulate the
experience of standing in the center of a cylinder and panning horizontally up to 360 degrees. Cubic panoramas add
the effect of being able to pan vertically as much as 180 degrees to create a 3-D “spherical” environment.
Cylindrical panoramic creation was done using the VR Worx program (Proni and Weisman, 1999). This program
costs approximately $300 and performs stitching automatically by identifying and matching pixels between adjacent
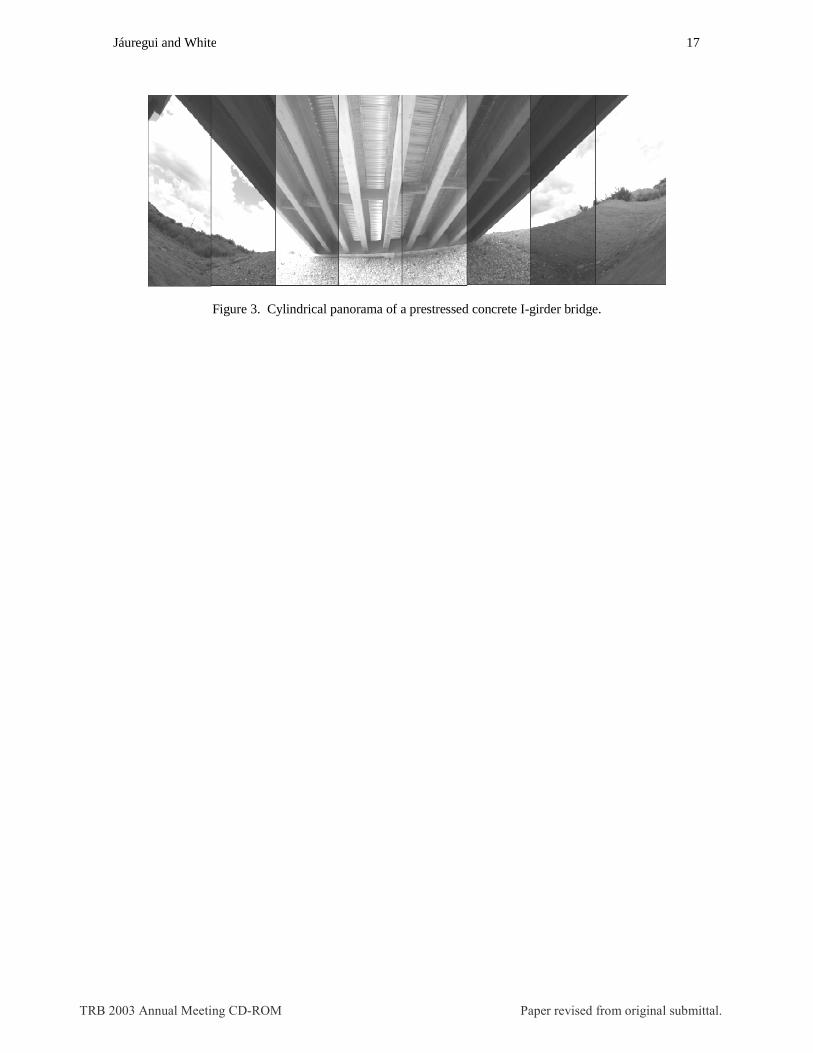
images. An image overlap of 30% is needed in order for the stitching to work properly. Figure 3 shows a
cylindrical panorama created using 8 individual images of a prestressed concrete I-girder bridge. As illustrated in
the figure, the VR Worx program is able to adjust the pictures in orientation and exposure to achieve a smooth
transition from one end of the panorama to the other.
In instances when the VR Worx program had difficulty in stitching images together, panoramic
development was done using the RealViz Stitcher 3.01 (RVS3) program (Antipolis, 2001), which has a more robust
stitching process and costs approximately $500. Unlike the VR Worx program, the RVS3 program also has the
capability for the creation of cubic panoramas. Figure 4 shows the camera orientations for acquiring the images for
a cubic panorama. As shown in the figure, three rows of images (at 20 images per row) are captured at vertical
TRB 2003 Annual Meeting CD-ROM Paper revised from original submittal.
Jáuregui and White 8
angles of +45, zero, and –45 degrees (Antipolis, 2001). Thus, a full 360° cubic panorama requires 60 images
compared to the 20 images needed for a full cylindrical panorama.
Step 4: Rendering of QTVR File
Once the stitching process is completed, the cylindrical and/or cubic panoramas are rendered to an output
file based on the Apple QuickTime standard (www.apple.com). The rendered panoramas and selected individual
images of localized areas (prone to or with existing damage and/or deterioration) are then linked together through
the use of “hot spots”. In general, “hot spots” are user-defined links that connect either (1) separate panoramic
images and/or (2) a single panoramic image to a detailed photograph. The creation of “hot spots” begins with the
creation of a nodal map; a nodal map shows the interactive relationships between a single panorama and its
associated links. Once linked, the panoramas and/or photographs combine to produce the final QTVR record to
simulate a virtual environment, which may be navigated at the discretion of the inspector. Written explanations
along with design drawings may be included to fully describe the direction of view within the environment and/or a
specific bridge feature under observation. The amount of office time spent in developing a QTVR record will
depend on the number and type (cylindrical and/or cubic) of panoramas to be rendered, the number of “hot spots” or
links in the rendered panoramas, and the amount of text matter and/or design drawings incorporated into the record.
The QTVR example record discussed in the following section, which included six 180-degree panoramas and 15
individual images of problem areas with text descriptors, required approximately eight hours (i.e., about one hour
and 20 minutes per panorama) of office time to create.
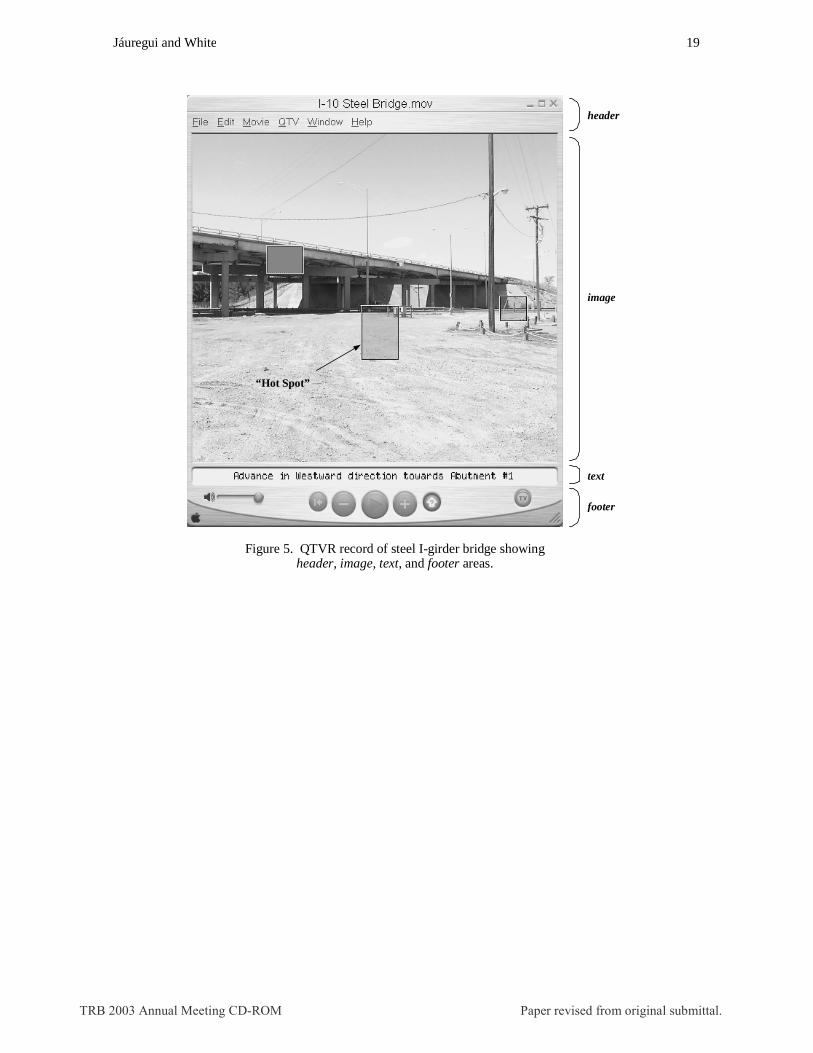
Figure 5 shows the opening scene from a sample QTVR record of a steel I-girder bridge. The screen
shown in the figure can be broken down into four distinct areas: the header, image, text, and footer areas. The
header or top portion of the screen contains the title of the bridge inspection project (i.e., “I-10 Steel Bridge”) and
the menu items for the QuickTime software. Details regarding the menu items may be found at the Apple
QuickTime website (www.apple.com). Panoramas and/or individual photographs are displayed in the middle or
image portion of the record. The inspector may navigate within this viewable image area at his/her discretion with
the use of the computer mouse. The rectangular boxes are “hot spots” which link the displayed panorama to other
panoramas and/or individual pictures. When the cursor is positioned in the outlined area of a “hot spot”, a text
description towards the bottom of the screen (i.e., the text area) may be displayed to describe the link. For example,
the “hot spot” located towards the right portion of the screen is linked to a panorama named “Advance in Westward
TRB 2003 Annual Meeting CD-ROM Paper revised from original submittal.
Jáuregui and White 9
direction towards Abutment #1”. A simple click of the computer mouse with the cursor positioned in the “hot spot”
region will display the linked panorama in the image area. This new panorama is now active and may contain
associated links of its own. In addition to other panoramas, “hot spots” may also link the active panorama to
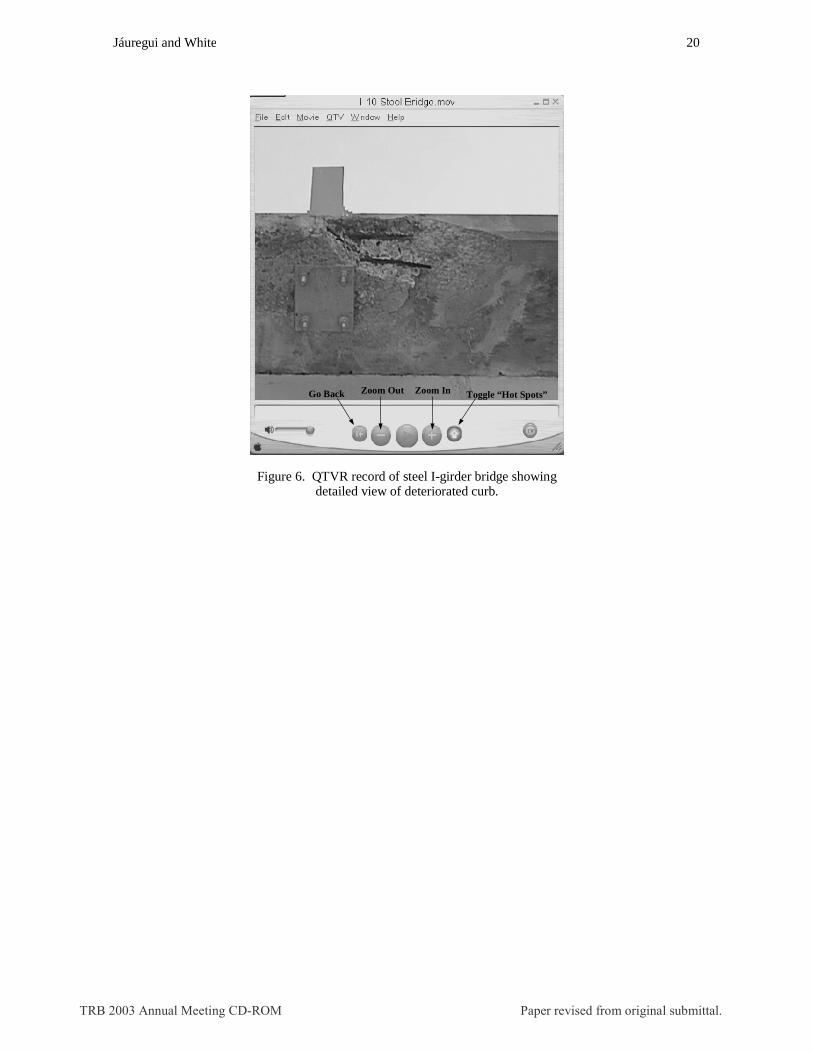
individual pictures of noted problem areas. For example, the “hot spot” on the left side of the image area shown in
Figure 5 is linked to a detailed photograph named “Advance Southward to Zoomed View of Spalling and Exposed
Rebar under curb on North Side of Deck (Span #4)”. Clicking on this “hot spot” brings up the screen shot of Figure
6, which shows a picture of the deteriorated area of the reinforced concrete deck beneath the curb. On the bottom
portion of the QTVR screen or footer are buttons that allow the inspector to zoom in and out within the viewable
screen area, to toggle the display of the “hot spots” on and off, and to return to the previous panorama and/or
individual picture.
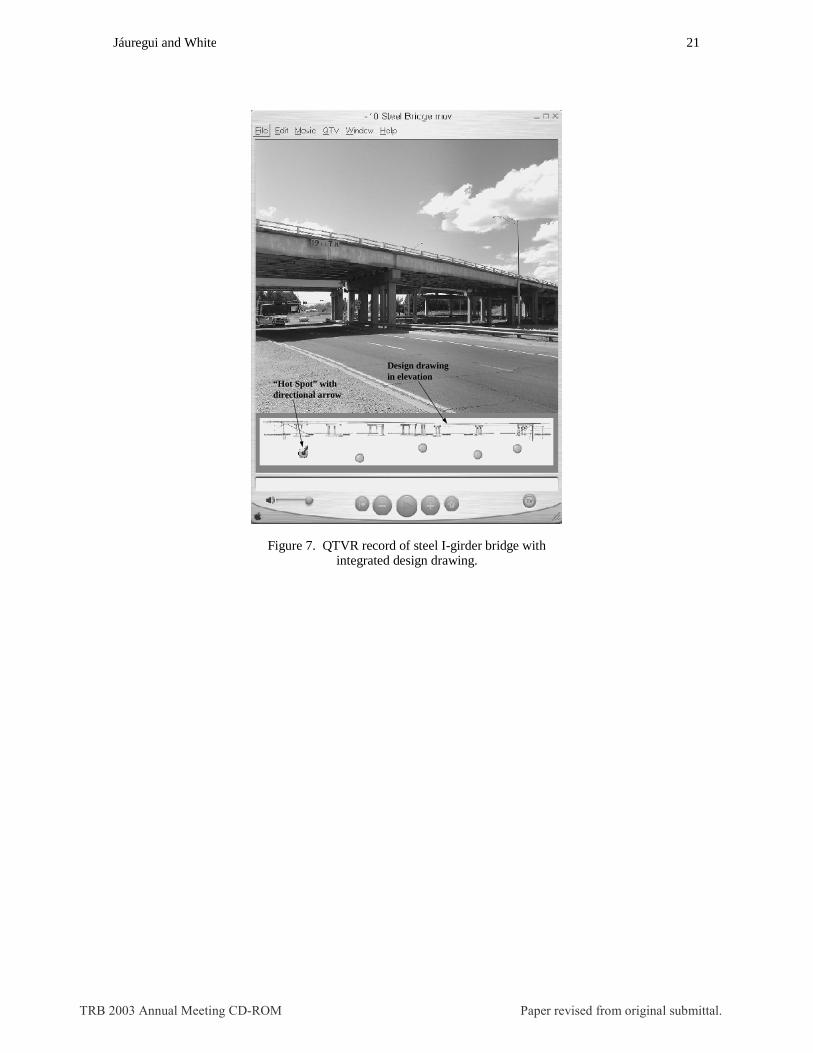
Another powerful feature of QTVR technology is that design drawings can be integrated into the bridge
inspection record. For example, Figure 7 shows the QTVR record of a steel I-girder bridge with a view of the bridge
in elevation (taken from the design drawings) placed below the bottom of the panoramic image. Five “hot spot”
buttons have been overlaid on the design drawing, each representing a different location from which the inspector
may view the bridge. As the inspector scrolls within the panoramic image, the arrow on the “hot spot” button that is
active follows the inspector’s line of sight. This particular feature is quite useful for planning a bridge inspection
since access, bridge clearances, and traffic conditions can be evaluated prior to the site visit. In addition, the
inspector has a good sense of direction before setting foot at the bridge site.
POTENTIAL IMPACT OF VIRTUAL REALITY IN BRIDGE INSPECTION
The QTVR technology can serve to improve the quality of bridge inspection projects in many ways. For
instance, personnel with inadequate experience, training, and/or education to accurately assess the condition of a
bridge often perform routine inspections without the assistance of a professional engineer on site (Rolander et al.,
2000). It has also been reported that the quality control measures used most often by state highway departments is
an office review of the inspection reports by a professional engineer (Rolander et al., 2000). This off-site review
process, however, may have limitations due to the written format and potential lack of visual documentation
provided in the report. With QTVR, a routine inspection of a bridge can be documented with more detail in a virtual
environment and reviewed remotely by a professional engineer at his or her convenience
TRB 2003 Annual Meeting CD-ROM Paper revised from original submittal.
Jáuregui and White 10
In preparing for an inspection, the inspector may choose to review past reports to determine the type and
severity of previously observed defects. Because of its predominately “written entry” format, a bridge inspection
report may be insufficient to thoroughly describe the location and condition of damage and/or deteriorated areas
observed during an inspection. An inspector often must refer to separate design drawings, rough sketches, and/or
hard copy photographs to identify where the defects were found. After an inspection, the current physical state of
the bridge is then compared to the previously noted condition to determine if the level of deterioration has advanced
or remained the same. This comparison may be difficult due to the written format and limited amount of
photographic detail recorded in a typical inspection report; the NBIS requires that only the top of the roadway and
side elevation of the bridge be photographed. The use of QTVR will enhance the value of previous inspection
reports in preparing and conducting an inspection. Virtual reality will also provide a better correlation between the
assigned rating and the observed physical state of the bridge. That is, the relationship between the noted condition
as described by NBIS (FHWA, 1995) terms such as minor, advanced, and sound (see Table 1) or by condition states
defined in the AASHTO Guide for CoRe Elements (1998) will be more obvious. Using web page authoring tools
and the Internet, the potential also exists to link a QTVR file directly to a bridge inspection report where a more
detailed account (longer than one line) of the bridge’s condition can be provided.
Training courses that cover visual inspection methods, such as the bridge inspector’s training course
(FHWA, 1995), could benefit greatly from QTVR technology. In this course, participants are taught the basic
procedures and techniques for inspecting and evaluating various types of bridges. For each bridge type, the design
characteristics are first reviewed. Procedures for inspecting the various areas (i.e., bearing areas, tension areas,
shear areas) of the bridge element (i.e., deck, superstructure, and substructure) are then presented. With this
background, the participant is then asked to review the bridge inspection records (by performing a cursory review of
still photographs taken of the bridge element) from various case studies and give a condition rating of the bridge
component using the NBIS rating system. Using QTVR, the noted bridge condition could be reviewed in a virtual
reality setting as if the inspector was at the site itself, thus, making the rating exercise much more valuable. As with
any practical training course, time must be allotted in the program to make field trips to the site of the constructed
facility. To remain on the program schedule, however, just a few field trips are made and only a limited amount of
time is actually spent in the field, which does not allow the participants to perform a thorough inspection of the
structure. Virtual bridge inspections conducted in a classroom setting cannot replace but can definitely aid in
recovering some of this lost experience. Inspections could also be placed on compact disks and distributed to the
TRB 2003 Annual Meeting CD-ROM Paper revised from original submittal.
Jáuregui and White 11
participants for later review. Hence, the QTVR technology will provide the platform necessary to “bring the bridge
to the inspector”.
CONCLUSIONS
Recent studies conducted by the Federal Highway Administration (FHWA) have raised several issues in
need of further action to improve routine bridge inspections. Accordingly, the study reported herein served to
improve the methods by which inspection data is recorded using Quick Time Virtual Reality (QTVR). The major
steps in developing a QTVR record of a bridge inspection project (including field procedures and multi-media
techniques) were illustrated. It is concluded that QTVR has the potential to advance bridge inspection practice in
such ways as facilitating the review of previous bridge inspection records, automating the bridge inspection process,
enhancing the training of inspectors, and overall improving bridge management systems.
ACKNOWLEDGEMENTS
The authors would like to thank the New Mexico State Highway and Transportation Department
(NMSHTD) and Federal Highway Administration (FHWA), in particular David Albright (Research Bureau Chief,
NMSHTD) and Reuben Thomas (Division Administrator, FHWA) for the support that made this research possible.
Appreciation also goes to James Pate, Anita Carrasco and Mark Fountain (Civil and Geological Engineering
Department, NMSU) for their help in the field as well as with the image processing. Contents of this paper reflect
the views of the authors and not necessarily those of the NMSHTD and FHWA.
REFERENCES
American Association of State Highway and Transportation Officials (AASHTO). (1994). Manual for Condition Evaluation of Bridges. Washington, D. C.
American Association of State Highway and Transportation Officials (AASHTO). (1998). AASHTO Guide for
Commonly Recognized (CoRe) Structural Elements. Washington, D. C. Antipolis, S. (2001). Stitcher 3.01 User Manual. REALVIZ S.A., France. Apple QuickTime Web Site http://www.apple.com/quicktime. Federal Highway Administration (FHWA). (1995). Bridge Inspector’s Training Manual / 90. U. S. Department of
Transportation, Washington, D. C. Haque, M. E. and Pongponrat, K. (2000). “Integrated Multimedia Uniform Bridge Element Identification System
Database for Bridge Inspection and Maintenance.” Transportation Research Record No. 1697 (Maintenance and Management of Bridges and Pavements), Transportation Research Board, Washington, D. C., pp. 1 – 5.
TRB 2003 Annual Meeting CD-ROM Paper revised from original submittal.
Jáuregui and White 12
New Mexico State Highway and Transportation Department (NMSHTD). (2001). “Road Lifecycle Innovative
Financing Evaluation (Road LIFE)”. Year 2001 Annual Report, Santa Fe, N. M. Phares, B. M., Graybeal, B. A., Rolander, D. D., Moore, M. E., and Washer, G. A. (2000). “Reliability and
Accuracy of Routine Inspection of Highway Bridges.” Transportation Research Record No. 1749 (Maintenance of Transportation Pavements and Structures), Transportation Research Board, Washington, D. C., pp. 82 – 92.
Proni, D. and Weisman, T. (1999). The VR Worx, Integrated Authoring Environment for QuickTime VR. VR
Toolbox, Inc., Pittsburgh, P. A. Rolander, D. D., Phares, B. M., Graybeal, B. A., Moore, M. E., and Washer, G. A. (2000). “Highway Bridge
Inspection: State-of-the-Practice Survey.” Transportation Research Record No. 1749 (Maintenance of Transportation Pavements and Structures), Transportation Research Board, Washington, D. C., pp. 73 – 81.
Thompson, P. D. and Shepard, R. W. (1994). “PONTIS.” Transportation Research Circular 423: Characteristics
of Bridge Management Systems, Transportation Research Board, Washington, D. C. White, K. R., Minor, J., and Derucher, K. N. (1992). Bridge Maintenance, Inspection, and Evaluation. 2nd Edition,
Revised and Expanded. Marcel Dekker, Inc., New York, New York.
TRB 2003 Annual Meeting CD-ROM Paper revised from original submittal.
Jáuregui and White 13
LIST OF TABLES Table 1. NBIS condition rating system (FHWA, 1995). LIST OF FIGURES Figure 1. Creation of panoramic image from series of individual photographs. Figure 2. Recommended camera stations for a three-span bridge. Figure 3. Cylindrical panorama of a prestressed concrete I-girder bridge. Figure 4. Camera orientations for cubic panorama (Antipolis, 2001). Figure 5. QTVR record of steel I-girder bridge showing header, image, text, and footer areas. Figure 6. QTVR record of steel I-girder bridge showing detailed view of deteriorated curb. Figure 7. QTVR record of steel I-girder bridge with integrated design drawing.
TRB 2003 Annual Meeting CD-ROM Paper revised from original submittal.
Jáuregui and White 14
Table 1. NBIS condition rating system (FHWA, 1995).
Condition Rating
Condition State
Description of Condition State
N
NOT APPLICABLE
9
EXCELLENT
8
VERY GOOD
no problems noted
7
GOOD
some minor problems
6
SATISFACTORY structural elements show some minor deterioration
5 FAIR all primary structural elements are sound but may have minor section loss, cracking, spalling, or scour
4
POOR
advanced section loss, deterioration, spalling, or scour present
3 SERIOUS section loss, deterioration, spalling, or scour have seriously affected primary structural members; local failures possible; fatigue cracks in steel or shear cracks in concrete may be present
2 CRITICAL advanced deterioration of primary structural members; fatigue cracks in steel or shear cracks in concrete may be present or scour may have removed substructure support
1 “IMMINENT” FAILURE
major deterioration or section loss present in critical structural members or obvious vertical or horizontal movement affecting structure stability
0
FAILED
out of service; beyond corrective action
TRB 2003 Annual Meeting CD-ROM Paper revised from original submittal.
Jáuregui and White 15
Figure 1. Creation of panoramic image from series
of individual photographs.
TRB 2003 Annual Meeting CD-ROM Paper revised from original submittal.
Jáuregui and White 16
Figure 2. Recommended camera stations for a three-span bridge.
TRB 2003 Annual Meeting CD-ROM Paper revised from original submittal.
Jáuregui and White 17
Figure 3. Cylindrical panorama of a prestressed concrete I-girder bridge.
TRB 2003 Annual Meeting CD-ROM Paper revised from original submittal.

Jáuregui and White 18
Figure 4. Camera orientations for cubic panorama (Antipolis, 2001).
TRB 2003 Annual Meeting CD-ROM Paper revised from original submittal.
Jáuregui and White 19
Figure 5. QTVR record of steel I-girder bridge showing
header, image, text, and footer areas.
header
image
text
footer
“Hot Spot”
TRB 2003 Annual Meeting CD-ROM Paper revised from original submittal.
Jáuregui and White 20
Figure 6. QTVR record of steel I-girder bridge showing
detailed view of deteriorated curb.
Go Back Zoom Out Zoom In Toggle “Hot Spots”
TRB 2003 Annual Meeting CD-ROM Paper revised from original submittal.
Jáuregui and White 21
Figure 7. QTVR record of steel I-girder bridge with
integrated design drawing.
“Hot Spot” with directional arrow
Design drawing in elevation
TRB 2003 Annual Meeting CD-ROM Paper revised from original submittal.