Individual Differences in Rule-Based Grammaticality ... - J-Stage
16
Individual Differences in Rule-Based Grammaticality Judgment Behavior: A Bayesian Modeling Approach Kunihiro KUSANAGI Hiroshima University Shusaku KIDA Hiroshima University Abstract The aim of the present study is to examine the source of individual differences in the rule-based grammaticality judgment behavior of foreign language learners. It has been recognized that learners with certain specific traits benefit relatively more from rule-based knowledge representations in their grammaticality judgment performance, while another type of learner tends to rely on their unconscious and non-symbolic type of knowledge, which is often called intuition. Generally, the former type of learner exhibits a relatively higher discriminability (d') in a grammaticality judgment task than the latter type. However, there remain individual differences unexplained in such rule-based grammaticality judgment behavior. The present study focused on grammatical carefulness (GC) as a key factor behind the variance inspected, as GC is considered as one of the latent variables associated with the speed-accuracy tradeoff and meta-linguistic behavior. Using the type II signal detection paradigm and Bayesian modeling, the present study, which targeted Japanese university students (N = 40) who engaged in a grammaticality judgment task (K = 48), found that learners with higher GC scores are more prone to benefit from rule-based knowledge representations than those with lower GC scores, who benefit from their intuition. It indicates that individuals’ psychological, behavioral, and meta-cognitive traits moderate grammaticality judgment behavior in a foreign language. The practical implications concerning testing and assessing grammatical performance in a foreign language were also discussed. 1. Background Analyzing decision, judgment, and choice behavior plays a central role in various academic fields, such as cognitive psychology and behavioral sciences. Foreign language teaching research is no exception; Grammaticality Judgment Tasks (GJTs) are regarded as one of the most commonly used set of tools to examine one’s grammatical performance and to construct latent variables such as grammatical knowledge, albeit they have also given rise to critical methodological debates (e.g., Ellis, 1991; Mandell, 1999). This toolbox usually consists of three 177
-
Upload
khangminh22 -
Category
Documents
-
view
5 -
download
0
Transcript of Individual Differences in Rule-Based Grammaticality ... - J-Stage
Individual Differences in Rule-Based Grammaticality
Judgment Behavior: A Bayesian Modeling Approach
Kunihiro KUSANAGI
Hiroshima University
Shusaku KIDA
Hiroshima University
Abstract
The aim of the present study is to examine the source of individual differences in the
rule-based grammaticality judgment behavior of foreign language learners. It has been recognized
that learners with certain specific traits benefit relatively more from rule-based knowledge
representations in their grammaticality judgment performance, while another type of learner tends
to rely on their unconscious and non-symbolic type of knowledge, which is often called intuition.
Generally, the former type of learner exhibits a relatively higher discriminability (d') in a
grammaticality judgment task than the latter type. However, there remain individual differences
unexplained in such rule-based grammaticality judgment behavior. The present study focused on
grammatical carefulness (GC) as a key factor behind the variance inspected, as GC is considered
as one of the latent variables associated with the speed-accuracy tradeoff and meta-linguistic
behavior. Using the type II signal detection paradigm and Bayesian modeling, the present study,
which targeted Japanese university students (N = 40) who engaged in a grammaticality judgment
task (K = 48), found that learners with higher GC scores are more prone to benefit from rule-based
knowledge representations than those with lower GC scores, who benefit from their intuition. It
indicates that individuals’ psychological, behavioral, and meta-cognitive traits moderate
grammaticality judgment behavior in a foreign language. The practical implications concerning
testing and assessing grammatical performance in a foreign language were also discussed.
1. Background
Analyzing decision, judgment, and choice behavior plays a central role in various academic
fields, such as cognitive psychology and behavioral sciences. Foreign language teaching research
is no exception; Grammaticality Judgment Tasks (GJTs) are regarded as one of the most
commonly used set of tools to examine one’s grammatical performance and to construct latent
variables such as grammatical knowledge, albeit they have also given rise to critical
methodological debates (e.g., Ellis, 1991; Mandell, 1999). This toolbox usually consists of three
177
variables: (a) accuracy; (b) reaction time; and (c) subjective measures, including confidence,
certainty, and other attributes. The latent structure among the three variables itself has been an
important subject of inquiry in mathematical psychology (e.g., Pleskac & Busemeyer, 2010;
Ratcliff & Starns, 2013). However, in foreign language teaching research, very little is known
about the dynamics among the three variables taken from GJTs, especially those with the third one
(Kusanagi, 2018; Tamura, Harada, Kato, Hara, & Kusanagi, 2016).
Generally, a subject’s accuracy of judgment behavior is defined as a correct response
ratio or a probability to answer correctly, and subjective measures are the result of another type of
post-decisional tasks, which are retrospections regarding one’s mental states related to the given
judgment and its processes. One of the typical cases of subjective measures may be binary
confidence rating. After judging the grammaticality of a stimulus, a subject is then asked to
choose two levels of confidence about a given judgment, such as "confident" or "not confident".
This procedure is sometimes called a type II task, while the judgment of the property of a given
stimulus is referred to as a type I task. Type II tasks have various applications in cognitive
psychology, especially research about artificial grammar learning, recognition memory, and
subliminal perception (e.g., Galvin, Podd, Drga, & Whitemore, 2003; Kunimoto, Miller & Pashler,
2001; Maniscalco & Lau, 2012). Other common applications of type II tasks may include: (a)
non-binary confidence ratings, such as the percentile scale (Tunney & Shanks, 2003); (b) the
Remember-Know (R/K) procedure (Yonelinas, 2002); (c) multinomial levels called source
attributions, such as "Rule", "Recollection", "Intuition", "Familiarity", and "Guess" (e.g., Scott &
Dienes, 2008); and (d) binomial source attribution, such as "Rule" vs. "Intuition" (e.g., Kusanagi,
2018; Tamura et al., 2016). We have adopted the last one, which is commonly used in previous
foreign language teaching research (e.g., Ellis, 2005; Tamura et al., 2016).
It is important to note that the responses regarding the subjective measures sometimes
supplied us with additional information to predict the probability that the given judgment is
correct. For instance, assuming that a subject engaged in a GJT (K = 100) with a binary
confidence rating, we can cross-tabulate the observed responses, as presented in Table 1 below.
Table 1.
Hypothetical Cross Tabulation of Type I and Type II Responses
Confident Not Confident Total
Correct 60 10 70
Incorrect 10 20 30
Total 70 30 100
In the column of “confident” responses, 60 out of 70 responses were correct (86 percent),
while in the column of “not confident” responses, 10 out of 30 responses were correct (33 percent).
In this hypothetical case, when a response is confident, the associated judgment is more than twice
178

as likely to be correct. This probabilistic relation can be formally called conditional dependence.
When there is such a conditional dependence of the responses between type I and type II tasks, it
is theoretically considered to give us a type of evidence for conscious knowledge, explicit
knowledge, explicit memory, meta-cognitive sensitivity, or more simply, awareness,
consciousness, and meta-cognition (e.g., Galvin et al., 2003; Kunimoto et al., 2001; Maniscalco &
Lau, 2012; Scott & Dienes, 2008). Conditional dependence can be formulated by various ways;
some previous research has employed a guessing criterion, a zero-correlation criterion (Scott &
Dienes, 2008), and the type II signal detection paradigm (e.g., Galvin et al., 2003; Maniscalco &
Lau, 2012). Second language acquisition researchers also pay attention to conditional dependence
between accuracy and subjective measures, in order to inspect explicit and implicit grammatical
knowledge of second language learners (e.g., Ellis, 2005; Rebuschat, 2013).
In foreign language teaching research in Japan, Kusanagi (2018) examined the dynamics
among accuracy, reaction time, and subjective measures taken from university-level English
learners’ grammaticality judgment data, of which stimuli were assumed to include only
grammatical structures that were already learned. The study reported a general tendency that a
shorter response time predicts a higher accuracy, and a higher probability of “rule” response:
namely, fast, rule-based, and correct responses vs. slow, intuition-based, and incorrect responses.
The results fit well to the common findings in mathematical psychology, rather than to the
distinction of explicit and implicit knowledge in second language acquisition theory (e.g., Ellis,
2005, 2006).
Even if conditional dependence in grammaticality judgment behavior of foreign language
learners is true as a general tendency, a problem arises when we focus on its variance, or
individual differences, which are a very important aspect of foreign language teaching in practice.
Namely, there are some learners who are more likely to rely on the “rule” to identify correct
responses, finding that using their “intuition” will mean that their responses are incorrect, and
there also is the other type of learner who behaves in a contrasting manner, using “intuition” to
find correct responses and dismissing the “rule” for leading them to incorrect responses. The
source of this inconsistency remains quite obscure, and that is what we have examined in the
present study.
2. Theoretical and Methodological Rationale
2.1 Type II Signal Detection Paradigm
To formulize the conditional dependence between accuracy and the subjective measures
described above, the present study employed the type II signal detection paradigm, which is
simply an application of signal detection theory or SDT (e.g., Macmillan & Creelman, 2005;
Stanislaw & Todorov, 1999) to type II tasks. We will first look at a standard SDT-based analysis
179

for GJT data, which starts with categorization of four types of possible responses, as detailed in
Table 2.
Table 2.
Response Categories in Signal Detection Theory
Stimuli = Grammatical Stimuli = Ungrammatical Response = "Grammatical" Hit False Alarm
Response = "Ungrammatical" Miss Correct Rejection
The Hit Ratio (HR1) and False Alarm Ratio (FAR1) were then calculated. HR1 is the probability of
giving a “grammatical” response to grammatical items, and FAR1 is the probability of giving a
“grammatical” response to ungrammatical items.
= Response = "Grammatical" | Stimulus = "Grammatical")
(1)
= Response = "Grammatical" | Stimulus = "Ungrammatical")
(2)
The discriminability index, d1' or type I d' is defined as
= HR) − FAR) (3)
where z denotes z-transformation.
Type I d' signifies both negative and positive values, and positive values represent how
well one discriminates given stimuli without response bias. A typical index for response bias is
criterion, c1, which is defined as
= −
12 [HR) + FAR)] (4)
When the index c1 is 0, there is no response bias. Positive values represent bias toward
grammatical responses; negative toward ungrammatical ones. This equal variance Gaussian signal
detection model is graphically represented in Figure (1).
180
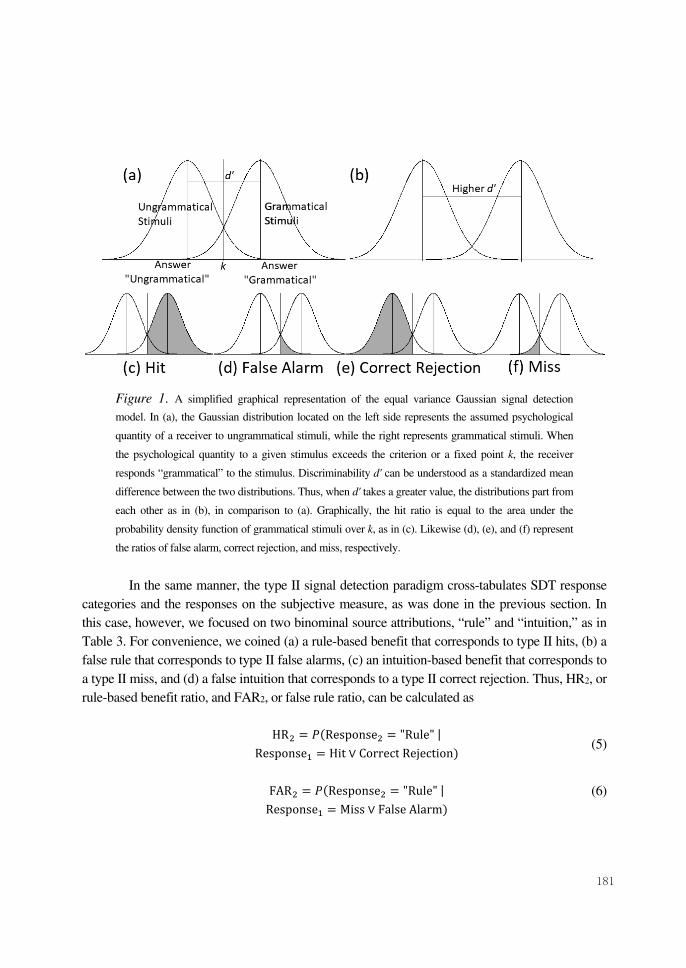
Figure 1. A simplified graphical representation of the equal variance Gaussian signal detection
model. In (a), the Gaussian distribution located on the left side represents the assumed psychological
quantity of a receiver to ungrammatical stimuli, while the right represents grammatical stimuli. When
the psychological quantity to a given stimulus exceeds the criterion or a fixed point k, the receiver
responds “grammatical” to the stimulus. Discriminability d' can be understood as a standardized mean
difference between the two distributions. Thus, when d' takes a greater value, the distributions part from
each other as in (b), in comparison to (a). Graphically, the hit ratio is equal to the area under the
probability density function of grammatical stimuli over k, as in (c). Likewise (d), (e), and (f) represent
the ratios of false alarm, correct rejection, and miss, respectively.
In the same manner, the type II signal detection paradigm cross-tabulates SDT response
categories and the responses on the subjective measure, as was done in the previous section. In
this case, however, we focused on two binominal source attributions, “rule” and “intuition,” as in
Table 3. For convenience, we coined (a) a rule-based benefit that corresponds to type II hits, (b) a
false rule that corresponds to type II false alarms, (c) an intuition-based benefit that corresponds to
a type II miss, and (d) a false intuition that corresponds to a type II correct rejection. Thus, HR2, or
rule-based benefit ratio, and FAR2, or false rule ratio, can be calculated as
HR = Response = "Rule" | Response = Hit ∨ Correct Rejection)
(5)
FAR = Response = "Rule" | Response = Miss ∨ False Alarm)
(6)
181

Table 3.
Response Categories in the Type II Signal Detection Paradigm
Response =
Hit ∨ Correct Rejection
Response =
Miss ∨ False Alarm
Response = "Rule" Type II Hit
(Rule-Based Benefit)
Type II False Alarm
(False Rule)
Response = "Intuition" Type II Miss
(Intuition-Based Benefit)
Type II Correct Rejection
(False Intuition)
Thus, type II d' and type II criteria were written as
= HR) − FAR) (7)
= −
12 [HR) + FAR)] (8)
Type II d' can be an estimator to evaluate how much a subject benefits from rule-based
knowledge rather than intuition in grammaticality judgment behavior without biases, relative to
overall discriminability. When the value is 0, it indicates no benefit from rule-based knowledge
and intuitions. Greater positive values indicate a higher benefit from rule-based knowledge.
Following previous studies, we expect that the population mean, μ, of this index takes a positive
rather than a negative value.
2.2 Grammatical Carefulness
Grammatical Carefulness (GC) is a psychological, behavioral, and meta-cognitive trait
that is expected to moderate foreign language learners’ speed-accuracy tradeoff and
meta-linguistic behavior (Kusanagi et al., 2015). A Foreign Language Grammatical Carefulness
Scale (FLGCS) is a statistically sound inventory written in Japanese (K = 14). FLGCS yields three
subscales and is measured by a three-factor model. Kusanagi et al. reported that the factorial
structure of this inventory is statistically robust, and each of their subscales showed a relatively
high reliability coefficient. Their scale was also reported to have measurement invariance among
the school levels and genders.
Theoretically, GC is expected to be a cause of highly cautious, careful, deliberate, and
intentional language use (Kusanagi et al., 2015, p. 79). Based on this hypothetical property, the
present study assumes that GC is one of the potential traits that explain the individual differences
in rule-based grammaticality judgment behavior, or more precisely, variance in type II d' of
foreign language learners. We expect that learners with relatively higher GC scores will exhibit
higher values in type II d' than learners with lower GC score. The present study further assumes a
182

bi-directional relationship between the two. That is, GC as a psychological, behavioral, and
meta-cognitive trait, is incrementally enhanced by learners’ past subjective successes in cautious,
careful, and deliberate types of language use that include rule-based grammaticality judgment
behavior.
2.3 Models and Research Questions
The present study adopted the framework of Bayesian modeling (see, e.g., Kruschke,
2013, and Lee & Wagenmakers, 2014, for an introduction) to examine the individual differences
described above, because it was recognized that the Null Hypothesis Significant Testing (NHST)
quite often seriously misleads foreign language teaching researchers whose research practice is, by
any standard, not free from (a) uncontrolled research designs with undoubted small sample sizes,
(b) less informative statistical treatments such as t-test and ANOVA, (c) informally described
hypotheses and research questions, and (d) a wealth of misinterpretations of p-values. Unlike
orthodox statistics, the ultimate goal of the present study is to gain a posterior distribution of
parameters in our mathematical models rather than judging statistical significance.
In Bayesian modeling, researchers first construct mathematical models, which should be
formally presented. In the case of the present study, we examine four general regression models
below:
:
= β + ε (9)
:
= β + βGC + ε (10)
:
= β + β
+ ε (11)
:
= β + βGC + β
+ ε (12)
where M denotes models. βj = 0, 1, 2) is the standardized regression coefficient and ε represents the
error of the i-th participant’s value.
is the response variable—that is, type II d' of the i-th
participant. The predicators in the models include GCi, which is the summated scale score of the
i-th participant, and
, which denotes type I d'. Additionally, β0 represents the intercept.
In Model 1, we expect that βwill take positive values. It is equivalent to the statement
that the population mean of type II d' takes a positive value as in (13).
μ
> 0 (13)
183

The inequality in (13) is the first research hypothesis of the present study. Namely, as a general
tendency, learners benefit more from rule-based grammaticality judgment behavior.
We can now inspect the inter-learner variance, which is the main purpose of the present
study. Using Bayesian model comparison, we can select the best model that fit to the observations
from Models 2 to 4. Bayesian model comparison is one of the model selection methods used in
Bayesian analyses. For instance, if we compare Models 1 and 2, the Bayes Factor (BF), which is
sometimes called strength of evidence, can be written as
BF =
|)|) (14)
where D represents the given data. When BF > 1, it suggests that Model 1 is preferred over Model
2. In the study, we expected that Models 2 and 4 would be more strongly supported by the given
data than Model 3. That is to say, GC is a valid predictor of type II d'. Note that type I d' can be
naturally correlated to GC and type II d'. Therefore, it is necessary to examine the indirect
correlation between GC and type II d' via type I d'. Moreover, we predict that β1 is not equal to 0
in Models 2 or 4.
¬β = 0) (15)
The statement in (15) is the second hypothesis of the present study. It means that GC explains the
individual differences of rule-based grammaticality judgment behavior.
In Bayesian statistics, it is assumed that all the parameters are random. Researchers,
therefore, should specify the prior distributions on the parameters in question. The distributions
represent the subjective probability that the researchers have, which must be given prior to
observations. In the present study, the prior distributions are specified below in (16) to (18):
~Normal0, ∞) (16)
~Normal0, ) (17)
~Gamma
12000 ,
12000) (18)
where σ is the hyperparameter for ε. This setting of the prior distributions followed the method
used by Martin, Quinn and Park (2001), and is graphically represented in Figure 2. The setting is
not derived from any type of target-specific information that the authors have.
184

Figure 2. A graphical representation of the priors in the present study. Plot (a) represents the
normal distribution on βs that are virtually uninformative. Plot (b) represents the Gamma
distribution for the hyperparameters of errors. Plot (c) represents the distribution on errors; note that
the distribution is not fixed until the hyperparameter in (b) is given. The plot represents an arbitrary
shape of the prior, where the hyperparameter is equal to 1.00, for instance.
The most important step in Bayesian modeling is to update the prior distribuions on the
parameters of the given model with the observations. The updated distributions are called the
posterior distributions, which are quite often substituted with a sample of random numbers from
the posterior distributions; this is called a Markov Chain Monte Carlo (MCMC) sample. The
posterior probabiliy, which takes the form of the distributions, can be represented as
Posterior ∝ Likelihood × Prior (19)
Therefore, it can be understood that the posterior distribution is propotional to both the prior
distribution that the researchers specified, and the likelihood function, which represents the
probability of observing the data under a certain model. The present study uses standard Gibbs
sampling, which is a common MCMC algorithim, in order to construct the samples from the
posterior distributions. We directly evaluated our hypotheses using BFs, calculating Expected A
Posteriori (EAP), and constructing Bayesian credible intervals by means of highest posterior
density interval (HDI), rather than equal-tailed intervals.
In sum, following the Bayesian analysis process briefly decribed above, the present study
formally examines the following two reseach hypotheses:
(a) The population mean of type II d' takes a positive value.
(b) The standard regression coefficient of GC to type II d' is not equal to zero.
If these hypotheses are judged true, we can conclude that individual differences in rule-based
grammaticality judgment behavior can be explained by psychological, behavioral, and
meta-cognitive traits of learners, such as GC.
0.0 0.2 0.4 0.6 0.8 1.0
-1.0
-0.5
0.0
0.5
1.0
( a)
Parameter
Probability
0.0 0.2 0.4 0.6 0.8 1.0
0.0
0.1
0.2
0.3
0.4
0.5
( b)
Parameter
Probability
-4 -2 0 2 4
0.0
0.2
0.4
0.6
0.8
( c)
Parameter
Probability
185

3. Method
3.1 Participants
Forty graduate students who speak Japanese as a first language and are learning English
for academic and occupational purposes participated in a grammaticality judgment task. All of the
participants majored in engineering. Thirty-eight out of 40 were male. Their self-reported TOEIC
scores ranged from 245 to 750, at M = 446.63, SD = 98.41. All the participants signed a consent
form before the experiment, and the ethical issues concerning the present study were thoroughly
explained. No outliers were excluded.
3.2 Instruments
Computer-based grammatical judgment tasks with both types I and II paradigms were
used. In type I task, the participants were asked to judge the grammaticality of a given English
sentence by pressing a response key: "grammatical" or "ungrammatical". The participants were
then asked about their mental states during the judgment, to which they responded by pressing the
“rule” or “intuition” key. A practice session with 10 trials was provided before the experiment.
The computer program was run on Windows OS, and administered on desktop PCs with 21-inch
monitors for all participants. The stimuli set consisted of 48 sentences, including structures such as
(a) adverb placement (k = 6), (b) auxiliary verbs (k = 6), (c) possessives (k = 6), (d) verb
complements (k = 6), (e) embedded questions (k = 6), (f) conditionals (k = 6), (g) infinitives (k =
6), and (h) third person singular phrases (k = 6). Half of the stimuli (k = 24) were grammatical, and
the rest were ungrammatical (k = 24) crossing the structures. The stimuli were presented using
block randomization. This task did not require a time limit or an accelerated pace.
After the GJTs, the participants filled out a paper copy of the questionnaire form. The
questionnaire included items about their demographic information and GC items (k = 14). The GC
items were answered using a seven-point Likert scale, following Kusanagi et al. (2015).
3.3 Analysis
Firstly, we calculated the descriptive statistics of (a) accuracy, (b) the “rule” response
ratio, (c) the GC score, (d) type I d', (e) type II d', (f) the type I criterion, and (g) the type II
criterion. Of these variables, only (c), (d), (e) were our primary interest; the other secondary
variables are for reference. For (a), (b), and (c), the reliability coefficients were calculated.
Although GC has a multi-factor model, the present study did not estimate the factor score of the
subscales. Rather, we used the summated score of all the items, as it is known that the factors had
an extremely high covariance rate (Kusanagi et al., 2015).
The series of Bayesian analyses described in Section 2.3 was conducted using R (R Core
Team, 2016) with psych (Revelle, 2016), MCMCpack (Martin, Quinn,& Park, 2011), GGally
(Schloerke et al., 2017), and HDInterval (Meredith & Kruschke, 2016) packages.
186

4. Results
4.1 Data Description
The descriptive statistics of all the variables are summarized in Table 4. The correlation
matrix among the variables is shown in Table 5. Figure 3 graphically represents the distributions
and correlations of the variables. We found that assuming normality for types I and II d' and the
GC scores is a statistically valid procedure. Accuracy and the "rule" response ratio did not reflect
either a ceiling or floor effect.
The reliability coefficients of the type I responses (k = 48), type II responses (k = 48), and
GC scores were then calculated using Cronbach’s α. The results were α = .61 for type I responses,
α = .91 for type II responses, and α = .90 for the GC score. Type I responses showed a slightly
lower level of reliability than the others. However, we judged the reliability sufficient for
subsequent analyses.
Table 4.
Descriptive Statistics of All the Variables M SD Skewness Kurtosis Minimum Maximum
Accuracy 0.68 0.09 -0.35 -0.04 0.42 0.86
“Rule” Response Ratio 0.55 0.22 -0.35 -0.48 0.04 0.92
GC Score 3.25 0.89 0.27 0.24 1.36 5.71
Type I d' 0.98 0.53 -0.17 -0.13 -0.43 2.12
Type II d' 0.72 0.97 -1.01 2.96 -2.87 2.53
Type I Criterion 0.12 0.30 0.33 0.92 -0.63 0.97
Type II Criterion -0.73 0.25 -1.67 3.70 -1.64 -0.38
Note. N = 40.
Table 5.
Correlation Matrix of All the Variables 1 2 3 4 5 6 7
1. Accuracy 1.00
2. “Rule” Response Ratio -0.13 1.00
3. GC Score 0.22 0.31 1.00
4. Type I d' 0.99 -0.11 0.21 1.00
5. Type II d' 0.26 0.90 0.38 0.27 1.00
6. Type I Criterion -0.31 0.10 0.01 -0.25 -0.05 1.00
7. Type II Criterion 0.09 0.39 0.16 0.07 0.45 -0.32 1.00
187

Figure 3. Plot matrix representing the univariate and bivariate kernel density and scatter plots among all
the variables (N = 40). The numbers represent: 1 = Accuracy, 2 = Rule response ratio, 3 = GC score, 4 =
Type I d', 5 = Type II d', 6 = Type I criterion, and 7 = Type II criterion.
4.2 The General Tendency of Rule-Based Grammaticality Judgment Behavior
In order to verify research hypothesis 1, we examined the sample from the posterior
distribution of β0 in Model 1 using a standard Gibbs sampling, the iterations of which were 10,000
and the number of chains was 1, without a thinning interval. Using Geweke’s diagnosis, we
confirmed that the sampling was successfully converged. The summary of the MCMC sample
from the posterior distribution is summarized below in Table 6: the EAP of β0 was .73, and the
Bayesian credible interval at α = .05 constructed by HDI ranged from 0.40 to 1.04. Figure 4 below
shows the density of the MCMC sample on β0 in Model 1. Obviously, our results supported
research hypothesis 1.
Table 6.
The Summary of the MCMC Sample in Model 1
EAP SD 2.5% 25.0% 50.0% 75.0% 97.5%
β0 0.73 0.16 0.41 0.62 0.73 0.83 1.04
σ2 1.00 0.24 0.65 0.83 0.97 1.13 1.56
Note: Percent here represents the percentile points, rather than the boundaries of HDI.
188

Figure 4. Density plot representing the general tendency of
rule-based grammaticality judgment behavior
4.3 Grammatical Carefulness Explains the Individual Differences
For research hypothesis 2, the MCMC samples for Models 2, 3, and 4 were generated
using Gibbs sampling with the same setting as Model 1. All of the samplings were confirmed to
be converged successfully. The BF matrix of the three models was then were calculated by
marginal likelihood using Laplace approximation. The matrix is shown in Table 7 below. As with
the results of the model selection, Model 2 was found to be the most favorable in terms of BF.
Table 7.
Bayes Factor Matrix
Numerator Log Marginal
Likelihood
Denominator
Model 2 Model 3 Model 4
Model 2 -65.19 1.00 5.01 1.22
Model 3 -66.80 0.20 1.00 0.24
Model 4 -65.38 0.82 4.12 1.00
We therefore examined Model 2 with great precision. The MCMC samples from the
posterior distributions in Model 2 are summarized in Table 8 below. Figure 5 below graphically
represents the posterior distributions and the traces of the terms. The Bayesian credible interval of
β1, the standardized regression coefficient of GC scores, ranged from 0.06 to 0.67, and the EAP
was 0.38. It obviously falls into the category of positive values. Thus, the results clearly suggested
that research hypothesis 2 is plausible.
Table 8.
The Summary of the MCMC Sample in Model 2
EAP SD 2.5% 25.0% 50.0% 75.0% 97.5%
β0 0.00 0.15 -0.29 -0.09 0.00 0.10 0.30
β1 0.38 0.15 0.07 0.27 0.38 0.48 0.68
σ2 0.92 0.23 0.58 0.77 0.80 1.05 1.46
0.0 0.5 1.0 1.5
0.0
0.5
1.0
1.52.
02.
5
Population Mean
Densi
ty
189

Figure 5. Trace and density plots representing the MCMC samples from the posterior
distributions in Model 2. Plot (a), (b) and (c) represent the trace of, β0, β1, and σ2 respectively,
and plots (d), (e), and (f) are the kernel density of each.
5. Conclusion and Implications
Our study clearly revealed that: (a) foreign language learners tend to benefit more from
rule-based knowledge representations and less from intuition, and (b) variations in this tendency
can be explained at least partially as GC, one of psychological, behavioral, and meta-cognitive
traits of foreign language learners.
There still remain issues that are unexplained. Firstly, it can be stated that judgment
behavior is a window to examine one’s knowledge and cognitive operations, but it does not fully
explain all real-time language use. Therefore, the results in the present study do not necessarily
mean that all the types of language use basically rely on rule-based knowledge representations
which are moderated by some learners’ traits such as GC. Secondly, we abstracted a very
important aspect of judgment behavior—reaction time. As we mentioned earlier, reaction time
must exhibit a complex relationship with rule-based grammaticality judgment behavior. Future
studies should examine the relationship between the two. Thirdly, the present study addressed
only one of learners’ psychological, behavioral, and meta-cognitive traits. Other more common
traits such as motivation, or epistemological factors such as learner belief and learning attitudes,
may be alternatives to predict individual differences of rule-based grammaticality judgment
behavior. Lastly, we interpret the obtained results carefully in the framework of Bayesian
modeling, but it does not guarantee that the results of the present study are generalizable to any
populations.
0 2000 4000 6000 8000 10000
-0.5
0.0
0.5
( a)
Iteration
Value
0 2000 4000 6000 8000 10000
-0.2
0.2
0.6
1.0
( b)
Iteration
Value
0 2000 4000 6000 8000 10000
0.5
1.0
1.5
2.0
2.5
( c)
Iteration
Value
-0.5 0.0 0.5
0.0
0.5
1.0
1.5
2.0
2.5
( d)
Value
Density
-0.2 0.0 0.2 0.4 0.6 0.8 1.0
0.0
0.5
1.0
1.5
2.0
2.5
( e)
Value
Density
0.5 1.0 1.5 2.0 2.5
0.0
0.5
1.0
1.5
2.0
( f)
Value
Density
190

Although such limitations should be taken seriously, our findings may shed light on the
field of assessment and testing grammatical performance. For instance, type II responses
themselves can be very important additional information for not only understanding cognitive
processes, but also making educational decisions, such as curricula design, students placement and
material development.
Assuming that there are two learners who perform very similarly in type I task, but one
benefits more from rules while the other benefits more from intuition, rationally, the pedagogical
treatments and materials that the two learners need may differ. For instance, teaching materials
that are needed for the learner who tends to rely on intuition may be a textbook that give precise
information about grammatical rules, rather than that of the pattern practice type. However, such
optimization of treatments and materials cannot be realized without understanding the individual
differences underlining in a latent factor behind the performance. Needless to say, in order to
understand such hidden individual differences and successfully apply it to everyday teaching
practices, formal approaches such as Bayesian modeling, which we have implemented in the
present study, will be very helpful and promising.
References
Ellis, R. (1991). Grammaticality judgments and second language acquisition. Studies in Second
Language Acquisition, 13, 161–186.
Ellis, R. (2005). Measuring implicit and explicit knowledge of a second language: A psychometric
study. Studies in Second Language Acquisition, 27, 141–172.
Ellis, R. (2006). Modeling learning difficulty and second language proficiency: The differential
contributions of implicit and explicit knowledge. Applied linguistics, 27, 431–463.
Galvin, S. J., Podd, J. V., Drga, V., & Whitmore, J. (2003). Type 2 tasks in the theory of signal
detectability: Discrimination between correct and incorrect decisions. Psychonomic Bulletin
and Review, 10, 843–876.
Kruschke, J. K. (2010). Doing Bayesian data analysis: A tutorial with R and BUGS. New York,
NY: Academic Press.
Kunimoto, C., Miller, J., & Pashler, H. (2001). Confidence and accuracy of near-threshold
discrimination responses. Consciousness and Cognition, 10, 294–340.
Kusanagi, K., Fukuta, J., Kawaguchi, Y., Tamura, Y., Goto, A., Kurita, A., & Murota, D. (2015).
Foreign Language Grammatical Carefulness Scale: Scale development and its initial
validation. Annual Review of English Language Education in Japan, 26, 77–92.
Kusanagi, K. (2018). Gaikokugo no bunpouchishiki ni okeru ichigensei no kenshou: Bunpousei
handan no seitouritsu, hannouzikan, shukantekihensuu o taishou ni (doctoral dissertation) [A
unitary view of grammatical knowledge in a foreign language.]. Nagoya University, Nagoya,
Japan.
191

Lee M. D., & Wagenmakers E. J. (2014). Bayesian cognitive modeling: A practical course.
Cambridge University Press.
Macmillan, N. A., & Creelman, C. D. (2005). Detection theory: A userʼs guide. Mahwah, NJ:
Lawrence Earlbaum Associates.
Mandell, P. B. (1999). On the reliability of grammaticality judgment tests in second language
acquisition research. Second Language Research, 15, 73–99.
Maniscalco, B., & Lau, H. (2012). A signal detection theoretic approach for estimating
metacognitive sensitivity from confidence ratings. Consciousness and Cognition, 21,
422–430.
Martin, A. D., Quinn, K. M., & Park, J. (2011). MCMCpack: Markov chain monte carlo in R.
Journal of Statistical Software. 42 (9), 1–21.
Meredith, M., & Kruschke, J. (2016). HDInterval: Highest (Posterior) Density Intervals. R
package version 0.1.3. https://CRAN.R-project.org/package=HDInterval
Pleskac, T. J., & Busemeyer, J. R. (2010). Two-stage dynamic signal detection: A theory of
choice, decision time, and confidence. Psychological Review, 117, 864–901.
Ratcliff, R., & Starns, J. J. (2013). Modeling confidence judgments, response times, and multiple
choices in decision making: Recognition memory and motion discrimination. Psychological
Review, 120, 697–719.
Rebuschat, P. (2013). Measuring implicit and explicit knowledge in second language research.
Language Learning, 63, 595–626.
Revelle, W. (2016). psych: Procedures for personality and psychological research. R package
version 1.6. http://CRAN.R-project.org/package=psych
Schloerke, R., Crowley, J., Cook, D., Briatte, F., Marbach, M., Thoen, E., Elberg, A., &
Larmarange, J. (2017). GGally: Extension to 'ggplot2'. R package version 1.3.2.
https://CRAN.R-project.org/package=GGally
Scott, R. B., & Dienes, Z. (2008). The conscious, the unconscious, and familiarity. Journal of
Experimental Psychology: Learning, Memory, and Cognition, 34, 1264–1288.
Stanislaw, H., & Todorov, N. (1999). Calculation of signal detection theory measures. Behavior
Research Methods, Instruments, and Computers, 31, 137–149.
Tamura, Y., Harada, Y., Kato, D., Hara, K., & Kusanagi, K. (2016). Unconscious but slowly
activated grammatical knowledge of Japanese EFL learners: A case of tough movement.
Annual Review of English Language Education in Japan, 27, 169–184.
Tunney, R. J., & Shanks, D. R. (2003). Subjective measures of awareness and implicit cognition.
Memory and Cognition, 31, 1060–1071.
Yonelinas, A. P. (2002). The nature of recollection and familiarity: A review of 30 years of
research. Journal of Memory and Language, 46, 441–517.
192