India's Urban System: Sustainability and Imbalanced Growth ...
20
sustainability Article India’s Urban System: Sustainability and Imbalanced Growth of Cities Abdul Shaban 1, * , Karima Kourtit 2,3,4,5,6,7 and Peter Nijkamp 2,3,4,7 1 School of Development of Studies, Tata Institute of Social Sciences, Deonar, Mumbai-400088, India 2 Center for European Studies, Alexandru Ioan Cuza University, 700505 Iasi, Romania; [email protected] (K.K.); [email protected] (P.N.) 3 Business Management Department, Open University (OU), 6411 CR Heerlen, The Netherlands 4 School of Architecture, Planning & Design, Polytecnic University, Ben Guerir 43150, Morocco 5 Department of Social and Economic Geography, Uppsala University, 75120 Uppsala, Sweden 6 Centre for the Future of Places (CFP), KTH Royal Institute of Technology, SE-10044 Stockholm, Sweden 7 Geography and Spacial Management, Adam Mickiewicz University, 61680 Poznan, Poland * Correspondence: [email protected]; Tel.: +91-9819145571 Received: 9 March 2020; Accepted: 1 April 2020; Published: 7 April 2020 Abstract: This paper maps out the structure and relative dynamics of cities of various size classes in India. It aims to address their hierarchical distribution, by employing the rank-size rule, Gibrat’s law, and a primacy index. The implications of urban concentrations for GDP, banking system, FDI, civic amenities, and various urban externalities (such as pollution and spatial exclusion) are also examined. It shows that India’s urban system, though it follows the rank-size rule, is huge and top-heavy. It follows also Gibrat’s law of proportionate growth. Although India’s cities collectively account for less than one third of the total population, they command more than three fourths of the country’s GDP. Megacities have become congested, clogged, polluted, and also show significant social polarization. There is a gridlock situation for the cities, inhibiting their potential for becoming effective economic and social change sites. The top-heavy character of India’s urban system also adversely impacts the balanced regional development of the country. Keywords: urbanization; imbalanced growth; hierarchical distribution; rank-size rule; Gibrat’s law; primacy index 1. Introduction According to population studies by the United Nations, the human geography in our world has entered a new epoch, namely, the ‘urban century’. The city—or in a more general sense, the urban agglomeration—has become increasingly the geographic orientation point or magnet of human activity. The city has become the natural economic habitat of people, the ‘home of man’ [1]. Today, more than 50% of the world population lives in urban areas. The turning point took place around 2008, when for the first time in human history, more than 50% of the world’s population (about 3.3 billion) started living in urban areas [2]. Whereas in the Global North, this transformation had already taken place in the twentieth century, the Global South is entering the urban revolution in the 21st century. It is estimated that by 2030, about 5 billion people will be city dwellers, out of which more than 80% will be from developing countries. In the meantime, during the period of 2000 to 2030, the urban population of Asia and Africa will double from 1.7 billion to 3.4 billion [2]. Given the expected positive association between urbanization and economic growth, it is plausible that this transformation to an urban age offers the Global South a unique opportunity for economic development and to improve quality of life for a large share of its deprived population. However, the success of this development will largely depend on how the Global South is able to design, govern, and manage its cities for these strategic ends. Sustainability 2020, 12, 2941; doi:10.3390/su12072941 www.mdpi.com/journal/sustainability
-
Upload
khangminh22 -
Category
Documents
-
view
0 -
download
0
Transcript of India's Urban System: Sustainability and Imbalanced Growth ...

sustainability
Article
India’s Urban System: Sustainability and ImbalancedGrowth of Cities
Abdul Shaban 1,* , Karima Kourtit 2,3,4,5,6,7 and Peter Nijkamp 2,3,4,7
1 School of Development of Studies, Tata Institute of Social Sciences, Deonar, Mumbai-400088, India2 Center for European Studies, Alexandru Ioan Cuza University, 700505 Iasi, Romania;
[email protected] (K.K.); [email protected] (P.N.)3 Business Management Department, Open University (OU), 6411 CR Heerlen, The Netherlands4 School of Architecture, Planning & Design, Polytecnic University, Ben Guerir 43150, Morocco5 Department of Social and Economic Geography, Uppsala University, 75120 Uppsala, Sweden6 Centre for the Future of Places (CFP), KTH Royal Institute of Technology, SE-10044 Stockholm, Sweden7 Geography and Spacial Management, Adam Mickiewicz University, 61680 Poznan, Poland* Correspondence: [email protected]; Tel.: +91-9819145571
Received: 9 March 2020; Accepted: 1 April 2020; Published: 7 April 2020�����������������
Abstract: This paper maps out the structure and relative dynamics of cities of various size classes inIndia. It aims to address their hierarchical distribution, by employing the rank-size rule, Gibrat’slaw, and a primacy index. The implications of urban concentrations for GDP, banking system, FDI,civic amenities, and various urban externalities (such as pollution and spatial exclusion) are alsoexamined. It shows that India’s urban system, though it follows the rank-size rule, is huge andtop-heavy. It follows also Gibrat’s law of proportionate growth. Although India’s cities collectivelyaccount for less than one third of the total population, they command more than three fourths ofthe country’s GDP. Megacities have become congested, clogged, polluted, and also show significantsocial polarization. There is a gridlock situation for the cities, inhibiting their potential for becomingeffective economic and social change sites. The top-heavy character of India’s urban system alsoadversely impacts the balanced regional development of the country.
Keywords: urbanization; imbalanced growth; hierarchical distribution; rank-size rule; Gibrat’s law;primacy index
1. Introduction
According to population studies by the United Nations, the human geography in our world hasentered a new epoch, namely, the ‘urban century’. The city—or in a more general sense, the urbanagglomeration—has become increasingly the geographic orientation point or magnet of human activity.The city has become the natural economic habitat of people, the ‘home of man’ [1]. Today, more than50% of the world population lives in urban areas. The turning point took place around 2008, when forthe first time in human history, more than 50% of the world’s population (about 3.3 billion) startedliving in urban areas [2]. Whereas in the Global North, this transformation had already taken placein the twentieth century, the Global South is entering the urban revolution in the 21st century. It isestimated that by 2030, about 5 billion people will be city dwellers, out of which more than 80% will befrom developing countries. In the meantime, during the period of 2000 to 2030, the urban populationof Asia and Africa will double from 1.7 billion to 3.4 billion [2]. Given the expected positive associationbetween urbanization and economic growth, it is plausible that this transformation to an urban ageoffers the Global South a unique opportunity for economic development and to improve quality of lifefor a large share of its deprived population. However, the success of this development will largelydepend on how the Global South is able to design, govern, and manage its cities for these strategic ends.
Sustainability 2020, 12, 2941; doi:10.3390/su12072941 www.mdpi.com/journal/sustainability

Sustainability 2020, 12, 2941 2 of 20
India is one of the major emerging economies of the Global South, after China. The country hasa long history of unbalanced urbanization [3]. Like many other countries of the Global South, it isundergoing an urban revolution. Its cities are experiencing a massive growth of population. However, asignificant share of its population still lives in poverty and substandard conditions. The ongoing urbanrevolution offers the country a great opportunity for economic, social, and ecological transformation soas to emerge as a developed country [4]. However, it has been argued by many researchers that Indianurbanization may be unsustainable, as it is largely unmanaged [4–7].
The challenges of unsustainability surround the Indian cities at multiple levels. First, the urbansystem is dominated by a few large cities, clustered in the western flank of India, with huge implicationsfor balanced regional development. Second, large cities control a significant share of the Indian economy,the propulsive industries, and new economic opportunities. Third, a majority of cities in India facehard challenges related to housing, transport, electricity, water supply, pollution, and congestion.Fourth, internally, most cities are also marked by significant social exclusion, crime, and violence. Fifth,the government policies to tackle the urban challenges and to avail the emerging opportunities havebeen lackadaisical and, in many ways, irrelevant to solve pressing problems.
In this context, the present paper attempts: (a) To examine India’s urban system in terms ofthe hierarchical distribution of cities; (b) to analyze the concentration of economic resources in citiesand how this distribution is shaped by megacities; (c) to understand the housing, water, transport,and related ecological challenges in Indian cities; and (d) to examine the social exclusion, specifically,religious exclusion.
The rest of the paper is organized as follows. Section 2 presents a review of the relevant literature,while Section 3 examines the urban system of India by examining the size-class distribution of cities,using the Rank-Size Rule method, Gibrat’s law of proportionate growth and the primacy index. Next,Section 4 focusses on the metropolitanization of the Indian economy through a concentration ofeconomy, bank credits, bank deposits, credit-deposit ratios, and foreign direct investments, whileSection 5 examines the issues related to governance, housing, water, transport, and related ecologicalchallenges. Section 6 addresses the social exclusion in Indian cities, while Section 7 concludes the paper.
2. Setting the Context
Cities are not islands, but part of a broader interactive spatial fabric. They have an internalstructure and dynamics (e.g., morphology, density, share of public vs. private space), but are alsosubjected to external driving forces (e.g., economic competition, nodal position in a spatial network).The conceptualization and analysis of cities has followed two streams of approaches, namely, locationand agglomeration theory [8–10] and urban systems theory [11–13]. Various hypotheses have beenlaunched in the course of history to understand and explain the complex patterns and dynamics ofcities and their hinterland, such as central place theory, spatial dominance theory, core-periphery theory,differential urbanization, and so forth [14]. But most publications were retrospective in nature, and didnot foresee the unprecedented dynamics in urbanization which led to the current ‘urban century’.
To understand the ‘age of the city’—or the ‘New Urban World’ [15]—the attention has to be focusedon key elements in the force field of modern cities. These are:
• The city as a collective magnet for a great diversity of economic activities (‘urban buzz’ [16]),caused by the efficiency-enhancing constellation of a city (appropriate infrastructure, marketinformation and access, etc.)
• The city as an externality-driven economic organism that is attracting business and people, asa result of scale and agglomeration advantages (supply of educational facilities, presence ofsuppliers, etc. [17]).
• The city as a concentration of social capital or as a ‘melting pot’ [18] of culturally or sociallydiversified groups.
• The city as a powerful political and economic node in a network of cities, a position referred to as‘urban empire’ in [19].

Sustainability 2020, 12, 2941 3 of 20
• The city as an ever-expanding power-block, which reinforces its position to the detriment of townsand villages in its hinterland [20].
The above sketch of the contemporaneous position of cities in our world has to be placed in theperspective of the dynamics of modern settlement systems. Two constituents in the complex force fieldof cities have to be mentioned here, namely, natural growth and migration. Both factors play a criticalrole in the rise in urbanization, in particular in the developing world.
Current statistics show an unprecedented rise in urban growth in countries in the emerging anddeveloping world. Especially Latin-American, African, and Asian countries witness a historicallyunique increase in urbanization, with two particular features: (i) Medium-sized and large cities turninto ever expanding large cities (including mega-cities with more than 10 million inhabitants); (ii) thenumber of medium-sized and large cities is increasing even faster. This so-called double urbanizationis one of the striking characteristics of the New Urban World [15]. Consequently, the relative share ofvillages and small cities is decreasing; they tend to become a ‘minority’. This decline in importance ofrural or peripheral settlements tends to erode their public amenities (cultural provisions, education,health care systems, etc.), which often prompts a vicious circle of downward change: Less amenities insmaller centers means that more people are attracted by higher-scale amenities in big cities.
The above-mentioned trend takes place in many countries—and certainly in countries in theGlobal South—and explains to a large extent the current urban revolution in settlement patterns allover the world. This trend is particularly visible in India. The large mega-cities in this country areshowing a disproportionally fast growth pace over the past decades, but also the number and size oflarge and medium-sized cities are rapidly growing, while the rural part of India—which still representsthe majority of settlements in this country—is gradually lagging behind, at least relatively. In the nextsection, we provide an analysis of urban settlement patterns in India.
3. India’s Urban System
With about 1.21 billion in population in 2011, India was one of the second largest countries afterChina in terms of size of population [21]. Although the present share of the urban population in Indiais relatively small, namely about 31.2%, but it is quite large in absolute number, namely, about 377million [22]. Furthermore, the decadal growth of urban population in India, though with a lowerbase, has been higher than the growth rate of the rural population from 1931 onwards (Table 1).The differences in the growth rates of the urban and rural population have been quite significantin some of the past decades. For instance, in 1951, mainly due to immigration of population fromPakistan (also due to religious riots), many people moved to urban areas where safety was higher; andin later years, the urbanization has reached its own momentum of growth due to (i) migration fromrural to urban areas, (ii) the identification of new settlements as urban (There have been some changesin the definition of ‘urban’ over the years, and these changes have impacted the number of settlementsdeclared as urban. However, it is not possible to reconstruct the past data with the revised definitions,therefore, the number of towns and urban population as published by Census of Indian 2011 for theyears 1901 to 2011 have been used in this study. In India, prior to 1951, the definition of urban wasarbitrary. An urban center was identified on the bases of (i) urban local body or municipality, (ii) civillines, which were outside the boundary of municipality/local body, and (iii) all the cantonments and allother contiguous clusters of houses inhabited by 5000 or more number of persons. In this identification,the Census superintendent was empowered to take a decision to declare a settlement as urban, keepingin mind the density of dwellings, historic nature of the settlement, importance of the settlement in trade,and to avoid declaring an overgrown village (without urban characteristic) as a town [23]. The Censusof 1951 used the following criteria to define a settlement as urban: (i) Population not less than 5000, and(ii) settlements with less than 5000 population, but having urban characteristics like supply of drinkingwater, electricity, schools, post offices, hospitals, etc. Census superintendents were empowered to takedecisions for declaring and identifying settlements as urban based on these characteristics. In 1961,more strict criteria to identify ‘urban’ was adopted, and these were: (a) Statutory towns—all places

Sustainability 2020, 12, 2941 4 of 20
with statutory bodies like city corporation, municipality, cantonment boards, or a notified town areacommittee, (b) census towns—all the places which satisfied the following criteria: (i) Population of5000 and above; (ii) density of population not less than 400 persons per square kilometer; and (iii) atleast 75% of male population engaged in non-agricultural work [24]. A small change in this definitionof census towns was brought in 1971, in which the b(iii) criterion was changed to ‘at least 75% of themale main working (a worker is main worker if he/she has worked for not less than 183 days in theyear preceding the census) population engaged in a non-agricultural sector. Since 1971, there has notbeen any change in the definition and criteria of identification of ‘urban’ by the Census of India [22].The changes of definition in 1951 and 1961 led to a decline in the number of towns from 3060 in 1951to 2700 in 1961 (see [25] for details). India added 2774 new Census Towns in 2011, more than in anyprevious censuses without any revision in definition adopted in 1971. Some researchers have calledthis ‘Census activism’ [26].), and (iii) the natural increase in urban population.
Table 1. Size and growth of urban population in India, 1901–2011.
Year Population (inMillion)
AbsoluteChange (in
Million)
% of UrbanPopulation
% Change inUrban
Population
% Change inRural
Population
1901 25.9 – 10.8 – –1911 25.9 0.1 10.3 0.4 6.41921 28.1 2.1 11.2 8.4 -1.31931 33.5 5.4 12.0 19.1 10.01941 44.2 10.7 13.9 32.0 11.81951 62.4 18.3 17.3 41.4 8.81961 78.9 16.5 18.0 26.4 20.61971 109.1 30.2 18.2 38.2 21.91981 157.7 48.6 23.3 44.5 19.31991 215.8 58.1 25.7 36.8 19.72001 286.1 70.3 27.8 32.6 18.32011 377.1 91.0 31.2 31.8 12.3
Source: Based on data from [22]. Note: Some of the computed values may not appear as exact or very small.Changes shown as zero because of rounding off.
3.1. Size-Class Distribution
India’s urban system is top-heavy. That is, a few mega-urban centers accommodate a significantlyhigher proportion of the total urban population than those by medium and small cities. This top-heavysystem has emerged because of the nature of historical experience the Indian economy went through.In the colonial period (roughly mid-19th century to mid-20th century), the port and capital citiesacquired major importance. The port cities became major conduit of exports and imports, and inthis way Kolkata, Mumbai, and Chennai emerged. Later on, industries—particularly, textile and,after independence, petrochemical industries—also started locating themselves in these urban centers,attracting workers from neighboring regions. Till today, these cities remain major urban centers intheir respective regions and also centers of economic opportunities. Delhi—due to political factors,as capital city—started growing, while later educational institutions and industries started locatingin and around Delhi. Today, Delhi has emerged as one of the biggest conurbation regions of India,including many negative externalities.
With the economic opportunities diffusing and given the large geographical surface of the country,other secondary urban centers in India also started emerging, giving rise to a second layer: Bangalore,Pune, Nashik, Hyderabad, Mangalore, etc. The top-heaviness of the urban system has not onlypersisted over the years, but it has also sharpened. This can well be seen from the fact that, thoughthere are a large number of towns in India (see Table 2), the major share of the urban population hasbeen in Class I cities (population of 100,000 and above), whose total share in the total number of townsis significantly small; for instance, it was only 7.6% in 2011, but these towns had 70.2% of the total

Sustainability 2020, 12, 2941 5 of 20
urban population (Table 3). The share of other classes of the towns in the total urban population hasover the years declined, but their share in the total number of towns, except class VI, has increased.In fact, as we shall see in the following sections, the economic importance of large cities (million pluscities) have consistently increased. The number of million plus cities in India rose from 5 (with a shareof the total urban population of 18.81%) in 1951 to 23 (32.54% of the urban population) in 1991, and to53 (42.62% of the urban population) in 2011 (see Table 4).
This consistent strengthening of ever-increasing large cities in the urban system in India is wellillustrated by the Lorenz curve in Figure 1. The Indian urban system—in terms of distribution ofpopulation in different size-class of cities—has clearly become more unequal. The small and mediumcities’ share in total urban population has consistently declined over the years, and that is why theLorenz curves for the selected years plotted in Figure 1, have progressively shifted away from thediagonal (or the line of equality). As a consequence, and parallel to his observation, the Gini coefficienthas increased consistently (Figure 2). The higher increases in the coefficient occurred in 1941, 1951,1961, and 2011, when the share of population of Class I cities increased substantially. The share of ClassI cities in the total urban population was 31.2% in 1931, it increased to 38.2% in 1941, 51.4% in 1961, and57.2% in 1971. As mentioned above, the share of Class I cities further consolidated between 2001–2011.It has increased to 70.2%, in 2011, of the total urban population in the country from 68.6% in 2001.
Table 2. Number of towns by size-class in India, 1901–2011.
Year No. of Towns Total Number of Towns
I II III IV V IV Total
1901 24 43 130 391 744 479 18111911 23 40 135 364 707 485 17541921 29 45 145 370 734 571 18941931 35 56 183 434 800 509 20171941 49 74 242 498 920 407 21901951 76 91 327 608 1124 569 27951961 102 129 437 719 711 172 22701971 148 173 558 827 623 147 24761981 218 270 743 1059 758 253 33011991 300 345 947 1167 740 197 36962001 393 401 1151 1344 888 191 43682011 468 474 1373 1683 1749 424 6171
Source: Based on data from [22]. Note: Data refer to the number of towns (urban agglomerations (UA) + towns notincluded in agglomerations). In 2011, there were a total of 298 UA and 170 towns in Class-I (population 100,000 andabove); in class II (population 50,000–99,999), 100 UA and 374 towns; in Class III (population 20,000–49,999), 75 UAand 1298 towns; in Class IV (population 10,000–19,999), 1 UA and 1682 Towns; in Class V (population 5000–9999) 0UA and 1749 towns; in Class VI (population < 5000), 0 UA and 424 towns.
Table 3. Percentage of urban population by size-class in India, 1901–2011.
Year Percentage of Urban Population by Size-Class
I II III IV V IV
1901 26.0 11.2 15.6 20.8 20.1 6.11911 27.4 10.5 16.4 19.7 19.3 6.51921 29.7 10.3 15.9 18.2 18.6 7.01931 31.2 11.6 16.8 18.0 17.1 5.21941 38.2 11.4 16.3 15.7 15.0 3.11951 44.6 9.9 15.7 13.6 12.9 3.11961 51.4 11.2 16.9 12.7 6.8 0.71971 57.2 10.9 16.0 10.9 4.4 0.41981 60.3 11.6 14.3 9.5 3.5 0.51991 65.2 10.9 13.1 7.7 2.6 0.3

Sustainability 2020, 12, 2941 6 of 20
Table 3. Cont.
Year Percentage of Urban Population by Size-Class
I II III IV V IV
2001 68.6 9.7 12.2 6.8 2.3 0.22011 70.2 8.5 11.1 6.4 3.4 0.4
Source: Based on data from [22].
Table 4. Growth of million plus cities and their population, 1901–2011.
Census Years Number ofCities
Population(Million)
City Population as % of
Total Population Total Urban Population
1901 1 1.51 0.63 5.841911 2 2.76 1.10 10.651921 2 3.13 1.25 11.141931 2 3.41 1.22 10.181941 2 5.31 1.67 12.021951 5 11.75 3.25 18.811961 7 18.10 4.12 22.931971 9 27.83 5.08 25.511981 12 42.12 6.16 26.411991 23 70.16 8.37 32.542001 35 107.88 10.50 37.812011 53 160.71 13.28 42.62
Source: Based on data from [22].
Sustainability 2020, 9, x FOR PEER REVIEW 6 of 20
Census Years Number of Cities Population
(Million)
City Population as % of
Total Population Total Urban Population
1901 1 1.51 0.63 5.84
1911 2 2.76 1.10 10.65
1921 2 3.13 1.25 11.14
1931 2 3.41 1.22 10.18
1941 2 5.31 1.67 12.02
1951 5 11.75 3.25 18.81
1961 7 18.10 4.12 22.93
1971 9 27.83 5.08 25.51
1981 12 42.12 6.16 26.41
1991 23 70.16 8.37 32.54
2001 35 107.88 10.50 37.81
2011 53 160.71 13.28 42.62
Source: Based on data from [22].
This consistent strengthening of ever-increasing large cities in the urban system in India is well
illustrated by the Lorenz curve in Figure 1. The Indian urban system—in terms of distribution of
population in different size-class of cities—has clearly become more unequal. The small and medium
cities’ share in total urban population has consistently declined over the years, and that is why the
Lorenz curves for the selected years plotted in Figure 1, have progressively shifted away from the
diagonal (or the line of equality). As a consequence, and parallel to his observation, the Gini
coefficient has increased consistently (Figure 2). The higher increases in the coefficient occurred in
1941, 1951, 1961, and 2011, when the share of population of Class I cities increased substantially. The
share of Class I cities in the total urban population was 31.2% in 1931, it increased to 38.2% in 1941,
51.4% in 1961, and 57.2% in 1971. As mentioned above, the share of Class I cities further consolidated
between 2001–2011. It has increased to 70.2%, in 2011, of the total urban population in the country
from 68.6% in 2001.
Figure 1. Lorenz curve for towns and urban population in India (1901–2011). Source: Computed using
data from [22].
3.2. Rank-Size Rule
Figure 1. Lorenz curve for towns and urban population in India (1901–2011). Source: Computed usingdata from [22].

Sustainability 2020, 12, 2941 7 of 20
Sustainability 2020, 9, x FOR PEER REVIEW 7 of 20
The hierarchical distribution of cities and their rank orders within a country have been one of
the important areas of research in urban systems studies. Empirical analyses have supported this idea
that generally the hierarchy of cities in a country conforms to what [27] is called the rank-size rule
distribution of cities. In an urban system conforming to a rank-size rule distribution, the population
of nth order city (Pn), in descending order of population, is:
𝑃𝑛 =𝑃1
𝑛 (1)
or
𝑃𝑛 = 𝑃1/𝑟𝑛𝑞,
where P1 is the population of the highest-order city, that is, the rank 1 city with the highest volume
of population; 𝑟𝑛𝑞 is ordinal rank number of the observed city. If we take the log of the rank and the
population of the towns and plot the results on an x-y axis, we observe a straight-line distribution.
When we take the log of both sides of Equation (1), we can write Equation (1) as:
𝑙𝑛 𝑃𝑛 = 𝑙𝑛 𝑃1 − 𝑞 𝑙𝑛 𝑟𝑛 (2)
This, as mentioned above, gives rise to a linear functional correlation between the population of
the cities and the rank of these cities. This functional relationship can also be presented in a regression
equation with Y as a rank of the towns, constant (α), and population as X,
𝑙𝑛 𝑌 = 𝑙𝑛 𝛼 − 𝑞 𝑙𝑛 𝑋 (3)
This implies that if the urban system of a country follows a rank-size rule distribution, the
estimated coefficient of the downward sloping line will be −1; higher values (−1 to 0) will indicate
that bigger cities are disproportionately larger and have a large share of the total urban population,
while values less than −1 indicate that the population is dispersed in a large number of cities [28]. The
empirical results of the rank-size distribution of Indian cities over the period 1901–2011 can be found
in Figures 3 and 4.
Figure 2. Gini Coefficient for population distribution between size classes of cities (Class I to Class
VI) (1901–2011). Source: Computed using data from [22].
In general, the rank-size rule distribution of cities is mostly found in developed countries where
there is a relatively balanced regional development. It is plausible to expect that spatially unbalanced
developed economies will lead to a migration of population to bigger cities, giving rise to a lower
0.560.57
0.58 0.59
0.62
0.660.66 0.67
0.69 0.700.71
0.74
0.50
0.55
0.60
0.65
0.70
0.75
0.80
Gin
i co
effi
cie
nt
Census years
Figure 2. Gini Coefficient for population distribution between size classes of cities (Class I to Class VI)(1901–2011). Source: Computed using data from [22].
3.2. Rank-Size Rule
The hierarchical distribution of cities and their rank orders within a country have been one of theimportant areas of research in urban systems studies. Empirical analyses have supported this ideathat generally the hierarchy of cities in a country conforms to what [27] is called the rank-size ruledistribution of cities. In an urban system conforming to a rank-size rule distribution, the population ofnth order city (Pn), in descending order of population, is:
Pn =P1
n(1)
orPn = P1/rq
n,
where P1 is the population of the highest-order city, that is, the rank 1 city with the highest volumeof population; rq
n is ordinal rank number of the observed city. If we take the log of the rank and thepopulation of the towns and plot the results on an x-y axis, we observe a straight-line distribution.When we take the log of both sides of Equation (1), we can write Equation (1) as:
ln Pn = ln P1 − q ln rn (2)
This, as mentioned above, gives rise to a linear functional correlation between the population ofthe cities and the rank of these cities. This functional relationship can also be presented in a regressionequation with Y as a rank of the towns, constant (α), and population as X,
ln Y = ln α− q ln X (3)
This implies that if the urban system of a country follows a rank-size rule distribution, theestimated coefficient of the downward sloping line will be −1; higher values (−1 to 0) will indicatethat bigger cities are disproportionately larger and have a large share of the total urban population,while values less than −1 indicate that the population is dispersed in a large number of cities [28].The empirical results of the rank-size distribution of Indian cities over the period 1901–2011 can befound in Figures 3 and 4.

Sustainability 2020, 12, 2941 8 of 20Sustainability 2020, 9, x FOR PEER REVIEW 9 of 20
Figure 3. Logarithmic distribution of city population and rank in India, 1901–1941. Source:
Computed using data from [22].
Figure 4. Logarithmic distribution of city population and rank in India, 1951–2011. Source:
Computed using data from [22].
Figure 3. Logarithmic distribution of city population and rank in India, 1901–1941. Source: Computedusing data from [22].
Sustainability 2020, 9, x FOR PEER REVIEW 9 of 20
Figure 3. Logarithmic distribution of city population and rank in India, 1901–1941. Source:
Computed using data from [22].
Figure 4. Logarithmic distribution of city population and rank in India, 1951–2011. Source:
Computed using data from [22].
Figure 4. Logarithmic distribution of city population and rank in India, 1951–2011. Source: Computedusing data from [22].
In general, the rank-size rule distribution of cities is mostly found in developed countries wherethere is a relatively balanced regional development. It is plausible to expect that spatially unbalanceddeveloped economies will lead to a migration of population to bigger cities, giving rise to a lower shareof the population in lower-order cities in comparison to what is generally expected from the rank-sizerule distribution. The concentration of a larger share of the population in top rank cities is also calledprimacy of these cities. If the rank 1 city has more than double of the population of the 2nd order city

Sustainability 2020, 12, 2941 9 of 20
(as expected under a rank-size rule distribution), it is called the primate city. Commonly, the primacyof the city of rank 1—denoted as C1—is measured as the ratio between P1 and P2, as presented below:
C1 = P1/P2 (4)
According to the rank-size rule:P1 = P2 + P3 + P4 (5)
Thus, the population of a rank 1 city is equal to the sum of the population of rank 2, rank 3, andrank 4 cities. Therefore, we can also use the ratio between population of rank 1 city and the sum ofthe population of ranks 2–4 to find out whether they are equal to 1 (no primacy) or have a primacy,denoted as C2, in relation to the 3 lower-order cities. This ratio also helps us to find out the distributionof the population in the 4 top cities and their imbalances, if any, within.
The rank-size rule distribution of the Indian cities from 1901 to 2011 are presented in Figures 3and 4. It is evident from these figures that over the years there have been definite orders of these citiesclose to the rank-size rule, but there is also a huge concentration of cities with a low population size atthe lower end, with the log of ranks 7–9 having a log of the population of 4.0–8.5. Figure 5—with theurban kernel density function—shows that the highest number of cities was located in the band of thelog of population 8.0 to 10.0, although in later years, with an increase in the population of cities, it hasshifted to the band of about log 8.0 to 12.0. Further, there seems to be largely a log-normal distributionof cities which is found in the rank-size rule conformity of the urban hierarchy.Sustainability 2020, 9, x FOR PEER REVIEW 10 of 20
Figure 5. Kernel density function of distribution of cities, 1901–2011. Source: Computed using data
from [22].
Table 5. Conformity of distribution of Indian cities to Rank-Size Rule, 1901–2011.
Year Intercept Beta Coefficient t-Value p-Value R-Squared
1901 16.343 −1.099 −143.880 0.000 0.931
1911 15.767 −1.041 −128.070 0.000 0.912
1921 16.048 −1.066 −165.640 0.000 0.942
1931 16.020 −1.045 −172.380 0.000 0.943
1941 15.992 −1.020 −187.180 0.000 0.948
1951 15.647 −0.959 −195.290 0.000 0.945
1961 15.747 −0.946 −182.870 0.000 0.941
1971 15.562 −0.901 −178.610 0.000 0.932
1981 15.565 −0.873 −215.380 0.000 0.941
1991 15.749 −0.866 −234.550 0.000 0.942
2001 15.892 −0.858 −280.830 0.000 0.951
2011 16.058 −0.854 −374.590 0.000 0.958
Source: Computed using data from [22].
Table 6. Top 5 largest city populations and primacy index, 1901–2011.
Rank Rank
1
Rank
2
Rank
3
Rank
4
Rank
5
Total
Populatio
n of Five
Top Rank
Cities
C1 C2
% of
Total
Urban
Populati
on
Mean
Popul
ation
of
Cities/
Town
s
Standard
Deviation
of
Populatio
n
Number
of
Cities/
Towns
1901 1.52 0.84 0.59 0.45 0.26 3.66 1.81 0.81 14.15 16,087 52,406 1537
1911 1.76 1.05 0.60 0.50 0.25 4.16 1.68 0.82 16.04 15,746 58,689 1579
1921 1.87 1.29 0.63 0.41 0.30 4.50 1.46 0.81 16.01 16,042 62,337 1678
1931 2.12 1.32 0.77 0.47 0.45 5.13 1.61 0.83 15.33 18,067 68,582 1777
1941 3.60 1.75 0.93 0.74 0.70 7.71 2.06 1.05 17.46 22,049 102,399 1924
1951 4.69 3.22 1.54 1.44 1.14 12.02 1.46 0.76 19.25 26,385 138,489 2237
1961 6.01 4.52 2.36 1.94 1.27 16.09 1.33 0.68 20.39 36,627 190,658 2104
1971 7.45 6.60 3.65 3.16 1.87 22.72 1.13 0.56 20.82 45,933 248,182 2333
1981 9.42 9.23 5.76 4.27 2.92 31.61 1.02 0.49 20.05 52,378 304,427 2960
1991 12.60 11.11 8.47 5.42 4.34 41.94 1.13 0.50 19.44 62,770 378,303 3381
2001 16.43 13.25 12.90 6.69 5.76 55.02 1.24 0.50 19.23 69,776 456,316 4075
2011 18.39 16.35 14.06 8.65 8.52 65.98 1.13 0.47 17.50 60,996 450,419 6134
Figure 5. Kernel density function of distribution of cities, 1901–2011. Source: Computed using datafrom [22].
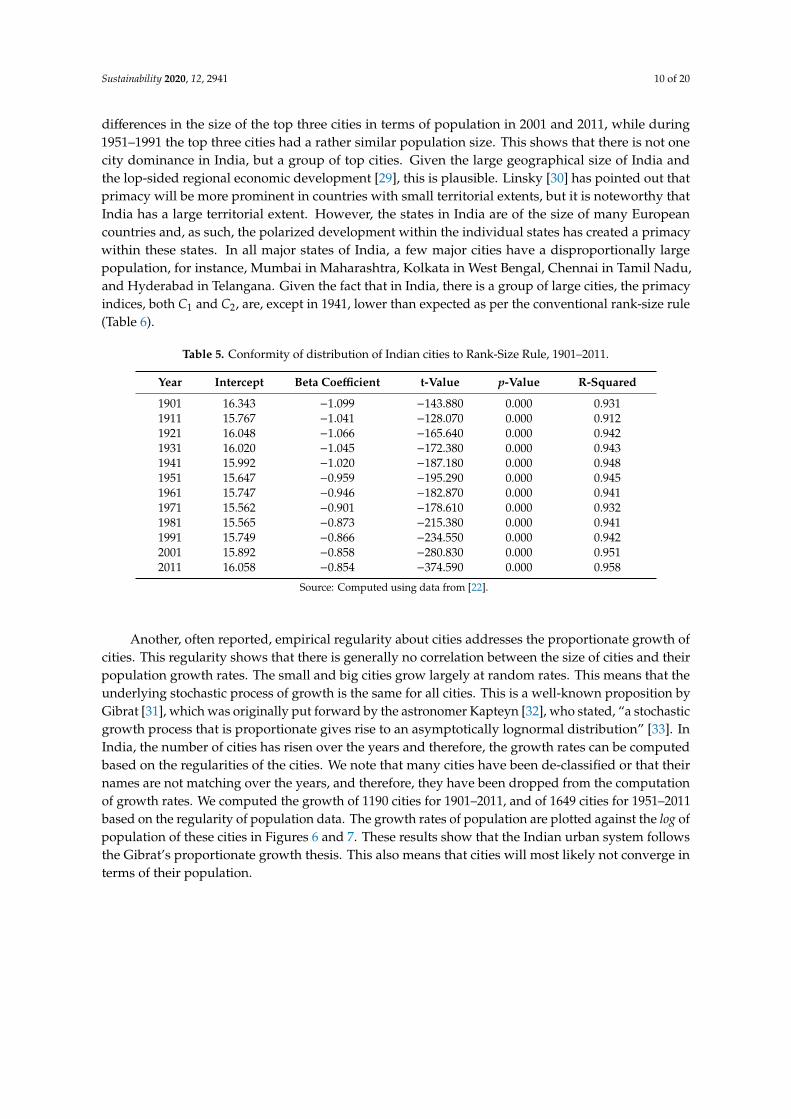
The regression results produced in Table 5 show that in India from 1901 till 2011, the urban systemhas followed the rank size rule, but the primacy has been strengthening (the regression coefficienthas increased over the years). The Zipf coefficient or β values have increased from −1.099 (nearly inconformity with the rank-size rule) in 1901, to −0.959 in 1951 to −0.854 in 2011, showing that city sizedistribution in India has progressively and steadily moved away from a rank-size rule distributiontowards a dominance of large cities. That means the slope of the lines have become flatter over theyears. It is not, therefore, any surprise to see that the size of the largest city population has also risenover the years. In 1901, the size of the largest city (UA) in the total urban population was 1.52 million,which increased to 4.69 million in 1951, and further increased to 18.39 million in 2011. The share of thetop five cities (UA) in the total urban population has also increased from 14.15% to 20.82% in 1971,and thereafter it has declined to reach 17.50% in 2011 (Table 6). Further, there have not been many
Sustainability 2020, 12, 2941 10 of 20
differences in the size of the top three cities in terms of population in 2001 and 2011, while during1951–1991 the top three cities had a rather similar population size. This shows that there is not onecity dominance in India, but a group of top cities. Given the large geographical size of India andthe lop-sided regional economic development [29], this is plausible. Linsky [30] has pointed out thatprimacy will be more prominent in countries with small territorial extents, but it is noteworthy thatIndia has a large territorial extent. However, the states in India are of the size of many Europeancountries and, as such, the polarized development within the individual states has created a primacywithin these states. In all major states of India, a few major cities have a disproportionally largepopulation, for instance, Mumbai in Maharashtra, Kolkata in West Bengal, Chennai in Tamil Nadu,and Hyderabad in Telangana. Given the fact that in India, there is a group of large cities, the primacyindices, both C1 and C2, are, except in 1941, lower than expected as per the conventional rank-size rule(Table 6).
Table 5. Conformity of distribution of Indian cities to Rank-Size Rule, 1901–2011.
Year Intercept Beta Coefficient t-Value p-Value R-Squared
1901 16.343 −1.099 −143.880 0.000 0.9311911 15.767 −1.041 −128.070 0.000 0.9121921 16.048 −1.066 −165.640 0.000 0.9421931 16.020 −1.045 −172.380 0.000 0.9431941 15.992 −1.020 −187.180 0.000 0.9481951 15.647 −0.959 −195.290 0.000 0.9451961 15.747 −0.946 −182.870 0.000 0.9411971 15.562 −0.901 −178.610 0.000 0.9321981 15.565 −0.873 −215.380 0.000 0.9411991 15.749 −0.866 −234.550 0.000 0.9422001 15.892 −0.858 −280.830 0.000 0.9512011 16.058 −0.854 −374.590 0.000 0.958
Source: Computed using data from [22].
Another, often reported, empirical regularity about cities addresses the proportionate growth ofcities. This regularity shows that there is generally no correlation between the size of cities and theirpopulation growth rates. The small and big cities grow largely at random rates. This means that theunderlying stochastic process of growth is the same for all cities. This is a well-known proposition byGibrat [31], which was originally put forward by the astronomer Kapteyn [32], who stated, “a stochasticgrowth process that is proportionate gives rise to an asymptotically lognormal distribution” [33]. InIndia, the number of cities has risen over the years and therefore, the growth rates can be computedbased on the regularities of the cities. We note that many cities have been de-classified or that theirnames are not matching over the years, and therefore, they have been dropped from the computationof growth rates. We computed the growth of 1190 cities for 1901–2011, and of 1649 cities for 1951–2011based on the regularity of population data. The growth rates of population are plotted against the log ofpopulation of these cities in Figures 6 and 7. These results show that the Indian urban system followsthe Gibrat’s proportionate growth thesis. This also means that cities will most likely not converge interms of their population.

Sustainability 2020, 12, 2941 11 of 20
Table 6. Top 5 largest city populations and primacy index, 1901–2011.
Rank Rank 1 Rank 2 Rank 3 Rank 4 Rank 5Total Population of
Five Top RankCities
C1 C2% of Total Urban
Population
MeanPopulation ofCities/Towns
StandardDeviation ofPopulation
Number ofCities/Towns
1901 1.52 0.84 0.59 0.45 0.26 3.66 1.81 0.81 14.15 16,087 52,406 15371911 1.76 1.05 0.60 0.50 0.25 4.16 1.68 0.82 16.04 15,746 58,689 15791921 1.87 1.29 0.63 0.41 0.30 4.50 1.46 0.81 16.01 16,042 62,337 16781931 2.12 1.32 0.77 0.47 0.45 5.13 1.61 0.83 15.33 18,067 68,582 17771941 3.60 1.75 0.93 0.74 0.70 7.71 2.06 1.05 17.46 22,049 102,399 19241951 4.69 3.22 1.54 1.44 1.14 12.02 1.46 0.76 19.25 26,385 138,489 22371961 6.01 4.52 2.36 1.94 1.27 16.09 1.33 0.68 20.39 36,627 190,658 21041971 7.45 6.60 3.65 3.16 1.87 22.72 1.13 0.56 20.82 45,933 248,182 23331981 9.42 9.23 5.76 4.27 2.92 31.61 1.02 0.49 20.05 52,378 304,427 29601991 12.60 11.11 8.47 5.42 4.34 41.94 1.13 0.50 19.44 62,770 378,303 33812001 16.43 13.25 12.90 6.69 5.76 55.02 1.24 0.50 19.23 69,776 456,316 40752011 18.39 16.35 14.06 8.65 8.52 65.98 1.13 0.47 17.50 60,996 450,419 6134
Source: Computed using data from [22]. Note: The ranks of cities have changed over the years—see Appendix A for details; the primacy index of city C1 is the ratio of population between1st and 2nd order cities, while C2 is the ratio of population of the 1st order city and the total population of 2nd, 3rd, and 4th order cities; the number of towns produced in this table areslightly different from those produced in Table 2, as data for individual towns for computation could be meaningfully identified from the records [22] to these numbers of towns.

Sustainability 2020, 12, 2941 12 of 20
Sustainability 2020, 9, x FOR PEER REVIEW 11 of 20
Source: Computed using data from [22]. Note: The ranks of cities have changed over the years—see
Appendix A for details; the primacy index of city C1 is the ratio of population between 1st and 2nd
order cities, while C2 is the ratio of population of the 1st order city and the total population of 2nd,
3rd, and 4th order cities; the number of towns produced in this table are slightly different from those
produced in Table 2, as data for individual towns for computation could be meaningfully identified
from the records [22] to these numbers of towns.
Another, often reported, empirical regularity about cities addresses the proportionate growth of
cities. This regularity shows that there is generally no correlation between the size of cities and their
population growth rates. The small and big cities grow largely at random rates. This means that the
underlying stochastic process of growth is the same for all cities. This is a well-known proposition by
Gibrat [31], which was originally put forward by the astronomer Kapteyn [32], who stated, “a
stochastic growth process that is proportionate gives rise to an asymptotically lognormal
distribution” [33]. In India, the number of cities has risen over the years and therefore, the growth
rates can be computed based on the regularities of the cities. We note that many cities have been de-
classified or that their names are not matching over the years, and therefore, they have been dropped
from the computation of growth rates. We computed the growth of 1190 cities for 1901–2011, and of
1649 cities for 1951–2011 based on the regularity of population data. The growth rates of population
are plotted against the log of population of these cities in Figures 6 and 7. These results show that the
Indian urban system follows the Gibrat’s proportionate growth thesis. This also means that cities will
most likely not converge in terms of their population.
Figure 6. Relationship between base year population of cities and growth rate of their population
(1901–2011). Source: Computed using data from [22].
y = 1.0898x + 11.508
R² = 0.0101
n=1190
0
10
20
30
40
50
60
70
80
6 8 10 12 14 16
Av
erag
e ex
po
nen
tial
gro
wth
rat
e (%
),
19
01
-20
11
Ln population 1901
Figure 6. Relationship between base year population of cities and growth rate of their population(1901–2011). Source: Computed using data from [22].Sustainability 2020, 9, x FOR PEER REVIEW 12 of 20
Figure 7. Relationship between base year population of the town and growth rate of population (1951–
2011). Source: Computed using data from [22].
4. Metropolitanization of the Indian Economy
India’s economy is extremely lop-sided in terms of the urban and rural distribution of Gross
Domestic Product (GDP). It is estimated that currently (2020), the share of India’s urban population
is about 35% of its total population, but the share of total GDP originating from urban areas is about
70 to 75%. The share of urban areas in India’s total GDP was 45% in 1990, and rose to 63% in 2014
[34]. It is argued that the rising urbanization will ignite urban consumption, services, and
infrastructure, and that the urban focus can put India’s economy on a higher growth path through:
(a) fueling urban consumption, especially of the premium-end of consumer goods and four-wheelers;
(b) powering urban services like consumer banking, healthcare, telecom data services, and internet;
and (c) driving the infrastructure sector, including civic urban infrastructure services and real estate
[34]. This kind of policy advocacy and understanding has led to an increased investment focus by the
Government of India on urban centers, especially on major urban centers through the Jwaharlal
Nehru Urban Renewal Mission launched in 2005 (which was replaced by the Atal Mission for
Rejuvenation and Urban Transformation in 2015). The focus of both these missions has been on urban
reforms and massive investment in infrastructures, especially in megacities. Another very important
program for the urban development, especially of megacities, by the Government of India—
accompanied by huge investments in these cities—is the Smart Cities Mission, which aims at making
the cities ‘smart’ through: (a) Promoting mixed land-use; (b) housing and inclusiveness; (c) creating
walkable localities; (d) preserving and developing open spaces; (e) promoting a variety of transport
options; (f) promoting e-governance; (g) giving an identity to the city; and (h) applying smart
solutions to infrastructure and services in area-based development [35]. This has made the urban
centers, especially the megacities, the sink of government and also private investments, while rural
areas, where about 65% of India’s population lives, have suffered, resulting in economic distress
among farmers, even leading to suicides, and rural to urban migration of population in search of
employment and better quality of life [36,37].
The Indian economy is largely metropolitanised [5]. A large share of the urban population lives
in million-plus and class I cities, and they contribute a significant share of India’s GDP, but they also
are a sink of savings and investments. Out of a total of 53 million-plus cities in India in 2011, the top
20 (based on population in 2011) is listed in Table 7. These top 20 million-plus cities account for 9.6%
y = 0.7096x + 20.974
R² = 0.0033
n=1649
0
10
20
30
40
50
60
70
80
90
100
6 8 10 12 14 16Aver
age
exp
on
enti
al g
row
th r
ate
(%),
19
51
-
20
11
Ln population 1951
Figure 7. Relationship between base year population of the town and growth rate of population(1951–2011). Source: Computed using data from [22].
4. Metropolitanization of the Indian Economy
India’s economy is extremely lop-sided in terms of the urban and rural distribution of GrossDomestic Product (GDP). It is estimated that currently (2020), the share of India’s urban population isabout 35% of its total population, but the share of total GDP originating from urban areas is about 70to 75%. The share of urban areas in India’s total GDP was 45% in 1990, and rose to 63% in 2014 [34].It is argued that the rising urbanization will ignite urban consumption, services, and infrastructure,and that the urban focus can put India’s economy on a higher growth path through: (a) fueling urbanconsumption, especially of the premium-end of consumer goods and four-wheelers; (b) poweringurban services like consumer banking, healthcare, telecom data services, and internet; and (c) drivingthe infrastructure sector, including civic urban infrastructure services and real estate [34]. This kindof policy advocacy and understanding has led to an increased investment focus by the Government

Sustainability 2020, 12, 2941 13 of 20
of India on urban centers, especially on major urban centers through the Jwaharlal Nehru UrbanRenewal Mission launched in 2005 (which was replaced by the Atal Mission for Rejuvenation andUrban Transformation in 2015). The focus of both these missions has been on urban reforms andmassive investment in infrastructures, especially in megacities. Another very important programfor the urban development, especially of megacities, by the Government of India—accompanied byhuge investments in these cities—is the Smart Cities Mission, which aims at making the cities ‘smart’through: (a) Promoting mixed land-use; (b) housing and inclusiveness; (c) creating walkable localities;(d) preserving and developing open spaces; (e) promoting a variety of transport options; (f) promotinge-governance; (g) giving an identity to the city; and (h) applying smart solutions to infrastructure andservices in area-based development [35]. This has made the urban centers, especially the megacities,the sink of government and also private investments, while rural areas, where about 65% of India’spopulation lives, have suffered, resulting in economic distress among farmers, even leading to suicides,and rural to urban migration of population in search of employment and better quality of life [36,37].
The Indian economy is largely metropolitanised [5]. A large share of the urban population lives inmillion-plus and class I cities, and they contribute a significant share of India’s GDP, but they also are asink of savings and investments. Out of a total of 53 million-plus cities in India in 2011, the top 20(based on population in 2011) is listed in Table 7. These top 20 million-plus cities account for 9.6% of thetotal population of the country, but controlled 46.3% of total bank deposits and 59.4% of bank credits inIndia [38]. In some million-plus cities like Mumbai, Chennai, Ahmedabad, Surat, and Coimbatore,the credit-deposit ratio of banks is more than 1, indicating that they also sucked the savings of otherregions (in the form of bank deposits). These imbalanced credit creations and deposit mobilizationsshow the clear spatial lop-sidedness in investments and also of savings. Mumbai and Delhi are twomajor sinks and poles of the Indian economy. These kinds of economic primacy of megacities raisequestions concerning sustainable and equitable regional development in India.
Table 7. Top million-plus cities (UA) and their shares in bank deposits, credits, and credit-deposit ratios.
Rank in2011
UA/City Population (Million) As on 30 September 2019
Population2011
Population2001
Deposits inINR (Billion)
Credit in INR(Billion)
Credit-DepositRatio
1 Mumbai 18.4 16.4 18,553 22,106 1.22 Delhi 16.3 12.9 11,820 11,959 1.03 Kolkata 14.0 13.2 3249 2450 0.84 Chennai 8.7 6.6 3735 4376 1.25 Bangalore 8.5 5.7 6288 4181 0.76 Hyderabad 7.7 5.7 3679 3644 1.07 Ahmedabad 6.4 4.5 1847 2152 1.28 Pune 5.1 3.8 2446 1824 0.79 Surat 4.6 2.8 524 623 1.2
10 Jaipur 3.0 2.3 1029 971 0.911 Kanpur 2.9 2.7 592 263 0.412 Lucknow 2.9 2.2 1417 420 0.313 Nagpur 2.5 2.1 674 349 0.514 Ghaziabad 2.4 1.0 495 213 0.415 Indore 2.2 1.5 555 485 0.916 Coimbatore 2.1 1.5 478 556 1.217 Kochi 2.1 1.4 1008 916 0.918 Patna 2.0 1.7 965 281 0.319 Kozhikode 2.0 0.9 290 221 0.820 Bhopal 1.9 1.5 746 566 0.8
Total 116 90.0 60,391 58,555 1.0% of all-India 9.6 8.8 46.3 59.4 –
Source: Based on data from [22,38].
The pull of foreign direct investments (FDIs) towards the regions with mega-cities also indicatesthe power of these cities as investment centers. Out of the total FDI of US $114.4 billion during theperiod 2014–2017, 31.1% and 22.3% were pulled in by Mumbai and Delhi, respectively (Table 8). Therest of the cities and regions, except Chennai, Bangalore, and Hyderabad, had only relatively smallshares in the total FDI.

Sustainability 2020, 12, 2941 14 of 20
Table 8. Regional inflow of foreign direct investments (FDI) in India from 1 April 2014 to 31 March 2017.
Rank Regional Offices of RBI States Covered Total FDI in US $ Million % of Total FDI
1 Mumbai Maharashtra, Dadra, and Nagar Haveli, Daman and Diu 35,526.2 31.12 New Delhi Delhi, Part of UP, and Haryana 25,501.9 22.33 Chennai Tamil Nadu, Pondicherry 10,563.5 9.24 Bangalore Karnataka 9697.3 8.55 Ahmedabad Gujarat 7141.5 6.26 Hyderabad Andhra Pradesh 5120.0 4.57 Kolkata West Bengal, Sikkim, Andaman, and Nicobar Islands 1243.5 1.18 Kochi Kerala, Lakshadweep 774.3 0.79 Jaipur Rajasthan 756.9 0.710 Bhopal Madhya Pradesh, Chattisgarh 256.3 0.211 Kanpur Uttar Pradesh, Uttranchal 198.1 0.212 Patna Bihar, Jharkhand 64.1 0.113 Chandigarh Chandigarh, Punjab, Haryana, Himachal Pradesh 71.8 0.114 Panaji Goa 135.5 0.1
15 Guwahati Assam, Arunachal Pradesh, Manipur, Meghalaya, Mizoram,Nagaland, Tripura 17.2 0.0
16 Jammu Jammu and Kashmir 6.0 0.017 Bhubaneshwar Orissa 27.2 0.0
Region Not Indicated – 17,308.5 15.1Grand Total Grand Total 114,409.8 100
Source: [39]. Note: Very small values are shown as zero because of rounding off.

Sustainability 2020, 12, 2941 15 of 20
5. Governance and Civic Amenities
The governance in most of the cities in India is rather poor. This has resulted in huge socialand physical infrastructural issues. In India, towns, 1971 onwards, are identified on the basis oftwo important criteria: (a) Statutory towns—include all the places with a municipality, corporation,cantonment board, or notified town area committee, etc.; (b) census towns—are places characterized bythe following features: (i) At least 5000 persons; (ii) having a density of population above 400 personsper square kilometer; and (iii) at least 75% of main male working population employed outside theagricultural sector [22]. This means that census towns have no urban governance body, and that theyare in a way unregulated and ungoverned. If there exists any governance body, it may be villagepanchayats (village administrative units). This compromises the effective governance of these townsand the development of their social and physical infrastructure. Data show that in 2001, 1362 (26.4% ofthe total towns in 2001) of the total towns were census towns, while in 2011, due to the inclusion of newsettlements as towns, this number has increased to 3894 (49.1% of the total towns in 2011) (Table 9).This shows that almost 50% of Indian towns do not have urban local bodies for their governanceand development. The finance and financial grants to the towns are recommended by the FinanceCommission of India from time to time. A town becomes eligible for finance if it has local body.As about half of the towns do not have local bodies, they are deprived of this benefit.
Table 9. Types of towns in India on the basis of local bodies and agglomerations. (2001 and 2011).
Type of Urban Units 2001 2011
Number of Towns % of the TotalTowns Number of Towns % of the Total
Towns
1. Towns: 5161 100 7935 100(a) Statutory Towns 3799 73.6 4041 50.9(b) Census Towns 1362 26.4 3894 49.12. UrbanAgglomerations 384 – 475 –
3. Out Growths (OGs) 953 – 981 –
Source: Based on data from [22]. Note: Out Growths (OGs): Areas around a core city or town, such well recognizedplaces, like a railway colony, university campus, port area, etc., located outside the boundaries of a town.
It is not surprising, therefore, that in 2011, 38% of the urban households in India did not havetap-water from treated sources. Furthermore, the share of households not having the source of drinkingwater within their premises was about 28%. About 12.6% of the households were without any access toa latrine and were defecating in the open air, while 6.0% were using community latrines. The SwtachBarata Mission or Clean India Mission has improved the situation, but only the next Census in 2021 maybe able to show the comprehensive success of this mission. Next, bathing facilities are not availablewithin the owned premises for 13.2% of the total of 78.9 million households in urban centers [40].
The situation of housing has been very grim. Out of 4041 statutory towns, slums were reportedin 63% of the towns in the 2011 Census. A total of 13.7 million households, accounting for 68million persons, were living in these slums, constituting 17.4% of the total urban households. As themillion-plus cities have a disproportionate concentration of economic activities, a large share of ruraland small-town migrants over the years have moved to these centers. As a consequence, the slumformations in these cities has been quite high. In 2011, 38.1% of the total households in 53 million-pluscities were living in slums, and the share was as high as 41.3% in the Greater Mumbai MunicipalCorporation area, 29.6% in the Kolkata Municipal Corporation area, 28.5% in the Chennai MunicipalCorporation, and 14.6% in the Delhi Municipal Corporation (Table 10). The homeless population inurban areas has risen over the years in the country. Where the homeless population in urban areas wasabout 0.2 million in 1961, it increased to 0.73 million in 1991, and further increased to 0.94 million in2011. The megacities like Kolkata, Mumbai, and Chennai has large share of these homeless people [41].

Sustainability 2020, 12, 2941 16 of 20
Table 10. Top 10 million-plus cities in terms of share of households in slums (2011).
Million Plus Cities Proportion of Slum HHs to Total Urban HHs (%)
1. Greater Visakhapatnam (Municipal Corporation) 44.12. Jabalpur Cantt (Cantonment Board) 43.33. Greater Mumbai (Municipal Corporation) 41.34. Vijayawada (Municipal Corporation) 40.65. Meerut (Municipal Corporation) 40.06. Raipur (Municipal Corporation) 39.07. Nagpur (Municipal Corporation) 34.38. Greater Hyderabad (Municipal Corporation) 31.99. Kota (Municipal Corporation) 31.810. Agra (Municipal Corporation) 29.8
Source: Based on data from [40].
The Indian cities—and specifically the million-plus cities—have become extremely congested.The neglect of public transport systems over the years and later, after the economic liberalizationin 1992–1993 due to rise of the middle class, the boom in demand of the automobile sector in citieshave choked these cities, besides adding to the toxicity of the air. The number of motorized vehiclesregistered in India was 0.3 million in 1951, which rose to 230.06 million in 2015, an approximately767 times increase [42,43]. As of 31 March 2016, Delhi (8.85 million), Bangalore (6.11 million), Chennai(4.94 million), and Greater Mumbai (2.82 million) were the top-4 cities in the country in terms ofregistered motor vehicles. Between 2006 and 2016, in these respective cities the number of registeredmotor vehicles rose 1.97 times (Delhi), 2.34 times (Bangalore), 2.11 times (Chennai), and 2.02 times(Greater Mumbai) [43]. In fact, these vehicles clog the roads of the cities, and people suffer from loss oftime in traffic jams, more payments to hired vehicles due to traffic jams, and burning of fuels, besidesemission of carbons and other toxic gases [44]. The air in these cities, and especially in Delhi, Bangalore,have turned toxic, and have been a cause of various respiratory diseases. In Delhi, health emergencieshave been declared many times [45,46]. Besides equitable distribution of welfare, these features raisequestions about the sustainability of the top-heavy urban centers of India.
6. Social Exclusion and Spatial Segregation
In a modernist paradigm, the cities have a social promise—the promise of social change leadingto liberty, equality, and freedom. It is then imagined that with the rise of capitalism (through cities),the negative city identities will disappear, and the status and identity of individuals will largelybe determined by his/her achievements. However, this has been a belief, though not a total failureeverywhere. In India, the cities’ internal morphology largely corresponds to the ethnic identities, withsome exceptions of social inclusion in a limited number of cities. All the major cities are known fortheir ethnic spaces, and the space identities are determined by the ethnic communities living therein.Riots between communities, and especially between Muslims and Hindus, and occasionally betweenlower castes and upper caste Hindus, have become common phenomena in cities, and especially inmegacities like Mumbai, Ahemdabad, Delhi, Kanpur, Surat, etc. Even the small and medium citiesare affected by these divides and violence [47,48]. Cities like Ahmedabad have become extremelydivided on the basis of religion after the Hindu-Muslim riots in 2002 [49]. Delhi is well known for itsHindu-Muslim segregated settlements, while in Mumbai, the highest segregation of population is alsobased on religion. The dissimilarity index [50] computed for the Muslim-Non-Muslim segregationsbased on the voter list data of 2014 for polling-booths are as high as 0.609, while (using the data atthe ward level) between non-lower castes and lower castes (called Scheduled Castes) this index is0.231. This shows that in Mumbai, almost about 23% of the lower castes population needs to move inorder to create a uniform distribution of population of lower and non-lower castes at the ward level.Furthermore, about 61% of the Muslim population would need to move so as to create a uniformdistribution of the population at the polling-booth level in the city. This shows the very high spatial

Sustainability 2020, 12, 2941 17 of 20
segregation of Muslims in the city [48]. This observation raises even more questions about the socialsustainability and the equitable development of Indian cities.
7. Conclusions and Discussion on Sustainability
This paper examined India’s evolving urban system in terms of hierarchical distribution ofcities, the concentration of economic resources in cities in relation to urban hierarchy, development ofinfrastructure, and ecological and social inclusion issues in the cities. India’s urban system is huge,with an enormous volume of population. Though India’s national urban system does not deviatesignificantly from the rank-size rule distribution over the years 1901–2011, it is top-heavy, that is, a fewcities control a significant share of the total urban population. Furthermore, the top-heavy nature ofthe urban system in India has significantly increased over the years. The share of population of citieswith 100,000-plus has risen, and this tendency is even more seen with regard to million-plus cities.As such, a small percentage of total cities account for a large share of India’s urban population. This isa result of distorted regional economic development, where because of rural economic distress andincome poverty, people migrate to cities with employment opportunities. As such, cities are relativelylarger in population size. This process further reinforces the size of such cities. India’s urban systemdoes not have any correlation between the size of the city and population growth rate, which reinforcesthe proportionate growth of cities as explained by Gibrat [31]. India’s economy is also found to be verymetropolitan-centric, that is, big cities control a significant share of the country’s GDP. Overall, about70–75% of total India’s GDP is generated by urban centers, and in this class, the share of megacities(above 10 million population) and million-plus cities is very high. The top 20 biggest cities contribute toabout half of India’s bank deposits, and three-fifths of bank credits. Some of these cities, like Mumbai,Chennai, Ahmedabad, and Coimbatore, are also investment sinks, as they absorb more bank credits(depriving other cities and rural areas) than what they would get in the form of their own deposits.In fact, Delhi and Mumbai (metropolitan regions) also account for more than half of the FDI inflowsin India.
Notwithstanding their economic powers, the megacities in India suffer from acute shortages ofsocial and physical infrastructures (schools, health facilities, roads, public transport, water supply,housing, and air quality, water quality). A significant share of the households in these cities live in slums.Furthermore, they also have been affected by social polarization and violence, especially on religiousand caste bases, leading to socio-spatial segregations. The story of the small and medium-size towns inIndia (below 100,000 population) is reverse in economic terms. They are often the centers of stagnationand lack necessary civic infrastructure and amenities. As such, the Indian urban system/cities can besaid to be far away from the sustainability triad of economy, equity, and environment. These threeaspects can create gridlock situations for the cities and inhibit their potential for becoming effectiveeconomic and social change sites, unless all these issues are addressed comprehensively and withoutany neglect of the less privileged rural and regional economies, which are the major source of migrationto large cities. The urban system in India is clearly facing major sustainability and resilience challenges.
Author Contributions: A.S.: Draft preparation, Overview of Urban Studies, Writing, Methodology, Editing, DataCollection, Investigation; K.K.: Design of Conceptual Framework, Overview of Urban Studies, Writing, Reviewing,Editing, Investigation; P.N.: Design of Conceptual Framework, Overview of Urban Studies, Writing, Reviewing,Editing, Investigation. All authors have read and agreed to the published version of the manuscript.
Funding: This work was supported by a grant of Ministry of Research and Innovation, CNCS—UEFISCDI, projectnumber PN-III-P4-ID-PCCF-2016-0166, within PNCDI III” project ReGrowEU—Advancing ground-breakingresearch in regional growth and development theories, through a resilience approach: Towards a convergent,balanced, and sustainable European Union.
Conflicts of Interest: The authors declare no conflict of interest.

Sustainability 2020, 12, 2941 18 of 20
Appendix A
Table A1. Top 5 cities in terms of total population in India (1901–2011).
Rank 1901 1911 1921 19311. Kolkata UA Kolkata UA Kolkata UA Kolkata UA
2. Greater MumbaiUA
Greater MumbaiUA
Greater MumbaiUA
Greater MumbaiUA
3. Chennai UA Chennai UA Chennai UA Chennai UA4. Hyderabad UA Hyderabad UA Hyderabad UA Hyderabad UA5. Lucknow UA Lucknow UA Delhi UA Delhi UARank 1941 1951 1961 19711. Kolkata UA Kolkata UA Kolkata UA Kolkata UA
2. Greater MumbaiUA
Greater MumbaiUA
Greater MumbaiUA
Greater MumbaiUA
3. Chennai UA Chennai UA Delhi UA Delhi UA4. Hyderabad UA Delhi UA Chennai UA Chennai UA5. Delhi UA Hyderabad UA Ahmadabad UA Ahmadabad UARank 1981 1991 2001 2011
1. Greater MumbaiUA
Greater MumbaiUA
Greater MumbaiUA
Greater MumbaiUA
2. Kolkata UA Kolkata UA Kolkata UA Delhi UA3. Delhi UA Delhi UA Delhi UA Kolkata UA4. Chennai UA Chennai UA Chennai UA Chennai UA
5. Bruhat BangaloreUA Hyderabad UA Hyderabad UA Bruhat Bangalore
UA
Source: Based on data from [22]. Note: Cities population is UA population.
References
1. Ward, B. The Home of Man; Norton: New York, NY, USA, 1976.2. Brugmann, J. Urban Revolution; Harper Collins: Noida, India, 2009.3. Bose, A. India’s Urbanization, 1901–2001; Tata McGraw-Hill: New Delhi, India, 1976.4. Mckinsey & Company. India’s Urban Awakening: Building Inclusive Cities, Sustaining Economic Growth;
McKinsey Global Institute: New Delhi, India, 2010.5. Sharma, R.N.; Shaban, A. Metropolitanisation of Indian Economy: Lessons in Urban Development. ICFAI J.
Gov. Public Policy 2006, 1, 17–35.6. Sharma, R.N.; Sandhu, R.S. (Eds.) Small Cities and Towns in Global Era: Emerging Changes and Perspectives;
Rawat Publications: Jaipur, India, 2013.7. Shaban, A.; Sattar, S. Industrial Dispersal and Clustering in India during Post-reform period and the Role
of Small & Medium Towns. In Small Cities and Towns in Global Era: Emerging Changes and Perspectives;Sharma, R.N., Sandhu, R.S., Eds.; Rawat Publications: Jaipur, India, 2013; pp. 111–151.
8. Alonso, W. Location and Land Use; Harvard University Press: Cambridge, UK, 1974.9. Parr, J. Agglomeration Economies. Environ. Plan. A 2002, 34, 717–731. [CrossRef]10. Fujita, M.; Krugman, P.; Venables, A.J. The Spatial Economy; MIT Press: Cambridge, MA, USA, 1999.11. Berry, B.J.L. City Size Distribution and Economic Development. Econ. Dev. Cult. Chang. 1961, 9, 573–588.12. Sassen, S. The Global City; Princeton University Press: Princeton, NJ, USA, 1991.13. Banaszak, M.; Dziecielski, M.; Nijkamp, P.; Ratajcak, W. Geography in Motion. Environ. Plan. A 2015.
[CrossRef]14. Geyer, H.S. The Fundamentals of Urban Space. In International Handbook of Urban Systems; Gayer, H.S., Ed.;
Edward Elgar: Cheltenham, UK, 2002; pp. 1–18.15. Kourtit, K. The New Urban World; Shaker: Aachen, Germany, 2019.16. Arribas-Bel, D.; Kourtit, K.; Nijkamp, P. The Socio-Cultural Sources of Urban Buzz. Environ. Plan. C 2016, 34,
188–204. [CrossRef]17. Glaeser, E.L. Triumph of the City: How Our Greatest Invention Makes Us Richer, Smarter, Greener, Healthier, and
Happier; Macmillan: London, UK, 2011.

Sustainability 2020, 12, 2941 19 of 20
18. Jacobs, J. The Economy of Cities; Vintage: New York, NY, USA, 1969.19. Glaeser, E.; Kourtit, K.; Nijkamp, P. (Eds.) Urban Empires; Routledge: New York, NY, USA, 2020.20. Nijkamp, P.; Kourtit, K.; Kocornik-Mina, A. (Eds.) Sustainable Villages and Green Landscapes in the ‘New Urban
World’; Shaker: Aachen, Germany, 2020.21. Census of India, Provisional Population Totals—Urban Agglomerations and Cities. 2011. Available online:
http://censusindia.gov.in/2011-prov-results/paper2/data_files/India2/1.%20Data%20Highlight.pdf (accessedon 25 February 2020).
22. Census of India, Population Enumeration Data (Final Population). 2011. Available online: http://censusindia.gov.in/2011census/population_enumeration.html (accessed on 25 December 2019).
23. Census of India, India—Report, 1931; Manager of Publications: Delhi, India, 1933; Volume 1, Part 1.24. Rao, V.K.R.V. Economic Growth and Rural-Urban Income Distribution 1950–51–1960–61. Econ. Political Wkly.
1965, 17, 373.25. Rumi, A. Measuring Urbanisation in India, ORF Issue Brief, 2017, 218, December. Available online:
https://www.orfonline.org/wp-content/uploads/2017/12/ORF_IssueBrief_218_Urbanisation.pdf (accessed on25 February 2020).
26. Amitabh, K. Method in Madness: Urban Data from 2011 Census. Econ. Political Wkly. 2011, 46, 13–16.27. Zipf, G.K. Human Behavior and the Principle of Least Effort; Addison Wesley: Boston, MA, USA, 1949.28. Zivanovic, Z.; Tosic, B.; Nikolic, T.; Gataric, D. Urban System in Serbia—The Factor in the Planning of
Balanced Regional Development. Sustainability 2019, 11, 4168. [CrossRef]29. Sanga, P.; Shaban, A. Regional Divergence and Inequalities in India. Econ. Political Wkly. 2017, 52, 102–110.30. Linsky, A.S. Some Generalizations Concerning Primate Cities. Ann. Assoc. Am. Geogr. 1965, 55, 506–513.
[CrossRef]31. Gibrat, R. Les Inégalite´s Economiques; Applications: Aux Inégalite´s des Richesses, à la Concentration des Entreprises,
aux Populations des Villes, aux Statistiques des Familles, etc., d’une loi Nouvelle, la loi de L’effet Proportionnel;Librairie du Recueil Sirey: Paris, France, 1931.
32. Kapteyn, J.C. Skew Frequency Curves in Biology and Statistics, Astronomical Laboratory; Noordhoff: Groningen,The Netherlands, 1903.
33. Eeckhout, J. Gibrat’s Law for (All) Cities. Am. Econ. Rev. 2004, 94, 1429–1451. [CrossRef]34. Business Standard, Urban Population to Contribute 70–75% of India’s GDP by 2020-Barclays. Available
online: https://www.business-standard.com/article/news-cm/urban-population-to-contribute-70--75-of-india-s-gdp-by-2020-barclays-114032000273_1.html (accessed on 25 February 2020).
35. Government of India, Smart Cities Mission, Ministry of Housing and Urban Affairs, New Delhi. Availableonline: http://smartcities.gov.in/content/innerpage/smart-city-features.php (accessed on 25 February 2020).
36. Shaban, A.; Narnaware, P.B. Innovations in Multistakeholder Partnerships for Sustainable Development:Fostering State-University-Community Nexus. In People-Centred Social Innovation: Global Perspectives on theEmerging Paradigm; Banerjee, S., Carney, S., Hulgard, L., Eds.; Routledge: London, UK, 2019; pp. 179–194.
37. Tumbe, C. A Million Migrations: Journeys in Search of Jobs, Live Mint. Available online: https://www.livemint.com/Politics/8WPPsZygqR7Mu6e3Fgy55N/A-million-migrations-Journeys-in-search-of-jobs.html (accessedon 25 February 2020).
38. Reserve Bank of India, Quarterly Statistics on Deposits and Credit of Scheduled Commercial Banks. Availableonline: https://www.rbi.org.in/Scripts/QuarterlyPublications.aspx?head=Quarterly%20Statistics%20on%20Deposits%20and%20Credit%20of%20Scheduled%20Commercial%20Banks (accessed on 20 February 2020).
39. Ministry of Commerce and Industry, State-Wise Statement on FDI Equity Inflows from April 2014 to March2017. Available online: https://data.gov.in/resources/state-wise-statement-fdi-equity-inflows-april-2014-march-2017-ministry-commerce-and (accessed on 20 February 2020).
40. Census of India, Housing Stock, Amenities & Assets in Slums—Census 2011, Registrar General and CensusCommissioner, Government of India, New Delhi. Available online: https://suburbin.hypotheses.org/754(accessed on 25 February 2020).
41. Sattar, S. Homelessness in India. Shelter 2014, 15, 9–15.42. Economic Times, Pollution Worse in Indian Cities as Registered Vehicles up by 700 Times Since 1951: Study.
Available online: https://economictimes.indiatimes.com/news/politics-and-nation/pollution-worse-in-indian-cities-as-registered-vehicles-up-by-700-times-since-1951-study/articleshow/69761131.cms?utm_source=contentofinterest&utm_medium=text&utm_campaign=cppst (accessed on 25 February 2020).

Sustainability 2020, 12, 2941 20 of 20
43. Government of India. Road Transport Year Book 2015–2016; Ministry of Road Transport & Highways TransportResearch Wing: New Delhi, India, 2018.
44. Vira, B.; Vira, S. Governing India’s Urban Environment: Problems, Policies and Politics. In Urbanisation andGovernance in India; Hust, E., Mann, M., Eds.; Manohar Publishers & Distributors: New Delhi, India, 2005;pp. 29–60.
45. Schultz, K.; Raj, S. New Delhi, Choking on Toxic Air, Declares Health Emergency, The New York Times.Available online: https://www.nytimes.com/2019/11/01/world/asia/delhi-pollution-health-emergency.html(accessed on 25 February 2020).
46. Rajaram, S. You Think Delhi is Polluted? Bangalore’s Pollution Levels Will Leave You Breathless, BangaloreMirror. Available online: https://bangaloremirror.indiatimes.com/bangalore/cover-story/you-think-delhi-is-polluted-bengalurus-pollution-levels-will-leave-you-breathless/articleshow/69065577.cms?utm_source=
contentofinterest&utm_medium=text&utm_campaign=cppst (accessed on 25 February 2020).47. Shaban, A. Muslim Citizenship, Identity and Violence in India. In Violence Studies; Kannabiran, K., Ed.;
Oxford University Press: New Delhi, India, 2016; pp. 142–169.48. Shaban, A. Ethnic Politics, Muslims and Space in Contemporary Mumbai. In Lives of Muslims in India: Politics,
Exclusion and Violence; Shaban, A., Ed.; Routledge: London, UK, 2012; pp. 208–225.49. Jeffrelot, C.; Laliwala, S. The Segregated City. Indian Express. Available online: https://indianexpress.
com/article/opinion/columns/muslims-in-india-hindus-jains-gujarat-love-jihad-5191304/ (accessed on 25February 2020).
50. Jahn, J.A.; Schmid, C.F.; Schrag, C. The Measurement of Ecological Segregation. Am. Sociol. Rev. 1947, 103,293–303. [CrossRef]
© 2020 by the authors. Licensee MDPI, Basel, Switzerland. This article is an open accessarticle distributed under the terms and conditions of the Creative Commons Attribution(CC BY) license (http://creativecommons.org/licenses/by/4.0/).