State of India's Livelihoods Report 2012
221
-
Upload
khangminh22 -
Category
Documents
-
view
3 -
download
0
Transcript of State of India's Livelihoods Report 2012

State of India’s Livelihoods Report 2012

Editor Vipin Sharma
ContributorsUnmesh Brahme
Sankar Datta
Biswa Bandhu Mohanty
Tara Nair
Smita Premchander
Suryamani Roul
Ashok Sircar

State of India’s Livelihoods Report 2012
Edited by
Vipin Sharma

Copyright © ACCESS Development Services, 2013
All rights reserved. No part of this book may be reproduced or utilized in any form or by any means, electronic or mechanical, including
photocopying, recording or by any information storage or retrieval system, without permission in writing from the publisher.
Jointly published in 2013 by
SAGE Publications India Pvt Ltd ACCESS Development Services
B1/I-1 Mohan Cooperative Industrial Area 28, Hauz Khas Village
Mathura Road, New Delhi 110 044, India New Delhi 110 016
www.sagepub.in www.accessdev.org
SAGE Publications Inc
2455 Teller Road
Thousand Oaks, California 91320, USA
SAGE Publications Ltd
1 Oliver’s Yard, 55 City Road
London EC1Y 1SP, United Kingdom
SAGE Publications Asia-Paciic Pte Ltd
33 Pekin Street
#02-01 Far East Square
Singapore 048763
Published by Vivek Mehra for SAGE Publications India Pvt Ltd, Phototypeset in 10/13 pt Minion by Diligent Typesetter, Delhi, and printed
at Saurav Printers, New Delhi.
Library of Congress Cataloging-in-Publication Data Available
ISBN: 978-81-321-1095-8 (PB)
The SAGE Team: Rudra Narayan, Shreya Chakraborti, Rajib Chatterjee, Sanjeev Kumar Sharma and Umesh Kashyap
Cover photograph courtesy: ACCESS.
Contents
List of Tables vii
List of Figures ix
List of Boxes xi
List of Abbreviations xiii
Preface xix
1. Understanding Livelihoods: A Review of Major Debates 1
Tara Nair
2. Livelihoods of People: How the Poor Are Making Both Ends Meet 13
Sankar Datta
3. Policy Initiatives on Livelihoods: Emerging Scenario 33
Ashok Sircar
4. Flagship Programmes of the Government: Where Do We Stand? 61
Suryamani Roul
5. Livelihoods Protection and Promotion: The Changing Role of Civil Society
Organizations 107
Smita Premchander
6. Role of Corporate Social Responsibility in Livelihoods Promotion of Poor:
A Commentary 125
Unmesh Brahme
7. Potential and Possibilities for Livelihood of the Poor 157
Biswa Bandhu Mohanty
About the Editor and Contributors 197

Thank you for choosing a SAGE product! If you have any comment, observation or feedback, I would like to personally hear from you. Please write to me at [email protected]
—Vivek Mehra, Managing Director and CEO, SAGE Publications India Pvt Ltd, New Delhi
Bulk SalesSAGE India offers special discounts for purchase of books in bulk. We also make available special imprints and excerpts from our books on demand. For orders and enquiries, write to us at
Marketing Department SAGE Publications India Pvt Ltd B1/I-1, Mohan Cooperative Industrial Area Mathura Road, Post Bag 7 New Delhi 110044, India E-mail us at [email protected]
Get to know more about SAGE, be invited to SAGE events, get on our mailing list. Write today to [email protected]
This book is also available as an e-book.

List of Tables
2.1 Distribution of labour force earning their livelihoods from different
sectors (2009–2010) 14
2.2 Key labour statistics—India (year) 15
2.3(a) Percentage of persons employed in principal and subsidiary status taken
together: Status by industry division—rural 15
2.3(b) Percentage of persons employed in principal and subsidiary status taken
together: Status by industry division—urban 16
2.3(c) Percentage distribution of GDP by sector 16
2.4 Revised estimates of GDP at factor cost by economic activity
(at 2004–2005 prices) in (`) billion 17
2.5 Trends in employment from Quarterly Report on changes in employment
in selected sectors (January–March 2012) 18
2.6 Change in poverty as per Expert Group 2009 (Tendulkar Committee) 21
2.7 Change in poverty as per Expert Group 1993 21
2.8 Annual average decline from 1993–1994 to 2009–2010 21
2.9 Average MPCE 24
2.10 Trends in per capita consumption of calories 25
2.11 Trends in rural and urban inequality 26
2.12 The level of inequality across states: Gini Coeficient (%) 26
3.1 Budget allocations in key existing programmes 35
3.2 New policies announced in the Union Budget 2012–2013 36
3.3 Factors that distinguish the affected and forward districts 45
3.4 Entitlement of food security as deined by the NFSB 53
3.5 Differences in NAC and the government’s approach to the NFSB 56
4.1 Scale of operations of MGNREGS 63
4.2 Stages of readiness at the level of state governments 77
4.3 Financial allocation under NRLM/SGSY during 2012–2013 (` in lakh) 79
4.4 Details of projects sanctioned under MKSP 80
4.5 Share of agriculture in GDP at current prices 88
4.6 RKVY fund utilization system 88
4.7 RKVY allocation criteria 89
4.8 New sub-schemes of RKVY 2011–2012 90
4.9 Budget allocation and release under RKVY 91
4.10 Ministry-wise targets for skill development for 2012–2013 97
4.11 GDP growth rate in backward states 103
6.1 CSR and its components—deinitions 129
6.2 Disclosure score follows a sectoral trend 132
6.3 The 10 principles of the UN Global Compact 134


List of Figures
2.1 Percentage labour force employed in various sectors and their
contribution to GDP (2009–2010) 15
2.2 Left-wing affected areas in India 29
4.1 The major ways in which MGNREGS Version 2.0 is expected to differentiate
itself from Version 1 64
4.2 Rains and rural job demands 69
4.3 Ensuring jobs 69
4.4 Projection on sectoral requirement 97
5.1 Changing donor focus in enterprise promotion 109
6.1 Disclosure on government parameters 133
6.2 Disclosure on environmental parameters 133
6.3 Trends in corporate responsibility reporting in India 138
6.4 Corporate responsibility strategy and approach 138
6.5 Corporate responsibility—topics and issues 138
6.6 Sector-wise break up of N100 reporters 139
6.7 The venture philanthropy model 144


List of Boxes
2.1 Climate change adversely affecting agriculture 19
2.2 Drought and its impact on the livelihoods of people 20
2.3 The evolution of thinking about poverty 22
2.4 The English translation of the poem Daridrarekha, Tarapada Ray, 1986 23
2.5 The Punjab situation 27
3.1 Salient features of LARR 2011 51
4.1 What the new version entails 63
4.2 A comparative analysis of the unique features of MGNREGA Version 1
and Version 2 64
4.3 Madhya Pradesh in list of top 10 states in MGNREGA implementation
(2 July 2012) 65
4.4 Smart card payment of wages under MGNREGS in Andhra Pradesh 67
4.5 Introduction of online wage payment on MGNREGS work
in Ganjam district, Odisha 68
4.6 Letter from Ministry of Rural Development dated 16 April 2012 74
4.7 Bihar: A case in making 78
4.8 A note written by K. S. Gopal upon his participation at the meeting of
1st Advisory Council on the NRLM chaired by the Minister for Rural
Development and held on 25 July 2012 85
4.9 Government of Odisha Plan on RKVY 92
4.10 Minting a skilled workforce. Targets to train 1 million youth during
Twelfth Plan period 95
4.11 Loan facility by bank for skill training 98
4.12 Vocational courses at the school level in Haryana 100
4.13 Initiative by AICTE on vocational education 100
4.14 Optimism—Convergence of NRLM with market 103
5.1 Business development strategies 109
5.2 Livelihoods missions set up by some Indian states 111
5.3 Seva Mandir: Holistic thinking about rural livelihoods 113
5.4 Livelihoods building: BRAC’s strategy 114
5.5 NGOs and agendas 115
5.6 CSOs with policy inluence 119
5.7 Restrictions on CSOs under the IT Act 120
7.1 IFAD’s seven principles of the Sustainable Livelihood Approach (SLA) 158
7.2 NRLM Bihar: Strategies for harnessing livelihood opportunities 164
7.3 Rural livelihoods—use of value chains: Natural ibre cluster 171
7.4 Pashu Sakhi (livestock nurse) model 173
7.5 The livelihoods 360 technology wins award for innovative ICT in
management of project 175

xii STATE OF INDIA’S LIVELIHOODS REPORT 2012
7.6 Steps for potential mapping for livelihoods 180
7.7 Differential livelihood strategies 182
7.8 Nine million SHG members to get mobile feeds on inancial transaction
in Andhra Pradesh under mobile book-keeping project 189
7.9 Aadhar Enabled Payment System (AEPS) 190

List of Abbreviations
AAP Annual Action Plan
ACA Additional Central Assistance
ADB Asian Development Bank
ADP Adivasi Development Programme
AEPS Aadhar Enabled Payment System
AFDP Accelerated Fodder Development Programme
AHVY Ambedkar Hastasilpa Vikas Yojana
AICTE All India Council for Technical Education
AISECT All India Society for Electronics and Computer Technology
AKRSP Aga Khan Rural Support Programme
ANBC Adjusted Net Bank Credit
AP Approach Paper
APEDA Agricultural and Processed Food Products Exports Development
Authority
ASSOCHAM Associated Chambers of Commerce and Industry of India
ATM Automated Teller Machine
ATMA Agriculture Technology Management
AYUSH Ayurveda, Yoga, Naturopathy, Sidh and Homoeopathy
BAIF Bharatiya Agro Industries Foundation
BC Business Correspondence
BDS Business Development Service
BF Business Facilitator
BGREI Bringing Green Revolution to Eastern India
BPL Below Poverty Line
BPO Business Process Outsourcing
BRGF Backward Regions Grant Fund
BRLF Bharat Rural Livelihoods Foundation
BRLPS Bihar Rural Livelihoods Promotion Society
CAB College of Agricultural Banking
CAG Comptroller and Auditor General
CARE Cooperative for Assistance and Relief Everywhere
CBO Civic Body Organization
CBS Core Banking Solution
CBSE Central Board of Secondary Education
CDP Community Development Programme
CENET Concurrent Evaluation Network
CEOBE Credit Equivalent of Off-Balance Sheet Exposure
CFPR Challenging Frontiers to Poverty Reduction
CFPR-TUP Challenging the Frontiers of Poverty Reduction-Targeting Ultra
Poor
CII Confederation of Indian Industry
CIPHET Central Institute for Post-harvest Engineering Technology

xiv STATE OF INDIA’S LIVELIHOODS REPORT 2012
CLP Chars Livelihoods Programme
CMFR Centre for Media Freedom and Responsibility
CPI Consumer Price Index
CPRC Chronic Poverty Research Centre
CRIDA Central Research Institute for Dry Land Agriculture
CSC Common Service Centre
CSIR Council for Scientiic and Industrial Research
CSO Civil Society Organization
CSP Customer Service Provider
CSR Corporate Social Responsibility
CSS Centrally Sponsored Scheme
DDM District Development Manager
DFID Department of International Development
DMI Delivery Monitoring Unit
DONER Development of NER
DRDA District Rural Development Agency
DWACRA Development of Women and Children in Rural Areas
EAC Economic Advisory Council
e-BAAT electronic Bank Awareness and Training
EDP Entrepreneurship Development Programme
EGoM Empowered Group of Ministers
FICCI Federation of Indian Chambers of Commerce and Industry
FIF Financial Inclusion Fund
FIS Financial Inclusion Scheme
FITF Financial Inclusion Technology Fund
FMS Farm Management Services
FPS Fair Price Shop
FY Financial Year
FYP Five Year Plan
GDP Gross Domestic Product
GIS Geographical Information System
GIZ Gesellschaft für Internationale Zusammenarbeit
GLPC Gujarat Livelihood Promotion Company
GRI Global Reporting Initiative
HRD Human Resource Development
HUL Hindustan Unilever
IAP Integrated Action Plan
IAY Indira Awas Yojana
IBA Indian Banks’ Association
ICAR Indian Council of Agricultural Research
ICDS Integrated Child Development Services
ICR Implementation Completion Report
ICRISAT International Crop Research Institute for the Semi-Arid Tropics
ICT Information and Communication Technology
IDBI Industrial Development Bank of India
IEO Independent Evaluation Ofice
IFAD International Fund for Agriculture Development
IFPRI International Food Policy Research Institute
IGNOU Indira Gandhi National Open University

List of Abbreviations xv
IIM Indian Institute of Management
IIMPS Invest India Micro Pension Services
IMPS Inter-bank Mobile Payment Service
IISc Indian Institute of Science
ILO International Labour Organization
IRDP Integrated Rural Development Programme
ISOPOM Integrated Schemes of Oilseeds, Pulses, Oil Farm and Maize
IT Information Technology
ITC Industrial Training Centre
ITES IT Enabled Services
ITI Industrial Training Institute
JLG Joint Liabilities Group
JRLP Jharkhand Rural Livelihoods Project
KCC Kishan Credit Card
KfW Reditanstalt für Wiederaufbau
KVI Khadi and Village Industry
KVIC Khadi and Village Industries Commission
KVK Krishi Vigyan Kendra
KYC Know Your Customers
LARR Bill Land Acquisition, Resettlement and Rehabilitation Bill
LDM Local Data Manager
LGBT Lesbian, Gay, Bisexual and Transgender
LIC Life Insurance Corporation of India
LSI Livelihood Status Index
LWE Left-wing Extremism
MDG Millennium Development Goal
MDM Midday Meal Scheme
MFDEF Micro Finance Development and Equity Fund
MFI Microinance Institution
mFMS mobile-based Fertilizer Management System
MFO Microinance Organization
MFPI Ministry of Food Processing Industry
MGNREGA Mahatma Gandhi National Rural Employment Guarantee Act
MGNREGS Mahatma Gandhi National Rural Employment Guarantee Scheme
MIS Management Information System
MKSP Mahila Kisan Sashaktikaran Pariyojana
MMA Macro Management of Agriculture
MoU Memorandum of Understanding
MPCE Monthly Per Capita Expenditure
MPRLP Madhya Pradesh Rural Livelihoods Project
MSME Medium, Small and Micro Enterprise
MSP Minimum Support Price
MSP Mahila Sashaktikaran Pariyojana
MTB Marketing, Technology and Brand
NABARD National Bank for Agriculture and Rural Development
NABFINS NABARD Financial Services Limited
NAC National Advisory Council
NAS National Accounts Statistics
NASVI National Alliance of Street Vendors of India

xvi STATE OF INDIA’S LIVELIHOODS REPORT 2012
NCAER National Council of Applied Economic Research
NCOP National Council of Old Persons
NCW National Commission for Women
NDC National Development Council
NDDB National Dairy Development Board
NDP National Dairy Plan
NEFT National Electronic Fund Transfer
NER North Eastern Region
NERLP North East Rural Livelihoods Project
NFSB National Food Security Bill
NFSM National Food Security Mission
NGO Non-government Organization
NHM National Horticulture Mission
NHRC National Human Rights Commission
NMMU National Mission Management Unit
NMP National Manufacturing Policy
NMSA National Mission for Sustainable Agriculture
NOS National Occupational Standards
NPA Non-performing Asset
NPCI National Payment Corporation of India
NPI National Programme on Rural Industrialization
NREGA National Rural Employment Guarantee Act
NREGS National Rural Employment Guarantee Scheme
NRHM National Rural Health Mission
NRLM National Rural Livelihood Mission
NRLP National Rural Livelihoods Project
NRSC National Remote Sensing Centre
NSAP National Social Assistance Programme
NSDC National Skills Development Council
NSDF National Skill Development Fund
NSLS National Scheme of Liberation of Scavengers
NSSO National Sample Survey Organisation
NTFP Non-timber Forest Produce
NULM National Urban Livelihoods Mission
NVEQF National Vocational Education Qualiication Framework
OBCs Other Backward Classes
OSS Off-site Surveillance System
PAC Project Approval Committee
PDS Public Distribution System
PFRDA Pension Funds Regulatory and Development Authority
PIA Project Implementing Agency
PLP Potential-linked Credit Plans
PMGSY Pradhan Mantri Gram Sadak Yojana
PMRDF Prime Minister’s Rural Development Fellowship
POS Point-of-sale
PPP Public Private Partnership
PPPIAD Public Private Partnership on Integrated Agriculture Development
PRC Project Review Committee
PRI Panchayati Raj Institution

List of Abbreviations xvii
PSC Project Screening Committee
PSIG Poorest States for Inclusive Growth
PTGs Primitive Tribal Groups
PURA Provision of Urban Amenities in Rural Areas
PwD Person with Disability
R&D Research and Development
RADP Rain-fed Area Development Programme
RAY Rajiv Awas Yojana
RBI Reserve Bank of India
RUDSETI Rural Development and Self-Employment Training Institute
RECS Regional Electronic Clearing Services
RFD Results Framework Document
RFIP Rural Financial Institutions Programme
RGA Rashtriya Garima Abhiyan
RGB Rushikulya Gramya Bank
RKVY Rashtriya Krishi Vikas Yojana
ROI Return on Investment
RSBY Rashtriya Swasthya Bima Yojana
RSETI Rural Self Employment Training Institute
RTF Right to Food
RTI Right to Information
RUDA Rural Non Farm Development Agencies
SBI State Bank of India
SC Scheduled Caste
SEBI Securities and Exchange Board of India
SERP Society for Eradication of Rural Poverty
SEWA Self Employed Women’s Association
SEZ Special Economic Zone
SFC State Financial Corporation
SFP State Focus Paper
SFURTI Schemes of Fund for Traditional Industries Regeneration
SGSY Swarnajayanti Gram Swarozgar Yojana
SHG Self-Help Group
SHGBLP SHG–Bank Linkage Programme
SHPI Self-Help Promoting Institution
SIDBI Small Industries Development Bank of India
SIIC State Industrial Investment Corporation
SLA Sustainable Livelihood Approach
SLBC State Level Bankers’ Committee
SOIL State of India’s Livelihoods Report
SOP Standard Operating Procedure
SPIP State Perspective Implementation Plan
SRI System of Rice Intensiication
SRLM State Rural Livelihoods Mission
SRMS Self Employment Scheme for Rehabilitation of Manual Scavengers
SSA Sarva Siksha Abhiyan
SSC Sector Skills Council
ST Scheduled Tribe
TCO Technical Consultancy Organization

xviii STATE OF INDIA’S LIVELIHOODS REPORT 2012
THP Targeting Hard Core Poor
TISS Tata Institute of Social Sciences
TSC Total Sanitation Campaign
TPDS Targeted Public Distribution System
UID Unique Identiication
UIDAI Unique Identiication Authority of India
UN United Nations
UNDP United Nations Development Programme
UNIDO United Nations Industrial Development Organization
UNWOMEN United Nations Entity for Gender Equality and the Empowerment of
Women
UT Union Territory
UTIAMC Unit Trust of India Assest Management Company
WCED World Commission on Environment and Development
WTO World Trade Organization
XIMB Xavier Institute of Management, Bhubaneshwar

Preface
Four years back, along with a small group of people from the sector, the State of India’s
Livelihoods (SOIL) Report was conceptualized. There wasn’t a single composite document to
track and trace progress on how aggregate efforts and investments were impacting the lives
of the poor. Since ‘livelihoods’ has such a broad deinition, we tried to organize this effort
into a framework that would help us track the progress in some kind of a continuing manner
around speciic parameters. Within ACCESS, we came up with the 4P framework as we
thought that if there was a way of tracking impact on the poor under the four broad heads of
‘understanding the current plight of the Poor’, ‘assessing Policy initiatives’, ‘analysing outcomes
from important Programmes and investments being made by Promoters’ and ‘identifying
Potential opportunities for the poor’, a good mechanism could be developed to track progress.
This effort has been an ongoing initiative of ACCESS, and I can say that the SOIL Report
has started to come together well, and is increasingly becoming a good reference document
for the sector. Based on the success of the last four Reports and positive feedback from the
stakeholders, ACCESS is now encouraged to bring out the ifth edition of the SOIL Report.
Traditionally the Report is brought out each year in time to be released at the Livelihoods
India Conference. Given the growing popularity of the Conference which is attended by a large
sectoral audience, for this year, it made sense to include one chapter in the Report dealing
with the changing role of Civil Society Organizations (CSOs) in livelihoods promotion, in
alignment with the theme of the Livelihoods India Conference for the current year. Given
the important role, often underestimated by ‘development wallahs’, this year, one chapter
has been included to assess the role of the private sector, which focuses on the emerging role
of Corporate Social Responsibility (CSR) in livelihoods promotion. This edition provides
evidence-based reporting, references, examples and case studies, which both policymakers
and practitioners engaged in livelihoods promotion of the poor will ind useful. ACCESS was
fortunate to have a group of excellent reviewers for the previous edition whose constructive
comments resulted in an improved Report this year. In all, the 2012 SOIL Report has seven
chapters authored by some well-known experts from the sector, a few of whom are writing
for the SOIL for the irst time, like Tara Nair and Unmesh Brahme, and others who have
engaged with the SOIL Report in the past like Sankar Datta, Ashok Sircar, Suryamani Roul,
Smita Premchander and Biswa Bandhu Mohanty.
Chapter 1 on ‘Understanding Livelihoods: A Review of Major Debates’ covers a wide sweep
of issues relecting the complexities that have come to characterize the livelihood environment
and the vulnerability of the poor and asset-less households. Starting with debates around
the conlict between growth and development, the chapter traces the idea of sustainable
development and livelihoods from the early debates in 1980s to the new vision of sustainability
as emerging from recent discourses on livelihoods. The chapter goes on to capture other major
debates around a wide array of themes such as implications of climate change on agriculture,
complex interrelations between conflict and livelihoods, small producers and market
integration, the role of technology and innovation in supporting sustainable livelihoods for
the poor and the synergy of partnerships for livelihoods promotion. In Chapter 2, ‘Livelihoods
of People: How the Poor Are Making Both Ends Meet,’ the author begins by describing how
the poor are making both ends meet in pursuing their subsistence livelihoods options, and

xx STATE OF INDIA’S LIVELIHOODS REPORT 2012
the kind of incomes they generate from these occupations. While touching on the fact that
the economy is slowing down, he drives home the point that growth is not translating into
employment, highlighting the rising consumption gap between the rich and poor and how
overall economic growth has not translated into better living conditions for the poor. He also
dwells briely on the challenges to livelihoods of the farmers in the dificult forest terrain of
Central India. In Chapter 3, ‘Policy Initiatives in Livelihoods: Emerging Scenario,’ the author
tries to capture what the State is doing in the policy domain to address the livelihoods challenges
of the poor. The chapter analyses the union budget and the Approach Paper to the 12th Five
Year Plan from a livelihoods perspective, looks at some new policy initiatives that inluence
the livelihoods of manual scavengers, street vendors, women farmers and Scheduled Castes/
Scheduled Tribes of Central India respectively and discusses two forthcoming missions, i.e.,
National Urban Livelihoods Mission (NULM) and National Dairy Plan (NDP). It also looks
at the uninished policy agenda of Land Acquisition Bill and the debate around the National
Food Security Bill. In Chapter 4, ‘Flagship Programmes of the Government: Where Do We
Stand,’ the author provides statistical outlines and brief reviews of the progress on the lagship
programmes during the reporting period, and also encompasses elaborate discourse on select
representative programmes. The transformational processes of the MGNREGS, transitional
approach of National Rural Livelihood Mission (NRLM)/Aajeevika, trickling up strategy of
Rashtriya Krishi Vikas Yojana (RKVY) in agriculture and triggering efforts under the skill
initiative have been reviewed with a view to making the selected programmes representative
of the target population, particularly segments such as poor and vulnerable communities,
women and the poorest households, small and marginal farmers and youth. Chapter 5,
‘Livelihoods Protection and Promotion: The Changing Role of Civil Society Organizations,’
tracks the development of CSOs as key actors in the process of development from a historical
perspective and highlights the challenges they must face to survive in the current environment.
It comes to the conclusion that even as traditional spaces for CSOs are shrinking, new spaces
are opening up and, thus, in order to remain relevant, CSOs will have to seriously re-examine
their worldviews, strategies and operations and constantly reinvent themselves to retain their
critical positioning in the process of shaping social structures and environments. Chapter 6
dwells on the role of CSR in livelihoods promotion of poor. While looking at the manner in
which CSR connects with livelihoods, it also provides observations and insights on how to create
a best practice mechanism to achieve livelihoods for the poor through the practice of CSR. New
opportunities as a result of urbanization and migration cover the potential sectors and sub-sectors,
mainly agriculture, services and manufacturing. The inal chapter, ‘Potential and Possibilities
for Livelihoods of the Poor,’ looks at livelihoods options for the poor in accordance with their
environment covering potential for rain-fed livelihoods, prospects for forest based livelihoods
and potentials and perspectives in the North East region. It also analyses livelihoods potential
for various sub-sections of the poor, including ultra poor and women. It looks at potential
for cluster development initiative and inancial inclusion for livelihoods promotion besides
discussing potential for livelihoods of the poor from a broader perspective.
Overall, the authors have brought in deep insights into issues that we as a sector need to
relect on. The challenge of addressing the issues of the livelihoods is overwhelming and unless
individual institutional efforts and initiatives are looked at an aggregate level and unless strong
partnerships are developed, the necessary multipliers will not be achieved and outcomes will
be ephemeral.
I extend my gratitude to all those who directly or indirectly helped see this report through
to completion. I am thankful to each of the authors who besides writing their own chapters
also participated in various consultations and workshops that provided the foundation for
this Report and brought great value addition through valuable insights and critical views. I

Preface xxi
am also deeply indebted to the Ford Foundation and UNDP India for their continued funding
support towards the Report.
The innovative insights and directions given by the Livelihoods India Advisory Group,
comprising experts such as Anshu Bhartia, Arindom Datta, Brij Mohan, Madhukar Shukla,
Maneesha Chadha, Meera Mishra, Orlanda Ruthven, Prema Gera, Ranu Bhogal, Sankar
Datta and Vanita Suneja, have been instrumental in shaping the report, and I express my
deep thanks to them.
I also wish to acknowledge Lucid Solutions and its Director, Shreemoyee Patra, for
undertaking the language edit of the Report and delivering it at a very short notice. Last but
not the least, I would like to thank the Livelihoods India Team at ACCESS comprising Puja and
Paankhuri, ably supervised by Suryamani Roul for coordinating the entire SOIL process.
I realize that further value add to the SOIL Report is necessary, and I remain optimistic
that improvement will inevitably result as we go forward. In this direction, a round table
was recently held to help identify whether developing indicators for tracking livelihoods are
feasible and, if so, what speciic indicators can be crafted with an aim to carrying them in
the SOIL Report 2013. Based on the recommendations of the expert group, work has already
been initiated.
It is our constant endeavour at ACCESS to contribute towards building knowledge for
the sector, and I hope that with this edition of SOIL we have succeeded in our effort to put
together a report that documents in an aggregated manner the various issues and challenges
in making the livelihoods of the poor sustainable, which will be seen as a relevant contribution
to the sector.
Vipin Sharma
CEO
ACCESS Development Services
New Delhi


In a world that is increasingly challenged
by depleting resources, worsening climate
variations, increasing economic disparity,
unemployment, persistent hunger and
poverty and heightening social discord,
the conlict between growth and develop-
ment has become disquietingly glaring. The
resource use choices made by nations that
progressed at impressive rates have come to
be questioned in the light of the stark contra-
dictions between the gains they have made
and the social and economic costs incurred
in the process. The discourses on develop-
ment have come to question the economic
growth strategies that endorse unsustain-
able and resource intensive choices made
by nations. There is increasing pressure
on countries to carry out ‘fundamental
economic transformations’ to ‘secure a
sustainable future’ with a view to increase
productivity, improve resource eficiency
and reduce environmental costs (United
Nations and Asian Development Bank,
2012: xiii–xiv). It appears that the focus is
back on the idea of sustainable development
with an added accent on ‘green growth’ and
environmental sustainability and, paradoxi-
cally, with a greater emphasis on the power
of the ‘market’.
Sustainable development and livelihoods: Early debates
It was in the late 1980s that the World
Commiss ion on Environment and
Development (WCED) offered for the irst
time a deinition of sustainable development
as that which meets the needs of the present
without compromising the ability of future
generations to meet their own needs. Beyond
meeting the basic needs—like food, cloth-
ing, shelter and jobs—of populations across
geographies, such development entails
making opportunities available to them to
fulil their legitimate aspirations for a better
life. The Commission laid out an elabo-
rate agenda for a concerted global action
programme to align the growth plans and
development goals of individual countries
to suit the objectives of sustainable devel-
opment which include revival of growth,
improving the quality of growth, meeting
basic needs (jobs, food, energy, water and
sanitation), ensuring a sustainable level of
population, conserving and enhancing the
resource base, reorienting technology and
managing risk, and merging environment
and economics in decision-making.1 The
WCED Report became a watershed in
development thinking in that it, for the irst
time, made an urgent plea to all the nations
Understanding Livelihoods: A Review of Major Debates
TARA NAIR
Chapter 1
1 See Chapter 2: ‘Towards Sustainable Development’,
Our Common Future: Report of the World Commission
on Environment and Development. Available at http://
www.un-documents.net/ocf-02.htm#III.2 (accessed on
20 August 2012). The Commission was chaired by Gro
Harlem Bruntland, the then Prime Minister of Norway,
and the report of the Commission is popularly known
as the Bruntland Report.

2 STATE OF INDIA’S LIVELIHOODS REPORT 2012
in the world to work towards the creation of
a new world where investments, technology
and institutions change in tandem to ensure
a balanced development of resources and
equitable distribution of its gains, not only
in the present but in future too.
Based on the above conceptual ediice,
the Commission evolved a definition of
livelihood as ‘adequate stocks and lows of
food and cash to meet basic needs’.2 In this
conceptualization of livelihood, security
and sustainability were built in as integral
elements. Livelihood security arises from
secure resource ownership and access
(through rights) as also access to economic
activities that yield adequate income, which
would help manage risks, shocks and contin-
gencies. Sustainability of livelihood ensures
enhancement and maintenance of resource
productivity over the long run.
Taking off from the work of WCED,
Chambers and Conway (1991) attempted
to explain livelihoods within an interac-
tive framework with capabilities (stores,
resources, claims and access) and activities
together determining the means of living for
individuals. They coined the term ‘sustain-
able livelihood’ (Solesbury, 2003) to refer
to the ability of livelihoods to help cope
with and recover from stress and shocks,
maintain or enhance capabilities and assets
(both tangible and intangible) and provide
livelihood opportunities for future gen-
erations. The concept was further extended
by Ellis (1998, 1999) who characterized
livelihood as comprising assets (natural,
physical, human, inancial and social capi-
tal), activities (on-farm, off-farm and non-
farm) and access to assets/activities which
together determine the living gained by the
individual or household. Importantly Ellis’
conceptualization took account of the role
of institutions (like land tenure, common
property, market etc.), social relations
(caste, ethnicity, gender etc.) and organiza-
tions (government and non-government
agencies, consumer groups etc.) in mediat-
ing households’ access to assets and activi-
ties. The tendency among rural households
to engage in a diverse portfolio of activities
and build a diverse asset base mainly to cope
with shocks and risks and improve quality
of life was also recognized in the scheme of
analysis that Ellis had put forth. Livelihood
diversiication eventually became a powerful
analytical tool while appraising the strategies
of survival employed by poor households in
both rural and urban areas.
With the popularization of the term
‘sustainable livelihood’ and the conceptual
developments in the 1980s and 1990s in the
ields of sustainable development and sus-
tainable livelihoods, efforts were also being
made to translate the concept in opera-
tional terms. One such attempt was made
by Scoones (1998) wherein he outlined a
framework to analyse sustainable livelihoods
in terms of context, resources, strategies
and outcomes. Also there were many efforts
made to develop policy-oriented sustainable
livelihood frameworks by multilateral insti-
tutions like the United Nations Development
Programme (UNDP) and international aid
agencies like Cooperative for Assistance and
Relief Everywhere (CARE), Department of
International Development (DFID), the
UK, and Oxfam (Knutsson, 2006). These
different approaches (known as sustainable
livelihood approaches or SLAs) came to be
known as ‘asset-vulnerability frameworks’
that conceptualize poverty as a condition
wherein secure conditions of life are lack-
ing (Norton and Foster, 2001). There are
three insights into poverty which underpin
the SLA. The irst is the realization that
there is no automatic relationship between
economic growth and poverty reduction.
How the poor takes advantage of expand-
ing economic opportunities depends on
their capabilities. Second, the poor conceive
poverty not only as low incomes, but also
as poor health, illiteracy, lack of access to
2 World Commission on Environment and
Development, Advisory Panel on Food Security,
Agriculture, Forestry and Environment, Food 2000:
Global Policies for Sustainable Agriculture as qquoted
in Chambers and Conway (1991).

Understanding Livelihoods: A Review of Major Debates 3
services, vulnerability and general feeling
of powerlessness. Third, active participa-
tion of the poor is essential while designing
policies and projects for them as they are the
best judges of their situation and priorities
(Krantz, 2001). The SLA has signiicantly
inluenced the poverty reduction initiatives
of both governments and non-government
organizations (NGOs) across the globe since
the 1990s.
New visions of sustainability
It is important to keep the above concepts
and frameworks in focus while reviewing
the more recent discourses on livelihoods
in the context of India shaped as they are by
the peculiar macroeconomic conditions the
country is faced with like the decelerating
growth and manufacturing output, lack of
growth in employment, inlationary pres-
sures and increasing social, political and
environmental conflicts. Added to these
is the concern about the widening of the
disparity in the economic capability of the
households between and within rural and
urban sectors as indicated by the provisional
results of the 68th Round National Sample
Survey point.3 Earlier studies have pointed
to the acceleration of intra-state rural–urban
inequality during the 1990s, a trend that had
set in since the late 1960s. All these have
signiicant implications for livelihoods in
general, and of the poorer sections, in par-
ticular. We present in the following sections
the main strands of some the recent debates
that have highlighted the emerging chal-
lenges to the overall livelihood environment
as also the newer opportunities that have
the potential to impact the attainment of
sustainable livelihoods for the poor.
There has been an increased urge among
scholars who engage with livelihood issues
in specific geographies to press rather
for refocusing policy and programmatic
attention on the larger agenda of securing
livelihoods. An interesting stream of enquir-
ies from the Chronic Poverty Research
Programme has contributed signiicantly to
our understanding of the poverty–livelihood
interaction.4 By pursuing themes that span
the multifarious aspects of poverty—assets
and economic activities to enhancement
of human capabilities—this set of studies
tried to reappropriate the space for more
substantive discourses on sustainability
of livelihoods by interrogating the links
between poverty, employment, incomes,
hunger, food, nutrition and health. Some
of the studies under the programme sharply
brought out the criticality of the association
between capability and livelihood, especially,
in the case of marginalized sections like the
tribal population. For instance, Padhi and
Panigrahi (2011) in their assessment of
the impact of policies and programmes on
the livelihood resources of tribal people in
Odisha critique the tendency to interpret
the concept of sustainable livelihood in
material terms, that is, in terms of access
to and sustainable management of liveli-
hood resources. They argue that sustain-
able livelihood needs to be broadly deined
in terms of enhancement of capabilities,
particularly in the context of tribal people.
Considering their multiple vulnerabilities
and the hostile physical environs of their
habitation, securing subsistence incomes
alone cannot serve as an appropriate strat-
egy for the promotion of sustainable liveli-
hoods in tribal regions. A critical element
of sustainable livelihood promotion in such
regions is ‘to ensure access to institutions
3 See, the press release issued by the National Sample
Survey Ofice, Ministry of Statistics and Programme
Implementation, 2 August 2012, ‘Provisional Results
of Household Consumer Expenditure Survey of NSS
68th Round’ (July 2011–June 2012).
4 Funded by the DFID, the Chronic Poverty Research
Centre (CPRC) was founded in 2000 as an interna-
tional partnership of universities, research institutes
and NGOs. Among other themes, the research studies
within the programme explored critical aspects of
livelihoods of the populations and regions trapped in
sustained poverty. More than 50 publications have been
published on India under the programme. For details,
see http://www.chronicpoverty.org.

4 STATE OF INDIA’S LIVELIHOODS REPORT 2012
and institutional resources in general and to
social and economic services in particular’
(p. 52) and insuring against risks that arise
from malnutrition, ill health, high morbidity
and mortality.
The discourses around livelihood secu-
rity and employment in the context of the
National Rural Employment Guarantee
Act (NREGA) have, of late, come to focus
more pointedly on the issue of sustain-
ability by examining the synergies between
employment generation, asset creation,
natural resource management, especially,
management of ground water resources,
and productivity of agriculture. Creation
of sustainable rural livelihoods through
rejuvenation of the natural resource base
is an important objective of the NREGA,
secondary to the objective of provision of
supplementary wage employment to the
rural poor. Some estimates showed that
nearly 70 per cent of the works taken up
through the NREGA related to water con-
servation, water-harvesting, restoration,
renovation and desilting of water bodies,
drought-prooing, plantation and affores-
tation.5 Water conservation and harvesting
alone constituted 23 per cent of all the work
reported under the Act in 2009–2010. These
works have been considered as green jobs
in the light of their contribution to envi-
ronmental services6 and rejuvenation of the
natural resource base.
To what extent have the works under the
NREGA contributed to resource conserva-
tion and enhancement of environmental
services? Though no conclusive answers
have yet emerged, a few isolated studies
have tried to quantity the beneits of the
NREGA activities. For instance, a study led
by the Indian Institute of Science (IISc),
Bangalore, and conducted in Chitradurga
district of Karnataka, found convincing
evidence to conclude that the NREGA works
could reduce vulnerability and provide sig-
niicant environmental services, including
groundwater recharge, water percolation,
increased water storage, improved soil
fertility, reclamation of degraded lands and
carbon sequestration (Tiwari et al., 2011).
They, in turn, led to increased production
of both crops and livestock. In short, the
activities helped reduce livelihood vulner-
ability to water scarcity and poor soil qual-
ity. Another study carried out by the Indian
Institute of Forest Management, Bhopal, in
four districts of Madhya Pradesh—Panna,
Chhindwara, Dhar and Ujjain—reported
increase in irrigated area as also cropped
area under wheat and gram.7
Despite the plausibility of generating
such positive externalities under the scheme,
many point out that the nature and quality
of assets created under the water manage-
ment works have been unsatisfactory. As
Narain (2012) laments:
Investment in these assets—coming largely
through employment guarantee schemes—is
hardly ever productive. The schemes provide
jobs and do not care about the quality of the
work. Watersheds are planted with trees but
protection of trees is not ensured. The tank is
desilted, but the channels or the catchments
that bring water to the tank are not.
Analysing the data pertaining to the three-
year period 2005–2009, Bassi and Kumar
(2010) too have noted a decline in works
related to water conservation. They also
found that up to 2009 only 26 per cent of the
works could be completed by spending 65
per cent of the earmarked funds. The under-
performance of the scheme has largely been
5 Keynote address by Rita Sharma, Secretary,
Ministry of Rural Development, at the symposium
on the NREGA for Water Management organized by
Overseas Research Foundation, New Delhi, 30 October
2009. See, Observer Research Foundation (2010). 6 Environmental services include recharging
groundwater, increasing rain water percolation, con-
serving water, increasing the area irrigated, reducing
soil erosion, increasing soil fertility, conserving biodi-
versity, reclaiming degraded crop and grazing lands,
enhancing the supply of leaf manure, fuel wood and
non-wood forest produce, and carbon sequestration.
See Tiwari et al., 2011.
7 www.nrega.nic.in/presentations/MRD%2013july.
ppt

Understanding Livelihoods: A Review of Major Debates 5
attributed to the neglect of local speciicities
with respect to socio-economic and hydro-
logical factors while deciding on the works.
The Mid-term Appraisal of the Eleventh Five
Year Plan endorsed this argument when it
pointed out the following:
Experience thus far suggests that the quality of
work undertaken under MGNREGA has yet
to come up to expectations both in terms of
PRI involvement and also in terms of the tech-
nical soundness of design. Work priorities in
many states tend to follow orders from the
state or district level rather than relecting the
needs and aspirations of the community. The
required technical input is also inadequate.
(Planning Commission, 2011: 255)
There is a general consensus, however,
that the scheme has the potential to produce
signiicant spillover beneits provided the
government invests in developing ways to
improve the quality and impact of works
under the scheme. Thus, by incorporating
scientiic inputs in planning of works at the
local level (Bassi and Kumar, 2010) or bridg-
ing the incentive deicit inherent in common
pool resources (Shah, 2009) the scheme can
be made to enhance its performance.
Climate change implications
The relationship between weather and agri-
culture has emerged as an important area of
research in recent years thanks to the height-
ened concern globally about climate change.
Still an evolving area of research, climate
change studies, especially, in agriculture,
underscores the signiicance of strengthen-
ing the ecological foundations of livelihood
activities. Though the many dimensions of
climate change vulnerability are not fully
uncovered yet in India, the available studies
indicate shifts in many critical ecological–
environmental phenomena in terms of both
space and time. The larger debate has been
around the likely impact of climate change
on agriculture, the sector that supports
livelihoods of majority of the population
in the country. The dependence of Indian
agriculture on weather is signiicant in that
more than 60 per cent of the cropped area in
the country relies on rainfall. Panda (2009)
quotes several studies that have discussed
and demonstrated climate change induced
shifts in livelihood environments. Ninan
and Bedamatta (2012) have provided some
insights into the plausible changes that cli-
mate change can effect in the agricultural
system:
Over the last few years, the Chhattisgarh
region received less than its share of pre-
monsoon showers in May and June. These
showers are important to ensure ade-
quate moisture in ields being prepared for
paddy cultivation. Agriculture will be worst
affected in the coastal regions of Gujarat
and Maharashtra, where agriculturally fer-
tile areas are vulnerable to inundation and
salinisation. Standing crops in these regions
are also more likely to be damaged due to
cyclonic activity. In Rajasthan, a rise in
temperature by 2°C was estimated to reduce
production of pearl millet by 10–15 per cent.
Madhya Pradesh, where soyabean is grown
on 77 per cent of all agricultural land, could
ironically beneit from an increase in carbon
dioxide in the atmosphere…. However, if this
increase in carbon dioxide is accompanied
by an increase in temperature, as expected,
then soyabean yields could actually decrease.
(pp. 2–3)
Mitigating the ill-effects of climate
changes, however, is riddled with contradic-
tions as the strategies used for mitigation
may come into conlict with the livelihoods
of people (Dev, 2011). Thus, measures that
reduce greenhouse gas emissions may end
up destabilizing the agricultural practices
followed by small and marginal farmers
and livelihoods of poor dairy producers.
Similarly, afforestation programmes will
result in reclamation of degraded land and
control soil erosion which may intensify the
competition for cultivable land and eventu-
ally threaten food security.
Conlicts and livelihoods
A renewed vigour is visible in recent years
in the debates around complex interrela-
tions between conlicts and livelihoods in
India thanks to continuous media attention,

6 STATE OF INDIA’S LIVELIHOODS REPORT 2012
systematic research efforts and the vigilant
activism of environment protection groups.
Ohlsson (2000) had argued that liveli-
hood conlicts arise from the coexistence
of populations facing livelihood loss due
to environmental destruction or unsus-
tainable development initiatives around
agriculture and industry and the growing
scarcity of healthy, productive ecosystems.
In the case of India, such conflicts also
relect the peculiar livelihood dilemmas
have emerged in regions where human
livelihood clashes with industrialization
strategies, animal habitats, biodiversity or
ecological sensitivity as it has happened
in Odisha, Assam, the Western Ghats or
the Sundarbans. In the case of Kaziranga
National Park, the environmentalists and
animal rights activists have been demanding
shutting down of quarries that are operat-
ing illegally within the eco-sensitive zone
in the Park, even as they serve as a major
source of livelihoods for the people in the
region in the absence of other income earn-
ing opportunities in the public and private
sectors (Choudhury, 2012). However, the
quarries are known to destroy paddy ields
and disturb wild animals as well as threaten
animal conservation efforts which in turn
affects tourism industry adversely. Thus,
there are larger long-term implications
of such development impasses for access
to sustained livelihood opportunities for
future generations.
Political conlicts and internecine wars
have remained a major source of livelihood
crisis in many regions in India. Ethnic con-
licts in the North East, the spread of armed
political action groups in states like Andhra
Pradesh, Chhattisgarh, Odisha, West Bengal
and Maharashtra and cross-border disputes
states like Jammu and Kashmir have all led
to livelihood crises largely affecting the mar-
ginalized populations. Newer evidences have
emerged in recent years that reinforce the
close association between conlicts, violation
of basic human rights, degradation of liveli-
hood opportunities and endemic poverty. A
study by Kumar et al. (2011) has argued that
ethnic conlicts in Manipur have increased
poverty both directly and indirectly:
Directly, since conlict is usually associated
with massive destruction, loss of property and
mass internal displacement. And indirectly,
because of fear or paranoia: people prefer not
to go back to their original homes. They stay
as underprivileged outsiders in other areas
rather than risking their lives. (p. 77)
Though conflicts cannot exhaustively
explain poverty, ‘the fight over scarce
resources and the attempt to maintain a
monopoly has in some ways provided the
immediate trigger for conlict’ (ibid.).
The enquiries into the causes of the
spread of activities of the Communist
Party of India (Maoist) in the country have
unequivocally linked the lack of security
and sustainability of livelihoods of the
Dalit–adivasi populations who have a larger
concentration in these regions. The Expert
Group (Government of India, 2008) that
looked into the development challenges in
extremist-affected regions acknowledged
that landlessness, lack of access to forests
and other common pool resources and
limited employment opportunities coupled
with illiteracy/low education and political
marginalization have created conditions
conducive to discontent among the people
and spread of extremist political groups. A
body of critique also exists which explicitly
attributes the ‘intensiication of uprisings
in the forested and indigenous regions’
to the exploitation of forest resources by
indigenous and multinational businesses
eyeing to make proits from mining and
aided by the state (Duara, 2011; Jason and
Carney, 2010).
The larger issue that still remains is
regional concentration of poverty. Studies
that have used different conceptual tools
have come to broadly similar conclusions
with respect to this phenomenon. The
‘Report on the Status of Food Insecurity in
Rural India 2008’, brought out by the World
Food Programme and M. S. Swaminathan
Research Foundation, has identiied Bihar,

Understanding Livelihoods: A Review of Major Debates 7
Odisha, Madhya Pradesh and Maharashtra
as the six most insecure states (M. S.
Swaminathan Research Foundation and
World Food Programme, 2008). According
to the Livelihood Status Index (LSI) devel-
oped by Rai, Sharma, Sahoo and Malhotra
(2008) for the different agro-climatic
regions, most of the tribal regions in Bihar,
Madhya Pradesh and Odisha (along with
the North East states) fall under the category
of low livelihood status. The LSI is worked
out in this study as a composite index of
six sub-indices pertaining to the status of
infrastructure, agriculture, nutrition, eco-
nomic development, health and sanitation
and availability of food. It is to be noted that
almost all the states that fall within the agro-
climatic region, Eastern Hills and Plateau
were found to have low livelihood status.
The study also observed that out of the 127
districts that experience low agricultural
productivity, 103 fall under the low liveli-
hood status region, reiterating the critical
links between degraded agriculture, rural
poverty and livelihood insecurity.
Importantly, the debates above have
served to extend the horizons of the liveli-
hood discourse by reclaiming the focus on
elements like security and sustainability.
Also, they have formed the critical intel-
lectual base that informs the action and
advocacy around a rights-based approach
to livelihoods in India.
Small producers and market integration
The policy perception about the poor as
being located outside the sphere of market
transactions and hence requiring consistent
state patronage has been modiied over the
past years. The new development prescrip-
tions increasingly have brought the poor
and their livelihood activities closer to the
market. This is relected in the burgeon-
ing literature on themes like smallholder
integration in agricultural markets or, at a
larger level, on the interaction between local
and global production systems, especially
in the context of the poor and developing
countries. Many studies have reafirmed the
critical role of small and marginal farmers
(who constitute close to 80 per cent of the
country’s agriculture) in fostering the sec-
tor’s growth apart from food security and
livelihood sustainability (Dev, 2012). The
view that market-focused reform measures
alone cannot help poor primary producers
minimize their risks and maximize returns
has gained increasing support from many
of these studies. Proactive government
intervention is necessary for enabling these
producers to tackle production and market
risks. Typically, small and marginal farm-
ers face problems that include uneconomic
size of land holdings; lack of market power
and susceptibility to exploitation by inter-
mediaries; lack of access to formal debt and
resultant undercapitalization of farming
activity; inadequate extension support, espe-
cially, with respect to scientiic information,
training and technology etc.; lack of access
to electricity, irrigation, other communica-
tion facilities (Mahajan and Gupta, 2011;
NCEUS, 2008). With acceleration in the
commercialization of agriculture, deinite
state programmes and policies would be
necessary to provide such farmers with ‘a
level playing ield with large farms in terms
of accessing land, water, inputs, credit, tech-
nology and markets’ (Dev, 2012: 2).
The other set of debates relates to
globalization and market integration of
manufacturing and service enterprises.
The two decades since the reform meas-
ures were introduced in India, the country
has witnessed a progressive trend towards
both an expansion of domestic economic
activities and their integration with global
production systems and markets. Though
such integration was the most visible in
technology-intensive production activi-
ties, sectors like agriculture too have come
under the influence of global economic
imperatives thanks to the convergence
of regulatory regimes across nations, a
process championed by supranational
bodies, like the World Trade Organization

8 STATE OF INDIA’S LIVELIHOODS REPORT 2012
(WTO), which oversee the structuring and
implementation of international trade and
investment agreements.
An important fallout of the strengthening
of new global governance arrangements has
been the circulation of a set of standards of
production and processing as the necessary
benchmarks required to access international
markets. Without such standards, it is
argued, participation in the global economy
may not bring any beneits to the poor coun-
tries as they would tend to compete on the
strengths of ‘paying low wages, disregarding
labour and environmental standards, cutting
corners in the production process and avoid-
ing taxation’ (Schmitz, 2004: 1). Such adverse
incorporation in the global value chains is
most likely in the case of smaller irms and
informal enterprises. Also, the vulnerability
of the poor workers at the lower rungs of the
global networks tends to increase.
Rising formal employment in upgraded
irms is complemented by the use of casual,
contract and other such forms of irregular
employment that is poorly paid, and without
social security. Evidence was found of lex-
ible employment practices being introduced
even among the regular workforce. Proits
for upgraded supplier irms have risen and
wages for core workers in these irms have also
risen, while those irms continuing in the low
value-added segments of product markets,
or in lower tiers of global supply chains have
more modest proits and pay lower wages
to workers with poor working conditions.
(Posthuma and Nathan, 2010)
Standards, as per the above argument, are
‘essential instruments for blocking the race
to the bottom and nudging enterprises from
the low to the high road of competitiveness’
(ibid.: 12). In other words, they are essential
for local enterprises to ‘upgrade’ economi-
cally and socially. Economic upgrading
relates to four aspects of production—
process upgrading, product upgrading,
function upgrading (change in position of
irms in the value chain like from assembly
to manufacturing to design and to branding)
and chain upgrading or moving to a new
chain altogether (Kaplinsky and Farooki,
2010). Social upgrading on
the other hand refers to ‘processes which
enhance the quality of employment for work-
ers, such as improved working conditions,
skills acquisition, or higher earnings. It also
involves the enhancement of social protection
and workers’ rights, particularly the more
vulnerable categories of workers including
women, children, migrants, and low-skilled
workers. (Posthuma and Nathan 2010: 5)
The gap between economic and social
upgrading can eventually be bridged only
through building firm-level capabilities,
designing appropriate sectoral policies
and innovation trajectories, labour skill
upgradation and introducing standards
and benchmarks. These debates around
standards and upgrading are converging
steadily towards evaluating and enhancing
the capabilities of developing nations to
capture the gains from global production
and market integration.
Even as the advocates of a global market
driven development strategy deliberate on
the issue of labour standards, the level of
employment in the country has remained a
cause of serious concern. In his analysis of the
employment data published by the National
Sample Survey Organsiation (NSSO) per-
taining to 2009–2010, Chowdhury (2011)
showed that there was a near stagnation in
the size of workforce in India since the mid
2000s. However, labour productivity grew
substantially—more than 34 per cent—
during this period. It is worth noting that as
per the Global Employment Trends 2012 pub-
lished by the International Labour Ofice, the
overall robust growth experienced by south
Asia during the 2000s was largely the result
of ‘a rapid rise in labour productivity rather
than an expansion in employment’ (p. 68).
The other disturbing trend is the decline in
female labour force participation across age
groups since the mid-2000s from 49.4 per cent
to 37.8 per cent in the case of rural women
and from 24.4 per cent to 19.4 per cent for
urban women.

Understanding Livelihoods: A Review of Major Debates 9
Such indings have given rise to wide-
spread apprehensions as to whether the
lexibilization–informalization paradigm
made popular as part of the reform agenda
is actually benefiting the labour. Lerche
(2012) argues that
in India the conditions of work and pay
are not improving for informalized labour.
Labour inds itself in a very weak bargaining
position, while government and employ-
ers push for further informalization. Social
loor policies do exist, especially NREGA,
but so far their impact on informal workers
is patchy. (p. 27)
The army of informal workers has also been
differentiated through the process of reform
to include not only the classic wage labour
but also another distinct class of labour
who possess some means of production
but have to ‘alternate between being wage
workers and small-scale petty commodity
producers in the precarious and insecure
informal sector seasonally or throughout
their lifetimes’ (p. 18).
The continuing discourse on increas-
ing informalization of work have come to
highlight some critical questions:
1. Whether and how far do decent work
standards ensure better working condi-
tions of informal workers in the absence
of collective political action on the part
of labour?
2. Do the targeted social policies alone will
lead to strengthening of the voices of
informal workers?
3. Are the current definitions of infor-
mal work and workers good enough
to capture the complex dynamics of
the emerging production and labour
arrangements as also labour market
inequalities?
Technology and innovation
India has a fairly elaborate infrastructure in
science and technology and has one of the
world’s largest stock of technical manpower
(World Bank, 2000). But only about 6 per
cent of this manpower pool is engaged with
rural and agricultural activities.8 The train-
ing infrastructure in rural technology mainly
involves the advanced training centres
attached to State Agricultural Universities,
the National Centre for Management of
Agriculture Extension, regional rural tech-
nology centers and community polytech-
nics. The Indian Council of Agricultural
Research (ICAR) and the Council for
Scientiic and Industrial Research (CSIR)
form the cornerstones of the research and
development system, though many other
players like central government institutions,
universities and colleges, district rural devel-
opment agencies, district industry centres,
state S&T councils and private industries
also from part of R&D activities. When it
comes to linking this elaborate system with
rural development activities, the experience
of the country has not been impressive. Also
the role of technology and innovation in
supporting sustainable livelihoods for the
poor has received scant attention in public
debates. On the other hand, the efforts of
those institutions in the non-state sector
that are committed to technology dissemi-
nation in the rural sector are constrained
by infrastructural bottlenecks in terms of
training, investment funds and marketing.
The poor and illiterate communities they
work with cannot be expected to scout for
technological solutions to improve their
livelihood situation and enhance incomes
from activities like agriculture and animal
husbandry. There is critical dearth of inter-
mediary institutions that can match the
sources of technologies with rural producers
after suitable adaptations.
Notwithstanding the gaps in making the
S&T system work for livelihoods, innovation
and technology are increasingly seen as part
of the debates on sustainable development.
8 http://www.tifac.org.in/index.php?option=com_c
ontent&view=article&id=417&Itemid=205&limitstart
=2 (accessed on 24 August 2012).

10 STATE OF INDIA’S LIVELIHOODS REPORT 2012
Speciically, inclusive innovation—inno-
vation that helps improve the productivity
and livelihoods of people in the informal
economy and the excluded populations to
claim their share in growth—has become
an integral component of the debates and
action programmes on sustainable growth
globally spearheaded mainly by the World
Bank Institute. The agenda of inclusive
innovation has received a boost in India with
the setting up of the National Innovation
Council and the declaration of 2010–2020 as
the Decade of Innovation. The other major
step in the direction of promoting innova-
tion is the proposed Inclusive Innovation
Fund to ‘drive and catalyse the creation of an
ecosystem of enterprise, entrepreneurship,
and venture capital, targeted at innovative
solutions for the bottom of the pyramid’.9
The concept grassroots innovation too
has received some policy attention as inno-
vation aimed at alleviating poverty based on
local and traditional knowledge systems and
its application (Gupta, 2012). It is argued
that apart from strengthening the capabili-
ties of poor people, the promotion of such
innovation would involve development of
robust incentives, policies and institutional
infrastructure.10
Synergy of partnerships
The various discourses reviewed in the previ-
ous sections point towards the urgent need
for sensitive strategies and concerted action
with a view to create conditions necessary
for triggering and sustaining a social and
economic order based on the values of equity
and distributive justice. The intellectual exer-
cises over the last couple of decades around
livelihoods have generated and popularized a
host of concepts and frameworks. The crucial
question is which of them would be the most
appropriate and eficient to develop strategies
to effect actions. One idea that has caught the
fancy of all is partnership. As different from
the earlier discourses that focused on the
role of distinct agents like the state, non-state
and private sectors in fostering livelihoods,
the new emphasis is on alliances—among
government agencies, industry associations,
private corporates, civil society organiza-
tions and worker/producer organizations.
The policy prescriptions both at the national
and provincial levels are increasingly being
driven by an implicit belief in the potential
inherent in such partnerships—especially
between the government and the private
sector players—in meeting the gaps in the
provision of basic services, including social
sector services. Public private partnership
(PPP) is deined as
an approach under which services are
delivered by the private sector (non-proit/
for-proit organizations) while the responsi-
bility for providing the service rests with the
government. This arrangement requires the
government to either enter into a ‘contract’
with the private partner or pay for the services
(reimburse) rendered by the private sector.
(Government of India, 2004: 1)
While PPPs are incorporated as part of
the approach of programmes that are
designed to have country-wide footprint
like the NRLM and National Agricultural
Implementation Programme, several sec-
toral programmes (health, livelihoods, skill
development) are being implemented in the
PPP mode at the state level too.11
Conclusion
The recent debates on livelihoods span
a diverse array of issues reflecting the 9 http://www.innovationcouncil.gov.in/index.
php?option=com_content&view=article&id=52&Ite
mid=34 (accessed on 24 August 2012).10 Anuja Utz and Carl Dahlman, ‘Promoting
Inclusive Innovation’. Available at http://siteresources.
worldbank.org/SOUTHASIAEXT/Resources/223546-
1181699473021/3876782-1191373775504/indiainnova-
tionchapter4.pdf (accessed on 26 August 2012).
11 Such partnerships have been tried in the imple-
mentation of midday meal schemes; Sarva Siksha
Abhiyan; Integrate Child Development Scheme;
national-level programmes to control blindness; and
diseases like tuberculosis, cancer and AIDS.

Understanding Livelihoods: A Review of Major Debates 11
complexities that have come to characterize
the livelihood environment and the
vulnerability of the poor and assetless
households. By no means the debates that we
have delineated above can be said to present
an exhaustive overview of the existing and
emerging perspectives on livelihoods. They
only represent some of the dominant themes
the understanding of which would help
appreciate the magnitude of the challenges
before political agents, policymakers,
researchers and activists.
References
Bassi, Nitin and M. Dinesh Kumar. 2010. ‘NREGA and
Rural Water Management in India: Improving
the Welfare Effects’, Occasional Paper No. 3-0910,
September, Institute for Resource Analysis and
Policy, Hyderabad.
Chambers, R. and G. R. Conway. 1991. ‘Sustainable
Rural Livelihoods: Practical Concepts for the
21st Century’, Discussion Paper 296, Institute of
Development Studies, Brighton.
Choudhury, Ratnadip. 2012. ‘Kaziranga: Where the
Wild Things Were’, Tehelka, 9(19), 12 May.
Chowdhury, Subhanil. 2011. ‘Employment in India:
What does the Latest Data Show?’, Economic and
Political Weekly, 46(32): 23–26.
Dev, S. Mahendra. 2011. ‘Climate Change, Rural
Livelihoods and Agriculture (focus on Food
Security) in Asia-Paciic Region’, WP-2011-014,
August, Indira Gandhi Institute of Development
Research, Mumbai.
———. 2012. ‘Small Farmers in India: Challenges and
Opportunities’, WP-2012-014, June, Indira Gandhi
Institute of Development Research, Mumbai.
Duara, Prasenjit. 2011. ‘The Chinese Revolution and
Insurgent Maoism in India: A Spatial Analysis’,
Economic and Political Weekly, 46(18): 33–36.
Ellis, Frank. 1998. ‘Household Strategies and Rural
Livelihood Diversification’, The Journal of
Development Studies, 35(1): 1–38.
———. 1999. ‘Rural Livelihood Diversity in Developing
Countries: Evidence and Policy Implications’,
Natural Resource Perspectives, No. 40, Overseas
Development Institute, London. Available at
http://www.odi.org.uk/resources/docs/2881.pdf
(accessed on 21 August 2012).
Government of India. 2004. ‘Report of the PPP Sub-
Group on Social Sector: Public Private Partnership’,
November, Planning Commission, New Delhi.
———. 2008. Development Challenges in Extremist
Affected Areas, Report of an Expert Group to
Planning Commission, Government of India,
New Delhi.
Gupta, Anil K. 2012. ‘Science and Technology for
Inclusive Social Development in 12th Five Year
Plan’, Working Paper No. 2012-06-03, June,
Indian Institute of Management, New Delhi.
International Labour Ofice. 2012. Global Employment
Trends 2012: Preventing a Deeper Job Crisis.
Geneva: ILO.
Jason, Miklian and Scott Carney. 2010. ‘Fire in the
Hole’, Foreign Policy, September–October 2010.
Kaplinsky, Raphael and Masuma Farooki. 2010. ‘What
Are the Implications for Global Value Chains
When the Market Shifts from the North to the
South?’, Policy Research Working Paper 5205,
February, The World Bank, Washington D.C.
Knutsson, Per. 2006. ‘The Sustainable Livelihoods
Approach: A Framework for Knowledge
Integration Assessment’, Human Ecology Review,
13(1): 90–99.
Krantz, Lasse. 2001. ‘The Sustainable Livelihood
Approach to Poverty Reduction: An Introduction’,
February, Division for Policy and Socio-Economic
Analysis, Swedish International Development
Cooperation Agency.
Kumar, Anand, Kamei Aphun, Khuraijam Bijoykumar
Singh and Homen Thangjam. 2011. ‘Situating
Conlict and Poverty in Manipur’, CPRC-IIPA
India Working Paper No. 37, Chronic Poverty
Research Centre, Indian Institute of Public
Administration, New Delhi.
Lerche, Jens. 2012. ‘Labour Regulations and Labour
Standards in India: Decent Work?’, Global Labour
Journal, 3(1): 16–39.
Mahajan, Vijay and Rajiv Kumar Gupta. 2011. ‘Non
Farm Opportunities for Smallholder Agriculture’,
paper presented at the Conference on New
Directions for Smallholder Agriculture, 24–25
January, International Fund for Agricultural
Development, Rome.
M. S. Swaminathan Research Foundation and World
Food Programme. 2008. The Report on the Status of
Food Insecurity in Rural India. Chennai, MSSRF.
Narain, Sunita. 2012. ‘Six Sins that Make Drought
Invincible’, Down to Earth, 31 May.
NCEUS (National Commission for Enterprises in the
Unorganised Sector), Government of India. 2008.
Report on Conditions of Work and Promotion of
Livelihoods in the Unorganised Sector. New Delhi:
Academic Foundation
Ninan, K. N. and Satyasiba Bedamatta. 2012. ‘Climate
Change, Agriculture, Poverty and Livelihoods: A
Status Report’, Working Paper 277, Institute of
Social and Economic Change, Bangalore.
Norton, Andy and Mick Foster. 2001. ‘The Potential
of Using Sustainable Livelihoods Approaches
in Poverty Reduction Strategy Papers’, Working
Paper 148, July, Overseas Development Institute,
Centre for Aid and Public Expenditure, London.
Observer Research Foundation. 2010. ‘NREGA for
Water Management: Symposium Proccedings’,
ORF Seminar Series, 1(4), January, Overseas
Research Foundation, Delhi.
Ohlsson, Leif. 2000. ‘Livelihood Conlicts—Linking
Poverty and Environment as Causes of Conlict’,

12 STATE OF INDIA’S LIVELIHOODS REPORT 2012
Environmental Policy Unit, Swedish International
Development Agency (SIDA), Stockholm.
Panda, Architesh. 2009. ‘Assessing Vulnerability to
Climate Change in India’, Economic and Political
Weekly, 44(16): 105–107.
Padhi, Sakti and Nilakantha Panigrahi. 2011. ‘Tribal
Movements and Livelihoods: Recent Developments
in Orissa’, CPRC-IIPA Working Paper 51, Chronic
Poverty Research Centre, Indian Institute of Public
Administration, New Delhi.
Planning Commission. 2011. Mid-term Appraisal:
Eleventh Five Year Plan 2007–12. New Delhi: Oxford
University Press.
Posthuma, Anne and Dev Nathan. 2010. ‘Introduction:
Scope for Aligning Economic and Social Upgrading
within Global Production Networks in India’, in
Anne Posthuma and Dev Nathan (eds), Labour
in Global Production Networks in India, pp. 1–33.
New Delhi: Oxford University Press.
Rai, Anil, S. D. Sharma, Prachi Misra Sahoo and P. K.
Malhotra. 2008. ‘Development of Livelihood
Index for Different Agro-Climatic Zones of
India’, Agricultural Economics Research Review,
21, July–December: 173–182.
Schmitz, Hubert. 2004. ‘Globalized Localities:
Introduction’, in Hubert Schmitz (ed.), Local
Enterprises in the Global Economy: Issues of
Governance and Upgrading, pp. 1–19. Cheltenham,
UK: Edward Elgar Publishing.
Scoones, Ian. 1998. ‘Sustainable Rural Livelihoods: A
Framework for Analysis’, IDS Working Paper 72,
Institute of Development Studies, Brighton.
Shah, Tushar. 2009. ‘Money for Nothing—Cash
Transfer is a Flawed Alternative to NREGS’, The
Times of India, 5 November, Delhi Edition.
Solesbury, William. 2003. ‘Sustainable Livelihoods: A
Case Study of the Evolution of DFID Policy’, IDS
Working Paper 217, Institute of Development
Studies, Sussex.
Tiwari, Rakesh, H. I. Somashekhar, V. R. Ramakrishna
Parama, Indu K. Murthy, M. S. Mohan
Kumar, B. K. Mohan Kumar, Harshad Parate,
Murari Varma, Sumedha Malaviya, Ananya
S. Rao, Asmita Sengupta, Ruth Kattumuri,
and N. H. Ravindranath. 2011. ‘MGNREGA
for Environmental Service Enhancement and
Vulnerability Reduction: Rapid Appraisal in
Chitradurga District, Karnataka’, Economic and
Political Weekly, 46(20): 39–47.
United Nations and Asian Development Bank.
2012. Green Growth, Resources and Resilience:
Environmental Sustainability in Asia and the
Pacific, UN and ADB, Bangkok.
World Bank. 2000. ‘Scientiic and Technical Manpower
Development in India’, Report No. 20416-IN,
August, Education Sector Unit, South Asia
Region. Available at http://www-wds. world-
bank.org/ servlet/ WDSContentServer/ WDSP/
IB/ 2000/10/21/000094946_00100705334540/
Rendered/PDF/multi_page.pdf (accessed on 25
August 2012).
———. 2010. India’s Employment Challenge: Creating
Jobs, Helping Workers. New Delhi: Oxford
University Press.

Introduction
To address the overwhelming livelihood chal-
lenge being faced by the densely populated
dense nation, i.e., India, the government
has allocated large resources for supporting/
generating livelihoods of the poor through
programmes such as the Mahatma Gandhi
National Rural Employment Guarantee
Scheme (MGNREGS) and National Rural
Livelihood Mission (NRLM) among oth-
ers. Large special purpose institutions like
Society for Elimination of Rural Poverty
(SERP) and Gujarat Livelihood Promotion
Company (GLPC) have been created to
support the livelihoods of the poor. Non-
government organizations (NGOs) like
PRADAN, MYRADA, BAIF and multilat-
eral agencies like the World Bank have also
started focusing on livelihood promotion
and support. Further, except for this current
year, the Indian economy has been growing
at a fairly high rate of about 8 per cent per
annum, and even after this current slow-
down, continues to remain one of the fastest
growing economies of the world.
However, in spite of these concerted
efforts, livelihoods for the poor are faced
with major challenges in the form of poor
monsoon and its consequent slowing down
of the economy, and especially of the manu-
facturing sector which generated livelihoods
in large numbers. The weakening value of the
rupee, resulting from this has led to higher
cost of petroleum products and, hence, of
transport, in turn leading to higher rate of
inflation, especially food inflation. Added
to this is the inadequacy of the government
to handle the current crisis, aggravated by
increasing allegations of corruption and
worsening political manoeuvring inher-
ent in coalition politics in the face of the
impending 2014 general elections.
The question that comes up here, there-
fore, is whether the livelihoods of the poor
have really improved? This is the question
that has been explored in this chapter. The
first part of the chapter describes how the poor
are making both ends meet while the second
part highlights some of the challenges they
are faced with.
We are a nation of 1.2 billion people,
projected to grow to 1.4 billion by 2026.
It is estimated that there will be roughly
300 million (National Commission on
Population, 2006) more Indians in the age
group 15–59 who would be looking for
livelihoods. One school of thought believes
that this projected ‘demographic dividend’
wherein 25 per cent of the global labour
force (Team Lease and IIJT, 2009) would
comprise of Indians, is a tremendous oppor-
tunity and a potential source of benefit.
However, the question that still remains
is how, at that point, would we deploy the
additional 300 million Indians? It is a trou-
bling question considering that at current
Livelihoods of People: How the Poor Are
Making Both Ends MeetSANKAR DATTA*
Chapter 2
* With research support from Anita Dixit, Consultant, Knowledge Resource Center, Azim Premji Foundation;
and Arunabha Bhattacharya, Research Associate, Azim Premji University.

14 STATE OF INDIA’S LIVELIHOODS REPORT 2012
rates alone an estimated 40 million1 people
in India will remain unemployed at the end
of this year (http://www.ibef.org/download/
IndiaNewOpportunity.pdf).
This is a question worrying policy-
makers, civil society organizations, bankers,
academicians and all the stakeholders in the
establishment—how do we address the chal-
lenge of providing livelihood opportunities
for this large populace and alleviate the
lot of the millions living in conditions of
abject poverty and deprivation which, if not
addressed, could have deep social, political
and economic consequences.
According to the United Nations
Development Programme (UNDP) 2010
data, an estimated 37.2 per cent Indians (or
some 450 million people) live below the
country’s national poverty line. The govern-
ment uses the poverty line formulated by the
Tendulkar Committee—a special commit-
tee formed under the Planning Commission
to estimate the poverty line—which is close
to the World Bank’s ‘below poverty’ bench-
mark of US$1.25 per day on a purchasing
power parity basis.
How are people managing their livelihoods?
Data regarding people engaged in different
sectors and the kind of income they gener-
ate from those sectors as reflected by the
percentage of gross domestic product (GDP)
contributed by the sector is present in the
Employment and Unemployment Survey,
National Sample Survey Organisation
(NSSO), Ministry of Statistics and
Programme Implementation and National
Accounts Statistics (NAS). However, though
GDP estimates for the years 2010–2011 and
2011–2012 have been worked out, the lat-
est figures of labour engaged were available
only for 2009–2010. Thus, Table 2.1 gives
engagement of labour and their incomes
for 2009–2010.
It can be seen from the data in Table 2.1
that more than 50 per cent of the labour
force (or 68 per cent of the rural labour
force) is still engaged in agriculture and
allied activities, which generate some of the
lowest incomes per capita (`29 thousand
per annum only). On the other hand,
Table 2.1: Distribution of labour force earning their livelihoods from different sectors (2009–2010)
Industry
GDP 2009–
2010 in ` bn
% of
GDP
Labour force
participation
% of people
employed
Per capita
GDP in `Agriculture, forestry and fishing 6,625 15 226 53.2 29,371
Mining and quarrying 1,042 2 3 0.6 409,689
Manufacturing 7,197 16 47 11 154,316
Electricity, gas and water supply 883 2 1 0.3 693,915
Construction 3,557 8 41 9.6 87,391
Trade, restaurants and
hotels, transport, storage and
communications
11,972 27 64 15.1 186,994
Finance, insurance, real estate and
business services
7,699 17 9 2.1 864,648
Community, social and personal
services, public admin, defence and
other services
6,101 14 35 8.2 175,476
Total 45,076 100 424 100 106,312
Source: Compiled from Employment and Unemployment Survey, NSSO, Ministry of Statistics and Programme
Implementation, New Delhi for the period 1999–2010, Government of India, National Accounts Statistics. Available
at www.mospi.nic.in
1 http://www.onemint.com/2010/11/10/indias-
unemployment-rate-stands-at-9-4/

Livelihoods of People: How the Poor Are Making Both Ends Meet 15
some sectors like financing, insurance, real
estate and business services generate `865
thousand per annum, but only 2.1 per
cent of the labour force depends for their
livelihoods on these. The two other sectors
providing livelihoods to large numbers,
namely Trade, Restaurants and Hotels,
Transport, Storage, and Communications
(employing 15.1 per cent of the labour force)
and Manufacturing (employing 9.6 per cent
of the labour force) generate an average
annual income of `187 thousand and `154
thousand only (see Figure 2.1).
The other two large income generating
sectors, Electricity, Gas and Water Supply
and Mining and Quarrying employ only 0.3
per cent and 0.6 per cent of the labour force
respectively. Therefore, the data reflects that
there are some sectors which have pushed up
the growth rate of India’s GDP. However,
Figure 2.1: Percentage labour force employed in various sectors and their contribution to GDP (2009–2010)
60
50
40
30
20
10
0
Comm
unity, s
ocial a
nd...
Finan
ce, I
nsura
nce, R
eal...
Trade,
Resta
urants.
..
Constructi
on
Electri
city,
gas &
wat
er...
Man
ufactu
ring
Min
ing &
Quar
ryin
g
Agricultu
re, fo
restr
y &...
% of GDP
% of people employed
Source: Compiled from Employment and Unemployment Survey, National Sample Survey Organisation, Minstry of
Statistics and Programme Implementation, New Delhi, for the period 1999–2010, Government of India, National
Accounts Statistics. Available at www.mospi.nic.in
Table 2.2: Key labour statistics—India (year)
Estimated population 1,182 million
Labour force
participation rate
359 persons out of 1,000
persons in the labour force
Estimated labour
participation
424 million
S our ce : C om p i le d f rom Em p loy m e nt and
Unemployment Survey, NSSO, Minstry of Statistics and
Programme Implementation, New Delhi for the period
1999–2010, Government of India, National Accounts
Statistics. Available at www.mospi.nic.in
Table 2.3(a): Percentage of persons employed in principal and subsidiary status taken together: Status
by industry division—rural
Year
Agri-
culture/
fishing
Mining
and
quarrying
Manu-
facturing
Electri-
city,
water
etc.
Const-
ruction
Trade,
hotel
and
restau-
rant
Tran-
sport
Financial
and
business
services
Pub adm,
educ.,
comm. serv-
ices etc.
1999–2000 76.3 0.5 7.4 0.2 3.3 5.1 2.1 0.3 4.9
2004–2005 72.7 0.5 8.1 0.2 4.9 6.1 2.5 0.5 4.5
2009–2010 68.0 0.6 7.2 0.2 9.4 6.4 2.9 0.6 4.8
Source: Compiled from Employment and Unemployment Survey, NSSO, Ministry of Statistics and Programme
Implementation, New Delhi for the period 1999–2010, Government of India, National Accounts Statistics. Available
at www.mospi.nic.in
they do not provide the basis of livelihoods
for large numbers (see Table 2.2).
The following Tables 2(a), 2(b) and 2(c)
suggest that growth in livelihoods has been
skewed in sectoral terms.
It can be seen from the above tables that
l The rural economy continues to remain
heavily dependent on agriculture and

16 STATE OF INDIA’S LIVELIHOODS REPORT 2012
allied activities, with the role of agricul-
ture and fishing as employment options
not having changed much over the last
10 years, declining from 76 to 68 per
cent between 1999 and 2010 (see Table
2.3[a]).
l However, agriculture has remained a
laggard with respect to the rest of the
economy both in terms of providing
livelihood opportunities as well as in
boosting it. This is a cause for worry
considering that agriculture remains
the largest employer—in terms of both
total people engaged and number of
people employed as a percentage of the
workforce—with a declining percentage
share in the overall GDP from 25 per cent
to 17.8 per cent.
l Growth in manufacturing which is
important to boost the economy2 has
Table 2.3(c): Percentage distribution of GDP by sector
Year
Agri-
culture/
fishing
Mining
and
quarrying
Manu-
facturing
Elec.,
water
etc.
Const-
ruction
Trade,
hotel
and res-
taurant
Tran-
sport
Financial
and
business
services
Pub adm.,
educ.,
community
services etc.
1999–2000 25.0 2.3 14.8 2.5 5.7 14.22 7.5 13.1 14.9
2004–2005 19.0 2.9 15.3 2.1 7.7 16.1 8.4 14.7 13.8
2009–2010 17.8 2.5 14.8 1.5 8.2 16.3 7.8 16.7 14.4
Sources: Estimated and compiled on the basis of reports of (1) Government of India (1999–20000), Employment and
Unemployment Survey, NSSO, Minstry of Statistics and Programme Implementation, New Delhi and (2) Government
of India, National Accounts Statistics. Available at www.mospi.nic.in
been on the decline. In the rural sector,
share of manufacturing in employment
has declined slightly, while the construc-
tion sector has emerged as a major source
of employment. In fact, it appears that
construction has taken over people from
the agricultural sector, both in rural
and urban areas. Further, the share of
construction in GDP has also increased,
albeit slightly. This is, thus, a sector to be
watched.
l The pattern of growth has been skewed
towards the service sector as well as
towards skill-intensive activities (finance,
insurance, real estate, transportation and
banking) which continue to pull up the
economy, but provide livelihood oppor-
tunities only for the educated and skilled
segments of the workforce. This means the
poor, who largely comprise the less skilled
and unskilled part of the workforce, con-
tinue to remain bereft of benefits accruing
from the growth in this sector.
l In the urban sector there is a slight
upward trend in availability of livelihoods
in financial sector and its share in overall
2 The Planning Commission in its Eleventh Plan
document has stated that to attain an average GDP
growth of 9 per cent over the next five years, the
manufacturing sector needs to growth by at least 12
per cent per annum.
Table 2.3(b): Percentage of persons employed in principal and subsidiary status taken together: Status
by industry division—urban
Year
Agri-
culture/
fishing
Mining
and
quarrying
Manu-
facturing
Elec.,
water
etc.
Const-
ruction
Trade,
hotel and
restau-
rant
Tran-
sport
Financial
and
business
services
Pub adm.,
educ.,
community
services etc.
1999–2000 8.8 0.8 22.7 0.7 8.0 26.9 8.7 4.1 19.5
2004–2005 8.8 0.8 24.6 0.7 8.1 24.6 8.6 5.3 18.7
2009–2010 7.5 0.6 23.0 0.6 10.2 24.3 8.7 6.7 18.5
Sources: Estimated and compiled on the basis of reports of (1) Government of India (1999–20000), Employment and
Unemployment Survey, NSSO, Minstry of Statistics and Programme Implementation, New Delhi and (2) Government
of India, National Accounts Statistics. Available at www.mospi.nic.in

Livelihoods of People: How the Poor Are Making Both Ends Meet 17
GDP, though its share in employment
in the rural sector remains negligible.
The Hotel and Trade sector has a slightly
larger share of the GDP pie than it did 10
years ago. However, as can be observed, it
does not contribute to increased employ-
ment. In fact, employment in this sector
in urban areas has actually declined
slightly, possibly indicating that it has
become more capital intensive.
Issues and considerations
Growth not translating into employment
Given the expected addition of 300 million
to the working population of the nation by
2026 (National Commission on Population,
2006), the task of keeping these people above
the poverty line would require creation of 11
million livelihoods every year.
The ‘Annual Report to the People on
Employment’, published by the Ministry of
Labour (2011), says that for so many jobs
to be added annually, which works out to a
2.5 per cent average growth in employment,
there are two conditions that must be met:
(a) the GDP must grow at 9 per cent, and
(b) the employment elasticity (the propor-
tionate change in employment after a unit
proportionate change in economic growth)
must be 0.29, as it was in the period during
1993–1994 and 2004–2005.
But where are the jobs or livelihood
options? Though there has been an increase
in the share of the industry and service sec-
tors and a decline in that of agriculture in the
overall employment scenario, they have failed
to generate sufficient employment oppor-
tunities, in turn putting a pressure on the
agriculture sector. The crux of the problem is
that though the educated and skilled workers
get employment in these sectors, there is very
real scarcity of livelihood options for the less
skilled and unskilled workers.
Historically India has been an agrarian
economy. This is especially true of rural
India with its small manufacturing sector,
and thus, a high share of agriculture based
livelihoods in the overall workforce. The
Table 2.4: Revised estimates of GDP at factor cost by economic activity (at 2004–2005
prices) in (`) billion
Industry
2009–2010
in ` mn
2010–2011
(QE)
2011–2012
(RE)
% change over previous year
2010–2011 2011–2012
Agriculture, forestry
and fishing
6,625 7,091 7,287 7.0 2.8
Mining and quarrying 1,042 1,094 1,085 5.0 –0.9
Manufacturing 7,197 7,742 993 7.6 2.5
Electricity, gas and
water supply
883 909 981 3.0 7.9
Construction 3,557 3,842 4,046 8.0 5.3
Trade and restaurants
and hotels, transport,
storage and
communications
11,972 13,305 14,628 11.1 9.9
Financing, insurance,
real estate and
business services
7,699 8,500 9,317 10.4 9.6
Community, social and
personal services, public
administration, defence
and other services
6,101 6,377 6,747 4.5 5.8
Total 4,508 4,886 5,202 8.4 6.5
Source: Ministry of Finance (2012).
share of livelihoods has continued to remain
more or less stagnant in spite of the fact that
there has been a structural change in the
share of agriculture in the GDP over the
last few decades.
So, in effect, growth in the economy
does not seem to be benefitting its largest
sector either in terms of output or in terms
of employment.
However, agriculture and allied sectors
like forestry, logging and fishing accounted
for roughly 15 per cent of the GDP in 2009–
2010 and employed approximately half of the
total workforce. Roughly 70 per cent of the
total population is dependent on this seg-
ment and despite a steady decline of its share
in the GDP, it remains the largest economic
sector and a significant part of the overall
socio-economic development of India.
Slowing economic growth
The Indian economy experienced a slow-
down in 2011. Though some sectors of the
economy kept growing, the growth rates
were generally low compared to previous
years, as can be seen in Table 2.4.

18 STATE OF INDIA’S LIVELIHOODS REPORT 2012
Construction, which employed 8 per
cent of the total workforce, grew by only
5.3 per cent as against 8 per cent growth
last year. Growth of Trade, Hotel, Transport
and Communication, which employed
around 25 per cent of the workforce, came
down from 11.1 per cent to 9.9 per cent.
Agriculture, which employed more than 50
per cent of the workforce, recorded a growth
of 2.8 per cent as compared to 7.0 per cent
last year. Manufacturing, which employed
11 per cent of the workforce, recorded a dip
in growth rate, at 2.5 per cent as compared
to 7.6 per cent last year. Mining and quar-
rying, which employs roughly 0.6 per cent
of the total workforce and which grew by 5
per cent in 2010–2011, has recorded a nega-
tive growth of 0.9 per cent, thereby, being
a major contributing factor in lowering the
overall GDP growth rate.
GDP growth slowed down in financial
year (FY) 2011 as industrial and investment
activity slumped and the current account
deficit (current expenditure which could
not be financed by current revenue) wid-
ened. Data released by the Central Statistical
Organisation (CSO) on 31 May 2012 shows
that GDP growth has slumped to 6.5 per
cent, the lowest since 2002–2003 (a drought
year), when growth rate of GDP fell to 4.1
per cent. With the exception of the electric-
ity, gas and water supply sector, which grew
by 7.9 per cent in 2011–2012 compared to
3 per cent in 2010–2011, and community,
social and personal services, where growth
was marginally higher in 2011–2012 as
compared to 2010–2011, all the sectors in
the Indian economy grew at a slower pace
in 2011–2012.
A paper (Alkire and Santos, 2010) pub-
lished by the Oxford Poverty and Human
Development Initiative (OPHI) in 2010
states that eight Indian states together have
a larger population below the poverty line
(BPL) than the entire population of the 26
poorest African nations combined—a very
disturbing fact that clearly indicates the
livelihood challenges of the poor. Thus, if
this slowdown in the rate of growth of the
economy continues or worsens, the impact
is bound to worsen the lot, not only of the
millions of Indians already living in poverty,
but also of those only marginally above the
poverty line, threatening to tip them back
into poverty.3
This is because the main impact of any
economic slowdown on the livelihoods
of people derives chiefly from the loss of
employment opportunities. If the expected
increase in unemployment were to take
place, those losing jobs may become the
‘new poor’ due to the sudden loss of income
(Malik, 2001) (see Table 2.5).
As can be seen from Table 2.5, employ-
ment at the overall level has increased by
81,000 between December 2011 and March
2012. The increase in employment is, how-
ever, lowest when compared with that in
the previous three quarters. The maximum
increase in employment during this period
is observed in the Information Technology
(IT)/Business Process Outsourcing (BPO)
sector (by 104,000), and even this increase
is lower than that recorded in the previous
three quarters.
Table 2.5: Trends in employment from Quarterly Report on changes in employment in
selected sectors (January–March 2012)
Sr Industry/Group
Changes in employment during
June 11 over
March 11
September 11
over June 11
December
11 over
September 11
March
12 over
December 11
March
12 over
March 11
1 Textiles including
apparels
33,000 42,000 78,000 – 87,000
2 Leather 1,000 2,000 12,000 3,000 16,000
3 Metals 53,000 38,000 – 7,000 84,000
4 Automobiles 18,000 22,000 –6,000 –1,000 33,000
5 Gems and
Jewellery
13,000 7,000 10,000 3,000 27,000
6 Transport 2,000 5,000 34,000 16,000 43,000
7 IT/ BPO 164,000 204,000 109,000 104,000 581,000
8 Handloom/
Powerloom
1,000 9,000 13,000 26,000 3,000
Overall 215,000 315,000 226,000 94,000 836,000
Source: Government of India (2012).
3 http://www.albrightstonebridge.com/economic-
slowdown_india/

Livelihoods of People: How the Poor Are Making Both Ends Meet 19
The survey results indicate that employ-
ment figures in the handloom/powerloom
and gems and jewellery sectors, which
registered increase in employment dur-
ing the last three quarters, have declined
slightly during the period January–March
2012 indicating a mild slowdown. In the
leather sector, employment has declined
continuously in the latest three quarters after
a marginal increase of 1,000 in the quarter
ending June 2011.
Climate change
The dwindling agriculture sector, which is
mostly privatized in India and where the
risk is borne by millions of farmers, is also
facing serious challenges from the chang-
ing climatic conditions. Newspaper articles
have already started showing that people are
shifting to shorter duration crops; farmers in
Madhya Pradesh have shifted out of some of
the higher revenue generating pulse crops to
more stable cereals (see Box 2.1).
This, apart from reducing income from
farming—especially for small holders with
rain-fed farms—and increasing risk, would
also affect the availability of cereals and
other nutritious crops.
Given the rapid decline in the capacity
of agriculture to offer employment and
the limited scope that exists in the services
Climate change, the greatest global challenge,
is already a reality for the farmers of Rajasthan.
It is increasing the pressure on already scarce
resources and if proper measures are not
taken, migration towards the cities will soon
reach new heights….. Any change in climatic
determinants could not only adversely impact
food security and nutrition but also affect the
well-being of the population that derives its
income from the sector. Agriculture and allied
sectors, therefore, exhibit high sensitivity to
climate fluctuations…. It is projected in a
range of studies that climate change will lead
to a decrease in crop and animal produce
especially in tropical countries like India,
aggravating the risk of hunger, malnutrition
and poverty, as the availability of food and
opportunities for livelihood across sectors will
get affected. On the flip side, it would affect the
demand and corresponding changes in crop
prices…. Though the vulnerability of farm
animals to climate change varies with their
genetic composition, type and breed, life stage
and nutritional status, studies indicate that
the performance of farm animals is affected by
climate. Heat stress in dairy animals is likely
to impact their productive and reproductive
functions, cautions the report.
Source: http://articles.timesofindia.indiatimes.
com/2012-06-18/jaipur/32297886_1_cli-
mate-change-milk-production-heat-stress
Box 2.1: Climate change adversely affecting agriculture
sector to absorb the relatively unskilled
labour displaced from agriculture, there
arise expectations from the manufacturing
sector to create mass employment for the
displaced lot.
The manufacturing sector in India is
critical for two main reasons: It has signifi-
cant potential and will have to gear up to
provide employment to a growing labour
force, especially that of the less skilled type
who are being displaced from the shrinking
agriculture sector; second it can help acceler-
ate the GDP4 growth due to its forward and
backward linkages with the other sectors of
the economy (see Box 2.2).
Poverty
Inadequacy of livelihood opportunities for
large numbers of the country’s populace
is also responsible for pushing them to
the brink of poverty. With an estimated
one-third of the world’s poor living in
India (DFID, 2012) and 29.8 per cent of
India’s population living below poverty
4 The Planning Commission in its Eleventh Plan
document has stated that to attain an average GDP
growth of 9 per cent over the next five years, the
manufacturing sector needs to growth by at least 12
per cent per annum.

20 STATE OF INDIA’S LIVELIHOODS REPORT 2012
Monsoon rains will not be enough to
save the country from its first drought
in three years, the weather office said on
Thursday as it forecast that the El Nino
weather pattern should reduce rains
again in the second half of the June to
September season. – Business Standard,
2 August 2012
As of 26 July, the total area under kharif
cultivation stood at 66.824 million hectares,
down 9.94 per cent from 74.2 million hectares
in the same period last year, with all crops
except sugar cane showing varying degrees
of decline from last year, government data
showed last Friday.
The area under rice, the most important
crop, showed an 8.72 per cent decline from
last year, while the area under coarse cereals
fell 22.65 per cent. The area under pulses
was down 17.8 per cent, while that under
oilseeds showed a fall of 1.1 per cent from
a year ago.
Considering that in India, 68 per cent
of the total net sown area comes under dry
land cultivation, spread over 177 districts,
the spectre of drought which hangs over the
country will adversely affect the livelihoods
of millions of people who are directly or
indirectly engaged in farming and related
activities, this is in addition to the losses in
crop production. Also severe drought could
potentially destroy livestock population
in these areas. Considering the poor and
vulnerable marginal farmers who in addition
to agriculture depend on livestock as means
of livelihoods will be put under further
pressure.
This coupled with the lack of alternate
sources of livelihoods which would have
capability to absorb the affected along with
the fact that Indian economy is slowing will
play havoc with the livelihoods of the poor
and especially the vulnerable. On Tuesday,
the RBI revised its estimate of economic
growth in 2012–2013 to 6.5 per cent from the
earlier 7.3 per cent. It also revised its estimate
for year-end inflation to 7 per cent from 6.5
per cent.
A rough estimate of the loss of livelihoods
can be calculated from the reduction of
coverage in area under various crops. There
is a shortfall of 8.2 million hectares under
cultivation in the same period last year. The
man-days utilized vary from crop to crop,
ranging from 70 man-days per hectare for
oilseeds to 140 man-days per hectare for
rice. Assuming an average of 100 man-days
per hectare, the total loss due to a decline in
sown area would be 820 million man-days.
If the average wage rate for agricultural
labour is taken as `100, the total loss of
rural employment would be around `8,200
crores.
This impending drought could lead
to migration of people to urban centers
in search of alternate livelihoods, putting
further pressures on the already stretched
urban infrastructure, have adverse effects on
health and increase hunger and starvation
related deaths. It will also lead to fall in both
agricultural and non-agricultural wages.
What we could also see is change in
crops being cultivated. Farmers will be start
moving from shorter duration and cash
crops to rice and wheat farming—which
are nowadays anyways heavily mechanized.
This would also lead to further fall in farm
labour requirement and further cause stress
on livelihoods.
Sources: http://www.business-standard.com/
india/news/india-confirms-drought-as-el-
nino-looms/181309/on Distress Situation in
Dryland Areas Impacts on Livelihood Pattern
and the Coping Strategies: A Review- Working
Paper- Itishree Patnaik-Working Paper- 91
(RULNR Working Paper No.6) http://www.
livemint.com/2012/08/02223126/It8217s-a-
drought.html?atype=tp Poorest Areas Civil
Society (PACS) Programme- DROUGHT IN
INDIA: Challenges & Initiatives
Box 2.2: Drought and its impact on the livelihoods of people
line there have been questions about
whether the high economic growth due
to economic liberalization of the economy
in 1991, and especially in the last decade,
has actually contributed to poverty allevia-
tion. It would be interesting to see how
the poor have fared. Has their quality of
life—defined as an increase in purchasing

Livelihoods of People: How the Poor Are Making Both Ends Meet 21
Table 2.6: Change in poverty as per Expert Group 2009 (Tendulkar Committee)
Year
Poverty ratio (%) Number of poor (million)
Rural Urban Total Rural Urban Total
1993–1994 50.1 31.8 45.3 328.6 74.5 403.7
2004–2005 41.8 25.7 37.2 325.81 81.41 407.22
2009–2010 33.8 20.9 29.8 278.21 76.47 354.68
Source: Planning Commission (2012d).
Table 2.7: Change in poverty as per Expert Group 1993
Year
Poverty ratio (%) Number of poor (million)
Rural Urban Total Rural Urban Total
1993–1994 37.3 32.4 36 244 76.3 320.4
2004–2005 28.3 25.7 27.5 220.9 80.8 301.7
Source: Expert Group 1993 (Official—Lakdawala Committee).
Table 2.8: Annual average decline from 1993–1994 to 2009–2010
Poverty ratio (% points) Number of poor (million)
Rural Urban Total Rural Urban Total
2004–2005 from 1993–1994 by
Expert Group 1993
0.81 0.61 0.77 2.1 –0.41 1.7
2004–2005 from 1993–1994 by
Expert Group 2009
0.75 0.55 0.74 0.25 –0.63 –0.32
2009–2010 from 2004–2005 by
Expert Group 2009
1.6 0.96 1.48 9.52 0.99 10.51
Source: Planning Commission (2012b).
Note: 1 crore = 10 million = 0.01 billion.
power parity—improved as a result of this
economic growth.
Trends in poverty reduction
A widely accepted method of studying
growth, estimating poverty, etc., is to look
at the change in real per capita income/
expenditure of the people.
In India we use the expenditure data
as a proxy for income (as a development
indicator) as it is more difficult to com-
pute income data, especially for the poor
who are engaged in a diversified portfolio
of subsistence activities. NSSO provides
expenditure data at various periods which
is used to study economic development over
years, which in turn is also used to calcu-
late the various poverty-related estimates.
The poverty line estimates set on the basis
of this survey give us a rough idea of the
overall picture.
The latest (2009–2010) large sample
NSSO Report (66th Round) shows a sizable
decline in absolute numbers in poverty,
even apart from percentages. This indicates
that the poverty rate—the percentage of
people whose overall consumption is lower
than that which can purchase a basket of
goods as measured by the poverty line—in
both rural and urban India—has come
down.
The Head Count Ratio (HCR) (Planning
Commission, 2012a) is obtained using urban
and rural poverty lines applied to the Monthly
Per Capita Expenditure (MPCE) distribution
of the states. The aggregated Below Poverty
Line (BPL) population of the states is used to
obtain the final all-India HCR and poverty
lines in rural and urban areas.
Some observations
The total number of poor declined from
407.22 mn (2004–2005) to 354.68 mn in
2009–2010 (Planning Commission, 2012d).
These estimates are based on the daily per
capita consumption of `28.65 in urban
cities and `22.42 in rural areas. In the five-
year period the number of poor declined by
around 13 per cent with rural poverty (14.6
per cent) falling at almost double the rate of
urban poverty (see Tables 2.6, 2.7 and 2.8).
These figures indicate that the growth
in the economy has helped lift millions out
of poverty as measured by the poverty line,
keeping in mind that poverty line expen-
ditures have been traditionally set at levels
just sufficient to allow for above-subsistence
existence.
However, other numbers continue
to be a cause for worry, especially those
regarding nutrition, health and education.
Considering the multidimensionality of
poverty, it is important to see whether the
steady reduction in consumption poverty
has translated into improvement in the
quality of life of the poor.

22 STATE OF INDIA’S LIVELIHOODS REPORT 2012
Though the objective behind the poverty
line has always been to monitor progress
in combating destitution, there have been
questions asked about the definition by
which poverty has been measured (Planning
Commission, 2012d) and the controversy
surrounding the discrepancy in NSSO data
and National Accounts (the two estimates
of average per capita consumption in India)
which led to pegging the poverty line at
`28.65 per capita daily consumption in
cities (Panagriya, 2012; The Indian Express,
2012). Though the reasons for the discrep-
ancy is beyond the scope of this chapter it
is important to note that it could lead to
serious errors of interpretation pertaining to
growth and its impact on livelihoods.
The changing nature of the poverty line
There has been a controversy surrounding
the Planning Commission’s estimates of
the poverty line, based on the Tendulkar
Committee’s (Planning Commission,
2012d) methodology that suggested people
consuming more than `28.65 daily in cities
and `22.42 in rural areas are not poor. In
response to the controversy, an expert group
headed by noted economist C. Rangarajan
has been set up to revisit the Tendulkar
Committee methodology for estimation of
the poverty line and identification of the
poor. The panel will suggest a methodology
to update the consumption-based poverty
line using the new consumer price indices
formulated by CSO, review alternative
methods of estimating poverty and recom-
mend how it should be linked to eligibility
for drawing benefits from the govern-
ment’s public welfare programmes (http://
www.livemint.com/2012/05/24225510/
Rangarajan-to-head-new-panel-t.html).
As C. Rangarajan said in an interview with
Business Standard (26 May 2012):
Poverty can be estimated in different ways. First,
the absolute method, in which one considers
how the economy has changed over time and
the number of people living below a certain
income level. The other is the relative method,
in which you consider the current level of aver-
age income and the income distribution in the
country. This has been widely used in India.
So far, we have only looked at consumption
expenditure. Now, we will also look at alterna-
tive ways—how to combine the current method
with poverty estimation techniques used in
other countries. (Business Standard, 2012)
In the context of the controversy over the
poverty line definition, this poem captures
the changing nature of poverty and the pov-
erty line very succinctly (Box 2.4):
THE EVOLUTION OF THINKING
ABOUT POVERTY: EXPLORING THE
INTERACTIONS RAVI KANBUR AND LYN
SQUIRE, SEPTEMBER 1999—considers the
evolution of thinking about poverty since
Rowntree’s classic study of poverty in England
at the turn of the last century. It highlights the
progressive broadening of the definition and
measurement of poverty, from
1. Command over market-purchased
goods (income)
2. to other dimensions of living standards
such as longevity, l i teracy and
healthiness, and
3. Most recently, to concerns with risk
and vulnerability, and powerlessness
and lack of voice.
The paper argues that while there is a correla-
tion between these different dimensions,
1. Broadening the definition of poverty
does not change significantly who is
counted as poor at least not as far as
aggregate measures are concerned.
2. Broadening the definition of poverty
changes significantly our thinking
about strategies to reduce poverty.
Source: Kanbur (1999).
Box 2.3: The evolution of thinking about poverty

Livelihoods of People: How the Poor Are Making Both Ends Meet 23
I had no food to eat
No clothes to hide my shame
No roof over my head.
You, the very soul of benevolence,
You came to me and said:
“No, ‘poor’ is an ugly word,
It robs people of human dignity,
No, you’re actually poverty-stricken.”
Stricken by relentless poverty,
My days of suffering,
My days of pain,
Ran on day after day,
I wasted away.
Suddenly, you appeared again, and said:
“Look, I’ve been thinking about it,
‘Poverty-stricken’ isn’t a good word either;
You’re impoverished.”
My days and nights in chronic
impoverishment,
Panting in the furnace of summer,
Shivering in the chill of winter nights,
Soaking in the monsoon rain
I became more and more impoverished.
But you are tireless,
You came to me again, and said:
“Impoverishment makes no sense.
Why must you be impoverished?
You have always been deprived,
You’re deprived, historically deprived.”
There was no end to my deprivation,
To bed half-fed year after year,
To bed in the street, under the naked sky,
I had a skeletal existence.
But you did not forget me,
This time, your clenched fist raised high,
You called out:
“Awake, arise, ye dispossessed!”
By then, I had not the strength to rise,
Hunger had almost finished me,
My rib cage rose and fell like bellows,
I could not keep up with
Your enthusiasm and excitement.
Long days have passed in the meantime,
You are now wiser,
And smarter.
This time, you have brought a blackboard
with you,
On it, with great care, and with some
chalk,
You have drawn a perfectly straight line;
This time you’ve had to work hard,
You wipe the sweat from your brow and
tell me:
“See this line? Below it,
Way below it, is where you are.”
Wonderful!
Thank you, thank you so much!
Thank you for my poorness,
Thank you for my poverty,
Thank you for my impoverishment,
Thank you for my deprivation,
Thank you for my dispossession,
And finally, thank you for that long and
perfect line,
Thank you for this bright and shining
gift.”
Source: Translated by Antara Dev Sen in ‘Below
the Sarkari Line’. Available at http://www.asi-
anage.com/columnists/below-sarkari-line-231
and http://icrindia.wordpress.com/2012/03/21/
daaridra-rekha-poverty-line/
Box 2.4: The English translation of the poem Daridrarekha, Tarapada Ray, 1986
Rising consumption gap between the rich and poor
A study conducted by ASSOCHAM (2012)
shows how distribution of income/expendi-
ture changes in the course of development
across states by looking into real monthly
consumption expenditure of households
in rural areas. It analyses the pace of devel-
opment in rural India at the state level by
analysing changes in real monthly per capita
expenditure5 in the two NSSO quinquennial
rounds viz., the 61st round conducted in
2004–2005 and the 66th round conducted
5 It has used average household MPCE to indicate
the development that has taken place in rural areas.
MPCE at current prices is deflated by Consumer Price
Index (CPI) to arrive at a realistic measure of change
in real economic well-being of people across regions
and classes. It has, thus, taken into account both price
rise and population change.

24 STATE OF INDIA’S LIVELIHOODS REPORT 2012
in 2009–2010 to provide an insight into
improvements taking place in the economic
well-being of rural people across states dur-
ing the five-year period between 2004–2005
and 2009–2010 (see Table 2.9).
A comparison of changes in MPCE at
constant prices across various rounds shows
how well-being has changed across MPCE
classes (ASSOCHAM, 2012):
l The findings of the study confirmed that
at the all-India level, growth rate of both
average per capita expenditure and the
resultant demand increased during the
study period.
l While the average per capita consump-
tion expenditure of the poorest 20 per
cent remained unchanged, the average
household income of the richest 20 per
cent increased by 7.7 per cent during the
five year period. This has broadly led to
increased inequalities.
l On an average, a rural household in the
richest 20 per cent category spent more
than 258 per cent of what a household of
similar size falling in the poorest 20 per
cent category spent in 2004–2005. This
difference has further increased to 286
per cent in 2009–2010.
However there is also an argument
that with an increasingly effective Public
Distribution System (PDS) making subsi-
dized food available to the poor households,
they would actually be able to buy better
nutrition with the same MPCE.
Reetika Khera (2011), who has been
extensively researching the PDS and
MGNREGA observes:
First, access to PDS has been rising steadily.
‘Access’ depends on the proportion of house-
holds (i.e., proportion of BPL, households)
that the government is willing to subsidize
and on whether the PDS delivers to BPL
households. Between 2004–05 and 2007–08,
the proportion of households receiving grain
from the PDS has progressively risen, from
about a quarter of rural households (27 per
cent) to just over one-third (35 per cent). In
several states this proportion increased by
more than 10 percentage points (e.g., from
six per cent to 18 per cent in Uttar Pradesh
(UP), from 22 per cent to 36 per cent in
Orissa, from 25 per cent to 47 per cent in
Chhattisgarh and from 40 per cent to 59 per
cent in Kerala). In addition, in states such
as Andhra Pradesh (AP), Himachal Pradesh
(HP) and Tamil Nadu (TN), access was
high to start6 with—81, 69 and 88 per cent
respectively.
Second, per capita purchase of grain from
the PDS has also been increasing. Even apart
from the four southern states, where per
capita grain purchase has traditionally been
relatively high (between 2.2 kg per month in
Karnataka and 4.98 kg per month in TN in
2007–08), there are some surprises among the
Hindi-speaking states too. In Chhattisgarh,
per capita purchase witnessed a five-fold
increase between 2004–05 and 2007–08, from
a measly 600 grams to 3.2 kg per month.
Uttarakhand’s performance is similar—up
from 640 grams to 2.15 kg. Another fact
6 As a standard, the National Institute of Nutrition
set the requirement for members of a reference group
consisting of Indian males of age 18–29 years with
normal body mass index and weight of 60 kg engaged
in sedentary work at 2,320 calories per day. Thus, the
2,300 to 2,400 calories per day range provides the
benchmark for required calorie intake for a representa-
tive Indian.
Table 2.9: Average MPCE
Poorest
20%
Second
20%
Third
20%
Fourth
20%
Richest
20% Overall
Average monthly real per capita consumption
expenditure in 2004–2005 (`)
83 112 138 173 297 161
Average monthly real per capita consumption
expenditure 2009–2010 (`)
83 117 145 183 320 169
Change in Average Consumption (%) 0 4.5 5.1 5.8 7.7 5.0
Source: ASSOCHAM (2012).

Livelihoods of People: How the Poor Are Making Both Ends Meet 25
that has gone unnoticed is the performance
of Himachal Pradesh (HP) and Jammu and
Kashmir, where per capita purchases are
higher than even in some of the southern
states. These two indicators suggest that in
2007–08, on an average, more people were
getting more grain per capita from the PDS
than before.
However other studies show that while
consumption poverty may have fallen,
it has been noticed that calorific poverty
continues to remain a challenge. Here, ‘NSS
Report No. 540: Nutritional intake in India’
(Ministry of Statistics and Programme
Implementation, 2012), throws up some
interesting facts.
For instance, the Planning Commission
while defining the poverty line has estimated
that the required subsistence calorie intake
is 2,400 calories per person per day in rural
areas and 2,100 calories per person per day
in urban areas (see Table 2.10)!
Table 2.10: Trends in per capita consumption
of calories
Calories (kcal)
Year Rural Urban
1993–1994 2,153 2,073
1999–2000 2,148 2,155
2004–2005 2,047 2,021
2009–2010 2,020 1,946
Source: Ministry of Statistics and Programme
Implementation (2012).
Nutritional intake in terms of calorific
value of food has been continuously declin-
ing, as is evident from Table 2.10. Figures
indicate that two-thirds of the country’s
population has lower nutritional intake
than required.7 It is also being argued that
there exists widespread hunger and mal-
nutrition driven by a significantly higher
incidence of poverty in the country than
reflected in the estimates of the proportion
of the population below the official ‘pov-
erty line. However, there is another view
which suggests that the Indian economy has
experienced a shift in food preferences and
reduced calorie requirements (Deaton and
Drèze, 2009).
Lack of information with respect to
hunger and malnutrition has also been a
constraint for policy makers and civil society
help groups. The HUNGaMA (Hunger and
Malnutrition) Survey conducted across 112
rural districts of India in 2011 is the most
recent set of data on child nutrition in India
(Naandi Foundation, 2012). However, the
country has no data since 2006 (NFHS-3) to
understand the current situation (IIPS and
Macro International, 2007).
Some key findings of the HUNGaMA survey:
l The incidence of child malnutrition is
widespread across states and districts: In
the 100 focus districts of the survey, 42
per cent children under five are under-
weight and 59 per cent are stunted.
l A reduction in the prevalence of child
malnutrition has been observed: In
the 100 focus districts; the incidence
of underweight children has declined
from 53 per cent (Ministry of Health
and Family Welfare, 2004) to 42 per
cent (Nandi Foundation, 2012); this
represents a 20.3 per cent decline over a
7-year period with an average annual rate
of reduction of 2.9 per cent.
l By the age of 24 months, 42 per cent
children are underweight and 58 per cent
are stunted.
This indicates that though there has been
an overall growth in the economy, it has
not been able to improve the living condi-
tions for the poorer sections of the society
significantly. The increase in the income or
per capita consumption levels has not always
translated into better living conditions for
the poorer sections of the society.
7 Chronic famishment - http://www.thehindu.com/
opinion/columns/Chandrasekhar/article2910006.ece

26 STATE OF INDIA’S LIVELIHOODS REPORT 2012
Increasing inequality in consumption
Inequality in consumption, expressed by the
Gini Coefficient,8 has fallen over the long
term in India, but is now on the increase.
The last five decades show a long-term
trend of declining inequality in rural areas
as well as in urban areas (see Table 2.11)
until the 1980s, and since then, a rise and a
long-term upward trend in the urban–rural
gap (Chaudhuri and Ravallion, 2006).
Increasing regional inequality
Over the decades there has been observed
greater regional concentration of poverty.
The percentage of poor has increased in
the eastern states except West Bengal and
Sikkim, while in the western states it has
remained more or less stagnant (Planning
Commission, 2012c).
l Poverty ratio in Himachal Pradesh,
Madhya Pradesh, Maharashtra, Odisha,
Sikkim, Tamil Nadu, Karnataka and
Uttarakhand has declined by about 10
percentage points and more.
l Some of the bigger states such as Bihar,
Chhattisgarh and Uttar Pradesh have
shown only marginal decline in the pov-
erty ratio.
l In Assam, Meghalaya, Manipur, Mizoram
and Nagaland poverty has experienced
increasing inequality.
The level of inequality differs widely
across states as can be seen in Table 2.12:
Table 2.12: The level of inequality across states:
Gini Coefficient (%)
State
2004–
2005
2009–
2010 Change
Jammu and Kashmir 15.02 22.38 7.37
MP (including
Chattisgarh)
29.71 34.66 4.96
Bihar (including
Jharkand)
24.31 29.20 4.90
Assam 18.66 21.97 3.31
Tamil Nadu 24.37 26.47 2.10
Punjab 19.05 20.88 1.83
Gujarat 22.12 23.92 1.80
Himachal Pradesh 20.06 21.49 1.43
Kerala 21.19 22.38 1.19
Uttar Pradesh
(including
Uttarakhand)
24.64 25.26 0.62
Karnataka 26.42 26.13 –0.29
North East 19.10 18.76 –0.34
Andhra Pradesh 25.81 25.22 –0.59
Rajasthan 20.73 19.11 –1.61
Union Territories
(UTs)
21.57 19.71 –1.86
West Bengal 24.84 22.50 –2.34
Haryana 22.54 20.18 –2.36
Maharashtra 27.5 23.65 –3.85
Odisha 36.88 31.13 –5.75
All India 26.40 27.40 1.00
Source: ASSOCHAM (2012).
Table 2.11: Trends in rural and urban inequality
Rural Urban Total
Measures of relative
inequality
1983 1993–
1994
2004–
2005
1983 1993–
1994
2004–
2005
1983 1993–
1994
2004–
2005
Gini Coefficient (%) 31.7 28.54 29.7 34.2 34.3 37.8 32.37 30.35 32.54
Source: Chaudhuri and Ravallion (2006).
8 Gini Coefficient measures quantifies the inequality
in income distribution. A Gini coefficient of 0 indicates
perfect consumption or income equality, while a 100
would imply that a single person incurs all consump-
tion expenditure or possesses all income.
The Gini-Coefficients (ASSOCHAM,
2012) for states indicate that income inequal-
ities have increased in Jammu and Kashmir
(by 7.37 percentage points), Madhya
Pradesh (including Chhattisgarh) (by 4.96
percentage points) and Bihar (including
Jharkhand) (by 4.9 percentage points).
These are followed by Assam, Tamil Nadu,
Punjab, Gujarat, Himachal Pradesh, Kerala
and Uttar Pradesh (including Uttarakhand).
At the same time, Gini-coefficient values
indicate falling inequalities in Odisha (by
5.75 percentage points), Maharashtra (by
3.85 percentage points), Haryana (by 2.36
percentage points) and West Bengal (by
2.34 percentage points). UTs, Rajasthan,
Andhra Pradesh, the North East states and
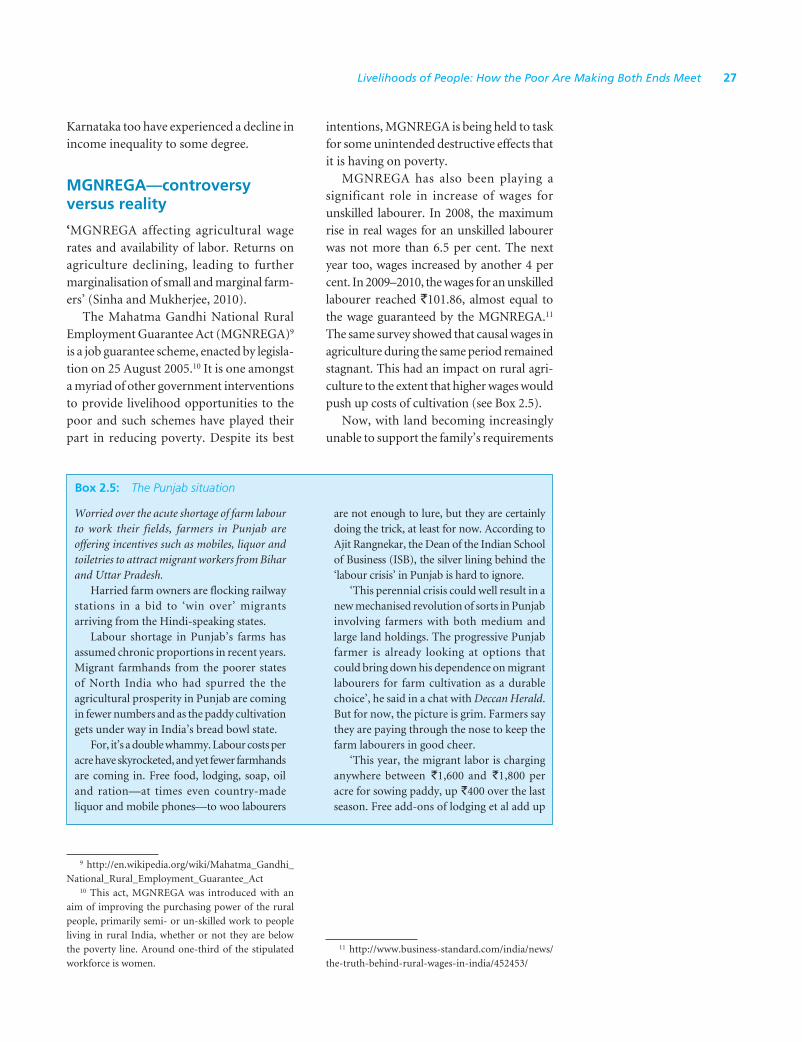
Livelihoods of People: How the Poor Are Making Both Ends Meet 27
Karnataka too have experienced a decline in
income inequality to some degree.
MGNREGA—controversy versus reality
‘MGNREGA affecting agricultural wage
rates and availability of labor. Returns on
agriculture declining, leading to further
marginalisation of small and marginal farm-
ers’ (Sinha and Mukherjee, 2010).
The Mahatma Gandhi National Rural
Employment Guarantee Act (MGNREGA)9
is a job guarantee scheme, enacted by legisla-
tion on 25 August 2005.10 It is one amongst
a myriad of other government interventions
to provide livelihood opportunities to the
poor and such schemes have played their
part in reducing poverty. Despite its best
intentions, MGNREGA is being held to task
for some unintended destructive effects that
it is having on poverty.
MGNREGA has also been playing a
significant role in increase of wages for
unskilled labourer. In 2008, the maximum
rise in real wages for an unskilled labourer
was not more than 6.5 per cent. The next
year too, wages increased by another 4 per
cent. In 2009–2010, the wages for an unskilled
labourer reached `101.86, almost equal to
the wage guaranteed by the MGNREGA.11
The same survey showed that causal wages in
agriculture during the same period remained
stagnant. This had an impact on rural agri-
culture to the extent that higher wages would
push up costs of cultivation (see Box 2.5).
Now, with land becoming increasingly
unable to support the family’s requirements
9 http://en.wikipedia.org/wiki/Mahatma_Gandhi_
National_Rural_Employment_Guarantee_Act10 This act, MGNREGA was introduced with an
aim of improving the purchasing power of the rural
people, primarily semi- or un-skilled work to people
living in rural India, whether or not they are below
the poverty line. Around one-third of the stipulated
workforce is women.
Worried over the acute shortage of farm labour
to work their fields, farmers in Punjab are
offering incentives such as mobiles, liquor and
toiletries to attract migrant workers from Bihar
and Uttar Pradesh.
Harried farm owners are flocking railway
stations in a bid to ‘win over’ migrants
arriving from the Hindi-speaking states.
Labour shortage in Punjab’s farms has
assumed chronic proportions in recent years.
Migrant farmhands from the poorer states
of North India who had spurred the the
agricultural prosperity in Punjab are coming
in fewer numbers and as the paddy cultivation
gets under way in India’s bread bowl state.
For, it’s a double whammy. Labour costs per
acre have skyrocketed, and yet fewer farmhands
are coming in. Free food, lodging, soap, oil
and ration—at times even country-made
liquor and mobile phones—to woo labourers
are not enough to lure, but they are certainly
doing the trick, at least for now. According to
Ajit Rangnekar, the Dean of the Indian School
of Business (ISB), the silver lining behind the
‘labour crisis’ in Punjab is hard to ignore.
‘This perennial crisis could well result in a
new mechanised revolution of sorts in Punjab
involving farmers with both medium and
large land holdings. The progressive Punjab
farmer is already looking at options that
could bring down his dependence on migrant
labourers for farm cultivation as a durable
choice’, he said in a chat with Deccan Herald.
But for now, the picture is grim. Farmers say
they are paying through the nose to keep the
farm labourers in good cheer.
‘This year, the migrant labor is charging
anywhere between `1,600 and `1,800 per
acre for sowing paddy, up `400 over the last
season. Free add-ons of lodging et al add up
Box 2.5: The Punjab situation
11 http://www.business-standard.com/india/news/
the-truth-behind-rural-wages-in-india/452453/

28 STATE OF INDIA’S LIVELIHOODS REPORT 2012
of food and the cattle’s requirements for
fodder, land based livelihoods of small and
marginal farmers are fast becoming unsus-
tainable. ‘Land’ in this context means not
just land with the capacity for producing
crops, but also the natural fauna, the rich
water, timber and mineral resources. Added
to this burden has been an unintended
effect of MGNREGA—that of pushing up
the wages of rural workers in a manner that
is raising costs of cultivation for farmers
and making it hard for them to compete
(Chandrasekhar and Ghosh, 2011).12,13 This,
in turn, is leading to greater farm mechani-
zation, which the small and marginal farmer
is not able to afford, thus, rendering them
even more non-competitive and leading to
further marginalization.
Another of the unintended consequences
of the MGNREGA has been the shortage of
labour in core sectors like infrastructure
and construction which depend on migrant
labour. This is happening because many
labourers prefer to work in the MGNREGA
programmes. Skills are also being lost as
artisans and handloom weavers are losing
skilled labour to the programme. A review
pointed out that there has been little, if any,
growth of skill at sites where MGNREGA is
being implemented. This is because workers
to more cost. Even at these rates, there aren’t
many migrants who could help matters’,
Jagtar Singh, a farmer said.
Farmers, even officials and experts,
attribute the ongoing recurrent labour crisis
to a ‘usual suspect’—Bihar’s growth trajectory
that’s increasingly being instrumental to
hold back sons of soil from migrating to
bread bowl states of Punjab and Haryana.
Bihar has recorded a 13 per cent growth
rate, the highest in the country. The Centre
sponsored job guarantee scheme in the state
has provided work options at the doorstep
at competitive rates. Bihar’s advantage is
Punjab’s bane, at least when it comes to
farm labourer.
Conclusion: If this kind of mechanization
takes place it is also affecting the livelihood
opportunities for the migrant farm labour in
Eastern Parts of the country, in a few years
to come.
Source: Punjab farmers undergo ‘labour
pains’. Available at http://www.deccanher-
ald.com/content/258009/punjab-farmers-
undergo-labour-pains.html
aren’t allowed to use machines; they have
to dig—using pick axes and shovels.14 The
idea of the scheme is to create as many jobs
as possible for unskilled workers. But in
practice, say critics, it means no one learns
new skills, only basic projects get completed
and the poor stay poor.15
This could have long term consequences
on the livelihoods of the poor. However,
further analysis of the MGNREGA is beyond
the scope of this chapter which has been
dealt with in detail in other chapters.
Challenges of peasants in undulating terrain
As we have seen, the majority of India’s
population is dependent on agriculture,
especially in rural India. So, land becomes
very important as a livelihood resource.
However, at the same time, assessments have
shown that forty per cent of rural households
have no land or less than half an acre of land
and that there are an estimated 1.3 to 1.8
crore landless rural families in the country
(Ministry of Rural Development, 2012).
Landlessness is an important feature of
poverty. The number of small and marginal
operational holdings has been increasing
steadily over the years. In this context, we
would like to highlight the challenges to
livelihoods that people in the undulating
forest terrains of central India have faced 12 http://articles.economictimes.indiatimes.
com/2011-01-19/news/28430232_1_infrastructure-
projects-infrastructure-space-core-sector13 http://www.firstpost.com/business/nrega-and-
the-law-of-unintended-consequences-26073.html
14 http://www.economist.com/node/2153664215 http://online.wsj.com/article/SB10001424052748
704081604576143671902043578.html

Livelihoods of People: How the Poor Are Making Both Ends Meet 29
(see Figure 2.2). This area is characterized
by undulating terrain, hilly topography and
a large concentration of landless adivasis
(tribal: original inhabitants) who have lived
here for thousands of years. The hilly and
forested terrains have shaped the lives of
these people.
The adivasis live off the forest, just as their
ancestors have, for thousands of years, and
depended on the forests for their livelihood.
Their livelihoods have revolved around non-
timber forest produce, hunting, fishing and
using a sustainable farming method called
shifting cultivation.
When the British came to India they had
differences amongst themselves about the
appropriate approach to forest conservation.
The British thought that the indigenous
system of shift farming was harmful and
banned it. Another reason for banning it
was that shifting cultivation made it difficult
for the government to calculate taxes.
Another course of action implemented
was replacing of natural mixed vegetation
with commercially exploitable systemic
plantation.
Post Independence too, little has changed.
Once rich deposits of minerals were discov-
ered in these regions, mining was begun on a
large scale which in turn led to displacement
of the traditional forest dwellers. Earlier,
lack of roads prevented most outsiders from
exploiting these natural resources. However,
now, roads and better infrastructure have
Figure 2.2: Left-wing affected areas in India
Source: Institute for Conflict Management, South Asia Terrorism Portal. Available at http://www.satp.org/satporgtp/
countries/india/database/conflictmap.htm

30 STATE OF INDIA’S LIVELIHOODS REPORT 2012
opened up vast areas for external interests to
control, grab, and exploit millions of acres
of forested terrain.
For thousands of years common prop-
erty resources was a traditional right for all,
be it farmers, grazers, fisher folk, etc. This
meant that though the forest dwellers and
inhabitants of these regions had lived here
for generations they ‘never owned the land’.
Consequently, the government was not able
to recognize their ownership or rights to
these lands because they did not have the
requisite titles.
This state of affairs caused a peculiar situ-
ation. With the inhabitants being forcefully
displaced from their original homes due
to the advent of modern times, and with
them, vested interests who wanted to exploit
these regions full of natural resources like
timber and minerals. Mining and irrigation
projects, which have lead to development
in other areas, have had unintended con-
sequences on the livelihoods of the original
inhabitants.
The implications have been that the
adivasis have been displaced and forced to
move to other, unfamiliar locales, and some-
times even to large cities. This has added
to their troubles and further impinged on
their livelihoods. Poverty has increased as
the displaced have no skills useful for life
in a city and little knowledge about urban
culture.
Concluding remarks
Recognizing the challenges to livelihoods
being faced by a large majority of the people
of India, huge investments have been made
in livelihood promotion in recent years.
And although there are several indicators
suggesting an improvement in the economy
of the nation, livelihoods of a large number
of the population continue to remain chal-
lenged.
l Employment opportunities have not
increased; but rather, have declined since
the economic slowdown.
l Earnings of the people, as reflected by
MPCE for the poorest 20 per cent, have
not increased in last decade.
l Inequality between the bottom and the
top 20 per cent of the population and
its diversity between states continues to
grow and worsen.
There has been drastic increase in prices
as well as production risks, induced by
global climate change as well as market
changes. This is a serious cause for concern
since it affects the vulnerable and the poor
in a big way.
Further, there is huge uncertainty with
regard to the livelihoods of the masses
caused by:
l instability of the rupee,
l crisis in the European economy which
also affects our export markets as well as
investor sentiment,
l fluctuation in oil prices,
l increase in food grain prices, and
l an impending drought brought about by
the unanticipated poor monsoon.
References
Alkire, Sabina and Maria Emma Santos. 2010.
‘Multidimensional Poverty Index’. Oxford
Poverty and Human Development Initiative.
Available at http://www.ophi.org.uk/wp-content/
uploads/OPHI-MPI-Brief.pdf http://www.ndtv.
com/article/india/indian-states-worse-off-than-
26-poorest-african-countries-37092
ASSOCHAM. 2012. ‘Rural Development in India: State
Level Experiences, Assocham Study’, New Delhi.
Business Standard. 2012. ‘Interview with C. Rangarajan’,
Business Standard, New Delhi.
Chandrasekhar, C. P. and Jayati Ghosh. 2011. ‘Public
Works and Wages in Rural India’. MacroScan/
Economic Research Foundation. Available at
http://www.macroscan.org/fet/jan11/fet110111-
Public_Works.htm
Chaudhuri, Shubham and Martin Ravallion. 2006.
‘Partially Awakened Giants: Uneven Growth in
China and India’. World bank.
Deaton, Angus and Jean Drèze. 2009. ‘Food and
Nutrition in India: Facts and Interpretations’,
EPW, XLIV(7).
DFID (Department of International Development).
2012. ‘Operational Plan 2011-2015’, June 2012,
New Delhi.

Livelihoods of People: How the Poor Are Making Both Ends Meet 31
Government of India. 2012. ‘14th Report on the
Quarterly Quick Survey Conducted by the Labour
Bureau on Changes in Employment Situation
in Selected Sectors’, Ministry of Labour and
Employment, Chandigarh.
Gupta, Anil and Haiyan Wang. 2012. ‘Could This Be
India’s Golden Moment?’. Available at http://
www.businessweek.com/articles/2012-06-13/
could-this-be-indias-golden-moment#p1
IIPS (International Institute for Population Sciences)
and Macro International. 2007. National Family
Health Survey (NFHS-3), 2005–06: India: Volume I.
Mumbai: IIPS. Available at http://www.measuredhs.
com/pubs/pdf/FRIND3/00FrontMatter00.pdf
Kanbur, S. M. Ravi. 1999. ‘The Evolution of Thinking
about Poverty: Exploring the Interactions’.
Avilable at http://siteresources.worldbank.org/
INTPOVERTY/Resources/WDR/evolut.pdf
Khera, Reetika. 2011. ‘PDS: Signs of Revival’, The
Hindu, 12 June 2011, New Delhi. Available at
http://www.thehindu.com/arts/magazine/arti-
cle2098575.ece
Malik, Muhammad Hussain. 2001. ‘The new poor’,
ESCAP, ed., Bulletin on Asia-Pacific Perspectives
2001/02 (United Nations publication, Sales No.
E.02.II.F.2), Bangkok, 18–19 October 2001
Ministry of Finance. 2012. ‘Monthly Economic Report’,
Department of Economic Affairs Economic
Division 4(3)/Ec. Dn. /2012, New Delhi. Available
at http://finmin.nic.in/stats_data/monthly_eco-
nomic_report/2012/indjune12.pdf\
Ministry of Health and Family Welfare. 2004. ‘District
Level Household and Facility Survey’. New Delhi:
Ministry of Health and Family Welfare.
Ministry of Labour. 2011. ‘Annual Report to the
People on Employment’. New Delhi: Ministry
of Labour.
Ministry of Rural Development. 2012. ‘The Land
Acquisition, Rehabilitation And Resettlement Bill,
2011’, Thirty-First Report, Lok Sabha Secretariat,
New Delhi.
Ministry of Statistics and Programme Implementation.
2012. ‘NSS Report No. 540: Nutritional Intake
in India’, National Statistical Organization,
Government of India, New Delhi.
Naandi Foundation. 2012. ‘The HUNGaMA Survey
Report—2011. Available at http://hungamafor-
change.org/HungamaBKDec11LR.pdf
National Commission on Population. 2006.
‘Report of the Technical Group on Population
Projections’. New Delhi: National Commission
on Population.
Panagariya, Arvind. 2012. ‘Myths about Poverty Lines’.
Available at http://articles.timesofindia.indiatimes.
com/2012-03-30/edit-page/31255204_1_poverty-
tendulkar-committee-lakdawala-committee
Planning Commission of India. 2012a. Poverty
Estimates for 2009–10’. New Delhi: Planning
Commission of India.
———.2012b. ‘Databook for DCH’. New Delhi:
Planning Commission.
———. 2012c. ‘Press Note on Poverty Estimates,
2009–10’. New Delhi: Planning Commission.
———. 2012d. ‘Data for Use of Deputy Chairman’.
New Delhi: Planning Commission.
Sinha, Uday Bhanu and Diganta Mukherjee. 2010.
‘Understanding NREGA: A Simple Theory
and Some Facts’, Working Papers, eSocialS-
ciences. Available at http://EconPapers.repec.org/
RePEc:ess:wpaper:id:3099
The Indian Express. 2012. ‘Bad data led to fall in poverty:
Montek’. Available at http://www.indianexpress.
com/news/bad-data-led-to-fall-in-poverty-
montek/926106/1
Team Lease and IIJT. 2009. India Labour Rwport,
report by the Geographic Mismatch and a Ranking
of Indian States by their Labour Ecosystem
(Labour Demand, Labour Supply, Labour Laws).
Available at http://www.teamlease.com/index.p
hp?module=user&event=downloadFile&folde
r=media&file=TeamLease_LabourReport2009.
pdf&type=file


Introduction
Policy in the context of a discourse on liveli-
hoods in India could be an Act, a mission
statement, a national- or state-level pro-
gramme, a scheme or a mix of these that has
been implemented, is being implemented or
is on its way, irrespective of the way it is pre-
sented in the public domain. For instance,
National Rural Development Mission and
Women Farmers’ Entitlement Bill are both
treated as policies in this chapter, though
one is a new mission while the other is a bill
recently placed in the Rajya Sabha. Needless
to say, livelihood policies ought to be seen
as a sub-set of macroeconomic policies
aimed at improving policy environment that
include supply side issues and often demand
side issues too.
However, livelihoods of the poor get
affected by major macroeconomic interven-
tions, not all of which may be attributed to
specific policy interventions. Instead, many
are rooted in the vagaries of market dynam-
ics; for instance, food inflation directly
affecting the poor negatively in the current
scenario, industrial employment showing
no signs of improvement or microfinance
being in limbo adversely affecting credit
supply to the poor. Many of these realities
impacting livelihoods of the poor can be
traced back to macroeconomic policies
or are decisions related to the political
economy, which are outside the scope of
this chapter.
On the other hand, certain policy inter-
ventions like those related to land acquisi-
tion do not directly impact livelihood issues
but promise to improve macroeconomic
parameters like gross domestic product
(GDP), growth, trade balance, etc., which
in turn may develop livelihood opportuni-
ties for the poor. Such policies have been
included in this chapter to put in perspective
their immediate impact on the lives of the
poor who often need to survive in the short
term in order to gain from opportunities in
the long term.
Often discussions around livelihood
and other factors of socio-economic equity
tend to revolve around three categories of
people—the Below Poverty Line (BPL), the
Scheduled Castes (SCs) and the Scheduled
Tribes (STs). Through the years, research
offered new insights on the need of other
such groups like women, landless and
disabled to be supported through affirma-
tive action. Supply side issues encouraged
the inclusion of more categories like
the financially excluded, the insurance
excluded and the development refugee.
The constituency for the present discus-
sion includes all these groups—the poor,
the disabled, the minorities, absolutely
landless, financially excluded, insurance
excluded, SCs, STs, etc. (Datta, Sharma
and Ruthven, 2011). This year we add three
new groups in the constituency over and
above last year (p. 57):
Policy Initiatives on Livelihoods:
Emerging ScenarioASHOK SIRCAR
Chapter 3

34 STATE OF INDIA’S LIVELIHOODS REPORT 2012
1. 10–12 million street vendors (Bhowmick,
2005)
2. 1.2 million manual scavengers (Report of
Sub Group on Safai Karmacharis, 2007)
3. 92.71 million rural women producers
(National Commission for Women
[NCW], 2005: 13)
Social research has shown that driven
by deprivation these three groups, cutting
across rural and urban poor, are awaiting
affirmative action.
There is another category of people that
we are including in the discussion on policy
initiatives on livelihoods—SCs and STs of
Central India. While they belong to the
large rain-fed areas of Central India and the
Deccan and as such deserve fuller attention,
they have been brought into focus because
they are victims of State failure on the one
hand and extremist violence on the other.
Caught in a pincer, they are not at par with
SCs and STs of other regions in the country.
We attempt to capture what the State is
doing in the policy domain to address their
livelihood challenges.
This chapter is divided into five sections.
The next section discusses the Union Budget
through the livelihoods lens. The section
thereafter discusses the approach paper to
Twelfth Five Year Plan (FYP) from a liveli-
hoods perspective. Next four sections deal
with policy initiatives that influence the
livelihoods of manual scavengers, street ven-
dors, women farmers and SCs/STs of central
India respectively. Thereafter, we discuss
two forthcoming missions—the National
Urban Livelihoods Mission (NULM) and
National Dairy Plan (NDP)—in two fol-
lowing sections. This is followed by a section
dealing with the unfinished policy agenda
of land acquisition. And then we capture
the debate on the National Food Security
Bill 2011 a one section. We conclude our
narrative on the section called Conclusion,
which is followed by a postscript that
briefly describes the new pathways in two
of the existing policies, Mahatma Gandhi
Rural Employment Guarantee Scheme
(MGNREGS) and Rashtriya Krishi Vikas
Yojana (RKVY).
Livelihoods in the Union Budget 2012–2013
It should be recognized at the outset that
neither does the Union Budget have any
dedicated section or allocation on liveli-
hoods nor is addressing livelihood issues
a key concern of the budget exercise. The
annual budget exercise is an opportunity
for the union government to manipulate
fund allocations to reflect the government’s
priorities. Using the budget as a tool, the
government can affect three things:
1. increase allocations to existing pro-
grammes,
2. promise to initiate new programmes
and
3. promise to initiate (and or adapt) new
policies and allocate funds for that.
These three types of interventions are
done for all the sectors that get budget sup-
port. Therefore, a relevant prism to view
through in the context of the present discus-
sion is to see what the budget does for ini-
tiatives on livelihoods across various sectors
and ministries that get budgetary support.
For the discussion in this chapter, we
may consider initiatives in agriculture, agri-
cultural credit, social-sector investments,
employment generation initiatives, welfare
measures for specific categories of people,
food security-related initiatives, initiatives
for micro and small enterprises, skill build-
ing and the like. By introducing a filter to
make these choices, we recognize that there
are a few shortcomings that may introduce
or hide aberrations in analysing outcomes.
At least three such prominent weaknesses of
introducing this filter are listed here:
1. Budget allocation or investment does
not always mean that it is benefiting the
existing or new category of poor in any
significant way in every case.

Policy Initiatives on Livelihoods: Emerging Scenario 35
2. There are other initiatives that do influ-
ence peoples’ livelihoods but may get
excluded from our consideration set
due to the above filter. It is probably
more difficult to measure the influence
of these inadvertent exclusions than the
ones included.
3. Budget being essentially an input exer-
cise does not always indicate outcomes
that the initiative may lead to. Thus,
the analysis of the Union Budget to
understand policy impetus to liveli-
hoods requires a more robust theoretical
framework for which more research is
necessary and presently not available.
Notwithstanding these drawbacks, this
chapter would still be useful in presenting
a practical way to look at budget allocations
to read the government’s mind. This forms
the bedrock of our motivation to look at the
Union Budget 2012–2013.
Table 3.1 captures the enhancement of
allocations in Union Budget 2012–2013
compared to the previous year in the most
critical existing programmes. It shows signif-
icant enhancements in outlays in Integrated
Child Development Services (ICDS),
agricultural credit, drinking water and
sanitation and National Social Assistance
Programme (NSAP). Of these the 150 per
cent enhancement in allocation for Bringing
Green Revolution to Eastern India (BGREI)
stands out, even though on a small base of
`400 crore in the previous budget.
Table 3.2 lists new policies that were
announced in the budget. The biggest
thrust of new policy initiatives seems to be
in manufacturing, creating Bharat Rural
Livelihoods Foundation and National
Urban Health Mission. Similarly, the share
of manufacturing in GDP has been steadily
declining in recent years, which the National
Manufacturing Policy (NMP) may arrest
and provide new impetus to. In case of Dalits
and tribals of Central India—commonly
known as people of LWE districts—who
await solutions that would help them out
of poverty, reduce the negative impact of
forest department’s apathy and antipathy
as well as protect them from the clutches
of extremism. Known solutions that have
worked in other parts of India may not work
in LWE districts and, therefore, the need
for an innovative solutions platform was
urgent. Hence, the proposal to set Bharat
Table 3.1: Budget allocations in key existing programmes
(in ` crore)
Key areas 2012–2013 2011–2012 Change (in percentage)
Agricultural credit 575,000 475,000 21.05
Drinking water and
sanitation
14,000 11,000 27.27
RKVY 9,217 7,860 17.26
BGREI 1,000 400 150.00
ICDS 15,850 10,032 57.99
NRLM 3,914 2,921 34.00
NSAP 8,447 6,165 37.02
Right to Education/Sarva
Siksha Abhiyan (SSA)
25,555 20,998 21.70
National Rural Health
Mission (NRHM)
20,822 18,115 14.94
MGNREGS 33,000 31,000 6.45
Food security subsidy 75,000 72,823 2.99
Source: Table compiled by author from ‘Key Features of Budget 2012–2013’, pp. 7–11. Available online at http://
indiabudget.nic.in/index.asp (accessed on 16 June 2012).

36 STATE OF INDIA’S LIVELIHOODS REPORT 2012
Rural Livelihoods Foundation is a welcome
step. The same can be said for urban health,
which has been long neglected. It is good to
see that concrete steps are finally being taken
to address this need of the urban poor.
evolved beyond policymaking even after a
whole year has elapsed. No significant allo-
cation change is seen in areas concerning
food security.
Probably the greatest mismatch between
policy and budget support is in the area of
sustainable development where the budget
has offered only a cursory attention. Chapter
12 of the Economic Survey 2011–2012
mentions eight missions to anchor sus-
tainable development in the mainstream
economic and social development agenda.
These are National Solar Mission, National
Mission for Enhanced Energy Efficiency,
National Mission on Sustainable Habitat,
National Water Mission, National Mission
of Sustaining Himalayan Ecosystem,
National Mission for Green India, National
Commission on Sustainable Agriculture
and National Mission for Sustainable
Agriculture. While almost all of these mis-
sions carry implications for livelihood, the
ones related to sustainable agriculture,
Himalayan ecosystem, solar mission and
water mission have very high significance in
livelihoods of a vast number of people. The
survey mentions that all these missions are
established and fund requirement computed
and projected (Government of India, 2012).
On the other hand, the Union Budget 2012–
2013 while making significant allocation for
water and sanitation under the National
Water Mission included cursory mentions
about National Commission on Sustainable
Agriculture while almost ignoring all the
rest. It may, therefore, be concluded that
the Union Budget 2012–2013 has not done
justice to the policy commitments made
earlier or elsewhere towards sustainable
development.
Livelihoods in the Twelfth FYP
Though the Twelfth FYP officially started
on 1 April 2012, there is no plan document
in place as yet. What we have instead is the
Approach Paper (AP) which consequently
forms the focus our discussion.
Table 3.2: New policies announced in the Union Budget 2012–2013
1. National Manufacturing Policy to make sure manufacturing contributes 25 per cent of GDP
and create 100 million additional jobs in five years.
2. Proposal to establish Bharat Rural Livelihoods Foundation, as a public private partnership
(PPP) initiative to work in LWE districts.
3. National Urban Health Mission being announced.
4. National Urban Livelihoods Mission to be initiated in the Twelfth FYP.
5. Six thousand model schools to be set up covering almost every block, under the Twelfth FYP.
6. A national mission on food processing will be set up with state governments.
7. Kissan Credit Card to be converted to ATM Card.
8. Pension amount under National Old Age Pension Scheme increased from `200 to `300 per
month.
9. National Mission for Protein Supplement to enhance productivity in dairy and fishing sector
with `2,242 crores allocated.
Source: Table compiled by author from ‘Key Features of Budget 2012–2013’, pp. 7–11. Available
online at http://indiabudget.nic.in/index.asp? (accessed on 16 June 2012).
However, a closer look at the budget
declarations reveals a few disquieting
omissions and inclusions. For example,
last year’s budget announced setting up of
a commission for sustainable agriculture.
This year, instead of any substantive alloca-
tion to support the commission the budget
limited its commitment to it, only bringing
under its umbrella a few existing pro-
grammes. This means there is no substan-
tive commitment to move towards more
sustainable agriculture. This is in sharp
contrast to the new mission on protein
supplements that has received immediate
budgetary support.
Another example of lack of focus where
it is needed is storage of foodgrain. It is
well established that storage capacity for
foodgrain and other agricultural produce is
abysmally low in the country and immedi-
ate concrete steps are necessary to enhance
the storage capacity. However, the budget
glosses over this reality with only a passing
remark on attempts to increase food grain
storage capacity. Similarly, the NFSB has not

Policy Initiatives on Livelihoods: Emerging Scenario 37
Both the Eleventh Five Year Plan docu-
ment and the AP to the Twelfth Plan have
been drafted to serve the stated overarching
agenda of inclusive growth, which effec-
tively boils down to boosting investment
in education, health, social security, food
security and rural employment, with a view
to improving outreach to under-served
populations. During Eleventh Plan, a few
massive programmes in the social sector
were launched, namely the National Rural
Employment Guarantee Scheme of NREGS
(under the Act by the same name), the mid-
day meal scheme (MDM) and the NRHM,
and outlay of funds in some of the ongo-
ing programmes like ICDS and SSA were
enhanced. The Twelfth Plan is expected to
continue in the same vein.
As a pertinent aside, though both
documents purportedly farther the cause of
social inclusion through improvements in
social infrastructure and provision of basic
services to people, it is indeed striking that
neither document attempts to study ‘social
exclusion’ in its real sense. They choose
to further the cause of inclusion without
studying the dimensions of exclusion as it
exists in India even though social exclusion
literature world wide is replete with analy-
ses and examples drawn from the Indian
context.
To return to the context of livelihoods,
while the AP does carry a section in the over-
view entitled ‘Employment and Livelihoods’
(Planning Commission, 2011, section 1.23:
11), the said section only discusses employ-
ment issues and does not really touch upon
concerns related to livelihoods and is,
therefore, of limited help. So again, in the
absence of a robust framework, initiatives
in agriculture, agricultural credit, social
sector investments, employment generation
initiatives, welfare measures for specific
categories of people, food security-related
initiatives, initiatives for micro and small
enterprises, skill building and the like have
been treated as livelihoods initiatives, and
the approach paper has been evaluated
within this restricted context.
The AP reflects on important parameters
of State interventions in terms of efficacy,
relevance, cost effectiveness and outreach
and, thereby, indicates need for path cor-
rections or even taking paradigmatically
different routes. It has made candid obser-
vations on what has worked and why and,
equally, what has not worked and why
not. So rather than looking at sub-sectors,
outlays, increase–decrease type quantitative
data, we have chosen to review the AP from
this limited perspective, capturing these
core observations in order to then identify
the challenges of livelihoods planning in
India.
Agriculture
First, like the Eleventh Plan document,
the AP to the Twelfth Plan also recognizes
the criticality of agriculture in alleviation
of poverty. Although the proportion of
population dependent on agriculture has
come down over last decade, poverty and
hunger are largely rural phenomena. The
AP recognizes in no uncertain terms that a
1 per cent incremental growth in ariculture
would actually reduce poverty in India
more significantly than larger growth in
other sectors (Planning Commission, 2011,
section 1.23: 12). It also recognizes that agri-
culture is a state subject, so the Centre has
to work very closely with states to reform
agriculture.
The second critical observation is that
the real challenge of agriculture lies in the
fact that rain-fed agriculture constitutes 56
per cent of total cropped area, 48 per cent of
food crop area and 68 per cent of non-food
crop area (Planning Commission, 2011, sec-
tions 7.24–7.25: 77–78). The AP recognizes
that to meet future demand for food, 40 per
cent additional supply of food grains will
have to come from this area. Moreover, the
traditional green revolution approach will
be of little use unless locally sustainable
natural resource management techniques
are adopted under a comprehensive pack-
age covering food nutrition, agriculture
and livelihoods. Therefore, the Twelfth

38 STATE OF INDIA’S LIVELIHOODS REPORT 2012
Plan must envisage convergence of liveli-
hoods, food, ecosystem and human health
(Planning Commission, 2011, section 7.27:
78). This cannot happen without national
policy support.
The third area of significant policy rel-
evance is land and tenancy reforms. The AP
recognizes the extremely limited success of
re-distributive land reforms and supports
the cause of liberalization of tenancies for
the benefit of small and marginal farmers.
While the AP suggests the route of legal
reform for liberalization of tenancies, it is
silent on how redistributive land reform can
be made more successful.
The AP goes on to highlight the dire need
to link the small producers to the market.
It recognizes that the marketing coopera-
tive as an aggregation of small produce at a
fair price and as a vehicle for capturing the
benefits of bulk sale, works only in a few
specific cases. The AP recommends policy
support for the new emerging approaches
in creating market access through small
producer companies and self-help group
(SHG) federations.
Finally, while 26 per cent of total area
of the country is estimated to be under
commons, the AP is not able to deliver an
official policy and programme architecture
at the district level to build a community-led
process of managing the commons.
Food security
The AP devotes only a small paragraph to
food security, in which it raises a slight con-
cern about reduction in net sown area by 2
million hectares. Even in this casual expres-
sion of passing interest in the matter, food
security is merely viewed as a production
challenge and very erroneously connected
with land acquisition issues. While an unin-
tended consequence of this error manifests
in sane advice that highly productive land
should not be considered for diversion to
non-agricultural uses, the paper is quick
to qualify this with the plea that ‘this may
not always be possible’. Compounding
its errors of omission, the AP goes on to
studiously ignore household food security
issues which have engaged public opinion
for a decade now.
Manufacturing
The AP is fairly critical of the fact that the
contribution of manufacturing to both
GDP as well as employment generation
in India is far below its true potential. It
has recommended the formulation of a
National Manufacturing Policy, to create
100 million jobs in the next 10 years in
textiles and garments, leather and footwear,
gem and jewellery, food processing, hand-
loom and handicrafts. Surprisingly, all of
these are the so-called traditional industries
which, some years ago, were thought to be
‘sunset’ sectors. So in that sense, the plan-
ning wisdom in India has perhaps come
full circle.
It is nevertheless astonishing that the AP
in its 146 pages has not found the space to
discuss the informal sector that employs by
far the largest number of people in India and
has been the greatest source of jobs created
in the last decade. While the AP does note
that a vast majority of jobs created during
2004–2005 and 2009–2010 were casual in
nature, a significant proportion of which
were in the construction sector, it makes no
attempt to discuss the predicament of such
insecure livelihoods and the significance of
this trend as a marker of the huge exclusion
of job seekers from the market.
Skill development
While the paper places on record its appre-
ciation of the efforts made by the National
Skills Development Council (NSDC), it
recognizes that at present only 12.5 per cent
of the workforce in India has participated
in any kind of formal skill development
programme. The paper sets a target of 25
per cent by the end of the Twelfth Plan,
which implies that an additional 70 million
persons would have to be skilled in the next
five years.
The measures outlined in the paper to
this end include:
Policy Initiatives on Livelihoods: Emerging Scenario 39
1. overhauling of the Industrial Training
Institutes (ITIs) and the Industrial
Training Centres (ITCs) in the coun-
try,
2. aligning the nature of skill formation
with the nature of emerging demand for
skills,
3. establishment of a robust national cer-
tification and accreditation system and,
in particular,
4. ensuring that the poor have access to
funds for pursuing skill development
programmes.
From a livelihoods perspective, it is not
clear how 70 million persons can expect
to be skilled in the next five years. Would
industrial and agricultural growth be
healthy enough to demand so many skilled
resources? Can NSDC cater to such a wide
diversity of needs? Does India have the
institutional architecture to deliver skills
programmes of the desired scale and quality,
for all categories of job seekers?
Social and regional equity
Finally, the AP in its chapter of social and
regional equity has identified excluded
groups as SCs, STs, Other Backward Classes
(OBCs), Primitive Tribal Groups (PTGs),
semi-nomadic and nomadic tribes, minori-
ties, differently abled persons, widows, les-
bian, gay, bisexual and transgender (LGBT)
groups, senior citizens, internally displaced
people, people living with AIDS, victims of
substance abuse, manual scavengers, street
vendors, etc. It is a welcome sign that specific
groups of people have been clearly identified
to address their needs of social inclusion and
livelihoods. However, apart from a pure
schematic approach that the governments
can take, prescriptions on what must exactly
be done for them are unclear.
Manual scavengers bill
Approximately 1.2 million manual scaven-
gers exist and operate in India today. Called
by different names in different parts of India,
they perform the same job of removing
human excreta from dry toilets of private
homes, public toilets, Indian railways and
the Indian Army. Their practice is centuries
old and refuses to go away. Almost all the
manual scavengers are Dalit Hindus and
Muslims (Hella and Halalkhor), subject to
several deprivations associated with caste,
basic human dignity and health, education
and nutrition. While the discourse on man-
ual scavengers has been strongly vocal on the
abolition of this age-old practice, discussion
on policy interventions to develop alternate
livelihoods has been fairly tepid.
Manual scavenging was abolished by an
Act of 1993 to be adopted and implemented
by state governments. However, on ground,
even after 19 years, Rajasthan and Uttar
Pradesh have not adopted it while Kerala,
Nagaland and Puducherry have reported
that they do not need to adopt it. However,
official statistics of Union Ministry of Social
Justice and Empowerment reveals that
number of dry toilets in Kerala is 1,339,
Nagaland is 1,800 and Puducherry is 476.1
Even in states where the law has been
adopted in principle, it is yet to be fully
implemented in either spirit or practice. The
National Scheme of Liberation of Scavengers
(NSLS) came into being in 1993 along
with the Act and was later renamed as Self
Employment Scheme for Rehabilitation of
Manual Scavengers (SRMS). State govern-
ments claimed that 7.70 lakh manual scav-
engers were identified in 1993, of which 4.28
lakh had already benefited from the NSLS,
thereby, leaving 3.42 lakh to be reached
under SRMS. As on 31 December 2009,
SRMS claims to have benefited about 1.17
lakh manual scavengers.2
The above data may be contrasted
with the Census 2011 figures, as quoted
by the National Campaign on Dignity
and Abolition of Manual Scavenging, the
1 Appendix I to the scheme as published in http://
socialjustice.nic.in/srmsanne.php2 http://socialjustice.nic.in/srmsanne.php

40 STATE OF INDIA’S LIVELIHOODS REPORT 2012
Rashtriya Garima Abhiyan (RGA). As per
the Census, there are 7.94 lakh dry toilets
in India being cleaned by humans with
another 4.97 lakh being left to the services
of animals that ingest human faeces. These
figures do not include the dry latrines of
the Indian Railways (letter dated 2 April
2012 by Garima Abhiyan to Mr Mukul
Wasnik, Minister on Social Justice and
Empowerment).
Clearly, had the rehabilitation of manual
scavengers been as successful as is being
claimed by official figures, the need for a
more comprehensive, wider and deeper
law would not arise. However, the need and
demand both exist. The answer lies in the
observations made by the National Advisory
Council (NAC) on 23 October 2010.3 In
section 5.2 of page 7 it writes:
1. The large majority of persons benefited
under the programme were not actually
engaged as manual scavengers.
2. An estimated 95% of manual scavengers
are women, whereas majority of the
schemes and beneficiaries are men.
3. Many of the scavengers are older women
with little education, skill and experience;
a loan and subsidized enterprise pro-
gramme is mostly useless for them.
4. There is also evidence of large scale
corruption, lack of transparency, delay,
uncertainty and harassment.
The central message remains that the
rehabilitation scheme was ill designed,
suffering from large-scale corruption and
lack of commitment on the part of state
governments.
The need for the new law emanates from
multiple considerations. First, manual scav-
enging is not a sanitation issue which falls
under the state list, but part of the mission
to remove untouchability, a constitutional
obligation. The law needs to define scaven-
gers more widely to include not just those
who remove the waste by hand but also
those who use brooms, pans and barrows.
The existence of such latrines must be a
punishable offence, and time-bound demo-
lition of such structures must be part and
parcel of the law. Further, the law should
make it explicit that the manual scavenger
is the victim and not the agent of the unlaw-
ful action and, hence, cannot be punished
under the Act.
Second, the new law should be based on a
credible survey that can dispel the lies of the
state governments that summarily deny the
existence of the practice in their geographies
in order to avoid doing anything about it.
The survey the NAC proposes should be
designed with active representation of both
the manual scavengers as well as the admin-
istration. The survey design should ensure
the inclusion of individuals who have been
engaged in manual scavenging for the last
10 years and are still unable to find alternate
employment.
The new law also must have new ways of
rehabilitating erstwhile scavengers. Socio-
economic history has demonstrated in no
uncertain terms that leaving it to the ‘res-
cued’ scavenger to find enterprise-based self-
employment is no solution. The RGA 2012 as
well as the NAC (2011) recommend that
1. All manual scavengers be identified and
provided multi-dimensional support
under a single scheme rather than a
variety of separate schemes that are dif-
ficult to administer and track and lead
to duplication of benefits to one house-
hold while another remains entirely
unreached
2. Loans under the scheme be replaced by
grants
3. All manual scavenger households receive
BPL cards
4. Housing support be extended to these
families under the Rajiv Awas Yojana
(RAY)
5. Manual scavengers employed in public
authorities be employed on secure terms
as regular staff and not under some
separate discriminatory head of manual
scavengers3 http://nac.nic.in/pdf/manual_scavenging.pdf

Policy Initiatives on Livelihoods: Emerging Scenario 41
6. The NAC, in particular, has also recom-
mended a monthly pension on `2,000
pension to all elderly women who have
been employed in manual scavenging
7. The RGA has demanded that land be
given to these families in their villages,
as part of their rehabilitation
The Prohibition of Employment as
Manual Scavengers and Their Rehabilitation
Bill 2012 was expected to be introduced in
the Parliament in the monsoon session but
it was not. While the new bill does address
some concerns of the NAC and the RGA, in
its present form it just does not seem to be
adequate to eradicate the evil has remained
so pervasive in India’s history. However, a
new beginning is indeed being made, and
this time the primary stakeholders, the
scavengers themselves, are a national force
to reckon with; so hopefully a better solution
will emerge.
Street vendors bill
The exact number of street vendors India
is not clearly known. One estimate puts
it at 2.5 per cent of our urban population
(Bhowmick, 2005). If we assumed that
about 40 per cent of the Indian population
is urban, that would give us a number of 12
million street vendors. The definition of a
street vendor can itself be a matter of debate.
The Model Bill of 2009 defines street vendor
as a person who sells merchandise of every-
day use or offering services to general pub-
lic, from any temporary built-up structure
or by moving from place to place. By this
definition, several thousand temporary tea
stalls run from the campuses of government
offices all over India, offering services pri-
marily to government staff may be excluded
from being termed as street vendor.
Definitions notwithstanding, the real
challenge for street vendors is gaining
legitimacy from the State. Street vending is a
wholly justifiable pursuit of livelihood from
a market and societal perspective; everyone
agrees that street vendors provide relevant,
reasonably priced and often valuable serv-
ices to homes and the public at large. In the
eyes of the general citizenry, street vending
is perfectly legitimate. The struggle lies with
establishing legitimacy in the eyes of the
State. A corollary of that legitimacy is access
to land and scope of improving their liveli-
hoods. The instrumentalities of the State, the
police and the civil authorities harass them
and arbitrarily confiscate their merchandise.
Individuals from police and civic authorities
regularly extract bribes from them. Often,
when a section of the organized market faces
competition from street vendors, it uses the
police and civic authorities to try to throw
them out of business.
Our interest in street vendors stems
from the fact that they form an important
component of the urban informal sector
that provides employment and livelihoods
to millions, no matter what the exact head
count may be. Therefore, we will, in this
section, make an attempt to capture their
journey to legitimacy through a piece of
legislation long awaited.
The evolution of their journey to legiti-
macy is about 22 years old. The Supreme
Court in its judgement in 1989 (Bhowmick,
2010: 12) declared that street vending
needs regulation, but street vending as a
right to carry out business as per funda-
mental right enshrined in Article 19(1)(g)
of the Constitution cannot be denied on
the ground that streets, pavements and
walkways are only for passing. This ruling,
of course, did not make any difference to
their lives on the streets of India. In 1989,
the National Alliance of Street Vendors of
India (NASVI) was born in Ahmedabad,
as an initiative of Self Employed Women’s
Association (SEWA), and they conducted
a pan-India survey from 1999 to 2000,
which was shared in a national workshop
hosted by Urban Development Ministry of
Government of India. A national task force
was constituted by the Ministry to formulate
a national policy, which came into existence
in 2004. The new government accepted it,
and the task of formulating a law was given

42 STATE OF INDIA’S LIVELIHOODS REPORT 2012
to National Commission on Enterprises in
the Un-organized Sector. A new version of
the policy came into existence in 2007, after
which a model law was written in 2009 by
the Ministry of Housing and Urban Poverty
Alleviation, which has so far not been placed
before the Parliament. However, a few states
like Odisha, Madhya Pradesh, Rajasthan
and Uttar Pradesh have adopted the model
bill and enacted their own law. But the two
states that probably have the largest number
of street vendors, Maharashtra and Delhi,
have not enacted it yet. In Mumbai alone,
there are about 2.5 lakh vendors and in Delhi
around 3 lakhs, earning their living through
street vending.
We will report the major shortcomings
of the model law as pointed out by experts
and by civil society, after which we will also
report a good practice that emanated from
a good policy. Major shortcomings of the
model law are as follows:
1. Regularization of natural markets that
get created adjacent to railway stations,
hospitals, big office buildings and the
like was recognized as a need and recom-
mended by the national policy but the
model law is silent on the matter.
2. The model law does not lay down that
in the registration for allotment of new
space, existing vendors will receive pri-
ority. Consequently, it is widely expected
that this will be auctioned on partisan
lines and or on bribes.
3. The national policy opined that eviction
should be the last resort and, if evicted,
the vendors should be given alternate
space to sell their wares in a way that
there is no adverse impact on their
incomes. The model law overlooks this
aspect completely, implying that civic
authorities can evict as they wish.
4. Many rural agglomerations have street
vending as well and the model law offers
no protection to them.
5. The model law is silent on the protection
of vending space in railway stations which
is one of the major demands of NASVI.
6. Another key demand of the NASVI is
for a Panchnama procedure to be fol-
lowed in the event of confiscation of
goods such that all goods confiscated
are first officially listed and then an
official receipt issued. The Andhra
Pradesh Ordinance on Street Vendors
actually has such a clause. The model
law, however, does not mandate such
procedure.
After the model law was drafted in 2009,
two subsequent developments are worth
mentioning. One is the landmark judgement
by the Supreme Court on 8 October 2010
to appoint Town Vending Committees to
regulate street vending and in the process of
regulation, allocate public spaces dedicated
to it. 4 In the same judgement, the Supreme
Court has asked the Union Government to
pass the law by 30 June 2011. This judge-
ment is even more clear about vending as a
fundamental right under Article 19(1)(g).
The second is a good practice that
emerged in Odisha that enacted the law
for street vendors only for Bhubaneswar
city and implemented it in due earnest. As
a result, substantial positive changes have
been observed. This is also a case where
public authorities (in allocating land, giv-
ing registration, bank finance), private
enterprises (in providing billboard support,
parking support and microfinance) and
community organizations (in conducting
joint survey, land measurement and space
planning) worked together to make it hap-
pen. Fifty two vending zones have been
created in the city wherein 2,198 shops
4 Urban space for street vending must be allocated
on some basis. Since it is widely accepted that about
2–2.5 per cent of the urban population is engaged in
street vending, two options exist (Bhowmick, 2010:
14):
(a) One-third of the pavement area could be allo-
cated to vending while two-thirds was left for
general public use.
(b) Two per cent of urban space could be reserved
for the street vendors.

Policy Initiatives on Livelihoods: Emerging Scenario 43
have been regularized. A study done by
Bhubaneswar Municipal Corporation and
NASVI surveyed the street vendor condi-
tions in late 2009 and observed a marked
difference in the experiences of the vendors
as they went about their daily business. In
allocating urban space, existing vendors
had been given priority, one-third of the
pavement space was clearly demarcated
for them, harassments have come down
drastically, sales have increased and so have
stocks.5 As all the stakeholders have a sense
of ownership of both the process as well as
the goals of a piece of legislation, legitimacy
by the State has been established not only in
regulation but also in the genuine promo-
tion of livelihoods.
Women farmers’ bill 2012
Before we embark on a discussion of the bill,
we would like to make the case for inclusion
of women farmers in this chapter.
First, let us consider why women farm-
ers are a relevant category in a discussion
on livelihoods for the poor. Several studies
have shown women’s engagement in liveli-
hoods activities of household is undergo-
ing a transformative change that has been
underway over the last two decades. As
men are moving to the cities and towns for
jobs, women’s works have enlarged from
households, animal-rearing to a deep and
wide involvement in agriculture, producing
food and other crops for consumption and
sale. As many as 80 per cent of rural women
workers are in engaged in agriculture com-
pared to 70 per cent men (NCW, 2005: 12).
Women are now primarily responsible for
crop production, from sowing to harvesting.
Agricultural work is adding to their daily
routine in a massive way throughout the
year with implications on health, stamina,
stress and overall well-being. Is the policy
domain conducive for this transformative
change? What are the policy issues that affect
women when they are farming? This is the
context in which we are discussing the case
of women farmers.
Though 80 per cent of rural women
workers are in agriculture, only 12.37 per
cent of women (Ministry of Agriculture,
2005–2006) own the land they till. The land
she works on either belongs to her husband
or to her in-laws. She neither owns it by
marriage nor by inheritance. Moreover,
since the land does not belong to her, she is
not considered a farmer; she is not eligible
for agricultural credit, crop insurance or any
state support that goes to rural households,
leave alone the dignity that is traditionally
associated with farming.
There are three areas of policy that con-
front women as farmers. One is her right in
marriage to the agricultural land her hus-
band has; second, is her right of inheritance
under Hindu or Muslim succession laws’
and third, is her recognition as a farmer and
her right to be supported by agricultural
policies of the state and the market.
Presently, women do not have any prop-
erty rights in their marriage; the extent of
her right to her husband’s property either
acquired in marriage or in succession is
decided by the courts on a case-to-case
basis. In terms of inheritance from her
paternal home, The Hindu Succession Act
1956 has two streams called Mitakshara
and Dayabhaga. To begin with, only in
the Dayabhaga system (prevalent in West
Bengal and Andhra Pradesh), the woman
had equal inheritance rights on her parental
property. With the 2005 amendment to the
Hindu Succession Act, the right has now
been extended to the Mitakshara tradi-
tion as well. However, both fail miserably
when it comes to implementation. Without
property rights, women farmers simply
cannot claim any support from agricultural
policy initiatives. The Women Farmers’
Entitlement Bill 2012 seeks to address these
three gaps together in one go.
This Bill was introduced in the Rajya
Sabha as a private member’s Bill in May 2012
by Professor M. S. Swaminathan, regarded 5 For details, see http://www.nasvinet.org/userfiles/
file/case%20study%20-empowering.pdf

44 STATE OF INDIA’S LIVELIHOODS REPORT 2012
as the architect of Indian Green Revolution
and a member of the Rajya Sabha. Clause 5
of the Act has the most sweeping provision:
a woman will have equal right to all proper-
ties, including all land, which belong to her
husband no matter how the land is acquired,
and concurrence of both the husband and
wife is mandatory for any land transaction.
The explanation is even more radical: it gives
the woman an automatic ownership right
to all property of her husband, irrespective
of her name appearing on any ownership
document. The mere fact that she is some-
one’s wife is enough in this matter. This is
a controversial clause as it contradicts some
of the existing laws of the land like marriage
laws, succession laws, property laws, regis-
tration laws, etc. So this would necessitate
good legal analysis.
Further, the Bill defines agriculture to
include an array of activities associated with
agriculture and is not limited to cultiva-
tion only. Also it is heartening to see water
rights specifically dealt with as a section in
the Bill.
The Bill, however, is seriously flawed in
its conceptualization of the implementation,
monitoring and enforcement aspects. It
tends to create exclusive new authorities for
women, thus, giving the signal that main-
stream existing authorities will continue to
work for men, and new exclusive authorities
will work for women. Some core criticisms
that may be levelled against the Bill are (see
RDI, 2007, 2012 for more details):
1. Certification process: While relying
on the Gram Sabha and the Gram
Panchayat to recommend and certify a
woman farmer is a good idea, we have
to be aware of the acute problems of
class–caste capture of the Gram Sabha
and Gram Panchayats; so second-tier
alternate process involving the Block
Development Officer should be in
place.
2. Land rights section only deals with
married women. This is a very limited
approach; unmarried women over 30,
widows and abandoned women should
also get the same right. So the land rights
section needs to be amended.
3. Several separate initiatives are suggested
in the Bill, like a separate fund for
women farmers, separate body, sepa-
rate social security schemes for women
farmers, separate authority to acquire
land for women farmers, etc. This form
of segregation may reinforce existing
dogmas and patriarchy and one set of
institutions meant for men and the other
for women may work at cross-purposes
which would be fruitless.
However , the Women Farmers ’
Entitlement Bill is a much-needed policy
of pervasive significance. It should be subject
to healthy debate and a comprehensive and
sound policy document should be drafted
to bring in the social and economic path
correction that is long-awaited.
Policy challenges on livelihoods in central India
Central India has a very high proportion of
ST and SC population, locked in a terrain of
forests and completely rain-fed agriculture,
interspersed with vast stretches of barren
land. In terms of political geography, bits
of Bihar, Odisha, West Bengal, Jharkhand,
Chhattisgarh and Andhra Pradesh along
with parts of Maharashtra coalesce to form
this large pocket of extreme deprivation and
exclusion that is in the grips of left wing
extremism. Comparison of relevant data
from these 78 districts with other parts of
the same states throws up many contrasts
(see Table 3.3).
Table 3.3 undoubtedly establishes the
fact that these areas are backward relative
to other regions of the same states, both
in terms of human as well as economic
development parameters. ST/SC popula-
tion is significantly more, illiteracy is high,
landlessness is high, urbanization is less,
forest cover is very high and per-capita
production is low.

Policy Initiatives on Livelihoods: Emerging Scenario 45
Table 3.3: Factors that distinguish the affected and forward districts
Odisha Jharkhand Chhattisgarh Bihar
Andhra
Pradesh
This
area
Other
area
This
area
Other
area
This
area
Other
area
This
area
Other
area
This
area
Other
area
SC/ST % 65 23 45 30 69 36 19 18 26 22
Literacy % 44 76 40 51 50 68 46 48 56 68
Infant mortality % 123 73 NA NA 76 57 NA NA 34 27
Urbanization % 17 23 10 37 7 29 12 8.6 24 28
Forest cover % 39 15 38 16 53 28 8 1 17 14
Agri-labour % 35 25 29 20 26 34 52 46 40 51
Per capita foodgrain
production
95 151 NA NA NA NA NA NA 121 293
Rural households without
any bank account
% 81 80 77 74 83 82 83 80 69 72
Rural households without
specified asset
% 63 37 46 36 47 31 53 50 56 41
Source: Planning Commission (2008: 21).
Note: NA: Not applicable.
There is now a clear recognition of
governance deficit in these zones in official
literature (Planning Commission, 2008,
Section 1.17.4). The Planning Commission
document clearly recognizes the failure
and links it with the nature of caste, class,
landed composition of the political class
and bureaucracy. The report proposes a set
of measures to (a) strengthen Panchayats’
Extension to Scheduled Areas Act (PESA)
governance in the region, (b) improve land
governance, (c) widen scope of tribal liveli-
hoods interventions, (d) empower oversight
bodies like NCW, National Commission
for SC–ST and National Human Rights
Commission (NHRC). This provides us
with the context in which we will look at
the State’s intervention thus far, particularly
three development policy interventions of
the State.
Integrated Action Plan (IAP)
Eighty-two districts of nine states were
selected in 2010–2011 to prepare and imple-
ment an integrated action plan under the
Backward Regions Grant Fund programme
for which a sum of ̀ 25 crore per district was
earmarked for financial year (FY) 2011 and
`30 crore per district was allocated in 2012.
The IAP is meant for improving the physical
infrastructure of the districts towards human
development, economic development and
from the security perspective. The district
collector, the superintendent of police and
the district forest officer are entrusted with
the task of jointly monitoring the prepara-
tion and implementation of the plan. The
committee is expected to draw up schemes
for developing school buildings, anganwadi
centres, primary health centres, drinking
water supply, village roads, electric lights in
public places, etc. The scheme so selected is
expected to show results in the short term.
The development commissioner/equivalent
officer in charge of development in the state
is accountable for scrutiny of expenditure
and monitoring of the IAP. Macro-level
monitoring of the IAP will be carried out
by the committee headed by the member-
secretary, Planning Commission.6
6 An area of concern, however, is that planning is the
most important responsibility of the three-tiered local
government established by our Constitution, but in the
IAP, the responsibility for planning lies with the three
top bureaucrats of the districts. Thus, it actually denies
the constitutional right of the elected local governments
and in the process forecloses the opportunity to involve
the larger citizenry in the planning process.

46 STATE OF INDIA’S LIVELIHOODS REPORT 2012
It is heartening to note that efforts have
been made to adapt some of the existing
schemes to the local context. For exam-
ple, while the Indira Awas Yojana (IAY)
guidelines for the rest of the country do
not permit construction of houses by any
civic authority; in IAP areas, involvement of
civic authorities in construction is permit-
ted. Further, `48,000 are allocated as cost
per dwelling unit under IAY in areas under
IAP as opposed to `45,000 as is the norm
elsewhere. Even the Pradhan Mantri Gram
Sadak Yojana (PMGSY) which is envisaged
to provide to provide all-weather rural
road connectivity to all habitations with
a population of 500 persons and above in
the plain areas extends itself to habitations
of 250 persons and above in hill states, the
tribal and the desert areas. MGNREGA and
Backward Regions Grant Fund (BRGF) are
allowed to recruit a panchayat development
officer appointed in each Gram Panchayat
of areas under IAP.
Integration in the context should mani-
fest in
1. geographical integration of various
schemes adapted to specific context of
the districts;
2. integration of people’s aspirations into
the planning process and priorities;
3. vertical integration of plans from below;
and
4. going beyond existing schemes and for-
mulating new ones to address emerging
needs of the people and the area.
However, no innovative local schemes
have emerged thus far from the IAP.
Further, there is no discernible trend on geo-
graphical, vertical or schematic integration.
For example, one would have expected that
the various rural housing schemes would be
integrated under the IAY and their condi-
tionality streamlined and adapted to local
conditions; this has not happened. Most
importantly, none of the recommendations
of the expert group report on extremist areas
(Planning Commission, 2008: 62–82) was
incorporated in the integrated planning
process.
Prime Minister’s Rural Development Fellowships (PMRDFs)
PMRDF is in a way designed to address
what we may call the integration deficit in
planning. Young bright minds are invited
to join the cadre for 2–3 years to assist the
district collector and his/her colleagues to
do the following:
1. Strengthen the district resource base
for programming by finding ways of
resourcing all the planned activities and
rational budgeting.
2. Establish or strengthen systems by
exploring alternative ways of delivering
services to reach the most deprived com-
munities.
3. Trigger processes which would support
the changes that have been envisioned in
this approach (e.g., village planning).
The expectation from the fellowship is
twofold: (a) the young minds will have the
courage to take this as a challenge and (b)
they would not be bound by stereotypically
crammed bureaucratic ways of thinking and
would bring in fresh perspectives.
A reasonably high pay of `65,000 per
month and `75,000 per month respectively
for the first two years has been fixed to keep
it attractive enough to invite bright candi-
dates. When recruited, the fellows undergo
basic training on public administration and
rural development issues and, thereafter, are
placed with the district collector in 78 IAP
districts. They are expected to assist the dis-
trict collector in the three above areas so that
improved integration can take place. So far,
156 candidates have been selected, and they
are undergoing training in two batches. Their
placement has been completed by August
2012. Selected fellows are all well qualified
with MBAs, M.Coms and other postgraduate
degrees, including a few PhDs.
Since the scheme has not matured
enough for us to comment on its effectiveness,
Policy Initiatives on Livelihoods: Emerging Scenario 47
only a few preliminary conjectures can be
made based on the experiences of public
administration:
1. Success of the fellows in delivering
results will depend crucially on their
being given the requisite freedom to
think and work innovatively, keeping
in mind that they do not get bogged
down by the usual rigmarole of district
administration.
2. Success is also dependent on the avail-
ability of reliable data not only on inputs
but on outputs and outcomes, which
often is a limitation within the govern-
ment system, thanks to the various
compulsions of the departments.
3. Knowing that physical capital does not
often lead to any development without
commensurate development of human
and social capital, their success will
depend on how much they can influence
the district administration to provide
adequate emphasis on formation of
human and social capital along with
improving physical infrastructure of the
district.
4. Much will depend on the level of com-
mitment the fellows can demonstrate
to work in such districts that are far
more backward than their homes and
erstwhile workplaces. They will need
to adjust to the difficulties associated
with such districts and yet work towards
improving lives here. This is not an easy
expectation to meet.
However, the two years they spend will
hopefully produce in their work an external
perspective on understanding the ethnogra-
phy of in these districts and create impactful
and innovative solutions.
Bharat Rural Livelihoods Foundation (BRLF)
The BRLF has been envisaged by the
Government of India as a corporate entity
with a corpus of `1,000 crore of which
the government commits `500 crore and
corporate India pitches in with the rest. Big
industrial houses have been approached to
contribute to the corpus. The Foundation
will not be structured as a government body
but as a corporate entity with a chairperson
and CEO. The government is expected to be
a minority in the BRLF Board. It is not only
about garnering private sector funding for
development of this region, but to get the
private sector involved in the development
of the region, through investments into the
economy and human development.
The Foundation will take up research,
pilots, implementation and innovative
projects in 170 districts of India of which
78 are LWE-affected districts. Since the
government is present in the Foundation, it
is expected that the BRLF will work in close
synergy with state and local governments.
On 27 April 2012, a national workshop
did bring in a large cross section of develop-
ment players, including the corporate sector
representatives and civil society representa-
tives to deliberate on the Foundation. The
initial buzz is very exciting, and we will have
to wait and see how it unfolds.
NULM
Urbanization in India is a rapidly expand-
ing phenomenon; 377 million persons now
live in cities which contribute to 60 per cent
of India’s GDP. Of the urban population,
26 per cent of them are poor, but the Gini
Index for urbanity in India has increased
from 0.34 to 0.38 over the years (NULM,
2012: 33–44).
Urban poverty is multi-dimensional. The
urban poor face multiple deprivations—
inadequate access to affordable housing,
basic civic services like water, sanitation,
drainage, solid waste management, roads,
street lighting, health care, education and
social security, and livelihoods opportu-
nities. The dimensions of urban poverty
can be divided into three categories: (a)
residential vulnerability (access to land,
shelter, basic services, etc.); (b) social vul-
nerability (deprivations related gender,

48 STATE OF INDIA’S LIVELIHOODS REPORT 2012
age and social stratification, lack of social
protection, inadequate voice and partici-
pation in governance structures, etc.) and
(c) occupational vulnerability (precarious
livelihoods, dependence on informal sector
for employment and earnings, lack of job
security, poor working conditions, etc.).
These vulnerabilities are interrelated.
Amongst the urban poor, there are sec-
tions subject to greater vulnerability in terms
of the above classification; these include
women, children, the elderly, SCs, STs,
minorities and differently abled persons who
deserve attention on a priority basis.
Urban poverty and challenges of liveli-
hoods is closely associated with the informal
sector. The sector comprises of people in
self-employment, manufacturing, distribu-
tion, services including domestic services.
The challenge is that of the vicious cycle
created by low skill, low capital, low clientele
base, low productivity, low income and low
investment. If this is the challenge in the
economic domain, in the human develop-
ment domain the challenges relate to land,
shelter, water, sanitation and other basic
services that make a decent living.
Attempts to address urban livelihoods
have always been on the basis of skill devel-
opment and to a lesser extent in improving
supply of credit to self-employed persons.
Microfinance has contributed its bit to
provide easy credit to the self-employed
in the informal sector. The working group
set up by the Planning Commission in the
context of Twelfth Plan recommended three
key areas of interventions—continued focus
on micro-enterprise and skill development,
mandatory creation and allocation of space
for urban poor’s livelihoods and appropriate
legislative action to guarantee decent liveli-
hoods of the urban poor. These three foci
form the basis of NULM.
The guiding principles of NULM (2012:
47–48) are:
1. The urban poor have a strong desire to
improve their quality of life and come
out of the clutches of poverty. They have
the innate capacity to do so. However, key
enablers empowering them to take posi-
tive action in this direction are missing.
2. Social mobilization and building strong
institutions of the poor in urban areas
are critical for unleashing their innate
capabilities. For this, an external, dedi-
cated and sensitive support structure
is essential so as to catalyze social
mobilization, institution-building and
empowerment process of the poor.
3. Access to livelihoods enhancement
opportunities though information,
knowledge, skills training, tools, infra-
structure, credit, marketing, collective
effort, etc., security of tenure, shelter
and basic services enable the urban poor
to gain access to improved living condi-
tions, sustainable livelihoods and come
out of poverty.
4. NULM would aim at universalization of
coverage of the urban poor in access to
skills development and credit facilities.
It will strive on demand for skills train-
ing of the urban poor for market-based
jobs and self-employment, facilitating
easy access to credit through measures
such as a credit guarantee scheme/credit
cards etc.
5. NULM believes that convergence with
policies, programmes and schemes of
other ministries/state governments/
urban local bodies dealing with skills,
livelihoods, entrepreneurship develop-
ment, social assistance, etc., is crucial to
the success of the Mission. It will strive
to enable the urban poor, including
slum-dwellers, street vendors and oth-
ers to access the opportunities made
available through different schemes in
a convergent manner.
The four prongs of intervention under
NULM are: social mobilization to build
institutions of the poor, capacity building
at all levels, skill development and micro-
enterprise support. While these in themselves
look appropriate, there are several concerns
that may be highlighted:

Policy Initiatives on Livelihoods: Emerging Scenario 49
1. Social mobilization can take place on
the basis of affinity related to ethnic
proximity as well as occupational affin-
ity. In urban areas, occupation affini-
ties have traditionally worked better
in terms of trade unions, associations
or cooperatives rather than proximity
affinities of a village or ethnic affinities
of a caste. Therefore, strategies of social
mobilization, in our view, should be
more on occupation lines rather than
on SHG type institutions. Experiences
of SEWA, NASVI, Safai Karmachari
Union, traders’ associations, market
associations, dabbawallahs of Mumbai,
railway vendors associations will bear
this out.
2. However, one lacuna that has plagued
these associations is the inter-play of
class caste –gender dynamic that needs
to be specifically addressed within social
mobilization strategies.
3. The institutional arrangement for skill
building has to be linked with market
need. The work of NSDC in skill build-
ing is a good pointer in this regard
in which an intermediary institution
providing multiple services of skill
building, linking with market and
assessing the market need of present
and future, upgrading skill training
courses is an important intervention.
The present institutions of ITIs and
skill building organizations are fol-
lowing an archaic model that needs a
thorough overhaul.
4. The protection aspect, particularly in
providing protected land and market
space for the informal sector enterprises
and services, is a vital intervention that
needs to be focused upon. That needs a
different kind of urban space planning,
including planning of public spaces and
private housing spaces.
5. Institutional arrangement for skill devel-
opment has to specifically address the
need for continuous skill up gradation
and skill expansion for upward social
mobility.
6. Micro-enterprise development for the
poor is an extremely challenging task as
they do not carry any micro-enterprise
experience from their ancestry. The crux
of this is that facilitation and handhold-
ing have to be for a longer period of
time, until the micro-entrepreneur has
more or less stabilized in her business.
7. Engaging with occupation-based asso-
ciation for expansion of livelihoods
potential has never been a core interven-
tion strategy, and the potential of this
engagement has never been explored
enough. NULM must rectify this mis-
take.
8. Since the service sector is a major pro-
vider of livelihoods of the urban poor,
closing the gap between user and pro-
vider through a dynamic information
system can play an important role. The
NULM has recognized this and plans for
kiosks at every ward, which is a welcome
step.
9. Similarly, it is heartening to note that
financial inclusion, a core component
of livelihoods promotion, is recognized
by the NULM as a core intervention
strategy.
10. Finally, it is important to critically evalu-
ate whether ‘women and community
institutions led and managed by women’
can comprise the most appropriate
vehicle for the task ahead compared to
other vehicles, and that evaluation is still
awaited.
As such, NULM will unfold under the
Twelfth Plan period and, therefore, we have
to wait to see what it delivers on the ground
towards improvement in livelihoods of the
urban poor.
NDP
India is the largest milk producing country in
the world today, and according to the NDP
published by National Dairy Development
Board, 70–75 million households in India
produced nearly 121.8 million tons of milk
50 STATE OF INDIA’S LIVELIHOODS REPORT 2012
in 2010–2011. However, demand for milk is
projected to increase to 155 million tons at
the end of 2016–2017 and 200 million ton
by 2021–2022 (NDP, 2012) implying that
the production capacity of milk has to be
almost doubled in next 10 years. NDP has
been conceived as a national initiative by
the Ministry of Agriculture, Government
of India, to double the production capacity
of milch animals in the country through
an array of technological and institutional
measures.
The total outlay of the NDP over a
15-year period is `17,300 crore of which
NDP-I with a six years’ outlay of `2,242
crore is going to be implemented in
Andhra Pradesh, Bihar, Gujarat, Haryana,
Karnataka, Kerala, Madhya Pradesh,
Maharashtra, Odisha, Punjab, Rajasthan,
Tamil Nadu, Uttar Pradesh and West
Bengal. These states contribute 90 per cent
of the milk production in India, 87 per cent
of the breedable cattle and 98 per cent of the
fodder resources.
The NDP aims to breed 2,500 disease
free buffalo bulls with high genetic merit
to produce 100 million semen doses by the
terminal year and hire and train 3,000 arti-
ficial insemination professionals to deliver
artificial insemination services to the milk
producers at their doorstep. The project
also proposes to create 40,000 local resource
persons, who will train the producers on
ration balancing so that the milch cows
and buffalos are fed in a scientific way. The
project expects to produce 7,500 tons of
fodder seeds so that the producers can meet
their fodder needs.
The project will help strengthen the
capacities of existing milk cooperatives
and cooperative federations, and may be
expected to encourage producers to form
producer companies. The project will be
rolled out through an array of implementing
agencies, the most important of them being
the milk cooperatives and milk federations.
At present milk collection covers 40,000
villages which the project expects to expand
to 61,000.
Since the basic production model is
based on enhancing production capacity of
individual milk producers through artificial
insemination, it is expected that the higher
milk production at home will give rise to
higher household income. Though this is
not an explicit objective of the project, it
is indeed a highly desirable, if unintended,
consequence that has a significant bear-
ing on livelihoods augmentation of the
individual milk producers who are largely
women, among the 70–75 million small and
marginal farming or landless households of
rural India.
At the time writing this chapter, the NDP
has just commenced, so the time has not
come to report its progress.
Land Acquisition, Resettlement and Rehabilitation (LARR) Bill 2011
The LARR Bill was discussed in last year’s
State of India’s Livelihoods Report (SOIL)
2011 report. The major development that
took place in the intervening period is
that both the resettlement and rehabilita-
tion bill and the land acquisition bill were
put under one comprehensive bill, called
the Land Acquisition, Resettlement and
Rehabilitation Bill 2011 and placed again
in the Parliament. Some other significant
changes were also brought in as a result of
wide discussions on the earlier drafts among
various sections of the society. At the time
of the writing this section, the parliamen-
tary standing committee has also given its
report on the present draft placed in the
Parliament. Political parties, civil society,
academia and industry have commented
upon it, and their concerns have been incor-
porated in the present draft. Therefore, at
least it may be said that the Bill tabled in the
Parliament now is the latest and improved
version, although it may not be the best
possible version yet.
It is important to clarify why the LARR
Bill has been taken up for discussion in the
chapter on policy on livelihoods. It is well

Policy Initiatives on Livelihoods: Emerging Scenario 51
known that land acquisition, irrespective
of its purpose, has destroyed livelihoods on
one hand and created new livelihoods on
the other. In its wake, farmers, pastoralists,
horticulturists, agricultural labourers and
share-croppers have lost their livelihoods,
while blue and white colour jobs, as well
as jobs in the informal sector such as shop-
keepers, transporters, hawkers, hoteliers,
contractors, construction labourers and the
like have been created. In most cases, land
acquired by government from the farm-
ers has been given to industries, railways,
highways, defence establishments, housing
projects or private companies and never the
other way round.
The doctrine of eminent domain has
been applied to serve a ‘public purpose’
where a few are compelled to sacrifice
in order to serve the interests of many
(although it has not always been demon-
strated that this condition is being met). So
far, farmers, tenants, landless labourers and
post-harvest processors who are essentially
Dalits, tribals and poor women have been
made to sacrifice.
Is the new LARR Bill able to minimize
that sacrifice while providing for new/pro-
ductive/alternate livelihoods for the project
affected persons, so that land acquisition
generates a win-win outcome for all rather
than a lose-win trade-off that plays out
adversely for peoples who already have so
little to lose? Let’s take stock of the major
features of the Bill before we take up dis-
cussions of the various concerns expressed
from many quarters. Box 3.1 captures the
salient features.
While the LARR Bill 2011 makes sig-
nificant provisions for reducing the loss to
1. Land acquisition can take place for pri-
vate companies and PPP ventures only
if 80 per cent of the affected households
give their consent.
2. For railways, special economic zones
(SEZs), highways, petroleum pipeline,
mines, etc., the LARR Bill would not
apply.
3. While in case of private companies,
the public purpose once stated cannot
change; for government establishments
it can.
4. Project affected persons will include both
land losers and livelihoods losers such as
landless workers, tenants, dependents,
forest right holders and fisher folk.
5. When private companies are in need of
land they must purchase 70 per cent of
the land that they need directly from the
landowners. Only then will the govern-
ment acquire the pending 30 per cent by
invoking the LARR Act.
6. Resettlement and rehabilitation provi-
sions would apply when private com-
panies purchase more than 100 acres of
land and government acquires any land.
Multi-crop irrigated land would not be
acquired unless absolutely unavoidable,
and will not exceed 5 per cent of multi-
crop irrigated area in a district.
7. When multi-crop area is acquired, an
equivalent amount of waste land has to
be developed.
8. Compensation is calculated to be the
sum of (double the market price plus
solatium). In case of the body for whom
the land is being acquired wants to offer
shares to the affected families, the value
of shares cannot exceed 25 per cent of
the sum mentioned.
9. The resettlement and rehabilitation
package includes the option of a job
and/or annuity of `2000 per month
for 20 years or `30,000 for a year. One
house is allocated under the Indira Awas
Yojana, one acre of land if land is taken
for irrigation project.
10. Also a onetime transportation allow-
ance of `50,000 and a resettlement
allowance of `500,000 per household
are mandated under the Act.
11. Provisions for Infrastructural facilities
at resettlement and rehabilitation area.
Source: Compiled by author from the LARR
Bill 2011.
Box 3.1: Salient features of LARR 2011

52 STATE OF INDIA’S LIVELIHOODS REPORT 2012
the affected families, critical concerns still
remain.
1. The provisions of this Act do not apply
when land is being acquired for cer-
tain uses such as railways, highways,
petroleum pipelines and SEZs among
others. These lands are acquired under
the relevant act as mentioned earlier.
Such exclusion creates clear inequities
among the affected families for whom
the ‘loftiness’ of the purpose for which
they are being displaced does noth-
ing to ameliorate the distress of the
displacement of an already precarious
existence. Which Act is applied for
acquisition is irrelevant for them. What
matters is that all the Acts must treat
them as equal. Not addressing this
violates the principles of natural justice
(ASHA, 2011).
2. Although several examples of public
purpose have been given in the Bill, the
definition of public purpose remains
unclear: What is public about the
purpose? Who constitute the public
and who do not? These are questions
that have not been answered (SCRD,
2012: 20).
3. It has been emphasized that public pur-
pose should be only limited to physical
infrastructure, irrigation and electricity
generation and should not include land
acquisition for private companies in any
circumstance (Ibid.: 26).
4. The doctrine of eminent domain has
been repeatedly questioned. All stake-
holders must be partners in develop-
ment. Eminent domain, a vestige of
the British Raj, is a purely utilitarian
doctrine that goes against principles of
human rights, participation, equal stake
holding (Ghatak, 2011).
5. Several clauses of the Bill have been
criticized: for example, a clause states
that if land allocated for a purpose lies
unutilized for 10 years, it will go back to
the government, but not to the original
landowners.
6. Compensation on the basis of market
value is an arbitrary concept, as market
value is determined on past use of land
and not on future use of land. As soon
as the land classification changes, from
agriculture to homestead or others,
the market value goes up, the benefit
of which goes to the government and
industry and not to the farmer.
7. While the role of the central and state
government in acquisition is clear, the
role of local self-governments is not at
all clear with regard to acquisition, reset-
tlement and rehabilitation.
8. Sale and purchase of land is a state sub-
ject, so the R&R provisions should be
done by respective state governments
(SCRD, 2012: 35).
Substantive change to anchor the role
and centrality of local self-governments in
acquisition, resettlement and rehabilita-
tion in the form of changing the preamble
of the Bill itself suggested by Standing
Committee is worth mentioning. ‘A Bill to
ensure, in concert with local institutions of
self-government and Gram Sabhas estab-
lished under the Constitution, a humane,
participative, informed, consultative and
transparent process for land acquisition’
(SCRD, 2012). The standing committee also
recommends that restriction on acquisitions
up to 5 per cent and 10 per cent of land in
a district should be applicable to all land
under cultivation.
The discourse on land acquisition has
three dimensions: adequate compensation
to both land and livelihood losers, restric-
tions on acquisition of fertile land as well as
acquisition of land for use by private compa-
nies, and integration of the land acquisition
process with resettlement and rehabilitation
of project-affected persons. R&R does not
merely entail relocation and housing with
monetary and social welfare support from
the government. Rehabilitation must be
aimed as rebuilding the lives and livelihoods
of the project-affected families in the longer
term much in the same way that the project

Policy Initiatives on Livelihoods: Emerging Scenario 53
expects to benefit blue and white collar
workers, engineers, contractors, architects,
businesspersons and traders. The LARR Bill
falls seriously short on this count.
Debate on Food Security Bill
No explanation is perhaps needed on why
the food security bill is being considered for
discussion in this chapter. Food is perhaps
the first requirement of a decent liveli-
hood. Hundreds of millions of Indians are
still food insecure for reasons that are well
documented in literature. We will focus here
only on the Food Security Bill as it holds a
promise to those Indians.
The bill’s current version
The NFSB 2011 has in Section 2(7) defined
food security as the supply of the entitled
quantity of foodgrains and meals to house-
holds under the targeted public distribution
system (TPDS), pregnant women, lactating
mothers, children, special groups, emer-
gency and disaster-affected persons, and
persons living in starvation. The Bill has
brought all the food programmes running
under ICDS, TPDS and MDM schemes for
BPL families, primary and upper primary
school-going children, pre-school children
going to angwanwadis and pregnant and
lactating mothers going to angwanwadis
under a single umbrella. The NFSB aims to
bring in 75 per cent of the rural and 50 per
cent of the urban population into its fold; 46
per cent rural population and 28 per cent of
the urban population are to be identified as
priority households, the criteria for which
will be decided by the central government.
Table 3.4 describes provisions of food secu-
rity as defined by the National Food Security
Bill 2011.
One radical departure of the bill is that
it holds the eldest woman as the head of
the household. However, so far the delivery
mechanism is concerned the Bill does not
Table 3.4: Entitlement of food security as defined by the NFSB
For whom Item Amount Price
Priority persons Rice or wheat or coarse
grains
7 kg per person per
month
`3 per kg for wheat, `2
per kg for rice, `1 per kg
for coarse grains
General households Rice or wheat or coarse
grains
3 kg per person per
month
@ 50% of Minimum
Support Price (MSP)
Pregnant women and
lactating mothers
Take home ration in
the form of meal during
pregnancy and 6 months
thereafter and `1,000 for
6 months
600 kcal per day, 18–20
gram protein
No price, packed cooked
meal given
Children 6 months to 3
years
Take home ration 500 kcal per day, 12–15
gram protein
No price for children
Children 3 to 6 years Cooked meal 500 kcal per day, 12–15
gram protein
No price children
Malnourished children of
6 months to 6 years
Take home ration 800 kcal per day, 20–25
gram protein
No price
All students of lower
primary classes, attending
school
Cooked meal 450 kcal per day, 12 gram
protein
No price
All students of upper
primary classes attending
school
Cooked meal 700 kcal per day, 20 gram
protein
No price
All above Food security allowance To be decided
Source: Compiled by author using NFSB Bill 2011.

54 STATE OF INDIA’S LIVELIHOODS REPORT 2012
propose any new institutional architecture.
It depends entirely on existing institutions
of ration shops/fair price shops (FPSs),
primary and upper schools and anganwadis
as delivery outlets; the distribution mecha-
nism reaching food up to these outlets also
remains the same. The only new institu-
tional architecture proposed in the Bill is
related to oversight; it assumes that ensuring
delivery of food grains and other promised
items require close oversight bodies. So the
Bill proposes constitution of a State and
Central Food Security Commission, district
grievance redressal officers at the district
level and vigilance committees at the state,
district, block and FPS levels. Moreover, the
local authorities are empowered under this
Bill to conduct social audit and provide local
oversight to effective distribution.
The state governments have the respon-
sibility under the Bill to make arrangements
for improving the capacity of storage facili-
ties, improving capacity of its civil supplies
department and institutionalizing FPSs.
Critiques of the NFSB 2011
The first critique we would like to take up
is from the Right to Food campaign (RTF,
2011). The RTF campaign has been the
pioneer in anchoring the agenda of hunger
and state responsibility. It appealed to the
Supreme Court and obtained a landmark
judgement in 2001 that called for univer-
salization of the institutional framework
of foodgrain delivery system in India and
asked the central and state governments to
commit to ensuring foodgrain delivery to
the poor.
The RTF campaign’s critique is at three
levels—moral, political and operational.
It attacks the moral aspects of the Bill by
saying that the Bill accepts a very narrow
definition of food security as availability
of foodgrains; it cleverly tries to reduce
the central government’s responsibilities;
it does not accept Supreme Court’s order
to universalize ICDS, and only considers
the supplementary nutrition aspect of it.
All these entail tokenism on the part of the
national government, and that stems from
a moral failure to commit itself to secure
household-level food security. Closely
connected with the moral critique is the
political critique that the Bill gives sweep-
ing powers to the central government,
while failing to raise political commitment
in ensuring delivery of food security to the
poor, by actually passing some important
responsibilities to the state governments,
diluting the oversight mechanisms, building
shortcuts to shift to cash transfers and the
like. RTF campaign’s operational critiques
are less in number: it says that the Act is not
time bound, the priority households are not
clarified. Overall, the Bill falls short of being
effective in oversight and grievance redressal
mechanism. Overall the Bill falls short in
effective in oversight and grievance redressal
mechanism (RTF, 2011).
Ashok Gulati (2009), the director of
International Food Policy Research Institute
(IFPRI) in Asia, makes an economic and
managerial critique. He argues that ensur-
ing food security has three components
in it: food availability, access to food at
household level which is a function of
purchasing power and foodgrain supply to
the households from the state, and absorp-
tion of food which is a function of clean
drinking water, primary health care and
environmental hygiene. He comments that
while food availability is not in question,
more than 300 million households still have
limited access to food, thanks to 58 per cent
of leakage in PDS, large exclusion errors in
BPL identification and lack of purchasing
power of the poor to buy food in the market.
His solution is to work towards agricultural
growth, invest in rural education, rural
infrastructure and agricultural R&D, water
harvesting, rationalize incentives in agricul-
ture and institutional reform in agricultural
markets, land leasing and reform in water
sector. It is not clear though how agricultural
growth can automatically transform the
ability of the poor to ensure the food basket
they need in a sustainable way. It is also not
clear how the vast impoverished swathes

Policy Initiatives on Livelihoods: Emerging Scenario 55
under rain-fed agriculture can benefit from
the proposed agricultural growth.
Professor Jean Dreze (2011), a former
member of the NAC and a champion of a
strong food security bill, actually deplored
the latest version of it, only on one count: the
conceptual principles behind creating two
categories namely ‘priority’ and ‘general’
and differential allocation of food grains
to these categories. Drawing from experi-
ences of Tamil Nadu, Andhra Pradesh and
some other states, he argues that inclusive
PDS have worked better whereas exclusive
targeted PDS have not worked well. His
argument against the two categories is
that exclusive targeting would always have
substantial errors and would defeat the
purpose.
The economic advisory council
In debating on the earlier drafts of Food
Security Bill, the Economic Advisory Council
(EAC) of the prime minister, headed by C.
Rangarajan had a different point of view. It
pointed to three likely disturbing trends as a
consequence of the NFSB considered in con-
junction with other food schemes like MDM
and Supplementary Nutrition Programme
(SNP). The first one is about food supply
matching food demand. It computed and
compared a number of scenarios in which
the foodgrain requirement will have to be
met either by increased foodgrain produc-
tion or by increased procurement. The first
requires substantive overhaul of foodgrain
agriculture which has remained stagnant.
The second has two impacts; when govern-
ment procures more grains from the market
(a) the overall foodgrain price will go up and
(b) this will inflate the government’s food
subsidy bill from the present level of about
`6,3000 crore to nearly ̀ 90,000 crore, thus,
disturbing government’s fiscal prudence.
The third argument which is linked with
the second relates to food inflation. As it
stands today, it is already very high and is
likely to go up further due increased pressure
on the national food basket. Therefore, the
EAC’s argument is to restrict the number of
beneficiaries to a much lower level than that
proposed by NAC or even the government,
and simultaneously revive Indian agricul-
ture to make more food grain available in
the market.
The national advisory council versus the government
The NAC has been championing the cause of
food security for the last 3–4 years. Its mem-
bers, Aruna Roy, Jean Dreze, Harsh Mander
and Naresh Saxena have been involved in
the cause of food rights in the country for
over a decade now. Under their influence,
the NAC have drafted a full version of the
Bill and submitted it to the government. The
government’s version that was introduced
in Lok Sabha has included a number of sug-
gestions from the NAC’s version, but serious
differences do remain.
The most important similarity in NAC
and the government’s version is in the
approach. Both have considered food
security as reaching food grains to the poor
households, in which supplementary nutri-
tion for pregnant mothers, lactating moth-
ers, infants, kids, midday meal for school-
going children, grains for all the members
of family, special provision for food for
people in distress including starvation are
part of one package. And both agree on a
substantive oversight mechanism. So the
differences are in details and, to be specific,
in degrees. Table 3.5 captures the differ-
ences in a nutshell. The only substantial
difference is that the NAC has taken a life
cycle approach, coupled with a human rights
approach which makes it more inclusive in
terms of entitlements, enforcements and
citizen claims.
As can be seen from the table, the govern-
ment’s version tried to reduce its commit-
ment to a minimum level, while in contrast,
the NAC tried to be more inclusive.
Looking at all the points and coun-
terpoints, we may mention a few overall
remarks on the debate. First, the present
version of the NFSB is a much improved
one from the past, where it has considered

56 STATE OF INDIA’S LIVELIHOODS REPORT 2012
Table 3.5: Differences in NAC and the government’s approach to the NFSB
Subject NAC Government
Rationale and preamble To provide all citizens with adequate nutrition and an
enforceable right to food
References to constitutional guarantees, judicial precedents,
international references dropped
Definitions Clearly defined several terms, including adults, children;
excluded households, food, general households, malnutrition,
severe malnutrition, starvation, household, health centre
At least 25 definitions dropped, many others modified
Prices for priority
households
Not to be revised upwards for a minimum of 10 years from date
of notification
Union government can modify or amend essential
entitlements by notification
Life-cycle approach A cornerstone, ‘shall be based on access to adequate and
appropriate food throughout the life cycle of a human being
from pregnancy to old age so as to ensure a healthy body and
mind’
Dropped
Population covered Coverage of 90% of rural population Coverage of 75% of rural population
Entitlements for
women
14 kg grain for single-women priority households, 8 kg for
general
14 kg for single woman dropped, 8 kg for general households
dropped
Emergency relief Rations at priority-household rates for ‘emergency’ and
‘disaster-affected’ persons for a period of one year after the
disaster
Two meals free of charge for three months
People living in
starvation
Double the grain specified for priority households, free for six
months; ‘proactive identification’ of such people, investigation
of starvation deaths, starvation protocol to prevent such deaths
Free cooked meals twice a day; all provisions for identification
and investigation of deaths dropped
National food
commission
To be created by independent public nomination process to
monitor public servants and starvation conditions, will have
powers to impose penalties, will have powers of civil court
No public nomination, union government will make rules, no
penalties, no judicial powers
Child malnutrition Free, ‘appropriate therapeutic foods’, special care at nutrition
rehabilitation centre
Dropped
Source: Compiled by the author from NAC documents and NFSB Bill, 2011.
all the food programmes in one umbrella
legislation. Thus, the programmes of ICDS,
MDM and the like will now have a legal
basis. Further, it also provides for food sup-
port for people with special needs (the starv-
ing and the disabled) and also for ordinary
people in special circumstances (disaster).
This must be good news for the citizenry.
That there is provision of a tiered oversight
mechanism from the centre to village level
through commissions, grievance redressal
officers, vigilance committees and social
audits is also good news.
The Bill does not address four key con-
cerns:
1. It does not ensure that all those who
need food support are included in the
priority and general list. Targeting has
always been full of errors and corrup-
tion, and there is no way that this Bill
can address it in its present form.
2. The Bill does not address the issue
of institutional reform necessary to
enhance the capacity of the State to
reach food to the deserved. ICDS is one
good example, the other being the PDS.
Recent examples of institutional reform
in PDS in Chhattisgarh and ICDS in
Tamil Nadu bring some hope (Khera,
2011). It is yet to be seen if other states
are able to replicate what Chhattisgarh
or Tamil Nadu have done.
3. Without strong revival of foodgrain
agriculture and rural infrastructure,
particularly scientific storage and rural
roads, this programme will surely create
an unmanageable strain in rural society,
affecting the poor adversely. This will
happen in two ways: food inflation will
increase while the off-take of the state
governments will decrease making less
food available at the FPSs. In particular,
very little attention is built into the Bill
Policy Initiatives on Livelihoods: Emerging Scenario 57
on how to reach out to special categories
of people and people in special circum-
stances.
4. The Bill does not at all address the food
absorption issue that is linked with
drinking water, primary health care and
environmental measures. These are seri-
ous limitations to say the least.
In sum, we would like to say that the
NFSB 2011 is indeed a major landmark in
the history of independent India, like the
MGNREGA, the RTI and Forest Rights
Act 2006 and should be enacted without
further delay. The concerns of delivery,
transparency and accountability are more
about implementation and can be constantly
worked upon towards improvement.
Conclusion
Policies do influence lives of the poor both
in positive and negative ways. India has been
witnessing a new surge in policy legislation
through the last two decades. Almost all of
these legislation are rights-based that are
justifiable and intend to make the State
more accountable to its citizen. While the
intent and enshrinement of rights within
these legislation are generally commend-
able, two major weaknesses remain. One is
that most legislation depend on the same
institutions that hitherto have not deliv-
ered and secondly, costs of enforcement
and implementation (depending on the
nature of the legislation) are not built in
as necessary conditions within the legisla-
tion itself. As a result the State continues
to do much less than is possible to do. As
a consequence, the success of these legisla-
tion depend on the voice of civil society and
social capital of community institutions of
social movements, and not on reformed
institutions of the State—bureaucratic or
political, supported by adequate budgetary
commitments.
What is not changing in both these
approaches is the nature of the State and
market institutions. The State institutions
remain bureaucratic, inert, often anti-
poor, corrupt, opaque and inefficient.
Market institutions by their very nature are
anti-poor, barring the radical experiments
of microfinance or fair trade and in the
context of India, the market institutions
remain imprisoned within the caste–class–
gender–ethnic inequality framework. The
interconnectedness of livelihoods with
this framework has never been seriously
discussed in the policy domain in terms of
interventions needed to break the prison
walls of multiple economic and social dep-
rivations that prevent the poor from having
decent livelihoods and wellbeing. The hope
probably lies in greater constituency action,
claiming rightful place in the domain of the
state and market.
Postscript
A new policy is not always a new beginning;
often tweaking existing policies have sub-
stantive implications and consequences that
may significantly contribute to improve-
ment in results. We would take up two
examples of what we may call new pathways
in the existing policy stream: NREGS-2.0
and RKVY. Since Chapter 4 of this report
authored by Suryamani Roul is discussing
these two programmes in detail, we will only
stick to the policy relevance and content of
the two.
MGNREGA 2.0
MGNREGA has crossed six years since
its promulgation. It had two objectives:
create and provide paid jobs for any one
who wants it for a maximum of 100 days
in a year and, thereby, create public assets
that can be productively used to provide
more income for the poor. Last six years
have drawn attention towards building
a delivery mechanism that can honour
the legal commitment; as a result on an
average, 42 days of work could be given
to those wanted it covering entire rural
India. Several challenges have restricted
the progress: (a) institutional capacity of

58 STATE OF INDIA’S LIVELIHOODS REPORT 2012
the panchayats, (b) cash flow mechanism
to reach out to millions in rural India, (c)
massive corruption, (d) lack of effective
asset creation, and the like.
A committee headed by Dr Mihir Shah
reviewed the progress and challenges
through widely held consultative processes
and suggested a number of measures to
improve overall performance. The policy
aspect of it is about four core issues: (a)
including 30 more new works in the existing
list—this would generate more projects to
provide more work, (b) providing a pan-
chayat development officer in every Gram
Panchayats to look at MGNREGA works—
expectedly this would enhance capacity
of the Gram Panchayats, (c) a number
of possible ways to expedite payment of
wages in time, and reducing bureaucratic
procedures—this would enthuse the people
to demand more work and (d) allowing and
encouraging SC/ST households to work in
their own plots of land/water body and get
paid under NREGA—hopefully, this will
ensure increased participation.
Since these are unfolding almost as this
piece is written, we have to wait and see the
results.
RKVY
RKVY was launched in 2007 as a scheme
of the Ministry of Agriculture to foster 4
per cent agricultural growth as committed
in the Eleventh Plan. This was a supple-
mentary scheme to fill in gaps that existed
in various agricultural schemes that the
Ministry ran. However, as its implementa-
tion was generally good, the Ministry felt it
can absorb more: so now five more schemes
are added to RKVY as sub-schemes. These
are Extending Green Revolution to Eastern
Regions, Integrated Development of
60,000 Pulses Villages in Rain-fed Areas,
Promotion of Oil Pal, Initiative on Vegetable
Clusters, Nutri-cereals, National Mission
for Protein Supplements, Accelerated
Fodder Development Programme, Rain-
fed Area Development Programme and
Saffron Mission. All these programmes
were announced in the annual budget
of 2011–2012. It appears that more pro-
grammes would now gradually be included
in RKVY which will gradually take the
shape of an umbrella programme and
others will become its sub-programmes.
We will have to wait and see whether it
delivers on the fundamental promise: 4 per
cent growth in agriculture in the Twelfth
Plan period.
References
ASHA (Association of Sustainable and Holistic
Agriculture). 2011. ‘LARR Bill 2011, Response
from ASHA’, New Delhi, p. 1.
Bhowmick, S. 2005. ‘Street Vendors in Asia: A Review’,
Economic and Political Weekly, 40(22–23):
22–62.
———. 2010. ‘Legal Protection for Street Vendors’,
Economic and Political Weekly, 45(51): 12–14.
Datta, Sankar, Vipin Sharma and Orlanda Ruthven.
2011. State of India’s Livelihoods Report 2011. New
Delhi: SAGE Publications.
Dreze, J. 2011, ‘Kon Banega Scorepati’, The Hindu,
November 28, p. 11.
Economic Survey 2012, chapter 12, p. 294.
Ghatak, M. 2011. ‘Land Acquisition Bill: A critique
and a proposal’, Economic and Political Weekly,
46(41): 69.
Government of India. 2012. Economic Survey 2011–
2012. New Delhi: Oxford University Press.
Gulati, Ashok. 2009, ‘Food Security and Agricultural
Reforms: Issues and Strategies: lecture at Birla
Institute of Management and Technology’, Birla
Instritute of Technology, Pilani, 2 October 2009,
slides 23–25.
Khera, R. 2011. ‘Revival of Public Distribution Systems:
Evidence and Explanations’, Economic and
Political Weekly, 46(44–45): 2.
Ministry of Agriculture. 2005–2006. Available at
http://agcensus.nic.in/document/ac0506/reports/
Chapter-6_2005-06.pdf (accessed on 16 June
2012).
NAC (National Advisory Council). 2011. ‘National
Advisory Council: Report for the period of 2010-
2011’, New Delhi, p. 4.
NCW (National Commission for Women). 2005. ‘Impact
of WTO on Women in Agriculture’, pp. 12 –13.
NDP (National Diary Plan). 2012. National Diary
Development Board, Gujarat, p. 2.
NULM (National Urban Livelihoods Mission). 2012.
‘Reform Measures and Policy Initiatives’, New
Delhi, pp. 43–48.
Planning Commission. 2008. ‘Development Challenges
in Extremist Affected Areas: Report of an Expert
Group’.

Policy Initiatives on Livelihoods: Emerging Scenario 59
Planning Commission. 2011. ‘AP 2007–2012’, a, section
1.23, 7.24, 7.25, 7.27, New Delhi.
RDI (Rural Development Institute). 2007. ‘Report
of the Sub Group on Safai Karmacharis 2007,
Submitted to Working Group on the empower-
ment of Scheduled Caste, for the XI-th Five Year
Plan’, New Delhi, p. 9.
———. 2012. ‘Private communication of Rural
Development Institute to Women Power Connect,
2012’. WPC-Oxfam, New Delhi.
RGA. 2012. ‘Rastiya Garima Abhiyan: “Letter to
the Minister, Minister of Social Justice and
Empowermnt”’, dated 02-04-012, p. 1.
RTF (Right to Food Campaign). 2011. ‘Right To
Food Campaign’s Critique of the National Food
Security Bill 2011’, New Delhi, pp. 6–7.
SCRD (School of Community Research and
Development). 2012. ‘Standing Committee on
Rural Development, XVth Lok Sabha: LARR Bill
2011-31st Report’, pp. 20–35.


Introduction
Having ridden a wave of economic growth
for a few years, India is now experiencing
challenges of a new order. Thanks to an
entire spectrum of populist policies and
programmes, the government seems to have
frittered away the opportunity of carrying
out second generation economic reforms
that would have helped sustain the previ-
ous decade’s growth. The economic review
reports and trends for 2012 speak of declin-
ing growth rate, inlation and the pressures
as well as the pains that the country is facing
at present. On one hand, the Indian story
informs of creation of enormous wealth
while on the other there is a major debate
on the growing poverty and disparity. The
government has recently instituted a panel
led by Dr C. Rangarajan to re-examine
and review the Tendulkar methodology
for determining the poverty line and redo
poverty mathematics. At the same time,
the Planning Commission is yet to gain
approval from the National Development
Council (NDC) on the Twelfth Five Year
Plan which has technically started rolling on
completion of the Eleventh Five Year Plan
in March 2012. It is said that due to delay in
submission of reports by the task forces, the
process is likely to be completed in the last
quarter of 2012. Anticipating continuation
of the lagship programmes, the Annual
Budget 2012–2013 has made a tall order
commitment and allocation on most of the
programmes. This will be explained in the
subsequent analysis of the progress made as
per the Annual Economic Review 2012.
Government programme on livelihoods promotion
Over the past ive decades, the government
has introduced a plethora of schemes that
focus on the rural poor. It makes huge
investments through various programmes,
even though several reports have been
known to indict their implementation qual-
ity and delivery systems, as well as rampant
practices of targeting and corruption. The
Planning Commission set up a sub-commit-
tee in April 2011 led by Dr B. K. Chaturvedi,
Member Planning Commission, to take a
look at the eficacy of centrally sponsored
schemes (CSSs) and recommend measures
for restructuring of the 147 schemes (as per
last count in 2011–2012) so as to enable
them to perform optimally and meet the
expectations of the state governments as
well as the other stakeholders. The sub-
committee has made several recommenda-
tions (report submitted in September 2011)
observing that a number of CSSs with small
outlays fail to achieve their objectives (about
44 per cent of the CSSs have annual outlays
less than `100 crore). The sub-committee
has clubbed the 147 schemes broadly into
three categories: (a) lagship programmes
which make national-level interventions on
Flagship Programmes of the Government:
Where Do We Stand?SURYAMANI ROUL
Chapter 4

62 STATE OF INDIA’S LIVELIHOODS REPORT 2012
education, health, irrigation, urban develop-
ment infrastructure, rural infrastructure,
skill development, employment, and other
as identiied sectors; (b) major sub-sectoral
schemes to address development problems
of sub-sectors of major sectors like agricul-
ture, education and health; and (c) sector
umbrella schemes to address sectoral gaps
and improve programme expenditures and
quality of delivery. It recommended reduc-
ing the number of schemes to a total of 59
with continuation of nine existing lagship
CSSs, compressing 99 sub-sectoral/umbrella
schemes to 39 and restructuring another
39 CSSs to 11 under Additional Central
Assistance (ACA).
While this chapter will primarily focus
on providing a statistical outline and a brief
review of the progresses on the lagship pro-
grammes during the reporting period, it also
encompasses elaborate discourse on select
representative programmes. An attempt has
been made to select the programmes with a
view to making it representative of the target
population, particularly segments such as:
l Poor and vulnerable communities
l Women and the poorest households
l Small and marginal farmers
l Youth
Four high investment-led government
initiatives have been identiied for a detailed
appraisal of performance during the report-
ing period on the basis of the nature of their
objectives and the target population. On the
basis of a critical examination of the stages
of programme implementation and delivery
system, a broad approach has been devel-
oped to cover the four illustrative lagship
programmes, which have been captioned
with 4Ts:
T1: Transformational processes of the
Mahatma Gandhi National Rural
Employment Guarantee Scheme
(MGNREGS)
T2: Transitional approach of National Rural
Livelihood Mission (NRLM)/Aajeevika
T3: Trickling up strategy of Rashtriya Krishi
Vikas Yojana (RKVY) in agriculture
T4: Triggering efforts under the skill
initiative
The analysis in this chapter is restricted to
these four programmes.
Transformational processes of MGNREGS
Ever since its inception seven years ago,
MGNREGS has had a number of supporters
as well as critics. While the supporters have
strongly been of the view that it would trans-
form rural areas, the critics have been more
concerned with the negative aspects like
rampant corruption and the uneven spread
of the scheme across states. Considered to be
India’s landmark right-to-work programme,
the original National Rural Employment
Guarantee Act (NREGA) was amended in
2011 and relaunched as Version 2. The Act
continues to guarantee 100 days of paid
employment to every rural household in
India regardless of eligibility criteria and
establishes the government’s lagship welfare
programme with huge resources allocated by
the Government of India under the Ministry
of Rural Development. Given the fact that
MGNREGS has a strong reach in all rural
districts in India, which it established over
a much shorter span of time than any other
rural development programme, there is no
parameter against which its outcomes can
be measured. With changing circumstances
and the radical people-centric approach
that has been adopted by the current min-
ister for Rural Development at the helm of
affairs, the reporting period is marked with
signiicant shifts in its approach at the level
of policy-making, execution and conver-
gence system with other programmes, and
most importantly, its outcome orientation.
Table 4.1 details the scale of operation of
MGNREGS.
In the subsequent sections, an attempt
is made to capture the major highlights
of MGNREGS with an emphasis on the

Flagship Programmes of the Government: Where Do We Stand? 63
Table 4.1: Scale of operations of MGNREGS
Indicators 2008–2009 2009–2010 2010–2011 2011–2012
Number of households (in crores) 4.5 5.3 5.5 5.0
Average person days per employed households 48 54 47 42
Expenditures (in crores) 27,250 37,905 39,377 37,303
Wages as % of total expenditure 67 70 68 70
Average wage per day (in `) 84 90 100 101
Source: Ministry of Rural Development (2012a).
transformational processes during the
reporting year.
In its seventh year of implementation
now, MGNREGS continues to polarize
opinions about its efficiency and effec-
tiveness. Claims about its inadequacy
and of its being a waste of time and
resources are substantiated by a govern-
ment report released on 14 July 2012 titled
‘MGNREGA Sameeksha’ (Ministry of Rural
Development, 2012b), a compendium of
independent studies on the scheme. At
the time of release of this report, both the
Prime Minister and the Minister of Rural
Development admitted that MGNREGS has
failed to make the expected impact because
of misappropriation of funds and resources
and patchy implementation systems in
several states. However, in places where
the scheme has worked, rural households—
particularly farmers—have managed to
tide over the deicit monsoon as a result of
adequate water storage. However, even here
the full potential of the scheme has not been
exploited since more than 50 per cent of
the work has either not been completed or
has been abandoned. There are cases where
the structures created have not been given
proper attention and human resources for
maintenance and further usage.
MGNREGS 2.0
Unveiled in February 2012 and brought into
effect from April 2012, MGNREGS Version
2 has expanded its scope by including 30
new works related to agriculture, watershed,
livestock, isheries, lood management and
irrigation, besides aligning with a national
sanitation campaign (please refer to Box 4.1).
The new norms also provide for `4,500 to
be contributed as labour component from
MGNREGA towards construction of toi-
lets under the Total Sanitation Campaign.
Under the expanded nature of works, the
focus of MGNREGA would be in blocks
with sizeable population of Scheduled Castes
(SCs) and Scheduled Tribes (STs) and those
which had been getting funds of `12 crore
a year under the scheme.
Version 2 envisages in making MGNREGA
a productivity-enhancing instrument with
a view to increasing agricultural output.
Panchayats are to decide the priority of
works in Gram Sabha meetings with a
stipulation of an overall labour to material
l It encompasses works related to agricul-
ture, animal husbandry, poultry, drinking
water and sanitation.
l It was earlier limited to land development
and afforestation.
l It now includes construction of cattle sheds,
poultry shelters, ish drying yards, etc.
l Small, marginal and SC–ST farmers will
be able to employ NREGA workers for
farm work.
Source: Ministry of Rural Development,
2012a.
Box 4.1: What the new version entails

64 STATE OF INDIA’S LIVELIHOODS REPORT 2012
Box 4.2: A comparative analysis of the unique features of MGNREGA Version 1 and Version 2
Version 1 Version 2No method to record demand Receipt system to register demand for work
Labour budgets are replica of last year Survey-based labour budgets every year
Assets planned arbitrarily A two-year rolling shelf of projects to be
created
No technical body to assist panchayats A technical asset planning body at each year
Social audit functional only in Andhra
Pradesh
Mandatory social audits twice a year
Banking correspondence model stuck at
conception stage
Provisions of funds for implementation of
banking correspondents
Spectrum of eligible projects too rigid State speciic works allowed to make scheme
relevant
Source: Ministry of Rural Development, 2012b.
ratio of 60:40. A comparative analysis of
the unique features of the two versions is
presented in Box 4.2.
The ive major ways in which MGNREGS
Version 2.0 will differentiate itself is depicted
pictorially in Figure 4.1.
Sanitation works covered under MGNREGS
A communique published in early August
2012 by the Ministry of Rural Development
has made it permissible to include Total
Figure 4.1: The major ways in which MGNREGS Version 2.0 is expected to differentiate itself from Version 1
Five Ways in
which NREGA 2.0
envisages to
address legacy
challenges
Skill Training
The logical next step, from
manual to skilled. One person
from each household that
completes 100 days of work will
be trained under NRLM in a
range of skills like carpentry.Rural Sanitation
NREGA Funds will be
deployed to promote
rural hygiene. For every
toilet built (estimated cost
of `10,000), `4,500
will go out of NREGA kitty.
The mandatory 60:40
labour-to-material ratio
will be maintained at the
Gram Panchayat level.
CAG Audit
An Annual CAG Audit—
limited to the ulilisation
of NREGA funds—will help
bring in more
transparancy. This year's
report will be in by
November, to be
submitted to Parliament in
December.
MoRD Funds for MoRP
The Rural Development Ministry
will tranfer 1% of its entire budget
of `99,000 crore to the
Panchayati Raj Ministry for
capacity building and training of
panchayats. This, it hopes, will
bring in a sea change in NREGA
implementation at the ground
level.
End to Minimum Wage Row
The AP High Court ruling that NREGA
payments below state minimum
wage amounted to forced labour had
put GoI in a quandary. The minister
will now amend the NREGA to put an
end to the controversy. Safeguards
to ensure that states dont arbitrarily
jack up minimum wages will be put
in place.
Source: Thampi. (2012).

Flagship Programmes of the Government: Where Do We Stand? 65
Sanitation Campaign (TSC) activities under
MGNREGS. The Ministry has also issued
revised guidelines to the state governments
indicating the process to be followed while
including sanitation projects under the
MGNREGS labour budget. The objective
of including access to sanitation facilities
under MGNREGS is to improve the quality
of life of the rural people and strengthen the
base of rural livelihood. The other objec-
tive is to expedite sanitation coverage in
rural areas as TSC has failed to achieve the
desired results. This will cover construction
of latrines in individual households, schools
and anganwadi centres that have not been
covered under TSC administered by the
Rural Development Department. As a part
of the execution process, the names of the
beneiciaries will have to be duly approved
by the Gram Sabha and then by the respec-
tive Gram Panchayats. The construction of
sanitation facilities will be subject to social
audit. As per the guideline, only job card
holders will be employed for the unskilled
works, and the total amount to be utilized
should not exceed 4,500 per individual
household.
UIDAI and MGNREGS—a convergence move
In order to weed out ghost cards and assess
the coverage of the programme with reason-
able accuracy, there has been a massive move
at both the central and state government
levels to update registration data, including
Aadhaar numbers of the beneiciaries under
MGNREGS. This move, aimed at testing the
coverage of Unique Identiication Authority
of India (UIDAI) among the beneiciaries of
MGNREGS, will also help create a database
for convergence with insurance schemes
such as the Rashtriya Swasthya Bima Yojana
(RSBY) and Aam Admi Bima Yojana. It will
thus be a starting point for convergence of
important social schemes and UIDAI as
a veriication system that includes Below
Poverty Level (BPL) status, RSBY status,
backward class status and Aadhar number.
The UIDAI project has already collected
As per the Government of India’s quarterly
Delivery Monitoring Unit (DMU) Report
(prepared on the basis of quarterly review of
the Planning Commission of India), Madhya
Pradesh is performing well in MGNREGA
implementation and is in the list of top 10
states in ive categories. Besides providing
maximum employment to villagers with
implementation of the MGNREGA, Madhya
pradesh has also created permanent sources of
livelihood. Payment of `120 per day is being
made to labourers while wages are being paid
depending on the quantum of work.
As per the report for January–March 2012,
Madhya Pradesh has retained its place in top
10 states in ive of seven categories. It stands
3rd in total expenditure under MGNREGA,
5th in generating man-days and number of
families completing 100-day labour, 6th in
making employment available to families
and 10th in generation of scheduled caste
man-days. According to monthly information
system report of the union government,
employment has been made available under
MGNREGA by generating 94.31 lakh man-
days. As many as 4.89 lakh families were
benefited, including 27 per cent STs, 20
per cent SCs and 42 per cent women. It has
been mentioned in the survey, conducted by
the Indian Institute of Management (IIM),
Indore, that the implementation of the
scheme has curtailed migration of people
from villages. According to the survey, 65 per
cent villagers have admitted that their income
has increased due to MGNREGA and life has
become prosperous.
They informed that their income has gone
up to 24 per cent while 88 per cent villagers
lauded MGNREGA’s role in creation of
permanent assets in villages. MGNREGA
has also increased agriculture production
and villagers have been able to change crop
pattern.
Source: Department of Public Relation (2012)
and Ankur (2012).
Box 4.3: Madhya Pradesh in list of top 10 states in MGNREGA implementation (2 July 2012)

66 STATE OF INDIA’S LIVELIHOODS REPORT 2012
biometric data for 20 crore Indian residents
and about another 40 crore people will be
covered in the project’s second phase. The
Income Tax Department, too, has decided to
record Aadhaar numbers of those applying
for a fresh PAN card. This is just beginning
to happen, even though there were many
reservations and apprehensions expressed
by several ministries and government
departments expressing doubts of the suc-
cess of UIDAI and angling to have their
own veriication systems, particularly in
case of MGNREGS which might have led
to deserving beneiciaries being left out of
the scheme. However, activity under UIDAI
has picked up from this year, with the
authority launching online authentication
pilots in Jharkhand and ministries agreeing
to cooperate to help lay the foundation of
Aadhaar on a larger scale. It is being said that
if MGNREGS can succeed, so can UIDAI.
The Ministry of Rural Development has a
very ambitious plan to achieve e-disbursement
of wages to workers across the country under
MGNREGS. It is evident that banking cor-
respondents equipped with Aadhaar-enabled
micro-automated teller machines (ATMs) will
visit the doorsteps of MGNREGS wage earners
to distribute their payments. A joint decision
by the Ministry along with the Ministry of
Finance and UIDAI is to seed in the Aadhaar
numbers of MGNREGS workers in NREGA
Soft (software) and to achieve complete
e-disbursement for MGNREGS workers,
initially in 46 districts and then extended it to
all other districts in two years time.
However, there are glitches which have
been reported in experiments with the
UID method for payment of wages under
MGNREGS. With regard to the experimenta-
tion process in Jharkhand, the main role for
Aadhaar is to facilitate the implementation
of the Business Correspondence model in
which accredited agents provide doorstep
banking services to MGNREGS workers
using a micro-ATM. They act as extension
counters to the local bank (Bank of India
in this case), disbursing wages near their
home through Aadhaar-enabled accounts
opened at the time of enrolment. However,
biometric authentication, which is meant
to prevent identity fraud, requires Internet
connectivity to electronically match workers’
ingerprints and Aadhaar numbers with their
records in the UIDAI’s Central Identity Data
Repository. Thus, predictable, the Jharkhand
experiment has come up against a number
of problems including system level flaws
and implantation issues including problems
such as distance from the village, ingerprint
recognition, some people not having UID
numbers and/or Aadhaar-enabled accounts
resulting in non-issuance of bank passbooks
and a general reluctance to participate in the
scheme due to perceived non-payment of
wages to the MGNRGES workers. It seems
worthwhile to consider solutions that involve
providing alternatives such as issuing pass-
books to withdraw money that the workers
have earned, providing Internet connectiv-
ity and introducing lexibility into the ‘One
(Bank) Branch-One Block’ model for such
experiments. These experiments have thrown
up extremely diverse issue in the ive states
in which they have been carried out so far
which, in the absence of suitable solutions,
constitute insurmountable obstacles.
There are, however, significant syner-
gies to be realized between the MGNREGS
and UID which would allow improved
implementation of the programme with
increased transparency. Renowned devel-
opment economist Jean Dreze (2012), in an
exchange of notes with the Minister for Rural
Development in a recent article, has called
NREGA ‘a rural mass hope’. According to
Dreze, in a survey of 1,000 NREGA workers
conducted in May–June 2008 in six states of
North India (including Jharkhand), it was
found that 68 per cent people considered the
programme ‘very important’ for them. He is
of the strong opinion that even though there
are many laws in the programme, there is
need to get into a serious debate and discus-
sion on how to make it work and that appli-
cation of Aadhaar is a way forward in this
direction in spite of the several operational
laws experienced in its pilot in Jharkhand.

Flagship Programmes of the Government: Where Do We Stand? 67
Six years ago, the Government of Andhra
Pradesh started a pilot smart card project as
a means to extend mainstream banking and
inancial services to the poor by using tech-
nology-based solutions to ensure eficient and
timely transfer of government beneits and
minimize leakages. The concept was new to
the banks, inding the right technology serv-
ice provider was a challenge, and there were
doubts about the execution and the viability
of the project. But today, the smart card
project is helping nearly 12.7 million poor
people across Andhra Pradesh in 69,000 habi-
tations and 22,000 Gram Panchayats to get
timely and full payment of their social security
pensions and wages under the MGNREGS.
The project has ive key stakeholders—the
state government, banks, technology service
providers, business correspondents and
beneiciaries. The state government releases
the funds meant for the payment of wages
under MGNREGS and pensions to the banks
and provides details of the eligible beneiciar-
ies. In turn, the banks open no-frills savings
accounts and issue smart cards within three
weeks to the beneiciaries.
A smart card contains a magnetic strip
to enable identiication, authentication, data
storage and application processing. It holds
data like ingerprints, photographs and other
details of the beneiciaries in an encrypted
form. For enrolling the beneficiaries for
smart cards and no-frills accounts, banks
appoint business correspondents or BCs.
Banks transfer the funds to a BC’s account
online. The BC, in turn, appoints a customer
service provider (CSP) at the village level, to
whom the cash is transferred for payments.
To qualify as a CSP, a person needs to be
a resident of the village, be a member of a
women’s self-help group (SHG) and should
have passed Class X. The CSP is trained in
using point-of-sale (POS) machines and
making payments. The system creates a
banking outpost in each village, eliminating
wastage of time and the money and effort the
beneiciaries had to invest on travel, waiting in
queues and losing valuable work days just to
get their wages. The only thing a beneiciary
needs to do is to bring his or her smart card to
the CSP. The CSP has to swipe the smart card
on a POS machine, which works similar to an
ATM. The POS machine, after authentication,
generates a printout of the pay receipt and
instantaneously updates the payment systems
of the bank, MGNREGS and social security
pension servers.
The CSP pays the cash to the beneiciary
as per the receipt. The government doesn’t
charge anything from the beneiciary. For
providing the service, the government pays a 2
per cent commission to the bank. Technology
is critical to the success of the smart card
project. Banks have tied up with technology
service providers to build solutions for
enrolment, authentication, data storage and
processing. While some service providers use
POS machines, others use mobile phones,
contactless radio-frequency identification
smart cards and integrated biometrics.
The smart card project has been extended
to 1,098 Mandals and 21,812 Gram Panchayats
across 22 districts in Andhra Pradesh, with
14.5 million beneiciaries enrolled and 13.7
million receiving payments. The government
has made payments worth `4,000 crores in
the iscal year ended March 2012, of which 2
per cent was paid to the banks as commission.
The smart card project’s major contribution
is helping the government reduce leakages
and frauds. Moreover, the project has helped
banks ind an alternative solution to deliver
services to the unbanked poor. Twelve banks
and postal departments have been working
on this programme. With the smart card
project becoming successful, banks have
started offering products and services such
as fixed deposits, insurance and loans to
customers. Though the state government
was able to reach the beneiciaries to a large
extent through the smart card project, there
is still an uninished agenda. People living in
the remote corners of the state are yet to be
touched by the technological developments.
The state government is now working closely
with banks and service providers to devise an
ofline payment system for paying wages and
pensions to people in remote tribal hamlets
cut-off from facilities such as mobile and
telecommunications.
Source: Author compilation.
Box 4.4: Smart card payment of wages under MGNREGS in Andhra Pradesh

68 STATE OF INDIA’S LIVELIHOODS REPORT 2012
Projection of higher demand on MGNREGS due to monsoon failure and response to drought situations
Speculation has been rife about signiicant
expected increase in demand for work under
MGNREGS due to the weak performance
of monsoon resulting in a drought situa-
tion this year. In anticipation of this, the
Ministry of Rural Development has asked
all states to prepare contingency plans and
review their estimates of work demand
under MGNREGS. It intends to expedite
the implementation of new projects under
the scheme to generate enough jobs to cater
to the expected increase in demand for
employment, which would mainly come
from agricultural workers. The Ministry is
of the view that there may not be a need for
additional fund allocation in view of the fact
that states have surplus funds left over from
the previous year, even though allocation for
MGNREGS was curtailed to ̀ 33,000 crores
in the current year’s budget, as compared to
`40,000 crores in 2011–2012.
However, the views being mooted
by the Ministry of Finance and those of
Rural Development which implements
MGNREGS differ from each other. The
Ministry of Finance primarily seeks conver-
gence with other departments and managed
to reach an agreement with the Ministry
of Rural Development in this respect in
2009, the plan could not go beyond some
pilot districts due to the unwillingness of
any ministry or department to work under
MGNREGS guidelines. Thus, in MGNREGS
Version-2, Ministry of Rural Development
has abandoned the convergence plan. In
fact, one school of thought maintains that
convergence is nothing more than a ploy by
the government to divert MGNREGS funds.
In the past, convergence of MGNREGS with
other departments has invited criticism from
the civil society, as it has been perceived as a
back-door effort to dilute the very purpose
of the Act. However, the Ministry of Rural
Development is considering—consequent
upon a nod from the Empowered Group of
Ministers (EGoM)—enhancement in the
number of days of employment provided
under MGNREGS from 100 to 150 days in
all drought-affected blocks which have more
than 50 per cent rainfall deicit. The new
guidelines for MGNREGS 2, which are yet
to be notiied, might be expected to result
in an expansion in the number of works,
whereby some measure of convergence
might be achieved (see Figure 4.2).
As can be seen from Figure 4.2, there has
historically been increased demand for work
under MGNREGS in years of monsoon fail-
ure or drought. This, along with the below
Starting the facility from Shergada Block in
Ganjam district in Odisha, electronic transfer
of wages to bank accounts of the beneiciar-
ies of MGNREGS is extended to all 22 blocks
from July 2012. Recently the Government
of Odisha has tied up with the Reserve Bank
of India (RBI) to disburse the MGNREGS
wages through the online facility. Under this
scheme, the wages of the beneiciaries will
be credited to their bank account directly
within a short period of time through the
Regional Electronic Clearing Services (RECS),
provided by the RBI, without intimating the
district authorities. The block authorities are
only to intimate the amount to be given to the
beneiciary. The beneiciaries can withdraw
the money from the banks even in non-
banking areas as some of the banks, including
the Rushikulya Gramya Bank (RGB) have
appointed BC to provide banking facilities
to villagers under the Financial Inclusion
Scheme (FIS).
Sources: Press Trust of India (2012) and
Government of Odisa—ganjam.nin.in on
MGNREGA.
Box 4.5: Introduction of online wage payment on MGNREGS work in Ganjam district, Odisha

Flagship Programmes of the Government: Where Do We Stand? 69
average rainfall being reported this year and
the low monsoon forecasts by the meteoro-
logical department have given rise to concerns
about agricultural output in the current year,
in view of which the government has also
formed contingency plans. Further, going
by previous trends, demand for work under
MGNREGS is expected to increase. Figure
4.2 shows the scheme’s effectiveness during
the drought year of 2009–2010 when demand
for employment under the scheme surged by
a record 61 per cent. Conversely, demand
for employment under the scheme deceler-
ated sharply by 19 per cent in the following
year 2010–2011, which was characterized by
surplus rainfall (see Figure 4.3).
In the recession hit year 2009–2010, the
scheme was further credited with increasing
consumption capacity of rural areas despite
the drought and economic downturn.
During 2011–2012, employment demand
under the scheme contracted by 6.4 per cent
primarily due to normal rainfall and good
reservoir levels. However, some analysts
are of the view that administrative issues
from the previous year such as delayed
wage payments might also have subdued
work demand.
Proposal for introducing foodgrains as part payment of wages
There is a major ongoing debate on the
proposal to introduce foodgrains as part
payment of wages under MGNREGS. The
three ministries involved in this process
have divergent views. The Ministry of Rural
Development has strong views on the Food
Ministry’s proposal for providing grain as
part-payment of wages under MGNREGS.
Further, following the Parliament’s per-
mission for at least 30 new works under
the scheme, Member of Parliament Jairam
Ramesh declared, ‘The work carried out
under the food-for-work programme was
really of bad quality and we do not want to
repeat the same mistake’ (Indian Express,
2012). And even though the Ministry of
Food has been supporting the idea, the deci-
sion is still on hold, pending a consensus.
While some parties involved in the design
Figure 4.2: Rains and rural job demands
Demands for MGNREGA Work
Persondays
Generated
Households
Provided
Work
Households
Demand
for Work
(In crore) ’11–12
5.17
215
5.02
’10–11
5.42
228
5.35
4.55
’09–10
181
4.51
’08–09
2.83
105
2.79
Trend in South West MonsoonActual Rainfall (mm) Devlation (%)*
*Devlation
from normal
877.7
2008
–1.7
2009
698.2
–21.8
2010
911.1
2
2011
901.2
2
Source: Banerji (2012).
Figure 4.3: Ensuring jobs
2.1
3.4
4.5
5.35.5
5
’06–07 ’11–12
No. of households provided
employment (in crore)
Spurt in demand for MGNREGA
Work in poor rain years
Source: Sen (2012).

70 STATE OF INDIA’S LIVELIHOODS REPORT 2012
of MGNREGS have welcomed the move on
the basis of the rationale that foodgrains may
not be as easy to divert as cash, besides pro-
viding some much needed food security to
those below the poverty line. As envisaged,
the work under MGNREGS is self-selecting
in nature to ensure that cash transfers and
purchasing power reach families that are
unable to find regular work. It was not
meant to replace the rural job market,
which is why linking it to minimum-wage
legislation is still not a convincing idea. K. S.
Gopal, Scholar in Residence at Tata Institute
of Social Sciences (TISS) and a former mem-
ber of the Central Employment Guarantee
Council is of the opinion that payment of
wages in foodgrains can be effective and will
result in six outcomes, dubbed as the 6Cs:
1. Conidence of the people
2. Customer
3. Calories
4. Community impact
5. Cost to the government
6. Some cash with timely food supply
Counter to this, Professor Ashwini
Kumar from TISS opines that a sudden shift
to payment of wages in kind would lead to
inequality of the worst kind, since it has the
potential to depress the marginal propensity
of the poor to absorb additional income
(Gopal and Kumar, 2012).
Restrictive measures and regulation due to fear
One of the modiications under MGNREGS
makes provision for small, marginal, and
SC/ST farmers to employ workers on their
farms for transplantation, weeding, etc.,
with the provision that they grow the System
of Rice Intensiication (SRI) variety of rice
which provides high yields with low water
consumption. However, the central govern-
ment has suspended a decision to allow rice
cultivation under MGNREGS, fearing that it
would lead to demands for including other
crops under the Act.
Further, there are fears across the board
about the higher MGNREGS wage payouts
stoking inlation, not least by making farm-
ing more expensive. Early in 2010–2011,
the government had benchmarked wages
under MGNREGS to retail inflation to
ensure a real wage of `100 a day for work-
ers seeking employment under the scheme.
Under the irst revision, minimum wages
have risen between 0.8 per cent in Odisha
and 24 per cent in Karnataka. In several
states, the wages under the scheme set a
loor for labour rate in agriculture, sug-
gesting that a rise in MGNREGS wages is
likely to result in increasing farm labour
costs. In all but 7 of the 28 states, includ-
ing predominantly agricultural states like
Uttar Pradesh, Haryana, Punjab and Bihar,
the revised MGNREGS wages are higher
than the prevailing minimum wages. It
has also been observed that over the past
three years, agricultural farm wages have
increased by nearly 70 per cent, along with
the rapid increase in food inlation.
Introduction of Comptroller and Auditor General (CAG) audit system
After the enactment of the social Audit
Rules in 2011, the central government,
in reaction to the criticism that crores of
rupees are squandered in lining the pock-
ets of corrupt functionaries involved in
MGNREGS, has started a new initiative in
July 2012 to usher in inancial prudence,
transparency and accountability by engag-
ing CAG-empanelled chartered accountants
in each district who would visit the vil-
lages to audit the NREGS work taking into
account minute details such as job cards,
projects being taken up, bank pass books,
and payment of wages made to workers.
In this process, the auditors will assess the
performance of the Gram Panchayats and
award certification on fund utilization.
Action taken reports submitted by the state
government on discrepancies observed in
the audit would be necessary for the states

Flagship Programmes of the Government: Where Do We Stand? 71
(and in turn, the Panchayats) to further
avail MGNREGS funds. To begin with, in
2012–2013, it is slated to audit 10 per cent
of the gram panchayats in every state.
Capacitating panchayats
Under the MGNREGS, the Panchayati Raj
Institutions (PRIs) are given huge inan-
cial resources for which they were neither
prepared nor trained to handle. There was
hardly any governance system at the local
level when the scheme was introduced in 200
districts, and later scaled up to the level of
the whole country. This resulted in all kinds
of corruption, embezzlement and misap-
propriation o these inancial resources. Now
under MGNREGS 2, there is a provision for
certiication of panchayat funds which will
be done through a district panel of chartered
accountants as the irst step of the audit. A
CAG audit of the entire programme will be
made in November, and the report will be
placed in Parliament by December 2012. As
a preparatory, it is envisaged that through a
unique transfer of funds, in this iscal year,
the Ministry of Rural Development will
transfer 1 per cent of its entire budget of
`99,000 crores to the Ministry of Panchayati
Raj to impart capacity building and training
to the panchayat functionaries.
Standard operating procedure—a major step
Aiming to address concerns regarding
the implementation of MGNREGS and
to stop leakages of funds, the Ministry of
Rural Development has formulated a set of
standard operating procedures (SOPs) in
September 2012, which have been imple-
mented with immediate effect. These aim
to streamline the redressal process and
include timelines for both the Centre and
states to dispose of complaints. As per
the SOPs, the complaints received at the
Ministry will be categorized into four major
types: (a) petitions, (b) grievances and
complaints regarding procedural violation
of guidelines, (c) complaints relating to
effective implementation of the Act and (d)
complaints involving inancial irregulari-
ties, so that the states can take appropri-
ate action accordingly. The SOPs set out
timelines for both the Centre and states for
disposal of complaints. In this system, the
complaints will be registered online and a
complaint number generated, allowing for
proper monitoring. State governments are
now required to establish a complaint cell,
under the direct charge of Secretary, Rural
Development of their respective states.
Under the Act, the Centre will exercise the
power to investigate complaints and hold
back funds to a state if remedial action is
not taken within a speciied time. With the
new system in place, state governments will
no longer be able to drag their feet on tak-
ing action on complaints, particularly those
relating to inancial irregularities. The SOP
is considered as the second major step in
the direction of enhancing transparency
and accountability of MGNREGS.
Evidence says it has worked
Given the multitude of claims and accusa-
tions with regard to implementation of
MGNREGS, the government has woken
to the need for an honest debate on the
scheme. Recently both the Prime Minister
and the National Advisory Council (NAC)
have talked about the laws in programme
implementation. There are arguments and
counter arguments on the scheme, primarily
centred around the point that it provides
wage employment at the rural level, thus
curbing outmigration. On the other side, it
is claimed that MGNREGS has pushed up
agricultural wages, which, some claim has
uplifted the living standards of the rural poor,
and others claim, has contributed to agricul-
tural crisis and food inlation. These views
are increasingly questioned by the available
evidence, which shed doubt on some com-
mon beliefs about the scheme and its impact.
A recent report compiled by the Ministry of
Rural Development suggests that ‘trends of

72 STATE OF INDIA’S LIVELIHOODS REPORT 2012
reduced labour force in agriculture precede
MGNREGA’. Further, implementation-
related problems continue to prevail where,
although the scheme offers guaranteed
employment of 100 days per year and timely
payment of wages, the ground reality tends to
be very different. For example, in Bihar, the
state with the highest incidence of outmigra-
tion, only 9 per cent of households actually
got 100 days’ employment under MGNREGS
in 2011–2012, which effectively averages
out to about 38 days of employment across
the board. Thus, the total earnings of an
MGNREGS worker may not exceed `2,000
to `3,000 in a whole year, while if he were to
migrate, he could easily make around ̀ 8,000
in the short paddy transplanting season that
lasts less than a month. The MGNREGS,
therefore, can hardly dissuade workers from
migrating.
A study on MGNREGS undertaken
by Oxford University (Berg et al., 2012)
involving researchers from the Institute for
Social and Economic Change, Bengaluru,
states that the programme has increased
rates of real agricultural wages by 5.3 per
cent yearly since its introduction in 2006.
This suggests the MGNREGS public works
programme beneits not only those directly
employed by the scheme but all wage earners
in the agricultural sector. The researchers
have used monthly wage data from the
Ministry of Agriculture from 2000 to 2011
for 249 districts across 19 states. As per the
study estimates, in the period 2008–2010,
MGNREGS generated 3.3 days of employ-
ment per year for each rural inhabitant in
the average district. The analysis shows that
each extra day of employment per capita per
year raises wages by 1.6 per cent, implying
the programme boosted real daily wage
rates by 5.3 per cent in the average district
in the period. The researchers have argued
that there are two possible ways in which a
large-scale public employment programme
like NREGA can inluence market wages.
The irst is that the extra competition for
workers drives up the price of their services.
The second is that the roads, dams and other
infrastructure built under the scheme may
increase rural productivity and, therefore,
wages across the board. The study does not
present direct evidence in favour of either
mechanism; however, anecdotal evidence
suggests that increasing competition for
labour is likely to be the more important
factor (see Annexure 1).
Transitional approach under SGSY/NRLM
A good beginning and a big dream
Commissioned as a game changing initia-
tive of the Ministry of Rural Development,
the NRLM (the restructured version of the
erstwhile Swarnajayanti Gram Swarozgar
Yojana (SGSY), now re-named Aajeevika,
aims at reaching around 7 crore poor rural
households across 600 districts, 6,000
blocks, 2.5 lakh Gram Panchayats and 6
lakh villages in India through aggregation
and self-managed SHGs and federated insti-
tutions, and support them for livelihoods
enhancement and income augmentation.
The programme is planned to be imple-
mented in a phased manner, starting with
150 districts and 600 blocks. For inancial
year (FY) 2012–2013, NRLM has an outlay
of `3,915 crore. While SGSY, which com-
menced in 1999, faced several implementa-
tion-level shortcomings, it did promote and
experience successful models in some states
like Andhra Pradesh and Kerala in terms of
mobilizing the community and building
social capital, inancial inclusion, women’s
empowerment and economic strengthening
of poor households. Building further on
the good practices, while simultaneously
trying to overcome its shortcomings, the
Ministry has started some fresh initiatives
under Aajeevika, which were not part of
the original SGSY. Provision of sensitive
support structures from national to block
levels, setting up of institutions for the
poor at various levels, provision of interest
subsidy, routing of capital subsidy through
federations of SHGs, etc., are some of the
unique features of Aajeevika.

Flagship Programmes of the Government: Where Do We Stand? 73
Aajeevika has been designed to function
on three levels:
1. Enhancing and expanding the existing
livelihoods options of the poor
2. Building skills for external job market
3. Nurturing the self-employed and entre-
preneurs
Livelihood services include both inancial
and capital services, as well as production
and productivity enhancement services such
as technology, knowledge, skills and inputs,
market linkages, etc. The interested rural
BPL youth would be offered skill develop-
ment after counselling and matching their
aptitude with the job requirements, and
placed in adequately remunerative jobs.
The self-employed and entrepreneurially
oriented poor would be provided skills and
inancial linkages and nurtured to establish
and grow with micro-enterprises for prod-
ucts and services in demand. These plat-
forms also offer space for convergence and
partnerships with a variety of stakeholders
across multiple sectors in the public, pri-
vate, civil society and community domain
by building an enabling an environment for
the poor to access their rights and entitle-
ments, public services and innovations. To
achieve results, Aajeevika also strives to be
the incubator of innovations in the rural
space and support social enterprises for
scaling up.
Aajeevika follows a mission mode appr-
oach for implementation which enables:
1. a shift from the earlier, allocation-based
strategy to a demand-driven strategy,
enabling the states to formulate their
own livelihoods-based poverty reduc-
tion action plans;
2. focus on targets, outcomes and time-
bound delivery;
3. continuous capacity building, imparting
requisite skills and creating linkages with
livelihoods opportunities for the poor,
including those emerging in the organ-
ized sector; and
4. monitoring against targets of poverty
outcomes.
As Aajeevika follows a demand-driven
strategy, the states have the lexibility to
develop their livelihoods-based perspective
plans and annual action plans for poverty
reduction. The overall plans would be within
the allocation for the state, based on inter se
poverty ratios. It is envisaged that high qual-
ity technical assistance and knowledge trans-
fer to the state missions would be required
to attain the mission’s outcome.
As FY 2011–2012 marked the end of the
Eleventh Five Year Plan, April 2012 wit-
nessed a formal transition from SGSY and
the commencement of Aajeevika, at the very
start of the Twelfth Five Year Plan (expected
to be approved by government towards end
of 2012). The following section is a synoptic
analysis on the performance of SGSY dur-
ing 2011–12, followed by that of Aajeevika,
highlighting the progress made in its initial
phase and the plans for 2012–2013. This
section also includes the initiatives under
the Mahila Kisan Sashaktikaran Pariyojana
(MKSP) with special focus on empowering
women farmers and skill initiatives.
Performance of SGSY during
2011–2012
With regard to transitioning of the pro-
gramme to NRLM/Aajeevika, there is a
reported fund utilization of 72 per cent at
the national level against the total available
funds. The states who were unable to meet
the national average with regard to utiliza-
tion of funds include Bihar, Chhattisgarh,
Goa, Gujarat, Haryana, Himachal Pradesh,
Jammu and Kashmir, Jharkhand, Karnataka,
Kerala, Madhya Pradesh, Maharashtra,
Punjab, Rajasthan, Tamil Nadu, Uttar
Pradesh, Uttarakhand and West Bengal.
Bihar, considered as one of the best perform-
ing states in rolling out the Jeevika Project
under the World Bank supported Bihar
Rural Livelihoods Project (now under the
NRLM) has reported fund utilization below
the national average under Aajeevika. In

74 STATE OF INDIA’S LIVELIHOODS REPORT 2012
terms of coverage of ‘Swarozgaris’ (SHG +
individuals), the percentage achievement of
Swarozgaris assisted against the target is 80
per cent at the national level. Some states
like Chhattisgarh (80 per cent), Gujarat (104
per cent), Haryana (109 per cent), Karnataka
(101 per cent), Kerala (109 per cent),
Maharashtra (96 per cent), Odisha (106
per cent), Punjab (90 per cent), Rajasthan
(125 per cent), Uttar Pradesh (94 per cent)
and Uttrakhand (92 per cent) have reported
achievement above the national average
of the target. While coverage of SC/ST
under the programme at the national level
was 49.59 per cent, states like Bihar, Goa,
Gujarat, Himachal Pradesh, Jammu and
Kashmir, Karnataka, Kerala, Maharashtra,
Uttar Pradesh, Uttarakhand and West Bengal
performed below the norm. The coverage of
women at the national level was 69 per cent.
However, the performance of the states in
achieving targets of minority Swarozgaris
has not been satisfactory. As per the norm,
15 per cent of the total Swarozgaris to be
assisted should have been from amongst the
minorities, which was actually the case only
in a few states, namely Jammu and Kashmir,
Kerala, Punjab, Tamil Nadu and West
Bengal. During 2011–2012 states/union ter-
ritories (UTs) have only been able to disburse
credit worth `4,399 crores which comes to
only 73 per cent of the credit target of ̀ 6,020
crores. The states which have exceeded the
national average include Chhattisgarh (98
per cent), Haryana (123 per cent), Himachal
Pradesh (193 per cent), Karnataka (105 per
cent), Kerala (98 per cent), Madhya Pradesh
(76 per cent), Maharashtra (78 per cent),
Odisha (83 per cent), Punjab (102 per cent),
Rajasthan (149 per cent), Tamil Nadu (77
per cent), Uttar Pradesh (105 per cent) and
Uttrakhand (97 per cent). (The state-wise
progress under SGSY during 2011–2012 is
shown in Annexure 1.)
Uninished preparatory tasks for rolling out Aajeevika
Since 2010, the Ministry of Rural
Development had been engaged in a con-
current process to develop the mission mode
approach, framework and rollout strategy
for the transition of NRLM to Aajeevika,
which was supported in various ways by the
World Bank, United Nations Development
Programme (UNDP), Ford Foundation,
various academic institutions and other
large development initiatives. A communi-
cation from the Ministry to states/UTs on 16
April 2012 (see Box 4.6) is self-explanatory,
detailing out the processes of approval of
the state perspective implementation plan
(SPIP), annual action plan (AAP), fund
release, submission of audit reports and
utilization certiicates under NRLM.
As per the ‘Framework of Implementation’
for NRLM (Aajeevika), the following are the
triggers for a state to receive funding support
under NRLM:
1. States should have set up a new society
or designated an existing society as
the State Rural Livelihoods Mission
(SRLM).
2. A CEO and a State Project Management
Unit (SPMU) mist be positioned in the
SRLM along with an approval for plac-
ing an implementation structure in the
irst phase districts and blocks.
3. The State’s poverty reduction action
plan (State Perspective Implementation
Box 4.6: Letter from Ministry of Rural Development dated 16 April 2012
Plan – SPIP) should be prepared and
submitted to MoRD.
A. Process of Approval of SPIP under
NRLM (Aajeevika)
l The Ministry, on receipt of SPIP,
would screen it initially through a
desk-appraisal. For the purpose, the
Ministry will put in place screening
teams, consisting of oficials and pro-
fessionals from NMMU, constituted
speciically for this purpose.
l After the desk appraisal, the comments
will be communicated to the states/
UTs.

Flagship Programmes of the Government: Where Do We Stand? 75
l A multidisciplinary Joint Appraisal
Mission will visit the state to assess
on ground the state of readiness of
the State to implement the SPIP. The
Mission would undertake ield visits
also and hold extensive discussions
with SPMU with phasing strategies
and results; stafing, implementation
capacity of units at various levels and
timeline; partnership arrangements
with government departments, banks,
NGOs, people’s institutions etc.; and
administrative and iduciary arrange-
ments.
l Based on the feedback from the
Appraisal Mission and comments
from the desk appraisal of SPIP, SRLM
would submit its revised SPIP.
l The state anchor within NMMU will
review the revised SPIP to see whether
the suggestions made have been incor-
porated and will also prepare a note
summarizing the main features of
the SPIP for the consideration of the
Empowerment Committee.
l State Mission Director/ Chief Executive
Oficer of SRLM would make the pres-
entation on SPIP in the meeting of the
Empowered Committee.
l Considering all aspects, including allo-
cation available to the state as per the
allocation formula, the Empowered
Committee will approve the SPIP,
with appropriate modiications and
recommend release of funds to the
State based on the approved SPIP.
B. Process for Approval of AAP under
NRLM (Aajeevika)
l The Ministry, on receipt of AAP, would
screen it initially through a desk-ap-
praisal by various thematic experts in
NMMU. A checklist for such appraisal
has been developed in the division.
l After the desk appraisal, the comments
will be communicated to the state/UTs
in a meeting with the state oficials.
l Based on the feedback from the desk
appraisal of AAP, SRLM would submit
its revised AAP.
l The state anchor within NMMU will
review the revised AAP to see whether
the suggestions made have been
incorporated and will also prepare a
note summarizing the main feature of
the AAP for the consideration of the
Empowered Committee.
l State Mission Director/ Chief Executive
Oficer of SRLM would make the pres-
entation on AAP in the meeting of the
Empowered Committee.
l Considering all aspects, including allo-
cation available to the state as per the
allocation formula, the Empowered
Committee will approve the AAP,
with appropriate modiications and
recommend release of funds to the
State based on the approved AAP.
C. Process of fund release under NRLM
(Aajeevika)
i. Process of Fund release
l During the year 2011–12 the first
instalment had been released to all
the DRDAs under the SGSY who have
claimed their second instalment dur-
ing the year 2010–11 or have submit-
ted the proposal for the release of 1st
instalment.
l The 2nd instalment had been released
to the DRDAs who had submitted their
proposals for the release of funds.
l Some states had submitted their SPIPs
and were Aajeevika compliant in all
respects during 2011–12 and had
informed that the funds to under SGSY
should be released to the SRLM. In case
of such state, the remaining amount
available during the year 2011–12, out
of the total state allocation for the year,
had been released to State Society as
per the SPIP/AAP submitted by them
and approval given by the Empowered
Committee. Similar procedure will
be followed for the subsequent years
also.
l Starting from the financial year
2012–13, no funds would be released
by the Ministry directly to the DRDAs
to the states who have become NRLM
compliant. All the funds will be
released to the SRLMs should have
opened a separate bank account for the
State Society and notiied the same to
the Ministry.
l SRLMs would devolve funds to the
districts in accordance with district-wise

76 STATE OF INDIA’S LIVELIHOODS REPORT 2012
allocations indicated in the AAP/ SPIP.
There should be an enabling order issued
by the state to enable fund low from
the SRLM to the DRDAs in the non-
intensive districts also.
l The first instalment will be released
after the approval of AAP/SPIP by the
Empowered Committee during the
months of April–May.
l The second instalment will be in the
months of October–December on
the request of SRLM in prescribed
pro-forma and on fulilment of the
following conditions:
¡ Utilization of at least 60% of the
available funds including the open-
ing balance;
¡ State Government’s contribution
during the previous year released
(in case of deficiency therein, Central
share would be reduced proportion-
ately);
¡ The opening balance of SRLM
should not exceed 10% of the
allocation of the previous year (in
case, the opening balance exceeds
this limit, the Central share would
be proportionately reduced);
¡ Audi t Repor t s , Ut i l i za t ion
Certiicates for the previous year
furnished;
¡ Achievement with reference to
Annual Action Plan; and
¡ Other terms and conditions stipu-
lated at the time of the previous
release should have been met.
l As per AAE/SPIP implementation
processes, subsequent trenches would
be subject to the half-yearly reviews,
annual reviews and plans, and uti-
lization of the previous tranche(s)
released and the balance funds avail-
able.
l Half Yearly Review Missions would
review implementation against the
plan (AAP and SPIP) outcomes and
the minimum quantitative/qualitative
performance criteria laid down by
Aajeevika, from time-to-time.
l Up to 10 per cent of the allocation under
NRLM will be retained at the Ministry
level for providing it to better perform-
ing states as additional instalment. This
additional instalment will be provided
on the following criteria:
¡ Expenditure is more than 75 per
cent of the total available funds by
31 December
¡ Request for additional funds over
and above the allocation for the
year; and
¡ Performance on key NRLM indica-
tors.
l However, the additional amount
would not exceed one installment (i.e.,
50 per cent) of the State allocation, care
would be taken to ensure that poverty
states get their due allocation and
better performing States get incentive
for reaching their poverty reduction
targets quickly.
D. Submission of Audit Reports and
Utilisation Certificate from the financial
year 2012–13
l The State Government Society which
fulils the requirement to receive funds
under NRLM will take a stock of all
the unspent balance lying each DRDA
under the scheme.
l The state government/state society
may take the decision that (i) these
unspent balance will be deposited by
each DRDA to the State Society under
the intimation to the Ministry or
(ii) the State may also the a decision
that unspent balances lying with the
DRDAs may be the part of available
funds under Aajeevika for that district
and while releasing the funds to the
Districts, the state society will take into
account these unspent balance.
l Audit reports/Utilization certiicates
of all the funds released to the district/
state will be furnished by the State
Society to the Ministry at the time of
submitting the proposal for the release
of 2nd instalment under Aajeevika for
the year 2012–13.
Source: Ministry of Rural Development,
Government of India, http://rural.nic.in/
sites/downloads/latest/Plan%20and%20
Process%20of%20fund%20release,%20
Submission%20of%20Audit%20Reports%20
Utilization.pdf

Flagship Programmes of the Government: Where Do We Stand? 77
As part of the implementation strategy as
well as in order to leverage political mileage
from such enormous programme outlays,
some states have come up with catchy
names for Aajeevika, such as Anandadhara
in West Bengal, TRIPTI in Odisha, Jeevika
in Bihar, Sanjeevini in Karnataka and
Himayat in Jammu and Kashmir, to name
a few. However, a committee of Members
of Parliament on NRLM has recently raised
concerns on the design and poor structuring
of the programme right at the beginning of
its transition. Some committee members
are of the view that in designing such a
large-scale poverty reduction programme,
the NRLM framework has not taken ground
realities into account.
Progress under Aajeevika (NRLM)
In view of the letter issued by the Ministry
of Rural Development to state governments
and the information from the agenda notes
of the Project Review Committee (PRC) on
various activities and the initial progress
(see Table 4.2), it is evident that Aajeevika
will require more time and effort for its
full roll-out. Table 4.2 sets out the stages of
readiness at the level of state governments,
even though NRLM is fully functional with
the National Mission Management Unit
(NMMU) in place.
Table 4.2 brings out key parameters like
the status of institutional structures and
capacity building, as well as programme
requirements like preparation of SPIP/
AAP. The state-wise progress describ-
ing the status of the Aajeevika is given in
Annexure 2.
The AAP 2012–2013 has been approved
for 10 states (Andhra Pradesh, Bihar,
Kerala, Jharkhand, Chhattisgarh, Madhya
Pradesh, Maharashtra, Assam, Odisha and
Tamil Nadu). Even though NRLM allows
for lexibility of design for state-speciic
plans, it has been delayed by many states
like Rajasthan where the programme was
lagged off in 2011 itself, since it is still
in the process of inalizing the SPIP and
AAP for approval by the Ministry of Rural
Development.
Financial allocation for 2012–2013
Table 4.3 provides details of state wise allo-
cation under NRLM/SGSY for the current
year.
Migrating from the earlier, allocation-
based model under SGSY to the present,
demand-driven strategy under Aajeevika,
some states, going by the lexibility given
to develop livelihood-based plans to reduce
Table 4.2: Stages of readiness at the level of state governments
Serial
number Activity
Number of states/
UTs completed
Number of states/
UTs not completed
1 Approval for setting up of State Society 21 12
2 Appointment of full-time mission director/CEO 12 21
3 State Project Management Units (SPMU) in position 12 21
4 Identiication of intensive districts/blocks completed 13 20
5 Preparation and submission of Annual Action Plan 13 20
6 Approval for recruitment of staff for SPMUs and District
Project Management Units (DPMUs) and Block Project
Management Units (BPMUs) for intensive districts and blocks
12 21
7 Preparation and submission of SPIP 3 30
8 Approval of AAP/SPIP and release of fund 10 23
9 Identiication of Resource Blocks completed 10 23
Source: Extracted from the Agenda Notes of the PRC dated 29 May 2012. Available at http://rural.nic.in/sites/
downloads/general/SGSY_NRLM_Agnd_PRC_F_May2012_29052012.pdf (last date of access 14/4/2012).

78 STATE OF INDIA’S LIVELIHOODS REPORT 2012
poverty, see this as an opportunity to claim
a bigger share of the `5,000 crore to be
spent over a ive-year period. While some
states like Bihar, Andhra Pradesh and
Odisha have put in major efforts to claim
a sizeable share of the `5,000 crore, others
like Rajasthan are yet to be fully prepared
to even for the take off. SPIP and AAP are
the two main programme planning docu-
ments based on which funds are released to
the respective states. By end of May 2012,
only 10 states were able to obtain approval
on their SPIPs and AAPs by the Ministry of
Rural Development.
At the mission level NMMU has launched
a new website http://aajeevika.in/and has
planned several new measures as part of its
2012–2013 activities. These include design
and development of electronically enabled
systems, building capacity of State Rural
Rural Development Department of
Government of Bihar has formulated
Perspective Implementation Plan under the
NRLM and has planned for manifold expan-
sion of Self-Help Groups network by increasing
their number to 10 lakhs involving 1.2 crores
women in the next ive years. Currently there
were only 57,000 SHGs with a membership of
7 lakh women in Bihar. However, the Rural
Development Department reports that the
existing number of SHGs is about 2.50 lakh,
and 70 per cent of them have been formed
under the Swarnajayanti Gram Swarozgar
Yojana (SGSY). While Bihar under the BRLP
has made good progress in promoting SHGs,
there is a discrepancy in the number of SHGs
in the state given by the Centre and the State
government. These SHGs need bank linkage
for ensuring access to credit to members.
But it is a fact that in Bihar there is no bank
branch in several block headquarters. As of
now, Bihar accounts for only 4 per cent of
the SHGs with bank linkage in the country.
In 2010–11, an amount of `293.64 crore was
given to 16,365 SHGs in Bihar under the
SHG-bank linkage programme. In order to
improve the quality of delivery of banking
service for the poor, the State Government
has made efforts to introduce the concept of
‘Bank Mitra-Help Desks’ and there is further
plan to scale up the concept. As a part of the
livelihood enhancement programme under
the SRLP, it is planned to make interven-
tions in some livelihood sectors that cover
a majority of the poor. In case of promising
sub sectors like dairy and poultry interven-
tion, the focus would be on organizing the
SHG households into cooperative societies to
ensure better price for their produce.
Box 4.7: Bihar: A case in making
NRLM is planned to be implemented
in a phased manner in Bihar initially in 55
blocks of the state in the irst year followed
with coverage of other blocks in successive
years covering all 534 blocks by end of
2014–15. NRLM entails expenditure of a little
over `9,200 crore over the next 10 years for
improving the economic condition of 1.25
crore rural families in the State.
Young Professionals from B-Schools to serve
under NRLM in Bihar
In May 2012, under the NRLM, the
Government of Bihar, has recruited 85 pro-
fessionals from various reputed Management
institutes like IRMA, IITs, London School
of Economics to implement projects in the
state in a professional manner. These profes-
sionals have been recruited through campus
recruitment process as well as through an
open application system following a rigorous
selection process. Initially, they are hired on
contractual basis for three years, after which
their jobs will be regularized in the districts.
The professionals are offered a monthly salary
in the range of `25,000–`50,000 depending
on their qualiication and work experience.
In addition, they are also entitled to annual
performance incentive up to `50,000 and
annual increment of `5,000. As a part of
the induction process, these professionals
would receive orientation programme on
NRLM followed by a three month intensive
programme comprising of month ield place-
ment in blocks and villages and two months
on speciic projects.
Source: www.telegraphindia.com, 3 May
2012.

Flagship Programmes of the Government: Where Do We Stand? 79
Table 4.3: Financial allocation under NRLM/SGSY during 2012–2013 (` in lakh)
Sl. no. Name of state/UT
Number of
district rural
development
authority (DRDA)
in the state/UT Allocation
Central State Total
1 2 3 6 7 8
1 Andhra Pradesh 22 11623.00 3874.33 15497.33
2 Bihar 38 27649.00 9216.33 36865.33
3 Chhattisgarh 16 6141.00 2047.00 8188.00
4 Goa 2 175.00 58.33 233.33
5 Gujarat 25 4375.00 1458.33 5833.33
6 Haryana 21 2574.00 858.00 3432.00
7 Himachal Pradesh 12 1084.00 361.33 1445.33
8 Jammu & Kashmir 22 1342.00 447.33 1789.33
9 Jharkhand 24 10425.00 3475.00 13900.00
10 Karnataka 30 8777.00 2925.67 11702.67
11 Kerala 14 3938.00 1312.67 5250.67
12 Madhya Pradesh 48 13156.00 4385.33 17541.33
13 Maharashtra 33 17349.00 5783.00 23132.00
14 Odisha 30 13294.00 4431.33 17725.33
15 Punjab 20 1251.00 417.00 1668.00
16 Rajasthan 32 6664.00 2221.33 8885.33
17 Tamil Nadu 30 10277.00 3425.67 13702.67
18 Uttar Pradesh 71 39827.00 13275.67 53102.67
19 Uttarakhandl 13 2096.00 698.67 2794.67
20 West Bengal 19 14773.00 4924.33 19697.33
21 Andaman and Nicobar Islands 3 25.00 25.00
22 Daman & Diu 1 25.00 25.00
23 Dadra and Nagar Haveli 1 25.00 25.00
24 Lakshadweep 1 25.00 25.00
25 Puducherry 1 275.00 275.00
TOTAL 529 197165.00 65596.67 262761.67
NORTH EASTERN STATES
1 Arunachal Pradesh 13 623.00 69.22 692.22
2 Assam 27 16194.00 1799.33 17993.33
3 Manipur 9 1086.00 120.67 1206.67
4 Meghalaya 7 1216.00 135.11 1351.11
5 Mizoram 8 281.00 31.22 312.22
6 Nagaland 11 834.00 92.67 926.67
7 Sikkim 1 313.00 34.78 347.78
8 Tripura 4 1960.00 217.78 2177.78
TOTAL 80 22507.00 2500.78 25007.78
GRAND TOTAL 609 219672.00 68097.44 287769.44
Source: Extracted from the Agenda Notes of the PRC dated May 29,2012. Ref: http://rural.nic.in/sites/downloads/
general/SGSY_NRLM_Agnd_PRC_F_May2012_29052012.pdf (last date of access 15/10/2012).

80 STATE OF INDIA’S LIVELIHOODS REPORT 2012
Livelihoods Missions under the World Bank
supported National Rural Livelihoods Project
(NRLP), building institutional and human
capacity through technical assistance, sup-
port on community investment, undertaking
special programmes, fostering innovation
forums (one has already been announced
in Bihar), initiating action pilots, social
entrepreneurship development and public–
private–community-partnership models.
Mahila Kishan Sashaktikaran Pariyojana (MKSP)
MKSP was introduced as a sub-component
of NRLM in Budget 2010–2011, with
an allocation of `100 crore for that year
and provision for the Ministry of Rural
Development to provide funding support
up to 75 per cent (90 per cent in case of
North East and hill states) to projects
submitted by state governments under the
scheme, with the balance to be contrib-
uted by the respective states or any other
national/international donor agency. The
programme also allowed monetization of
contributions by the project implementing
agency (PIA) in the form of manpower,
infrastructure, etc. The Pariyojana aims
at meeting the speciic needs of women
farmers and achieving socio-economic and
technical empowerment of rural women
farmers—predominantly small and mar-
ginal farmers. The expected outcomes of
the programme include net increase in
income of women farmers on a sustain-
able basis, increased visibility of women as
an interest group in agriculture, increased
access to productive land, inputs, credit,
technology, information, markets and land
management. In January 2011, the Ministry
issued the programme guideline developed
in consultation with various stakeholders,
requesting states to submit projects under
MKSP. NRLM has narrowed down its focus
on themes such as sustainable agriculture
and non-timber forest produce (NTFP)
to work with partners in the MKSP pro-
gramme. Details of the projects sanctioned
under MKSP are presented in Table 4.4.
Table 4.4: Details of projects sanctioned under MKSP
Sl. no. State Details of the PIA Title of the project
Total project
cost (in crores)
1 Andhra Pradesh 22 Zilla Samakhyas (Community
Based Organization)
Consolidation and deepening Community Managed Sustainable
Agriculture (CMSA) programme
251.58
2 Kerala Kudumbshree Collective farming through women farming groups (Joint Liability
Groups)
79.9
3 Kerala Consortium of panchayats
in Palakkad, Thrissur and
Malappuram districts of Kerala
Reviving the paddy cultivation through Women Labour Banks in
Palakkad, Thrissur and Malappuram districts of Kerala
60.62
4 Madhya Pradesh Action for social advancement
(ASA) for Chhatarpur and
Tikamgarh, Madhya Pradesh
Enhancing agricultural based livelihoods of small women farmers and
improving their strategic role in agriculture through building multi level
collectives, increasing agriculture productivity and establishing market
linkages in tribal districts of Chhatarpur and Tikamgarh of Madhya
Pradesh
9.16
5 Madhya Pradesh Action for social advancement
(ASA) for Jhabua, Barwani and
Mandla, Madhya Pradesh
Enhancing agricultural based livelihoods of small women farmers and
improving their strategic role in agriculture through building multi level
collectives, increasing agriculture productivity and establishing market
linkages in tribal districts of Jhabua, Barwani and Mandla districts of
Madhya Pradesh
13.35
6 Madhya Pradesh Centre for Advancement
and Research Development
(CARD)
Tribal Women Agriculture Transformation (TWAT) in Maikal Hills
Region- Mandla and Dindori district of Eastern Madhya Pradesh
2.56
(Table continued)

Flagship Programmes of the Government: Where Do We Stand? 81
The ofice memorandum of the Project
Approval Committee (PAC) meeting held
on 27 July 2012 notes that the role of the
Ministry of Rural Development in liveli-
hoods promotion would be to propagate
successful models which are otherwise
unable to be replicated due to technical
reasons. The focus of MKSP should be on
value-added human resource development
and, therefore, material investments should
not be encouraged. The objectives of MKSP
supported projects would, thus, address at
least one of the following objectives:
1. Creation and incentivization of com-
munity institutions and producers’
organizations
2. Sensitization of women farmers to
enable them to avail the services pro-
vided by state governments and, thus,
increase the absorption capacity of the
community as a whole
3. Sensitization of the state governments
towards the need to fine-tune their
agricultural policies
The Project Screening Commitee (PSC)
considered catagorizing the proposals
under two heads: demand side interven-
tions and supply side interventions, in
the interests of a balanced approach.
The Ministry of Rural Development was
expected to integrate MKSP with the
broader NRLM roll-out plan, capacitate
SRLMs and provide technical support to
the SRLMs to implement MKSP, thus,
eventually integrating the MKSP under
the SPIP and AAPs. After examining the
preparedness of the state governments, the
PSC felt that SRLMs of Andhra Pradesh,
Bihar, Tamil Nadu and Kerala had reached
the organizational readiness required to
steer the MKSP in their respective states
since they had dedicated and trained
resources to promote livelihoods that
would enable them t o integrate the MKSP
plans in line with their SPIP and AAPs. In
order to ensure uniform and systematic
implementation, the PSC has decided to
discontinue the concept of multi-state
projects and has directed the concerned
Sl. no. State Details of the PIA Title of the project
Total project
cost (in crores)
7 Madhya Pradesh Professional Assistance
for Development Action
(PRADAN)
Enhancing farm livelihoods of women SHGs in Mahakaushal Region of
Madhya Pradesh
19.97
8 Maharashtra MS Swaminathan Research
Foundation (MSSRF)
Empowerment of women farmers in Vidarbha, Maharashtra 5.82
9 Bihar Professional Assistance for
Development Action (PRADAN),
Bihar
Enhancing food security of poor and marginalized communities through
SRI method of paddy andwheat cultivation in a sustainable manner in
Gaya and Nalanda districts of Bihar
14.3
10 Bihar Bihar Rural Livelihood
Promotion Society (BRLPS)
Enhance the income and agriculture productivity of women farmer
through comprehensive agriculture intervention in Khagaria, Purnea,
Madhubani, Muzaffarpur, Gaya, Nalanda, Madhepura, Saharsa & Supaul
districts of Bihar
97.6
11 Bihar Action for Social
Advancement(ASA)
Enhancing status of small women farmers by improving their strategic role
in agriculture through building two tier women led collectives, increased
agriculture productivity and ensuring eficient backward and forward
market linkage systems, in Purnea, Khagaria, and Jamui districts of Bihar
13.17
12 Karnataka Genetic Resource Ecology and
Nutrition Foundation (Green
Foundation)
Empowering women, powering agriculture strengthening women farmers
through sustainable agriculture practices and participatory development
strategies covering Chitradurga and Ramanagram Districts of Karnataka
6.25
Total 574.28
Source: http://aajeevika.in/
(Table continued)

82 STATE OF INDIA’S LIVELIHOODS REPORT 2012
state governments and PIAs in such cases
to submit fresh proposals.
Under the NTFP segment of MKSP, the
PSC in its July 2012 meeting examined the
large-scale tasar-based livelihoods proposals
submitted by various agencies with a total
budget of `7,160.96 lakhs and in view of
their levels of readiness, allowed their inte-
gration by the SRLMs of Andhra Pradesh
and Bihar into their AAPs, while simulta-
neously advising the Central Silk Board,
Professional Assistance for Development
Action (PRADAN) and Bharatiya Agro
Industries Foundation (BAIF) to recast
their proposals since they were multi-state
in nature. The NTFP-related proposals
submitted by Kovel Foundation, Jattu Trust,
CCN (all in the tribal districts of Andhra
Pradesh), have been approved for three
years with a total budget of `29.65 crores.
A few other proposals from Maharastra,
Karnataka, Rajasthan and West Bengal have
been approved/advised for resubmission.
MKSP is currently in the process of
evolving and is making a good beginning
in terms of creating awareness on the rights
and entitlements of women farmers and
promoting gender sensitivity within the
implementing agencies towards women
farmers to ensure their effective empow-
erment. UN organizations like United
Nations Entity for Gender Equality and the
Empowerment of Women (UNWOMEN)
have come forward to support PIAs under
MKSP in terms of developing modules for
gender equality in agriculture and in under-
taking capacity building trainings in Bihar
and Madhya Pradesh as well as document-
ing the best practices from the experiences
under Kudumbashree and Indira Kranthi
Patham (in Kerala and Andhra Pradesh
respectively).
In its report submitted in January
2012, the Steering Committee constituted
by the Planning Commission under the
Chairmanship of Dr Mihir Shah for pro-
viding a critical review of the programme’s
physical and inancial performance during
the Eleventh Five Year Plan and to suggest
priorities, strategies and allocation for the
Twelfth Five Year Plan has endorsed the
rationale for MKSP in quickly generating
large scale proofs of workable value chain-
based livelihoods interventions in agricul-
ture and allied projects across the country.
The Steering Committee strongly recom-
mended that MKSP also produce multiple
tested solutions, materials, manuals, cost-
ing and processes that can be replicated
across the country with suitable adaptations
according to local needs at an early stage,
thus, enabling the states to scale up well in
time. The Committee has also given recom-
mendations on other Mahila Sashaktikaran
Pariyojanas (MSPs) in non-farm products
including Khadi, handloom, handicrafts
and services in clusters comprising at least
5,000–10,000 households. The igures for
the inal outlays will be released only after
the Twelfth Five Year Plan is approved, but
the Committee has recommended a budget
of ̀ 300 crores per year for MKSP and ̀ 200s
crore per year for other MSPs.
Although MKSP, in its original form, has
no formal linkages with the programmes
and schemes of the Ministry of Agriculture,
it would be of interest and beneit to all
stakeholders if a mechanism could be estab-
lished to leverage, integrate and learn from
the various programmes being implemented
by the Ministry of Agriculture, particularly
the RKVY and Women in Agriculture pro-
grammes.
Skill development and placement programme
Special Projects under Aajeevika provides
job placements through training in place-
ment linked, market-driven skills to the
rural poor youth. During 2005–2006 and
2011–2012, more than 4 lakh youth have
benefited from this programme under
SGSY. The key features of the programme
include
1. short-term (6 to 12 weeks) placement-
linked, market-driven training for the

Flagship Programmes of the Government: Where Do We Stand? 83
rural poor youth in the age group 18–35
years;
2. programme implemented through pri-
vate companies or NGOs covering sector
speciic skills, basic computer literacy
and soft skills;
3. training agencies responsible for place-
ment of youth after successful comple-
tion of training; and
4. post-placement tracking for one year.
Functioning of Rural Self-Employment Training Institutes (RSETIs)
The concept of RSETIs is based on RUDSETI,
a society established by jointly by three agen-
cies—Syndicate Bank, Canara Bank and Sri
Manjunatheswara Trust at Ujire, Karnataka.
In a similar vein, on 7 January 2009, the
Ministry of Rural Development issued a
guideline for creation of such institutes in
each district to impart skill and employment
training to the rural youth. A total of 526
RSETIs started functioning by May 2012.
A grading analysis has been undertaken by
the Ministry for 427 RSETIs, based on which
the concerned RSETI, the sponsoring bank
and the State would be recognized as well
performing agencies. As per the analysis, 8
per cent of the of the RSETIs were graded
A+, another 8 per cent were graded A and
30 per cent were graded ‘B’. However, a
majority of 41 per cent were graded in the
lowest category, ‘D’.
The Ministry of Rural Development is
looking at ways and means for improving
the quality of training being imparted by
RSETIs, for which it has signed a memo-
randum of understanding (MoU) with
National Academy of RUDSETI, Bangalore,
and organized training programmes for
the management functionaries of RSETIs.
However, there are several issues relating
to functioning of RSETIs which broadly
include lack of commitment of sponsoring
banks, posting of suitable director, adequate
stafing, uniform course curriculum, effec-
tive systems with regard to preparation of
training manuals, operational manuals,
facilitation manuals, quality audit, inancial
audit, etc., and post training handholding
support to the trainees. There are also issues
relating to allotment of land and requisite
infrastructure that hinder the functioning of
RSETIs, as well as those relating to prompt
reimbursement of claims by District Rural
Development Agencies (DRDAs) to RSETIs,
and the functioning of Local Advisory
Committees and State Level Bankers’
Committees (SLBCs) and sub-committees
on RSETIs.
Amongst the many challenges for the
training of rural youth, there are a number
of critical issues regarding the available data-
base of unemployed youth, mobilization,
beneiciary selection for placement-linked
skill development projects, district-level
monitoring of placement projects and train-
ing centers, setting up of facilitation centers
by the service provider, post placement
tracking/veriication of placed beneiciaries,
monthly/quarterly review of special projects
at the state government level and setting
up of state missions for implementation/
monitoring of special projects. The RSETI
model is much debated for serving a good
cause but with questionable basic premises.
Also it is not very clear to what extent this
part of the programme under Aajeevika is
connected and linked with the National Skill
Development Corporation (NSDC) and
the new authority being envisaged under
the chairmanship of the prime minister for
skilling India on a large scale.
The creation of 50 lakh formal sector jobs
for the rural poor youth through skilling is
envisaged under NRLM over the next ive
years which is expected to facilitate inte-
gration of the rural youth into the growing
economy. The major areas of intervention
include launching multi-state projects
through the scaling-up approach, strength-
ening systems by way of analysing and
addressing current constraints in the entire
value chain and providing end-to-end solu-
tions for placement of the rural poor youth.
Some of the strategies include building

84 STATE OF INDIA’S LIVELIHOODS REPORT 2012
partnerships and knowledge management,
special Interventions in vulnerable and less
developed areas, undertaking Himayat and
Integrated Action Plan projects, develop-
ing block resource centre strategy (with
the block as a unit), building capacities of
focus states and state-level skills and jobs
missions.
Aajeevika cell in NABARD to facilitate convergence
In April 2012 the National Bank for
Agriculture and Rural Development
(NABARD) has launched a dedicated
Ajeevika cell to help alleviate poverty in
rural hinterlands. This cell, with a dedicated
team of oficials from NABARD, will work
in close coordination with the Ministry
of Rural Development for furthering the
goals of Aajeevika. The cell aims at ena-
bling women get better access to inancial
resources at affordable rates and facilitating
establishment of sustainable livelihoods. To
start with, the unit will focus on about 600
backward and extremism-affected blocks in
150 districts of the country to be identiied
by MoRD. The Aajeevika cell will facilitate
convergence of a wide variety of approaches
and best practices to mobilize poor house-
holds into SHGs as well as propagating
livelihood development approaches such
as Wadi in adivasi communities to ensure
establishment of sustainable livelihoods.
The cell will also attempt to address supply
and demand side constraints, besides bridg-
ing capacity gaps of the poor communities
and strengthening existing livelihood sectors
such as agriculture and allied activities and
establishing micro-enterprise.
Support from World Bank, UNDP and Ford Foundation to strengthen Aajeevika
In 2000, World Bank started its initial
engagement in select districts of Andhra
Pradesh, Madhya Pradesh and Rajasthan
and learned systematically from these expe-
riences. The Implementation Completion
Report (ICR)of these three initial World
Bank-supported state projects have shown
that these projects have resulted in mobi-
lizing household savings worth more than
US$1,000 million, leveraged US$6 billion
in credit from commercial banks, achieved
US$1,000 million turnover in collective
marketing of farm and non-farm produce.
World Bank supports the project compo-
nents under (a) institution and human
capacity development, (b) state livelihoods
support for setting up institutional architec-
ture, (c) innovation and partnership support
and (d) project implementation.
During the Twelfth Five Year Plan the
World Bank with its NRLP of US$1,000
million and technical and inancial assist-
ance is slated to play a vital role in eradi-
cation of poverty at different levels in all
panchayats, districts and states. In order
to expand the programme under the Bihar
Rural Livelihoods Project, additional inanc-
ing is being sought from the World Bank to
support the geographical expansion of the
project to cover all the blocks in the existing
six districts of Bihar under the parent project
as well as support consolidation of the activi-
ties undertaken while promoting greater
impact of last mile service delivery.
Similarly, UNDP has a strategic part-
nership with NRLM to support improved
planning and delivery of the poverty
reduction and livelihoods promotion pro-
gramme in various states. The work-plan
of UNDP–NRLM partnership for two
years (2011–2012) supports a combination
of initiatives, namely, strengthening and
speeding up the programme implementa-
tion by providing technical advisory services
to overcome the challenges of inclusion
with respect to disadvantaged regions and
social groups, convening multiple stake-
holders representing persistently excluded
groups such as particularly vulnerable tribal
groups for a dialogue with policy-makers
and implementers on issues of inclusion,

Flagship Programmes of the Government: Where Do We Stand? 85
and facilitating knowledge generation and
management for effective sharing of good
practices on varied issues including inan-
cial inclusion and women led value chain
development. It also links ield-level prac-
titioners and community representatives
with the highest policy-making structures,
both at the state and national level. UNDP
is currently working to further support
NRLM in developing a strategic partnership
framework with non-government organiza-
tions (NGOs) and civil society organizations
(CSOs) at various implementation levels.
This is aimed at creating a resource pool of
NGOs and civic body organizations (CBOs)
having relevant experience to help in the
training and induction of new teams, as well
as at learning from best practices of estab-
lished NGOs in social mobilization, liveli-
hoods promotion—particularly in tribal
areas, partnerships and replication models
and creating a strong learning platform for
regular and continuous knowledge sharing
among NGOs and SRLMs on one hand, and
with NRLM on the other.
In addition, Ford Foundation sup-
ports academic consortia led by the Xavier
Institute of Management, Bhubaneshwar
(XIMB) to help, support, strengthen and act
as a think tank in shaping up NRLM and in
giving it direction.
A critical analysis
In view of the fact that there has been a
preparatory time of almost two years for
the roll-out of NRLM, the progress is, at
best, tardy, despite a general understand-
ing on the government’s full support and
approval with regard to its implementation
in mission mode across the country. Past
experiences and learnings from Integrated
Rural Development Programme (IRDP)
and SGSY with regard to planning, imple-
mentation and monitoring do net seem to
have been leveraged to the best advantage to
build and strengthen the roll-out of NRLM.
An approach of piloting/initiating NRLM
intensively in each state to understand and
develop the modalities of planning, imple-
mentation and monitoring could, perhaps,
have been carried out before launching it
throughout the country.
Given the current status and stages in
which the states have prepared or are yet
to prepare for NRLM, there are whole
lot of questions being raised on the new-
ness and uniqueness of the programme.
K. S. Gopal, Scholar in Residence at TISS,
Mumbai, circulated the note (see Box 4.8)
on his views after attending the irst meet-
ing of the NRLM advisory council held on
25 July 2012.
1. Convergence needs a greater emphasis. Its
scope to widen and deepen opportunities
to succeed on livelihoods must be fully
explored. There is little idea, knowledge
and experience on how to drive the
convergence juggernaut. Coordination
meetings and reviews by higher echelons
inds low relection at delivery end. It is
often whimsical and dependent on the
individual whereas what is needed is a
systematic and accountable approach.
Your Ministry is bestowed with a budget
of one hundred thousand crores. Effective
Box 4.8: A note written by K. S. Gopal upon his participation at the meeting of 1st Advisory Council on the NRLM chaired by the Minister for Rural Development and held on 25 July 2012
convergence within the Ministry, as a irst
step, can leap frog NRLM outcomes and
serve an ambitious agenda on poverty
alleviation and social development.
2. Civil society pilot initiatives embedded
in convergence are forced to withdraw
and there is rising frustration. There is
urgency for convergence to succeed in
the Ministry mandated activities. You
must provide a systematic and reliable
convergence process of NRLM with
MGNREGS and the Total Sanitation
Plan. It must cover a transparent plan,

86 STATE OF INDIA’S LIVELIHOODS REPORT 2012
sequencing in implementation and joint
oversight to optimize impact. The single
irst will help to improve the productive
assets base, as assisting the individual
farmers is now included in the shelf of
permissible works, while the other will
impact the health of households in terms
of reduced expenses and to improve the
self image of women.
3. To crack the convergence juggernaut,
we need to have validated ‘approaches’
and ‘know how’. We must understand
its building blocks, modus-operandi,
objectives, sequencing, egos, hierarchies,
reporting and monitoring etc. For this we
need to have studies and case illustrations
on the dynamics and the process of
convergence leading to developing
of its frameworks, models, protocols,
procedures and practices.
4. On PRI and SHG the matter is not one
of convergence or dovetailing. The aim
must be to promote joint leadership and
staff symbiosis in select tasks such as of
planning, review and impact measurement.
We must note that on implementation
issues and responsibilities, there are
genuine differences and conlicts in their
respective mandate. Also fostering the
autonomy of both in management and
accountability to activities will make them
healthy.
5. Deepening existing livelihood options
through value change enhancement
is the key strategy of NRLM. Of equal
importance is to widen the supply
side; the scope and opportunities for
livelihoods. Otherwise NRLM will
harvest a few low hanging fruits and
produce cases of ‘best practices’ while the
task is to help millions move from eek to
enhancing livelihoods.
6. You must give illip to new ideas and
experiments by promoting ‘Next
Practices’. You must identify and
harness game changing ideas, policies
and management frameworks, especially
those that are centered on the capacity
and the competitive and comparative
advantage of the poor.
7. While moving on the ‘value chain’
one ensure must safeguard both the
negotiating ability and autonomy of the
poor. While markets can improve the
lives of the poor, its power is also complex
and mysterious and not understood
by reiterating the commonplaces of
contemporary development literature.
8. One must recognize that there are
many kinds of markets, each associated
with particular social conditions and
relations as well as particular economic
circumstances. Intellectual work on
negotiating the markets rather than
merely serving them must be a part of
NRLM.
9. Risk management is important. But the
thinking to address it is by developing and
offering an insurance product. Aspects of
risk sharing, knocking down the insurance
product into bits that address the fears and
the pockets of the poor, risk minimization
etc are key instruments that must actually
have irst charge in handling risk.
10. NRLM lays stress on ‘processes’ as key
value for effective outcomes. I would
like one aspect built into this and of
immense value for those in the recipient
side–predictability. Its lack and denial
leads to uncertainty and vulnerability,
shirking of responsibility by officials,
black box, corruption, etc leading to
frustrating people and outcomes. For
instance, in MGNREGS there must
be detailed written agreement of the
district oficer with the farmer whenever
development of say horticulture or any
other activity (especially those where
delivering on time is crucial) is taken up
on private lands of poor households. What
actions, investments and when they can be
expected can safeguard the poor against
bureaucratic intransigence.
11. Measuring outcomes and performance
monitoring is focused on the inancial,
especially on the leveraging of bank
funds. This is an important indicator of
investment and the attendant conidence
in NRLM. But focusing only on it fails to
recognize the potential and the purpose of
the Mission. I request that non-inancial
aspects be monitored with equal emphasis.
This is because what the boss monitors is
what the system tries to work and deliver
upon.
Source: Varma (2012).

Flagship Programmes of the Government: Where Do We Stand? 87
Looking at the current readiness on
Aajeevika, 2012–2013 is expected to bring
mixed results on both fund utilization and
physical target achievement, and the impact
thereof.
Trickling up of an agriculture initiative: RKVY
The Ministry of Agriculture has, for the irst
time, published a report titled ‘The State of
Indian Agriculture’ 2011–12 recommending
wide-ranging reforms in the agriculture sec-
tor to enable it to meet the growing demands
and challenges of both human and envi-
ronmental factors (Ministry of Agriculture
and Co-operation, 2012). As per the report,
the thrust areas for the agriculture sector
include enhancing public sector investment
and effective transfer of technology along
with institutional reforms in research set-up
to make it more accountable and geared
towards delivery; conservation of land, water
and biological resources; development of
rain-fed agriculture and minor irrigation;
timely and adequate availability of inputs;
support for marketing infrastructure; and
increasing low of credit, particularly to small
and marginal farmers. The report highlights
the fall in contribution of agriculture to the
overall Gross Domestic Product (GDP) to
13.9 per cent. Noting that this trend is only
to be expected in the development process
of any economy, the report underlines the
importance of Indian agriculture as forming
the backbone of development, since 52 per
cent of India’s workforce is still engaged in
agriculture for its livelihoods, besides its
criticality with regard to food security and
inclusive growth.
The report further highlights the records
achieved in the production of foodgrains
and many other crops. Among the major
steps taken in the recent years for improv-
ing crop production and productivity, the
report lays special emphasis on the contri-
bution made by RKVY towards increasing
public investment in agriculture and allied
sectors. The National Food Security Mission
(NFSM) and National Horticulture Mission
(NHM) have also emerged as path-breaking
interventions which have helped in achiev-
ing record production of cereals, pulses,
oilseeds, fruits, vegetables and spices during
the last two years. Bringing Green Revolution
in Eastern India (BGREI) (Government of
India, 2011–2012) is another initiative that
has been started to increase the productivity
of the cropping system, mainly rice, wheat,
maize and pulses through promotion of
innovative production technologies and
agronomical practices, thus, effectively
addressing the underlying key constraints of
different agro-climatic sub-regions.
The report emphasizes the need to bridge
the yield gap in low productivity regions
by means of technology, inputs and other
interventions. Highlighting the structural
changes in the composition of Indian agri-
culture, and leading on to diversiication
into horticulture, livestock and fisheries
since the 1990s, the report states that the
shares of fruits and vegetables and livestock
have shown an increasing trend in recent
years, growing at much faster rates than the
traditional crops sector. The report further
observes that the private sector responds
much better and faster to incentive struc-
tures. Hence, along with greater public
investment in agriculture, there is also need
for reforms in the incentive structures in
agriculture.
On the subject of farm credit, the report
has advocated innovative models to reach
out to the bottom 40 per cent of farmers who
are still out of the umbrella of institutional
credit. The report says that while the over-
all credit to agriculture has been growing
phenomenally during the last few years, and
the interest rates for farmers have also been
reduced to 7 per cent (4 per cent after taking
into account the 3 per cent interest subven-
tion for timely repayment of crop loans),
the biggest challenge remains in terms of
increasing access to credit, particularly for
the bottom 40 per cent.
The report has called for wide-rang-
ing reforms in agricultural marketing in

88 STATE OF INDIA’S LIVELIHOODS REPORT 2012
acknowledgement of the fact that imperfect
market conditions and restrictions on the
movement of agricultural commodities
are not letting the farmers realize the true
value of their produce. The report has also
portrayed the advantages of public private
partnerships (PPPs) being adopted by the
government in addressing the issues of the
agrarian sector and overcoming its short-
comings, besides attracting larger private
sector investments and techno-managerial
eficiencies in infrastructure development
through ‘viability gap funding’ support.
Changing proile: Agriculture to have larger share in GDP
With a change and update in national
accounts scheduled for the coming year, the
agriculture sector is expected to show a surge
from 14 per cent of GDP (at 2004–2005)
prices to over 17 per cent at current prices.
This is mostly an outcome of changes in
the terms of trade and price of agricultural
produce compared to industrial output
since 2007–2008. Further, the wholesale
price inlation of food articles has risen at a
compounded average rate of 10.7 per cent
in the six years up to 2011 against 5.1 per
cent for manufactured goods, indicating
a huge shift in terms of trade in favour of
agriculture. Because of the relative change
in prices, there has been a massive shift in
incomes away from the urban to rural areas,
thus explaining the increase in purchase of
consumer goods. The price effect has been
magniied by the rapid increase in rural
wages. The MGNREGS has also set the loor
for rural wages, apart from guaranteeing
100 days of employment. Although some
experts opine that this kind of resurgence
based on higher prices, including some set
by the government, does not capture the full
picture, it should be worthwhile to see to
what extent the farmer has beneited from
the rise in input costs and shift in terms of
trade (see Table 4.5).
Genesis of RKVY in 2007–2008
RKVY is primarily a project-oriented
scheme which provides additional outlays
on existing state and central schemes in
non-project mode, which means that funds
can be utilized by the states in two streams
(see Table 4.6).
RKVY incentivizes the states to increase
public investment in agriculture and allied
sectors, taking into account agro-climatic
conditions, natural resource issues and tech-
nology and integrating livestock poultry,
and isheries more fully, while providing
more lexibility and autonomy in planning
and execution of the schemes. RKVY funds
allocation criteria that build in incentives
for increased expenditure on agriculture
and allied sectors. It also directs allocations
to the rain-fed states and states with higher
growth potential in agriculture. The alloca-
tion criteria are reproduced in Table 4.7.
Table 4.5: Share of agriculture in GDP at
current prices
Share of GDP in percentage 2004–2005
prices
Current
prices
Agriculture, forestry and
ishing
14 17.2
Mining and quarrying 2.1 2.7
Manufacturing 15.3 13.9
Electricity, gas and water
supply
1.9 1.7
Construction 7.8 8.1
Trade, hotels, transportation
and communication
28.1 25.2
Financing, insurance, real
estate and business
17.9 17
Community, social and
personal services
13 14.3
Source: Pandey (2012).
Table 4.6: RKVY fund utilization system
Stream Fund utilization
Stream-I A minimum of 75% of the RKVY fund is
to be used for speciic projects/schemes/
programmes which have been approved
as part of the state and district plans
Stream-II A maximum of 25% of the total
RKVY funds can be used in a year for
strengthening the existing state sector
schemes
Source: RKVY Scheme Guideline, Ministry of
Agriculture and Cooperation, Government of India.

Flagship Programmes of the Government: Where Do We Stand? 89
At the beginning, in its irst year (2007–
2008), RKVY was started with a relatively
small allocation of `1,489.70 crores only.
However, allocation for the RKVY has
been increasing every year, and for the year
2011–2012, an allocation of `7,860 crores
was made. States have taken up over 4,000
projects under RKVY all across the country
in agriculture and allied sectors includ-
ing horticulture, organic farming, farm
mechanization, micro and minor irriga-
tion, watershed development, agriculture
marketing and storage, seed farms, soil
and fertilizer testing laboratories, animal
husbandry, dairy development, isheries,
extension and agricultural research, etc.
Critical infrastructures, such as state seed
farms, soil and fertilizer testing laboratories,
etc., have also received assistance under the
programme across the states. Since RKVY
does not prescribe any speciic sector or
intervention to be taken up, states have the
lexibility to choose those projects which,
in their judgement, are likely to generate
growth in agriculture and allied sectors and
will contribute to the objectives of RKVY.
The RKVY programme guidelines contain
only an indicative list of components/activi-
ties which states can take up.
The areas of focus under RKVY are:
1. Integrated development of major food
crops such as wheat, paddy, coarse
cereals, minor millets, pulses and
oilseeds
2. Agriculture mechanization
3. Activities related to enhancement of
soil health
4. Development of rain-fed farming sys-
tems in and outside watershed areas,
as also integrated development of
watershed areas, wastelands and river
valleys
5. Support to state seed farms
6. Integrated pest management
7. Encouraging non-farm activities
8. Strengthening of market infrastructure
and marketing development
9. Strengthening of infrastructure to
promote extension services
10. Activities relating to enhancement of
horticultural production and popu-
larization of micro irrigation systems
11. Animal husbandry and isheries devel-
opment activities
12. Special schemes for beneficiaries of
land reforms
13. Undertaking ‘concept to completion’
projects
14. Grant support to the state government
institutions that promote agriculture/
horticulture
15. Study tour for farmers
16. Organic and bio-fertilizers
17. Innovative schemes
The functioning of RKVY programme
format has enabled the launch of new
schemes and programmes that keep the
states’ flexibility and authority intact.
Table 4.7: RKVY allocation criteria
Parameter
Weight in
percentage
The percentage share of net un-irrigated area in a state to the net un-irrigated area of the eligible
states. Eligible states are those states that become eligible to avail of the RKVY scheme based on
their baseline level of expenditure under the State Plan and preparation of District and State
Agricultural Plans.
20
The projected growth rates to a base year Gross State Domestic Product (GSDP) for agriculture
and allied sectors (say, 2005–2006) will be applied to the GSDPs to be attained by the end of the
Eleventh Plan by the states. The parameter will be set in terms of inter-state proportion of these
GSDPs projected to be reached by the state by the end of the Eleventh Plan.
30
Increase in the total Plan expenditure in agriculture and allied sectors in the previous year over
the year prior to that year.
50
Source: State of India’s Agriculture, 2011.

90 STATE OF INDIA’S LIVELIHOODS REPORT 2012
During Budget Speech in March 2012,
the Finance Minister had announced ive
special initiatives as part of the RKVY,
with a continued sub-scheme of BGREI
and a modiied integrated development
scheme for 60,000 villages to limit it to
pulses. Additionally, the Rain-fed Area
Development Programme (RADP) and
Saffron Mission were also implemented
under RKVY during 2011–2012. Five new
sub-schemes taken up during 2011–2012
include Vegetable Initiative for Urban
Clusters, Initiative for Nutritional Security
through Intensive Millets Promotion,
National Mission for Protein Supplements
and the Accelerated Fodder Development
Programme. In all, nine special pro-
grammes and schemes were implemented
as sub-schemes of RKVY with a total
allocation of `2,500 crores as indicated in
Table 4.8.
The nine sub-schemes have very speciic
objectives.
1. BGREI: Rupees 400 crores were allo-
cated for extending technologies to
improve the productivity of the rice-
based cropping system in the eastern
region of the country. The programme
is being implemented in seven eastern
states of Assam, West Bengal, Odisha,
Bihar, Jharkhand, Eastern Uttar Pradesh
and Chhattisgarh.
2. Integrated development of 60,000 pulses
villages in rain-fed areas: To attain self-
suficiency in the production of pulses
within the next three years, an annual
allocation of `300 crores was made to
promote 60,000 pulses villages in rain-
fed areas for the purpose of increasing
crop productivity and strengthening
market linkages.
3. Promotion of oil palm: In order to achieve
a major breakthrough, special attention
is being paid to oil palm as it is one of
the most eficient oil crops. This com-
ponent, which had an allocation of ̀ 300
crores is now allocated to bring 60,000
hectares under oil palm plantation and
for integrating the farmers with the
markets.
4. Vegetable initiative for urban clusters: In
order to meet the growing demand for
vegetables by the creation of vegetable
production clusters around major cities
and establishing effective market link-
age and supply chain, an outlay of `300
crores has been made.
5. Nutri-cereals: To promote balanced
nutrition, a higher production of bajra,
jowar, ragi and other millets is to be taken
up in 1,000 compact blocks covering
about 25,000 villages, with an outlay of
`300 crores made for it in 2011–2012.
6. National mission for protein supplements:
This mission was launched with an allo-
cation of ̀ 300 crores to take up activities
to promote animal based protein pro-
duction through livestock development,
dairy farming, piggery, goat rearing and
isheries in selected blocks.
7. Accelerated fodder development pro-
gramme: Rupees 300 crores was provided
for the fodder development programme,
targeting farmers in 25,000 villages.
8. Rain-fed area development programme:
An allocation of `250 crores was made
to exploit the potential of different
farming systems based upon the natural
resource and endowments created either
Table 4.8: New sub-schemes of RKVY 2011–2012
Sub-scheme
Allocation
in ` crore
BGREI 400
Integrated Development of 60,000 pulses villages in rain-fed areas (60,000 pulses
villages)
300
Special programme on oil palm area expansion (oil palm) 300
Vegetable initiative for urban clusters (vegetable clusters) 300
Initiative for nutritional security through intensive millet spromotion
(nutri-cereals)
300
National Mission for Protein Supplements (protein supplements) 300
Accelerated Fodder Development Programme (AFDP) 300
Rainfed Area Development Programme (RADP) 250
Saffron Mission-Economic Revival of J&K Saffron 50
Total 2,500
Source: Mail circulated by K. S. Gopal on [email protected]

Flagship Programmes of the Government: Where Do We Stand? 91
by the farmers or through schemes like
MGNREGS, RKVY, NHM and water-
shed projects.
9. Saffron mission: This mission has been
launched to boost the production of
saffron in Jammu and Kashmir with an
allocation of `50 crores in 2011–2012.
Over last ive years, RKVY has emerged
as a popular programme supporting
national priorities as sub-schemes while
keeping the states’ flexibility of project
selection and implementation intact. In
all, nine special programmes with focused
objectives are being implemented as sub-
schemes of RKVY. States have taken up
over 5,290 projects in the last ive years
across all segments of agriculture and allied
sectors. In aggregate, the states allocated
6.04 per cent of the State Plan allocations
to agriculture in 2010–2011 as compared
to 4.88 per cent in 2006–2007. In absolute
terms, the contribution of State Plans to
agriculture and allied sectors has gone up
from `8,770.16 crores in 2006–2007 to
`22,158.46 crores in 2010–2011. RKVY
has, thus, succeeded in incentivizing states
to allocate more funds to agriculture and
allied sectors, consequently emerging as the
principal instrument for development and
revival of agriculture.
The RKVY has now witnessed a quan-
tum jump in evolution from the variegated
schematic approach to a completely new
approach which emphasizes decentralized
agricultural planning. It envisages that
states would prepare comprehensive district
and State Agriculture Plans for projects
which are best suited to local conditions, to
catalyse the existing production scenario for
achieving higher production in agriculture
and the allied sector, thereby giving them
the required lexibility. RKVY has, thus,
emerged as the principal instrument for
development of the agriculture and the allied
sector in states and has, indeed, accelerated
the revival of agriculture.
Till February 2012, `6,992.44 crore was
released to various states under RKVY for
2011–2012. Table 4.9 gives a break up of
release and allocation of funds over the last
ive years.
Further, the Budget of 2012–2013 has
made provision of ̀ 9,217 crores for RKVY.
The scheme, which was launched in 2007
with the objective of achieving four per
cent annual growth in the agricultural
sector during the Eleventh Plan, is now
being revamped for the Twelfth Five Year
Plan and will be rolled out fully from April
2013, delaying the process by a year. For this
year, the Ministry of Agriculture will con-
tinue all its existing schemes under RKVY.
The Ministry of Agriculture had already
started working towards consolidating its
50 odd schemes into about a dozen fol-
lowing recommendations by the Planning
Commission. However, owing to oficial
huddles, particularly for sharing of changes
in the scheme with various stakeholders
like state governments or coordinating
agencies and banks, and the onset of the
kharif season, the revamped schemes will
be implemented in their new form by next
inancial year, adopting a focused approach
towards each sector and avoiding overlaps
inherent in the multiplicity of schemes (see
Box 4.9). The revamped scheme envisages
supporting a new objective of asset creation
along with its current job of funding projects
and schemes, including long term allocation
spread across four to ive years, doing away
with the current practice of yearly allocation.
Funding to states under RKVY will be made
Table 4.9: Budget allocation and release under
RKVY
Year Allocation Release
2007–2008 1498.7 1246.8
2008–2009 3165.67 2876.34
2009–2010 3806.74 3756.53
2010–2011 6755.00 6719.05
2011–2012 7729.24 6992.44 (as on
29 February 2012)
Source: Press Information Bureau (2012), dated 29
March 2012. Available at http://pib.nic.in/newsite/
erelease.aspx?relid=81921

92 STATE OF INDIA’S LIVELIHOODS REPORT 2012
in proportion to the growth of agriculture
in that particular state.
PPP: The new mantra in agriculture under RKVY
The Ministry of Agriculture has announced
a new framework on 16 August 2012 to
encourage PPPs in the farm sector. It is
envisaged to support such PPP projects
through government funds provided to
states under RKVY with an average invest-
ment of `1 lakh per farmer, half of which
will have to be put up by the private partner.
At the national level, the Small Farmers’
In this July 2012, Government of Odisha has
taken a decision to align the projects under
RKVY as per the farmers need. It recognizes
the three major requirements of farmers like
scientiic storage facility to arrest post harvest
loss, marketing linkages to get remunerative
price, adequate supply of farming machines to
win over the issue of labour supply for timely
agricultural operations. The Government has
planned for setting up of argi-entrepreneur
centres in rural areas through co-operative
banks and Primary Cooperative Societies
for availability of mechanized agricultural
equipments and popularization of modern
agricultural techniques. In the irst phase,
government has approved farm mecha-
nization schemes for ive districts namely
Kendrapara, Kandhamal, Mayurbhanj and
Jajpur and OUAT’s technical support is
sought to guide and organize implementa-
tion of the programme through KVKs in
these districts. Against budget allocation of
`904 crores for different RKVY programmes
over last ive years from 2007–08 to 2011–12,
the programmes expenditure is reported
to be around `826 cr. The utilization from
2007–08 to 2010–11 has been 100% with
expenditure of `36 cr, `115 cr, `120 cr, and
`274 cr respectively. The major programmes
undertaken during 2011–12 included normal
RKVY, bringing Green Revolution to Eastern
Region of India (BGREI), developing of
60,000 Seed Villages, developing of Nutri
cereals, Oil Palm, Vegetable Initiative for
Urban Clustres, Rain-fed Area Development
programme (RADP) and National Mission
for protein Supplements. The total expendi-
ture has been more than ̀ 279 cr. The alloca-
tion so far under normal RKVY for 2012–13
has been around `226 cr. Apart from this
`217 cr has been allocated under different
sub-schemes of BGREI and `12 cr has been
allocated for Vegetable initiative for urban
Box 4.9: Government of Odisha Plan on RKVY
cluster, `18 cr allocated for Diary/Fishery/
Goatery schemes and `2 cr allocated for
Nutri Cereals.
During Eleventh Plan period, 235 projects
were taken up, out of which 120 projects have
been completed and rest 115 projects are
ongoing which are expected to be completed
having allocation of ̀ 139 cr during 2012–13.
Nine new projects has been approved under
BGREI with a total cost of `267 cr. These
projects include Block demonstration of
Paddy under BGREI, Technology Mission
on Cotton, Popularization of hybrid maize
under PPP, popularization of hybrid paddy,
seed treatment campaign, incentivising
line-showing and line-transplanting,
e-paste surveillance and pest management
and distribution of leaf colour chart. The
Government has also approved projects
of worth `110 cr to be phased out in three
different years. In all districts, it is planned to
set up Soil Testing Centres involving Primary
Agricultural Cooperative Societies.
Odisha has a successful model on the
intervention through Mobile Veterinary Units
(MVU) under Animal Resources Centres.
The MVU is now running in 41 blocks of
10 districts namely Mayurbhnaj, Kalahandi,
Nuapada, Bolangir, Keonjhar, Nawarangpur,
Malkangiri, Koraput, Rayagada and Sonepur.
It is planned to extend the programme to 165
blocks of these districts along with Gajpati and
Kandhamal as new districts. The Vegetable
clusters programme is being implemented in
and around Bhubnaeswar urban clusters and
the Government has planned to extend the
initiative to Sambalpur and Rourkela urban
clusters during current year.
Source: ‘Odisha: RKVY projects should be
aligned to farmer’s needs says Chief Secretary,
Jyoti Prakash’, 18 July 2012. Available at
http://www.orissadiary.com/

Flagship Programmes of the Government: Where Do We Stand? 93
Agribusiness Consortium, an arm of the
Ministry of Agriculture, has been nomi-
nated to provide technical support and
facilitation to the states and public sector
players. However, the state governments are
vested with the power to take decisions on
the type and number of projects to be sup-
ported under the Public Private Partnership
on Integrated Agriculture Development
(PPPIAD). Each project is expected to run
between three years and ive years and cover
a minimum of 10,000 farmers. To keep
tabs on performance, a results framework
document (RFD) will be signed between
the private sector partner and the concerned
state government. Overall, PPPIAD appears
well-intentioned and could serve as a boost
to new and existing private players, particu-
larly rural sector-focused start-ups. If private
players could be incentivized enough by this
means to get into the sector and build an
ecosystem, the PPPIAD could help alleviate
such problems for future entrepreneurs.
Through this scheme under RKVY, it
is envisaged to leverage 50 per cent invest-
ment by the private sector over the next ive
years, with the balance share to be borne by
the Union Government, the government
is expecting to rope in a minimum of ive
lakh farmers through various supply chains.
Such a network will offer farmers an assured
channel for their produce and its competi-
tive pricing.
Changing proile of the agrarian society
In a recent study report titled ‘The Great
Indian Equalisation’ (Mishra and Shankar,
2012) said that ‘Rural India ... is no longer
an agrarian economy exposed to the vicis-
situdes of an erratic monsoon’. The study
says that manufacturing GDP in rural India
has grown at a compounded annual growth
rate of 18 per cent between 1999 and 2009 and
today accounts for 55 per cent of the manu-
facturing GDP. The study says that almost
75 per cent of all new factories in the last
decade have come up in rural India. While
one of the reasons for this development
could be that there is little physical space
available in cities, it has been also found
that rural factories deploy more capital and
employ more people. This change is show-
ing up in the nature of employment in rural
India. There has been a sharp drop in male
employment in agriculture in the past ive
years, which the authors say, ‘is equal to
the shift away over the previous 27 years’.
The study’s indings state that the ratio of
rural to urban per capita GDP has narrowed
down from 3 times to 2.5 times over the past
decade, with the transition from agriculture
to industry and services being very rapid in
rural India over the past decade. According
to the authors, this runs contrary to the
trend seen in other emerging economies.
Further, according to the report, because of
these changes, much of the incremental job
creation in manufacturing was accounted
for by construction, apart from such services
as trade at the individual level. The report
further adds that as rural India becomes less
dependent on the vagaries of the monsoon,
it also gets linked to the national economic
cycle against which it was immune so far.
Triggers in skills development initiative
The year 2011–2012 has witnessed a major
trigger in the skill development arena. There
are four major developments in skills-
related areas in India, marking the begin-
ning of exciting times in building human
capital, with its focus on leveraging India’s
demographic dividend and reaching the goal
of 500 million people.
1. Private sector participation in skills
development: With the constitution of
National Council on Skills Development
in 2008 (chaired by the prime minister)
and formation of the NSDC 2011–2012
has been a landmark year for skill devel-
opment in India, particularly in the con-
text of PPPs. The NSDC has forged new
partnerships to train people, including
joint ventures with big players like the

94 STATE OF INDIA’S LIVELIHOODS REPORT 2012
Bharti Group (11.5 million), Everonn
(15 million), Future Group (7 million),
and NIIT (7 million). As per the annual
report of NSDC, the organization has
covered 365 districts in 30 states and
UTs with 639 centres having rolled
out 346 courses in both organized and
unorganized sectors as on March 2012.
Against a target of training 1.62 lakhs
people, it could train 1.81 lakhs candi-
dates and have placed 1.44 lakhs with
79 per cent record. NSDC has funded
32 projects with 22 active partners so
far and other corporate players have
shown keen interest in partnering with
the organization. For instance, Fiat India
Automobiles has launched ‘Diksha’ to
provide educational avenues and techni-
cal training for youth. In West Bengal,
Axis Bank and Bandhan have jointly
launched a `100 crore initiative in the
area of providing skills training and
assets to poor households. In Jammu
and Kashmir, under a special scheme,
the industry sector has showed interest
in joining hands with NSDC to induct
youth to train them in special skills at
their facilities across India. All India
Society for Electronics and Computer
Technology (AISECT) has established
partnerships with NSDC with a mis-
sion to empower around 1.3 million
youth across semi-urban and rural India
over the next 10 years. Under this alli-
ance, AISECT will work as a national
partner of NSDC to propagate quality
skill development training across the
country and undertake placement of
students through a network of over
10,000 centres spread across 27 states
and three union territories. AISECT’s
skill development initiative intends to
cater to seven (of the 21 priority) sec-
tors identiied by NSDC which include
Information Technology (IT) and IT
Enabled Services (ITES), electronics
and hardware, banking and inancial
services, teacher and assessor train-
ing, textiles, organized retail and agri
skills. Commencing operations in the
backward regions of states like Madhya
Pradesh, Chhattisgarh, Jharkhand,
Bihar, Rajasthan, Uttar Pradesh, Odisha
and Maharashtra, it plans to gradually
expand and implement the programme
across the country. Besides primary
training, AISECT also plans to under-
take a ‘training of trainers’ programme
to improve the quality of skill training
and technology utilization by trainers.
Innovatively, AISECT endeavours to
optimally utilize 6,000 Common Service
Centres (CSCs) that it has set up at the
panchayat level across Madhya Pradesh,
Chhattisgarh and Punjab, by setting
up of vocational/skill resource centres,
providing placement and post-training
support and counselling (both online
and offline) and developing quality
e-learning materials in the vernacular.
2. Reform in Higher secondary education:
The Ministry of Human Resource
Development has launched the revised
centrally-sponsored scheme of voca-
tionalization of higher secondary edu-
cation. In order to promote vocational
training in schools the government has
established a vocational education cell
within the Central Board of Secondary
Education (CBSE). The scheme intends
to help create a bridge between the
academia and industry. The National
Occupational Standards (NOS) devel-
oped by the Sector Skills Councils
formed by NSDC will govern the activi-
ties in vocational education.
3. Job creation remains the key challenge:
The government was able to create only
one million jobs against the target of 50
million jobs during the Eleventh Plan
period. It has now set an ambitious tar-
get of creating 60 million jobs during the
Twelfth Five Year Plan. As a step towards
this, the government has unveiled a new
Manufacturing Policy that promises 100
million new jobs.
4. Changing the social perception of skills: For
the irst time, World Skills Competition
Flagship Programmes of the Government: Where Do We Stand? 95
has received significant coverage by
Indian media. A 16-member delegation
from India has participated in the com-
petition in London. This is a step forward
that demonstrates India’s determination
to become the skills reservoir of the
world. On the other hand, there are
reports from remote villages in under-
developed states like Odisha and Bihar
highlighting how innovative approaches
to skill development are making a big
difference (see Box 4.10).
On 11 May 2012; Mr B. K. Patnaik, Chief
Secretary Government of Odisha said that the
state targets to train one million youth during
the Twelfth Plan period. Currently, there are
800 technical institutions and training centers
in the state with an yearly intake capacity of
134,000 students. Around 70,000 youth are to
be trained outside these institutions each year in
association with private training partners.
BHUBANESWAR: Class IX student
Manjulata Sahu was forced to quit school last
year to help her family in domestic chores until
it was time for her to get married. That would
have been the end of the Nimapada girl’s
education. But the teenager was soon lured by
the promise of campus placement with ̀ 5,000
monthly salary after a month’s training by a
Bhubaneswar-based institution.
With a large number of agencies giving
funds to support skill development these
days, top notch institutions have changed
their focus from distributing fancy degrees
to impart employable expertise to those with
almost no educational qualiications to boast
of. Bar bending and steel ixing, masonry,
driving and motor mechanic, sewing are
some of the skills in high demand zeroed in
on by organizations to reduce the demand-
supply gap.
After one month of sewing machine
operator’s training at Centurion University
of Technology and Management (CUTM),
Manjulata would be able to take a three-
month on-job training with a monthly pay of
`3,500. ‘After that I will get a garment industry
job of around `5,000 with accommodation
facility in an Indian city. What an exciting
change,’ beamed Manjulata. CUTM has
already trained 3,000 students as sewing
machine operators.
‘There is a huge demand for this kind of
training. We are unable to produce suficient
manpower for industries approaching
us for people with such soft skills,’ said
Box 4.10: Minting a skilled workforce. Targets to train 1 million youth during Twelfth Plan period
Mukti Mishra chairman of Gram Tarang
Employability Training Services, an initiative
of CUTM.
Around 15 million youth need initial
vocational training every year in India and
the existing private and public institutional
capacity is only three million. ‘To meet the
huge demand, we wanted to partner in this
sector as a major thrust area,’ said Mishra.
Gram Tarang offers training in desktop
publishing (DTP), tailoring, motor repair,
wielding, among others. It has training centres
in Paralakhemundi, Bhubaneswar, Rayagada,
Balangir, Balasore and Koraput in the state
besides four centres in Andhra Pradesh.
‘While government departments such as
ministry of rural development and ministry
of SC/ST development support different
kinds of training, we have also collaborated
with industry to churn out skilled manpower
needed for them,’ said Abhinav Madan,
managing director of Gram Tarang. Though
most of the training is mainly for school
dropouts or for those with low educational
qualiication, several graduates too are joining
the courses because of guaranteed jobs, he
added.
If someone visits the fast progressing
construction work at the All India Institute
of Medical Sciences in Bhubaneswar, chances
are high that one would come across semi-
skilled construction workers trained at Sri Sri
University (SSU) here, promoted by spiritual
guru Sri Sri Ravi Shankar. ‘Vocational training
is an important aspect of our university. All
our trainees on bar bending and steel ixing
are getting campus placements. Larsen
and Toubro is our largest recruiter,’ said
Vijaya Lakshmi Mohanty, associate director
(public relation) of the university. SSU vice-
chancellor Kailash Chandra Mishra said the
varsity will expand its vocational training
base to cover several other skill-oriented
training soon.

96 STATE OF INDIA’S LIVELIHOODS REPORT 2012
A few trends recognizing skills as the future
Addressing the nation on 15 August 2012,
the Prime Minister announced the setting
up of a specialized authority to implement
skill development schemes in a coordinated
manner to enhance job prospects of the
youth. Terming it as an ambitious scheme, he
talked about the National Skill Development
Council and the training package including
the duration of the training courses, rang-
ing between six weeks and six months, and
participation of the private sector and NGOs
which will help achieve a target of 8 crore
people in the next ive years. Initially about
`40,000 crore is proposed to be pumped into
this body, to be set up by the end of the year.
There is likelihood of the Prime Minister’s
NSDC being subsumed into this author-
ity. The authority will aim at Sector Skill
Councils in various sectors like automobile,
retail, security services, food processing,
etc., to bring together all stakeholders on
one platform. As an advisory body, NSDC
was set up in 2008 by the Prime Minister
with some cabinet ministers, ield experts,
and representatives from the Planning
Commission, the National Manufacturing
Competitiveness Council and NSDC. The
NSDC has the mandate of imparting skills
to 150 million people in 10 years. The NSDC
has identiied over 21 key sectors (including
the unorganized sector) that will be of par-
ticular importance. Of these, manufacturing,
textile, construction, automotive, retail and
health care are the key sectors. The NSDC,
as part of its mandate, is also facilitating the
setting up of sector approaches in the form of
31 Sector Skills Councils (SSCs). Ten SSCs in
the automotive, retail, security, health care,
IT/ITES, and gems and jewellery verticals,
among others, have already been approved.
However, the functioning of NSDC has
come under serious criticisms on account
of its approach and strategies to achieve the
targets in view of its current progress and
partnerships.
In retrospect, in order to address the
skill gap in the country the government’s
National Skill Development Plan aims to
create 500 million skilled manpower by
2022. Besides NSDC’s target of skilling 150
million people, the Ministry of Labour and
Employment has a target of 100 million,
the Ministry of Human Resource develop-
ment 50 million and the remaining 200
million from 17 other ministries. The cur-
rent status of ministry-wise targets for skill
development for 2012–2013 is presented in
Table 4.10.
Policy push: Budget announcements 2012–2013
In the Union Budget 2012–2013, the gov-
ernment has doubled its allocation of funds
for skills development under the National
Skill Development Fund (NSDF) to `1,000
crores, raising the corpus of the fund to
`2,500 crores. The launch of the credit guar-
antees fund and exemption of vocational
training institutions from service tax are
some of the steps taken to help make skills
training affordable.
Visible Gap
The Indian economy has grown by leaps
and bounds and the choices have become
All the 15,000 tribal students taking
admission in Kalinga Institute of Social
Sciences (KISS) get vocational training as an
integral part of the curriculum. Every student
undergoes vocational education in one of
the 50 trades offered as per his or her talent,
the institute claims. KISS offers computer
training, painting, composite farming, photo
framing, food processing, incense stick
making, animal husbandry, food processing
and preservation, tailoring, applique, bakery,
soft toy making and driving, among others.
Source: Pradhan (2012).

Flagship Programmes of the Government: Where Do We Stand? 97
diversified. However, the formal educa-
tion system in India has not changed much
and remains divorced from any sort of
vocational education or training. This has
created a paradoxical problem, with big
numbers in terms of manpower, lacking in
skill and training.
India’s expectation of high GDP growth,
which corresponds with respective sectoral
growth, is expected to generate 98 million
incremental jobs between 2010 and 2015.
This will mean that on an average approxi-
mately 20 million workers will require some
form of vocational training every year. With
a current capacity of about 5.5 million, the
existing capacity for vocational training is
Figure 4.4: Projection on sectoral requirement
THE KEY SECTORS IN TERMS OF
REQUIREMENTS ARE:
Sector
Incremental
required
till 2020
Share of
mid-high
skill jobs*
Infrastructure 3.9 mn yearly –20%
BFSI 0.3 mn yearly >70%
Organized retail 1.4 mn yearly 40–45%
Tourism/hospitality 1.4 mn yearly 45–50%
Media 0.2 mn yearly 50–55%
Health care 1.0 mn yearly >70%
Education 0.7 mn yearly >70%
Total 8.9 mn –40%
SUPPLY AND DEMAND
The existing supply of vocational training is
inadequate to meet the demand
Supply Demand
Courses with limited industry
linkage
2,050 NA
Agriculture 226 NA
Auto and components 179 800
BFSI 3 300
Computers and electronic
hardware
107 300
Construction and real estate 459 3,900
Food processing 61 700
Health care 350 1,000
IT/ITeS 67 400
Media, entertainment and
creative arts
45 200
Textiles 471 1,900
Tourism and hospitality 61 1,400
Transport and logistics 3 1,500
Source: NSDC, KPMG Analysis, Kotak Institutional
Equities: The Great Unskilled. Can We Fix It, Secondary
Research.
Table 4.10: Ministry-wise targets for skill
development for 2012–2013
Ministry/Department/Organization
Target
2012–2013*
Labour and Employment 2,500,000
Micro, Small and Medium Enterprises 600,000
Agriculture 1,000,000
Rural Development 500,000
Higher Education 220,000
Women and Child Development 150,000
Housing and Urban Poverty Alleviation 1,000,000
Tourism 54,000
Social Justice and Empowerment 40,000
Textiles 250,000
Heavy Industries 20,000
Department of IT 440,000
National Skill Development
Corporation 400,000
Ministry of Chemicals and Fertilizers 30,000
Ministry of Development of North
Eastern Region 3,000
Ministry of Food Processing Industries 11,000
Ministry of Road Transport and
Highways 100,000
Ministry of Tribal Affairs 5,000
Total 7,323,000
Source: NSDC. Available at http://www.skilldevelop-
ment.gov.in/node/128
Note: *Number of people the Government aims to
cover.
inadequate to meet the demand. Figure 4.4
shows the projections therein for some of
the sectors and explains the situation.
There are other related issues on qual-
ity of training, micro-level requirements,
mobility of candidates, inspirational factors
which have limited industry linkages which

98 STATE OF INDIA’S LIVELIHOODS REPORT 2012
constitute constraints in terms of meeting
industry standards.
Paying the cost of training: In search of solutions
There are many private players who have
joined the skill development ield as train-
ing organizations under the PPP approach.
While some have prepared business models
relying on fees from trainees, others are
trying to make the industry pay the place-
ment fees. However, industry players tend
to resist placement fees since usually those
who employ entry-level skilled workers
operate in the unorganized sector and do
not necessarily distinguish between skills
obtained over a three-month training
and an unskilled worker. There is neither
a premium in the wages nor a desire to
pay any placement fees in return for such
skills. Thus, the market model of skill train-
ing mainly hinges on students paying for
themselves. Since the majority of trainees
come from economically backward strata,
they find it difficult to pay the `5,000
upwards usually charged for such entry-
level skill-training programmes. While a
policy for bank lending for skill training
has now been put in place, its eficacy,
both in terms of loan disbursement and
that of subsequent repayment, will have
to be time tested.
There, thus, exists a paradoxical situation
with regard to who will and bear the cost of
training. Articulating the situation, Manish
Sabharwal, Chairman, Team Lease, in his
article published in People Matters.in on 4
June 2012 speaks about the market failure
in skills. Paying for the cost of skill training
remains one of the biggest challenges. The
candidates either do not have the capacity or
are unwilling to pay for the training. On the
other hand, companies looking for hiring
the right kind of skills and competence are
willing to pay for trained candidates but not
for training. Training organizations/service
providers are thus unable to garner enough
candidates to impart training in a cost effec-
tive manner. On an average depending on
the duration and nature of skill training, an
investment between `2,000 and `10,000
per month is required to impart skill train-
ing. On the candidate’s part, the return on
such investment largely depends on the job
market situation. Citing the views of Nobel
laureate economist Peter Diamond, Manish
Sabharwal talks about the need for ‘a few
months of repair’ (Sabharwal, 2012). The
experience of community colleges that offers
associate degrees is an endeavour to help
prepare and repair candidates and make
them employable. Skill vouchers, advocated
by many, are perhaps another mechanism
(see Box 4.11).
In order to support and help develop skilled
workforce, the Indian Banks’ Association
(IBA) has approved a vocational education
loan scheme recently. This scheme aims
at beneiting around 25 lakh people in the
country, who can avail loans in the next
three years for pursuing vocational courses
offered by industrial training institutes and
polytechnics and other technical and profes-
sional courses from recognized colleges and
universities. The interest rate charged will be
linked to the base rate of banks as decided by
the individual banks or at reduced rates, if an
interest subsidy is provided by the central or
Box 4.11: Loan facility by bank for skill training
state governments to all or a class of benei-
ciaries proposed to be targeted.
Banks will charge a simple interest rate
during the study period and up to the
commencement of repayment. The note on
model loan scheme for vocational education
and training also mentions that servicing
of interest during the study period and the
moratorium period till commencement of
repayment is optional for students. Also
an interest concession of 1per cent will be
provided if the interest is serviced during the
study period and the subsequent moratorium
period prior to the commencement of

Flagship Programmes of the Government: Where Do We Stand? 99
Informal sector: Blending the idea of apprenticeship and soft skills
While formal training and apprenticeships
may be better equipped to serve the formal
system, there is hardly any system and model
in India that caters to micro and small
enterprises and supports people to become
self-employed. Apprenticeship schemes can
be looked at as a viable alternative for small
employers as they have the effect of mak-
ing skilled labour productive more quickly
and bringing down the cost for employers.
The challenge is to reduce the duration of
training while raising the quality so that the
return on investment for employers is better
guaranteed. Further, learning technical skills
is not enough; soft skills that make people
employable are just as critical. Experiences
from other countries show that the appren-
ticeship model is particularly effective at
developing these skills alongside technical
skills.
How to overcome the bottlenecks: Some ideas
In the skill training value chain there is a
need to retain the following aspects:
1. Popularizing vocational education and
training: A campaign by the proposed
skill development authority and/or
NSDC can help educate both parents
and candidates on the importance of
skill training and vocational education.
Professional agencies can be roped in
to popularize vocational education,
thereby helping to reduce the shortfall in
the number of skilled workers available
in the country (see Box 4.12).
2. Retaining interest of the concerned parties:
The individual candidate, training pro-
vider, certiication authority, potential
employer and suitable (dis)incentive
system can be devised like Voucher
System for the trainee candidates, seed
repayment. The bank will not charge any
processing fee for the loan. The loan will be
provided by all member banks of IBA and
banks and inancial institutions as advised by
the RBI. Banks will not take any collateral or
third-party guarantee. However, the parent
will execute the loan document along with
the student borrower as joint borrower.
Insurance for the loan is optional, and the
borrower can repay the loan any time after
commencement of repayment without having
to pay any prepayment charges. Banks will
have to implement the scheme from July
1 after taking the approval of their board.
There are obvious challenges in rolling out the
scheme by the Banks at such a short notice.
Any student of Indian nationality can
avail the loan. The student will have to secure
admission in a course run or supported by a
ministry/department of the government or
a company/society/organization supported
by the NSDC or the State Skill Missions/
State Skill Corporations, preferably leading
to a certiicate/diploma/degree issued by a
government organization or an organization
recognized/authorized by the government to
do so. To avail the loan, the vocational/skill
development course must be for anywhere
between two months and three years. There
is no age bar for the student to avail the
loan. However, if the student is a minor,
while the parent will execute the documents
for the loan, the bank will obtain a letter
of ratiication from the borrower after he
becomes a major. Banks will give a loan of
`20,000 for courses of up to three months
and `1.5 lakh for courses above one year.
Banks will consider sanction of higher
limits for courses of duration above one
year for speciic courses offered by reputed
institutions with and for courses with high
employability. The loan will include expenses
for tuition course fee, examination, library
and laboratory fee, caution deposit, purchase
of books, equipment and instruments. It will
also cover any other reasonable expenditure
found necessary for completion of the
course. Analysts say the new loan scheme for
vocational courses will help a large number
of people and will make them employable
with skills.
Sources: www.iba.org.in; www.edevelopment.
gov.in

100 STATE OF INDIA’S LIVELIHOODS REPORT 2012
capital grant and equity participation
by the government through respec-
tive departments, bilateral projects
like NRLM/SAMRIDHI and potential
employers.
3. Social standing: The growing interest
in vocational education has enormous
potential to change mindsets and cre-
ate an enabling environment for skilled
workers. The policy decision by All
India Council for Technical Education
(AICTE) is considered as a positive
move to introduce vocational under-
graduate degrees (see Box 4.13).
4. Skilling and employability solutions:
Another important perspective is related
to the acceptance of the vocationally
skilled workforce by corporate houses,
government, policymakers, and society in
general. A social ecosystem that respects
those skilled in vocational education, a
support system that addresses some of
the basic necessities of life, a network to
share and live with and a decent work-
ing atmosphere will certainly go a long
way in changing the mindset of people
towards skilling and, thereby, empower-
ing the youth.
Strict policy measures to make things work: IGNOU’s decision on community colleges
In 2009, the concept of community col-
leges was introduced by the Indira Gandhi
National Open University (IGNOU). There
are about 465 community colleges running
The Government of Haryana has planned
to introduce vocation courses at school level
under which students would be trained in
vocational courses. Launched in September
2012, this programme will be governed
under the National Vocational Education and
Qualiication Framework. The Government
of Haryana has identiied and selected eight
districts (Jhajjar, Gurgaon, Faridabad, Rohtak,
Ambala, Palwal, Mewat and Yamunanagar)
Talking about introduction of vocational edu-
cation in undergraduate level, recently in June
2012, S. S. Mantha, Chairman AICTE, has
made an announcement to approve 4–5 such
colleges in each state. AICTE has received
applications from 300 colleges to introduce
vocational education. For now, 10 sectors
have been chosen which include tourism,
construction, printing, telecom, information
technology, mobile and communication. To
begin with, AICTE has proposed ive sec-
tors for each college. Each sector can have a
maximum of 100 students limiting initially
to admit 500 students under the programme
Box 4.12: Vocational courses at the school level in Haryana
Box 4.13: Initiative by AICTE on vocational education
for the project and will begin with ive schools
in each of the above districts. Four vocational
courses like IT, retail, security and automo-
bile along with basic education are included
under this programme. The students could
avail of the employment opportunities to
their maximum after doing these courses at
school level.
Source: Times of India, 2 September 2012.
in a college. The purpose of having this pro-
gramme is to bolster employment opportuni-
ties for college graduates. Students who did
not opt for vocational education at the school
level can simultaneously do extra hours to
make up for lessons they have missed under a
speciic trainer. Ministry of Human Resource
Development has already launched the
National Vocational Education Qualiication
Framework (NVEQF) for implementation in
polytechnic as well as engineering colleges,
besides other colleges in the university system,
from 2012 to 2013.
Source: Srivastava (2012b).

Flagship Programmes of the Government: Where Do We Stand? 101
1,615 programmes enrolling nearly 43,000
students under this programme. These col-
leges offer and empower the underprivileged
with job-oriented and skill-based education
programmes in the form of an associate
degrees, diplomas or certiicates. After com-
pletion of the associate degree, a student can
take admission to an undergraduate college.
However, IGNOU found that many colleges
were being run as commercial establish-
ments, operating franchises and charging
arbitrary fees from students. In view of this,
the IGNOU Board of Management decided
on 31 May 2012 that the community college
scheme would be subjected to a time-bound
review which has put the career prospect of
thousands of students at stake (Srivastava,
2012a).
The way ahead
Although the Budget for 2012–2013 included
increased support for NSDC, the appoint-
ment of the skill councils in retail, security
and automobile sectors, the allocation of
`1,000 crore to the NSDF and a separate
credit guarantee fund that will beneit the
youth in acquiring market-oriented skills,
it is clearly not enough for India to effec-
tively train its burgeoning young workforce.
Over last two or three years there has been
unending public debate on developing
concrete action plans but the key to it is
a clearly deined unambiguous standards
framework for training and certiication in
vocational education, strengthening of PPP
models to encourage private investment and
participation in defining standards such
as NOS and SSC, as well as and seamless
integration of vocational education with
mainstream university education. In sum,
the situation calls for coordinated action
among various ministries such as Human
Resource Development and Labour as
well as the Planning Commission on skill
development policies and programmes to
reach, target, empower and capacitate the
vast majority of the workforce in the unor-
ganized sector.
According to a recent McKinsey Global
Institute report (McKinsey Global Institute,
2012), because industry has not expanded as
quickly as the capacity of the higher educa-
tion system, India is going to be one of the
few countries in the world with a surplus
of high-skill workers in the coming decade.
India will have around 6 million more
skilled workers than its domestic industries
can employ. While this doesn’t bode too well
for domestic industrial growth, it provides a
great opportunity for India’s skilled work-
ers. The report talks about India’s surplus
of high-skill workers but the medium-skill
workers (those who have completed second-
ary education) would face major problems
unless concerted action is taken soon to
increase secondary school penetration
and improve the reach of vocational train-
ing across this subset of the labour force.
According to the report, due to India’s low
secondary school graduation rate, there will
be a shortfall of 13 million medium-skill
workers by 2020. This corroborates the
issues being highlighted by several reports,
including those by International Labour
Organization (ILO), Federation of Indian
Chambers of Commerce and Industry
(FICCI) and Team Lease. The report also
makes recommendations including achiev-
ing 100 per cent secondary school enrolment
by 2020, providing job-relevant vocational
skills to the 285 million Indians with no
secondary education and improving the
performance of labour-intensive sectors.
Hopefully, the Twelfth Five year Plan
will provide some answers and concrete
avenues to consolidate these efforts while
the National Skill Development Authority
will successfully function as an umbrella
mechanism to coordinate and achieve this
gigantic number.
Good investment must result in good returns
All the four programmes described above are
well meaning and have made good inroads
even though each of them is in different
102 STATE OF INDIA’S LIVELIHOODS REPORT 2012
stages of their respective programme cycles.
However, the investment igures indicate
only the supply side of the picture: how
much has been allocated and spent, and
there is hardly any measure to determine
how much of the money spent on liveli-
hoods promotion and opportunities have
actually reached the poor. There exist occa-
sional ield studies and evaluations such as
some National Sample Survey Organisation
(NSSO) surveys which provide information
on the extent of leakages in the public dis-
tribution system (PDS) and the MGNREGS.
While these statistics show a much lower
extent of leakages (40 per cent in 2009–2010
for PDS and 42 per cent for MGNREGS)
than what is normally believed, this is no
substitute for an institutional mechanism
for evaluating government programmes,
especially on livelihoods promotion. At the
same time, there is hardly any information
on other flagship programmes and the
extent of subsidies for which independent
evaluation using secondary data is not even
possible. However, there is some progress
on this front. The Planning Commission
is already in the process of establishing an
independent evaluation office (IEO) to
undertake evaluation programmes. The
Ministry of Rural Development has also
proposed setting up of a concurrent evalu-
ation network (CENET) for evaluating its
programmes. All these efforts are yet to
come out with evidences and statistical
analysis. The social audit system and the
recent move for introducing the CAG
audit system on MGNREGS is one of the
paradigm shifts in the direction towards
institutionalization of mechanisms on
providing information on outcomes and
visible returns.
At the cusp of the Twelfth Five year
Plan it was expected that the Budget
2012–2013 would give signals on policy
directions and enhanced focus on critical
areas on livelihoods promotion. In view
o f the disappointing growth rate of the
economy, coupled with high inflation-
ary pressures, the allocation made on the
lagship programmes, as explained above,
has been relatively pragmatic. However,
the Budget 2012–2013 has not given clear
directions on the programme front except
a few corrective measures such as that on
MGNREGS, promises about consolidation
of RKVY (while remaining silent on the
Women Farmers’ Entitlement Bill, 2011)2,
populist announcements on NRLM and
setting ambitious targets on skills initiatives
(see Box 4.14).
Twenty one years ago, in one its issues,
the Economist noted that India was like a
tiger that had been caged for so long in a
crouched position that it would be unable
to leap even if it were uncaged. Two decades
later, the same journal speculated about
the possibility that it would speed ahead
of China. However, in May 2012, it took a
very different stance by means of a sobering
assessment that an India ‘bereft of leaders’
is destined for a period of lower growth.
Despite all the debate about where to draw
the poverty line, poverty levels have declined
at a higher rate during 1995 to 2010. In many
ways, given the prevalent global economic
situations, a growth of 5 per cent plus still
looks good for India. However, there is a
contradiction inherent in this eulogy, which
has serious implications on the opportunity
cost that the poor would be burdened with.
The backward states like Uttar Pradesh,
Bihar, Madhya Pradesh, Rajasthan, Odisha,
Chhattisgarh and Jharkhand which account
for more than half of India’s population,
2 The Women’s Farmers Entitlement Bill, 2011,
acknowledges the increasing feminization of India’s
agricultural labour force, with women constituting over
50 per cent of Indian farmers and about 60 per cent of
the farming sector workforce. The Bill intends to pro-
vide gender speciic needs of women farmers, protect
their legitimate needs and entitlements and empower
them with rights over agricultural land, water resources
and other related right and for other functions relating
thereto and for matters connected therewith. Once
passed by the Parliament and enacted, this Bill would
eliminate the handicaps faced by women farmers, such
as title to land, and access to credit, inputs, insurance,
technology and market.
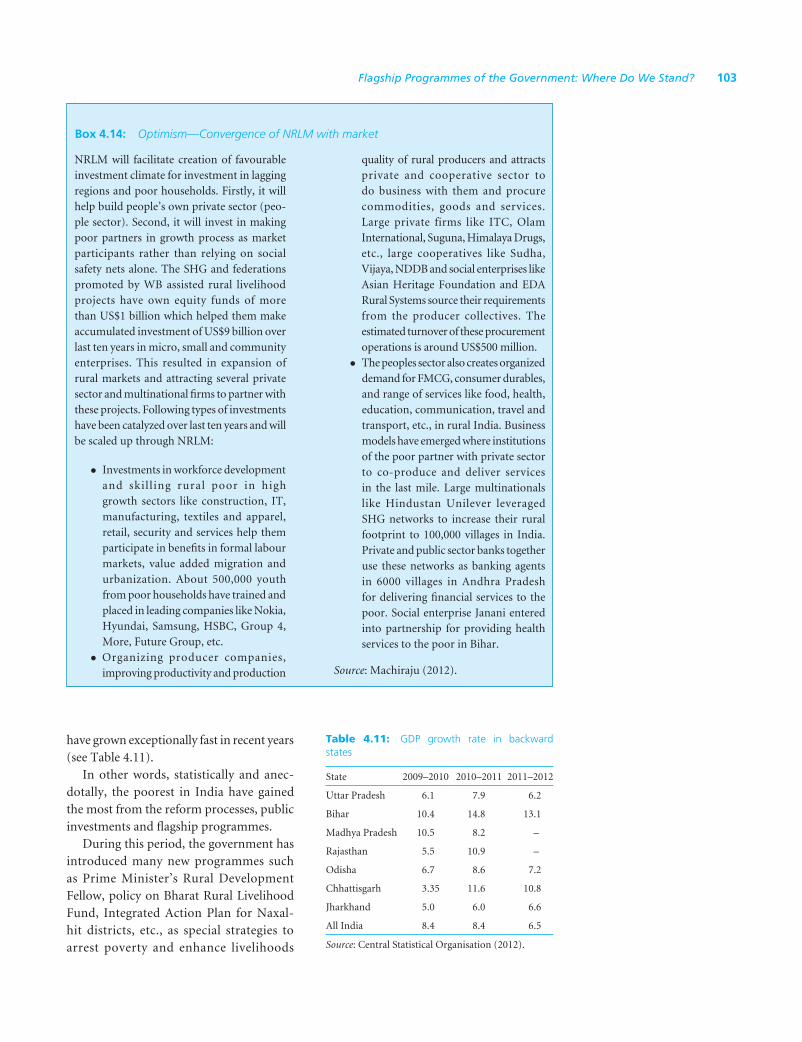
Flagship Programmes of the Government: Where Do We Stand? 103
NRLM will facilitate creation of favourable
investment climate for investment in lagging
regions and poor households. Firstly, it will
help build people’s own private sector (peo-
ple sector). Second, it will invest in making
poor partners in growth process as market
participants rather than relying on social
safety nets alone. The SHG and federations
promoted by WB assisted rural livelihood
projects have own equity funds of more
than US$1 billion which helped them make
accumulated investment of US$9 billion over
last ten years in micro, small and community
enterprises. This resulted in expansion of
rural markets and attracting several private
sector and multinational irms to partner with
these projects. Following types of investments
have been catalyzed over last ten years and will
be scaled up through NRLM:
l Investments in workforce development
and skil l ing rural poor in high
growth sectors like construction, IT,
manufacturing, textiles and apparel,
retail, security and services help them
participate in beneits in formal labour
markets, value added migration and
urbanization. About 500,000 youth
from poor households have trained and
placed in leading companies like Nokia,
Hyundai, Samsung, HSBC, Group 4,
More, Future Group, etc.
l Organizing producer companies,
improving productivity and production
Box 4.14: Optimism—Convergence of NRLM with market
quality of rural producers and attracts
private and cooperative sector to
do business with them and procure
commodities, goods and services.
Large private firms like ITC, Olam
International, Suguna, Himalaya Drugs,
etc., large cooperatives like Sudha,
Vijaya, NDDB and social enterprises like
Asian Heritage Foundation and EDA
Rural Systems source their requirements
from the producer collectives. The
estimated turnover of these procurement
operations is around US$500 million.
l The peoples sector also creates organized
demand for FMCG, consumer durables,
and range of services like food, health,
education, communication, travel and
transport, etc., in rural India. Business
models have emerged where institutions
of the poor partner with private sector
to co-produce and deliver services
in the last mile. Large multinationals
like Hindustan Unilever leveraged
SHG networks to increase their rural
footprint to 100,000 villages in India.
Private and public sector banks together
use these networks as banking agents
in 6000 villages in Andhra Pradesh
for delivering inancial services to the
poor. Social enterprise Janani entered
into partnership for providing health
services to the poor in Bihar.
Source: Machiraju (2012).
Table 4.11: GDP growth rate in backward
states
State 2009–2010 2010–2011 2011–2012
Uttar Pradesh 6.1 7.9 6.2
Bihar 10.4 14.8 13.1
Madhya Pradesh 10.5 8.2 –
Rajasthan 5.5 10.9 –
Odisha 6.7 8.6 7.2
Chhattisgarh 3.35 11.6 10.8
Jharkhand 5.0 6.0 6.6
All India 8.4 8.4 6.5
Source: Central Statistical Organisation (2012).
have grown exceptionally fast in recent years
(see Table 4.11).
In other words, statistically and anec-
dotally, the poorest in India have gained
the most from the reform processes, public
investments and lagship programmes.
During this period, the government has
introduced many new programmes such
as Prime Minister’s Rural Development
Fellow, policy on Bharat Rural Livelihood
Fund, Integrated Action Plan for Naxal-
hit districts, etc., as special strategies to
arrest poverty and enhance livelihoods

104 STATE OF INDIA’S LIVELIHOODS REPORT 2012
opportunities for the people in affected
areas. Similarly, on the agriculture front
and in addition to the restructuring of
RKVY, there are new policy guidelines on
priority sector lending, PPPs through Small
Farmer’s Agribusiness Consortium and
NABARD, and now a proposal for setting
up of an Agriculture Credit Guarantee Risk
Fund in view of increasing incidence of bad
farm sector loans and drought situations in
many states. In its recent Economic Outlook
Report (Economic Advisory Council to the
Prime Minister, 2012) the Prime Minister’s
Economic Advisory Council (PMEAC) has
stressed on the need for agricultural reforms
and cutting down subsidies on power and
water. The report is strongly of the view that
agricultural growth in India has lagged behind
as compared to that of other fast-developing
countries because reforms have not been
introduced. The PMEAC has also indicated
that the factors that deterred bold policy ini-
tiatives in the farm sector in the past have lost
much of their relevance today. The two key
ones among them were the perception that
the majority of farmers, being small and mar-
ginal, lacked the ability to absorb shocks and
that carrying out reforms in this sector was
dificult since agriculture was a state subject.
Various ways and means are now evolving
and emerging for both the Centre and the
states to work on the reforms agenda and
arrange for its speedy implementation. Both
the Twelfth Five Year Plan and a restructured
RKVY, it is expected, will bring about a lot
of changes in agriculture investment related
decisions by the government.
The State, thus, still remains as the largest
investor in livelihoods promotion for the
poor and their empowerment.
ANNExURE 1 Statewise SGSY status and progress in 2011–12
States /U.T.
Total
credit target
Total credit
disbursed (` in lacs)
Credit disbursed
(in % age)
Total
available funds Utilization
% age
utilization
Credit
subsidy ratio
Andhra Pradesh 32,130 15,256.89 47.48 15,966.21 8,928.52 55.92 2.89
Bihar 76,420 17,845.3 23.35 54,945.14 14,639.25 26.64 1.74
Chhattisgarh 16,980 16,715.27 98.44 8,335.71 7,001.18 83.99 1.87
Goa 500 115.03 23.01 451.37 61.59 13.65 2.23
Gujarat 12,090 8,199.97 67.82 5,991.39 5,316.7 88.74 2.57
Haryana 7,130 8,769.64 123 3,531.7 3,531.7 98.95 3.67
Himachal Pradesh 3,010 5,821.39 193.4 1,676.08 1,419.78 84.71 6.78
Jammu & Kashmir 3,710 1,166.05 31.43 1,160.82 525.25 45.25 3.67
Jharkhand 28,820 9,686.44 33.61 13,940.08 9,041.79 64.86 1.64
Karnataka 24,260 25,598.77 105.52 12,440.72 11,798.34 94.84 3.47
Kerala 10,890 10,696 98.22 5,419.99 5,232.6 96.54 2.77
Madhya Pradesh 36,370 27,647.3 76.02 18,258.76 14,810.33 81.11 2.71
Maharashtra 47,950 37,466.78 78.14 24,210.2 23,080.34 95.33 2.53
Odisha 36,750 30,572.07 83.19 17,292.83 17,134.89 99.09 2.58
Punjab 3,470 3,571.77 102.93 1,428.72 1,200.86 84.05 3.76
Rajasthan 18,430 27,525.07 149.35 12,045.28 10,108.88 83.92 4.02
Tamil Nadu 28,410 21,923.04 77.17 12,995.19 9,366.49 72.08 3.16
Uttar Pradesh 110,020 116,115.27 105.54 59,875.64 42,832.96 71.54 2.65
Uttrakhand 5,800 5,681.4 97.96 2,972.15 2,646.01 89.03 3.2
West Bengal 40,840 18,788.83 46.01 21,110.3 17,000.05 80.53 2.75
Source: http://rural.nic.in/sites/downloads/general/SGSY_NRLM_Agnd_PRC_F_May2012_29052012.pdf

ANNExURE 2 Status on progress of NRLM/Aajeekvika roll-out as in May 2012
States
Institutional structure Capacity building Programme requirements
Cabinet
approval
for roll-out
of NRLM
Setting up of state
society-society
registered
Appointment of
fulltime mission
director/CEO
Recruitment of
SMMU core
team-full time
Identiication
of intensive
districts/blocks
completed
Approval from
competent authority
for HR structure,
salary, recruitment
policy, inancial
and administartive
delegation
Recruitment
of staff for
intensive
blocks and
districts
Exposure visit
of key persons
Identiication
of resource
blocks
completed
Resource
block strategy
inalization and
MoU signed
with resource
organization
Resource block
strategy rolled
out
Developing
induction strategy
for project staff at
various levels
Implementation
of staff induction
strategy
Preparation and
submission of
annual action
plan
Approval for
interim HR
policy, admn
and inancial
rules for the
initial period
Preparation and
submission of SPIP
Approval of AAP/
SPIP and release of
fund
Implementation
of other pilots–
livelihoods
pilots, inancial
inclusion pilots,
etc.
Preparation of
systems and
policies
AP Done Done Done Done All districts are
intensive
Done Already in
place
Not required Not required Not required Not required Already done Already done Submitted Submitted Done SPIP/AAP approved
and funds released
Not required NA
Bihar Done Done Done Done Done Done Under
progress
Not required Not required Not required Not required Done To be done (after all
staff are recruited)
Submitted Done Submitted Approved and funds
released
To be done Done
Gujarat Done Done (A for-proit
company has been
set and designated
as SRLM)
Done Done Done HR structure and
salary approved.
Rest in progress
Done To be done To be done To be done To be done To be done To be done 1st draft
submitted but
needs extensive
revision
To be done In progress AAP likely to
be approved in
irst quarter of
2012–2013
To be done In progress
Haryana Done Done To be done (Addl.
Charge has been
given to Director RD)
Recruitment
process in on
Done To be done To be done To be done To be done To be done To be done To be done To be done 1st draft
submitted.
Revisions
To be done To be done To be done To be done To be done
HP Done Done To be done (Addl.
Charge has been
given to Director RD)
Recruitment
process in on
To be done To be done To be done To be done To be done To be done To be done To be done To be done To be submitted To be done To be done To be done To be done To be done
J&K To be done Done To be done To be done To be done To be done To be done To be done To be done To be done To be done To be done To be done To be done To be done To be done To be done To be done To be done
Jharkhand Done Done Done Done Done Done Partially done Done Done To be done To be done To be done To be done Submitted Done To be done To be done To be done To be done
Karnataka Done Done Done To be done Done HR structure and
recruitment policy
is approved and the
rest is under process
To be done To be done To be done To be done To be done To be done To be done To be submitted To be done To be done To be done To be done To be done
Odisha Done Done Done Partially done Done HR structures and
salaries approved
Under
progress
Done for
existing staff .
Done To be done To be done Already exists To be done for the
newly appointed staff
To be submitted To be done Under preparation—
1st draft done
Expected to be done
by April
To be done Exists for the
TRIPTI project
Chhattisgarh Done Done Done Recruitment
process is on
Done HR structure
approved. Rest in
progress
To be done Done for
existing staff
Done Under progress To be done To be done To be done Done Done Partially done Expected to be done
by mid-April
To be done Initial inancial
delegation done.
Rest to be done
Kerela Done Done Done Done Done Done Done NA NA NA NA NA NA Done Done Done Done and funds
released in February
2012
NA Done
MP Done Done Done Done Done Done Partially done Done Done To be done To be done To be done To be done Submitted Draft prepared 1st draft submitted To be done To be done Draft prepared
Maharashtra Done Done Done Recruitment
process is on
Done HR structure
approved. Rest in
progress
Under
progress
Done for
existing staff
of irst
Phase districts Done Under progress To be done
(within April)
To be done 1st draft
submitted
Done Under preparation—
poverty diagnostics
done
Expected to be done
by mid-April
To be done To be done
Punjab Done Done Not done In process Done In process In process Done Done In process In process In process+G12 In process Done In process In process Not done Not done In process
Rajasthan Done Done Done Partially Done Done Being done In process Done Done In process In process In process In process In process In process In process Not done In process In process
TN Done Done (WDC
designated as
SRLM)
Done In progress Done Being done In progress Not required as
the state has its
own successful
model
Not rquired Not rquired Not rquired World Bank
supported PVP
project has already
developed these
To be done 1st draft
submitted
Too be done In progress Expected to be done
in April 2012
Not required To be done
UP Done Done Yet to be done (A
nodal person for the
mission nominated)
Recruitment
process yet to
be initiated
Done (approved
by GB)
HR structure,
salaries approved
by GB
Yet to be
initiated
To be
undertaken
To be done Under progress To be done To be done To be done To be done To be done To be done To be done To be done To be done
Uttranchal Done Done To be done To be done To be done To be done To be done To be done To be done To be done To be done To be done To be done To be submitted To be done To be done To be done To be done To be done
West Bengal To be done To be done To be done To be done To be done To be done To be done To be done To be done To be done To be done To be done
Source: http://rural.nic.in/sites/downloads/general/SGSY_NRLM_Agnd_PRC_F_May2012_29052012.pdf

106 STATE OF INDIA’S LIVELIHOODS REPORT 2012
References
Ankur, Sirothia. 2012. ‘Madhya Pradesh performing
well in MGNREGA’, Times of India, 1 July 2012.
Banerji, Devika. 2012. Economic Times, 30 June 2012.
Berg, Erlend, Sambit Bhattacharyya, Rajasekhar
Durgam and Manjula Ramachandra. 2012. ‘Can
Rural Public Works Affect Agricultural Wages?
Evidences from India’, CSAE Working Paper
WPS/2012-05, Centre for the Study of African
Economies, Department of Economics, University
of Oxford, 15 May.
Central Statistical Organisation. 2012. ‘Backward States
Growing Fast, Providing Good Economics Can be
Good Politics, ET Bureau, New Delhi.
Department of Public Relations. 2012. ‘Madhya
Pradesh in top-10 in ive MNREGA Categories’,
Department of Public Relations, Madhya Pradesh,
1 July.
Dreze, Jean. 2012. Business Standard. Available at:
http://article.wn.com/view/2012/08/09/neverthe-
less_nrega_is_rural_mass_hope_jean_dr_ze/
Economic Advisory Council to the Prime Minister.
2012. ‘Economic Outlook 2012–13’, Economic
Advisory Council to the Prime Minister Chaired
by Dr. C. Rangarajan, 17 August 2012.
Gopal, K. S. and Ashwini Kumar. 2012. ‘Debate on
Should food be distributed via MGNREGS’,
Business Standard, 25 April.
Government of India. 2011–2012. ‘Budget Speech of
Finance Minister’, Government of India, New
Delhi.
Indian Express. 2012. ‘Ramesh against proposal
for providing grain under NREGA’, Financial
Express Bureau: The Indian Express, New Delhi,
Wednesday, 9 May.
Machiraju, Sitaramachandra. 2012. ‘Convergence of
NRLM with markets’. The World Bank. Available
McKinsey Global Institute. 2012. ‘The world at work:
Jobs, pay and skill for 3.5 billion people’, McKinsey
Global Institute Report, June 2012.
Ministry of Agriculture and Co-operation. 2012.
‘The State of Indian Agriculture’, Ministry of
Agriculture and Co-operation, Government of
India, March 2012.
Ministry of Rural Development. 2012a. ‘MGNREGA
Sameeksha 2006–2012’. New Delhi: Ministry of
Rural Development.
———. 2012b. An Anthology of Research Studies on the
MGNREGA 2005, 2006–2012. New Delhi: Orient
Black Swan.
Mishra, Neelkanth and Ravi Shankar. 2012. ‘The Great
Indian Equalisation,’ Credit Suisee, April 2012.
Pandey, Vinay. 2012. ‘Resurgent agricultural sector to
have larger share in economy’, Economic Times,
New Delhi, 21 August.
Pradhan, Ashok. 2012. ‘Minting a Skilled Workforce’,
TNN, Times of India, Bhubaneswar, 12 May
2012.
Press Information Bureau. (2012). ‘`6992 crore
released to States under RKVY in 2011–12 till
February 2012, ̀ 9217 crore Budgetary Allocation
for 2012–13’, Government of India, 29 March.
Available at: http://pib.nic.in/newsite/erelease.
aspx?relid=81921
Press Trust of India (PTI). 2012. ‘E-payment facility
for NREGA beneiciaries in Odisha unveiled’,
Economic Times, 29 June 2012.
Sabharwal, Manish. 2012. ‘Who’ll pay for skilling?’
Available at: http://peoplematters.in, 4 June 2012.
Sen, Amiti. 2012. ‘Rural development ministry plans big
push to MNREGA to tackle drought’, Economic
Times. 3 August 2012.
Srivastava, Vanita. 2012a. ‘IGNOU suspends commu-
nity colleges, students left in the lurch’, Hindustan
Times, New Delhi, 4 July 2012.
———. 2012b. ‘Vocational UG Degrees on Offer Soon’,
Hindustan Times, New Delhi, 7 June 2012.
Thampi, Praveen S. 2012. ‘NREGA 2.0: Does it have what
it takes to be the poor’s portal to a brighter future?’
Economic Times, 10 June 2012, ET Bureau.
Times of India. 2012. ‘Haryana government to introduce
vocational courses at school level’, 12 September.
Varma, Sanjeev Kumar. 2012. ‘B-school band in
rural push—Professionals from top institutes to
implement projects’, www.telegraphindia.com,
Thursday, 3 May 2012, Calcutta, India.
Introduction
Civil society organizations (CSOs) have played
an important role in poverty alleviation, social
mobilization, increasing empowerment and
improving livelihoods of people over the past
ive decades. They have been in the forefront
of development initiatives and have attained
national and international recognition as
legitimate actors in the shaping of society.
The development paradigms in the ields
of growth, poverty reduction and social
inclusion have changed signiicantly over
the past six decades since Independence.
CSOs have, thus, operated in and shaped
a development space that is being continu-
ously conigured and reconigured.
This chapter tracks the development of
CSOs as key actors in the process of develop-
ment from a historical perspective and high-
lights the challenges they must face to survive
in the current environment. The chapter shows
that even as traditional spaces for CSOs are
shrinking, new spaces are opening up. Thus,
in order to remain relevant, CSOs will have to
seriously re-examine their worldviews, strate-
gies and operations, and constantly reinvent
themselves. Only then can they retain their
critical positioning in the process of shaping
social structures and environments.
Deinitions and typology
Since all organizations contribute to the
development process in some way or the
other, it may be argued that all organiza-
tions headed by citizens—other than gov-
ernment—are civil society organizations.
While some of these work purely for proit
and, even in doing so, generate employment,
incomes and social beneits, others delib-
erately position themselves as non-proit
organizations/voluntary organizations/
non-governmental organizations (NGOs)
etc. The discussion on CSOs in this chapter
shall focus on the latter category, i.e., organi-
zations contributing to the development
process without aiming for proit.
Going beyond the basic classiication by
proit objective, CSOs may further be clas-
siied into the types of services they provide.
This kind of classiication is useful in evalu-
ating these organizations in terms of the
value they deliver to society. For instance:
1. Service provision: This category includes
CSOs that focus on provisional of
operational services, such as schools and
hospitals, in areas where the government
has been unable to deliver.1
2. Advocacy: The second category encom-
passes CSOs that focus on building
awareness and mobilizing people
towards common political goals. They
often create platforms for setting as well
Livelihoods Protection and Promotion:
The Changing Role of Civil Society Organizations
SMITA PREMCHANDER*
Chapter 5
1 Some of these services include poverty alleviation
programmes, protection of human rights, environmen-
tal concerns, etc. This has been explored in this article
by Ramakrishnan (2011).
* With research support from Svetha Venkatram.

108 STATE OF INDIA’S LIVELIHOODS REPORT 2012
as implementation and monitoring of
political, social and economic agenda
(Varshney, 2011). Trade unions and
NGOs engaged in social mobilization
fall into this category (Ibid.).
3. Consultancy: Yet another type of CSO
may be offering research, publica-
tions and/or consultancy in its area of
expertise.
While some CSOs are primarily targeted
towards the community, others may be
mainly engaged in providing services to
the State and, yet, others may be oriented
towards working with donors who fund
their activities. There are inherent challenges
in each ield as well as with each partner,
which are elaborated upon subsequently in
the chapter.
An organization is perceived as a CSO
or a profit-making organization depend-
ing on the nature of the work it does.
Further, the type of CSO it is perceived
as is also dictated by the agenda it propa-
gates and the motivations that drive its
work. As the nature of work performed
by CSOs continues to change over time,
it is important to acknowledge an entire
spectrum of new types of CSOs that
have emerged and be cognizant of their
potential effects on the socio-political
landscape of development. (Glasius,
2010)2
CSOs in livelihoods promotion
This section tracks the various types of
activities that CSOs have historically under-
taken to promote livelihoods for the poor.
The broad scenario is a complex one, with
different paradigms existing concurrently,
even as there have been paradigm shifts
across decades.
CSOs: From welfare to self-reliance and rights-based approaches
Earlier on CSOs worked in the welfare para-
digm, with social welfare programmes for
those who needed assistance. Social welfare
programmes typically cover those who can-
not earn their livelihoods and need to be
supported to do so.
Over time, the approach of giving doles
to the poor has come under severe criticism,
with emphasis on self-reliance, giving rise to
programmes that augment and emphasize
development of human assets (e.g., skill
development) and provision of inputs that
will help generate incomes (credit, market
linkages, etc.). Within this ield of enterprise
development and support, too, the focus of
NGOs and donors has been changing, as
depicted in Figure 5.1.
Enterprise promotion efforts tapered
down to minimalist microinance by the
early 1990s. However, with the realiza-
tion, soon after, that women who save and
take loans continue to need support for
enterprise start-ups and growth, these re-
appeared in the form of what is currently
termed ‘business development services’
(BDS). Entrepreneur development pro-
grammes and BDS continue to exist in
India, with the former mainstreamed pri-
marily in government organizations, such
as technical consultancy organizations and
BDS provided largely by private consultancy
organizations.
A subset of the poor and extremely
poor, such as those chronically ill, people
with severe disabilities and the aged, are
unlikely to attain self-dependence. This
latter group, thus, needs long-term social
protection measures. Social protection
measures are, however, largely perceived
as being out of the livelihoods domain, and
despite being considered a right, are typi-
cally less resourced. Very few NGOs concern
themselves with linking these really needy
groups to the protection grants and services
to which they are oficially entitled.
While some CSOs have moved from
welfare approaches to rights-based
2 This article by Glasius stems from a talk given
by Marlies Glasius at the Knowledge and Change
conference in the Hague, 29 September–1 October
2010.

Livelihoods Protection and Promotion: The Changing Role of Civil Society Organizations 109
Figure 5.1: Changing donor focus in enterprise promotion
INCOME GENERATING ENTERPRISES
ENTERPRISES START UP
GROUP-BASED FINANCING: MATCHING GRANTS
MINIMALISTIC MICROFINANCE
Source: Author.
approaches, others have evolved into
microinance organizations (MFOs) and
yet others have emerged in the BDS space
with the intention of supporting liveli-
hoods promotion, albeit as private con-
sulting organizations. Box 5.1 describes
business development models used by
PRADAN and DHAN in their livelihoods
building programmes.
The state approach to livelihoods
After the two World Wars, the idea that the
State must provide for the welfare of its peo-
ple began to gain popularity. Government
efforts were also social welfare oriented.
However, this is not to say that there were
no credit avenues available to the poor.
Government loans for agriculture have
existed in pre-Independent India since 1793
and short-term cooperative credit institu-
tions since 1904. After 1929, cooperative
land mortgage banks were started to help
farmers redeem lands mortgaged to private
moneylenders, and from 1954, the All India
Debt and Investment Surveys began docu-
menting the extent and nature of debt and
investment in farm and non-farm sectors
(Premchander, 2003).
PRADAN
PRADAN assists rural women from similar
social and economic contexts to form self-
help groups (SHGs). These start off as thrift
associations and then go on to form clusters
and federations. They are able to collaborate
with banks to provide for the members’ needs
for large funds. PRADAN assists members and
their families to develop medium-term inan-
cial goals and plans for themselves. Technical
and inancial assistance is provided to imple-
ment the livelihood plan. The long-term goal
is to create self-sustaining enterprises.
DHAN
DHAN focuses on scaling up enterprises
so that their beneits reach the maximum
number of people. Thematic organizations
are promoted. The guiding philosophy is to
empower the poor, and not on provision of
services. Collaborations with the government
and mainstream organizations are actively
pursued.
Sources: PRADAN’s oficial website http://
www.pradan.net; DHAN’s oficial website
www.dhan.org/aboutus.php
Box 5.1: Business development strategies

110 STATE OF INDIA’S LIVELIHOODS REPORT 2012
Anchoring the Independence struggle was
the Gandhian approach to sustainable rural
livelihoods, which prioritized the concept of
self-reliance at the village and national levels.
Production was a critical activity in each
household, with women and men engaged in
home-based production of food and textile
products, and only additional needs being
met through inter-village or rural–urban
trade. The Gandhian approach extended the
concept of self-dependence from the village
to the national level, resulting in the demand
for self-rule and independence from the
colonial rulers of the country.
It is this approach and a concern for bal-
anced regional development that led to the
adoption of the Community Development
Programme (CDP) by the Indian gov-
ernment. The country was divided into
administrative blocks, which then integrated
upwards as districts and states and after an
initial phase of piloting, the CDP approach
spread across the country. There was little
partnership envisaged between the govern-
ment and NGOs in that period, though
Gandhian organizations which engaged with
production of Khadi and Village Industry
(KVI) products were supported oficially
through grants-in-aid.
The Indian government’s enterprise pro-
motion strategies, which included targeting
the poor, encompassed provision of voca-
tional training in a selected trade as well as
some equipment as enterprise start-up sup-
port. The equipment could be a full grant or
a combination of grant and loan, the latter to
be taken from and repaid to the bank. These
efforts were routed through various gov-
ernment schemes, the major one being the
Integrated Rural Development Programme
(IRDP). The IRDP was launched in 1978
with special focus on the poor through the
concept of ‘below a poverty line’ (BPL).
This was deined on the basis of the mon-
etary value of a basket of goods needed to
obtain a pre-determined level of ‘suficient
number of’ calories per day. Several schemes
were launched to promote rural develop-
ment, which encompassed training, asset
purchase and subsidized loans for asset
creation for poor families. The programme
was known for corrupt practices in the
context of selection of beneiciaries, voca-
tional training organizations, purchase of
equipment and loan sanctions. There were
large-scale defaults on bank loans under the
programme. Further, intermittent efforts
in late 1990s, towards start of collective
businesses through women’s groups, such
as Development of Women and Children
in Rural Areas (DWACRA), were also
unsuccessful.
During the early 1980s, the SHG approach
was piloted in India, and by the early 1990s,
such groups were recognized as an alternate
means of reaching out to the poor. The
group approach was based on social col-
lateral, which replaced inancial collateral
and enabled banks to lend to the poor, thus,
signiicantly reducing the risk of default.
In 1999, recognizing the success of the
group approach in reaching out to and
empowering large numbers of the poor, the
government merged the IRDP programmes
into the Swarnajayanti Gram Swarozgar
Yojana (SGSY), which directed official
support through SHGs. In its new incarna-
tion, the programme offered subsidized
credit to SHGs while the vocational training
component was scaled down. To date, over
600,000 SHGs have been given subsidized
or unsubsidized credit under the SHG–bank
linkage scheme, of which 90 per cent are
women’s groups. However, while these have
been effective in offering small savings and
credit facilities to women, their record in
terms of repayment of bank loans has been
extremely poor, reflecting continued failure
in enterprise creation (Premchander and
Premchander, 2010).
Thus SGSY continued to carry the inef-
ficiencies and corruption of the earlier IRDP
programmes and so was unable to effectively
deliver the poor out of poverty. It was then
that linking the poor to non-subsidized
credit came up as a possible avenue to
sustainable income generation and enter-
prise creation, but failed to expand to the

Livelihoods Protection and Promotion: The Changing Role of Civil Society Organizations 111
required scale.3 It was realized that the poor
needed bank linkages for the facilitation of
savings, credit and other inancial services,
both through SHGs and directly. In 2005,
inancial inclusion was recognized as the
irst step towards mainstreaming the poor,
and both the government and the Reserve
Bank of India (RBI) have since prioritized
it at the policy level.
The subsidies under SGSY were widely
recognized as creating distortion in the
implementation of the scheme. However,
in some states, such as Andhra Pradesh,
owing to strong state support and supervi-
sion, the group approach achieved signii-
cant success in building community-based
institutions at an unprecedented scale. By
2011, SGSY was replaced by the National
Rural Livelihoods Mission (NRLM). The
latter is a demand driven ‘mission’ that
does not provide targeted support, but
seeks to provide support for creation of
high quality people’s organizations with
technical support in the livelihoods ield.
The states have set up state level-missions
to implement NRLM, some of which are
given in Box 5.2.
CSOs in livelihoods
The notion of what qualiies as development
has itself undergone several changes over the
decades. As early as the 1920s, the idea that
perhaps development interventions should
aim to move beyond simple charity from
an external organization towards involving
people’s participation in decisions on
utilization of local resources began to take
shape. Rabindranath Tagore’s Sriniketan
experiment (1921) is an example of this idea.
Other similar non-government programmes
that were organized at around the same
time were Dr Spencer Hatch’s Marthadam,
the Gurgaon Project of F. L. Brayne and
Raja Sir T. Madhavarao’s work in Baroda
(Datta, 1994)
In the pre-Independence era, CSOs also
focused on providing Gandhian-style aid
to the poor, modeling themselves along
Gandhi’s ideas on swaraj or self-rule. This
essentially involved developing villages into
self-contained micro-units. The thrust was
on enabling communities to take their own
decisions regarding development at the
local level and to develop their own village
micro-level, self-sustaining economies.
Panchayats were seen as local-level decision-
making bodies directly representing the
views of the village community. As per
the Gandhian philosophy, property rights
remained with individuals who would use
the land for developing the interests of the
community as a whole. Based in Wardha,
Gandhi’s Sevagram project (1936) was a
model of his philosophy. The focus was
on boosting cottage industries (especially
Khadi) and creating opportunities for
non-farm employment. This, in effect, was
intended as an opportunity to reconstruct
village resources and beneit the underprivi-
leged and the landless. After Independence,
l Society for Elimination of Rural Poverty,
Andhra Pradesh
l Madhya Pradesh Rural Livelihoods
Programme
l Western Orissa Rural Livelihoods Project
(Jeevika)
l Bihar Rural Livelihoods Promotion
Society (Aajeevika)
l Jharkhand State Livelihood Promotion
Society (JSLPS)
l Integrated Basin and Livel ihood
Development Programme Meghalaya
Source: Author.
Box 5.2: Livelihoods missions set up by some Indian states
3 For a detailed analysis, see Premchander,
Chidambaranathan and Jeyaseelan (2009).

112 STATE OF INDIA’S LIVELIHOODS REPORT 2012
Gandhi encouraged people to join the
Rachanatmak Karyakrama (a movement of
constructive work). Many CSOs took up the
cause and styled their functioning along the
lines of Sevagram (Datta, 1994).
In the decades between 1950s and 1980s,
there was plenty of donor funding available
for NGOs supporting livelihood building
projects. It is important to note that while
this was the case, NGOs still viewed their
work as ’intervention’, with little effort
put into making the business units self-
sustainable and proitable and ultimately
gearing them for scaling-up. Donors too
began questioning the viability of such
programmes.
In mid-1960s, an experiment was car-
ried out in Gujarat to develop the spirit of
entrepreneurship through training. Leading
entrepreneurs and politicians in Gujarat
believed that if they could kindle the entre-
preneurial spirit in the people, they could
foster economic development in the area.
The programmes were scaled up with aca-
demic inputs, and Gujarat became the irst
state to start entrepreneurship development
programmes. Soon after, a survey by David
McClelland conducted in Kakinada district
of Andhra Pradesh found that entrepreneur-
ship was the key differentiator between well
developed and less developed areas. A logical
extrapolation of this inding emerged with
the theory that poor economies owed their
poverty to lack of entrepreneurship. At this
time, state agencies also held the belief that
the entrepreneurial trait is one that can be
developed. This led to the conclusion that
state investment in entrepreneurship and
enterprise development would foster eco-
nomic development as well.
All of this taken together spurred the
Government of India to start technical con-
sultancy organizations (TCOs) in collabora-
tion with development-oriented inancial
institutions, such as Industrial Development
Bank of India (IDBI), National Bank
for Agriculture and Rural Development
(NABARD), the state financial corpora-
tions (SFCs) and the state industrial invest-
ment corporations (SIICs). TCOs were
set up in 16 states and provided technical
expertise for starting up business units as
well as business training in areas such as
loan application procedures, principles of
administration, recruitment practices, etc.
Initially targeted at men, the TCOs gradu-
ally shifted their focus to youth and women.
However, although Entrepreneurship
Development Programmes (EDPs) initi-
ated by TCOs were systematically oriented
towards the poor, women, youth and other
disadvantaged groups, those who joined
them were typically from the middle and
lower middle classes—there was still little
support available for the poorest of the poor,
who continued to remain out of the net of
mainstream credit facilities.
Banks, for their part, have been wary of
extending loans to the poor since provision
of low interest rural credit has historically
led to problems. The reasons for these
problems have been internal (inadequate
loan policies and appraisal procedures,
inadequate supervision and monitoring
of loans, etc.) as well as external (natural
calamities, absence of backward and for-
ward linkages, lack of government support
and legal framework for effecting recover-
ies, and political interference in banking
as well as cooperative credit institutions)
(Premchander, 2003).
Livelihoods strategies promoted by CSOs
The traditional approach to enterprise
promotion is focused on the entrepreneur.
External intervention programmes gener-
ally make use of the criteria of poverty to
target participants, extending programme
assistance to those who fall below a deined
poverty line. Some programmes support all
the selected people in expanding existing
income generating activities or undertak-
ing new ones, while in some programmes, a
ilter is used to select potential entrepreneurs
even from amongst those who fall below the
deined poverty line.

Livelihoods Protection and Promotion: The Changing Role of Civil Society Organizations 113
Value chains are formed when a set of
businesses perform a linked sequence of
value-added activities. In this process, a
number of participants play an important
economic role along the value chain and
each participant has unique inancial flows
(Premchander and Premchander, 2010).
Promotion of enterprises across a value
chain is expected to increase the chances
of success of individual enterprises at the
various levels and create synergies across
the chain to achieve a much more significant
scale and incremental income than would
be possible through a scattered approach.
It also allows organizations providing BDS
to specialize and achieve greater efficiency
and scale than would be possible if a wide
range of enterprises across different sectors
were to be supported.
Taking into account experiences of live-
lihoods promoting organizations in India,
and more broadly in Asia, a set of livelihoods
promotion processes stand out.
The key to building enterprises across
value chains is a good understanding of the
opportunities for business development
and selection of the sector/sub-sector and
products for which enterprises will be sup-
ported across value chains. The next step is
to plan the number of levels and the number
of enterprises at each level for a given loca-
tion. The technical needs, scale, economics
and linkages required at each level need to
be set out clearly, so that enterprises can be
planned and promoted accordingly. Once
the BDS and other service provision needs
are planned, then the question arises about
who should deliver these services. Large
programmes like BRAC, CLP and MEDEP
offer core BDS through their own staff. On
the other hand, while smaller NGOs such
as Udyogini and Sampark also do this, they
tend to pass on some BDS or outsource
them over time.
BRAC’s enterprise promotion activi-
ties started in the early 1990s as part of
donor programmes, but there was always
an intention to make them independent
of donor support so that they could be
scaled up significantly. In 1999, 60 per cent
The civil society organization Seva Mandir,
established in the 1920s by Dr Mohan Sinha
Mehta, was based on ideas of Mahatma
Gandhi.
In the late 1960s, Seva Mandir ran adult
education programmes as well as programmes
geared towards building infrastructure. The
concept worked to improve the lives of
villagers and empower them by creating
awareness on rights and entitlements.
1978 onwards, it encouraged youth to take
part in village council elections. However,
these strategies of Seva Mandir only saw
limited success. Villagers still had limited
autonomy over issues of governance, control
of resources and development. In 1985,
the National Wasteland Development
Board was created by the government as a
means to support voluntary organizations
working on development projects in remote
areas. Seva Mandir engaged itself with this
initiative in order to give local communities
the opportunity to involve themselves in
development efforts rather than wait for state
interventions.
Eventually, Seva Mandir developed the
capacity to run its programmes independent of
the government. Seva Mandir has recognized
the coming together across the boundaries
of class, caste, etc., helps the cause of self-
governance and sustaining development
programmes in its work area. For instance,
under the Forest Rights Act, villagers can
get individual titles on their forest lands.
However, in Seva Mandir’s area of work, 73
communities united and applied for collective
ownership of the forests.
Seva Mandir may be considered as an
example of achieving economic, political
and social transformation in a non-violent
manner through constructive work and self-
governance.
Source: Mehta and Singh (2012).
Box 5.3: Seva Mandir: Holistic thinking about rural livelihoods

114 STATE OF INDIA’S LIVELIHOODS REPORT 2012
of the costs were being covered, with an
expectation of 80 per cent coverage of costs
by 2000, and full cost recovery by 2002.
BRAC not only met these targets, but also
separated its enterprise division from donor
programmes and has always had separate
cost calculations for services provided to the
latter. By 2010, BRAC had a highly proitable
enterprise development programme where
each BRAC enterprise was a cost centre
and all technical support provided to other
BRAC programmes was on the basis of full
cost recovery. The programmes included
several thousand micro-entrepreneurs and
were meticulously planned at each level.
The income generating activity, or micro-
enterprise, for the individual entrepreneur
is planned to yield full or subsidiary employ-
ment. Usually sale of cows and milk provides
subsidiary income, while activities like poul-
try and ishery are more often taken up at a
scale where they provide full employment
for the entrepreneur. Often each activity can
be taken up at different scales, with BRAC’s
intention being to provide support up to a
level where the activity generates suficient
income for a household to come out of the
poverty trap.
In BRAC’s programme of enterprise
promotion all those who are part of a SHG
have the option of taking up the enterprises
they select from a given wide range. The
training is then focused on the selected
enterprise. BRAC does have training plans
in place at its various ofices, for enterprise
types that the organization perceives to
be feasible in those particular districts
or sub-districts. All participants who select
these enterprises receive trainings and are
willing to accept loans are considered capa-
ble of entrepreneurship.
When a programme focuses on the entre-
preneur, the latter selects an enterprise that
he or she feels is best suited to her abilities. A
programme may, therefore, support a wide
range of enterprises. For instance, BRAC
has supported enterprises ranging from
agriculture to poultry, ishery and livestock
(see Box 5.4).
By contrast, in the value chain approach,
enterprises are selected at one or more
levels in a given product chain, and entre-
preneurs are promoted at each of these
levels to achieve synergies from backward,
forward and horizontal linkages. The BRAC
programme has reined and perfected this
approach over the past two decades.
In India, ACCESS has emerged as one
of the largest livelihoods promotion CSOs,
with over 17 ofices in different states imple-
menting projects in partnerships with the
government, private sector and donors.
ACCESS projects span community-based
microinance, building producer organiza-
tions and creating market linkages.
Most enterprise development pro-
grammes have shown that individual house-
hold-based enterprises have a greater chance
of success compared to group enterprises.
The latter are more dificult to sustain due to
stringent requirements with regard to group
coherence, leadership, management and
administration. Some form of organization
building, however, helps to involve those
The strategy followed by BRAC is unique in
that it plans enterprises along the whole value
chain of an industry, right from the irst input
to the market. BRAC plans the number of
enterprises at each level, the scale and proit-
ability of an enterprise, inputs and capital
needed, technical training and support and
market linkages. It then goes on to provide
all these inputs and support through its own
technical experts and units, and also creates
service providers right down the value chain.
This planning has resulted in BRAC contrib-
uting signiicantly to the growth of enterprises
in at least ive sectors: agriculture, ishery,
poultry, livestock and sericulture.
Source: Author.
Box 5.4: Livelihoods building: BRAC’s strategy

Livelihoods Protection and Promotion: The Changing Role of Civil Society Organizations 115
hitherto excluded in decision-making and
helps them gain voice and representation,
as also bargaining power. Thus, organiza-
tion building enables the empowerment
processes to unfold in addition to building
in long-term sustainability of the impact of
external interventions.
Challenges faced by CSOs
According to a survey by the Union Home
Ministry, there are 33 lakh CSOs in India,
which comes to approximately one CSO
for every 400 persons. A majority of these
provide operational or charity-based serv-
ices. However, several CSOs have emerged
in the ield of advocacy, with a focus on
monitoring governance and building sup-
port for various social and political agenda
(Ramakrishnan, 2011).
However, all CSOs do not necessarily
function in a transparent manner. There
are several that exist only on letterheads and
are able to garner funds without providing
clear statements of expenditure (Ghose,
2010). Box 5.5 provides the outline of an
internationally known terminology that has
developed to describe NGOs with different
motivations and orientations.
BINGOs are allegedly motivated by the
wish to prove that the private sector is the
most eficient, even in delivering social ben-
eits. In India, the service area of BINGOs
usually lies around the production units of
companies, who use their Corporate Social
Responsibility (CSR) funds to work with
their own workers’ families and in villages
that are the catchment areas of these units.
Many CSR projects help the companies to
source or appease labour or expand their
sales. There are also many whose commu-
nity development interventions have won
acclaim by virtue of being able to devote
time and money from company proits on a
long-term basis, unlike donors who engage
in shorter term interventions on projects.
GONGOs, on the other hand, are cred-
ited with multiple motivations. In India,
NGOs set up by retired government oficials
generally work to implement government
schemes, but being formally outside the
ambit of the State, serve as operationally
convenient avenues for donors, not only in
terms of funding but also in terms of wield-
ing greater influence on operations.
The structuring of all State-level rural live-
lihoods programmes as separate registered
societies, such as Society for Elimination
of Rural Poverty (SERP), Bihar Rural
Livelihoods Promotion Society (BRLPS),
Madhya Pradesh Rural Livelihoods Project
(MPRLP),Jharkhand Rural Livelihoods
Project (JRLP), etc., are evidence of creation
of structures within the fold of the govern-
ment with independent recruitment, opera-
tional, and monitoring processes. This rein-
forces the position of a CSO as the connector
of the last mile, to those poor and excluded.
A strong criticism of GONGOs is that since
they position themselves as ‘human rights
NGOs’, government-related organizations
end up occupying the space that would oth-
erwise be occupied by genuine CSOs, who
would represent the real voice of the people,
not coloured by the government.
There are several gaps between different
types of organizations: NGOs, donors and
government. For example, quite often the
l BINGOs: Business interest NGOs, also
known in the US as astroturf (a play on
the word grassroots)
l GONGOs: Government-organized
NGOs
l FLAMINGO: The fly-by-night or flavour-
of-the-month NGO is an impostor
organization posing as an NGO and
writing funding proposals simply to
attract donor funding.
Source: Glasius (2010).
Box 5.5: NGOs and agendas

116 STATE OF INDIA’S LIVELIHOODS REPORT 2012
government is seen to either pressurize or
incentivize NGOs for various development
activities that entail diversiication of the
NGOs’ operational areas into health, edu-
cation, livelihoods, etc. At other times, the
government as well as donors give preference
to those NGOs who have a deined product
to deliver to the community as well as the
capability to deliver. Further, both donors
and the government pressurize NGOs to
deliver results quickly (Premchander and
Premchander, 2010).
In the context of international partner-
ships, NGOs tend to be oriented towards
meeting the strongly formulated demands
and expectations of donors, hiring so-called
‘professionals’ (MBAs, MSWs,4 etc.) for the
project management, who are generally
devoid of loyalty, either to the organization
or to the community. The fact that they are
prone to switch jobs frequently in pursuit
of the best possible professional trajectory
seems to indicate that their salaries need to be
suficiently high to keep them motivated and
enable them to maintain their lifestyles. Even
apart from optimum salaries, the NGOs
and the funding organizations need to offer
them incentives in terms of career growth,
job satisfaction, etc., in order to retain them.
This is an inherent risk that is prevalent in
any type of organization or industry.
Even though NGOs work with the com-
munity, an idealized conceptualization of
the community has numerous pitfalls. For
instance, NGO Sampark has had conflicts
with members of the community over the
issue of preferring corruption over honesty.
It would be erroneous to assume that every-
one in the community is honest and against
corruption. In fact, it has been known for
communities to collude with dishonest
staff members in the NGOs, government
offices or banks staff to promote corrupt
practices.
A case in point was a government scheme
for training women in tailoring, whereby the
trainees would be paid a monthly stipend.
Several women joined, but no one actually
learnt tailoring. The government officer
booked the expenses but did not appoint a
teacher or hold classes. The women collected
the stipend and gave a portion of it to the
government officer. The women continued
earning money from their farm labour
and additionally took the stipend without
putting in the required time or learning
anything; the officer retained the money
that was meant for running the training
classes, as well as part of the women’s sti-
pend as bribe. Both parties perceived this
as beneficial, but the skill formation, which
was the actual objective of the scheme, did
not take place.
Another important point in this context
is that rationales of quality expectations
change with time and with changing social
paradigms. Often these demands are quite
upfront and are also reflected in the policies
and products of the various donor agencies.
Donor agencies formulate their demands
and expectations and most NGOs tend
to agree as they feel they have no choice,
although some large and powerful NGOs do
manage to dictate some of their own terms
as well. Values of transparency and account-
ability to the people that the NGOs serve are
usually on the top of the NGOs’ priorities
while notions of quality dominate those of
the donors. Further, when demands of the
donors dominate, such as are evidenced
in the bidding and selection processes for
development contracts, they create pressure
for survival of the fittest among the NGOs.
Consequently, local perspectives usually
get ignored in the process since the NGOs’
orientation towards the requirements of
the donors detracts from their articulation
of local needs.
The ‘donor–recipient’ paradigm has,
thus, effectively replaced the ‘solidarity’ par-
adigm. This has resulted in reduction in the
quality of cooperation between NGOs and
donors. In occasional instances where there
is solidarity between the NGOs and donors,
the quality of cooperation in the projects 4 Masters in Business Administration, Masters in
Social Work.

Livelihoods Protection and Promotion: The Changing Role of Civil Society Organizations 117
is high. The demands and expectations for
quality in international cooperation cur-
rently hinge on the concept of sustainability,
which is perceived to reflect the quality of
the work done. This, however, effectively
acts as a trap since it diverts attention from
the orientation of the project towards com-
munity benefits and towards the financial
benefits to the NGO itself. For instance,
NGOs working in the field of selling con-
doms mobilize more money than the ones
generating awareness and education about
family planning, benefits of smaller families,
etc. Such being the case, the comparative
advantage of NGOs in terms of organiza-
tional flexibility is inevitably replaced by
bureaucracy of NGOs.
Donors, for their part, are increasingly
focused on technical expertise. They want to
deal with NGOs primarily as contractors and
expect a similar approach from the NGOs.
Donors in the present scenario expect NGOs
to hire and fire contract staff as per their
need, which is a complete turnaround from
the way NGOs are traditionally supposed to
function. Donors today tend to treat NGOs
as extended arms for delivery, which is,
in effect, a short-term agenda. Long-term
project agenda for bringing about significant
change on the ground, in which the donor
and NGO used to work in partnership,
is fast becoming an outmoded practice
(Premchander and Premchander, 2010).
Donors, NGOs and local communities
are all stakeholders in community projects,
but with different stakes. The quality of
development depends entirely on the
quality of relationship between the local
NGO and the community at one end and
that between the NGO and the donor at
the other. A good relationship between the
community and the local NGO, however,
does not necessarily imply smooth sailing
operations. The lives and livelihoods of
the poor are essentially strained, and these
strains and difficulties inevitably reflect
on the success of the intervention projects
introduced by the NGOs and donors (Ibid.,
2010).
NGOs are generally perceived as ‘in
identity’ with the people while the donor is
perceived as an ‘external entity’. However,
from the point of view of the local commu-
nity the NGO is external too. Nowadays the
local community believes that the NGO is an
agent of the donor and demands a price for
compliance. Sampark faces this very issue
in its field operations. In the early days of
Sampark’s work in the villages in 1995, the
NGO formed a partnership with a Swiss
university for livelihoods research. Usually,
Sampark’s staff went to the villages in a bus
or autorickshaw (three wheeler), but one
day, six of them arrived in the village in a
jeep, with a Swiss academician. They had
two group discussions relating to employ-
ment, migration, health, and several other
issues. Then the Swiss consultant and all
except one of Sampark’s field staff left. The
people then surrounded this person and said
to her: ‘We answered all the questions of
the white man. What will we get in return?’
The attitude was: ‘Your donor wants you to
achieve something. We are helping you to
achieve it. Now compensate us for this.’
Sampark was formed with idealistic
objectives and believes in non-corrupt
operations. This has always meant that
government schemes are not routed through
Sampark. Officers granting benefits route
these through other local NGOs which
routinely give ‘cuts’ and ‘percentages’ to
them. As a result Sampark’s SHGs, which
have been in existence and have been oper-
ating well for over two to five years, don’t
get government support while new groups
which are formed overnight just to get gov-
ernment money, do. This makes the com-
munity very unhappy. Once a government
office sanctioned a loan to a farmers’ group
promoted by Sampark, but did not release
the first instalment as they expected 10 per
cent of the loan as bribe, which Sampark was
not willing to give. The farmers argued with
the Sampark staff: ‘You need to see the loan
as a chapatti5 in the hand of the officer. The
5 This is a type of Indian bread.

118 STATE OF INDIA’S LIVELIHOODS REPORT 2012
oficer wants a piece from it, and then we
can have the rest. If we don’t allow him to
take that piece, we lose the whole chapatti.
Is it wise to do that?” In this case, however,
Sampark managed to convince the farmers
to go as a group and demand that their loan
be released without a bribe.
These stories bring to us the realization
that people’s thinking patterns and nuanced
signiicance they assign to money, loans,
bribes, etc., can be quite different from
those of the NGOs. Ideals that are upheld by
NGOs need not be the same as those that are
upheld by the local community. Further, the
community is not one monolithic category
either—the interests of the various eco-
nomic strata, caste groups, genders and age
groups are all often quite disparate. These
need to be understood and negotiated when
any development intervention is designed.
The quality of these negotiations determines
the extent to which gaps between different
expectations are bridged.
The quality of partnership between the
NGO and the donor has a strong influence
on the quality of development. Moving
towards high quality partnerships requires
donors to be flexible and NGOs to be
administratively strong, transparent, and
accountable. Quality standards have to be
explicit, agreed upon and monitored for
adherence. Above all, the impact of the pro-
grammes on the poor needs to be monitored
and used as the final indicator for the quality
of development work and partnerships.
Working with the extreme poor to
enhance their livelihoods is another area
which needs long-term support. Sampark
started its work with women living in
extreme poverty, many of whom were
from among the Scheduled Castes (SCs). A
large number of these were devadasis, who
are dedicated to God by social custom and
are denied the right to marry. They suffer
human rights deprivations and are subjected
to sexual arrangements outside of marriage.
This means that there are several women in
the villages of north Karnataka, numbering
10 to 20 per village, in the age group of 30
to 60, who have had little support from their
male partners, and have the responsibility of
bringing up their children as well as caring
for their ageing parents. Their children often
drop out of school, partly because they can-
not cope with studies and partly to support
the mothers with housework and earning.
These children have had very little schooling
and are, thus, engaged in grazing animals or
head loading or other work which does not
provide either a decent work environment
or a sufficient income. They stand in urgent
need of vocational training to improve their
employability and livelihoods but cannot
afford training. In order to introduce a pro-
gramme which provided vocational training
suited to the needs of each young girl and
boy, along with a stipend that would enable
the family to forego the work the child was
employed in, Sampark talked about this need
in various forums, and a Swiss organization
came forward to join hands for the voca-
tional training. The training programme
was started, stabilized and found useful in
changing the lives and livelihoods of the
extreme poor. However, the programme was
fully grant based, so the Swiss organization
suggested that Sampark look for options to
expand operations and launch a vocational
training institute which could reach the
poor, but at the same time, charge fees to
others and to companies in which it places
these youth, so that the institute could oper-
ate at a viable scale and ultimately become
self-sustaining. Sampark evaluated this
possibility twice. Each time the finding has
been that if the poor have to be reached, they
have to be given not only free training but
also stipends to enable them to afford the
time to acquire skills. The market is not yet
sophisticated enough to derive profits from
those who can pay to cover the costs. The
potential for such an institute is still under
examination. A project which reaches out to
the poor must be followed at a scale which is
financially sustainable for the implementing
organization. It, thus, requires initial seed
funding from donors, whether national or
international.
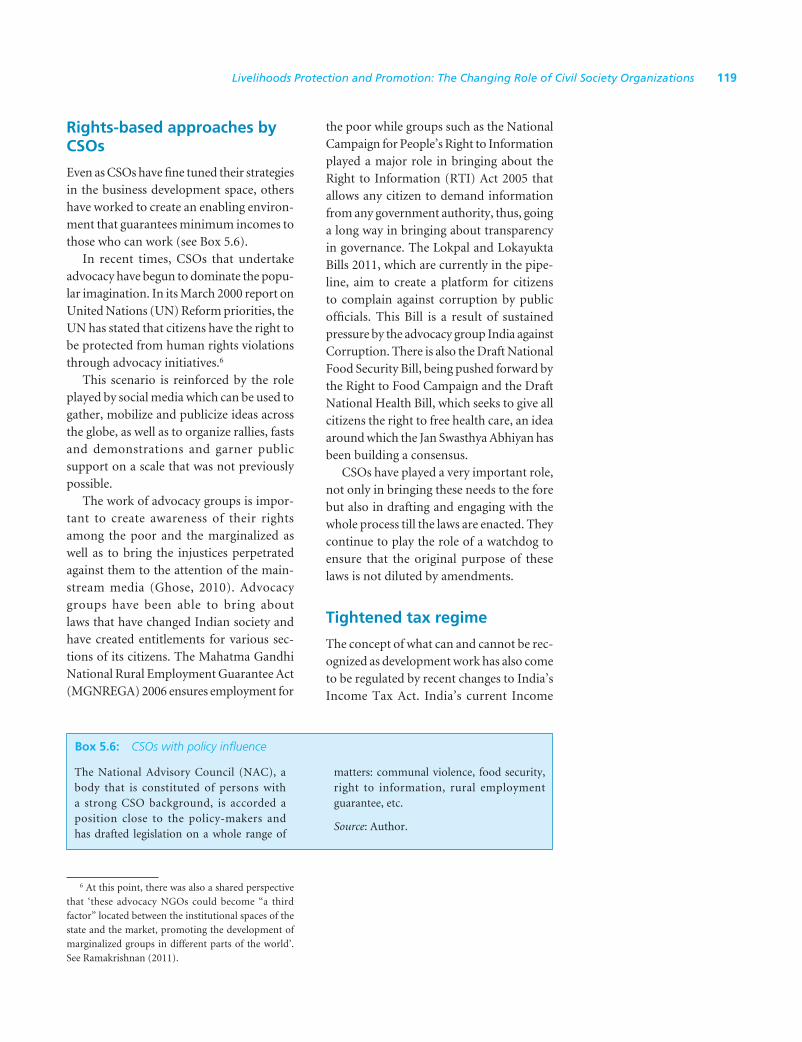
Livelihoods Protection and Promotion: The Changing Role of Civil Society Organizations 119
Rights-based approaches by CSOs
Even as CSOs have ine tuned their strategies
in the business development space, others
have worked to create an enabling environ-
ment that guarantees minimum incomes to
those who can work (see Box 5.6).
In recent times, CSOs that undertake
advocacy have begun to dominate the popu-
lar imagination. In its March 2000 report on
United Nations (UN) Reform priorities, the
UN has stated that citizens have the right to
be protected from human rights violations
through advocacy initiatives.6
This scenario is reinforced by the role
played by social media which can be used to
gather, mobilize and publicize ideas across
the globe, as well as to organize rallies, fasts
and demonstrations and garner public
support on a scale that was not previously
possible.
The work of advocacy groups is impor-
tant to create awareness of their rights
among the poor and the marginalized as
well as to bring the injustices perpetrated
against them to the attention of the main-
stream media (Ghose, 2010). Advocacy
groups have been able to bring about
laws that have changed Indian society and
have created entitlements for various sec-
tions of its citizens. The Mahatma Gandhi
National Rural Employment Guarantee Act
(MGNREGA) 2006 ensures employment for
the poor while groups such as the National
Campaign for People’s Right to Information
played a major role in bringing about the
Right to Information (RTI) Act 2005 that
allows any citizen to demand information
from any government authority, thus, going
a long way in bringing about transparency
in governance. The Lokpal and Lokayukta
Bills 2011, which are currently in the pipe-
line, aim to create a platform for citizens
to complain against corruption by public
oficials. This Bill is a result of sustained
pressure by the advocacy group India against
Corruption. There is also the Draft National
Food Security Bill, being pushed forward by
the Right to Food Campaign and the Draft
National Health Bill, which seeks to give all
citizens the right to free health care, an idea
around which the Jan Swasthya Abhiyan has
been building a consensus.
CSOs have played a very important role,
not only in bringing these needs to the fore
but also in drafting and engaging with the
whole process till the laws are enacted. They
continue to play the role of a watchdog to
ensure that the original purpose of these
laws is not diluted by amendments.
Tightened tax regime
The concept of what can and cannot be rec-
ognized as development work has also come
to be regulated by recent changes to India’s
Income Tax Act. India’s current Income
The National Advisory Council (NAC), a
body that is constituted of persons with
a strong CSO background, is accorded a
position close to the policy-makers and
has drafted legislation on a whole range of
matters: communal violence, food security,
right to information, rural employment
guarantee, etc.
Source: Author.
Box 5.6: CSOs with policy influence
6 At this point, there was also a shared perspective
that ‘these advocacy NGOs could become “a third
factor” located between the institutional spaces of the
state and the market, promoting the development of
marginalized groups in different parts of the world’.
See Ramakrishnan (2011).

120 STATE OF INDIA’S LIVELIHOODS REPORT 2012
Tax Act is quite stringent. Only those who
run speciic types of CSOs are eligible for
income tax exemptions. These provisions
are given in Box 5.7.
There is a marked degree of stringency
within these categories as well. For instance,
to be eligible for tax beneits under the head
of education, an organization needs to be
running a school or college. This is not
stated explicitly in the Act, but this is the
interpretation applied in implementation
of the Act. Conversely, if an organization
chooses to conduct literacy training pro-
grammes for adults, it does not qualify for
income tax exemptions. Therefore, adult
literacy programmes run for women in
SHGs do not qualify for income tax beneits
under this criteria, and neither do allied
programmes that support parents’ groups
to hold schools accountable for the quality
of education. As a consequence, a number of
necessary support programmes run by CSOs
are overlooked for exemptions. Another
instance of this would be that under the
category of health care, a CSO running a
hospital or distributing free medicines can
avail tax incentives but not if its area of focus
is planning sustainable health insurance
models for poor women.
In such cases, instead of providing incen-
tives the law can actually act as a deterrent
for organizations who may be interested
in taking on the role of encouraging the
autonomy of disadvantaged people.
The tax law, thus, reduces the scope of a
CSO’s activities. Currently, private–public–
partnerships (PPPs) are encouraged in the
ield of development work, indicating an
emerging trend towards corporatization.
Under Section 35AC of the Income Tax
Act, tax breaks are provided to companies
engaging in CSR programmes but not
to NGOs interested in building people’s
cooperatives. As a result, when NGOs run
cooperatives, they structure and empower
themselves such that they may eventually
become self-sustaining and independent of
external funding.
Thus, essentially, CSOs promoting the
activist model of disempowered groups
taking control of their movement out of
poverty is not encouraged by the prevailing
tax regime. In the present scenario, unless
an NGO runs a school or hospital alongside,
it cannot hope to become completely inde-
pendent of external funding. The present
practice is to allow a corporate to charge
any amount of fees for a hospital/university
Section 2(15) of the Income Tax Act, 1961
(‘Act’) deines ‘charitable purpose’ to include
the following: (i) Relief of the poor, (ii)
Education, (iii) Medical relief and (iv) the
advancement of any other object of general
public utility
An entity with a charitable object of the
above nature was eligible for exemption
from tax under Section 11 or alternatively
under Section 10(23C) of the Act. However,
it was seen that a number of entities who were
engaged in commercial activities were also
claiming exemption on the ground that such
activities were for the advancement of objects
of general public utility in terms of the fourth
limb of the deinition of ‘charitable purpose’.
Therefore, Section 2(15) was amended vide
Finance Act, 2008 by adding a proviso which
states that the ‘advancement of any other
object of general public utility’ shall not be a
charitable purpose if it involves the carrying
on of (a) any activity in the nature of trade,
commerce or business; or (b) any activity of
rendering any service in relation to any trade,
commerce or business; for a cess or fee or
any other consideration, irrespective of the
nature of use or application, or retention of
the income from such activity.
Source: Circular No. 11/2008, Government
of India Ministry of Finance Department
of Revenue Central Board of Direct Taxes
(Tax Policy and Legislation Division), 2008.
Available at http://incometaxindia.gov.in/
archive/CircularNo_23122008.pdf
Box 5.7: Restrictions on CSOs under the IT Act

Livelihoods Protection and Promotion: The Changing Role of Civil Society Organizations 121
that it runs in order to fund its CSR activi-
ties. To ensure that it continues getting tax
breaks, this model means that a company
is not incentivized to promote sustainable
empowerment for the people. Meanwhile,
there is little support to be had for NGOs
who are promoting rural livelihoods, help-
ing the poor stand on their own feet, linking
farmers groups to markets, etc.
However, it is important to note that this
was not always the case. Earlier, tax exemp-
tion was based on where an organization
spent their money (e.g., on various types of
development work) and not on how they
earned it (i.e., not on whether they are a
corporation or a cooperative).
The tightening tax regime reflects at
least two trends. The irst is the need for
the government to raise fiscal revenues,
which explains its withdrawal of a inancial
incentive.
The second is control of the sector. In
1954, the US amended its tax code to incor-
porate the ’third way’. In effect, the changes
meant that CSOs could provide charity
services to the poor but could not avail of
tax beneits if they tried to mobilize groups
to engage with political/economic systems
that create poverty.7
This shows the need for control, whereby
CSOs could engage with giving doles, but
a disincentive for engaging with politics.
By contrast, in India, while there could
be political backlash in case of criticism
of the government, there are no statutory
disincentives to enable people to have a
voice, influence and agency.
Rediscovering their roles
The chapter highlights that CSOs are spread
across all areas of livelihoods support and
promotion, from livelihoods protection
to promotion, and from working with
the extreme poor to those who can start
businesses. CSOs take different forms and
promote a variety of people’s organizations,
including cooperatives and producer com-
panies. Historically, CSOs have worked as
partners with the government, private sector
and national and international donors, while
also challenging them.
It is clear that CSOs have a non-profit
role to play in the development space in the
provision of goods and services in instances
where market conditions render the people
unwilling or unable to pay and private,
profit making organizations uninterested in
supplying (Datta, 1994). If the government
too is unable to provide the goods or services
required in such cases, then the CSO has
a significant role to play in their delivery.
Similarly, when the government is unable
to perceive critical needs, then CSOs raise a
voice on behalf of those excluded, triggering
sweeping changes by bringing in laws that
safeguard the livelihoods needs of large sec-
tions of the poor.
Often, CSOs enter areas which are
uncharted and break new ground. This
happens when they supply goods or services
that the private sector would find unprofit-
able to manufacture and distribute.8 Then,
when the concept is proven, the private
sector may step in and take the successfully
tested formulae to scale. This is evident in
the microfinance sector in India, where
CSOs broke ground, thus, changing the
mainstream enabling environment, as a
result of which microfinance has grown
7 In 1954, Democratic Senator Lyndon B.
Johnson of Texas pushed through an amendment
to the tax code that forbade tax-exempt non-profit
organizations from ‘political’ activity. Johnson’s law
entered the tax code to define a special new kind of
organization named for its place in the code, 501(c)
(3). Any organization that conducts voluntary work
(examples given include ‘testing for public safety,
literary or educational purposes, or for the preven-
tion of cruelty to children or animals’) is exempt
from taxation if it did ‘not participate in, or inter-
vene in (including the publication or distributing
of statements), any political campaign on behalf
of (or in opposition to) any candidate for public
office’. (Prashad, 2004)
8 This idea has been discussed by Paul Samuelson
in his work ‘The Pure Theory of Public Expenditure’.
See Samuelson (1954).

122 STATE OF INDIA’S LIVELIHOODS REPORT 2012
into a full-fledged industry today, with
large proit-making organizations reaching
out to the poor with commercial microi-
nance services. However, as we have seen
in the case of microinance, private sector
scale-up does not guarantee that the poor
get covered. Large sections of the poor
can remain excluded, requiring continued
presence of CSOs to reach the poorest and
most excluded.
This reiterates the need for CSOs in the
context of emerging programmes for the
extreme poor, which have spread across the
world in the past decade. The programmes
irst emerged in Bangladesh, with BRAC’s
Challenging Frontiers to Poverty Reduction
(CFPR) programme, followed by the Chars
Livelihoods Programme (CLP) and others.
These have now spread to several countries,
including India, where Bandhan and SKS
Microinance have replicated CFPR. These
programmes have elements of grants for
livelihoods protection, such as stipends for
food and fodder, and livelihoods promotion
for asset creation, such as purchase of cattle,
poultry, lease of agricultural land, and also
technical trainings as per requirement.
Even as these programmes demonstrate
the need for CSOs to continue to innovate,
they also point to the fact that excluded
groups need to be supported by national
governments. This critical issue is taken up
most effectively by the CSOs that engage in
building people’s voices and representing the
cause of the marginalized and excluded so
that oficial policies and programmes reach
them to prevent abject poverty and its debili-
tating impacts. The building up of a policy
environment that brings forth laws such
as the MGNREGA and the proposed Food
Security Bill, among others, is also perceived
as a coexisting with the neo-liberal paradigm
in which private proits are allowed to grow
unimpeded with the government being the
custodian of those who cannot beneit from
the mainstream. It absolves the private sec-
tor from responsibility for inclusion, which
can result in extreme violation of natural
resources, often paradoxically, in collusion
with the government, as seen in the coal
sector in India (Rajshekhar, 2012).9
CSOs in India have traditionally played
several roles, and all these roles continue
to exist. The policy space is shrinking, with
the government taking a very narrow view
of charitable activities, thus, excluding most
activities relating to organization building
and empowerment from those recognized
for tax exemptions. This has made the task of
CSOs more dificult because livelihoods pro-
motion which has been a domain of support
for the poor, enabling their self-reliance, is
now to be taxed. This is a retrograde step
that will deter genuine non-proit CSOs
from operating in this space and push them
towards becoming proit-oriented.
At the same time, the need for CSOs
to position themselves as watchdogs is
bigger than ever before, for both public
programmes such as the implementation
of MGNREGS and for private sector growth
and its impacts on both the poor as well as
the natural resources in a region. The need
for CSOs to engage with advocacy also
remains critical, so that the laws of the coun-
try are inclusive and provide a safety net to
those who remain excluded and whose liveli-
hoods need to be supported and promoted
through oficial and private grant funds.
References
Datta, Sankar. 1994. Management of Development
Organizations: Learning from Eight Cases; Anand,
Institute of Rural Management, Anand.
9 Although current rules prohibit private players
from acquiring mines to extract and sell coal in the
open market, they have been using an innovative
arrangement with state mining corporations to do
the same. Under this arrangement, the coal ministry
awards a mine to a state mining corporation (SMC).
The SMC, in turn, floats a joint venture (JV), in
which it holds a majority stake as sweat equity,
but makes no investment. A private player holds a
minority stake, but brings in the entire investment
and handles all operations. If the contract terms
are lopsided or if output is not monitored, such an
arrangement lends itself to abuse, as the Karnataka
Lokayukta exposed while investigating illegal iron-
ore mining in the state. (Rajshekhar, 2012)

Livelihoods Protection and Promotion: The Changing Role of Civil Society Organizations 123
Ghose, Bhaskar. 2009–2010. ‘Voluntary Service’,
Frontline, 26(26). Available at http://www.frontli-
neonnet.com/fl2626/stories/20100101262610400.
htm
———. 2010. ‘Give NGOs a chance’, Frontline, 27(13).
Retrieved from http://www.frontlineonnet.com/
fl2713/stories/20100702271309100.htm (as seen
on 23 August 2012).
Glasius, M. 2010. ‘Dissecting global civil society:
values, actors, organizational forms’, 50.50
inclusive democracy. Retrieved from http://
www.opendemocracy.net/5050/marlies-glasius/
dissecting-global-civil-society-values-actors-or-
ganizational-forms (as seen on 23 August 2012).
Mehta, A. and P. Singh. 2012. ‘The Story of Seva
Mandir—Experiments in Constructive Work and
Non-Violent Social Change’. Paper presented at
Roots to Fruits: Non-violence in Action, Conference
at Durban University of Technology, South Africa,
31 July to 2 August 2012. Organised by Gandhi
Development Trust and the International Centre
of Nonviolence.
Prashad, V. 2004. ‘Privatised aid and NGOs’, Frontline,
20(16). Retrieved from http://www.frontlineon-
net.com/fl2026/stories/20040102000806400.htm
(as seen on 23 August 2012).
Premchander, S. 2003. ‘NGOs and Local MFIs: How
to Increase Poverty Reduction through Women’s
Small and Micro-Enterprise’, Futures, 35: 361–378.
Pergamon: doi:10.1016/S0016-3287(02)00086-1
Premchander, S., V. Prameela, M. Chidambaranathan
and L. Jeyaseelan. 2009. ‘Multiple Meanings of
Money: How Women See Microfinance. New Delhi:
Sage Publications.
Professor Premchander and Premchander, S. 2010.
‘Profits for the Poor: Building Businesses Along
a Value Chain: Experiences from Asian Enterprise
Development Programmes’. Indian Institute of
Management, Ahemdabad.
Premchander, S., with K. S. Ravi, R. Gopalan, K.
Kalyanram, Faruk O Anjani and K. Sudin. 2010.
‘Different Stakeholder, Different Meaning: A
Southern Perspective of Development NGOs and
Quality’. Unpublished.
Samuelson, P. 1954. ‘The Pure Theory of Public
Expenditure’, Rev. of Econ. & Stats. 36: 387–389.
Rajshekhar, M. 2012. ‘JVs with state mining companies
help private partners reap profit’, The Economic
Times, 6 August. Retrieved from http://articles.
economictimes.indiatimes.com/2012-08-06/
news/33065575_1_coal-mine-pc-parakh-coal-
secretary (as seen on 23 August 2012).
Ramakrishnan, V. 2011. ‘Filling a Vacuum’, Frontline,
28(19). Retrieved from http://www.frontlineon-
net.com/fl2819/stories/20110923281901900.htm
(as seen on 23 August 2012).
Varshney, A. 2011. ‘State of civil Society’, The
Indian Express, 14 June. Retrieved from http://
www.indianexpress.com/news/state-of-civil-
society/803327/0 (as seen on 23 August 2012).


Introduction
This chapter on livelihoods looks at the
manner in which corporate social respon-
sibility (CSR) connects with livelihoods
and provides observations and insights on
how to create a best practice mechanism
to achieve livelihoods for the poor through
the practice of CSR. CSR is a large discipline
with many cross cutting and intercon-
nected themes and while it is useful to
deliberate on these, the focus through the
chapter has been retained on livelihoods
such that some dynamic conclusions can
be drawn. The author hopes that as the
scope of CSR and livelihoods evolves, in
subsequent status reports, a comprehensive
state of CSR and livelihoods will add mean-
ing and substance to the ongoing debate on
livelihoods creation.
Thus, this chapter does not profess to be
an all-inclusive reference on CSR, neither
does it purport to be an analytical piece
on the merits or otherwise of CSR as a
discipline. It rather looks to create a broad
understanding of the concept and suggests
further references for the reader to analyse
the gamut of activities which come under
the banner of corporate social responsibility.
The important position this chapter takes
is that of creating a commentary on the
state of CSR in relation to livelihoods and
providing some pointers for policy as well
as practice interventions. The introduction
of this chapter on CSR as part of the State
of India’s Livelihood (SOIL) 2012 edition is a
new and irst time addition to various other
livelihoods themes which look at the state of
poor, role of government and civil society
organizations, government schemes and
other instruments in place to create liveli-
hood opportunities, among others.
With the Indian economy growing at
over 9 per cent in the past few years, the role
of corporations in an emerging economy
to create wealth took new meaning with
the burgeoning of the new middle class
whose increasing consumption patterns
contributed to corporate profits, rise in
government tax earnings and creation of
a new breed of youth joining the informa-
tion technology and other service sectors.
This role got accentuated in an interesting
way, in a way meriting closer scrutiny and
magniication against the backdrop of a now
failing economy, growing at less than 6 per
cent per annum in recent times.
This poses an interesting question as to the
role of corporations in society, the relevance
of CSR, the steps corporations should take in
creating positive social and environmental
impact and the manner in which all of this
has a bearing on livelihoods of the poor. This
chapter then explores the fundamentals of
CSR, looks at debates and concern areas sur-
rounding the discipline, delves a bit deeper
into the manner in which corporations have
connected with society to alleviate poverty
and suffering through various routes and
models and inally attempts to connect the
role of corporations and CSR to livelihoods.
Role of Corporate Social Responsibility in Livelihoods
Promotion of Poor: A Commentary
UNMESH BRAHME
Chapter 6

126 STATE OF INDIA’S LIVELIHOODS REPORT 2012
Through the chapter, a few key cases
give the reader an insight into corporate
social responsibility initiatives. While the
chapter, overall looks at details across the
CSR spectrum in so far it’s relations to
livelihoods and the poor is concerned, it
also aims to highlight areas of strategic rel-
evance, both past and future, while aiming
to bring into focus, at all times, the ‘people,
policy, promoters and potential’ scenarios,
the cornerstone and guiding principles of
all SOIL reports.
Concepts
CSR and livelihoods is an emerging theme,
very recent in its introduction on the debate
which looks at how various players can help
alleviate poverty through creating jobs and/
or providing opportunities to masses at the
bottom of the economic pyramid to access
livelihood creation in both urban and rural
areas.
CSR has come a long way since its histori-
cal origins expressed in the various United
Nations (UN) summits. Starting with the
UN Rio Summit in 1982, which made the
concept of sustainable development popular
and arriving at its present state of being the
most sought after new discipline to be cre-
ated by corporations, CSR continues to be
both an enigma and coveted tool for social
development.
The concept of CSR in India is not new, the
term may be. The process though acclaimed
recently, has been followed since ancient
times albeit informally. Philosophers like
Kautilya from India and pre-Christian era
philosophers in the West preached and
promoted ethical principles while doing
business. The concept of helping the poor
and disadvantaged was cited in much of the
ancient literature. The idea was also sup-
ported by several religions where it has been
intertwined with religious laws. ‘Zakaat’,
followed by Muslims, is donation from one’s
earnings which is speciically given to the
poor and disadvantaged. Similarly Hindus
follow the principle of ‘Dhramada’ and Sikhs
the ‘Daashaant’. In the global context, the
recent history goes back to the seventeenth
century when in 1790s, England witnessed
the irst large scale consumer boycott over
the issue of slave harvested sugar which inally
forced importer to have free-labor sourcing.
(KPMG, 2008)
In India, in the pre independence era, the
businesses which pioneered industrialization
along with ighting for independence also
followed the idea. They put the idea into
action by setting up charitable foundations,
educational and health care institutions,
and trusts for community development. The
donations either monetary or otherwise were
sporadic activities of charity or philanthropy
that were taken out of personal savings which
neither belonged to the shareholders nor
did it constitute an integral part of business.
The term CSR itself came in to common use
in the early 1970s although it was seldom
abbreviated. By late 1990s, the concept was
fully recognized; people and institutions
across all sections of society started sup-
porting it. This can be corroborated by the
fact that while in 1977 less than half of the
Fortune 500 irms even mentioned CSR in
their annual reports, by the end of 1990,
approximately 90 percent Fortune 500 irms
embraced CSR as an essential element in
their organizational goals, and actively pro-
moted their CSR activities in annual reports
(KPMG, 2008).
According to ‘Altered Images: the 2001 State
of Corporate Responsibility in India Poll’, a
survey conducted by Tata Energy Research
Institute (TERI), the evolution of CSR in
India has followed a chronological evolution
of four thinking approaches:
Ethical Model (1930–1950): One signiicant
aspect of this model is the promotion of ‘trus-
teeship’ that was revived and reinterpreted by
Gandhiji. Under this notion the businesses
were motivated to manage their business entity
as a trust held in the interest of the community.
The idea prompted many family run businesses
to contribute towards socioeconomic devel-
opment. The efforts of Tata group directed
towards the well-being of the society are also
worth mentioning in this model.
Statist Model (1950–1970s): Under the
aegis of Jawahar Lal Nehru, this model came
into being in the post-independence era.
The era was driven by a mixed and socialist
Role of Corporate Social Responsibility in Livelihoods Promotion of Poor: A Commentary 127
kind of economy. The important feature of
this model was that the state ownership and
legal requirements decided the corporate
responsibilities.
Liberal Model (1970s–1990s): The model was
encapsulated by Milton Friedman. As per this
model, corporate responsibility is conined to
its economic bottom line. This implies that it
is suficient for business to obey the law and
generate wealth, which through taxation and
private charitable choices can be directed to
social ends.
Stakeholder Model (1990s–Present): The
model came into existence during 1990s as
a consequence of realization that with grow-
ing economic proits, businesses also have
certain societal roles to fulill. The model
expects companies to perform according
to ‘triple bottom line’ approach. The busi-
nesses are also focusing on accountability and
transparency through several mechanisms.
(KPMG, 2008)
CSR: Some deinitions (Thomas and Nowak, 2006)
Business for Social Responsibility (America’s
largest organization devoted to CSR)
Business decision-making linked to ethical
values, compliance with legal requirements,
and respect for people, communities, and the
environment around the world. (Aaronson
2003, p. 310)
Prince of Wales Business Leaders Forum
Open and transparent business practices that
are based on ethical values and respect for
employees, communities, and the environ-
ment. It is designed to deliver sustainable
value to society at large, as well as to share-
holders. (Aaronson 2003: 310)
European Commission
A concept whereby companies decide vol-
untarily to contribute to a better society
and a cleaner environment. (European
Commission 2001: 5)
Anonymous respondent to an Accountancy
Ireland survey
CSR is ‘doing the right thing even when
no-one is looking’.
(Anonymous, 2006a)
Peter Drucker was one of the irst to explicitly
address CSR, including public responsibility
as one of the eight key areas for business
objectives developed in his 1954 book, The
Practice of Management. While Drucker
believed that management’s irst responsibil-
ity to society involved making a proit, ‘he felt
it was also most important that management
consider the impact of every business policy
and action upon society’. (Joyner and Payne
2002: 302)
This positioning in a large way countered
the extremist economic positioning which
marked Friedman’s thesis.
The initial historical debates around
CSR surrounded the now famous Milton
Friedman’s quote that the ‘business of busi-
ness is business’ which insists that using
shareholder money to support social and
environmental issues is not and should not
be the role of corporations. The argument
centred around the fact that corporates
create proits, employment, pay taxes and
thus this can be the only way in which busi-
nesses should create social impact. There
were many supporters of this maxim at least
until such a point that activism by groups
such as Greenpeace, Sierra Club in the US
and more local home-grown movements in
India, against large dams and deforestation,
for example, brought to light the role of
corporations in stark contrast to Friedman’s
thesis of business as usual.
There was a growing realization that
businesses sought and pursued low input
operational costs, in order to maximize out-
put and proitability, in the process ignoring
the social, environmental, community and
geopolitical impact of their presence and
operations. In effect, the role of business as
deined by its very existence to create incre-
mental proits was to externalize all social
and environmental costs, a fact which many
observers have outlined as the key reason
for the emergence of CSR, which in some
way, tries to internalize these costs for the
beneit of society.
CSR and sustainability
The debate around climate change and the
North–South divide fostered by industrial

128 STATE OF INDIA’S LIVELIHOODS REPORT 2012
nations emitting more carbon dioxide per
capita compared to the developing world,
brought to fore further awareness about
CSR and ushered its transformation into
sustainability. It is worthwhile spending
some time here on usage of the terms CSR
and Sustainability. The traditional view
is that corporations practising corporate
philanthropy, i.e., donating monies to
charities or setting up foundations or
involving themselves in relief and rehabili-
tation work after a natural disaster, are the
ones that can be considered as practising
CSR. This view has been held constant for
a long time, and most of the companies
today do not stretch themselves beyond
this view to innovate the manner in which
they practise CSR.
Over the years, sustainability eventually
started replacing CSR in few of the cor-
porations who realized that the demands
on business are not only from customers
but also from a wider set of stakeholders,
including communities, regulators, govern-
ments, activists and other influencers. Led
by Western academic thinking as well as
more local home grown ideologies around
sustainability of business focused on ethical
principles, sustainability and CSR started to
merge into a uniform platform for activation
and positively diverted the attention of busi-
nesses to consider social and environmental
issues as a wider canvas on which businesses
had to operate.
Let’s now look at the definitions of some
of the integral components of CSR, thought
leadership and implementable activities (see
Table 6.1).
Recent happenings
CSR has evolved substantially since its early
days and many large and small corporations
are keen to develop systems and processes to
ensure they are able to create a well-defined
CSR and sustainability practice.
The well accepted definition of CSR is not
a common term; MNC’s prefers sustain-
able development or sustainable business
while several Indian companies talk about
responsible business or Triple P (People,
Planet, and Profit). It is important to note
that Indian companies and stakehold-
ers give a broader definition of CSR then
MNC and stakeholders. According to the
Indian Corporate: ‘Sustainable development
implies optimizing financial position while
not depleting social and environmental
aspects and CSR implies supporting issues
related to children, women and environ-
ment’. (Berad, 2011)
These corporate refer in its definition of CSR
to community development. In the context of
Western community, development is often
seen as charity. In the Indian context it is
seen as a large responsibility of a corporate,
not only by stakeholders but also by the local
Indian management. The background of
this is that stakeholders see the large western
companies as capitalist islands in a developing
country. This position gives them a certain
responsibility towards the community. Most
of the MNC’s leave room to their Indian
daughter company to develop initiatives
in this field; sometimes they have a special
fund. All kinds of initiatives are developed
by the interviewed Indian companies, many
times bottom up initiated by the employees.
(Ibid.)
Nearly all leading corporates in India are
involved in corporate social responsibility
(CSR) programmes in areas like education,
health, livelihood creation, skill development,
and empowerment of weaker sections of the
society. Notable efforts have come from the
Tata Group, Infosys, Bharti Enterprises, ITC
Welcome group, Indian Oil Corporation
among others.
The 2010 list of Forbes Asia’s ‘48 Heroes
of Philanthropy’ contains four Indians. The
2009 list also featured four Indians. India has
been named among the top ten Asian coun-
tries paying increasing importance towards
corporate social responsibility (CSR) disclo-
sure norms. India was ranked fourth in the
list, according to social enterprise CSR Asia’s
Asian Sustainability Ranking (ASR), released
in October 2009. (Ibid.)
Moreover, in 2009, the government made it
mandatory for all public sector oil compa-
nies to spend 2 per cent of their net profits

Role of Corporate Social Responsibility in Livelihoods Promotion of Poor: A Commentary 129
Table 6.1: CSR and its components—definitions
CSR Component Deinition
CSR Strategy Corporate framework to work on social and environmental issues.
Issue based work CSR interventions on speciic issues.
Core Competency
Connect
Corporate interventions aligned with business core competencies in areas where corporations have expertise in products and
services. For example: health, water, manufacturing, etc.
Materiality Measuring CSR such that there is a focus on impact and the same can be benchmarked and outcomes validated.
Beyond Philanthropy Not practising mere donations, but engaging the entire business in social change.
Catalytic philanthropy Using philanthropy as a strategic tool in collaboration with government, NGOs and other partners for achieving larger social
good.
Philanthrocapitalism Allocating personal wealth to charity, along the lines practiced by some billionaires such as Bill Gates, Warren Buffet and Azim
Premji.
Cause Related Marketing Utilizing brand sales to fund a cause by earmarking proceeds of sales, mostly through advertising and sponsored events.
Bottom of Pyramid
Markets
Corporations creating products and services which are affordable to the poor as well as marketing to under-served areas.
Shared Value A framework created by Mark Harper and Michael Porter of Harvard Business School which looks at companies creating shared
value opportunities by reconceiving products and markets, redeining productivity in the value chain, and enabling local cluster
development.
Green to Gold Utilizing environmental innovation and positioning as a competitive advantage for business sustainability. For example, GE
Ecoimagination, IBM Smart Planet, etc.
Bottom Billon Intervention to pull out the bottom billion of the world’s population out of poverty.
Cradle to Cradle Zero waste approach across production and consumption.
Risk Considering work on CSR as a risk mitigant such that positive relations are established with various stakeholders including
government and communities.
Patient Capital Utilizing private equity and venture capital investment approach with expectations of phased returns, creating both social and
commercial impact.
Social Venture Funding Utilizing an investment approach to social impact by supporting social enterprises who serve bottom of pyramid markets.
Sustainability While CSR has evolved over the years into sustainability, the term per se, indicates sustainable development ensuring not
only long term value addition by business to economy, but also ensuring suficient natural resources and good quality of life
availability to future generations.
Climate Change Work on both mitigation and adaptation strategies to reduce the impact on increasing global temperatures owing to rising
carbon dioxide and other greenhouse gas emissions.
Green Buildings Ensuring construction of real estate and infrastructure in accordance with environmental sound norms, mostly in relation to the
covenants promulgated by International Green Buildings Council.
Employee Engagement
and Volunteering
Ensuring employees participate in community work, thus helping create a more humane face for the corporation as also building
speciic values and ideals based thinking in employees.
Diversity Creating strategies for accepting variety of thoughts and actions within corporate decision making, including greater role for
women and other groups who have not beneitted from the process of empowerment.
Afirmative Action Creating strategies for employment of disenfranchised communities within corporations.
Supply Chain Working with vendors as well as enterprises in the supply chain to ensure socially and environmentally friendly sourcing and
disposal of post-consumer waste.
Minority Franchising Working with communities and enterprises in under-served areas by partnering with them to create corporate market expansion
and growth.
Responsible Sourcing Sourcing raw materials and commodities with minimal environmental and social impact.
Extended Product
Responsibility
Ensuring that products are disposed of in a manner which does not harm the environment and creating a mechanism for
recycling and re-use.
Ecological Footprint Ensuring corporations build strategies and framework for equitable natural resource utilization, including biodiversity
conservation and climate change.
Employee Welfare Creating policies, frameworks and procedures for employees to beneit from social welfare
Triple Bottom Line Running business to beneit People, Planet, Proits, as a combined approach, instead of merely looking at commercial bottomline.
Source: Author.
130 STATE OF INDIA’S LIVELIHOODS REPORT 2012
on corporate social responsibility. Besides
the private sector, the government is also
ensuring that the public sector companies
participate actively in CSR initiatives. The
Department of Public Enterprises (DPE) has
prepared guidelines for central public sector
enterprises to take up important corporate
social responsibility projects to be funded
by 2-5 per cent of the company’s net proits.
(Berad, 2011)
Today, CSR in India has gone beyond merely
charity and donations, and is approached
in a more organized fashion. It has become
an integral part of the corporate strategy.
Companies have CSR teams that devise spe-
ciic policies, strategies and goals for their CSR
programmes and set aside budgets to support
them. These programmes, in many cases, are
based on a clearly deined social philosophy
or are closely aligned with the companies’
business expertise. A handful corporate
houses are dedicated and practicing the CSR
as they are dictated by the very basis of their
existence. It is observed that many companies
are promoting their CSR activities and uses
it as a tool for Marketing. This denotes that
the companies are far from perfect as the
emphasis is not on social good but rather as
a promotion policy. (Ibid.)
Overall though, for the majority of the
corporations in India today, CSR contin-
ues to avoid deinition and action and we
see scattered charitable contributions with
not much form and substance. The con-
nect to livelihoods is in very nascent stages,
and many corporations do not perceive
CSR as going beyond the plain vanilla
charitable support to education, health
and environment as standalone issues, to
name a few. All industry associations, such
as Confederation of Indian Industry (CII),
Associated Chambers of Commerce and
Industry of India (ASSOCHAM), Bombay
Chamber of Commerce and Industries,
among others, have been advocating prac-
tice of CSR and sustainability for over two
decades now and this has generated a large
knowledge base and best practice scenarios
to ensure that CSR assumes a place of
importance in corporate boardrooms and
business workings.
India does not have a regulatory mecha-
nism in place to govern the manner in which
CSR in practiced. The only instrument
and incentive that has been available is the
income tax savings for corporations if they
donate funds to approved charities regis-
tered with competent government authori-
ties. This situation may soon change with the
new Companies Bill now in the process of
being tabled in the Parliament which makes
CSR more structured for corporations to
implement.
As per the Bill, every company with a
networth of ̀ 500 crores or more or turnover
of `1,000 crores or more or net proit of
`5 crores and above in a iscal will have to
form a CSR Committee, consisting of three
or more directors, of which at least one
director should be an independent director
(Press Trust of India, 2012).
Clause 135 of the Bill is still being debated
in terms of its compulsory mandate lan-
guage:
The clause seems to provide a security valve
for companies by stating.... That if a com-
pany fails to meet the desired standard, it
may get away by providing the reason. Such
a statement may, in practice, defeat the very
purpose of clause 135, the Parliamentary
Standing Committee on Finance said in its
report on Companies Bill 2011. In case, a
company fails to spend the 2% prescribed,
it would have to explain to the sharehold-
ers the reason for such a failure. (Business
Standard, 2012)
Also, to make sure that there are not
loose ends in the clause, the Committee
has suggested that ‘Clause 135(5) of the Bill
mandating Corporate Social Responsibility
(CSR) be modified by substituting the
words ‘shall make every endeavor to
ensure’ with the words “shall ensure”’
(Ibid.).
In his dissent note, Member of Parliament
Gurudas Kamat said:
It is a well-perpetuated fallacy that corporate
are run on the promoters’ or shareholders’

Role of Corporate Social Responsibility in Livelihoods Promotion of Poor: A Commentary 131
funds alone. The fact of the matter is that
most of the capital required by corporate both
long-term and medium-term is provided by
the banking/inancial system, which is oper-
ated out of the public funds. (Press Trust of
India, 2012b)
Therefore, he said if corporates are man-
dated to undertake CSR, it is very fair and
logical and a natural corollary of the nature
of capital invested in them and it need not
be over-stated that the corporate owe it
to the people and the society to pay them
back. This is the second time the Standing
Committee has given its observations on
the Companies Bill after opposition in
the Lok Sabha over substantial changes.
The Parliamentary Standing Committee
on Finance had given its observations on
the Bill irst time in August 2010. The new
Companies Bill, which was tabled in the
backdrop of the ̀ 14,000-crore Satyam fraud,
promises greater shareholder democracy and
stricter corporate governance norms. It is
expected to be presented in Parliament for
consideration passage in the forthcoming
monsoon session. (Ibid.)
A report says that Indian listed companies
had a combined net proit of ̀ 4,37,167 crore
last year. At 2 per cent, this will yield slightly
less than $2 billion a year as the CSR kitty of
India Inc. Such a large sum generated every
year can alleviate many of our social and envi-
ronmental issues. Companies must integrate
CSR in business models. The Netherlands
has been building infrastructure to support
sustainable projects like recapturing used
materials from the waste stream to recycle
them. Starbucks is using its ‘scale for good’
model to address the jobs crisis in the US
through the ‘Jobs for USA’ programme. With
more than 12,000 stores in the US, Starbucks
has the scale to make a signiicant impact on
jobs. (Goenka, 2012)
Three countries stand out in terms of CSR
regulations. The irst is Denmark, the irst
western country to mandate CSR informa-
tion in companies’ annual inancial reports.
The second is Indonesia that has taken a
global lead by passing a law requiring all
public companies to issue CSR reports and,
third, perhaps the biggest impetus for CSR
reporting, came in January 2010, when US’
Securities Exchange Commission asked all
US-based public companies to regularly
disclose climate-related risks in their annual
reports. (Goenka, 2012)
The jury is still divided amongst non-
governmental organizations (NGOs), gov-
ernments and corporations on whether CSR
should be made mandatory. The proposed
Companies Bill, while steering away from
making 2 per cent CSR spends of last three
years net proits mandatory, does insist on
a systematic CSR governance process and
asks corporations to mention their reasons
for not spending funds towards charitable
causes.
The Bill does make a mention of the
kind of social issues and causes corpora-
tions should support (though this list is
indicative), and this does provide suficient
scope for businesses to consider the cause
of livelihoods seriously.
Yet the present debate amongst corpo-
rations is whether the Bill is required at all
since according to them they are already
doing their best to contribute to society.
While this is true of large corporations and
well-known brands as the survey mentioned
in this chapter indicates, for majority of
the corporations CSR is still a new terrain,
something which the new Bill should help
address in terms of providing a systematic
activation framework.
Securities and Exchange Board of India (SEBI) guidelines
Another development on the CSR and sus-
tainability reporting front has been the SEBI
notiication mandating business responsi-
bility disclosure and reporting.
Through its board resolution passed on
November 24th, 2011, the Securities and
Exchange Board of India (SEBI), has
mandated listed companies to report on
Environmental, Social and Governance
(ESG) initiatives undertaken by them
through a Business Responsibility (BR)
report which would form part of a com-
pany’s annual reports/filings. As per
SEBI’s directive the business responsibility
reports should describe measures taken

132 STATE OF INDIA’S LIVELIHOODS REPORT 2012
by companies covering the key principles
of the ‘National Voluntary Guidelines
on Social, Environmental and Economic
Responsibilities of Business’ [refer to annex-
ure for complete guidelines] framed by the
Ministry of Corporate Affairs (MCA). This
SEBI directive will be immediately appli-
cable to the top 100 companies (by market
capitalization) and remaining companies will
come under its ambit in a phased manner.
(cKinetics, December 2011)
NVG-SEE is flexible in its reporting
approach. If companies are already following
an accepted sustainability reporting frame-
work then they may continue to do so (see
flow chart below). Such companies are not
required to publish a separate report, but can
map the 9 core principles of NVG to the dis-
closures made in their existing sustainability/
business responsibility reports. Companies
who have decided to adopt the NVG but
don’t have the necessary capacity to furnish
a full-fledged report can provide a state-
ment of commitment to adoption of NVG
to their stakeholders and furnish primary
details on activities undertaken in relation
to these guidelines. Companies who would
like to adopt NVG to the full extent can
furnish reports detailing their performance
on environmental, social and governance
factors based on the suggested framework.
(Preparedness of Indian Public Equities for
Business Sustainability. (Ibid.)
In July 2011, cKinetics conducted a stra-
tegic assessment of the current disclosure
levels of India’s leading companies across
multiple sectors to gauge the current
level of preparedness of India Inc on
Business Responsibility reporting. As part
of the work, the companies comprising
the Bombay Stock Exchange Sensex (BSE
30) were reviewed for their current disclo-
sure levels viz. the reporting framework
suggested by the NVG-SEE. These 30
companies account for INR 28,218 bil-
lion market capitalization(as on July 22,
2011) representing almost 42% of the total
market capitalization of companies listed
on the Bombay Stock Exchange. The study
calculated the disclosure score for all the 30
companies which constitute the BSE Sensex.
The NVG-SEE was used as the framework
to map the disclosure levels of Indian com-
panies. The NVG-SEE framework has 36
parameters reflecting nine key principles
related to responsible business practices.
(Preparedness of Indian Public Equities
for Business Sustainability (cKinetics,
December 2011)
The data was collated from publically
available information through company
annual reports, sustainability reports and
company websites. The disclosure score
varied across a wide range for these 30
companies, from 19 per cent to as high
as 78 per cent (see Table 6.2, Figures 6.1
and 6.2).
Table 6.2: Disclosure score follows a sectoral
trend
Industry
No. of
companies
Range of
disclosure score
Banking and finance 4 19%–28%
Automobile 5 31%–78%
Construction &
Engineering
2 33%
Metals 4 39%–50%
Electric Utilities 3 39%–61%
Oil & Gas 2 67%–72%
Heavy Electrical
Equipment
1 39%
IT Consulting &
Software
3 61%–78%
FMCG 2 72%–75%
Telecom Services 2 22%–25%
Realty 1 36%
Pharmaceuticals 1 31%
Source: cKinetics (2011).
Global standards: Global standards and what form it has been adapted into in the Indian context
International legal instruments and guidelines (KPMG, 2008):
In the recent past, certain indicators and
guidelines such as the SA8000, a social per-
formance standard based on International
Labour Organization (ILO) Conventions
have been developed. International agencies

Role of Corporate Social Responsibility in Livelihoods Promotion of Poor: A Commentary 133
such as the UN and the Organization for
Economic Co-operation and Development
have developed compacts, declarations,
guidelines, principles and other instru-
ments that set the tone for social norms for
organisations, though these are advisory for
organisations and not mandatory.
One of the UN Millennium Development
Goals (MDGs) calls for increased contribu-
tion of assistance from country states to help
alleviate poverty and hunger, and states in
turn are advising corporates to be more
aware of their impact on society. In order
to catalyse actions in support of the MDGs,
initiatives such as Global Compact are being
put in place to instrumentalize CSR across
all countries. As the world’s largest, global
corporate citizenship initiative by the UN,
the Global Compact, a voluntary initiative
is concerned with building the social legiti-
macy of business.
The UN global compact
The Global Compact is a framework for busi-
nesses that are committed to aligning their
Figure 6.1: Disclosure on government parameters
Frequency of board meetings
Statement on Ethics, Codes of Conduct
Processes in place to ensure conflicts of
interest are avoided
Mechanisms for shareholders/employees
to provide recommendations to the Board
Person responsible for oversight review is
independent from the executive
Mandate and composition of committees
Governance structure
0% 50% 100%
Source: cKinetics (2011).
Figure 6.2: Disclosure on environmental parameters
0% 40% 60% 80%20% 100%
Reconstruction of bio-diversity
Discharge of water and effuents
GHG emissions and efforts made to
reduce them
Total water consumed and % of water
recycled and reused
Renewable energy as % of total energy
consumption
Use of energy saving processes and the
total energy saved
Total energy consumed by the business
entity for its operations
% of recycled input materials
Source: cKinetics (2011).

134 STATE OF INDIA’S LIVELIHOODS REPORT 2012
business operations and strategies with ten
universally accepted principles that postulate
that companies should embrace, support
and enact, a set of core values in the areas of
human rights, labour standards, the environ-
ment, and anti-corruption. (KPMG, 2008)
The United Nations Global Compact is a
strategic policy initiative for businesses that
are committed to aligning their operations
and strategies with 10 universally accepted
principles in the areas of human rights,
labour, environment and anti-corruption
(www.unglobalcompact.org). The Global
Compact provides strategic advice and
practical tools for companies working with
CSR (Norwegian Embassy, 2012) (see Table
6.3).
Other India speciic CSR Guidelines
Several major CSR initiatives have been
launched in India since the mid-1990s. Among
the irst is the voluntary code of corporate gov-
ernance, ‘Desirable Corporate Governance: A
Code’, established in April 1998. This was
an initiative by the Confederation of Indian
Industry (CII), India’s largest industry and
business association. The FICCI - Aditya
Birla CSR Centre for Excellence in New
Delhi was launched on February 17, 2010. On
March 16, 2010 The Global Compact Local
Network India hosted ‘The Asia - Pacific
Regional Conclave’ in New Delhi on the topic
of ‘Enhancing Enterprise Value through the
Global Compact’ attracting over 500 delegates
from 21 countries, including dozens of top
leaders from Government, business and civil
society. The strong Government support to
this Conclave is in line with recent steps by
the Government of India to advance sustain-
ability in the country. National Foundation
for Corporate Governance (NFCG) is a body
which promotes CSR and raises the standards
of corporate governance practices in India.
The Ministry of Corporate Affairs has released
the second version of the National Voluntary
Guidelines on Social, Environmental and
Economic Responsibilities in line with the
Global Compact Network India. (Norwegian
Embassy, 2012)
Human rights
‘Human rights violations are a crucial
CSR concern for companies…. Amnesty
International is an independent organisa-
tion promoting human rights, and provides
updated information on the human rights
situations in individual countries’ (www.
amnestyinternational.org). The UN Global
Table 6.3: The 10 principles of the UN Global Compact
Human rights
Principle 1 Businesses should support and respect the protection of internationally proclaimed human
rights; and
Principle 2 make sure that they are not complicit in human rights abuses
Labor
Principle 3 Businesses should uphold the freedom of association and the effective recognition of the right to
collective bargaining;
Principle 4 the elimination of all forms of forced and compulsory labor;
Principle 5 the effective abolition of child labor; and
Principle 6 the elimination of discrimination in respect of employment and occupation
Environment
Principle 7 Businesses are asked to support a precautionary approach to environmental challenges;
Principle 8 undertake initiatives to promote greater environmental responsibility; and
Principle 9 encourage the development and diffusion of environmentally friendly technologiee
Anti-corruption
Principle 10 Businesses should work against corruption in all its forms, including extortion and bribery
Source: UN Global Compact Ofice (2007).

Role of Corporate Social Responsibility in Livelihoods Promotion of Poor: A Commentary 135
Compact also offers practical advice and pro-
grammes for ‘Business and Human Rights’
(www.unglobalcompact.org). Human rights
in India are covered under ‘The Protection of
Human Rights Act, 199’ (as amended by the
Protection of Human Rights (Amendment)
Act, 2006-No. 43 of 2006). This is handled by
the ‘National Human Rights Commission’
(see http://nhrc.nic.in) (Norwegian Embassy,
2012).
Child labour
India is a member of the International Labour
Organization, and has ratiied 40 of the ILO
conventions. However, India has not ratiied
the ILO core conventions relating to child
labour:
o 138 Minimum Age Convention (1973)
o 182 Elimination of the Worst Forms of
Child Labour (1999)
India’s domestic law on child labour, Child
Labour (Prohibition and Regulation) Act
(1986), bans employment of children in some
dangerous occupations, such as factories and
mines, and regulates the working conditions
in others. According to this law, anyone above
the age of 14 will be regarded as an adult
and will not be protected by the child labour
regulations. According to UNICEF, insuf-
icient attention has been given in India to
eliminate the worst forms of child labour. The
1986 child labour law does not cover children
in all sectors. India has the world’s highest
number of child labourers less than 14 years
of age. (Norwegian Embassy, 2012)
Labour laws and right of organization
India has altogether ratiied at least 333 labour
laws, but not the ILO core conventions related
to the right of Organization:
o 087 Freedom of Association and Protection
of the Right to Organize (1948)
o 098 Right to Organize and Collective
Bargaining (1949)
Furthermore, the way Indian labour laws
are supervised and implemented varies. The
country was in 1976 the irst country in the
South Asian region to enact legislation against
bonded labour, a form of slavery in which a
person pledges him/herself to work to pay
off a loan. Such contracts can be passed on
through generations. Contract labour, e.g.
workers that are not employed by the organi-
zation but hired for a speciic task or project,
is another complex area, and sub-contracting
is especially common in India. These contract
workers do not get the same protection and
beneits as the permanent workers, and many
work as contract labour for longer periods
of time. The fact that, as mentioned, 90% of
the Indian labour is in the informal sector,
they will have weak protection by labour
regulations. Although the ILO Conventions
related to forced labour have been ratiied,
certain forms of bonded labour still persists,
especially in the informal sector. Most Indian
states have enforced an act for minimum
wages for labourers in scheduled employ-
ment, as stipulated in the Minimum Wage
Act from 1948. However, the minimum wage
is often not paid. According to ILO, labour
under minimum wage is considered a form
of bonded labour, and they claim that there is
a staggering amount of bonded labourers in
India, particularly in the southern part. Many
of these are children.
In April 2010, the central government
raised the wage ceiling for coverage under
the national health insurance scheme for
industrial workers to ̀ 15,000 per month from
`10,000 (http://country.eiu.com). India has
enacted legislation that prohibits discrimi-
nation due to gender, religion, ethnicity or
caste. Again, the record of implementation
varies. ILO has observed some violations in
India’s implementation of the Discrimination
(Employment and Occupation) Convention,
(No 111, from 1958). This convention
obligates the state parties to hinder discrimi-
nation due to e.g. caste or gender, such as
different salary scales and labour conditions.
Legislation authority in India is shared
between the Central Government and the
State Governments. Some laws, such as those
regulating minimum wages, differ from state
to state. Likewise, the implementation and
supervision mechanisms may vary between
states. (CSR Country Brief, India 2012,
Innovation Norway, Norwegian Embassy)
The environment
India is the 8th largest investor in renew-
able energy in the world, and according to
Ernst & Young’s Renewable Energy Country
136 STATE OF INDIA’S LIVELIHOODS REPORT 2012
Attractiveness Indices, India is the 4th
most attractive country for investments in
renewable energy. The Indian government
is currently investing heavily in renewable
energy as well as in the implementation of
measures such as differential pricing, renew-
able purchase obligations and renewable
energy certificates tradable at the Indian
Energy exchange. The responsibility for
environmental governance is shared between
the corporations and the government. Many
Indian institutions have come up with vol-
untary guidelines on environmental friendly
practice. Among these is a partnership on
voluntary pollution control, developed by the
Indian Ministry of Environment and Forests
together with the industrial sector. Other ini-
tiatives include the Energy Eficient Initiative
by the Indian Chamber of Commerce, the
Indian Ecomark and the Clean Technology
initiative by the Confederation of Indian
Industry and others.
The main environmental law related to
production is The Environment (Protection)
Act (1986). This law gives the central govern-
ment the authority to protect and improve
environmental quality, as well as control and
reduce pollution from all sources. Another
development is the E-Waste Management &
Handling Rules which will come into effect
from May, 2012. They concern the producers’
liability for recycling and reducing e-waste,
meaning discarded electronic devices and
equipment, in the country. With regard to
the implementation of environmental laws,
a challenge has been lack of knowledge on
how to fulill the laws in practice. There are
also weaknesses in the implementation and
control mechanisms. The budget and infra-
structure for control has not been suficient,
although greatly improved over the last years.
(CSR Country Brief, India 2012, Innovation
Norway, Norwegian Embassy)
Transparency and corruption
In the Transparency International Corruption
Perceptions Index in 2010 India was ranked as
number 87 out of 178 countries. Lack of trans-
parency and excessive ‘red tape’ in the Indian
public sector is the main challenge. Decision
processes takes time, and inal decisions may
be delayed again and again. A 2005 study done
by Transparency International in India found
that more than 50 per cent of the people had
irsthand experience of paying bribe or ped-
dling influence to get a job done in a public
office. Taxes and bribes were also common
between state borders. 84 per cent of the com-
panies asked in a survey performed by Kroll
and Economist Intelligence Unit reported
increasing exposure to fraud. Corruption and
bribery, fraud related to vendors, suppliers or
procurement, as well as information theft, loss
or attack were reported as the most common
types of fraud. A major factor spurring this
growth is the high staff turnover. However,
the report also highlights that less than 50 per
cent of the respondents invested in anti-fraud
measures such as background screenings and
third party due diligence, although inside
jobs claimed 59 per cent of the incidences
of frauds (Kroll’s Annual Global Fraud
Report 2011/12). http://www.krollconsult-
ing.com/fraud-report/2011-12/press-only/.
(CSR Country Brief, India 2012, Innovation
Norway, Norwegian Embassy)
Global reporting initiative
Across the various global benchmarking
and reporting tools available, the Global
Reporting Initiative holds most sway and
this section describes key elements of this
framework, with comprehensive details in
annexures at the end of this chapter.
The Global Reporting Initiative (GRI) is
a non-profit organization that promotes
economic, environmental and social sus-
tainability. GRI provides all companies and
organizations with a comprehensive sustain-
ability reporting framework that is widely
used around the world.
GRI works towards a sustainable global
economy by providing organizational report-
ing guidance. A sustainable global economy
should combine long term profitability with
social justice and environmental care. This
means that, for organizations, sustainability
covers the key areas of economic, environ-
mental, social and governance performance.
GRI’s Sustainability Reporting Framework
enables all companies and organizations
to measure and report their sustainability
performance. By reporting transparently
and with accountability, organizations can
increase the trust that stakeholders have in
them, and in the global economy. GRI is a
network-based organization.

Role of Corporate Social Responsibility in Livelihoods Promotion of Poor: A Commentary 137
A global network of some 30,000 people,
many of them sustainability experts, con-
tributes to its work. GRI’s governance bodies
and Secretariat act as a hub, coordinating
the activity of its network partners. (www.
globalreporting.org)
Case studies2
Hindustan Unilever (HUL)
The company has made good progress in
meeting its sustainability goals and was one
of the irst entities in the country to launch
a women’s livelihood programme ‘Shakti’
that allowed women to gain successful
employment through acting as distribu-
tors and retailers for HUL’s brands in rural
India, helping the company to expand its
reach in under-served markets. HUL has
also recently announced an ambitious target
of sourcing all its agricultural commodities
and raw materials in a sustainable manner,
a step that will go a long way in creative
sustainable supply chains. (http://www.hul.
co.in/Images/Unilever-Sustainable-Living-
Plan-India-2011-Progress-Report_tcm114-
241468.pdf)
Pepsico India
The company has been working with farm-
ers to improve their yields for raw materials
and farm produce required for its food and
beverage operations and is also assisting
through water management and commu-
nity development interventions. (http://
pepsicoindia.co.in/Download/print-media/
Pepsi%20Citizenship%20Report-%20
2010-11.pdf)
ITC
ITC has been a pioneer in creating liveli-
hood opportunities for farmers whose
produce the company sources as raw mate-
rials. While the e-choupal model created
by the company provides farmers with an
information technology enabled access to
pricing of farm produce and commodities
in nearby markets, ITC also has created a
sourcing model allowing it to purchase farm
produce directly from farmers thus giving
them a better price realization. (http://www.
itcportal.com/sustainability/sustainability-
report-2011/index.aspx)
Yuva parivartan
Yuva Parivartan is a NGO based in Mumbai,
which over the years has created a move-
ment with the vision to create opportunities
for school dropouts and deprived youth
to lead productive and socially useful lives.
It focuses on four main areas: Vocational
Training, Community Engagement, Industry
Partnership and Placement Cell. Over the
past 13 years, the organization has expanded
to over 79 centres all over India. Yuva
Parivartan has been successful in developing
a working, integrated and replicable model in
empowering deprived dropouts and youth to
earn a livelihood and become useful citizens.
They are now in the process of reaching
400,000 youth with a scale up plan of impact-
ing 1 million youth in the next few years.
Interestingly, the work of Yuva Parivartan is
supported by a number of corporations, thus
creating a unique example and model in cre-
ating jobs for the masses through corporate
social responsibility interventions (http://
yuvaparivartan.org/index.aspx).
Youth4jobs
Youth4jobs is a useful model to evaluate
from the livelihoods perspective since it
focuses on underprivileged youth such as
Scheduled Castes (SCs)/Scheduled Tribes
(STs), PwDs (Persons with Disability), rural,
tribal youth and girls and attempts to inte-
grate them into the mainstream workforce
through skilling and job readiness training.
This enables the youth to make the most
of the work opportunities arising from the
new economy by enhancing their skill sets,
thereby making them employable. It empha-
sizes values and life-long learning, leading
2 Note: Large format case studies are beyond the
scope of this chapter. Thus, we provide here a few
examples with links to relevant sustainability reports.
As mentioned earlier, while many sustainability reports
are available, the link to livelihoods for the poor can be
seen in a negligible number of cases.

138 STATE OF INDIA’S LIVELIHOODS REPORT 2012
to sustainability. (http://www.youth4jobs.
org/index.php)
Future of CSR in India
Status of CSR Today
A recent KPMG report (KPMG, 2011)
revealed the following:
l Only 31 out of the N100 companies
considered for the survey are publicly
reporting on their corporate responsibil-
ity performance of which only 25 percent
have systems to measure, monitor and
report on such issues.
l Fifty two per cent of the reports are
externally assured, out of which 62 per
cent prefer accountancy ûrms for assur-
ance.
l Enhancing brand image and reputation
and ethical considerations emerge as
top drivers for companies to report on
corporate responsibility and cost saving
appears last on the agenda of reporters.
l The reports are encyclopaedic in nature
and do not touch upon the business case
for sustainability.
l Across the reports, the linkage between
stakeholder engagement, materiality and
business strategy has not been clearly
established (see Figures 6.3, 6.4, 6.5 and
6.6).
In a related report by cKinetics assesss-
ing the prepardness of companies in their
compliance with the SEBI guidelines for business responsibility reporting, the results
were slightly better.
The livelihoods dimension
These survey findings are instructive in
many ways in that they indicate the low
levels of CSR strategy formulation within
corporations and a still lower level of work-
ing on issues affecting the community. It is
important to note that the focus on liveli-
hoods is non-existent and there would be
much that corporations will need to do in
order to bring livelihoods on their agenda.
Even in areas such as supply chain, where
Figure 6.3: Trends in corporate responsibility
reporting in India
of the companies
report on their
CR performance
of the reporters
use GRI guidelines
for CR reporting
Strengthened
reputation and
brand and
ethical
considerations
emerge as
top drivers for
companies to
report on
corporate
responsibility
31% 71%
Source: KPMG (2011).
Figure 6.4: Corporate responsibility strategy
and approach
of top 100
companies
have a CR
strategy in place
of the reporters
have systems
for managing,
measuring and
reporting on CR
issues
of the reporters
link CR into
governance
structures
16% 68% 42%
Source: KPMG (2011).
Figure 6.5: Corporate responsibility—topics
and issues
of the
companies
report the
business
risk of climate
change
of the
companies
disclose their
Green House
Gases (GHG)
emissions
of the
companies
identify and
disclose the
business risk
of CR issues
in their
supply chain
23%
52% 62%
21% 13%
of the reports
are externally
assured
Corporate responsibility report assurance
is the
share of
accountancy
firms as
assurance
providers
to CR reports
Oil and gas,
construction
and building
material and
IT companies
lead with the
highest number
of assured reports
Source: KPMG (2011).

Role of Corporate Social Responsibility in Livelihoods Promotion of Poor: A Commentary 139
there is a potential to create jobs both
for disenfranchised communities as well
as small and medium enterprises (which
employ a large number of people in the
country), the data does not show a posi-
tive trend in terms of corporations whole
heartedly embracing the job creation and/or
employment/entrepreneurship generation
potential across the supply chain.
While there has been a positive trend
to capture data relating to greenhouse gas
emissions and report the same with a view
to reduce these emissions over a period
of time, most corporations in the country
today work more on mitigation strategies
than on adaptation interventions. While the
former allows businesses to look at renew-
able energy and technological innovations
to optimize their energy footprint, the
latter (adaptation) is more relevant from
the standpoint of working with affected
groups and communities who are at the
receiving end of varying climatic patterns,
thus, affecting their agricultural yield as well
as income generating opportunities. Very
few corporations have been able to grapple
with this reality with the result that one sees
limited interventions in this space. Though,
a few interventions by Unilever, Nestle and
Pepsi do buck the trend.
CSR: Integrating with livelihoods
CSR as it stands today in India needs to
take a larger leap to connect with issues
surrounding livelihoods of the poor. As we
have noted in this chapter, most corporate
initiatives are one-off and support more
traditional issues and causes such as edu-
cation and health. We have though some
unique exceptions here where organizations
such as the Azim Premji Foundation and
Bharti Foundation have been created out of
personal and corporate wealth with a view
to enhancing the quality and outcomes of
education at primary and secondary levels.
It would be safe to assume here that such
Figure 6.6: Sector-wise break up of N100 reporters
3%
6%
6%
13%
13%
13%
3%3%
10%
7%
16%
7%
Automotive
FMCG
Emgineering and
other manufacturing
Other Services
Chemical and synthetics
Food and Beverages
Mining and metal
Pharmaceuticals
Construction and
building materials
IT Services
Oil and Gas
Utilites
Source: KPMG (2011).

140 STATE OF INDIA’S LIVELIHOODS REPORT 2012
initiatives, in time, will lead to better quality
of students seeking higher education and
hence mainstream employment.
The success of such initiatives is also
dependent on the extent to which they
target communities at the bottom of the
economic pyramid and become instru-
mental in working with the government
on ongoing grassroots initiatives through
a public-private partnership model. The
real issue, as readers will notice through
the chapters in this report, is to do with the
large number of educated and uneducated
youth who are unemployed and have not
been mainstreamed into regular jobs despite
good economic growth. The gravity of the
situation is also manifested in the fact that
while there is a large demand from corpo-
rations for utilization of land and other
natural resources, their CSR policies have
not adequately addressed mechanisms to
create equitable access to natural resources
and establish livelihood strategies which
beneits local communities.
Thus, CSR is still at odds when it comes
to extractive industries and issues of local
displacement and rehabilitation, with gov-
ernments more often than not supporting
industry over the masses. Agitations over
land acquisition and the time taken to
kick start power and other infrastructural
projects are but a case in point.
Livelihoods and supply chains
These scenarios are a direct resultant of the
lack of awareness on part of corporations to
look at backward and forward linkages of
their business to procurement supply chains
and post consumption disposal chains. In
both areas, there are possibilities to cre-
ate local enterprises which feed into larger
corporate sourcing channels, thus, creating
a useful route for the emergence of small
and medium enterprises that would create
more local jobs.
Inclusive growth
As is by now well known, despite the
GDP growth over the years, the addition
of more poor to the country’s population
continues and their earning ability, though
bolstered in some cases by the introduction
of MGNREGA in some areas, continues to
hover around US$2 a day. Thus, with lim-
ited purchasing power, most poor urban
and rural communities are still a part of the
consumption economy, whose products and
services they can ill-afford. Here, of course,
there is an additional debate around how
poverty is not merely earning capacity or
lack of it and low income, but also avail-
ability of and access to sound health, educa-
tion, nutrition and the like, scenarios which
we take for granted for those of us who are
economically better off.
CSR then, needs to take cognizance of
these fundamental cracks in the economy
and correct its strategic intent through
looking at a combination of ethical sales and
inclusive growth, which can create the nec-
essary livelihood opportunities. Charitable
donations and establishment of socially
mandated foundations indeed have their
place in creating positive change and impact,
the need of the hour is for the multifarious
such foundations and NGOs to merge their
intent and seek a collaborative platform for
creating inclusive growth in partnership
with the government.
Climate change
The entire area of climate change, energy
eficiency and clean tech is an additional
factor which corporations need to consider
while they formulate their CSR strategies.
These verticals have the imminent potential
to create an innovation economy and new
jobs based on environmentally driven skills
and expertise. Since such initiatives are
also based on utilizing renewable energy
resources, there is sound logic in the argu-
ment that local communities who reside in
resource rich areas will beneit through the
creation of local jobs.
Climate change and the impact it has on
local weather patterns also creates an inter-
esting dimension for livelihoods. As more
and more people get affected by inclement
weather, falling agricultural yields and
lack of employability opportunities, the

Role of Corporate Social Responsibility in Livelihoods Promotion of Poor: A Commentary 141
resultant migration to urban areas creates
further stress on an already taxed infra-
structure minimizing available livelihood
opportunities. In rural areas and inaccessible
terrains which are the repository of natural
resources, an interesting equation develops
where local communities while facing the
after effects of climate change also have
limited access to natural resources which
are more often than not parcelled out for
commercial gains.
Impact
CSR while approaching work with com-
munities with an increasing frequency has
not created holistic impact on any issue.
This is primarily because corporations
support small projects which are not con-
nected to addressing social and environ-
ment issues at the level of causation and
enduring solutions. There is also no trend
and practice which allows corporations to
work together to address a particular cause
or social issue.
Reporting
While impact reporting using Global
Reporting Initiative (GRI) indicators has
caught on as a globally discernible trend,
very few businesses practice reporting and
assurance, keeping issue impact in mind.
Livelihoods does not feature here as a dis-
tinct measurable. It would be important
here to state that the Global Reporting
Framework provides ample opportunities
for corporations to create strategies which
look at long term CSR impact across eco-
nomic, environmental, labour practices,
human rights, societal and product respon-
sibility standards.
Extractive industries
Concerns remain on how best mining,
power and infrastructure companies are
addressing social and environmental issues
for communities affected by mining opera-
tions. While the government has made
it mandatory to spend a large portion of
mining investments in a particular area on
community welfare and rehabilitation, one
does not see much evidence of the manner in
which corporations are having a systematic
plan to address this issue.
Displacement
The story is no different when it comes to
displacement of communities affected by
large industrial projects with the spoils of
the project rarely being shared with local
communities. It is useful to note here the
potential which exists for corporations to
train local labour into higher skill based
activities as required by their speciic indus-
try, through appropriate vocational and
other training interventions. Such thinking
rarely exists with the displaced population
left to be taken care of by some government
scheme or the other. In extreme cases, dis-
placed population has taken to the streets
and violent confrontations with corpora-
tions and industries have been witnessed in
many cases. Some observers have very rightly
attributed the rise of left-wing extremism to
the gradual build-up of displaced and dis-
enfranchised communities.
Agriculture, non-farm and artisanal interventions
While this thematic area deals directly with
the employability of a large number of peo-
ple in rural India, it’s reflection on the CSR
agenda is very poor. Corporations rarely look
at supporting projects in natural resource
management, agricultural yield enhance-
ment, off-farm supply chain improvements
and the like. These are considered as alien
areas and the ability to understand the
technicalities do not exist within corporate
social responsibility teams and departments.
Thus, resulting in a situation where the most
potent of livelihood spaces is not occupied
by CSR interventions.
Microinance
The historical success of microfinance was
touted as a unique way in which corporates
in the form of banks and financial institu-
tions could arrest poverty at the bottom of
the pyramid as well as create profits. The

142 STATE OF INDIA’S LIVELIHOODS REPORT 2012
striking of the right balance though between
social impact and proits has not been easy
for the sector, with the government being
compelled to clamp regulatory restrictions
in the wake of run-away proiteering by
many microinance institutions. Also, to a
large extent microinance did not progress
beyond the narrow conines of consumption
lending and in the process lost the oppor-
tunity to create livelihood inance practices.
This situation seems to be changing off late
with the growth in the number of producer
companies and the accompanying RBI
directive which asks banks to enhance their
agricultural lending activities.
The emerging and new intervention of
value chain finance will help microinance
let go of its legacy haplessness and help
connect rural producers to corporate buyers
and consumers through creating afford-
able inance at various points across the
agricultural, artisanal and other off-farm
supply chain.
Private investment
One of the reasons for the debacle faced by
microinance has been the runaway private
equity/venture capital investment in some
microinance institutions, leading to expec-
tations of high valuations, excess return on
investment (ROI) on the back of what has
been a very weak rural poor consumer based
with almost constant low purchasing power
parity over the years. The gradual growth
of private investment in social enterprises
is a good hybrid model to achieve social
and commercial impact, yet it will need to
be wary of the microinance experience. It
will also need to look at creating grassroots
employment in the enterprises irst before
tackling market penetration with new prod-
ucts and services. Only then, would they be
able to achieve inclusive growth and connect
with livelihoods opportunity creation.
Role of NGOs
Most CSR funding is routed through local
NGOs basis their project proposals to work
on speciic issues and causes. By this very
definition, NGOs follow a single-track
approach of treating corporations as donor
agencies over and above other founda-
tions and entities from whom they seek
funds. While this is an essential survival
mechanism, in the process, NGOs fail to
realize the important value addition which
corporations can bring to the table in terms
of management intervention, distribution,
logistics and related skills, for example, and
the ability to create inclusive supply chains.
Thus, the ability to create a connect with
livelihoods of the poor is lost in the design
process itself.
Collaboration with Government policy-making
As Ruchir Sharma, in his seminal work
‘Breakout Nations’, points out: India has
been a singular case of a mixed economy
where welfare state politics overrides any
other strategy to reduce poverty. The
government continues to create wealth
for the treasury through industrial and
corporate taxation and it continues to
create trickle down schemes which never
reach the masses, thus requiring incre-
mentally large sums of money every year to
plug a widening budgetary deicit. Where
corporate social responsibility fails in this
scheme of things is its inability to relate
to government policy making and play
an active role in implementing these poli-
cies on ground. The recent creation of the
Bharat Livelihoods Fund aimed at remov-
ing livelihood disparities in poor states
through corporate participation could
perhaps be a way forward in resolving the
conundrum. Though earlier such attempts,
for example, the creation of the National
Skill Development Corporation (NSDC),
has met with mixed success owing to its
‘larger than life’ focus on scale than quality
or substance.
Conlict areas
An important area which corporations and
CSR have steered clear of is that of peace,
security and geopolitical risk. Clearly these
are fundamental to understanding depriva-
tion and lack of livelihoods at the grassroots

Role of Corporate Social Responsibility in Livelihoods Promotion of Poor: A Commentary 143
and it’s only an open mind to understand
such issue that will help corporations prac-
tise good CSR in relation to livelihoods.
Recommendations: Mechanisms for connecting CSR to livelihoods and poor
This chapter has, thus, far outlined the
cracks in the CSR wall in terms of deini-
tion, impact and connectivity with key issues
pertaining to livelihoods. This concluding
section looks at offering recommendations
for CSR to reclaim the livelihoods space, in
the process arguing that their ability to do
so will also help businesses become more
inclusive and help their work on other
social issues such as education, health and
environment.
Philanthropy
Corporations can continue to practise
simple philanthropy, but if they are more
tactical and strategic in their approach,
they can pool resources together with other
corporations to create scale and impact. The
issues of employability through skilling,
mainstream jobs, training financing can
then be easily addressed.
Climate change
As mentioned elsewhere in this chapter,
both adaptation and mitigation interven-
tions provide a range of opportunities to cre-
ate jobs as well as entrepreneurial ventures
and there is an imminent opportunity for
corporations to deploy their CSR budgets
in a systematic way to arrest the impact of
climate change on livelihoods.
Employability, skills and training
Clearly, the country has seen many corpo-
rate initiatives in education at all levels from
early childhood education to primary educa-
tion to higher education. Yet these are not
located on a spectrum of assessing oppor-
tunity for creating jobs cross the life cycle of
students. Very few corporations have taken
the cause of livelihoods seriously and NGOs
working on these issues are indeed lesser in
number than those working on other issues
(refer to annexures).
Natural resource management
Creating an equitable natural resource uti-
lization policy as part of the CSR ensemble
of any corporation is an important step
that corporations would need to take in
the near future. We already have some
examples such as that of Unilever (please
see annexures for case example) who have
committed to sustainable sourcing of all
their agri-commodities and raw materials.
Initiatives such as these will not only enable
corporations to better manage their natural
resource utilization footprint, including that
related to water, but also help in creating
new jobs across the sourcing chain. It is not
enough merely to state that a corporation
has consumed less water by virtue of putting
back more water into the environment,
either through savings, community water
harvesting or replenishing the ground water
table. As long as these initiatives are related
to creation of local water based thriving
economy around agricultural opportuni-
ties, there would not be any livelihoods
created.
Venture philanthropy
This is a new ield combining the best of
venture management and philanthropic
approaches allowing not-for-profits and
social enterprises to develop their organiza-
tional capacities and eficiencies to achieve
large scale impact. In the area of livelihoods,
this model has a signiicant place in that it
will allow corporations to fund organiza-
tions keen to expand across the country with
positive employability initiatives and would
also help organizations convert into suc-
cessful social enterprises with commercially
sustainable approaches (see Figure 6.7).
Social enterprises and social venture funding
Corporations have demonstrated limited
engagement thus far in supporting social
enterprises in their initial pre-start up stages.

144 STATE OF INDIA’S LIVELIHOODS REPORT 2012
It is this inflection point in the life of a social
enterprise which requires greatest support
to help them create a demonstration model
of an idea, product or process which they
could scale to benefit communities at the
bottom of the pyramid. Such grant and
or low cost debt support is not reflected
in today’s CSR initiatives even by banks
and financial institutions. It is a big area
for improvement and one that can sup-
port livelihood mechanisms by ensuring
skill based training for employment with
the social enterprise and helping the social
enterprise itself reach out to under-served
masses. (Please note by social enterprise, we
mean a commercial for-profit organization
which services needs of communities at the
bottom of the pyramid.)
Supply chain
Inclusive supply chains as an intervention
has not caught the fancy of most corpora-
tions despite its potential to create jobs
across small and medium enterprises which
provide raw materials, goods and services to
large industries. Similarly, as this chapter
states elsewhere in the document, the scope
to create post-consumer waste management
Figure 6.7: The venture philanthropy model
Financial Capital
Advice and Engagement• Strategy
• Marketing
• Coaching
• Networks• HR advice
AdditionalFunding
Venture Philanthropy multiplies the impact of financial capital throughadvisory services and high engagement over time
VP involvementencouroges otherfunders
Increased
SocialImpact
Other Funders
Social PurposeOrganization
Venture
Philanthropy
Fund
Source: Building a community of venture philanthropists across Asia, Asian Venture Philanthropy Network.
Primarydriver isto createsocial value
Primarydriver isto create
financial value
Organizations can create ‘blended’ social and financial value
SOCIAL PURPOSE ORGANIZATIONS (SPO’s)
Charities Revenue Generating Social EnterprisesSociallyDriven
Business
TraditionalBusiness
Impact Only Impact First Finance First
Venture Philanthropy
Social Venturing
Grants only;no trading
Tradingrevenue and
grants
Potentiallysustainable
>75%tradingrevenue
Breakeven allincome from
trading
Profitablesurplus
relnvested
Profitdistributing
sociallydriven
CSR company Companyallocating
percentage tocharity
Mainstreammarket
company
Source: European Venture Philanthropy Association (2010).

Role of Corporate Social Responsibility in Livelihoods Promotion of Poor: A Commentary 145
system also has the potential to create local
enterprises and jobs, which very few corpo-
rations have built into their strategy.
Diversity
An emerging area of growth and this time
in connection with human resource man-
agement has been the creation of diversity
and afirmative action task forces in few
corporations with the express purposed of
creating systems and processes to hire, train
and employ gainfully youth from economi-
cally backward communities or those with
disabilities and differentially abled lives.
Diversity programming and interventions
have a large role to play in ensuring inclusive
business and its factoring into CSR budgets
is an urgent necessity.
Volunteering
Corporations pride in their employee vol-
unteering abilities, but more often than
not end up visiting grassroots communi-
ties occasionally more from a standpoint
of gaining some insights, rarely converting
this experience into long term association or
binding commitment to bring about change.
In terms of livelihoods, youth mentoring
programmes, teaching interpersonal skills,
industry exposure visits, allow offer a useful
window for corporations and CSR to make
visible impact.
Relief and rehabilitation
Another important mechanism for corpora-
tions to create livelihood opportunities is to
work on a long duration project in the wake
of any natural disaster relief and rehabilita-
tion operations they undertake. Instead of
merely donating money, CSR indeed has
the potential to look at long term livelihood
creation plans for communities in distress.
Conclusion
This chapter on CSR and livelihoods promo-
tion of the poor does paint a bleak picture in
terms of prevailing trends and the manner in
which corporations are addressing issues of
inclusivity and livelihoods. The positioning
is purposeful and the discipline itself needs
to emerge out of a growing attachment to
fads, jargon and the new found concept of
materiality to mean and create real impact
in the lives of the poor.
There has been a disturbing tendency
to treat the poor as mere consumers, either
of government doles or that of business
products, services and brands. There can
indeed be no change on the social and envi-
ronmental landscape as long as corporations
understand that creating consumer demand
and proits will need to go hand in hand in
establishing covenants that ensure a fair
chance for livelihoods to all.
ANNexuRe 1 Corporate social responsibility policy as enshrined in
the revised Companies Act 2009/2011
Clause 135
135. (1) Every company having net worth of rupees ive hundred crore or more, or turnover
of rupees one thousand crore or more or a net proit of rupees ive crore or more during
any inancial year shall constitute a Corporate Social Responsibility Committee of the Board
consisting of three or more directors, out of which at least one director shall be an independ-
ent director.
(2) The Board’s report under sub-section (3) of section 134 shall disclose the composition of
the Corporate Social Responsibility Committee.
(3) The Corporate Social Responsibility Committee shall:
(a) formulate and recommend to the Board, a Corporate Social Responsibility Policy which
shall indicate the activities to be undertaken by the company as speciied in Schedule VII;
146 STATE OF INDIA’S LIVELIHOODS REPORT 2012
(b) recommend the amount of expenditure to be incurred on the activities referred to in
clause (a); and
(c) monitor the Corporate Social Responsibility Policy of the company from time to
time.
The Board of every company referred to in sub-section (1) shall:
(a) after taking into account the recommendations made by the Corporate Social
Responsibility Committee, approve the Corporate Social Responsibility Policy for the company
and disclose contents of such Policy in its report and also place it on the company’s website,
if any, in such manner as may be prescribed; and
(b) ensure that the activities as are included in Corporate Social Responsibility Policy of
the company are undertaken by the company.
The Board of every company referred to in sub-section (1), shall make every endeavour to
ensure that the company spends, in every inancial year, at least two per cent of the average
net proits of the company made during the three immediately preceding inancial years, in
pursuance of its Corporate Social Responsibility Policy: Provided that if the company fails to
spend such amount, the Board shall, in its report made under clause (o) of sub-section (3) of
section 134, specify the reasons for not spending the amount.
SCHEDULE VII
(See sections 135)
Activities which may be included by companies in their Corporate Social Responsibility
Policies
- eradicating extreme hunger and poverty;
- promotion of education;
- promoting gender equality and empowering women;
- reducing child mortality and improving maternal health;
- combating human immunodeiciency virus, acquired immune deiciency syndrome, malaria
and other diseases;
- ensuring environmental sustainability;
- employment enhancing vocational skills;
- social business projects;
- contribution to the Prime Minister’s National Relief Fund or any other fund set up by the
Central Government or the State Governments for socioeconomic development and relief
and funds for the welfare of the Scheduled Castes, the Scheduled Tribes, other backward
classes, minorities and women; and such other matters as may be prescribed.
5. Paragraph 7 of the Statement of Objects and Reasons appended to the Companies Bill,
2009 states the salient features of the said Bill. The notes on clauses appended to the aforesaid
Bill also explain the provisions of the Companies Bill, 2009, pending in this august House. The
revised Bill, namely, the Companies Bill, 2011, inter alia, makes the following amendments
to the Companies Bill, 2009 which broadly include:
(i) Concept of Corporate Social Responsibility is being introduced.
(ii) Enhanced Accountability on the part of Companies.
(b) Corporate Social Responsibility (CSR) Committee of the Board proposed in addition
to other Committees of the Board viz. Audit Committee, Nomination and Remuneration
and Stakeholders Relationship Committee. These committees shall have IDs/non-executive
directors to bring more independence in Board functioning and for protection of interests
of minority shareholders.

Role of Corporate Social Responsibility in Livelihoods Promotion of Poor: A Commentary 147
(iii) Additional Disclosure Norms:
(a) New disclosures like development and implementation of risk management policy,
Corporate Social Responsibility Policy, manner of formal evaluation of performance of Board
of directors and individual directors included in the Board report in addition to disclosures
proposed in such report in the Companies Bill, 2009.
(iv) Enhanced Accountability on the part of Companies:
(b) Corporate Social Responsibility (CSR) Committee of the Board proposed in addition
to other Committees of the Board viz. Audit Committee, Nomination and Remuneration
and Stakeholders Relationship Committee. These committees shall have IDs/non-executive
directors to bring more independence in Board functioning and for protection of interests
of minority shareholders.
Clause 135—This new clause seeks to provide that every company having speciied net
worth or turnover or net proit during any inancial year shall constitute the Corporate
Social Responsibility Committee of the Board. The composition of the committee shall be
included in the Board’s Report. The Committee shall formulate policy including the activi-
ties speciied in Schedule VII. The Board shall disclose the content of policy in its report
and place on website, if any of the company. The clause further provides that the Board
shall endeavour to ensure that at least two per cent of average net proits of the company
made during three immediately preceding inancial years shall be spent on such policy
every year. If the company fails to spend such amount the Board shall give in its report the
reasons for not spending.
Item (a) of sub-clause (4) of clause 135 proposes to empower the Central Government to
prescribe the manner of disclosure of contents of Corporate Social Responsibility Policy in
the Board’s Report and on the company’s website.
Source: Government of India (2011).
ANNexuRe 2 National voluntary guidelines for the social, environmental and
economic responsibilities of business (NVG-See)1
The National Voluntary Guidelines for Social, Environmental and Economic Responsibilities
of Business were released by the Ministry of Corporate Affairs, Government of India, in July
2011. They outline principles for responsible business action and provide guidance for the
implementation of the same. These guidelines have been formulated to encourage adoption of
sustainability reporting and mainstream disclosure on environmental, social and governance
metrics in India. NVG-SEE provides businesses a framework which enables them to move towards
responsible decision making and urges them to adopt the ‘triple bottom-line’ approach.
SEBI has, in the recent years, laid increasing signiicance on disclosure of non-inancial
measures and has lent support to ESG disclosure and standard setting initiatives. As per
SEBI’s requirement under clause 49 of the listing agreement all public equities are required
to comply with certain disclosure norms related to corporate governance. SEBI’s decision to
get the largest businesses to adopt the NVG-SEE is a reafirmation to continue to raise the bar
for disclosure and drive transparency in the marketplace.
1 National Voluntary Guidelines on Social, Environmental and Economic Responsibilities of Business 2011, http://
www.mca.gov.in/Ministry/latestnews/National_Voluntary_Guidelines_2011_12j ul2011.pdf, as quoted in Preparedness
of Indian Public Equities for Business Sustainability (Environmental, Social and Governance) Disclosure and Reporting,
Issue brieing in context of SEBI mandating Business Responsibility Reporting, cKinetics, December 2011.

148 STATE OF INDIA’S LIVELIHOODS REPORT 2012
The national voluntary guidelines consist of 9 core principles, namely:
Principle 1: Businesses should conduct and govern themselves with Ethics, Transparency and
Accountability.
Principle 2: Businesses should provide goods and services that are safe and contribute to
sustainability throughout their life cycle.
Principle 3: Businesses should promote the well-being of all employees.
Principle 4: Businesses should respect the interests of, and be responsive towards all stakehold-
ers, especially those who are disadvantaged, vulnerable and marginalized.
Principle 5: Businesses should respect and promote human rights.
Principle 6: Business should respect, protect, and make efforts to restore the environment.
Principle 7: Businesses, when engaged in influencing public and regulatory policy, should do
so in a responsible manner.
Principle 8: Businesses should support inclusive growth and equitable development.
Principle 9: Businesses should engage with and provide value to their customers and consum-
ers in a responsible manner.
ANNexuRe 3 NVG-See business responsibility report—suggested framework2
Part A
Part A of the report includes basic information and data about the operations of the business entity
so that the reading of the report becomes more contextual and comparable with other similarly
placed businesses. It may be written in a free format incorporating at least the following:
A-1
l Basic details of the business – Name; nature of ownership; details of the people in top
management; location of its operations - national and international; products and services
offered; markets served;
l Economic and Financial Data – Sales; Net Profit; Tax Paid; Total Assets; Market
Capitalization (for listed companies); number of employees
A-2
l Management’s Commitment Statement to the ESG Guidelines
l Priorities in terms of Principle and Core Elements
l Reporting Period/Cycle
l Whether the report(s) based on this framework or any other framework
l Any Significant Risk that the business would like its stakeholders to know
l Any Goals and Targets that were set by the top management for improving their perform-
ance during the Reporting Period.
Part B
Part-B of the report incorporates the basic parameters on which the business may report their
performance. Efforts have been made to keep the reporting simple keeping in view the fact
2 National Voluntary Guidelines on Social, Environmental and Economic Responsibilities of Business 2011, http://
www.mca.gov.in/Ministry/latestnews/National_Voluntary_Guidelines_2011_12j ul2011.pdf, as quoted in Preparedness
of Indian Public Equities for Business Sustainability (Environmental, Social and Governance) Disclosure and Reporting,
Issue briefing in context of SEBI mandating Business Responsibility Reporting, cKinetics, December 2011.

Role of Corporate Social Responsibility in Livelihoods Promotion of Poor: A Commentary 149
that this framework is equally applicable to the small businesses as well. The report may be
prepared in a free format with the basic performance indicators being included in the same.
In case the business entity has chosen not to adopt or report on any of the Principles, the same
may be stated along with, if possible, the reasons for not doing so.
B-1
Principle 1—Ethics, transparency and accountability
l Governance structure of the business, including committees under the Board responsible
for organizational oversight. In case no committee is constituted, then the details of the
individual responsible for the oversight.
l Mandate and composition (including number of independent members and/or non-executive
members) of such committee with the number of oversight review meetings held.
l State whether the person/committee head responsible for oversight review is independent
from the executive authority or not. If yes, how.
l Mechanisms for shareholders and employees to provide recommendations or direction to
the Board/Chief Executive.
l Processes in place for the Board/Chief Executive to ensure conflicts of interest are
avoided.
l Internally developed statement on Ethics, Codes of Conduct and details of the process
followed to ensure that the same are followed.
l Frequency with which the Board/Chief Executive assess BR performance.
Principle 2—Products life cycle sustainability
l Statement on the use of recyclable raw materials used.
l Statement on use of energy-eficient technologies, designs and manufacturing/service-
delivery processes.
l Statement on copyrights issues in case of the products that involve use of traditional
knowledge and geographical indicators.
l Statement on use of sustainable practices used in the value chain.
Principle 3—Employees’ well-being
l Total number of employees with percentage of employees that are engaged through con-
tractors.
l Statement on non-discriminatory employment policy of the business entity.
l Percentage of employees who are women.
l Number of persons with disabilities hired.
l Amount of the least monthly wage paid to any skilled and unskilled employee.
l Number of training and skill up-gradation programmes organized during the reporting
period for skilled and unskilled employees.
l Number of incidents of delay in payment of wages during the reporting period.
l Number of grievances submitted by the employees.
Principle 4—Stakeholder engagement
l Statement on the process of identiication of stakeholders and engaging with them.
l Statement on signiicant issues on which formal dialogue has been undertaken with any
of the stakeholder groups.

150 STATE OF INDIA’S LIVELIHOODS REPORT 2012
Principle 5—Human rights
l Statement on the policy of the business entity on observance of human rights in their
operation.
l Statement on complaints of human rights violations iled during the reporting period.
Principle 6—Environment
l Percentage of materials used that are recycled input materials.
l Total energy consumed by the business entity for its operations.
l Statement on use of energy saving processes and the total energy saved due to use of such
processes.
l Use of renewable energy as percentage of total energy consumption.
l Total water consumed and the percentage of water that is recycled and reused.
l Statement on quantum of emissions of greenhouse gases and efforts made to reduce the
same.
l Statement on discharge of water and effluents indicating the treatment done before dis-
charge and the destination of disposal.
l Details of efforts made for reconstruction of bio-diversity.
Principle 7—Policy advocacy
l Statement on significant policy advocacy efforts undertaken with details of the platforms
used.
Principle 8—Inclusive growth
l Details of community investment and development work undertaken indicating the finan-
cial resources deployed and the impact of this work with a longer term perspective.
l Details of innovative practices, products and services that particularly enhance access and
allocation of resources to the poor and the marginalized groups of the society.
Principle 9—Customer value
l Statement on whether the labelling of their products has adequate information regarding
product-related customer health and safety, method of use and disposal, product and
process standards observed.
l Details of the customer complaints on safety, labeling and safe disposal of the products
received during the reporting period.
Part C
Part C of the report incorporates two important aspects on BR reporting. Part C-1 is a disclosure
on by the business entity on any negative consequences of its operations on the social, environ-
mental and economic fronts. The objective is to encourage the business to report on this aspect in
a transparent manner so that it can channelize its efforts to mitigate the same. Part C-2 is aimed
at encouraging the business to continuously improve its performance in the area of BR.
C-1
l Brief Report on any material/significant negative consequences of the operations of the
business entity.

Role of Corporate Social Responsibility in Livelihoods Promotion of Poor: A Commentary 151
C-2
l Brief on Goals and Targets in the area of social, environmental and economic responsibili-
ties that the business entity has set for itself for the next Reporting Period.
ANNexuRe 4 Global reporting initiative GRI 3.1 reporting guidelines3
Overview of Sustainability Reporting
The Purpose of a Sustainability Report Sustainability reporting is the practice of measuring,
disclosing, and being accountable to internal and external stakeholders for organizational
performance towards the goal of sustainable development. ‘Sustainability reporting’ is a
broad term considered synonymous with others used to describe reporting on economic,
environmental, and social impacts (e.g., triple bottom line, corporate responsibility report-
ing, etc.). A sustainability report should provide a balanced and reasonable representation
of the sustainability performance of a reporting organization—including both positive and
negative contributions. Sustainability reports based on the GRI Reporting Framework dis-
close outcomes and results that occurred within the reporting period in the context of the
organization’s commitments, strategy, and management approach. Reports can be used for
the following purposes, among others:
l Benchmarking and assessing sustainability performance with respect to laws, norms, codes,
performance standards, and voluntary initiatives;
l Demonstrating how the organization influences and is influenced by expectations about
sustainable development; and G3 Reporting Framework;
l Comparing performance within an organization and between different organizations over
time.
Orientation to the GRI reporting framework
All GRI Reporting Framework documents are developed using a process that seeks consensus
through dialogue between stakeholders from business, the investor community, labour, civil
society, accounting, academia, and others. All Reporting Framework documents are subject to
testing and continuous improvement. The GRI Reporting Framework is intended to serve as
a generally accepted framework for reporting on an organization’s economic, environmental,
and social performance. It is designed for use by organizations of any size, sector, or location.
It takes into account the practical considerations faced by a diverse range of organizations—
from small enterprises to those with extensive and geographically dispersed operations. The
GRI Reporting Framework contains general and sector-specific content that has been agreed
by a wide range of stakeholders around the world to be generally applicable for reporting an
organization’s sustainability performance.
The sustainability reporting guidelines
The Guidelines consist of Principles for defining report content and ensuring the quality
of reported information. It also includes Standard Disclosures made up of Performance
Indicators and other disclosure items, as well as guidance on specific technical topics in
Reporting.
3 Extract from G3.1 Guidelines Including Technical Protocol.pdf, From Global Reporting Initiative, www.glo-
balreporting.org

152 STATE OF INDIA’S LIVELIHOODS REPORT 2012
Indicator Protocols
These exist for each of the Performance Indicators contained in the Guidelines. These Protocols
provide deinitions, compilation guidance, and other information to assist report preparers
and to ensure consistency in the interpretation of the Performance Indicators. Users of the
Guidelines should also use the Indicator Protocols.
Sector supplements
Complement the Guidelines with interpretations and guidance on how to apply the
Guidelines in a given sector, and include sector-speciic Performance Indicators. Applicable
Sector Supplements should be used in addition to the Guidelines rather than in place of the
Guidelines.
Technical protocols
Created to provide guidance on issues in reporting, such as setting the report boundary. They
are designed to be used in conjunction with the Guidelines and Sector Supplements and cover
issues that face most organizations during the reporting process.
Orientation to the GRI guidelines
The Sustainability Reporting Guidelines consist of Reporting Principles, Reporting Guidance,
and Standard Disclosures (including Performance Indicators). These elements are considered
to be of equal in weight and importance.
Part 1—Reporting principles and guidance
Three main elements of the reporting process are described in Part 1. To help determine
what to report on, this section covers the Reporting Principles of materiality, stakeholder
inclusiveness, sustainability context, and completeness, along with a brief set of tests for each
Principle. Application of these Principles with the Standard Disclosures determines the top-
ics and Indicators to be reported. This is followed by Principles of balance, comparability,
accuracy, timeliness, reliability, and clarity, along with tests that can be used to help achieve
the appropriate quality of the reported information. This section concludes with guidance
for reporting organizations on how to deine the range of entities represented by the report
(also called the ‘Report Boundary’).
Part 2—Standard disclosures
Part 2 contains the Standard Disclosures that should be included in sustainability reports.
The Guidelines identify information that is relevant and material to most organizations and
of interest to most stakeholders for reporting the three types of Standard Disclosures:
l Strategy and Proile: Disclosures that set the overall context for understanding organiza-
tional performance such as its strategy, proile, and governance.
l Management Approach: Disclosures that cover how an organization addresses a given set
of topics in order to provide context for understanding performance in a speciic area.
l Performance Indicators: Indicators that elicit comparable information on the economic,
environmental, and social performance of the organization.
Applying the guidelines
Getting started
All organizations (private, public, or non-proit) are encouraged to report against the
Guidelines whether they are beginners or experienced reporters, and regardless of their size,
sector, or location. Reporting can take various forms, including web or print, stand alone

Role of Corporate Social Responsibility in Livelihoods Promotion of Poor: A Commentary 153
or combined with annual or inancial reports. The irst step is to determine report content.
Guidance for this is provided in Part 1. Some organizations may choose to introduce reporting
against the full GRI Reporting Framework from the outset, while others may want to start with
the most feasible and practical topics irst and phase in reporting on other topics over time.
All reporting organizations should describe the scope of their reporting and are encouraged
to indicate their plans for expanding their reporting over time.
GRI application levels
Upon inalization of their report, preparers should declare the level to which they have applied
the GRI Reporting Framework via the ‘GRI Application Levels’ system. This system aims to
provide:
l Report readers with clarity about the extent to which the GRI Guidelines and other
Reporting Framework elements have been applied in the preparation of a report.
l Report preparers with a vision or path for incrementally expanding application of the GRI
Reporting Framework over time.
Declaring an Application Level results in a clear communication about which elements of
the GRI Reporting Framework have been applied in the preparation of a report. To meet the
needs of new beginners, advanced reporters, and those somewhere in between, there are three
levels in the system. They are titled C, B, and A. The reporting criteria found in each level
reflects an increasing application or coverage of the GRI Reporting Framework. An organiza-
tion can self-declare a ‘plus’ (+) at each level (ex., C+, B+, A+) if they have utilized external
assurance. An organization self-declares a reporting level based on its own assessment of its
report content against the criteria in the GRI Application Levels.
In addition to the self-declaration, reporting organizations can choose one or both of the
following options:
l Have an assurance provider offer an opinion on the self-declaration.
l Request that the GRI check the self-declaration.
For more information on Application Levels, and the complete criteria, see the GRI
Applications Level information pack available as an insert to this document, or found online
at www.globalreporting.org.
Request for notiication of use
Organizations that have used the Guidelines and/or other elements of the GRI Reporting
Framework as the basis for their report are requested to notify the Global Reporting Initiative
upon its release. While notifying GRI, organizations can choose any or all of the following
options:
l Simply notify the GRI of the report and provide hard and/or soft copy.
l Register their report in GRI’s online database of reports.
l Request GRI checks their self-declared Application Level.
Maximizing report value
Sustainability reporting is a living process and tool, and does not begin or end with a printed
or online publication. Reporting should fit into a broader process for setting organizational
strategy, implementing action plans, and assessing outcomes. Reporting enables a robust
assessment of the organization’s performance, and can support continuous improvement in

154 STATE OF INDIA’S LIVELIHOODS REPORT 2012
performance over time. It also serves as a tool for engaging with stakeholders and securing
useful input to organizational processes.
ANNexuRe 5 Relevant laws and regulations4
A mention of relevant laws and regulations in this annexure is purposeful and is meant to give
the reader a perspective on the fact that while legal provisions exist to work with marginalized
communities as well as other citizens, corporates rarely make an attempt to relate their CSR
strategy, activation framework and implementation to the provisions of various laws intended
to create a better society.
l Industrial Disputes Act 1947
l Factories Act 1948
l Companies Act 1956
l Trade Union Act 1956
l Equal Remuneration Act 1976
l Bureau of Indian Standards Act 1986
l Consumer Protection Act 1986
l Environment Protection Act 1986
l Prevention of Corruption Act 1988
l Public Liability Insurance Act 1991
l National Commission for Backward Classes Act 1993
l Persons With Disabilities (Equal opportunities, protection of rights and full participation)
Act 1995
l Trade Marks Act 1999
l Juvenile Justice (Care and Protection of Children) Act 2000
l Designs Act 2000
l New Competition Act 2002
l Prevention of Money Laundering Act 2002
l National Commission for Minority Educational Institutions Act 2004
l Commission for Protection of Child Rights Act 2005
l National Rural Employment Guarantee Act 2005
l Right to Information Act 2005
l Protection of Women from Domestic Violence Act 2005
l Micro Small and Medium Enterprises Development Act 2006
l The Scheduled Tribes and Other Traditional Forest Dwellers (recognition of forest rights)
Act 2006
l Protection of Human Rights(amendment) Act 2006
l Rehabilitation and Resettlement Bill 2007
l Land Acquisition (amendment) Bill 2007
l Hazardous Waste (management, handling and trans-boundary movement) Rule 2008
l The Information Technology (Amendment) Act 2008
l Workmen’s Compensation Act 1923
l Children (pledging of labour) Act 1933
l Payment of Wages Act 1936
l Industrial Employment (standing orders) Act 1946
l Employees State Insurance Act 1948
4 CSR Country Brief, India 2012, Innovation Norway, Norwegian Embassy.

Role of Corporate Social Responsibility in Livelihoods Promotion of Poor: A Commentary 155
l Minimum Wages Act 1948
l Employees Provident Fund and Miscellaneous Provisions Act 1952
l Maternity Beneits Act 1961
l Payment of Bonus Act 1965
l Contract Labour (regulation and abolition) Act 1970
l Payment of Gratuity Act 1972
l Bonded Labour System (abolition) Act 1976
l Inter-State Migrant Workmen (regulation of employment and conditions of service) Act
1979
l Child Labor (prohibition and regulation) Act 1986
l Building and Other Construction Workers (regulation of employment and conditions of
service) Act 1996
l Wildlife protection Act 1972
l Water (prevention and control of pollution) Act 1974
l Water (prevention and control of pollution) Cess Act 1977
l Air (prevention and control of pollution) Act 1981
l Forest (conversation) Act 1980 and Amendments 1988
l National Environment Tribunal Act 1995
l National Environmental Appellate Authority Act 1997
l Energy Conservation Act 2001
l Coastal Aquaculture Authority Act 2005
l Special Economic Zones Act 2005
l Essential Commodities Act 1955
l Union Duties of Excise (distribution) Act 1979
l Central Excise Tariff Act 1985
l Customs (amendment) Act 1985
l Taxation Laws (amendment & miscellaneous provisions) Act 1986
l Direct Tax Laws (amendment) Act 1988
l Foreign Trade (development and regulation) Act 1992
l Securities and Exchange Board of India Act 1992
l Customs and Central Excise Laws (repeal) Act 2004
l National Tax Tribunal Act 2005
l National Manufacturing Policy 2011
ANNexuRe 6 Resources
Reader can visit these links for further details on CSR and sustainability.
Business Fights Poverty, http://www.businessightspoverty.org/
Mckinsey on Society, http://mckinseyonsociety.com/
CSR Wire, http://www.csrwire.com/
Business for Social Responsibility, http://www.bsr.org/
Sustainable Brands, http://sustainablebrands.com/
World Resources Institute, http://www.wri.org/
World Business Council for Sustainable Development, http://wbcsd.org/home.aspx
FSG, http://www.fsg.org/
Ethisphere, http://ethisphere.com/
Global Reporting Initiative, https://www.globalreporting.org/Pages/default.aspx

156 STATE OF INDIA’S LIVELIHOODS REPORT 2012
References
Beck, Ulrich. 2009. World at Risk. Cambridge: Polity
Press.
Berad, Nilesh R. 2011. ‘Corporate Social Responsibility—
Issues and Challenges in India MET Institute of
Management’, International Conference on
Technology and Business Management, 28–30
March 2011, Nasik.
Brown, Lester R. 2008. Plan B 3.0, Mobilizing to Save
Civilization, Earth Policy Institute.
Business Standard. 2012. ‘Panel for Making 2%
Spending on CSR Mandatory’, Business Standard,
New Delhi, 8 July 2012.
cKinetics. December 2011. ‘Preparedness of Indian
Public Equities for Business Sustainability
(Environmental, Social and Governance)’,
Disclosure and Reporting, Issue Brieing in Context
of SEBI Mandating Business Responsibility
Reporting. Available at http:/www.ckinetics.
com/publication/Preparedness_of_India_inc_
for_NVG.pdf
Collier, Paul. 2007. The Bottom Billion. Oxford: Oxford
University Press.
Esty, Dan and Andrew Winston. 2006. Green to Gold.
UK: John Wiley and Sons.
European Venture Philanthropy Association. 2010.
‘European Venture Philanthropy Directory
2010/11’, European Venture Philanthropy
Association.
Gail, Thomas and Margaret Nowak. 2006. ‘Corporate
Social Responsibility: A Deinition’, Graduate
School of Business, Curtin University of
Technology, Perth, Australia.
Gobe, Marc. 2002. Citizen Brand. New York: AllWorth
Press.
Goenka, Harsh. 2012. ‘Why Is It a Good Idea to
Mandate Corporate Social Responsibility’,
Economic Times, 1 September 2012. Available
at: http://articles.economictimes.indiatimes.
com/2012-09-01/news/33535456_1_net-proit-
companies-bill-crore-last-year
Government of India. 2011. The Companies Bill, 2011,
Bill No. 121 of 2011, Ministry of Corporate Affairs,
New Delhi.
Green, Stephen. 2009. Good Value. UK: Allen Lane.
Hilton, Steve and Giles Gibbon. 2002. Good Business,
Texere Publishing.
Kanter, Rosabeth Moss. 2010. Super Corp. UK: Proile
Books.
KPMG. 2008. ‘Corporate Social Responsibility:
Towards a Sustainable Future—A White Paper’,
KPMG, ASSOCHAM, New Delhi..
———. 2011. ‘Corporate Responsibility Survey
2011: Marching Towards Embracing Sustainable
Development’, KPMG India, Mumbai.
Norwegian Embassy. 2012. CSR Country Brief, India
2012, Innovation Norway, Royal Norwegian
Embassy, Commercial Section, New Delhi.
Prahlad, C. K. 2005. The Fortune at the Bottom of the
Pyramid, Wharton School Publishing.
Press Trust of India. 2012. ‘Acceptable Formula on CSR
Is Ready: Moily’, Business Standard, New Delhi,
27 June 2012.
Sharma, Ruchir. 2012. Breakout Nations: In Pursuit of
the Next Economic Miracles. UK: Allen Lane.
UN Global Compact Office. 2007. ‘2007 Leaders
Summit’, UN Global Contact Annual Review,
New York.
Background
Livelihood promotion for the poor is a
multi-faceted issue that requires multi-
pronged interventions at the policy and
the programme front in order to meet the
dynamic needs of the people. In India, it
is an immense challenge and an incredible
opportunity for all institutions, public and
private. The State has been a major player in
policy formulation and programme imple-
mentation. Policy exploration and debate
continue on a number of issues ranging
from food security, land acquisition and
rehabilitation, the mode of delivery of sub-
sidies and Public Distribution System (PDS)
rationalization, to the merger of Central
Sector schemes and review of parameters
for measurement of poverty.
The Twelfth Five Year Plan (FYP) that
focuses on faster, more inclusive growth
and creation of sustainable livelihoods was
to commence from April 2012; however, it
is still awaiting approval from the National
Development Council (NDC).
Achieving economic growth of 9 per
cent with 4 per cent growth in agriculture,
while combating high inlation and inancial
exclusion is a daunting task. Several mega
livelihood programmes have been initiated,
such as the ambitious and comprehen-
sive National Rural Livelihoods Mission
(NRLM) launched in 2011. The Mission tar-
gets 70 million rural poor and was unveiled
in select states for phased implementation
over a 10-year period. While numerous live-
lihood models from self-help group (SHG)
federations, non-governmental organiza-
tions (NGOs), civil society organization
(CSOs) and donor agencies are under trial
in various parts of the country, no scalable
model has yet emerged.
In the financial sector too, financial
inclusion plans are top agenda. However,
consequent to the Andhra Pradesh crisis,
the microfinance sector/microfinance
institutions (MFIs) that could have played
a critical role in developing livelihoods for
the poor have gotten mired in controversies,
leading to a fresh hue and cry for responsible
inance, customer protection and a code
of ethics for the sector. The Government
of India has renewed efforts to evolve the
revised MF (Regulation and Development)
Bill, based on recommendations of the
Reserve Bank of India (RBI) constituted
Malegam Committee.
The corporate sector has also been play-
ing a signiicant role in the development of
sustainable rural livelihoods, particularly in
retail markets and the agri-business sector.
The public private partnership (PPP) model,
due to its proven record of success and com-
petence, is being increasingly sought after as
the way forward in sustainable livelihoods
development.
Under the aegis of Unique Identiication
Authority of India (UIDAI), Unique
Identiication (UID) Number/Aadhar-based
schemes are making steady progress as a
means of systematic/transparent/accurate
identiication of BPL families and plugging
Potential and Possibilities for Livelihood of the Poor
BISWA BANDHU MOHANTY
Chapter 7

158 STATE OF INDIA’S LIVELIHOODS REPORT 2012
leakages in various schemes. The National
Identiication Authority Bill is still awaiting
approval by the Parliament.
Meaning and scope of potential for livelihoods
Public perceptions vary regarding the
deinition, meaning and scope of the term
‘livelihoods’. Here, potential livelihoods for
the poor are conceived and discussed from
a broader perspective. Potential is linked to
(a) category of the poor from the regional
perspective; (b) diversities, dificulties and
needs of such people; (c) extent and type
of vulnerability. The potential needs to be
examined from two angles: natural environ-
ment and human capital.
The potential and, therefore, livelihood
options for the poor will vary with their
environment: rain-fed areas, deserts, disaster-
prone areas (lood-affected, drought-prone,
tsunami-affected, etc.), forest-based regions,
coastal areas, urban slums, regions affected
by left-wing extremism (LWE), hilly regions
and so on.
Furthermore, vulnerabilities and chal-
lenges of different groups need to be
addressed while determining their liveli-
hood options: women, the old and destitute;
senior citizens; Scheduled Castes (SCs);
Scheduled Tribes (STs) and Other Backward
Classes (OBCs); minorities; tribals; the
disabled; artisans; scavengers; devadasis;
sex workers; street vendors; migrants; refu-
gees; livestock rearers; ishermen; small and
marginal farmers and the landless; child
labourers; unemployed youth; the ultra
poor; single women, etc.
Livelihood promotion as a means of
comprehensively pulling the poor above the
poverty line encompasses
1. generation of employment opportuni-
ties, preferably in local areas;
2. provision of physical and social infra-
structure;
3. increase of enrolment into primary/
secondary schools/elimination of drop-
outs;
4. improvements in public health making
it more effective and equitable;
5. improvements in productivity of agri-
culture, industry and services through
research and development (R&D) and
skill and capabilities building;
6. ensuring security in food, nutrition,
employment, wage and livelihoods and
basic amenities.
Thus, the potential for fulilling the multi-
dimensional needs of the poor through sus-
tainable livelihoods in different segments/
areas/sub-sectors comes within the purview
of this chapter. The above-stated multi-
dimensional aspects of sustainable livelihood
promotion have been aptly relected in 7
guiding principles of Sustainable Livelihoods
Approach (SLA) of IFAD as given in the
Box 7.1.
Census 2011: Livelihood potential
Youth: The blossoming potential
The Census 2011 puts the country’s total
population at 1.21 billion, unfolding youth
power as a demographic dividend. The
l Accept a people-centred approach
l Be holistic
l Consider the dynamics of the situation
l Build on strengths
l Encourage broad partnerships
l Foster micro–macro links
l Aim for sustainability
Source: Author’s compilation based on IFAD’s
Sustainable Livelihoods Approach(SLA),
detailed in IFAD’s website www.ifad.org/sla
/indexhtm
Box 7.1: IFAD’s seven principles of the Sustainable Livelihood Approach (SLA)

Potential and Possibilities for Livelihood of the Poor 159
Approach Paper (AP) to the Twelfth FYP
(Planning Commission, 2011) also states,
India has younger population not only in
comparison to advanced economies but also
in relation to the large developing countries.
As a result, the labour force in India is
expected to increase by 32% over the next
20 years, while it will decline by 4.0% in
the industrialized countries and by nearly
5.0% in China. This demographic dividend
can add to growth potential, provided two
conditions are fulilled. First, higher levels
of health, education and skill development
must be achieved. Second, an environment
must be created in which the economy not
only grows rapidly, but also enhances good
quality employment/livelihoods opportunities
to meet the needs and aspirations of the youth.
[paragraph 1.18]
The 66th National Sample Survey
Organisation (NSSO) Survey on Employment
(2009–2010) further states that the number
of young people in education and therefore,
out of workforce, has increased dramatically,
causing a drop in the labour participation
rate. The number of youth in the working
age group of 15–24 years who continued
their education has doubled from about 30
million in 2004–2005 to over 60 million in
2009–2010. We can, therefore, assume that
a much larger number of educated youth
will join the labour force in the years ahead.
For growth to be inclusive, and to meet the
needs and expectations of a growing young
populace, adequate, remunerative and qual-
ity livelihood opportunities are essential.
The medium, small and micro enterprise
(MSME) sector, knowledge sector, agri-
business and non-farm sector are the emer-
gent potential avenues in our economy.
Urbanization and migration: New opportunities
In 2001, the urban population was 285
million, in 2011, it was 380 million, and by
2030, it is expected to jump to 600 million.
More people will eventually live within
urbanized conglomerations, due to diversi-
ication of villages, sprouting of peri-urban
centres around large towns and migration
of people into towns. Geographical clusters
that are located within the vicinity of cities
will support rural livelihoods and become
the prospective markets. There is a syner-
gistic relationship between rural prosperity
and the continuum of urban development
from small farms to larger cities and met-
ros. However, fulfilling basic needs and
improving the quality of life of urban poor,
who suffer from multiple deprivations and
vulnerabilities, is a major challenge. The
urban poor would include migrants, moving
from rural areas to towns/cities and people
living in the urban conglomerations. Given
the changing milieu, facilitating migration
as a strategy for livelihood promotion has
been recognized.
Provisioning for livelihoods of the elderly
The ‘expectancy of life at birth’ benchmark
has improved signiicantly over the decades:
from 41 years in 1950s, to about 58 years in
1980s, 62 years in 1990s and 63 years in the
last decade. The Government of India has
taken several initiatives to ensure livelihood
security of the elderly. A Situation Analysis
of Elderly in India was undertaken in 2011,
National Policy for Older People was for-
mulated in 1999, a reconstituted National
Council of Old Persons (NCOP) was set up
in 2005, and the legislation on Maintenance
and Welfare of Parents and Senior Citizens
Act passed in 2007. In view of improved life
expectancy over time, greater support to this
segment is warranted, whether in terms of
inance, security, food, health care, shelter
and security or ensuring their ongoing par-
ticipation in development.
Potential Sectors/Sub-Sectors
Agriculture
Agrarian economy
The Indian economy is predominantly
agrarian even though the share of agri-
culture in GDP has been consistently
declining—the population dependent on

160 STATE OF INDIA’S LIVELIHOODS REPORT 2012
agriculture declined from 70 per cent a dec-
ade ago to about 52 per cent in 2010–2011
(RBI, 2011).
Apart from its share in employment,
agriculture continues to be important for
inter-sector linkage with manufacturing and
services, and for microeconomic stability.
Growth in agriculture and allied sectors
is a necessary pre-condition for inclusive
growth, reduction of poverty level, farm pro-
ductivity and income growth, and develop-
ment of farm/rural economy. To quote RBI
Governor, D. Subba Rao, in his address on
‘Agricultural Credit-Accomplishments and
Challenges’ at National Bank for Agriculture
and Rural Development’s (NABARD)
Foundation Day held in Mumbai on 12
July 2012:
It is well worth repeating that agriculture
defines the emotional and economic well
being of India. True, agriculture’s share in
GDP is less than 15 per cent but it still remains
the direct domain of over half of the popula-
tion whose economic prospects are linked to
the performance of agriculture.
According to a World Bank Report (World
Bank, 2008),
among 42 developing countries, over the
period 1981–2003, one per cent GDP growth
originating in agriculture increased the
expenditures of the three poorest deciles, at
least, 2.5 times as much as growth originating
in the rest of the economy. Clearly improving
the performance of agriculture is the key to
our quest for inclusive growth and poverty
reduction.
The agriculture and allied sectors real-
ized an average annual growth rate of 3.3
per cent during the Eleventh Plan Period
(2 per cent in the Tenth Plan) against the
targeted growth rate of 4 per cent. Agri-
growth, to a certain extent, continues to
be characterized by luctuations due to the
vagaries of nature. Notwithstanding the
potential of agriculture for production,
employment, income and empowerment,
and livelihood promotion, agrarian distress
continues due to multiplicity of factors.
There is, therefore, a great need to integrate
our efforts on livelihood promotion with
focus on sustainability of agriculture and
agribusiness.
Range of activities in agriculture/ agri-business
With a view to making agriculture more a
productive and proitable livelihood option,
there is scope to develop support business
development services, as follows:
l information and communication tech-
nology (ICT) based technologies for
undertaking soil testing, facilitating crop
selection and optimization of returns
from land and irrigation;
l provision of Farm Management Services
(FMS), providing appropriate guidance
and extension services;
l provision of agri-implements and farm
mechanization;
l provision of rural infrastructure includ-
ing storage facilities;
l availability of quality seeds to meet local
demand;
l availability of fertilizers and pesticides,
preferably farm yield manure, vermi-
compost and organic resources;
l improvement in pre- and post-harvest
practices and structured management
services ;
l avenues for market intelligence infor-
mation about market and channelling
agri-produce to markets.
There is scope for organized interven-
tions by both government and non-govern-
ment agencies in this direction, in order to
minimize the hardships of farmers including
women engaged in agricultural occupations.
For new generation and progressive farmers
taking up agri-business projects, there are
opportunities, scope and potential under
the purview of farming input, such as sup-
plies, support services, support facilities,
technology, value addition and output
channelling.

Potential and Possibilities for Livelihood of the Poor 161
Farming interventions include contract
farming, own land/leased land farming, cash
crops, inter-cropping, mechanized farming,
seed production/multiplication, multiple
cropping with allied activities. Input sup-
plies activities include seeds, agro-chemicals,
agri-implements, consumables and ingredi-
ents, chemicals, quality control equipment
and packing material.
Support services cover nurseries, ware-
housing, specialized storage facility, cold
chain, machinery, tools, spares and main-
tenance support, water treatment, efluent
treatment, broilers, training and counsel-
ling. Primary processing/value addition
facilities/opportunities could be in the areas
of pack houses, cleaning, sorting, grading,
and value addition at farm end. Processing
interventions would comprise processing
of seeds, grains, fruits, vegetables, spices,
oilseeds, plantation crop produce, Non-
timber Forest Produce (NTFP), etc.
Different categories of products could be
frozen, pickled, extruded dried, fresh dried,
etc. Processing interventions would include
crushing, milling, sorting/grading, polish-
ing, wax treatment, irradiation, cooking and
pasteurization. Output channelling could
include retailing supplies/bulk supplies to
traders, processors, exporters, aggregation
centres, food services, etc.
Challenges and possibilities in agriculture livelihood
As enumerated above, a wide range of
activities in agriculture can be pursued
as livelihood options. However, climate
change, extreme weather conditions, con-
straints in infrastructure, lack of market
intelligence and market reforms, limita-
tions of predominantly small and marginal
farmers, etc., pose tough challenges. Various
schemes/programmes/missions have been
initiated with the objective of tapping the
potential of agriculture and allied sectors,
and opening up livelihood opportunities.
These include: National Food Security
Mission, Rashtriya Krishi Vikas Yojana
(RKVY); Macro Management of Agriculture
(MMA), Integrated Schemes of Oilseeds,
Pulses, Oil Farm and Maize (ISOPOM);
National Mission for Sustainable Agriculture
(NMSA), National Horticulture Mission,
National Bamboo Mission, various inte-
grated schemes for livestock (dairy, poultry,
isheries water management and soil nutri-
ent management, rain-fed farming, linking
small producers and markets, land and
tenancy reforms, etc).
Service sector
High share in economy and diversiied activities
As per the Economic Survey, the share of
Services in India’s Gross Domestic product
(GDP) at factor cost (at current prices)
increased from 33.5 per cent in 1950–1951
to 55 per cent in 2010–2011 and 56.3 per
cent in 2011–2012 (advance estimates).
The share of ‘trade, hotels and restaurants’
as a group at 16.9 per cent, is the largest
contribution to GDP among various sub-
sectors, followed by ‘inancing, insurance,
real estate and business services’ at 16.4 per
cent. The services growth rate at constant
prices has always been above the overall
GDP growth since 1996–1997 except in
2003–2004. In 2011–2012, as per advance
estimates, the growth rate has been placed
at 9.4 per cent.
The Service Sector will provide con-
tinuous opportunities for creation of decent
livelihoods in both rural and urban areas.
Census 2011 puts India’s rural population
at 833 million and rural income opportuni-
ties exist not only in the farm sector but also
in the interconnected non-farm and other
interrelated sub-sectors and activities. While
agriculture continues to be a primary source
of employment in the economy overall and
predominantly so for rural areas, in urban
India, the services sector is the principal
source of employment. According to the
NSSO Report on the employment and
unemployment situation in India 2009–
2010, the services sector accounted for 147
and 582 for every 1000 persons employed in
rural and urban areas respectively.

162 STATE OF INDIA’S LIVELIHOODS REPORT 2012
This fast growing sector encompasses
a vast spectrum of services, which cre-
ate a range of job opportunities that
demand highly skilled to unskilled man-
power. Information technology (IT) and
IT-enabled services including telecom may
be expected to contribute to economic
growth in the coming years by creating busi-
ness opportunities and supporting them.
Health care, education and inancial serv-
ices, community services, security services,
media, entertainment, ilms, music, radio,
television and recreation are other areas
that will provide huge livelihood opportu-
nities. Construction, tourism, hospitality,
transportation and communication are high
growth sub-sectors. The construction sector
provides direct and indirect employment to
35 million people and is expected to open
up employment opportunities to 92 million
persons by 2022. Tourism and hospitality
create multiple employment opportunities
through its many arms: transportation,
accommodation, food, establishments, retail
shops, entertainment, business and hotels.
Knowledge/skill-based service sector opening up opportunities
The knowledge-based service sector, tech-
nology-intensive sectors and services will be
the sought after destinations for livelihood
of new young entrants in the labour force.
In recognition of these young entrants and
the need for greater pace and quality of
livelihood creation, the Twelfth Plan AP
and the Economic Survey, 2012 have both
laid greater stress on skill-building as an
instrument for improving effectiveness
and the contribution of labour to overall
production.
Pro-poor tourism
Pro-poor tourism is an emerging area that
aims to increase the net beneit that low
from tourism and related activities to the
poor. It envisages promotion of community
tourism, heritage tourism, eco-tourism,
wellness tourism, etc., and calls for diver-
sity of activities from micro to macro level,
including capacity-building of participating
poor, development of infrastructure, mar-
keting, publicity, planning, investment and
policy. These will provide the multiple ben-
eits of economic livelihoods besides social
and cultural improvement.
Manufacturing sector
Potentials of MSME
The manufacturing sector, as per the
Economic Survey 2012, did not perform
well and its share of GDP came down to
27 per cent from its 28 per cent peak. In
an emerging economy, the manufacturing
sector is the driver of growth and promoter
of employment and, therefore, needs to be
developed rapidly. The MSME sector is a
strategic asset for the economy and the foun-
dation for manufacturing sector and liveli-
hood options. MSMEs contribute nearly 8
per cent of the GDP, 45 per cent of the man-
ufactured output and 10 per cent of exports.
According to the All India Census of Small
Scale Industries (2006–2007), it provides
employment to about 59.7 million people
through 26.1 million enterprises producing
over 6,000 products. There are an estimated
1.30 million women-owned enterprises and
1.2 million women-managed enterprises.
The rural non-farm sector encompass-
ing this segment provides alternative/
supplementary livelihood to many rural
people, particularly small, marginal farm-
ers, artisans, women and other vulnerable
sections. To quote an Approach Paper
of the Planning Commission (Planning
Commission, 2012),
About half of our population is either wholly
or signiicantly dependent for their livelihood
on some form of farm activity—be it crop,
agriculture, horticulture, animal husbandry
or isheries. With low levels of infrastructure
and human development and in a context
replete with inequalities and uncertainty,
rural India views its future transformation
with both hope and trepidation. Expansion of
farm incomes is still the most potent weapon
for reducing poverty. Non-farm income
opportunities such as post-harvest opera-
tions, maintenance of farm equipment, etc.
offer a virtuous cycle connecting expansion of

Potential and Possibilities for Livelihood of the Poor 163
farm activity to that of rural non farm income
opportunities.
Ministry of MSME, Development
Commissioner (SSI), various boards of
handlooms/handicrafts/coir/sericulture,
Government of India, Khadi and Village
Industries Commission (KVIC), Small
Industries Development Bank of India
(SIDBI), NABARD, banks, etc., are all
engaged in implementing a range of inan-
cial and promotional schemes, services and
incentives that enhance the development of
MSMEs on ground.
Potential of agro AMD food processing sector for livelihood
India currently produces about 50 million
tons of fruit, which is about 9 per cent of the
world’s fruit production and 90 million tons
of vegetables which is approximately 11 per
cent of the world’s production. However,
only 2 per cent of fruits and vegetables
produced in India are processed, which is
extremely low as compared to countries
like USA, China and others. Lack of proper
processing and inadequate storage of fruits
and vegetables result in huge wastage. A
recent study by the Central Institute for
Post-harvest Engineering Technology
(CIPHET) in 2010 has assumed that post-
harvest losses of agricultural products in
India amounts to `440 billion annually. It
is estimated that the income of farmers and
rural workers increases by 100–200 per cent
when a food processing project is established
in a region and yield increases by 50–250
per cent. The potential for employment is
also high.
The food and drink industry is not only
of the largest employers worldwide, it has
an important employment multiplier effect.
For example, it is estimated that each job in
the European soft drink sector generates up
to ten additional jobs.
Numerous schemes have been initiated
by the government and other organizations
to support agro and food processing activi-
ties. These include the Ministry of Food
Processing Industry (MFPI), Agricultural
and Processed Food Products Exports
Development Authority (APEDA), Ministry
of Agriculture, National Horticulture Board
as well as banks like SIDBI and NABARD.
MFPI’s inancial assistance includes schemes
for technology up gradation, human
resource development, quality testing, R&D,
TQM, backward and forward integration,
development of infrastructure including
food parks, cold chains, etc.
Prospective sub-sectors: Growth vis-à-vis employment
According to Confederation of Indian
Industries (CII), sub-sectors that offer
the best prospects from the employment
perspective are retailing, leisure, travels,
tourism, hospitality, health care, apparels,
telecommunication and IT-enabled services
and food processing. Other employment-
oriented sub-sectors include beauty culture,
auto repairs, gems and jewellery, and enter-
tainment. A study on Indian Labour Market
(ADECCO Institute and Tata Institute of
Social Sciences, 2009) by Adecco Institute
and Tata Institute of Social Science identiies
ive sub-sectors as the most promising from
the perspective of growth and employment
in the years ahead. These are: IT industry
(IT workforce is estimated to increase to 30
million by 2020); telecom (estimated 10-fold
increase in broadband and phone subscrib-
ers); health care (likely to be 40 million by
2020); infrastructure and retail. To quote a
research paper titled ‘Youth Employment
and Unemployment in India’ by S. Mahendra
Dev and M. Venkatnarayan of Indira Gandhi
Institute of Development Research (2011),
Joblessness (27%) is much more than unem-
ployment (an absolute number 203.6 mil-
lion). 89% of youth have not taken any kind
of vocational training and, among the rest,
half of them have received through hereditary
practices. About 40% of youth population
are vulnerable. They include 11% of work-
ing poor, 4 per cent unemployed and 25%
not seeking any job. 26% of youth employed
suffer from poverty. Unemployment of youth
is only one of the problems of youth in labour
market. Since many of them are in the informal/

164 STATE OF INDIA’S LIVELIHOODS REPORT 2012
unorganized sector, the income, productivity
of workers, and conditions of work and social
security have to be improved.
Under NRLM, Bihar is one of the few
states that has prepared a State Programme
Implementation Plan to unlock the liveli-
hood potential of various sectors. IL&FS
Cluster Development Initiative has pre-
pared a detailed project report for opera-
tionalzing the Agribusiness Infrastructure
Development Investment Program Phase
II in the states of Biharin March 2010 for
the Asian Development Bank (ADB). This
report suggests a hubs-and-spoke model for
harnessing the identiied potential of sub-
sectors in various districts (see Box 7.2).
Union budget: 2012–2013 announcements and livelihood prospects
1. The Union Budget has identiied pri-
orities that will go a long way in imple-
mentation of livelihood promotion
To quote the report ‘Food Processing in
Bihar: The Road Ahead’ by IL&FS, prepared
for the Government of Bihar, ‘the state is
now uniquely positioned to utilize its rich
untapped natural resources such as fertile
soils and abundant water. Water, the life line
in agriculture, is abundant in Bihar and the
real issue is not availability but management’.
Vision 2015 of the state envisages tapping the
untapped potential of Bihar’s agriculture sec-
tor through accelerated development of food
processing industry by following strategies:
l Develop and strengthen region-speciic
supply chain infrastructure and linkages.
l Increase processing, reduce wastage and
ensure value addition in perishables like
fruits, vegetables, meat, ish and poultry.
The state will target to reduce wastage by
about 15 per cent, increase processing
from present negligible levels to, at least,
10 per cent.
l Provide capacity-building facility to
upgrade the skills of stake holders in the
industry.
l Focus on formation of producer groups/
companies as per State Perspective
Implementation Plan (SPIP) under
NRLM.
It is envisaged to first develop livelihood
groups (producer groups) and then fed-
erations (producer companies/cooperatives),
deriving membership from the base unit via
SHGs. The livelihood groups would be pro-
vided support through customized training
at village and block levels. Linkage of these
groups to the commercial sector would be
facilitated. The producers groups will facili-
tate (a) purchase or procurement of inputs,
(b) local processing and storing of inputs
and outputs and (c) marketing and selling of
produce. A collective approach will provide
them bargaining power with large traders in
the value chain of the livelihood sector/sub-
sector/commodities. The project managers/
facilitators would develop an appropriate
package of best practices and handhold the
producer groups to adopt suitable practices
through technical assistance. The National
Commission on Farmers has concluded that
Bihar and eastern India present uncommon
opportunities for becoming another ‘fertile
crescent’, even as the present fertile crescent
(comprising Punjab, Haryana and western
Uttar Pradesh) has reached a state of eco-
nomic and ecological distress.
Source: The box item refers to 3 study
reports: (1) ‘Final Report-Operationalizing
the Agri-business Infrastructure Business
Investment-Phase II-Bihar(March 2012)’,
prepared by IL&FS Cluster Development
Initiative, New Delhi for Asian Development
Bank (ADB); (2) ‘Food Processing in Bihar:
The Road Ahead’ (April 2007), prepared
by IL&FS for Government of Bihar and (3)
‘State Perspective and Implementation Plan
(SPIP), Bihar (2011-12- 2021-22)’, prepared
by Jeevika Rural Livelihood Promotion
Society, Patna for Department of Finance,
Government of Bihar, Patna and Ministry of
Rural Development, New Delhi.
Box 7.2: NRLM Bihar: Strategies for harnessing livelihood opportunities

Potential and Possibilities for Livelihood of the Poor 165
interventions, if implemented scrupu-
lously. These include: improvement
of delivery system, governance and
transparency, streamlining and reduc-
ing the number of central sponsoring
schemes, strengthening central plan
monitoring and directing efforts for bet-
ter targeting and leakage-proof delivery
of subsidies, etc. A speciic initiative and
scheme announced in the Budget that
will impact livelihoods of the poor is the
nationwide rolling out of mobile-based
Fertilizer Management System (mFMS)
that envisages providing end-to-end
information on the movement of ferti-
lizers and subsidies, from the manufac-
turer to the retail level, beneitting 120
million farmers.
2. Implementing handloom weavers’ coop-
eratives revival package.
3. Rationalizing the scope of various
missions for agriculture development,
e.g., National Food Security Mission,
National Mission on Sustainable
Agriculture including Micro Irrigation,
National Mission on Oilseeds & Oil
Palm, National Mission on Agriculture
Extension and Technology and National
Horticulture Mission Creating Public
Distribution Networks, National
Information Utility, computerizing
PDS, using the Aadhaar platform.
4. Rolling out multi-sectoral programmes
in selected high-burden districts, har-
nessing synergy across nutrition, sani-
tation, drinking water, primary health
care, women education, food security
and consumer protection schemes.
5. Establishing Bharat Livelihood Foun-
dation of India through Aajesvika to
support and scale up civil society and
interventions, particularly in the tribal
regions covering 170 districts.
6. Setting up sector-speciic skill communi-
ties under NSDC, and a separate credit
guarantee fund for improving low of
institutional credit for skill development
7. Enlarging the Aadhaar platform by
facilitating payment of wages, pensions,
etc., to the vulnerable sections of people,
directly to their beneiciary account.
The above interventions, coupled with
inancial inclusion-related proposals and
legal enactments including the proposed
Food Security Bill would create new
opportunities for livelihoods for the poor.
However, the extent of impact can only be
determined by the pace, quality and effec-
tiveness in implementation of the various
proposals.
Potential of various geographical regions
Potential of rain-fed livelihoods
Harnessing economically viable, socially
inclusive and environmentally sustainable
livelihood security and growth with opti-
mal management of land, water, forest and
social capital has been a major challenge
for all stakeholders of rural development.
Almost all forest areas, grazing/grasslands,
coast lands and dry lands, and 80 per cent of
hill horticulture are non-irrigated/dry land
areas. As much as 60 per cent of livestock
are raised in non-irrigated/dry land areas.
About 87 per cent of pulses and coarse
cereals, 77 per cent of oilseeds, 60 per cent
of cotton and 50 per cent of ine cereals are
produced in non-irrigated agro-climatic
regions. Sixty per cent of rain-fed agriculture
supports only 40 per cent of the population,
contributing 40 per cent of food grain pro-
duction. Yet, it is imperative that rain-fed
areas contribute signiicantly to maintain
our food security as the yields from irrigated
agriculture is plateauing and the possibility
of bringing more areas under assured irriga-
tion is reducing. In contrast, the economy
of the region is complex, diverse risk-prone
and under-invested. With low productivity,
the livelihood of the tribals, landless, asset
less, small and marginal farmers of the
region is highly vulnerable. Notwithstanding
these limitations, there is a vast range of
possibilities for permutations and combina-
tions of farming systems, keeping in view

166 STATE OF INDIA’S LIVELIHOODS REPORT 2012
regionally differentiated socio-economic
conditions, demands, market linkages and
availability of natural resources.
Some sub-sectors that have excellent
prospects and opportunity for livelihood
promotion in this region are milk produc-
tion (collection, processing, marketing and
servicing on the lines of National Dairy
Development Board [NDDB]), and minor
forest produce (processing, value addi-
tion and marketing of forest produce like
oilseeds, tamarind and medicinal plants).
It is widely accepted that the watershed
approach is the best way for development
of rain-fed areas as it creates favourable
conditions for risk reduction and productiv-
ity improvement. Multiple ministries and
agencies are engaged in implementation of
watershed projects. The National Rain-fed
Area Authority has been introducing liveli-
hood perspectives in their programmes,
emphasizing on capacity building, moni-
toring and evaluation, learning and social
audit. A participatory approach encouraging
community to share in planning, implemen-
tation and monitoring is key to the success
and sustainability of such programmes.
Rain-fed zones, watershed areas, dry lands,
hilly tracks, etc., are the testing grounds for
bankers and development agencies who
promote microinance, micro-enterprises
and livelihoods.
The major challenge lies in developing
dry land farming that covers two-thirds of
rural India, creating an enduring value chain
and sustaining livelihoods. D. Subba Rao,
RBI Governor, in an address on agri-credit
(Reserve Bank of India, 2011) says:
There is also need for more robust weather
insurance and agricultural extension services
to target diversiied livelihood options in the
rain-fed areas. As appraisal and disbursement
of credit for rain-fed agriculture requires a
different orientation and approach, there is
also a need to design innovative credit prod-
ucts. Such products would help in building
the conidence of bankers in rain-fed agri-
culture, and would also ensure the inancial
and economic inclusion of the vast majority
of small and marginal farmers from these
areas. Clearly, improving the performance
of agriculture is key to our quest for inclusive
growth and poverty reduction.
Forest-based livelihood prospect: Unlocking forest values for forest dependent people
Scope and strife
Twenty-two per cent of India’s total territory
comprises forest covered areas. While many
communities depend on forest resources
for their livelihoods, over 60 per cent of the
tribal people live within 5 km of the forests.
Increased ease of access and governance of
natural resources, particularly forests across
states and at the national level, have been
issues of concern. Tribal communities’ cus-
tomary rights over land, mines, forests and
water have suffered due to unsustainable
extraction of resources by government and
private companies, leading to destruction of
ecology, environment and their livelihoods.
Loss of access to natural resources coupled
with incidences of displacement from their
land due to mining and other development
projects have adversely affected the cultural,
social and economic life of the tribal com-
munities. The Recognition of Forest Rights
Act 2006 that came into force in December
2007, marks a radical departure from exist-
ing forest legislation and aims to provide
a framework that vests forest rights with
forest-dwelling communities and also to
foster a new forest conservation regime.
The provisions of the Act are perceived dif-
ferently by different people. Tribal rights
activists perceive it as an overdue instru-
ment of justice; environmentalists, on the
other hand, perceive serious ecological fall
outs, with the potential threat of rampant
deforestation. However, it is expected that
ownership rights will give communities the
much-needed impetus and responsibility
to protect forest resources and enable their
participation in conservation efforts, as
envisaged in the Act. Tribal welfare and for-
est conservation can be viewed, therefore, as
complementary goals. Against this scenario,

Potential and Possibilities for Livelihood of the Poor 167
several initiatives are under way that aim at
reducing the pressure on forest resources
by creating new livelihoods opportunities,
enabling communities to shift to more sus-
tainable income-generating activities.
Supportive programmes and strategies for forest dwellers’ livelihood
Several NGOs and development agencies
like PRADAN, Bharatiya Agro Industries
Foundation (BAIF) and Access have
been working with this segment of poor,
towards providing sustainable livelihood
opportunities.
PRADAN’s forest and tree-based live-
lihoods interventions in Jharkhand and
Odisha comprise ‘tussar’ cocoon produc-
tion, ‘lac’ cultivation and production and
trading of ‘siali’ leaf plates, among other
farm forestry activities. About 5,000 families
have been involved in these activities, as a
part of their programme on natural resource
management. Various government authori-
ties like Ministry of Rural Development,
Department of Agriculture, Ministry of
Textiles, as also a number of resource insti-
tutions such as the Central Silk Board and
the Indian Lac Research Institute have been
associated with the implementation of this
programme.
Access Development Services is currently
implementing three forest-based projects
in Madhya Pradesh and Rajasthan. Its
NTFP Rural Livelihoods Project, Madhya
Pradesh, focusing on tribal communities,
aims to enhance revenues from NTFP, to
reduce impact on forest resources by way
of adding value to the produce, to enhance
productivity and provide a minimum of
500 NTFP producers with more nego-
tiation power in the market through their
consolidation in a Producers Company.
Their capacity-building for the Community
Forestry Project in Madhya Pradesh aims
to augment income from NTFP of a
minimum of 200 households from for-
est dependent communities, by adopting
more sustainable activities. The Sustaining
Tigers in Ranthambore (Rajasthan) through
Innovative Poverty Eradication Solution
aims to improve sustainable livelihood of
500 households, through tourism promo-
tion and agriculture.
BAIF has been deeply involved in promo-
tion of the Wadi (small orchard) approach
for over two and half decades. In this
approach, tribal and backward communities
are facilitated to build sustainable livelihood
through a multi-disciplinary approach—
tree plantation, agriculture in inter-space
and other supplementary activities. BAIF has
done pioneering work in Wadi promotion,
initially implemented in Maharashtra and
Gujarat under the KFW-NABARD assisted
Adivasi Development Programme (ADP).
The Wadi Approach has been replicated by
NABARD in its Tribal Development Fund,
based on successful ADP since 2003–2004.
In this expansion phase, sustainable and par-
ticipatory livelihood programmes are sup-
ported, encompassing agriculture, organic
Wadis/mixed Wadis, soil conservation,
water resources development. These and
other supplementary measures are aimed
at economic upliftment, social empower-
ment, improvement in quality of life includ-
ing health, and women empowerment in
tribal dominant areas of the country. Thus,
there is immense scope and possibilities
for strategies and programmes that aim to
provide alternative livelihood opportunities
by reducing pressures and maintaining/
sustaining ecological balance.
Potentials and perspectives of North Eastern Region (NER)
Unique features and complexity of issues
It is a fact that North Eastern India, com-
prising seven states, has valuable natural
resources—it hosts species-rich tropical
rain forests and supports a diverse lora
and fauna. The large reserves of petroleum
and gas in the region constitute a ifth of
the country’s total potential. Industrial raw
materials such as coal, hydrocarbons and
mineral resources such as thorium, lime-
stone, etc., are also available in abundance.

168 STATE OF INDIA’S LIVELIHOODS REPORT 2012
There is a fascinating variety of socio-
cultural, ethnic and linguistic diversity in
the region, with more than 200 dominant
tribes and many sub-tribes relecting the
complex social structures. Notwithstanding
the potential, the poverty rate in the region
is significantly higher than the national
average and lack of development plagues
the region, despite the inancial assistance
extended by the Government of India.
The absence of basic infrastructural
facilities is a major constraint to the pro-
motion of entrepreneurial ventures in the
region. This is compounded by protracted
civil unrest/insurgency in many parts of the
region. A lack of enterprise and decline in
community income generation has resulted
in large-scale migration of youth to cities
and other urban areas within and outside
the region. This further compounds the
labour-intensive requirement of most
agricultural practices in the hilly regions.
Moreover, poor market access and oppor-
tunities for value addition for cash crops
and locally abundant horticultural crops
hinder any possibility of tapping alternative
sources of income. Government authorities
are the largest employers, but such jobs
are drying up. Private sector employment
opportunities are very scarce in the organ-
ized sector. Although the youth in the NER
are comparatively more educated compared
to the rest of India, they lack technical and
employable skills. There is a perceived need
to increase and diversify sources of income
at the community level, as this would help o
arrest migration and reduce dependence on
the government. This change can be brought
about by the revival and strengthening of
traditional institutions for better manage-
ment of resources and for building peace
and development in the region.
Traditional agricultural practices in NER
NER has common characteristics—hilly ter-
rain, a fragile eco system, tribal population,
biodiversity, forest resources, traditional
and customary approach in agriculture,
low productivity, rural poverty and poor
infrastructure. The subsistence farming
traditionally practiced in the region is slash-
and-burn agriculture, locally called jhum
cultivation. Jhum cultivation is the pre-
dominant system of land use in the upland
areas of Manipur, Meghalaya, Mizoram and
Nagaland—19 to 45 per cent of the forest
area is under jhum cultivation. This system
is akin to community farming without
heritable rights over the lands. Due to loss
of traditional jhum land to commercial tree
plantations, and population pressures, the
land available for cultivation has declined
and jhum, a sustainable form of agriculture
for many centuries, is no longer able to meet
the needs of households. In many areas the
jhum cycle has reduced drastically, leaving
little time for soil regeneration. A combina-
tion of traditional ecological knowledge,
resource management and practical expe-
rience of farming community has been
applied for many years in biodiversity con-
servation in the region—these same tools
can be utilized as a useful guide to develop
solutions for land use and management and
livelihoods path.
The crucial role of tribal communities in
the developmental process of the region has
been recognized by government authorities.
Traditional structures like Village Councils
can be used to secure the participation and
involvement of people in development
efforts. These Councils provide a point of
contact between Government and people.
Village Development Board in Nagaland
represents a decentralized form of planning
and devolution of powers at the village and
grass roots level. Traditional institutions
like Kukis in Manipur, Nakma, Akhing
(the female’s decision-making power in
forest land used by the matrimonial tribe)
in the Garo hills of Meghalaya, signify the
force and validity of local customary laws.
In Meghalaya and Tripura 90 per cent of
forest land is controlled by local community
institutions, while in Assam and Tripura
it is 30–40 per cent. District Councils and
local government institutions in Assam,
Meghalaya, Tripura and Mizoram usually
Potential and Possibilities for Livelihood of the Poor 169
have a crucial role in natural resource man-
agement, use of forest land, and regulation
of jhum.
Possibilities for livelihoods in NER
The Government of India through the
Ministry for the Development of NER
(DONER) has initiated the North East
Rural Livelihoods Project (NRELP) for
four NER states, viz., Mizoram, Nagaland,
Sikkim and Tripura. Implementation is
proposed in two districts of Mizoram,
Nagaland and Tripura and three districts
of Sikkim, in order to increase and sustain
income of the poor, especially women.
The NRELP focuses on supporting various
livelihoods activities from the lower-level
SHGs to higher-level federations in the
proposed districts. Agriculture, piggery,
poultry, dairy, ishery, etc., are the predom-
inant means of livelihood in the region.
The rural population in these identiied
districts are highly vulnerable due to the
fragile landscape and natural resources of
the area. Some of the donor-driven liveli-
hood programmes have been aimed at
bringing alternative means of livelihoods
in the region. For instance, International
Fund for Agriculture Development (IFAD)
implemented Livelihoods Improvement in
the Himalayas (1999–2012) with a view to
helping vulnerable groups in the rugged
highlands improve their livelihoods and
develop alternative means for increasing
their income in the remote and underde-
veloped districts of Meghalaya. The NER
Community Resource Management project
in the upland areas(1999–2016) is aimed at
improving sustainable livelihood opportu-
nities of vulnerable groups by introducing
them to improved land management prac-
tices that preserve the ecological balance
of the region and create better options for
poor farmers—more sustainable farming
practices, water conservation and crop
diversification. Livelihood programmes
and strategies should capture ground
realities and be built upon the following
premises:
1. Build on locally available knowledge,
customary practices and resources.
2. Enlist Government facilitation for mar-
ket access.
3. Establish partnerships with local com-
munity.
4. Empower the community to raise its
resources Preserve balance in natural
resources and environment.
Potential of cluster development approach
Initiatives of development agencies
The Cluster Development approach has
been recognized as the most inclusive,
sustainable and integrated way for devel-
opment of micro and small enterprises,
poverty alleviation and livelihood enrich-
ment. This approach is as per recommen-
dations of the Expert Committee on Small
Enterprises (Abid Husain Committee
1997), and is driven by the persistent ini-
tiatives and support of global agencies like
United Nations Industrial Development
Organization (UNIDO), International
Labour Organization (ILO), United Nations
Development Programme (UNDP), etc.
Positive outcomes have been noted in most
developed and developing countries.
Besides international agencies, several
ministries of the Government of India and
state government departments have intro-
duced sector-speciic schemes that promote
cluster development:
1. Developmental and financial agen-
cies like State Bank of India (SBI),
SIDBI, NABARD, KVIC, Rural Non
Farm Development Agencies (RUDA),
Confederation of Indian Industry (CII)
and IL&FS have been involved in cluster
promotion.
2. The Government of India introduced
the National Programme on Rural
Industrialization (NPRI), aiming to
develop 100 rural clusters every year,
starting from 1999 to 2000.
3. NABARD has reported that as on 31
March 2012, it has supported 120

170 STATE OF INDIA’S LIVELIHOODS REPORT 2012
clusters (100 for handlooms and handi-
crafts) across 110 districts in 22 states.
4. UNIDO has been assisting the GOI and
other leading development organizations
signiicantly for qualitative development
of various clusters across the country.
5. The Ministry of Micro, Small and
Medium Enterprises, Government of
India, has been supporting Schemes
of Fund for Traditional Industries
Regeneration (SFURTI) under which
KVIC and Coir Board will promote 100
clusters.
6. The Ministry of Textiles, Office of
Development Commissioner has been
implementing the Integrated Handloom
Cluster Development Approach
Programme, focusing on formation of
viable weaver entities.
7. The Mega Cluster Approach under the
aegis of Development Commissioner,
Handicrafts, Government of India, was
utilized to scale up the infrastructural
and production chain at handicraft
clusters through Baba Saheb Ambedkar
Hastasilpa Vikas Yojana (AHVY)
8. Ayurveda, Yoga, Naturopathy, Sidh and
Homeopathy (AYUSH) industry has
an annual turnover of `50,000 million,
and is dominated by MSMEs (about
80 per cent) in identiied geographical
clusters.
Thus, by virtue of various initiatives, clusters
have been developed in the country under
three broad categories—high tech clusters
(IT, IT-enabled services, etc.), traditional
manufacturing clusters, and low technolo-
gy-based poverty intensive microenterprises.
Varying degrees of success has been achieved
in the programmes cited above.
Challenges in cluster development approach
The cluster approach, which was focused on
in the Eleventh Five year Plan, has contin-
ued validity and relevance for its livelihood
enhancement prospects. In view of the
limitations of artisans, small entrepreneurs
and asset-fewer people, their participation
within clusters promotes sustainable liveli-
hoods. Common sets of skills, challenges
and opportunities can be leveraged under
integrated development programmes. These
include (a) similarity or complementarity in
the methods of production, quality control,
testing, energy consumption and pollution
control, (b) similar level of technology and
marketing strategies/practices, (c) channels
of communication among the members of
clusters.
The cluster approach targets for a cost-
effective production strategy, saving in raw
material procurement by following mass-
purchase policies, technology innovation,
product diversiication, exploration of new
markets, establishment of common facilities
centres, etc. Clusters in rural areas and small
towns, however, face numerous challenges
such as upgradation of product quality,
access to wider markets, multi-skilling
labour, access to inancial services, adequate
business infrastructure and protection of the
environment. The convergence of support
by using high-end development profes-
sionals to build up local capabilities at the
technical and managerial levels is a necessary
condition to harness the positive potential
effect of rising new market forces. New
forms of partnership between producers
and organized marketing companies need
to be supported with development funds,
encouraging producer groups to enhance
their capabilities in order to meet rising
demands of quality, timely delivery, designs
and production management system. The
development of these locations should be
linked with the district planning process to
ensure that it includes the local knowledge
and wisdom for development of the sectors.
The technological dynamics, combination
of protection and promotional measures,
and innovative methodologies under the
cluster approach can trigger and transform
livelihoods. Sub-sector clusters with a high
prevalence for speciic economic activity can
be chosen for further intervention. Clusters
can be identiied that represent diversity of

Potential and Possibilities for Livelihood of the Poor 171
socio-economic groups, agro-climatic con-
dition and level of backwardness.
Prospects of integrated cluster development schemes
In the traditional sector, particularly in the
handloom sector, ongoing integrated cluster
development projects have the potential
for signiicant promotion of livelihoods.
Weavers can be given the latest designs as
per industry needs, through net working
with industry, and these products can be
supplied to the big marketing chains. Ways
and means should be found to develop
and use technology that its into the rural
environment, leading to value addition and
employment generation. In order to achieve
this, it is important to understand each stage
of the value chain, with the clear objective of
exploring ways to tweak the same in order
to enable employment generation in rural
areas (see Box 7.3).
Livelihood prospects of various sub-sections of poor
Ultra poor
Considering the magnitude, complexity
and diversity of livelihood issues of the
ultra poor and vulnerable tribal groups,
migrant labour, and single women—they
have only lately received the attention of
policy-makers and promoting agencies.
The issues include identiication of house-
holds, designing capacity-building mecha-
nism and support schemes, availability of
resources, and institution-building for
handholding/facilitating their livelihood
promotion. Some institutions that have
addressed these issues and gained useful
experience are: Aga Khan Foundation’s Aga
Khan Rural Support Programme (AKRSP),
India, for vulnerable tribal groups, Aajeevika
Bureau for migrants, Trickle Up for single
women, Yuva for destitute single women in
The dry land farmers of Lakkanahalli and
surrounding areas in Karnataka have found
an alternative way of generating income
through natural ibre cluster products. Due to
the initiative of IDF, an NGO in the area, this
approach has helped the farmers market their
produce, sharpened their entrepreneurial
abilities and reduced migration.
Dubai Shankaramma, from the cluster, says
We have some hopes now. We need not migrate to
cities now for those two square meals. Five years
ago, we hardly used to get wages 60 to 70 days in
a year. Now, we have our own place and get wages
250 to 300 days. Our earning has increased from `25 per day to `80–150 now. Earlier Davangere,
at best, was the biggest city we ever saw in awe.
Now, we have visited many cities. I am now called
Dubai Shankaramma. Others have visited Delhi,
Mumbai, and Bangalore several times. We can
afford to have our dreams. And we are conident
that we can realize these small dreams.
The new found conidence of women is
born, not just from economic power, but
also due to social empowerment, bringing
an indirect impact on agricultural economy
and local infrastructure. The banana
farmer no longer sells the banana stem
free. Now, the women need to buy these.
After extracting the ibre, the waste is now
being composted as the value of vermin-
composing is known in the village. Due
to development of the village as a cluster,
unemployed youth have found viable self
employed ventures, running regular auto-
rickshaws, setting up telephone booths,
small eateries and kiosks, etc.
Traversing along with the poor women
in this journey of exploring sustainable
livelihoods, IDF-Gramya and other associated
supporting institutions are helping to address
the institutionalization of group enterprise
and community ownership of various spheres
of entrepreneurial activities, especially the
iner nuances of niche and distance marketing
of products, inancial risk management and
robust integration of cluster working as
contemporary activity with the culture of dry
land farming.
Source : Shrikanth Shenoy TV, ‘Rural
Livelihood-Vale Chain’ in LEISA INDIA.
Box 7.3: Rural livelihoods—use of value chains: Natural ibre cluster

172 STATE OF INDIA’S LIVELIHOODS REPORT 2012
slum areas, etc. Challenging the Frontiers
of Poverty Reduction-Targeting Ultra Poor
(CFPR-TUP) programme was pioneered by
BARC in Bangladesh. In India, Bandhan,
a Kolkata-based MFI launched Targeting
Hard Core Poor (THP) programme in
Murshidabad district of West Bengal.
In 2010, Centre for Media Freedom and
Responsibility (CMFR) did a survey on
the impact of the programme and reported
positive results: increased productivity,
increased household food consumption,
larger asset-base, better food security, etc.
Institutions have tried various approaches
for developing institutional structure,
such as intensive counselling, imparting
new skills, extending need-based services
and evolving suitable livelihood options
However, lexibility in approaches, intense
engagements and patience are the key fac-
tors for positive results. Most ultra-poor
groups need interventions across multiple
areas including livelihoods, health care
and inancial literacy. Replication of the
strategies and programmes is possible
only after contextualizing the same to local
needs. There is an increasing realization of
emerging multi-dimensional needs of such
ultra poor by various development agen-
cies, bringing to the fore a possible thrust
of efforts in new directions.
Women’s livelihoods
The livelihood activities pursued by women
are transforming in recent years. Considering
the increasing role of women in farming
activities, the Women Farmers’ Entitlement
Bill is under consideration in Parliament,
as discussed in the earlier chapter. Various
studies reveal that women are pursuing
multifarious economic activities in various
secondary and tertiary segments—basket-
making, rope-making, leaf-plate-making,
fruit/vegetable-selling, dal (pulses) crushing,
papad-making, agarbatti-making, khadi,
handloom, powerlooms, etc. Livestock-
related activities pursued by them include
milch animal rearing, goatery, piggery, etc.
The new activities that women are taking up
include stitching and cutting, embroidery,
weaving appliqué, carpet-making, blanket-
making, etc. The contribution of women
to industry and the economy cannot be
under-estimated, the agarbatti industry
being a case in point: National Council
of Applied Economic Research (NCAER),
in its study, has observed that the value
of agarbatti industry, that predominantly
employs women, is placed at `18,000
million, the rate of growth is 20 per cent
on an annual basis, and one-ifth of the
production is exported. Another example
is rice cultivation, the most important agri-
cultural operation in the country, not only
from the point of food security but also in
terms of livelihoods. Women are increas-
ingly involved in SRI cultivation in paddy,
particularly in eastern India. Promotion of
System of Rice Intensiication (SRI) is an
activity that strives to optimize productivity
and therefore income.
In all these interventions, women need
institutional, technical and infrastructural
support. Mahila Kisan Sashaktikaran
Pariyojana (MKSP), the subcomponent of
NRLM envisages addressing speciic needs
of women farmers and their socio-econom-
ic-technical empowerment. The scope of the
scheme is being expanded to NTFP, isher-
ies, dairy and livestock. Since more women
than men tend to be employed in fragile
non-permanent contracts, they are more
vulnerable to being laid off in conditions of
declining demand or other dificulties faced
by employers. Increase in gender gap in
wages does arise in an unemployment situ-
ation. In all livelihood programmes, gender
dimensions should be given due focus and
their speciic needs should get attention. In
all SHG-centric programmes, women are in
the forefront (see Box 7.4).
Pillars of effective livelihood promotion strategy
Institution-building for livelihoods
Appropriate institution-building is of key
importance to ensure hand holding, skill

Potential and Possibilities for Livelihood of the Poor 173
development, technical guidance, business
development services, counselling, etc., in
livelihood activities. The Government of
India’s many livelihood programmes also
focus on the institution-building aspect.
Yet, the eficacy, quality and sustainability
of these efforts continue to be the major
challenge. For instance, in case of SGSY and,
subsequently, NRLM, it was envisaged to
set up 500 Rural Self Employment Training
Institutes (RSETIs) all over the country
during the period 2007–2008 to 2011–2012,
on the pattern of Rural Development
and Self Employment Training Institutes
(RUDSETIs). As on 31 December 2012,
509 RSETIS had started functioning (295
funded by the Government of India). In
order to bring uniformity in training across
all RSETs and inculcate the spirit and ethos
of the RUDESTI model, a Memorandum
of Understanding (MoU) was signed with
the National Academy of RUDSETIs on
29 July 2011. The MoU envisaged uniform
training and capacity building of directo-
rates and faculties of RESETS, followed by
close mentoring and monitoring of RSETS,
so that by the third year of operations these
RSETS would perform at the level of best
performing RUDSETIs. However, RSETS, as
they stand today, are nowhere near achiev-
ing the quality, effectiveness and ethos of
RUDSETIs. RSETS should be rejuvenated
to fulil the envisaged vision.
Skill development
In recent years, many important initiatives
have been taken in the ields of education,
training, skill development and counsel-
ling. These include: Right to Education
Act 2009; constitution of National Council
for Skill Development by the Government
of India in 2008; policy and promotion
focus under the auspices of National Skill
Development Corporation(NSDC); PPP
in skill development; setting up of ’sector
skill councils’; AISTCI–NSDC partner-
ships with focus on identified priority
sectors for spreading quality skill devel-
opment and training through Common
Service/Vocational/Skill Resource Centres;
reform in higher secondary/higher educa-
tion, etc.
While these are good steps in the right
direction, the challenges are (a) sustain-
ing dynamism, quality and equity in the
endeavours; (b) using local resident skills
for designing, executing and maintenance
of rural infrastructure; and (c) ensuring par-
ticipation of community and community-
based organizations (unorganized sector) in
the whole process. In the traditional farm
sector, the younger generation of upper and
middle class is shifting to emerging remu-
nerative jobs. New technologies and service-
based activities require new skills. Multiple
skills are required for large infrastructure
development. With the focus on low cost
‘Pashu Sakhi’ is a semi-literate or literate
woman in the village who trained and sup-
ported in ield, disseminates appropriate goat
management practices, ensures preventive
health care of livestock and undertakes irst
aid services to ailing goats. The hallmark of
the Pashu Sakhi (livestock nurse) system is
that she delivers such services at door step,
well-on-time, at irst symptoms, within low
cost and with a women-friendly approach.
Source: Pashu Sakhi (Livestock Nurse) con-
cept is based on successful effort undertaken
by Ibtada (a Rajasthan-based NGO) in the
beginning and replicated by 26 NGOs across
the country, for putting rural women in the
frontier role of livestock primary health care
and door step extension services. The Goat
Trust has pioneered/facilitated populariza-
tion of the concept, which has been explained
in the website www.goattrust.org. The Goat
Trust was registered as a charitable trust (in
2008 at Lucknow) to promote small livestock-
based livelihood. The Goat Trust has been
publishing awareness literature/web-based
information on livestock including Pashu
Sakhi model. Available at ww.goattrust.org
Box 7.4: Pashu Sakhi (livestock nurse) model

174 STATE OF INDIA’S LIVELIHOODS REPORT 2012
and competitive edge, the manufacturing
sectors will need to procure skilled per-
sonnel (skilled workers, good supervisors
and managers) from rural or semi-urban
areas. Given the numbers of technical
graduates every year, there is huge scope
for innovation and employment in new
areas. The rapidly changing parameters in
the economy—needs, technology, income
levels and environment—means that the
year(s) ahead is likely to witness paradigm
shifts in skill development, employment
and social inclusion interventions.
Entrepreneurial culture
A possible strategy for promotion of the
rural non-farming sector is to focus on
building an entrepreneurial culture among
rural youth. This can be developed through
a dynamic skill development process, pro-
viding marketing, technology and brand
(MTB), integrating producers and consum-
ers through fairness—lexibility, managing
conundrum and coordination between
producers, policy-makers and sectoral
associations, etc. Development agencies
could help in this purpose by strengthen
tie-ups with International Training
Institutes (ITIs), Skill Development Centres
and Polytechnics/Vocational Colleges.
The National Vocational Qualification
Framework (NVEQF), commencing from
2012 to 2013, provides vocational educa-
tion in polytechnics, engineering and other
colleges, and can be a major change setter.
A worthwhile strategy to build livelihoods
in the non-farm sector could be to harness
the untapped potential of school drop-outs
(2.1 million every year) by providing them
vocational education.
Livelihood enhancement through aggregation: Challenges
The enhancement of livelihoods for a
large number of the small and marginal
necessitates serious efforts at aggregation.
The process of aggregation in both farm
and non-farm has been difficult due to
non-availability, inaccessibility and non-
affordability of basic ingredients. In the irst
instance, organizing individual persons with
a common produce/product/service into a
collective, then capacity-building, creating
awareness and working out synergies that
will sustain bondage, needs rigorous social
mobilization. Second, management of pro-
ducers’ collectives would require competent
professionals, the services of value chain
experts and activity-speciic specialists. In
addition, there is the challenge of entering
an existing market chain or creating alterna-
tive chains. All the processes/arrangements
involve not only high cost but also high
risk as irst generation producer organiza-
tions would need inancial support and risk
guarantee arrangements. Two ways to help
the process could be: (a) enhance awareness
about the need and methods of inancing
these institutions and (b) incentivize the
inancing institutions. It is, therefore, better
to deal with products and services that are in
demand to promote aggregation, as creat-
ing demand and markets for new and/niche
products are costly and require greater/
sophisticated management intervention.
Technology in livelihoods
The importance of using Appropriate
Technology in farm and non-farm activities
is well recognized. It adds values in terms
of pace and quality of livelihood pursuits,
productivity, and sustainable income
and employment. The Indian Council of
Agricultural Research (ICAR) has developed
a large number of technology-based model
activity-proiles. However, transfer, appli-
cation and replication of such models are
a challenge. Krishi Vigyan Kendra (KVK),
Agriculture Technology Management
(ATMA), etc., can play a useful role in this
direction.
The International Crop Research Institute
for the Semi-Arid Tropics (ICRISAT) in
partnership with the national agricultural
research system in the country and Asia,
i.e., the Central Research Institute for Dry
Land Agriculture (CRIDA), the National
Remote Sensing Centre (NRSC) and State
Agricultural Universities among others, has
been directing efforts towards enhancing

Potential and Possibilities for Livelihood of the Poor 175
the productivity of rain-fed system through
application of scientiic tools.
Application of Geographical Information
System (GIS), remote sensing, etc., for
planning, implementation, monitoring and
evaluation of integrated watershed projects
is being advocated. Use of GIS for planning
of NREGS and other government-sponsored
government schemes can strengthen coor-
dination among departments and reduce
duplication of watershed development. It
may also be necessary for people and pro-
moters to have complete understanding
of the eco system. Accordingly, it may be
worthwhile to document indigenous knowl-
edge and refine/reintroduce it wherever
required. Technology, whether indigenous,
reined indigenous or modern, can aid liveli-
hoods in rain fed areas.
As stated earlier, Aadhar, the UID
project has the potential to transform rural
livelihoods, particularly those excluded
poor who reside in remote areas. ‘The
national optic fibre network project’,
underway in PPP mode, envisages connect-
ing Gram Panchayats with rest of the gov-
ernmental system, and is expected to open
up new avenues for delivery of services to
people, including e-governance. Mobile
services have already revolutionized rural
connectivity. This could be further leveraged
to bring live market prices of farm produce
and information on job opportunities into
the rural areas (see Box 7.5).
Programmes for livelihood promotion
Potential assessments under programmes
There are a large number of programmes
being implemented by GoI , State
Governments, donor agencies and develop-
ment agencies, with the objectives of poverty
reduction and livelihood promotion in dif-
ferent areas/regions/segments. However,
very few programmes take a holistic and
systematic approach in their design and
content while addressing the livelihoods
needs of the poor. Many schemes imple-
mented under the aegis of the Government
of India have national coverage and compre-
hensive processes and perspectives. These
include NRLM (Aajeevika), Integrated
Watershed Development Schemes, RKVY,
Mahatma Gandhi National Rural employ-
ees Guarantee Scheme (MGNREGS), etc.
Some of these programmes do attempt to
link the local potential with livelihoods of
the poor by conducting baseline surveys,
Livelihood 360 is an ambitious project
conceived by Naandi Foundation Team, an
NGO involved in agro-forestry. The project
has been conferred with the Vodafone
Mobile award, which is a part of Mobile
and Telecom International Congress 2012.
The award is in recognition of Naandi’s
innovative approaches to leveraging com-
monly available and affordable technologies
to solve complex programme management
challenges in rural and tribal regions in the
country. With this simple solution, a farmer
can use a mobile to know the exact price,
purchase, buy and and have full control of
his products, without the need to travel. This
is made possible because of accurate data
management, and monitoring of its digits
can be automated through this application.
This innovative application is ideal in the
rural context, since Naandi’s projects include
6,000 hectares of fruits, trees, coffee, etc., and
thousands of small producers in coopera-
tives are in need of more ways of rigorous
management.
Source: ‘The livelihoods 360 Technology
wins an Award in India’ in Livelihoods-Act
Today For Better. The news item describes
how ICT can accelerate development and
management of projects in rural areas and
cites the above award-winning Technology
of Naandi Foundation. Avaialbale at: www.
livelihood.eu. Last date of access: 13 October
2012.
Box 7.5: The livelihoods 360 technology wins award for innovative ICT in management of project

176 STATE OF INDIA’S LIVELIHOODS REPORT 2012
preparing perspective plans and adopting a
participatory approach. In addition to these
programme documents, the Five Year Plan
documents of the Planning Commission,
NSSO surveys, and the Economic Survey
by the Ministry of Finance, Government
of India, highlight the potentials in various
sectors/sub-sectors and regions that could
be harnessed for livelihoods promotion.
Donor agencies like the World Bank, IFAD,
Department of International Development
(DFID), etc., have compiled comprehen-
sive design documents on the livelihood
support programmes of their respective
region. These impact studies/review reports
on various schemes do bring out the critical
issues in livelihoods, the best practices and
possible replicable strategies.
Mahatma Gandhi National Rural Employment Guarantee Act (MGNREGA)
MGNREGA aims at enhancing livelihood
security of people in rural areas by guaran-
teeing 100 days of wage employment in a
inancial year (FY) and thereby developing
economic and social infrastructure in rural
areas. Under the scheme, `110,000 million
has been released as wage payments since
its inception in 2006. In 2010, about 11.55
million families, or nearly one in four rural
households, were provided over 2,500 mil-
lion person-days of work under this pro-
gramme. This mega scheme has the immense
potential of transforming rural India by
encompassing all poor (wage earners,
migrant labour and women) in all regions
including drought-affected, LWE-affected
areas. Evaluation studies have brought out
mixed results. On the one hand, there is
improvement of standard of living, seasonal
migration has been arrested, there is a steady
rise of real wages, etc. On the other hand,
there is delay in payment of wages, leakages,
hike in wage rates shortage of farm labour,
lack of asset creation, etc., that is reducing
the impact of the programme. Since the
basic premise of the scheme is to have con-
vergence with all other livelihood schemes
including NLRM, Pradhan Mantri Gram
Sadak Yojana (PMGSY), etc., the possibil-
ity of the programme impacting sustainable
livelihood hinges upon this convergence
and a partnership approach in implemen-
tation. MGNREGA, in its strategy, should
not be limited to providing short term and
adhoc wage employment; it should aim at
generating long term improvement of liveli-
hoods. Efforts need to be directed towards
minimizing distortions, by tightening
monitoring, vigilance and audit (concur-
rent, post-disbursement, Comptroller and
Auditor General [CAG] and social).
International donor agencies and livelihood promotion
International donor agencies like World
Bank, IFAD, DFID, Deutsche Gesellschaft
für Internationale Zusammenarbeit (GIZ),
Reditanstalt für Wiederaufbau (KfW),
UNDP, etc., are implementing/supporting
several rural inance, livelihood and poverty
alleviation programmes in the country.
Their participation in such programmes
has added value to livelihood promotion
strategies and has the prospect of bringing
new experiences, lessons and outcomes to
all other stake holders in future.
For instance, IFAD has been imple-
menting the Tejaswani Rural Women’s
Empowerment Programme in Maharashtra
(2007–2015), Women’s Empowerment
and Livelihood in Mid-Gangetic Plains,
Post-Tsunami Sustainable Livelihoods
Programme for Coastal Communities
(2004–2015), Orissa Tribal Empowerment
and Livelihoods Programme (2003–2013),
Mitigating Poverty in Western Rajasthan
Project (2008–2014), Priyadarshini (women
empowerment) Programme in Uttar
Pradesh, etc. These programmes, with a
focus on the poor, are broadly aimed at
increasing access to agri-technologies and
natural resources, and also access to inan-
cial services and value chains.
DFID has been involved in watershed-
based development, rural livelihood
programmes, tribal empowerment and

Potential and Possibilities for Livelihood of the Poor 177
livelihood programmes in several states.
They have been supporting Poorest States
for Inclusive Growth (PSIG) in four states,
i.e., Bihar, Uttar Pradesh, Odisha and
Madhya Pradesh, through SIDBI and other
partner agencies.
Under the GIZ-NABARD Rural Financial
Institutions Programme (RFIP), GIZ has
been providing technical support for capac-
ity-building of rural inance institutions,
Cooperative reform programmes, micro-
inance development including SHG–Bank
Linkage Programme (SHGBLP), and inan-
cial inclusion. Its support included develop-
ing training modules for stakeholders of
SHG–bank linkage, livelihood mapping,
cash-low-based loan products, demand-
based inancial products and services for
SHG members, developing inancial capabil-
ity index for rural, low-income households,
developing approaches for inancial literacy
and awareness, micro-remittance corridors,
etc. Its studies will provide valuable insight
for policy formulation and promotional
interventions in livelihoods of the poor.
World Bank has approved in July 2011
a soft loan of US$1 billion to part fund
NRLM, envisaged to invest US$8.7 billion
to promote livelihood to 350 million rural
poor in 422 blocks of 107 districts in 13
states. Earlier, World Bank had supported
livelihood projects in Andhra Pradesh,
Bihar, Madhya Pradesh, Rajasthan and
Tamil Nadu and, thereby, has supported 35
million poor since 2000. The participation
of World Bank in these programmes added
value to the system and positively impacted
on micro, small and community enterprises,
expansion of rural markets, collective mar-
keting of farm and non-farm produce, etc.
Moreover, it attracted several private sector
and multi-national irms as associates for
investment.
NRLM
NRLM is the other ambitious scheme that
plans to reach out to a significant poor
population in a phased manner: in the irst
year, it will cover as much as 600 blocks in
150 districts; by the third year, it will have
increased coverage to 1,500 blocks in 150
districts; in the ifth year, 2,100 blocks in
300 districts will be added; and in the sev-
enth year, the balance 1,800 blocks would
be covered. It is envisaged that by the 10th
year, the last village and by 15th year, the
last household would be given support. The
pace, quality, intensity and coverage in this
programme will have direct and signiicant
bearing on the livelihood scenario of the
country. The livelihoods of the poor will be
considerably impacted, depending on the
seriousness with which the stake holders
take the envisaged interventions forward.
The Government of India, in its NRLM
framework, has focused on the following:
social and financial inclusion; promo-
tion of institutions for the poor; skill and
capacity-building efforts; convergence and
partnerships; involvement of Panchayati
Raj Institutions (PRIs); support structures;
monitoring, evaluation and learning; provi-
sions of capital subsidy/interest subsidy &
revolving fund; overall inancial manage-
ment. As a part of preparatory strategies,
the states are expected to take the following
measures:
1. take state cabinet approval for the pro-
gramme
2. register a separate livelihood authority
3. place an exclusive CEO for the authority
4. formulate HR, administration and
inancial rules
5. recruit suitable staff at various project
units at state, district and block levels
6. identify intensive and resource blocks
7. prepare Annual Action Plan (AAP) and
SPIP
8. obtain approval for the plans from the
Government of India for release of
funds
9. developmanagement information sys-
tem (MIS)
10. initiate capacity-building measures for
the project staff
11. start implementing pilot interventions
in intensive blocks, etc.

178 STATE OF INDIA’S LIVELIHOODS REPORT 2012
Notwithstanding the detailed guide-
lines issued and initiatives taken by the
Government of India, preparatory arrange-
ments in states have been slow. A review of
progress of 18 states, as on 30 June 2012,
revealed that 17 states have constituted a
separate organizational set up (Society or
Company) and 15 states have positioned
an exclusive CEO (except Haryana, Punjab
and Himachal Pradesh) for NRLM. Only
three states, viz., Andhra Pradesh, Bihar and
Kerala livelihood authorities have prepared
and submitted detailed SPIP. Four states,
viz., Maharashtra, Gujarat, Haryana and
Tamil Nadu are in the process of inalization
of SPIP. Seven states, viz., Andhra Pradesh,
Bihar, Odisha, Chhattisgarh, Madhya
Pradesh, Punjab and Kerala have prepared
the AAP. Fourteen states have identiied
intensive blocks and eight states have identi-
ied resource blocks. Seven states have given
exposure to the personnel positioned in the
NRLM programme.
Steering committee on rural livelihoods and rural governance
The Steering Committee of the Planning
Commission constituted six Working
Groups: (a) MGNREGA; (b) NRLM; (c)
Area Programmes; (d) PRIs and Rural
Governance; (e) Rural Housing; and (f)
Provision of Urban amenities in Rural
Areas (PURA). Based on the reports of
Working Groups, the Steering Committee
has submitted their report in January 2012.
However, pending approval by NDC, the
approach paper to the Twelfth Plan is still
to be implemented. The recommendations
of the Steering Committees should also be
considered and translated to the planning
document. The major recommendations
are as under:
1. Strengthen credit-cum-technology sup-
port
2. Empower institutions of the poor
3. Facilitate the poor to compete on more
equal terms in market
4. Accelerate human development pro-
grammes, such as drinking water, sanita-
tion and housing
5. Impart much needed skills to rural
population
Overview of implementation and methodology and contents of SPIPs
NRLM has been under various stages of
preparation/implementation in the states. In
addition special programmes under the aegis
of State Rural Livelihoods Mission (SLRM)
include skill development and employment
in Jammu and Kashmir (Himayat) and
naxal-affected districts. Further, MKSP for
empowering women in agriculture has been
launched.
The SPIP under SLRM envisages pull-
ing up socially and economically vulner-
able categories of the population through
strategic interventions in sectors and
locations, and an integrated development
approach over a period of seven years. The
NRLM Mission document, issued by the
Government of India, is quite comprehen-
sive and includes operational guidelines
for implementation and a template for
preparation of SPIP. The guidelines for
SPIP cover many areas including: analysis
of situation, demographic proile, rural
poverty context, social and inancial inclu-
sion, livelihoods options, convergence and
partnership, support structure, training
and capacity-building, monitoring and
evaluation, governance and accountabil-
ity, role of PRIs, inancial management,
accounting, procurement, key strategies,
timelines, budget, etc. On review, it is
observed that each of the states have been
making preparatory arrangements, includ-
ing analysis of SPIP/AAP, in the local
context, though there have been variations
in the nomenclatures of the programmes,
time-frame, strategies and interventions.
Besides SGSY in all states, a number of
states have already implemented liveli-
hoods programmes, many of which are
donor-driven. The experience gained, best

Potential and Possibilities for Livelihood of the Poor 179
practices developed and institutions cre-
ated are being built upon/capitalized in the
SLRM planning and implementation. Some
states like Kerala and Tamil Nadu, to name
a few, propose to concurrently implement
donor-driven/state-sponsored livelihood
programmes.
With regard to sub-sector/potential
assessment, it is felt that a more in-depth
analysis from demand and supply perspec-
tives should be made. The sub-sectors
should be classified under (a) potential
for high growth, (b) high employment, (c)
high share in economy, and (d) high prior-
ity from developmental perspectives and
linked with livelihood options. It is already
envisaged that, under SLRM, there should
be convergence with other state government
departments and national level schemes like
MGNREGA. It would be better, therefore,
if perspective plans in critical areas like
agriculture, education, health, sanitation,
etc., get synchronized with the SPIP exercise.
Furthermore, the potentials (physical and
inancial) assessed for key sub-sectors for
the districts in the Potential-linked Credit
Plans (PLP) can be linked with area-wise/
year-wise plans envisaged under SPIP, in
order to facilitate the banking sector’s sup-
port for livelihood inance.
Emerging challenges in implementation of NRLM
1. The process of identifying appropriate
livelihood for each individual house-
hold, within the context of skill, knowl-
edge, market, so as to ensure sustainable
income will be a challenge.
2. The elaborate design documents aim
to eliminate the deiciencies witnessed
under SGSY. However, in the context
of continuity of capital subsidy, etc.,
sustaining financial discipline and
efficiency of delivery system assume
signiicance.
3. Sustainability of institutions like fed-
erations, ownership of the institutions
and participatory decision-making are
issues. Besides process and system efi-
ciency, recruitment of appropriate HR
and their competence and continued
commitment are key factors.
4. Several non-government agencies like
Basix, Dhan Foundation, MYRADA,
SKDRP, Pradan, BAIF, IDF, etc., State
government authorities, as also interna-
tional donor agencies have been imple-
menting different models of livelihood
programmes, with varying degrees of
success. Each has its strengths, potentials
and perspectives. Integrating the efforts
of these prominent players in the SLRM
implementation process will be a signii-
cant challenge.
Potential assessment—ways, means and relevance
Focus on location-speciic/demand-based occupations: The key approach
Perspective sectors encompass agriculture
and allied activities including(agri-business,
agri-value chain, agro-processing), for-
estation, retail and wholesale trade, tourism,
housing, construction, micro-enterprises,
decentralized, tiny and small scale indus-
try, IT and IT-enabled services, education,
health and hospitality, inancial services,
transport, communication, community
services, etc. Within each broad category,
innumerable livelihood options exist.
The poor have their own basket of live-
lihood options and inancial needs which
are often revolving. So, instead of a supply-
driven/top-down approach, demand-
driven/location-speciic activities should be
supported through organized interventions
in the livelihoods programmes. Livelihood
challenges are bound to be different depend-
ing on the type of work—the challenges of
those doing manual labour in ields, kilns
and small workshops will be different from
the people taking up activities on piece-rated
wages and those taking up activities on their
180 STATE OF INDIA’S LIVELIHOODS REPORT 2012
own account. Moreover, different produc-
tion relations are combined with all these
multiple occupations and these production
relations also keep changing for the same
activity as well as across activities. As a
result, the poor are multi-tasked and their
livelihood strategy comprises several jobs.
Therefore, periodic potential assessment,
based on intensive survey of each household,
would be realistic (see Box 7.6).
PLPs/State Focus Papers (SFPs) and livelihoods
NABARD has been preparing PLPs for
each of the districts through its District
Development Managers (DDMs) in a con-
sultative process annually. It has also been
preparing an annual State Focus Paper for
each of the states, based on the PLPs. These
documents relect the exploitable potential
that can be tapped with institutional credit
during the reference year. This is prepared
after making an assessment of the present
status of infrastructure, the support services
available and the planned development of
each of the sectors/sub-sectors. The policy
guidelines, thrust areas and important pro-
grammes of the Government of India, RBI,
NABARD, Planning Commission and the
state government are kept in view. These
plans serve as important reference docu-
ments for banks, policy-making authorities
and development agencies. With a view to
enhancing greater appreciation and par-
ticipation of bankers’ community in the
livelihoods sector, the following strategies
are deemed necessary:
1. In the current year’s PLP, prepare a spe-
cial chapter on potential in each sector/
sub-sector that could be harnessed for
institutional credit during the ive year
plan period (2012–2013 to 2016–2017–
Twelfth Plan). It would be worthwhile
to focus on livelihood inance and mega
schemes like NRLM in the PLPs not
only for the Twelfth Plan but also for
the reference year.
2. Although PLPs contain valuable data/
information on various aspects of rural
development, inancial services other
than credit and livelihood inance do
not get adequate coverage and analysis.
As SHGs and livelihood programmes
complement each other, and under the
SHG-2 strategy of SHG–bank linkage,
focus has been laid on livelihood inter-
ventions by matured SHGs, it would be
useful if livelihood aspects are relected
adequately in PLPs/SFPs.
3. With increasing importance being laid
on inancial services beyond credit in
the Financial Inclusion drive, more
discussions on insurance, savings and
remittance and other services should
ind place in these documents.
l Diagnose and describe typical livelihoods
portfolios of poor households and
prioritize key livelihood activities based
on its impact in poverty alleviation
l Develop understanding of value chain
of subsectors vis-à-vis stake holders;
analyse sub-sector dynamics and leverage
points and choose intervention points,
identifying the need for skill, technology,
inancial services
l Document the lessons from the field
and arrive at conclusions within each
subsector
l Draw road map for handholding for
community groups and livelihood
promotion organizations
l Determine possible changes in practices
as any new interventions bring with it
change in traditional practices and trade
relationships
l Direct efforts for action research for better
understanding and testing innovative
approaches
l Design concrete programmes, based on
above steps and learnings
Source: Author.
Box 7.6: Steps for potential mapping for livelihoods

Potential and Possibilities for Livelihood of the Poor 181
4. SLMs are expected to implement
SPIPs during 2013–2014 and beyond
with greater intensity, after the pre-
paratory period is over. The financial
inclusion/participation of SHGs and
the related tiers at cluster and district
levels are crucial to successful imple-
mentation of SPIP. In this context, the
coordination and consultative process
between State Livelihood authorities
with banks, DDMs, NABARD, SLBC
Convenor and local data manager
(LDMs) in the states assume greater
significance. This, therefore, should
be strengthened.
5. NRLM, MGNEREGA, National Old
Age Pension Scheme, social enterprise
schemes, community-based schemes,
cluster development programmes,
integrated development programmes
with focus on watershed, handlooms
revival, natural resource management,
forest-based/tribal development, diary
development, etc., all have opened huge
vistas for inancial inclusion/livelihood
inance. Consequently, a policy frame-
work for support of banking sector for
SLRM and other livelihood programmes
can be helpful in addressing issues
related to livelihoods inance.
Measurement of inancial inclusion
One of the measures of the level of inancial
inclusion is the Financial Inclusion Index,
developed on the basis of an empirical study.
This index is based on three basic dimen-
sions of an inclusive financial system—
banking penetration, availability of banking
services and usage of the banking system.
According to the value of the Index, Indian
States can be classiied into three categories:
states with high, low and medium levels of
inancial inclusion. According to empirical
results, Kerala, Maharashtra and Karnataka
are some of the states that have a wider
extent of inancial inclusion, as compared to
other states of India. Tamil Nadu, Punjab,
Andhra Pradesh, Himachal Pradesh, Sikkim
and Haryana come under the category of
medium inancial inclusion. The extent of
inancial exclusion is found to be signii-
cantly low in the North Eastern and Eastern
states. NABARD is also, through National
Informatics Centre, developing a web-based
GIS application for assessing the reach and
extent of banking in India and also a web-
based MIS for capturing the banking facility.
These efforts have immense possibilities for
future.
Possible outcome of implementation processes
Positives and perspectives of livelihood programmes
Apart from improvement of livelihood of
the poor, it is expected that considerable
beneits will emerge in the systems and proc-
esses that are put in place during scaling and
deepening of livelihood programmes. These
would include:
1. If information, data and critical analy-
sis of the potentials are reflected in
house hold baseline surveys, livelihood
mapping and also SPIPs in the desired
manner, the same could be used as a
reference document by all those who
want to promote livelihoods of the poor
in the given area, other than Livelihoods
Mission.
2. The large scale pilots envisaged in the
preparatory years under SPIP and other
development agency-sponsored/donor-
driven programmes could bring about
demonstrable ‘model’ sites, innovations
in institutional processes and best-prac-
tices zones. The lessons from these can
lead to smoother scaling up of activities
in other states also.
3. The training institutions, centres of
excellence, community learning acad-
emies, etc., that are set up can be linked
with other such institutions in the state
and across the country, for cross ferti-
lization of ideas and learnings, sharing
of success stories, case studies, tools and
documents.

182 STATE OF INDIA’S LIVELIHOODS REPORT 2012
4. Many of the states are looking to Society
for Eradication of Rural Poverty (SERP)
in AP for onsite guidance, hand-holding
support, exposure visits/immersion
programmes, in view of their long expe-
rience in the livelihoods programme. In
the years ahead, apart from demand–
driven technical assistance from SLRM
authority of the Government of India,
twinning arrangements between states
should be upscaled, facilitating peer
learning at various levels.
5. With the increasing involvement of
professionals, technical experts, mas-
ter trainers, experienced practition-
ers including Community Resource
Persons, etc., in the implementation
process, a large pool of HR will become
available to the livelihoods sector in all
states.
With increasing recourse to ICT and
other technological devices in liveli-
hoods service, IT/web-based learning
platforms, knowledge management
tools and embedded practices would
come to the fore. This will enlarge
and enrich dissemination, commu-
nication, feedback and participation
process.
6. If the programme as envisaged, with
systematic planning, participatory
approach, convergence, etc., results in
sustainable dividends to the poor, all
other departments/agencies at the state
and national level will be encouraged
to replicate such strategies in other
programmes that having bearing on
livelihoods (see Box 7.7).
7. Integration with banks and financial
institutions as also efforts under the
SHGLP, inancial inclusion plans, etc.,
of the banking sector is another critical
area. Quality and sustainability of SHGs,
strengthening the demand side and
responsible use of inancial services are
major issues to be addressed.
Elaborating BASIX strategy, Sri Vijay
Mahajan wrote in an article entitled ‘Credit
is necessary but not ample condition for
livelihood promotion’, the study showed
that there is need for risk mitigation, yield
enhancement, cost reduction, and bring-
ing rural producers together for better
bargaining at marketplace. Hence, in 2002,
BASIX revisited its strategy, to provide a
comprehensive act of livelihood promotion
services to rural poor households. Before
Basix reafirmed that credit is a necessary
but not suficient condition for livelihood
promotion. Its revised ‘Livelihood Triad’
strategy included provision of financial
services beyond credit, such as insurance,
provision of agricultural, livestock and
nonfarm enterprise development services;
and institutional development services for
producer organizations.
Sri Alosius Fernandez in his article titled
‘Self-Help Afinity Groups (SAGs)-Facilitating
Livelihoods—a new form of empowerment to
support livelihood’ explained MYRADA’s
experience as follows:
If the majority of the poor do not rise
above the poverty line, it is not due to
their inability to adjust to unexpected
changes—it is because they need new
skills, conidence and the power to change
the framework in which they are trapped
and which is created by oppressive power
relations and traditional practices. The
SAGs, if properly trained in the institutional
capacity-building (ICB, not ICT), together
with their federations, provide the space to
generate this ‘empowerment’, which has the
potential to support their livelihood choices
and change shackling power relations.
Source: ‘Credit is a necessary but not ample
condition for Livelihood Promotion’ by Sri
Vijay Mahajan and that of ‘Self-Help Afinity
Groups (SAGS)-facilitating Livelihoods-a new
form of empowerment to support Livelihoods’
by Sri Alosius Fernandez, had appeared at page
14 and 26 respectively, in the Micro Finance
World, quarterly supplementary magazine
(April–June 2010) of the Financial Express
(Mumbai), sponsored by NABARD.
Box 7.7: Differential livelihood strategies

Potential and Possibilities for Livelihood of the Poor 183
Financial inclusion and livelihood promotion
New vistas for livelihoods under SHG 2 package of interventions
Financial inclusion is conceived as the proc-
ess of ensuring access to inancial services
timely and adequately, where needed by
the vulnerable segments (such as weaker
sections and low income groups), at afford-
able cost, in transparent and fair method
by inancial institutions. Financial Services
are critical ingredients in livelihood promo-
tion; livelihood inance has assumed greater
signiicance with the upscaling, diversiica-
tion and deepening of livelihood interven-
tions. Livelihood promotion efforts centre
around SHGs as most of the programme
designs take SHGs and SHG-related struc-
tures as delivery routes. No wonder, then,
that SHGs are the primary foundation of
inancial inclusion and the stepping stone
to livelihood promotion, particularly for
matured SHGs.
SHG–Bank linkage, which was launched
by NABARD in 1992 with 500 SHGs, has
grown phenomenally over the years. The
programme covers 7.4 million SHGs sav-
ing linked to 100 million households sav-
ing with the banking system with a saving
balance of `10,000 million, and 4.9 million
SHGs credit linked to SHGs having a bank
credit outstanding of `31,000 million as on
31 March 2011. It has become the largest
microfinance programme in the world,
facilitating inancial inclusion, unfolding
livelihood opportunities and enabling
socio-economic empowerment of the poor,
mostly women. Notwithstanding the mas-
sive expansion of SHGBLP, it has suffered
from weaknesses and distortions in various
ways, thus affecting the graduation of SHG
members towards micro entrepreneurship
and their full participation in livelihood
activities.
The state governments, as SHPI, stepped
into the SHG sector and apart from facili-
tating scale, they also routed funds under
Government schemes through the SHG
route, resulting in dilutions in the basics
of SHGs under the linkage programme
Concerns surfaced in the approach and
functioning of SHG–BLP, such as: skewed
regional distribution of SHGs, delays in
opening of SHG accounts and disburse-
ment of loans, non-approval of repeat loans,
multiple membership and borrowing by
SHG members within and outside SHGs,
inadequate bankers’ interface and moni-
toring, etc. All these warranted remedial
measures for smooth, qualitative and sus-
tainable growth of SHGs and NABARD, in
March 2012, has come out with guidelines of
SHG2, re-focusing the basic tenets of SHGs
and effecting certain crucial changes in the
approach and design of the programme, as
follows:
1. Focus has been brought back to volun-
tary savings over and above the compul-
sory savings and opening of individual
bank accounts by the members besides
SHG accounts.
2. Flexibility in sanction of loans by way
of introduction of cash credit/over draft
loan system for SHGs and providing
frequent/repeat loans, etc., has been
emphasized.
3. Promoting Joint Liabilities Group
(JLG) from within SHGs with facilita-
tion of enterprise-building/livelihood
options has been permitted.
4. Risk: mitigation mechanism is to be
improved through introduction of
self-rating by SHGs, audit, and deploy-
ment of Business Facilitators (Auditors)
from among the active SHG members,
NGOs (SHPIs) or existing Business
Correspondences (BCs) of banks for
audit in SHGs.
5. Building up SHPIs, strengthening moni-
toring mechanism and deepening train-
ing interventions will have a renewed
focus.
The Women SHG Development Fund
has been set up in NABARD, with corpus
contribution from GoI, with the objective
of facilitating SHG inance and support-
ing the objectives of Aajeevika. Hopefully,

184 STATE OF INDIA’S LIVELIHOODS REPORT 2012
a livelihoods development approach will
be facilitated through active participation
of the banking system in the processes
and strategies, as detailed in SHG-2, and
other NABARD funds such as Micro
Finance Development and Equity Fund
(MFDEF), Watershed Development Fund,
Tribal Development Fund, Producers
Organizations Development Fund, etc.,
will also be supportive of livelihood inter-
ventions.
Another new scheme formulated
by NABARD, in association with the
Government of India, as a viable and self-
sustainable model, focuses on promotion
and inancing of women SHGs in backward
and LWE-affected districts of the country.
This scheme is being implemented in 109
such districts.
SHGBLP, SHG federations and NRLM: Convergence
The SHG movement and SHGBLP had
tremendous transformational impact on
banking with poor, policy and approaches
of all stake holders and the overall socio-
economic environment during the last 20
years. The programme exhibited exceptional
diversities in thrust, patterns and outcomes.
It commenced in 1992 with a limited
objective, scale and scope of services, and
lacked the broader vision of encompassing
livelihoods of the poor with empowering
and supportive inancial and non-inancial
services. Other than state governments/
Government of India-sponsored pro-
grammes, formation of Federations was
another dimension of the programme. In its
growth process, problems surfaced in both
the supply and demand side. In the SHG 2
scenario, livelihood prospects of the poor
can be addressed effectively, provided the
following are taken care of:
1. The role of the growing number of
SHG federations needs to be realisti-
cally carved out. NABARD expected
emerging federations to assume the
role of business facilitators, with no
inancial intermediation role. However,
major NGOs like MYRADA, Dhan
Foundation, SKDRP, etc., took a holistic
view of livelihoods of SHG members and
put in place differential institutional
structures for development and empow-
erment of SHGs.
2. The banks’ corporate thrust on SHG 2
and livelihoods promotion is key to
progress. Yet, the path of transition
to SHG 2 is beset with challenges—
conversion of term loan mode to cash
credit system, development of savings
products, JLG–SHG differentiation,
integrating with livelihood programmes,
sustaining the quality of portfolio,
MIS development and strengthening
monitoring mechanism are tough tasks
ahead for inancing banks and other
stake holders.
3. Banks are expected to participate not
only in SHGBLP but also in NRLM, and
as both are being implemented through
federal structure of SHGs, it is a major
challenge as to how convergence can
be accomplished. A clear road map,
therefore, needs to be chalked out at
this juncture, and institutions like RBI,
NABARD, Government of India and
state governments should have mutual
understanding in this regard.
4. Within SHG–BLP and also financial
services products, there is need for con-
tinuous effort and constant innovation,
in order to meet the aspiration of the
poor. To quote Dr K. C. Chakrabarthy,
Deputy Governor RBI, from his paper:
‘Financial Inclusion—A Road India
Needs to Travel’:
The Product designed by the banks are not
tailored to suit the needs of low income
households. The existing business models do
not pass the tests of scalability, convenience,
reliability, lexibility and continuity.
MFIs and livelihoods: Problems and possibilities
It remains true that the SHG movement in
India has not scaled up country-wide in the
absence of adequate human and inancial

Potential and Possibilities for Livelihood of the Poor 185
resources. The formal banking system has
also failed to penetrate the last mile and
extend services to each and every rural citi-
zen in the country. In this context, MFIs in
various legal forms stepped in to play a criti-
cal role in inancial inclusion. They scaled
up their operations rapidly with substantial
support from the banking sector, private
funding agencies and SIDBI. Lending by
commercial banks to MFIs for on-lending
to SHGs, JLGs and individuals was treated
as priority sector lending.
However, the concept of MFIs fell victim
to human proclivities of over-aggressive
lending, multiple lending and consequently
over-indebtedness of clients leading to poor
repayment records and coercive practices
in recovery. As a result, MFIs were reined
in and this is owed in particular to the
restrictive legislation of the Government of
Andhra Pradesh in 2010. As this had serious
adverse repercussions in the entire sector,
RBI came out with new guidelines in May
and August 2012 to streamline operations
of MFIs, based on Malegaon Committee
recommendations. The guidelines assigned
70 per cent weightage to stipulation of quali-
fying assets with a focus on inancing income
generating assets to extend collateral-free
loans; a ceiling of 12 per cent to 10 per cent
was imposed on margins earned by the MFI;
the interest rate was relaxed from 30 per
cent pa to 26 per cent per annum; it was laid
down that one client could be inanced by a
maximum of two MFIs. Various measures
towards customer protection, obligatory
membership of Credit Information Bureau
and adherence to fair practices code have
been introduced. These regulatory measures
along with the Micro Finance (Regulation
and Development) 2012 Bill are expected
to usher in an approach to micro-inancing
that is more favourable to their customers
while addressing the challenges in their
operations. During 2012–2013, several
banks, and private funding agencies have
re-opened financial support to MFIs.
In conformity with their mission, MFIs
should be able to make a signiicant change
in supporting livelihoods of the poor if they
take the following measures:
1. MFIs should evolve suitable/innovative
inancial services products for the poor,
participating in livelihood programmes.
NGOs as also MFIs should have greater
share in the implementation of NRLM
and other livelihood programmes.
2. MFIs have to revisit their business
models so as to support the clients in
the niche market and at the same time,
themselves remain inancial viable and
organisationally sustainable. RBI has
modiied the margin for MFIs from 12
per cent to 10 per cent for large lenders
(with loan portfolio over ̀ 1,000 million)
and 12 per cent to for others. This has
posed tough challenge to MFIs.
3. They should strive to change the public
perception through fair practices, codes
of conduct, responsible inance, trans-
parent processes/public disclosures and
a customer-friendly approach. They
should reorient/refine their business
processes, product design and delivery/
collection methods.
4. Both the MFI sector and SHGBLP are
at crossroads in different contexts. Both
streams should play a complementary
role in qualitative growth of SHGs and
effective livelihood support to poor.
Broader horizon of inancial inclusion
Initiatives of policy-makers
There is acute need for inancial inclusion
in India, given the unpleasant fact that
45.95 million farmer households (over
200 million persons) out of 89.3 million
households (including householders) do not
have access to any inancial services—either
institutional or non-institutional—and
only 27 per cent (24.3 million households)
are covered by formal services (as per the
NSSO Survey Report, 2009). Subsequent
to the recommendation of the Committee
on Financial Inclusion 2008 (Dr Rangarajan

186 STATE OF INDIA’S LIVELIHOODS REPORT 2012
Committee), this agenda, with policy and
promotional initiatives, was given sharp
focus by the Government of India, RBI and
NABARD. The Financial Inclusion Fund
(FIF) and Financial Inclusion Technology
Fund (FITF) were instituted in NABARD
with contribution from the Government of
India, RBI and NABARD, with the express
purpose of supporting financial inclu-
sion interventions. During 2010–2011 the
Swabhimaan Campaign was launched to
extend banking facilities either through a
brick and mortar branch or BC in habita-
tions with a population over 2,000. Acount
of 74,111 villages with population over 2,000
were identiied for provision of inancial
services and, till March 2012, 74,199 of these
have been covered.
In the Union Budget, it was proposed
to extend the Swabhimaan Campaign to
villages with population of more than
1,000 in North East and hilly states and
to other habitations that have crossed the
2,000 population mark, as per Census 2011.
Ultra small branches are being set up by
banks where, earlier, BCs would deal with
cash transactions. As a result, total banking
outlets, as per the latest June 2012 update,
have reached 147,534, almost twice of what
it was a year ago. RBI has relaxed the norms
for branch licensing and encouraged banks
to open branches in tier-2 centres (popula-
tion between 50,000 and 100,000). Still, on
an average, a branch serves around 13,000
customers which is high. The number of no-
frill accounts has gone up to 103 million and
22.34 million Kishan Credit Cards (KCCs)
have been issued by the end of the FY 2012.
The interventions of banks to ensure bank-
ing services in those villages having popula-
tion of more than 1,000 during 2012–2013
and beyond will witness sizeable expansion
of branches and BC mechanism, thereby
reducing inancial exclusion signiicantly
in the year(s) ahead. However, challenges
remain regarding the quality of inancial
inclusion, the depth and breadth of bank-
ing penetration, availability of the banking
services and usage of the banking system.
Business Facilitators (BFs) and BC
The renewed focus on inancial inclusion has
given impetus to the BF and BC mechanism,
as also the introduction of new technological
devices for expanding outreach in the last
mile and bridging the gap between demand
and supply of services. Since its introduction
by RBI in 2006, the scope of BC/BF has been
enlarged with a series of liberalized policy
measures, markedly increasing the number
of eligible institutions/individuals.
Technology is assuming the role of key
driver for inancial inclusion services. RRBs
have switched over to core banking solu-
tions (CBS) and cooperative banks are in
the process of establishing CBS networks,
purchase of Point-of-Sale (POS) and
Automated Teller Machine (ATMs). Under
FITF, NABARD has been providing support
to RRBs and Co-operative Banks to adopt
technology (including CBS) and capacity
building efforts. The Government of India
has speciied uniform technology norms for
corporate business correspondents across
the country for facilitating integration. Some
banks are in the process of switching over to
in-house BC outits in the form of separate
trusts/subsidiaries with separate recruitment
and remuneration structures. However, BC/
BF–Bank partnership has not been stabilized
in the sector. This can be a potential instru-
ment for serving the livelihood of the poor,
provided the following issues are given due
attention:
1. Credibility, competence and commit-
ment of BFs/BCs is critical for up-scaling
their services. In this context, proper
track record of personnel, transparency
in accounting, etc., assume signifi-
cance.
2. Financing banks are exposed to a whole
range of risks—reputation, strategic,
compliance, operational, concentra-
tion, etc. Due measures need to be taken
for appropriate risk—mitigation. The
inancing banks have to evolve proper
processes, procedures and practices for
BC and enforce scrupulous adherence.

Potential and Possibilities for Livelihood of the Poor 187
3. Adoption of appropriate technology,
ensuring compatibility and integration
of technology being used by banks and
BC is also crucial for successful opera-
tion of BC mechanism.
4. Viability of BC is another critical issue
as there is a mismatch between revenue
earned through commission and the
cost incurred in BC operations. The
compensation to BC should be adequate
to sustain its operations. A basket of
products needs to be offered through the
BC instead of a single product to make
inancial inclusion efforts viable.
Financial education
Financial literacy/inancial education are
being pursued hand-in-hand with inancial
inclusion initiatives, in order to create the
pull for accelerating to formal channels of
inance. The language, content and meth-
odology of inancial education would vary
depending on the target group—students,
salaried people, senior citizens, house-
wives or unorganized labour. For stronger
impact, the programme needs to be tai-
lored, taking into account the demographic
proile and regional differences of the target
population. Keeping this in mind, Lead
banks have established Financial Literacy
and Credit Counselling Centres. NABARD
has supported such centres in 128 districts
spread over 12 states. RBI is in the process
of launching electronic Bank Awareness
and Training (e-BAAT) programme to
increase awareness about technology-
enabled inancial services.
Integration of livelihoods with wider spectrum of inancial services: Potential and possibilities
Current practices in financial inclusion
revolve around the provision of limited
and basic inancial products and services,
primarily thrift and credit for the vulner-
able and inancially excluded sections. The
expanded approach for inancial inclusion,
on the other hand, focuses not only on the
provision of basic banking products like
savings and credit, but also other important
ancillary inancial products such as saving-
cum-overdraft, entrepreneurial credit insur-
ance, remittance, mutual funds, inance for
affordable housing, etc. A broader inancial
inclusion would also cover common protec-
tion and education, particularly inancial
literacy for new entrants to the formal
inancial system, as inancial inclusion forms
an integral part of economic inclusion. The
potential of some of these products is out-
lined in the following paragraphs.
Savings
Further focus is needed on savings as an
essential inancial service for the poor in the
livelihoods programme. Possible strategies
in this direction would be: accent on savings
under SHG–BLP, linking saving to credit,
insurance and remittance, empowering
member-depositors in Primary Agriculture
Credit Societies (PACS), mobilizing savings
in remote areas through BCs/BFs and devel-
opment of innovative and client-friendly
saving products. The bankability of the poor
offers a major business opportunity for the
banks to develop a stable, retail deposit base
and curb volatility in earnings with the help
of a diversiied asset portfolio. A suitable
deposit protection scheme is also required
to protect the interest of PACS member-
depositors.
Microinsurance
Microinsurance, as a part of financial
services for the poor, facilitates improvement
of quality of livelihoods. Despite the
huge potential market for microinsurance
encompassing life, health, crop, livestock,
weather and general assets, 90 per cent of
the population remains excluded. Multiple
models and schemes do exist; however,
evolving an innovative, cost-effective, lexible
and comprehensive client-centric and
market-driven sustainable microinsurance
product design is a challenge. Managing
demand-supply mismatch, scaling up
distribution and outreach network and
addressing procedural and operational issues
(e.g., documentation, delay in settlement,
actuarial calculation, etc.) are also challenges.

188 STATE OF INDIA’S LIVELIHOODS REPORT 2012
Initiatives of localized community-based
health insurance, Rashtriya Swasthya
Bima Yojana (RSBY), National Rural
Health Mission, products developed by Life
Insurance Corporation (LIC), India Post
and other private insurance companies, and
pilot experiments of weather-based schemes
with adoption of technology are welcome
moves. In the year ahead, greater efforts
need to be directed to linking insurance with
livelihood promotion schemes and inancial
inclusion drives, to tap the huge potential of
microinsurance in the country.
In the case of microinsurance, the trans-
action cost of banks in eficient sale, under
writing and evaluation of claims is signii-
cant, and is standing in the way of expan-
sion. Currently, only insurance company
agents, banks, MFIs, NGOs and SHGs are
allowed to sell micro insurance policies. If
the BC network is permitted to undertake
microinsurance business, in addition to
cash transaction in banking services, it will
help in increasing penetration of microin-
surance services to the excluded poor and
also facilitate banks to increase volume and
attain scale of economy in microinsurance
business.
Micro pension
Invest India Micro Pension Services (IIMPS)
Pvt. Ltd and UTI, AMC, have developed a
low cost scalable mechanism for enabling
rural and urban working poor to achieve
a digniied retirement through thrift and
self-help. IIMPS has been working in select
states, in collaboration with other agen-
cies including Sewa Bank and NABARD,
encouraging and assisting the working poor
to save for their old age, offering pension
products through a proprietary micro pen-
sion model. NABARD has supported IIMPS
to pilot test a micro pension model among
SHG members in eight districts of four
states. Two live examples are the Pension
scheme for auto rickshaw drivers in Delhi
and the Vishwakarma Yojana of Rajasthan
Government for unorganized sector.
Pens ion Funds Regula tory and
Development Authority (PFRDA) are in
the process of evolving a national pension
scheme for the unorganized sector as Micro
Pension has the potential of being an inte-
gral part of livelihoods promotion schemes,
on a wider scale and in a comprehensive and
sustainable manner.
Mobile, technology, ICT-based services—potential money transfer
Signiicant strides have been made in the
payments and settlement system includ-
ing electronic and telecommunication in
banking under the aegis of RBI. Today both
the service providers and the poor have
a number of technology options—smart
cards, micro-ATMs, ATMs mobile tech-
nology, Aadhar Enabled Payment System
(AEPS)—for availing inancial services. RBI
has preferred a bank-led mobile banking
model and permitted 69 banks to provide
mobile-banking services to customers as
on 31 May 2012. The Inter-bank Mobile
Payment Service (IMPS) and the instant
24×7 electronic funds transfer system have
been developed by the National Payment
Corporation of India (NPCI). Although
there has been steady growth in volume
and value of such transactions, the pace has
been slow, considering that there are over
900 million mobile subscribers in India.
Money transfer through mobile wallets (up
to `50,000 for the present) leveraging the
National Electronic Fund Transfer (NEFT)
platform of RBI, being promoted by a few
companies holds immense scope for facili-
tating small value remittances. However,
micro remittance as a business proposi-
tion for inancial institutions and as liveli-
hood facilitation for the poor, particularly
migrants has not been realized. The recent
study by GIZ, IFMR, College of Agricultural
Banking (CAB), on domestic remittance
have brought to the fore various innovative
strategies and options that may be developed.
Progressive expansion of mobile banking,
introduction of micro-ATM standards and
kiosk banking are moves in the right direc-
tion. However, the migrants continue to face
hardships in the absence of cost-effective,
convenient, hassle-free and fast remittance
Potential and Possibilities for Livelihood of the Poor 189
services within a congenial policy framework
of suitable safeguards. The barriers are on
account of the following factors:
1. Suboptimal availability of trained com-
petent persons to guide the poor and
address their technical challenges with
technical devices/ICT-based models, is a
critical issue and need to be addressed.
2. IT security issues need proper attention.
A balance should be struck between
security procedures and convenience of
the customers.
3. Multiple technologies and delivery
modes bring to the fore the issue of
integrity with CBS and capability of
people at the operational level to cope
with products and technologies. It will
be better to concentrate on a few stable
and scalable technologies and delivery
models.
4. The strategy should be aimed at creating
a facilitating ecosystem leveraging on
technology and promoting partnerships
among the stake holders for effective
inancial inclusions delivery mechanism.
There is need for strengthening and
streamlining the collaborative relation-
ship between banks and mobile network
operators. All stakeholders need to
work out strategies to increase IMPS-
supported mobile banking transactions
(see Box 7.8).
Training and awareness
The level of knowledge and awareness about
livelihoods and enterprise development
among bankers, BCs/BFs and SHGs is not
adequate. Training inputs on all aspects and
nuances of livelihoods inance need to be
imparted during training programmes for
bankers. This should include knowledge
and understanding of the fundamentals of
livelihoods promotion, sub-sector poten-
tials, value chain analysis, identiication of
viable income generation activities, enter-
prise promotion, marketing development
skills, management of enterprises, business
planning, potential viability, minimum
threshold for different activities, inancial
products and services, etc.
The aim of microfinance, apart from
giving access to inancial services, should
be strengthening livelihoods of the poor
and enabling them to transform into entre-
preneurs following an economic growth
trajectory. In this context, it is important
to build mindset, cultural and attitudinal
changes at the grass root level, and develop
user-friendly methodology at bank branches
and BC outlets, so that a holistic customer
service is extended to the poor. In view of
the fact that the poor are generally more
susceptible to events that can adversely affect
their already fragile livelihoods, more focus
is required by banks to build sustainable
relationships (see Box 7.9).
Data on repayments made and loans disbursed
will be uploaded to mobile phones by record-
keepers in about 15 minutes. The records will
capture all the existing loans of individual
members, insurance details, old loans, details
of assets and repayment dates in Telugu. As of
now, the uploading of data of over 0.8 million
SHGs has already been completed as part of
the project which is claimed to be the irst of
its kind in the country. Visakhapatnam-based
Blue Frog Mobile Technologies has designed
the software and is deploying the project.
Under the project, Village Organizations are
being provided mobile handsets uploaded
with book-keeping software to begin with,
which will be extended to all others. Every
Village Organization has about 30 SHGs and
there are over 40,000 book-keepers who are
uploading data into mobiles. The advantage
of this initiative is that it promotes inancial
literacy and ensures transparency.
Source: ‘Nine million SHG members to get
mobile feeds on inancial transaction in Andhra
Pradesh under mobile book-keeping project’,
Business Line, Mumbai edition, 16 July 2012.
Box 7.8: Nine million SHG members to get mobile feeds on inancial transaction in Andhra Pradesh under mobile book-keeping project

190 STATE OF INDIA’S LIVELIHOODS REPORT 2012
Business innovation and policy environment
1. Business model innovation must get
attention of the banking sector to dis-
cover new and integrated approaches
for inancial services delivery to poor.
For instance, the business model of
NABARD Financial Services Limited
(NABFINS), a subsidiary of NABARD
envisages working with NGOs, asso-
ciated with social mobilization to
inance at the irst level for production.
It engages with Producer organiza-
tions for meeting both capital invest-
ment and working capital needs. In
Cooperative Credit System, in the
post-reform scenario, it is possible to
try out innovations, particularly at grass
root level societies, considering their
proximity to rural poor and outreach
in remote areas.
2. The regulatory issues in livelihoods
can be best addressed by strengthening
sector-own control, internal control
system, disclosure practices, pragmatic
application of know your customers
(KYCs), voluntary codes of standards
and fair practices, etc.
Sri H. R. Khan, Deputy Governor, RBI, in
his address on ‘Issues and Challenges in
Financial Inclusion: Policies, Partnerships,
Processes and Products’, at the symposium
at IIPA, Bhubaneswar, on 30 June 2012,
aptly summed up:
I am sanguine about rapid progress of inan-
cial inclusion efforts in India as the stake hold-
ers have come to realize the need for viable
and sustainable business models which focus
on accessible and affordable inancial services,
products and processes, synergistic partner-
ships with non-bank entities including the
technology service providers for eficient han-
dling of low value, large volume transactions,
particularly in remote banking shadow areas
and appropriate regulatory and risk manage-
ment policies that ensure inancial inclusion
and inancial stability more in tandem.
Priority sector guidelines—changing focus and perspectives on livelihoods
Livelihood promotion requires huge invest-
ment, organisational efforts for capacity
building, access to markets, technology,
infrastructure development, product
and process innovation, monitoring and
The basic premise of AEPS is that one BC
Customer Service Point (CSP) will have the
ability to service customers of many banks,
based on the unique identification data
stored in the Aadhar database. The AEPS
platform is aimed at enabling a bank cus-
tomer to use Aadhar as identify to access the
respective Aadhar-enabled bank account and
perform basic banking transactions. A pilot
scheme in four districts of Jharkhand state
is currently being carried out under which
MGNREGA wages to labourers are credited
to their Aadhar-enabled bank accounts.
The beneiciaries draw the amount through
micro ATMs which authenticate their Aadhar
Number. This has tremendous potential for
the future.
A Centre of Excellence for Rural Financial
Institutions (CERFI) has been established by
NABARD in collaboration with UAIDAI,
for bringing about higher accountability and
transparency in the last mile banking. It is
intended to develop a technology platform
among the institutions, enabling them to
provide Aadhar-based inancial services. The
CERFI, through a national level network,
will test-check mobile-linked cash-less
transactions, new KCC guidelines about
card-based inancial services as well as other
Aadhar-enabled inancial services.
UADAI plans to enrol 400 million
people and assign Aadhar numbers in the
next two years, under its second phase of
expansion.
Source: NABARD’s Annual Report 2011–
2012, July 2012, NABARD HO, Mumbai;
www.npci.org
Box 7.9: Aadhar Enabled Payment System (AEPS)

Potential and Possibilities for Livelihood of the Poor 191
coordination. Directed lending, as an insti-
tutional mechanism, has been in vogue in
India since 1960. Priority sector lending is a
statutory dispensation aimed at ensuring that
the vulnerable sections get access to credit
at an affordable price and thereby improve
their livelihoods. It also seeks to ensure that
there is adequate credit low of resources to
those segments of the economy that have
potential for employment—agriculture,
micro and small enterprises, among others.
RBI had constituted a committee headed by
Sri V. M. Nair, to revisit the priority sector
lending classification and related issues.
Based on the committee’s report (February
2011), banks have been advised by RBI (in
July 2012) to give sharper focus to directing
low of credit to economically weaker sec-
tions of the society, in order to achieve the
policy objectives of inclusive and equitable
growth. The revised guidelines envisage that
18 per cent and 40 per cent of Adjusted Net
Bank Credit (ANBC) (or Credit Equivalent
of Off-Balance Sheet Exposure [CEOBE],
whichever is higher) will be directed to
the Agriculture and Overall priority sector
respectively. In case of commercial banks
inancing SHGs, JLGs and individuals will
be computed as priority sector, provided
85 per cent of the total assets of MFIs are in
the nature of qualifying assets and aggregate
credit low extended for Income Generating
Assets (IGA) is not less than 75 per cent of
total loans given by MFIs. In a revision that
will determine low of priority sector credit
to manufacturing enterprises, they have
been classiied based on their investment
in plant and machinery—if investment in
plant and machinery does not exceed `25
lakhs, it qualiies as a micro enterprise, how-
ever, If investment in plant and machinery
is more than `25 lakhs but less than `50
million then the unit is classiied as a small
enterprise. So far, banks have been comfort-
ably meeting their indirect lending target
as it included loans to food and afro-based
processing units with investments in plants
and machinery up to `100 million. These
changes will necessitate reviewing of their
strategies for inancing MSEs and food and
agro-based activities. In his address to bank-
ers recently at the platinum jubilee function
of Indian Overseas Bank, Sri Subba Rao,
Governor, RBI stated: ‘The priority sector
can deliver on its promise only if eligible
sectors are restricted to a select few that are
important from the perspective of improv-
ing livelihoods.’
Convergences and partnerships
As is evident from the foregoing paragraphs,
the magnitude of poverty, complexities of
social milieu, diversities of natural resources
and regional environment and, above all,
emerging needs and aspirations are enor-
mous. As no single institution will be able
to address the multi-faceted livelihood issues
and challenges, successful and sustainable
livelihoods promotion strategies would nec-
essarily require institutional coordination,
convergence and partnerships. Moreover,
large numbers of programmes have been
designed /introduced with various products
and services aimed at poverty reduction and
livelihood enrichment, often resulting in
duplication, overlapping and implemen-
tation bottlenecks. In such a scenario, a
platform/forum should be created for stake
holder consultations and coordination, thus
reducing overlaps and enhancing collective
results. The stake holders in this participa-
tory approach would include: Panchayat
Raj Institutions/local self-government,
NGOs, community-based organizations,
government agencies at district, state and
national levels, banks and inancial institu-
tions, development agencies, academic and
training institutions and resource persons/
practitioners, livelihood-based producers
groups and service providers. As the way
forward clearly emphasizes on convergence,
co-ordination and partnership/participatory
approach, suitable national/state/district/
cluster-level platforms have been envisaged.
Due to the multiplicity of programmes,
interventions at implementation level

192 STATE OF INDIA’S LIVELIHOODS REPORT 2012
usually lack in in pace, quality and effective-
ness. The rationalization of Central Sector
programmes, based on B. K. Chaturvedi
Committee report, if implemented expe-
ditiously, would help in this direction, as
would similar rationalization in state gov-
ernment schemes. Coordination and mutual
commitment of policy-making institutions
and implementing agencies is important.
Mutual responsiveness of Government
of India and state government in liveli-
hood programmes, including NRLM and
MGNREGA, are crucial for smooth imple-
mentation, and the State Government’s
support is much needed for infrastructure
development and various linkages.
Governance, transparency and communication
Notwithstanding the proclaimed vision,
mission, goals and objectives in policy
documents, programmes and schemes
related to livelihoods of the poor, reports
of improper selection of target groups, leak-
ages/diversions in funds, corrupt practices,
non-payment, delay in delivery of claims/
entitlements, lack of disclosures/commu-
nications, violation of the prescribed pro-
cedures, dificulty in access to information/
services are often reported in study reports
and media and public fora. In the approach
papers to Planning Commission, and in
the guidelines on various national liveli-
hood schemes, emphasis has been laid on
e-governance, accountability, transparency
in systems and processes, service, etc., in
order to eliminate the above-reported dis-
tortions. A step in the right direction would
be insistence on adherence to governance
codes, adoption of codes of standards and
fair practices, adequate public disclosures
in audit reports, development and regular
updating of web sites, market intelligence
by policy-makers, documentation and dis-
semination of learnings, computerization
of processes, etc. Upscaling the Aadhar
programme, strengthening the social audit
mechanism, as also concurrent, internal
and statutory audits, sensitization of direc-
tors/boards and committees, progressive
computerization of various rural inancial
institutions including co-operatives, and
streamlining customers’ grievance redres-
sal system are likely to have better and
more salutary impact in implementation
of livelihood schemes. More care, attention
and safeguards need to be directed towards
better targeting, earnest and timely imple-
mentation, and an institutional mechanism
for customers’ protection should be put in
place to fulil the objectives of various liveli-
hood schemes in the years ahead.
Monitoring and evaluation—members’/customers’ awareness/feedback
Efficiency of monitoring and evaluation
systems has been emphasized in all impor-
tant livelihood programme documents.
Field-level feedback, to enable corrective
measures, is built into the design of various
livelihood programmes including donor-
driven programmes. NABARD’s PLPs even
capture farmers’ views to various credit-
related schemes in a separate chapter. As per
NRLM guidelines, stake holder consultations
are envisaged as a prelude to preparation of
AAP and SPIP. A participatory approach in
the design, implementation, monitoring,
appraisal and evaluation of programmes
is focused on in institutional mechanism.
Monitoring and evaluation should be
strengthened in all livelihoods mega schemes,
and should include both off-site and on-site
instruments. A robust off-site surveillance
system (OSS) should be put in place. The
yardstick for evaluation of programmes
should be evolved in a way that ensures all
the variables are manageable. Adherence to
time-lines and benchmarks is important.
Members’ awareness of their rights, entitle-
ments and obligations will ensure proper
implementation of the programme, as dei-
ciencies in supply and demand levels can
be remedied based on informed feedback.
Good systems for such purpose have been an

Potential and Possibilities for Livelihood of the Poor 193
in-built feature for DFID, IFAD and World
Bank-assisted programmes.
The rural poor, particularly women, who
are being mobilized through grass-roots-
level institutions like SHGs, should voice
and seek accountability from providers of
educational, health, nutritional and inancial
services. Legal instruments such as Right to
Information (RTI), Right of Education, for-
est rights and entitlements, and the proposed
food security right, have empowered the
common man to seek his entitlements. The
participation of producers, consumers/users
and members in governing bodies/commit-
tees/associations, e.g., water users/watershed
committee, forest protection bodies, civil
societies organization, etc., vindicates the
voice and views of the poor/ultra poor. With
ownership repositioning, a rights-based
approach, and participatory mechanism, it
will deinitely be possible to change the exist-
ing scenario. To quote AP to Twelfth Plan:
‘Total Quality Management, innovative
use of IT, emphasis on social mobilization
and capacity building, strengthening local
institutions and building partnerships with
civil society organization and community
to determine to the needs and aspiration of
people, improvement of project manage-
ment capabilities’ will be required for better
implementation, accountability and govern-
ance. Consumer protection measures, too,
need to be strengthened.
Looking ahead
As explained in the foregoing paragraphs,
livelihoods are multi-dimensional and
accordingly, a series of initiatives are being
undertaken at various levels. The success and
sustainability of such interventions, despite
numerous challenges, will be dependent on
a host of factors—to ascertain sustainability
of a project/programme/policy, seven ques-
tions need to be asked: Is it socially relevant?
Is it technologically feasible? It is economi-
cally viable? Is it environmentally friendly?
Is it politically expedient? Is it legally permis-
sible? Is it ethically right?
Notwithstanding various concerns on
the economic front, e.g., inlationary pres-
sure, falling value of rupee, rising Non-
performing Assets (NPAs) in agriculture
sector, continuing global slowdown, difi-
culty in achieving 9 per cent growth, etc., the
development measures listed below will have
signiicant impact on livelihood opportuni-
ties for the poor, in the years ahead.
1. Progressive implementation of NRLM
across states with preparation of SPIP
and adoption of identiied strategies.
2. Commencement of implementation
of various approaches envisaged under
Twelfth FYP with due approval of
NDC.
3. Empowerment of the vulnerable sec-
tions with passage of various legisla-
tions including Food Security Bill,
Women Farmers Entitlement Bill,
Land Acquisition, Rehabilitation and
Resettlement Bill, etc.
4. Improvement of MIS and monitoring
systems with availability of critical data
on potential sub-sectors, value chain,
livelihood options, etc.
5. Greater progress in implementation of
Financial Inclusion Plan resulting in
deepening of financial services from
banks and inancial institutions through
branch expansion, BC/BF network, etc.
6. Corporate entry and interventions
bringing synergy in PPP, networking,
innovations, competitiveness, employ-
ability of youth.
7. Merger and rationalization of various
government schemes, resulting in better
effectiveness.
8. Finalization of Poverty Measurement
Indices will bring clarity on the magni-
tude of poverty.
9. Focus on NABARD’s SHG 2 strategies
under SHGBLP facilitating greater
participation of bankers in graduation
of SHGs and low of livelihoods inance
through SHG structure.
10. Enhanced capacity-building efforts for
all stake holders under SHG-2, strategic
interventions by the Skill Development

194 STATE OF INDIA’S LIVELIHOODS REPORT 2012
Mission for skill-building, entrepre-
neurship and vocational training, etc.,
bringing about greater employability of
the skilled poor.
11. Availability of the results of various pilot
studies/experiments undertaken by
the state livelihood authorities, during
preparatory stages, providing scope for
innovation in livelihoods models and
replication of best practices.
12. Institution-building at various levels—
SHG federation, community-owned
organizations, producer companies—
and process re-engineering in existing
institutions—RUDSETIs/RSETIs,
livelihood learning centres—building
sustainability in livelihood operations.
13. All livelihood models—cluster develop-
ment, rural business hubs, technology-
based agriculture practices/service
activities, participatory approaches,
etc.—if taken forward appropriately
and in the desired pace and manner, will
usher in considerable improvement in
the quality of implementation. Progress
in the livelihoods sector will enable India
to meet the goals under Millennium
Development Goals (MDG) by 2015.
It will bring India towards progressive
fulilment of the goals set by Vision 2020
of the Planning Commission that states,
‘Our vision of India—2020 is nation
building with energy, entrepreneurship
and iInnovation’ (Government of India,
2002). To quote the AP to the Twelfth
FYP:
Some of the challenges themselves emanate
from the country’s economy’s transition to
a higher and more inclusive growth paththe
structural changes that come with it and
expectations it generates. These challenges call
for renewed efforts on multiple fronts, learn-
ing from the experience gained and keeping
in mind global developments.
The test for appropriateness of future
interventions for livelihoods of the poor can
be best described by the advice of Mahatma
Gandhi:
I will give you a talisman. Whenever you are
in doubt or when the self becomes too much
with you, apply the following test. Recall the
face of poorest man (woman), whom you
may have seen and ask yourself, if the step
you contemplate is going to be of any use to
him (her), own life and destiny.
The complete quotation for this would be
as follows:
I will give you a talisman. Whenever you are
in doubt, or when the self becomes too much
with you, apply the following test. Recall
the face of the poorest and the weakest man
[woman] whom you may have seen, and
ask yourself, if the step you contemplate is
going to be of any use to him [her]. Will he
[she] gain anything by it? Will it restore him
[her] to a control over his [her] own life and
destiny? In other words, will it lead to swaraj
[freedom] for the hungry and spiritually
starving millions?
Then you will ind your doubts and your
self melt away.
References
ADECCO Institute and Tata Institute of Social Sciences.
2009. ‘Indian Labour Market Report’, ADECCO
Institute and Tata Institute of Social Science,
Mumbai.
Assam State Rural Livelihoods Mission Society. 2012.
Presentation on Annual Action Plan (2012–2013)
by Government of Assam to MoRD, Government
of India, New Delhi, 22 May 2012.
Batra, Vikas and Soumya Aneja. 2012. ‘Cluster
Development Programme—A Methodology for
Sustainable Business Development for Poverty
Alleviation and Micro enterprise Promotion’,
paper presented at National Conference on
Emerging Challenges for Sustainable Business.
Bihar Rural Livelihood Promotion Society. 2007.
‘Jeevika—Project Implementation Plan’ (Project
Assisted by World Bank), Bihar Rural Livelihoods
Society, Department of Finance, Government of
Bihar, Patna.
Care India and FAO. 2007. ’Moving from Micro
Credit to Livelihood Finance’, CARE India, New
Delhi in collaboration with Food and Agriculture
Organisation, Rome.
Chakrabarthy, K. C. 2011.’Financial Inclusion Road
India Need to Travel’. Available at www.rbi.
org
Chhattisgarh State Rural Livelihood Mission. 2011.
AAP Presentation (2012–2013) to Ministry

Potential and Possibilities for Livelihood of the Poor 195
of Rural Development, Government of India,
New Delhi.
Das, Keshab. 2012. ‘Indian Rural Clusters and
Innovation-Challenges for Inclusion’, Economics,
Management and Finance Markets. New York:
Addleton Academic Publishers.
Finance Ministry. 2012. ‘Union Economic Survey—
2012’, Government of India, New Delhi. Available
at www.inanceministry.nic.in
Gnaranjan, Sri. 2008. ‘Basix—Micro Insurance for
protecting Livelihoods’, paper presented at Micro
Finance Summit, Nepal.
Government of India. 2002. ‘Report of Committee
on India Vision—2020’, Planning Commission,
Government of India, New Delhi.
———. 2010. State perspective and Implementation
Plan—Template (Annexure 4), Ministry of Rural
Development, New Delhi.
———. 2012. Presentation of Jharkhand Annual Action
Plan (AAP) to Empowered Committee Review
Meeting at Ministry of Rural Development, New
Delhi, 7 May 2012.
Government of Odisha. 2008. The Orissa Poverty
Reduction Mission, Target Rural Initiatives for
Poverty Termination & Infrastructure (TRIPTI)—
Project Implementation Plan. Panchayat Raj
Department, Bhubaneswar.
IDF. 2011. ‘Sujeevan—Financial Inclusion for liveli-
hoods, Security’, Sustainable Livelihood Highlights,
IDF, Bangalore.
IL&FS Cluster. 2007. ’Food Processing in Bihar-The
Road Ahead’.
———. 2010. ‘Operationalising the Agro_busi-
ness Infrastructure Development Investment
Programmee.’ Available at the public domain.
Jeevika Rural Livelihoods Promotion Society. 2011.
‘State Perspective and Implementation Plan
(SPIP—2011–12 to 2021–22)’, Department of
Finance, Government of Bihar for NRLM, MORD,
GOI, New Delhi.
Jharkhand State Livelihood Promotion Society.
2011. Report and Proceedings of State Level
Consultation Workshop on NRLM (26–27
August 2011).
Khan, H. R. 2012. ‘Issues and Challenges in Financial
Inclusion: Policies, Partnerships, Processes and
Practices.’ Available at www.rbi.org
KPMG and Access Development Services. 2012. ‘Himachal
Pradesh State Rural Livelihoods Promotion in the
State—Project Inception presentation’, report pre-
sented before HP State Rural Livelihoods Mission,
Rural development Department, Government of
Himachal Pradesh, Shimla.
Madhya Pradesh Rajya Ajeevika Forum. 2012. ‘AAP
(2012–13) for NRLM in Madhya Pradesh’, pre-
sented to MoRD, New Delhi on 15 May 2012.
Mahajan, Vijaya. 2005. ‘From Micro Credit to
Livelihood Finance’, text of speech of Sri Mahajan
for falicitating Dr M. S. Swaminathan on his 80th
birthday.
Mahajan, Vijaya. 2010. ‘Credit is Necessary but Not
Ample Condition for Livelihood Promotion’,
Financial Express , Micro Finance World
(Mumbai), April, May, June 2010, Special Issue
on Livelihoods sponsored by NABARD.
Maharashtra State Livelihoods Mission. 2012–2013.
‘AAP 2012–13 for NRLM’, report submitted to
MoRD, GOI, New Delhi.
Mahendra, Dev S. and M. Venkatenarayan. 2011.
‘Youth Employment and Unemployment in
India’. Available at www.igidr.ac.in
Ministry of Finance. 2012. Union Budget 2012–13.
Finance Minister’s Budget Speech on 16 March
2012.
Ministry of Rural Development. 2010. ‘NRLM
Programme Implementation Plan’, Ministry of
Rural Development, Government of India, New
Delhi. Available at www.ajeevika.org.in/nrlm
Ministry of Statistics and Programme Implementation.
2011. ‘MDG—India Country Report—2011’,
Central Statistical Organization, Ministry of
Statistics and Programme Implementation,
Government of India, New Delhi. Available at
www.mospi.nic.in
Ministry of Textiles. 2011–2012. ‘Revival, Reform and
Restructuring Package for Handloom Sector’,
Office of Development Commissioner for
Handlooms, Ministry of Textiles, Government of
India, New Delhi. Available at textmin.nic.in
National Sample Survey Ofice. 2011. ‘Key Indicators
of Employment and Unemployment in India—
2009–10’, Ministry of Statistics and Programme
Implementation, Government of India, New
Delhi.
Odisha Livelihoods Mission. 2012–2013, ‘Presentation
on Odisha Annual Action Plan (2012–13)’, report
submitted to Ministry of Rural Development,
Government of India, New Delhi.
Panchayat Raj Department. 2012–2013. Policy Note
2012–13 of Minister for Rural Administration
and Rural Development, Government of Tamil
Nadu, Chennai.
Planning Commission. 2002. ‘Report of the Committee
on India Vision—2020’, GoI, New Delhi.
———. 2011. ‘Faster, Sustainable and More Inclusive
Growth’, An Approach to Twelfth Five Year Plan,
Government of India, New Delhi.
———. 2012. ‘Report of 12th Plan (2012–2017)’,
Steering Committee on Rural Livelihoods and
Rural Governance, Planning Commission, New
Delhi.Reserve Bank of India. 2011. ‘RBI Annual
Report 2010–11’. Mumbai: Central Ofice of RBI,
August 2011.
———. 2012. ‘Report of the Committee to Re-examine
the Entire Classification and Suggest Revised
Guidelines with Regard to Priority Sector Lending
Classification and Related Aspects’, February
2012. D. Subba Rao, Governor, Reserve Bank of
India, ‘Agricultural Credit-Accomplishments and
Challenges’ (12 July 2012, Mumbai).

196 STATE OF INDIA’S LIVELIHOODS REPORT 2012
Society for Elimination of Rural Poverty (SERP).
2002. Andhra Pradesh Rural Poverty Reduction
Project—Project Implementation Plan, Ministry
of Rural Development, GoI.
State Mission. 2011. ‘Kudumbashree—State Rural
Livelihood Mission—SPIP under NRLM’, report
submitted to Ajeevika, MORD. GoI, New Delhi.
Available at www.ajeevika.org
Tankha, Ajay, 2012. Banking on SHGs—Twenty Years On’
for Access Development Services. New Delhi: SAGE
Publications and Access Development Services.
Thorat, Y. S. P. and Howard Jones. 2011. ‘Remittance
Needs and Opportunities in India’, NABARD
Rural Financial Institutions Programme (RFIP),
German Development Cooperation (GIZ), New
Delhi.
World Bank. 2008. ‘Growth and Poverty Reduction
in Agriculture’s Three Worlds’, World Bank
Development Report. Washington D.C.: The
World Bank.

About the Editor and Contributors
The editor
Vipin Sharma is the CEO of ACCESS Development Services. He is responsible for institu-
tionalization and expansion of the organization as a pan-Indian resource organization to
support livelihoods outreach. He has earlier worked in CARE India as Programme Director,
Microinance, heading CASHE (Credit and Savings for Household Enterprises), CARE’s
largest microinance programme worldwide. Prior to that, he was Executive Director, Rural
Non Farm Development Agency (RUDA), Government of Rajasthan. He holds a Bachelors
degree in History from St. Stephen’s College, Delhi University, and a Masters in History from
University of Rajasthan, Jaipur.
The Contributors
Unmesh Brahme is a Yale World Fellow and co-founder of Sustainability CXO Partners
Worldwide, a strategy and impact investing advisory irm, and Climate Civics Institute, a com-
munity centric initiative in adaptation and policy innovation. Mr Brahme serves on several
Indian and global not-for-proit boards and teaches sustainability, corporate social responsi-
bility and inclusive economy strategy at business schools and public forums globally.
Sankar Datta works as a Professor at Azim Premji University. Dr Datta holds a Bachelors
degree in Agriculture and Animal Husbandry from GB Pant Agriculture University, Pantnagar,
Uttar Pradesh, a postgraduate diploma in Rural Management from the Institute of Rural
Management, Anand, Gujarat, and a PhD in Economics from Sardar Patel University, Gujarat.
He was at Madhya Pradesh Oilseeds Co-operative Federation, PRADAN and the Indian
Institute of Management (Ahmedabad), before joining the faculty of the Institute of Rural
Management, Anand, for ive years. He serves on the board of directors at various agencies
supporting livelihoods. He has been a member of the Task Force constituted by the Planning
Commission of India focusing on rural livelihood generation. He is also on the Advisory
Board of the Centre for Management of Agriculture of the Indian Institute of Management
(Ahmedabad).
Biswa Bandhu Mohanty has worked with NABARD for 28 years in the areas of development
inance and rural development, particularly promotion of the non-farm sector, microinance,
human resource development, supervision of rural inance institutions, agriculture inancing
and institutional development. He was Chief General Manager for eight years and headed
important departments. Prior to joining NABARD, Mr Mohanty worked for nine years with
Utkal University, Orissa Finance Service, Steel Authority of India Limited and Reserve Bank
of India. After his retirement from NABARD, he has been engaged as a freelance consultant
to reputed national and international agencies in his areas of expertise.

198 STATE OF INDIA’S LIVELIHOODS REPORT 2012
Tara Nair is an Associate Professor in Gujarat Institute of Development Research, New Delhi.
She has published in journals and edited books on topics like inancial intermediation and
commercial banks, trends and patterns in the Indian microinance sector, inancial inclusion,
microenterprise development and media economics and policy. She has also been part of large
scale ield studies on the impact of microinance in India, Myanmar and Bangladesh.
Smita Premchander is the Secretary of Sampark and a development consultant. She special-
izes in microinance, microenterprise, women’s empowerment, working with extreme poor
and bonded labour programmes, social protection and social inclusion.
Suryamani Roul, Vice President, Livelihoods, ACCESS Development Services, has expertise
in enterprise and entrepreneurship promotion with intensive exposure in remote areas and
tribal communities. He has earlier been Project Director, Sustainable Tribal Empowerment
Project, CARE-India, Andhra Pradesh, and Project Manager, CREDIT Project under CARE-
India’s Small Economic Activities Development (SEAD) Programme supported by DFID’s JFS
support with World Food Programme and Rotary Foundation in undivided Bihar (Ranchi).
He holds a Bachelors degree in Economics from Utkal Universsity, a Masters in Analytical and
Applied Economics from Utkal University and an MBA from University of Calcutta.
Ashok Sircar is a National Programme Director with Rural Development Institute. Before
this, he was Professor, Development Studies and Action, Azim Premji University, Bangalore.
He has worked intensively on land reform issues, disaster management and local governance.
He has designed and implemented extensive training programmes for government oficials,
NGO workers and panchayat functionaries. He has also written 15 popular books in Bengali
on disaster preparedness, SHGs, microinance, Panchayati Raj and the Right to Information
(RTI). He has been the author of the chapter ‘Reflections on Livelihoods Policies’ in the SOIL
Report 2011.