STATE OF INDIA'S LIVELIHOODS - Grameen Foundation India
172
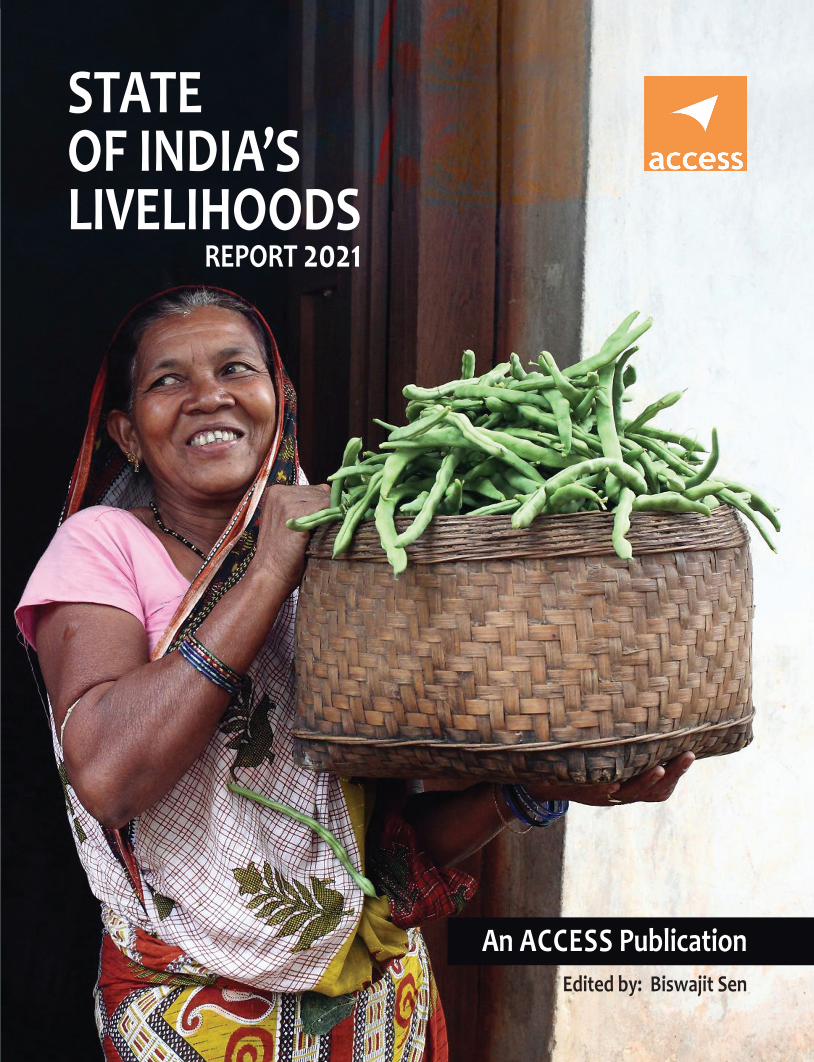
STATE OF INDIA’S LIVELIHOODS REPORT 2021 An ACCESS Publication Edited by: Biswajit Sen
-
Upload
khangminh22 -
Category
Documents
-
view
0 -
download
0
Transcript of STATE OF INDIA'S LIVELIHOODS - Grameen Foundation India
STATE OF INDIA’S LIVELIHOODS
REPORT 2021
An ACCESS PublicationEdited by: Biswajit Sen
Supported by
The State of India’s Livelihoods (SOIL) Report is an annual publication addressing the contemporary issues emerging in the livelihoods sector. It is the only document that aggregates the experiences and challenges of the sector, analyses case studies and Report on the progress of both government-run and privately-run programs. It is released at the Livelihoods India Summit, a national level event organised by ACCESS.
For the last 13 years ACCESS has continued to bring out the State of India’s Livelihoods Report year after year, with an aim to inform policy makers and practitioners on the various issues that the poor constantly grapple with. This year’s Report assimilates current debates and developments around the livelihoods of the poor and their plight especially in view of the ongoing pandemic and its devastating second wave.
Given the diversity and complexity of the livelihoods landscape, the SOIL Report can never be comprehensive and complete. While some core themes are continued from the previous year’s Reports, to provide stability to the Report structure, interesting new themes have also been added. The continuing coverage includes an overall scenario of the livelihoods of poor and policy and programme interventions by the Government in response to COVID 19. The Report also covers two themes relating to the agriculture sector. While one tries to make sense of ground realities as it relates to the central sector scheme on formation and promotion of 10,000 FPO, the other looks at sustainable agriculture policies and practices as it is evolving in India. The coverage on future of jobs and women in informal sector, critically looks at livelihoods of youth and women and explores more inclusive policies. The Report also builds on previous coverage in SOIL Report 2019 on five years of CSR practice in India and further presents a commentary on how CSR has changed and how much of these changes are likely to continue.
Editor:Biswajit Sen
Contributing Authors:Biswajit SenDeepika PingaliKasturi SharmaPriti GulatiSaumya PremchanderSmita Premchander Prabhat LabhM. ManjulaRicha GovilAnnapurna NetiShankar Venkateswaran Ashok Kumar Sircar
ISBN 978-81-955245-2-5
9788195524525
STATE OF IN
DIA’S LIVELIH
OO
DS REPO
RT 2021


STATE OF INDIA'S LIVELIHOODS
REPORT 2021

Copyright @ Access Development Services 2021
All right reserved. No part of this book may be reproduced or utilised in any form or by any means, electronic or mechanical, including photocopying, recording or by any information storage or retrieval system, without permission in writing from this publisher.
ACCESS Development Services22, Ground Floor, Hauz Khas VillageNew Delhi 110016www.accessdev.org
ISBN 978-81-955245-2-5Disclaimer: The view expressed in this publication are those of the authors and do not necessarily refl ect the view and policies of ACCESS. NABARD and Rabobank do not assume any responsibility for the content published in this report.

List of Tables ivList of Figures vAnnexure vList of Abbreviations vi
Foreword ix1. Overview 1 Biswajit Sen
2. Women in Informal Sector 19 Deepika Pingali, Kasturi Sharma, Priti Gulati, Saumya Premchander, Smita Premchander
3. Future of Jobs in India 47 Prabhat Labh
4. Sustainable Agriculture 79 M. Manjula
5. Farmer Producer Companies: From Quantity to Quality 99 Richa Govil and Annapurna Neti
6. Reshaping of CSR during COVID-19 115 Shankar Venkateswaran
7. Livelihoods Policies in COVID-19 Times 129 Ashok Sircar
About the Sponsors 151
About the Authors 153
Contents

iv STATE OF INDIA'S LIVELIHOODS REPORT -2021
LIST OF TABLESTable 1.1. India GDP Growth Rates 5Table 3.1. Urban and Rural Unemployment Rate in India in Last 12 Months 51Table 3.2. Unemployment Rate in % for Persons 15 Years and Above under
Usual Status with Different Educational Attainments 51Table 3.3. Estimate of Labour Force and Unemployment by
Max Educational Qualification 53Table 3.4. Labour Force, Employment and Unemployment by Age Groups 54Table 3.5. States with Highest and Lowest Levels of Educational Attainments 54Table 3.6. Best and Worst Performing States on Ratio of Female 15–64 Years
in Labour Force as a Percentage of Total Persons 55Table 3.7. Best and Worst Performing States on Ratio of Female Workers to Male
Workers and Percentage of Female Population with Secondary Education 55Table 3.8. Most and Least Capital Intensive Industries 57Table 3.9. Largest Job-Creating Industries 58Table 3.10. Industries Creating Least Number of Jobs 58Table 3.11. Estimated Employment in the MSME Sector (Activity Wise) 62Table 3.12. Distribution of Employment by Type of Enterprises in
Rural and Urban Areas (Numbers in million) 62Table 3.13. Number and Amount of Loans Disbursed under PMMY 63Table 3.14. Number and Amount of Loans under Different Categories of MUDRA Loans 63Table 3.15. Private Equity-Venture Capital Investment in Education, EdTech Firms 68Table 5.1. Total Equity Grant Scheme Sanctions from its Inception until
31 March 2021, among States with More than 20 Cases Sanctioned 101Table 5.2. Guarantees under Credit Guarantee Scheme since Its Inception,
for States with More than 10 Sanctioned Cases 101Table 5.3. Budgetary allocations under Scheme for Promotion of 10,000 FPOs 102Table 5.4. State-Wise Distribution of Producer Companies, for Top 20 States 105Table 5.5. Comparison of Key Characteristics of Producer Companies Registered
in Latest and Preceding Financial Years 107Table 7.1. A Few Indicators of Livelihood Distress Due to COVID-19 and Lockdown 130Table 7.2. Livelihoods Policy Response in Union Budget 131Table 7.3. Government Subsidies to Support Agri-production and Procurement 131Table 7.4. States’ Response to Livelihood Distress 133Table 7.5. MNREGA Work Demand and Person Days Generated: Change during
the Pandemic Years 135Table 7.6. MNREGA Performance of 16 Major States during Three Years 137Table 7.7. ONORC Data for Interstate Migrants for the September 2021 141Table 7.8. ONORC Data for Intra-district and Inter-district Migrants within the
Same State 141Table 7.9. PM Fasal Bima Yojana Performance during Kharif Season of 2020–2021
and 2021–2022 142

Contents v
LIST OF FIGURESFigure 1.1. Sustainable Livelihoods Framework 2Figure 2.1. Gender-wise Selected Categories of Informal Workers in India
during 2017–2018 20Figure 2.2. The Four Pillars of Decent Work 21Figure 2.3. The GESI Framework 22Figure 2.4. Women’s Employment across Formal and Informal Sectorswork 23Figure 3.1. Labour Force Participation Rate in India: Urban and Rural (Aug 2021) 52Figure 3.2. Labour Force Participation Rate in India: Male and Female (Aug 2021) 52Figure 3.3. The Association between Education and Income 53Figure 3.4. Distribution of Employment in the MSME Sector Category Wise 62Figure 5.1. Number of Producer Companies Registered by Financial Year 104Figure 5.2. Number of Producer Companies Registered in FY20 and FY21 106Figure 5.3. FPC Density (Number of FPCs per 1 lakh Agricultural Workers) as of
31 March 2021 106Figure 5.4. Key Characteristics of a Two-Tier Model for FPCs 109
ANNEXUREAnnexure 4.1. Sustainable Agriculture Systems/Practices: Principles,
Core Practices, Sustainability, Scale and Agencies 91

vi STATE OF INDIA'S LIVELIHOODS REPORT -2021
LIST OF ABBREVIATIONS
3IR Third industrial revolutionADP Aspirational Districts ProgrammeAIF Agriculture Infrastructure FundANMs Auxiliary nurse-midwivesASHA Accredited Social Health ActivistAUEGS Ayyankali Urban Employment Guarantee SchemeAWH Anganwadi helperAWWs Anganwadi workersBFSI Banking, Financial Services and InsuranceBPKP Bhartiya Prakritik Krishi PadhatiCBBOs Cluster Based Business OrganizationsCMIE Centre for Monitoring Indian EconomyCRIDA Central Research Institute for Dryland AgricultureCSE Centre for Science and EnvironmentCSOs Civil society organizationsDBT Direct Benefit Transfere-NAM Electronic national agriculture marketEPFO Employees’ Provident Fund OrganisationETL Economic threshold limitFAO Food and Agriculture OrganizationFPCs Farmer Producer CompaniesFPOs Farmer Producer OrganizationsGDP Gross domestic productGER Gross enrolment ratioGESI Gender Equality and Social InclusionGVA Gross value addedIBC Insolvency and Bankruptcy CodeICAR Indian Council of Agricultural ResearchICDS Integrated Child Development ServicesIFAD International Fund for Agricultural DevelopmentIFPRI International Food Policy Research InstituteILO International Labour OrganizationIMPS Immediate payment serviceKBOCWWB Karnataka Building And Other Construction Workers Welfare BoardLEIA Low External Input AgricultureLF Labour forceLPR Labour participation rateMCA Ministry of Corporate AffairsMDGs Millennium Development Goals

Contents vii
MGNREGA Mahatma Gandhi National Rural Employment Guarantee ActMoRD Ministry of Rural DevelopmentNAMG National ASHA Mentoring GroupNBFCs Non-banking financial companiesNFSA National Food Security ActNGRBC National Guidelines on Responsible Business ConductNIIF National Investment and Infrastructure FundNIP National Infrastructure PipelineNMSA National Mission for Sustainable AgricultureNOFP National Organic Farming PolicyNRLM National Rural Livelihoods MissionNSDA National Skill Development AgencyNSO National Statistical OfficeNSSO National Sample Survey OfficeONORC Operationalization of One Nation One Ration CardPCs Producer companiesPDS Public Distribution SystemPE Private equityPHC Primary healthcarePKVY Paramparagat Krishi Vikas YojanaPLFS Periodic Labour Force SurveyPMKSY Pradhan Mantri Krishi Sinchai YojanaPMMY Pradhan Mantri MUDRA YojanaPR Participation ratePUC Paid-up capitalRBI Reserve Bank of IndiaRMKU Rajasthan Mahila Kaamgar UnionRTS Rooftop solarSDGs Sustainable Development GoalsSEWA Self Employed Women’s AssociationSFAC Small Farmers’ Agri-business ConsortiumSHG Self-help groupSOIL State of India’s LivelihoodSRI System of rice intensificationUER Unemployment rateUPI Unified Payments InterfaceVC Venture capitalVUCA Volatile, Uncertain, Complex and AmbiguousWFP World Food ProgrammeZBNF Zero budget natural farming

Foreword ix
ForewordRecent data speaks of the magnitude and dimensions of poverty in India and thus the
issues encompassing livelihoods of the poor. According to the recently published first National Multidimensional Poverty Index (MPI) released by the NITI Aayog that is based on the National Family Health Survey (NFHS) for 2015-16, using three dimensions viz. education, health, and standard of living, a quarter of India’s population was still poor in that year. MPI for 2021, launched by UNDP and Oxford Poverty and Human Development Initiative, University of Oxford, prepared on basis of 10 indicators such as nutrition, years of schooling, access to cooking fuel, sanitation, drinking water, electricity, etc., shows that 27.9 per cent of India’s population are multidimensionally poor.
Given devastating impact of the COVID-19 pandemic in its many forms and slowdown on all economic fronts over the last two years, the livelihoods of cross sections of the population in the country have been hard hit. While India had made remarkable strides to end poverty in recent years till 2019, the unprecedented COVID-19 pandemic slowed decades of progress to a large extent, halting the pace in improving livelihoods - be it farm, non-farm or off-farm segments and thereby exacerbating the poverty situation. A class of ‘new poor’ is an added challenge to India due to job loss, reverse migration, slowdown in industry and services sectors.
However, in spite of the prevailing pandemic situation, there are some good signs too. As per the Brookings report, India is no longer the country with the world’s most poor. As per the real-time data from the World Poverty Clock, 6 percent or 86.8 million of the Indian population are living in extreme poverty, but 30 Indians are also escaping extreme poverty every minute.
In order to protect livelihoods, the Government has initiated several measures, including ensuring food security, cash transfers to farmers and poor households, and economic stimulus towards the economic recovery and strengthening the health infrastructure. The major challenge remains to accelerate the strategies and utilise the available resources towards the faster revival and reconstruction of economic activities along with a fight against the COVID-19 pandemic.
The agriculture sector favoured by good monsoon over two years has performed well as compared to other sectors. In tune, both Government and private sectors are putting higher allocations on agriculture, promoting climate resilient sustainable agriculture, food processing, market reforms and collectivisation of small holder farmers through the Centrally Sponsored Scheme for formation and promotion of 10,000 FPOs. These are progressive steps from the view point of policy, targeting at improving the livelihoods of farmers.
For the last 13 years ACCESS has continued to bring out the State of India’s Livelihoods Report year after year, with an aim to inform policy makers and practitioners on the various issues that the poor constantly grapple with. This year’s report assimilates current debates and developments around the livelihoods of the poor and their plight especially in view of the ongoing pandemic and its devastating second wave. The 2021 SOIL Report has seven chapters authored by well known sector experts: Biswajit Sen, Smita Premchander, Prabhat Labh, M. Manjula, Richa Govil, Annapurna Neti, Shankar Venkateswaran and Ashok Sircar. While a few have come on board for the first time, Smita Premchander, Shankar Venkateswaran and Ashok Sircar have played a crucial role in bringing out past reports.

x STATE OF INDIA'S LIVELIHOODS REPORT -2021
The ‘Overview’ by the editor for this year’s Report Mr. Biswajit Sen, focuses on how the COVID 19 pandemic combined with various trial and error policies, have affected the lives and livelihoods of different population groups in different ways and to a varying extent. It emphasizes that discussing livelihoods in the limited framework of macro-economic trends is neither inclusive nor sustainable in the long run, when a very large percentage of India’s population is still poor and vulnerable. Dwelling briefly on the current policies and programmes for employment generation, Biswajit concludes on the note that it is not enough to have progressive policies and programmes, but quality institutions implementing such policies are equally critical.
The second chapter by Smita Premchander et al. analyses the situation of women in informal economy in India, in some of the heavily feminized sectors such as Anganwadi and ASHA workers, domestic workers and construction workers. The authors also examine the impact of COVID 19 on chosen sectors and on the working conditions of women in particular, while highlighting the contribution of women workers to these sectors during COVID 19.
Prabhat Labh in his chapter ‘Future of Jobs in India,’ discusses major trends and issues related to the state of jobs and employment in India. Starting with the impact of COVID-19 on jobs, he moves on to comprehensively review jobs in select sectors including Agri and Allied sectors, MSMEs, Green Jobs, Tourism and Hospitality, Education and EdTech, Banking and Financial Services, Infrastructure and IT and IT enabled services.
M. Manjula's chapter starts by presenting a contrast on the political versus scientific discourse on sustainable agriculture and the need to bring about clarity in conceptual understanding of sustainable agriculture across discourses. She moves on to present the status of sustainable agriculture in India in terms of policy and budgetary support, while dwelling on experiences around few sustainable agriculture practices such as zero budget natural farming and organic farming. She concludes by presenting potential solutions to scale up sustainable agriculture through either customizing existing programmes and policies or designing new programmes and policies that will have greater adoption among farmers.
In their chapter ‘Farmer Producer Companies: From Quantity to Quality,’ authors Richa Govil and Annapurna Neti try to make sense of ground realities and policies as we look at a future with thousands of Farmer Producer Companies ecosystems operating in the country. Starting with describing the current landscape of Farmer Producer Companies, the chapter goes on to look at possible impact of recent policy changes, concluding with some thoughts on approaches for the future.
Chapter 6 'Reshaping of CSR during COVID 19,' by Shankar Venkateswaran, builds on the previous coverage in SOIL Report 2019 on five years of CSR practice in India and further presents a commentary on how CSR has changed and how much of these changes are likely to continue.
In the final chapter ‘Livelihoods Policies in COVID Times,’ Dr. Ashok Sircar takes up from where he left off in SOIL Report 2020, looking at specific policy and programme interventions by the Union Government in response to COVID 19, while making attempts to capture specific measures taken by few state Governments that are noteworthy. To conclude, the chapter also focuses on imagining effective pathways for addressing policy gaps.
I would like to express my gratitude to all stakeholders who have continued to support the State of India’s Livelihoods Report. I would like to thank Rabobank Foundation and Mr. Arindom Datta for the continued support to the Report. The financial assistance received from Research and Development Fund of National Bank for Agricultural and Rural Development towards publication of SOIL is gratefully acknowledged.
I would like to thank all the authors for their efforts in coming out with well researched chapters. Special thanks to Mr. Biswajit Sen who accepted our request and took on the responsibility to edit the Report, giving qualitative input to the authors at different stages, and finally tightening the whole document and bringing it together as a composite report. The report has hugely benefited from his strong support to the entire process.
I would also like to acknowledge the efforts put in by Parul from the Livelihoods India Team for support and coordination with the authors and managing the process for coming out with the Report

Foreword xi
smoothly. The Team was ably supported by Lalitha on all fronts. Last but not the least, I thank Mr. Vipin Sharma our CEO for guidance and direction as always in bringing out this Report.
I hope with our combined efforts; the SOIL Report reaches a wide readership this year and continues to be a good reference document for those interested in livelihoods promotion in India.
The State of India’s Livelihood Report will be launched at the Livelihoods India Summit on December 16, 2021
Puja GourVice President


Overview
1
1.1. Preamble‘You take my life when you take the means whereby I live’ (Shakespeare, 1600). The above dramatic quote from Shakespeare defines livelihoods in its broadest sense, not only in terms of what is narrowly used as an economic term—as a source of income for an individual, family or community—but also in terms of identity and dignity. While we delve deeper into the various dimensions of livelihoods, as we move forward in this year’s State of India’s Livelihood (SOIL) report, in terms of statistics, sectors, policies and practices, it is important that we keep in the background the human benefit and cost that arises out of sustainable livelihood generation and loss.
The non-economic dimensions of livelihood are particularly important when observing what we have all seen in the past year, the devastating impact that the COVID-19 pandemic in its many forms (waves) has had on the citizens, particularly the poor and vulnerable. Hence, for this year’s SOIL Report, the COVID-19 challenge and effect will continue to be an underlying theme when we discuss livelihoods. It is in this context that the
Biswajit Sen
following SOIL 2021 Report, and the introductory overview, has expanded the definition of livelihoods to include many dimensions that were discussed in the early days of the use of the term ‘livelihood’, but which seem to have been dropped from the mainstream debates on livelihoods in recent years (Department for International Development, 2000). Among the oldest and most widely used definition of livelihoods is the following:
A livelihood comprises the capabilities, assets and activities required for a means of living. A livelihood is sustainable when it can cope with and recover from stresses and shocks and maintain or enhance its capabilities and assets both now and in the future, while not undermining the natural resource base. (Department for International Development, 2000)
This framework, while focusing primarily on economic factors such as income and assets, draws in both vulnerabilities and capabilities, which has again become very relevant in the context of COVID-19.

2 STATE OF INDIA'S LIVELIHOODS REPORT -2021
The framework depicts stakeholders as operating in a context of vulnerability, within which they have access to certain assets. Assets gain weight and value through the prevailing social, institutional and organizational environment (policies, institutions and processes). This context decisively shapes the livelihood strategies that are open to people in pursuit of their self-defined beneficial livelihood outcomes. (Kollmair & Gamper, 2002)
Figure 1.1. Sustainable Livelihoods Framework
Source: Department for International Development (2000).
The above definition and framework of livelihoods is shown in Figure 1.1 above and is particularly relevant in the time of COVID-19, as it encompasses not only income but also access and expenditure such as on health; the asset base that allows a family to cope with shocks, as well as debt for expenditure such as for COVID-19 treatment. But, most important of all, it helps us to understand and analyse vulnerabilities to which we now turn to.
1.2. COVID-19 and Resulting VulnerabilitiesThe devastating second wave of the countrywide COVID-19 pandemic affected us all in some ways this year, directly and indirectly. It’s reach
across the country, the speed with which it spread from urban to deep rural areas and the acuteness and permanency of the morbidity and mortality that it left behind affected all dimensions of life, including livelihoods. The conflict between livelihood loss and COVID-19 spread was never sharper. The impact was compounded by the inability to anticipate and plan for the wave on the one hand, and the acute capacity constraints that characterize the public health system in India on the other. The COVID-19 pandemic, combined with the various trial and error policies implemented by governments at different levels to combat it, has had an uneven impact on different sections of the population and exposed some of the inherent vulnerabilities relating to the livelihoods of different population groups.
1.2.1. Impact on Sectoral LivelihoodsAt the broadest level, livelihoods have been directly and adversely affected in several sectors that were virtually shut down due to both COVID-19 and the consequent lockdowns and travel restrictions. These included sectors that employ a large number of people from different segments of the population and include several subsectors within them. Such sectors include tourism, which within it also houses the subsectors of eateries and restaurants, hotels, handicrafts, entertainment, etc. Another badly affected sector was that of transport, both urban and rural. Both of these sectors have a very wide range of formal and informal players and employ a very large number of local and migratory labour. The disruption of global supply chains and markets affected export-based, labour-intensive sectors such as textiles and ready-made garments. Construction, which is a large employer of both skilled and semi-skilled labour, is another sector that was adversely affected and only in recent months has shown signs of picking up. But the livelihood impact of COVID-19 has been far more complex than what is apparently visible. Some occupations which were inherently vulnerable have been completely wiped out in specific locations and clusters, for example, street vendors, waste pickers, performance artists, restaurant workers, pastoralists, barbers, artisans, etc. In fact, the largest employer in India
Livelihood Strategies
- More income- Increased
well-being- Reduced
vulnerability- Improved
food security- More sustain-
able use of NR base
StructuresLevels of govern-ment Private sector Laws
Policies Culture
Institutions Processes
ShocksTrendsSeasonality
Influence&
access
Human Capital Natural Capital Physical Capital Financial CapitalSocial Capital
in order to achieveLivelihood
Assets
VulnerabilityContext
TransformingStructures &
Processes
Livelihood Outcomes

Overview 3
continues to be such niche occupations in the unorganized sector that are easy to enter but also very unorganized.
It is generally believed that the first COVID-19 wave in 2020 largely hit urban India, and rural occupations such as agriculture were not adversely impacted. However, this has not been so throughout the COVID-19 pandemic period. With local transport being affected and widespread shutdown of mandis, even local supply chains for farm inputs and outputs were affected, and small farmers have found it very difficult to sell their produce. Migration out of rural India is essentially an economic response to a lack of remunerative and decentralized local livelihood opportunities in the source geographies. COVID-19 only highlighted the fact that this challenge remained unaddressed in the absence of major rural reconstruction programmes. Further, as migrants returned to their source geographies, they not only did not find gainful employment, but they also put extra pressure on natural resources such as drinking water, firewood and food. The widespread second wave, which reached deep into rural areas, compounded these problems further.
1.2.2. Impact on Migrant WorkersAll the above sectors are not only large employment generators, but they also strongly represent the migratory labour force from rural to urban areas, which is now estimated to reach over a hundred million. This very large migratory labour force is largely employed in the unorganized informal sector. The informal sector workers have no access to social security, job security and proper housing and generally depend on daily wage earnings to meet their daily needs (Sengupta, 2007). They are estimated to constitute over 90 per cent of India’s workforce. The fact that migrants constitute a sizeable proportion of the informal workforce was perhaps less widely known, but the first wave of COVID-19 brought this out most vividly, despite several attempts to downplay its magnitude. What makes migrants—and among them women—especially vulnerable is
the fact that they are far from home, isolated from their communities and completely dependent on the middlemen who brought them to their work locations. Because they are not local, many do not appear on muster rolls and so have no access to entitlements like the public distribution system for food and facilities to deal with occupational health issues. And many of them are self-employed such as street vendors/hawkers, waste pickers and daily wage labourers. Official statistics often do not represent them in reports, so estimates vary widely. Public policies for food security and other welfare schemes are still very much dependent on source geographies and state/district-level policies and programmes (and identification within them such as ration cards and Aadhar cards).1 Hence, today, a very large segment of India’s population of the poor is ironically marginalized by the very system that they help maintain and build.
To development practitioners, the issues faced by migrant workers are not new, and many NGOs have been working with them, both in the areas where they migrate from (referred to as source or sending areas/geographies) and in the areas to which they migrate (destination areas/geographies). NGOs have been trying to address issues relating to working conditions, living conditions, occupational health and safety, wages, forced labour and so on, but with sporadic success and only in small pockets. The vulnerability of this very large population segment, both from the point of view of health and other social security services, to livelihood issues ranging from food security to employment was for the first time vividly brought out during the COVID-19 pandemic.
1.2.3. Impact on Social Infrastructure and Human ResourcesWhile the inadequacy of total public investment in the health sector in India, less than 1 per cent, compared to other countries, was vividly brought out during the second COVID-19 wave, what was less visible was how COVID-19 impacted the ‘frontline’ public health workers—
1. The One Nation One Ration Card idea, which could provide some food security to the migrant families, has not been implemented or well thought through and is discussed in Chapter 8 of this report on policy during COVID-19 times.

4 STATE OF INDIA'S LIVELIHOODS REPORT -2021
Accredited Social Health Activist workers, Anganwadi workers, auxiliary nurse midwives, hospital workers, etc., a large percentage of whom are also women. They are the first point of contact with communities, particularly in rural areas, but were ill-equipped in terms of knowledge, protective gear and protocols for dealing with the situation. With much of the health infrastructure and resources being diverted to COVID-19, other health services provided by the public health system to the poor, such as rural primary health centres, were compromised. This included immunization, maternal and child health, family planning, TB treatment, etc. Even in related sectors, such as other frontline government staff, there were repercussions. Over 600 schoolteachers died during panchayat elections in UP due to electoral duties during the second COVID-19 wave. While some micro-studies and journalistic articles exist on the impact on this very large grouping of the most vulnerable public staffing, no macro-studies or even transformative polices exists for them even now. Only very recently2 was the government forced to pay a token compensation for death through COVID-19 because of a Supreme Court judgement.
1.2.4. Impact on WomenDevelopment practitioners recognize that the impact of COVID-19 on women is more significant and worrisome than what has been documented and acknowledged. Again, anecdotal evidence points to increased violence against women and girls, and with lockdowns in place, access to helplines were severely compromised and the ability to respond to calls of distress even more so. Further, workplace discriminations were magnified, and several studies have shown that fewer women were able to secure jobs post lockdowns. The perennial problem of unequal wages and poor working conditions for women continued and often became worse. Perhaps less understood and researched is the fact that many of the frontline workers are women—the AAAs, nurses and a significant proportion of doctors and paramedics. These women had to deal with both
their professional and domestic responsibilities, causing immense stress. A more in-depth analysis of the impact on women in the informal sector of the COVID-19 pandemic from a gender perspective is provided in Chapter 2 of this report.
Summarizing, to understand the full impact of COVID-19 on livelihoods, it is essential to use a livelihoods framework that goes beyond just economic growth, income and employment. It requires an understanding of vulnerabilities and capacities. The COVID-19 pandemic, combined with the absence of targeted policy measures and policy prescriptions, has affected the lives and livelihoods of different sections of the population in very different ways and to a varying extent. These factors need to be kept in mind when we review the overall livelihood situation in India during the current year within the longer run overall trends.
1.3. Perspectives and TrendsAt the macro, all-India level, various statistical trends are available as to the different contexts which affect livelihoods of the population. This overview highlights some of the important trends that go beyond specific segments and vulnerabilities created by COVID-19. The different trends highlighted below also show the different paradigms or frameworks which researchers and policymakers use for understanding livelihoods. In some ways, each indicator touches partially upon the more comprehensive framework for livelihoods delineated above.
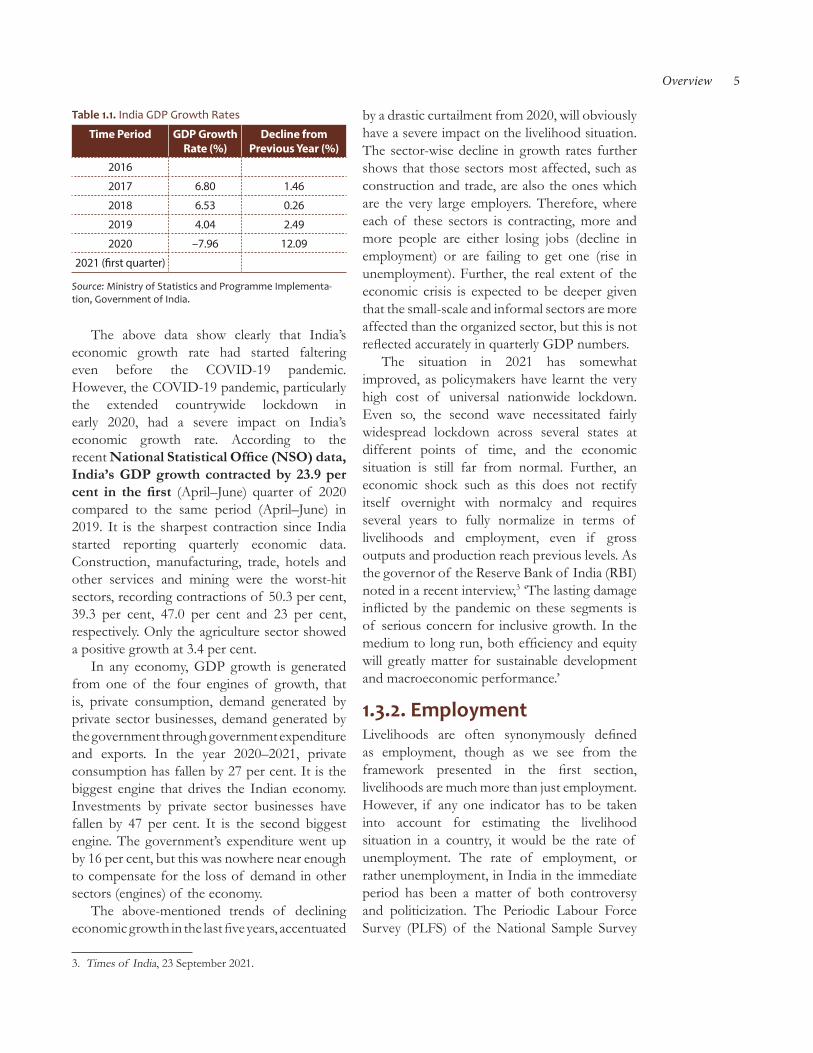
1.3.1. Economic Growth: Gross Domestic Product TrendsSustained economic development, or more specifically economic growth, has been historically the measure not only for a country’s development but also the employment and well-being of its population. Recent trends in gross domestic product (GDP) of India show the following (Table 1.1).
2. Supreme Court Judgment on Compensations to Death by COVID individuals of Rs 50,000, 23 March 2021.
Overview 5
Table 1.1. India GDP Growth Rates
Time Period GDP Growth Rate (%)
Decline from Previous Year (%)
2016
2017 6.80 1.46
2018 6.53 0.26
2019 4.04 2.49
2020 –7.96 12.09
2021 (first quarter)
Source: Ministry of Statistics and Programme Implementa-tion, Government of India.
The above data show clearly that India’s economic growth rate had started faltering even before the COVID-19 pandemic. However, the COVID-19 pandemic, particularly the extended countrywide lockdown in early 2020, had a severe impact on India’s economic growth rate. According to the recent National Statistical Office (NSO) data, India’s GDP growth contracted by 23.9 per cent in the first (April–June) quarter of 2020 compared to the same period (April–June) in 2019. It is the sharpest contraction since India started reporting quarterly economic data. Construction, manufacturing, trade, hotels and other services and mining were the worst-hit sectors, recording contractions of 50.3 per cent, 39.3 per cent, 47.0 per cent and 23 per cent, respectively. Only the agriculture sector showed a positive growth at 3.4 per cent.
In any economy, GDP growth is generated from one of the four engines of growth, that is, private consumption, demand generated by private sector businesses, demand generated by the government through government expenditure and exports. In the year 2020–2021, private consumption has fallen by 27 per cent. It is the biggest engine that drives the Indian economy. Investments by private sector businesses have fallen by 47 per cent. It is the second biggest engine. The government’s expenditure went up by 16 per cent, but this was nowhere near enough to compensate for the loss of demand in other sectors (engines) of the economy.
The above-mentioned trends of declining economic growth in the last five years, accentuated
by a drastic curtailment from 2020, will obviously have a severe impact on the livelihood situation. The sector-wise decline in growth rates further shows that those sectors most affected, such as construction and trade, are also the ones which are the very large employers. Therefore, where each of these sectors is contracting, more and more people are either losing jobs (decline in employment) or are failing to get one (rise in unemployment). Further, the real extent of the economic crisis is expected to be deeper given that the small-scale and informal sectors are more affected than the organized sector, but this is not reflected accurately in quarterly GDP numbers.
The situation in 2021 has somewhat improved, as policymakers have learnt the very high cost of universal nationwide lockdown. Even so, the second wave necessitated fairly widespread lockdown across several states at different points of time, and the economic situation is still far from normal. Further, an economic shock such as this does not rectify itself overnight with normalcy and requires several years to fully normalize in terms of livelihoods and employment, even if gross outputs and production reach previous levels. As the governor of the Reserve Bank of India (RBI) noted in a recent interview,3 ‘The lasting damage inflicted by the pandemic on these segments is of serious concern for inclusive growth. In the medium to long run, both efficiency and equity will greatly matter for sustainable development and macroeconomic performance.’
1.3.2. Employment Livelihoods are often synonymously defined as employment, though as we see from the framework presented in the first section, livelihoods are much more than just employment. However, if any one indicator has to be taken into account for estimating the livelihood situation in a country, it would be the rate of unemployment. The rate of employment, or rather unemployment, in India in the immediate period has been a matter of both controversy and politicization. The Periodic Labour Force Survey (PLFS) of the National Sample Survey
3. Times of India, 23 September 2021.

6 STATE OF INDIA'S LIVELIHOODS REPORT -2021
Office (NSSO) released in May 2019 showed that the unemployment rate in the country in 2018 was 5.3 per cent in rural India and 7.8 per cent in urban India. The latest PLFS, released in September 2021, for the period September–December 2020 shows the overall unemployment rate at 10.30 per cent. The unemployment rate in urban areas remained in double digits at 10.30 per cent in three consecutive quarters in 2020. This has been an improvement from the 20.8 per cent urban unemployment rate that we saw in the lockdown period of April–June 2020. However, it is still not lower than the pre-COVID-19 levels. According to the Centre for Monitoring Indian Economy (CMIE) data released in September 2021, the overall unemployment rate in India stands at 8.30 per cent, while the urban unemployment rate stood at 9.70 per cent and the rural unemployment rate at 7.7 per cent. While these official figures are highly reliable in themselves, the question to ask is how relevant they are to the whole issue of employment generation in a structurally shifting economy and society. It does throw some light though on the magnitude of the problem of employment that needs to be addressed. To really understand the long-term implication of these unemployment rates, we need to disaggregate the data above geographically, age wise and gender wise.
1.3.3. Unemployment among Young PeopleOut of the estimated current population of 1.35 billion, India has more than 50 per cent of its population below the age of 25, and more than 65 per cent below the age of 35. In 2020, the average age of an Indian was only 29 years (compared to 37 in China and 48 in Japan). This is the great demographic dividend that the world of development talks about. However, to convert this demographic dividend into economic development and growth implies that this extremely large cohort of young people who are entering the workforce every year is productively employed. To be productively employed in turn implies that there are enough opportunities for employment through economic growth and other means on the one hand and that the millions joining the workforce every year are
adequately trained and skilled to be employable. Just numbers do not lead to a dividend.
So what is the latest situation of employment and unemployment among the young people in India currently. The CMIE data show that in August 2021, the unemployment rate for people below the age of 30 years stood at 32.03 per cent, which means almost every third youth in the country is unemployed. If we look at different age segments of 15–19, 20–24 and 25–29 years, their unemployment rates in August were 67.21 per cent, 45.28 per cent and 13.24 per cent, respectively. This rather alarming situation of youth unemployment is not wholly the result of the COVID-19 pandemic and has been creeping upon India for over a decade. In addition to economic de-growth and slowdown, which affects overall employment rates, the problem of youth unemployment is complex, structural and multidimensional.
1.3.4. Employment, Employability and JobsEmployment per se is the end result of the process where an individual is provided a source of sustainable economic livelihood through some means. However, in a structurally shifting economy, there is also the whole question of employability. Even at the level of engineers, there is a question being raised as to how many of the engineering graduates are skilled enough to actually meet the needs of industry. In agriculture, the question is being raised as to whether agriculture as it is practised today is adequate to provide productive employment for the next generation. Hence, employability is concerned with the process by which individuals are made capable in terms of skills—both technical and behavioural—to be able to enter the workforce required by the changing Indian economy.
Job is a much narrower concept than employment and is concerned with a state of employment that is in a more formal organization and of a more regular nature such as a regular monthly payment of wages and salaries. Given the numbers and the structure of the Indian economy at present, it is unlikely that we can use jobs and employment synonymously.

Overview 7
Even governments everywhere have moved on from solving the employment problem by providing direct government jobs to promoting employment in the wider economy. In the medium and longer run, while the end result is the number and percentage of population gainfully employed, in terms of policies and programmes, it is the suitable and adaptable employability of individuals on the one side and the growth of the economy on the other, that is going to drive employment rates. Jobs in the formal sector are a contributory factor to employment generation but can never be the whole solution. Further, data show (Mahajan, 2020) that much of the economic growth in the formal organized sector in India has not led to any substantive increase in jobs.4
There are several qualitative factors that also need to be considered when we talk about sustainable employment for young people. The first factor is that of youth aspirations. Employment is not only a matter of economic livelihood, but it is also a matter of choices. In sector after traditional sector, anecdotal evidence as well as formal surveys show that the young do not see a future in their parents’ profession and want to shift out. They want to shift out either because they do not see adequate economic rewards for the traditional profession or because they see that such a profession has less social standing. Hence, employment and unemployment statistics also very often hide the real issues—the fact that it is the same people who are always at risk of unemployment in an inefficient labour market founded on structured inequalities of location, gender, sector and social identity.
The second factor is the issue of urbanization. As the economy and population shift more towards urban areas, particularly small towns, the question in employment shifts to the issue of sectors. The question of whether one should invest in traditional high employment sectors but with a declining market share, such as handlooms and many other traditional rural sector works, or
whether one should invest in high growth–high employment sectors as future trends dictate, as in the so-called digital economy and allied services, is an important question for employment-oriented investment choices.
The third factor is the issue of labour productivity. This brings us to the old economic concept of disguised unemployment where a very large number of people are employed in a sector, such as subsistence agriculture, but that is because there is no alternative available. A lot of the current employment in agriculture is of this kind. Employment generation has to be a movement from lower to higher productivity work.
1.4. Gender and EmploymentWithin the whole theme of livelihoods, the whole issue of gender needs to be looked at from a fresh perspective of rights rather than just labour force participation. It is being increasingly realized that with massive outbound migration of youth from the rural areas, particularly of male youth, the rural areas are increasingly dominated by the need for female employment. This is often termed as the feminization of agriculture and allied activities. Hence, when we look at programmes for rural and urban employment, we also have to look at the gender dimension of employment. This is also present when we have large-scale distress migration of families to urban areas where female employment is high in unorganized sectors such as housing and construction.5
1.4.1. Sector and Subsector determinants of EmploymentTraditionally, livelihoods have been looked at as an issue of employment across structures of sectors that are broadly defined, such as employment in the unorganized or informal
4. Chapter 3 of this report discusses in greater detail the future of jobs in India5. Chapter 2 of this report discusses the gender dimension of livelihoods, particularly in the informal sector, in greater
detail.

8 STATE OF INDIA'S LIVELIHOODS REPORT -2021
sector versus employment in the organized sector; employment in the large-scale corporate sector versus the less organized but more spatially spread small and micro-industries sector; employment for the unskilled, semi-skilled and highly skilled workforce. Each of these ‘sectors’ requires a very different set of programmes for promoting employment and throws up a very different set of opportunities. All employment in these sectors is however determined by how well these sectors are doing in terms of growth and what is their share in the overall economy. In that sense, employment is always a derived variable of the state of the economy in terms of both structure and growth.
Another common framework used for analysing livelihoods is to use tools developed for sector and subsector analysis. Here, the capacities of a certain broad sector such as agriculture which are large employers are looked at and their trajectory and potential for generating employment is looked at.
Agriculture continues to be the largest employer still in India and is the only sector that showed a production growth of 3.5 per cent during the COVID-19 period. In 2019, 42.6 per cent of the workforce in India was employed in agriculture, while the other half was almost evenly distributed among the two other sectors, industry and services. While the share of Indians working in agriculture is declining, it is still the main sector of employment. CMIE data from the consumer pyramid household survey shows the share of agriculture in total employment has gone up from 35.3 per cent in 2017–2018 to 36.1 per cent in 2018–2019 and then to 38 per cent in 2019–2020. Further, the same data from the CPHS shows that reverse migration to agriculture continues even in 2020–2021. The share of agriculture in total employment jumped to 39.4 per cent this year from 38 per cent in 2019–2020 while the share of manufacturing dropped sharply from 9.4 per cent to 7.3 per cent (Centre for Monitoring Indian Economy, 2021).
An analysis of the data (Sharma, 2021) states that according to CMIE, while the trend
on the bases of CPHS is in sync with the PLFS conducted by NSO of the government, the shift towards agriculture in the last three years is more under PLFS. The latest PLFS report shows a sharp increase in employment in agriculture from 42.5 per cent of the total employment in 2018–2019 to 45.6 per cent in 2019–2020. While PLFS records a 3.1 percentage point increase in labour into agriculture, CPHS estimates a much smaller increase of 1.9 percentage points, ‘Such a large shift of labour in favour of agriculture cannot be voluntary. It is a sign of distress in the labour market where non-agricultural sectors are unable to provide employment and labour is forced to shift to agriculture’, the CMIE said in its weekly labour market analysis (Sharma, 2021). As per CMIE, the shift to agriculture is happening despite the fact that the sector has the lowest wage rates. Citing the PLFS data which show wages under salaried jobs stands at Rs 558 per day, for self-employed Rs 349 per day, while for the casual labour employed in agriculture it is Rs 291 per day. Labour would not voluntarily shift to this lowest wage rate sector unless it had no better option. According to CMIE, large parts of employment from the relatively unorganized construction sector and the unorganized manufacturing sector moved into agriculture. It is estimated that nearly 60 per cent of the employment in manufacturing industries is in the unorganized sector and labour from here migrated into agriculture in times of distress. A reverse migration phenomenon which has become well known from images of migrant labour returning to their villages. The question is does this increase in employment in agriculture actually mean enhanced and sustainable livelihoods under the conditions in which agriculture today finds itself or is it just a low-cost labour absorber. Agriculture obviously needs reforms both in terms of technology, environmental sustainability and markets.6 It is in the above context that the policy and programmes of the agriculture sector needs to be looked at.
6. In this context, Chapter 4 of this report looks at the specific dimension of sustainable agriculture and the progress therein.

Overview 9
1.5. Poverty, Inequality and LivelihoodsIt is possible to discuss livelihoods in a limited sense within the framework of macro-trends defining the economy’s broad parameters, such as GDP growth only. There is a tendency in the dominant economic and policy domains to do this and hence both policies and programmes tend to take a path of pure economic growth for the country on the one hand and centralized welfare dole outs for the poor on the other. However, as we have defined right upfront in our livelihoods framework, such an approach is neither inclusive nor sustainable in the long run, when a very large percentage of India’s population are still poor and vulnerable; in the sense of their inability to cope with shocks, such as COVID-19, that drive them back to poverty on the one hand and a very low asset base to generate sustainable livelihoods on the other. It is therefore important that a report such as the SOIL Report 2021 goes beyond the traditional boundaries of analysing data sets that do not take into account issues of equity and poverty. Such evidence has an overbearing relevance to millions of people in India, living in both rural and urban areas.
The Pew Research Center, using World Bank data, has estimated that the number of poor in India (with income of $2 per day or less in purchasing power parity) has more than doubled to 134 million from 60 million in just a year due to the pandemic and concomitant lockdowns, induced recession. In recent decades, India had emerged as the country with the highest rate of poverty reduction. In 2019, the Global Multidimensional Poverty Index reported that India lifted 271 million citizens out of poverty between 2006 and 2016. Contrasting this with the situation in 2020, we find that India has the highest global poverty increase. As noted by the report. ‘This means, India is back in a situation to be called a “country of mass poverty” after 45 years’ (Mahapatra, 2021). Further, the Pew Research Center’s analysis finds that the middle class in India is estimated to have shrunk by 32 million in 2020 as a consequence of the downturn, compared with the number it might have reached
in the absence of the pandemic. This accounts for 60 per cent of the global retreat in the number of people in the middle-income tier (defined here as people with incomes of $10.01–$20 a day). Meanwhile, the number of people who are poor in India (with incomes of $2 or less a day) is estimated to have increased by 75 million because of the COVID-19 recession. Formally, India has not systematically calculated the number of poor since 2011, when the Tendulkar Committee Report, estimating district-wise poverty levels, was published. But the United Nations estimated the number of poor in the country to be 364 million in 2019, or 28 per cent of the population.
The definition of poverty over the decades has also expanded from being just defined by economic indicators to a more comprehensive Human Development Index. This in turn has expanded the definition of what constitutes sustainable development and has come to be reflected in what has come to be called Sustainable Development Goals (SDGs), which are to be achieved by 2030 by each participating country. Without going into the details here, there is an excellent report on the various SDGs and their state-wise rankings (as well as government interventions) which has been published by the NITI Aayog and UNDP this year (NITI Aayog and United Nations, 2021). In Chapter 6 of the report, there is a definition and discussion on the Multidimensional Poverty Index that is used internationally. This index not only takes into account economic indicators such as income and consumption but also health (nutrition, child mortality), education (years of schooling, school attendance), affordable and clean energy, clean drinking water and sanitation, housing and asset ownership. The report goes on to rank all states and union territories against each of the SDGs to provide a comprehensive index for policy and programme planning and review. In a subcontinental-sized country like India, such geographical disaggregation is essential. In addition, based on the poverty and other indicators data available with the Government of India, the latter identified a certain number of districts as ‘aspirational districts’ (a jugglery of terminology for the most backward districts). The Aspirational Districts Programme (ADP) was launched in January 2018 with a ‘renewed focus

10 STATE OF INDIA'S LIVELIHOODS REPORT -2021
and inclusive interventions in the most backward districts of India’. The programme is not only multi-sectoral and focused on poverty alleviation and livelihoods and services but also seeks to provide best practices in different interventions for other districts to follow (NITI Aayog, 2020).
Summarizing, to comprehensively understand the State of Livelihoods in India currently, it is essential to look at the problems and issues from multiple perspectives, ranging from overall macroeconomic growth and employment/unemployment to more disaggregated analysis in terms of different cohorts of the population (youth, women), different sectors and subsectors, and different geographies (states/districts). However, underlying these perspectives, there also needs to be a sensitivity to the vulnerable groups, particularly the poor, whose numbers have alarmingly increased during the COVID-19 period, and put the clock back on India’s endeavour for inclusive development. Poverty, in all its dimensions, needs to be integrated with livelihoods.
1.6. Policies and ProgrammesPolicies at the meta level and programmes at the meso and micro levels are the instruments through which the problem of livelihood loss and regeneration is to be addressed. In the context of India, where mass poverty has re-emerged due to the COVID-19 pandemic and every third young person is unemployed, this implies creating sustainable livelihood solutions for hundreds of millions of people. While in the very short term, welfare measures such as free food distribution help to prevent mass deprivation, these policies in no way offer long-term solutions to the massive livelihood problem facing the country. Both from the analytical frameworks presented above, as well as the different perspectives that capture trends, it is clear that a more comprehensive understanding of the multidimensional nature of livelihoods is necessary. This in turn implies that there is no one-size-fits-all solution to livelihood generation that can be created through simplistic and centralized policy prescriptions. Decentralized policies for
different segments of the population, different sectors and subsectors, and different geographies and clusters are required. Centralized policies can provide an enabling environment and financial support, but programme design and implementation have to be highly decentralized. A more detailed exposition of the various policies and programmes that indirectly and directly affect livelihood generation currently is provided in Chapter x x of this report. Here in the ‘Overview’, we will only attempt to create a typology of such policies and programmes, and briefly describe the main programme that is being utilized currently by the Government of India (without taking away from the significant innovations and implementations occurring at the state and district levels by state governments and non-government organizations towards creating livelihoods, particularly for the poor and in rural areas). If very large-scale livelihood generation, which is what India requires, is to be achieved, then the focus needs to be on sustainable livelihoods rather than immediate welfare-based short-term livelihoods. Second, focus needs also to continue to be on linking livelihoods to poverty alleviation, which implies that the poor and disadvantaged should be able to benefit from the policies and programmes. Third, given that there are major structural shifts occurring in the economy, such as urbanization, shifts in demand and consumption patterns and decline in certain large employment traditional sectors, focus needs to be kept on these secular shifts which government policies can do little about in the short run.
The focus of India’s economic policies has always been the promotion of economic growth. However, these policies have also been focused, both since the 1991 reforms, and the various reforms undertaken since 2019, on either the more organized industrial sector or the formal agriculture sector. There is no doubt that sustained economic growth, over decades, enables large-scale livelihood generation across sectors of the economy. India’s economic growth trajectory, of over 7 per cent per annum, between 2004 and 2013 has been assisted by reformist, albeit incremental, fiscal and monetary policies. During the same period, India was also able to bring down a very large number of people living in poverty. Both the

Overview 11
tapering down of economic growth from 2016 and the COVID-19 crisis have again activated the Government of India since 2020 to push a set of reformist fiscal and monetary policies to recover India’s growth trajectory. It is too early to pass judgement on the efficacy of these policies, but it may be worthwhile to summarize the key policies and programmes, within the broader set, that directly effects the livelihood situation in India.
During 2020, there was a comprehensive policy and programme mix announced, with much fanfare, for economic growth and social development, as well as mitigating the effects of COVID-19, which was branded as Atmanirbhar Bharat by the Government of India. What is more critical however is the incremental policy and budgetary support measures announced by the Government of India periodically since then. Some of the policies that indirectly impact livelihood generation through industry development include the Production Linked Incentive schemes of budgetary support to different industrial sectors, the most recent being to the textiles sector; sustained capital support to the MSME sector by the RBI through loan repayment restructuring, liquidity infusion into the commercial banks and deficit financing to regenerate demand by the government through expenditure. While these policies were necessary to restart the economy after COVID-19, they were largely focused on the organized industry sector, which employs only a small percentage of the labour force and primarily focuses on raising production levels. Both direct demand generation through enhanced cash incomes and direct employment of the poor continue to remain problematic.
Throughout 2020 and 2021, with the return of urban migrants back to the rural areas on the one hand, and the existing rural unemployment with slow growing and labour surplus agriculture on the other hand, the government had to fall back on primarily existing welfarist measures for livelihood generation. The primary instrument for this has been the enhanced budgetary support and implementation of the existing MGNREGA programme. For immediate relief, this was backed by free food ration distribution of limited quantity to all rural households. In many cases, the budgetary allocation for the
later was increased by state governments. The effectiveness of the MGNREGA programme in the very short term to create livelihoods is clearly seen in the peak in man day’s employment generated by the programme in July/August 2020, just post the national lockdown and return of the migrants. An interesting study by the Centre for Policy Research, Delhi (Centre for Policy Research, 2021), compares the MGNREGA programme’s impact in 2020 and 2021.
The CPR study notes the following:
In 2020, when the ravages of COVID-19 and associated policies became visible, the MGNREGS provided a much needed lifeline to most of India’s rural poor. Budgets were enhanced significantly. In FY 2020-21 Rs. 1.1 lakh crore was spent on the scheme. As many as 7.55 crore households across the country were given work through the year. However, demand for work consistently outstripped supply. A clear indicator that rural distress and unemployment persisted despite the opening up of the Indian economy in June 2020 after the national lockdown was lifted and a relatively healthy growth in agriculture. In the first quarter of 2020, when the national lockdown was in place (months of April, May and June 2020), demand for work under MGNREGS rose to new highs, touching 4.47 crores in June, the highest of the year. Despite this sudden, massive increase in work demand, the response was robust and work availability high. May in particular saw 3.73 crore households demanding work, and 88.5 per cent of this demand, or 3.3 crore households were provided work. MGNREGS not only proved to be the most important entitlement protecting India’s workers, it also proved to be elastic. Expanding, at speed, when needed and contracting when demand was low. It is important to note however, that despite this expansion, demand consistently outstripped supply.

12 STATE OF INDIA'S LIVELIHOODS REPORT -2021
In 2021, as the second wave hit, rural India suffered this time from the combination of health and economic shock. Once States began to announce lockdowns, unemployment rates rose once again. Conversely, for the same months of 2021, not only was overall demand for work lower than in 2020, but supply of works was even lower. In comparison to the high of 4.47 crore households who demanded work in June of the previous year, 3.5 crore households demanded work in June 2021. Despite this lower demand for work, the overall supply of works has been even lower for May and June 2021 than in the same months of 2020. This means that even though fewer people were turning to MGNREGS in rural areas this year, lesser work (and therefore, income) was being provided under the scheme.
Hence, prima facie, the MGNREGA programme seems to be currently the only mass employment provider for the poor, becoming useful both in times of crisis and more normal times. From a sustainable livelihood perspective, the question that arises is can the MGNREGA be categorized as a sustainable livelihood generation programme or is it a purely short-term welfare programme or a safety net programme for ensuring income to the poor. At the apex level, it is primarily a financing instrument, albeit innovatively designed to be a demand-based programme. However, at the more detailed micro-design and implementation level, the way that the MGNREGA is used provides the answer to the livelihood question. Here, we have to look at how both selective non-government organizations, women’s SHGs and enlightened Panchayat Samitis have used the MGNREGA to plan the works to build productive rural infrastructure, management of natural resources like small watersheds, as well as individual assets such as private land development. Further, these experiments have been successfully implemented in the poorest of the regions, such as the tribal belt. Hence, creatively used, the MGNREGA is both a safety net and a programme for creating infrastructure and assets for livelihood generation.
A second national-level government programme with the potential for mass livelihood generation that needs to be looked at is the National Rural Livelihoods Mission (NRLM). The NRLM was initiated by the Ministry of Rural Development (MoRD), Government of India, with the objective of establishing efficient and effective institutional platforms that enable the rural poor to increase household incomes through livelihood enhancements and improved access to financial and selected public services. The programme strategies formulated by NRLM envisages the creation of dedicated support structures for the delivery of programme benefits and pulling together all other poverty reduction efforts by the government departments, Panchayati Raj Institutions, CSOs, formal financial institutions and the private sector under one umbrella (World Bank, 2011). To enable the MoRD to play such a wide and new kind of role, a special component of the programme was designed, which included technical assistance provision to the states, national-level partnerships with specialized agencies, human resource recruitment from the market and training, and capacity building of project implementation teams. This aspect of the programme is discussed in further detail in the next section on institutions.
The NRLM is primarily focused on building women SHGs, federating them at higher levels, linking them up with commercial banks for credit and through various technical inputs create a variety of rural-based livelihoods in different sectors ranging from agriculture, animal husbandry, etc. (depending on the local situation and demand). The NRLM, working through the State Rural Livelihoods Mission has been fairly focused, innovative and effective nationally in delivering a variety of services that in turn enable the poor, particularly women, to generate long-term livelihoods. Because it is a slow achieving programme, not dependent on a one-time delivery of a service (such as vaccines) or goods (such as cooking gas), but rather dependent on intensive mobilization of communities, it has not got that much priority at the Government of India level. However, at the state level, there has been extensive buy-in of the programme from the political leadership in several states (Bihar being a prime example).

Overview 13
There are several other smaller programmes and schemes that directly and indirectly affect livelihoods of the poor. However, neither do these have the reach of the above MGNREGA and NRLM, nor are they so effective in creating livelihoods on scale across states. The Urban Livelihoods Mission has not really taken off as a programme. One of the glaring gaps in the policy–programme matrix for livelihoods has been the absence of a comprehensive urban livelihood and social security programme mix addressing the needs of the urban poor and the migrant labour. This was starkly brought out during the humanitarian crisis that occurred with migrant labour in 2020. Considering the continuous mass migration that has been occurring over the years from the rural areas of high poverty states to the urban areas of more industrialized states, a comprehensive policy and social security framework for such labour working in the construction, services and unorganized sectors in India’s urban areas is urgently required.
Summarizing, at the level of the state, policies and programmes (with enabling laws, budgetary support and implementation structures) are key instruments for generating livelihoods for the population in general, and the poor households in particular. Civil society institutions do not have the reach and resources to replace governments (and are also hindered by a strangulating regulatory framework today), even when they are doing effective work. In India, even though mass employment has always been politically, socially and economically critical, when we study the policies, they have been more focused on the economic development of the organized sector. However, the organized industry sector only employs a small percentage of the total workforce and has shown poor growth in employment numbers in the last decade. The two large employment generating programmes currently, the MGNREGA and the NRLM, are both focused on rural areas. While both these programmes have been effective and useful, even in the COVID-19 crisis, they do not directly address the problem of urban employment. India is rapidly urbanizing, and it is estimated that a majority of the population will shift to urban areas over the next decade. As the economy shifts structurally to the urban
areas, including small towns, a new set of policy measures are required to address the livelihood and related social security issues of this now very large segment of the population, especially of the young people.
1.7. InstitutionsPolicies and programmes formulated and designed at a centralized level can be both appropriate and sophisticated but if not implemented well be of limited effectiveness. Given India’s size and spread, it is often acknowledged that programmes do not reach the ground in the manner that they are originally intended to because of ‘weak implementation’. Further, given India’s federal structure, a very large number of programmes that are relevant to economic growth and livelihood generation are actually implemented by the state governments. Political conflicts vis-à-vis buying in between the central and state governments is one possible reason for this (as seen in the case of the new agriculture laws). However, another often less reported reason is the varying capacities of different state bureaucracies. Hence, consultations, negotiations, standardized implementation guidelines and central support of flexible and decentralized planning and implementation protocols are some of the preconditions for policy effectiveness in India. Underpinning this overarching implementation capacity constraint is the role of institutions. Any study of a theme, such as livelihoods, would be incomplete if we do not address the state of institutions that are mandated to implement policies and programmes.
The critical role of institutions in overall economic development has long been recognized. However, institutions are something much more than just a cluster of organizations, implementing programmes. Douglass North in his seminal work on institutions (North, 1990) has explored the role of institutions in economies and societies. Among other features, he states that ‘institutions are the incentive system that structure human interactions. They make predictable our dealings with each other…and remove uncertainty’. Further, ‘institutions are made up of formal rules, informal norms

14 STATE OF INDIA'S LIVELIHOODS REPORT -2021
and their enforcement characteristics…. In many ways norms are more important than formal rules’ (North, 1990). The second observation made by North and others on the nature of institutions is that they are characterized by ‘path dependency’, which is that once a certain set of choices in terms of goals, strategies and rules are made, institutions, over time, become dependent on them and keep repeating them, even if they lead to underperformance. Path dependency is common to many large organizations, both in private and public sectors. Institutions either die if they are path dependent for a long time and markets change or they survive through government subsidies if they are in the public sector. In both cases, their relevance and ‘market share’ decline.
Given this theoretical background, here we will look upon a few types of institutions that are currently present in India in the livelihood space. Such institutions are also discussed in different chapters of this report, such as the farmers producer organizations in Chapter 5; and the role of the corporate sector, a specific type of institution in the business sector, in Chapter 6. At the first level, institutions can be characterized by the nature of their ownership and the organization type they represent. In the context of livelihoods, many such institutions may be identified. These are (a) state-owned and managed institutions, which are directly responsible for both designing and implementing policies and programmes of the government; (b) the private corporate sector or the organized manufacturing and services sector; (c) the private semi- and unorganized sector like private trade channels in different subsectors; (d) the civil society institutions that work in the public domain such as the NGOs; (e) elected local bodies such as the panchayat system in India who are mandated today for many public roles and (f) the people’s organizations who directly both own and benefit from government policies but also are dependent on markets.
It is not the purpose here to discuss the full role and efficacy of each of this type of institution. Only a select few examples of the
above are given here to highlight their significance in the creation of livelihoods on the one hand and the changes that they have undergone to make themselves more relevant to the livelihoods of the poor in recent years on the other. It also needs to be noted that (unfortunately) institutions can become territorial in nature and often there is conflict between two types of institutions working in the same space with the same mandate (My SHGs). On the other hand, examples of natural and historical collaborative networks of organizations also exist that follow all the characteristics of institutions—common norms and predictive behaviour. Such examples are often found in commodity markets and product value chains in different sectors, such as in traditional sectors like agriculture and new ones like tourism.
Within the government, which is the largest implementer of programmes for livelihoods, there has been a systematic and conscious effort to innovatively design institutions that can effectively implement a particular policy or programme. Two examples are worth giving. The first is the NRLM, where each state has been mandated to establish independent societies as State Rural Livelihoods Missions. However, the institutional innovation did not stop here. The state missions are fully staffed by professionals from the market in each functional field and massive investments in training and human resource development has been undertaken for both the staff and the community organizations built by the mission. The other institutional innovation in NRLM has been at the central level of the MoRD, where a fully professionally staffed National Mission Management Unit has been established to provide support to the State Rural Livelihoods Missions.7
The second example is in the case of the Skill Development Mission. The National Skill Development Mission was officially launched in July 2015. The first step in the institution dimension to give skill development a focus was the creation of the Ministry of Skill Development and Entrepreneurship. However, a subject matter such as skill development is cross sectoral. ‘The
7. Similar structures have been established for the National Health Mission and the Sarva Shiksha Abhiyan in school education.

Overview 15
Skill development Mission has been developed to create convergence across sectors and States in terms of skill training activities’ (Ministry of Skill Development and Entrepreneurship, 2015). Key institutional mechanisms for achieving the objectives of the Mission have been divided into three tiers, which will consist of a Governing Council for policy guidance at apex level, a Steering Committee and a Mission Directorate (along with an executive committee) as the executive arm of the mission. Mission directorate will be supported by three other institutions—National Skill Development Agency (NSDA), National Skill Development Corporation and Directorate General of Training—all of which will have horizontal linkages with Mission Directorate to facilitate smooth functioning of the national institutional mechanism (Ministry of Skill Development and Entrepreneurship, 2015). However, like in the case of the NRLM, the model had been experimented within selected states where state-level Skill Development Missions had been established, both for coordinating across ministries and departments, and having their own programmes. Further at the state level, flexibility was provided to a variety of private sector and civil society players to participate in the programmes through outsourcing.
Probably the most important type of institution in this chain of organizations that can contribute to mass livelihood generation is what may be called people’s institutions. In the context of livelihoods, they would essentially be mutual aid-based organizations which are self-managed and through a variety of mechanisms and skills provide services for their members’ development and livelihoods. Two such examples, which today are not small in scale or membership across the country, are the women’s self-help group (SHG) federations for both credit and financial management and sector-based livelihoods and for agriculture the farmer producer organizations. The traditional institution in this model has been the cooperative society. The cooperative society movement in India has a long and chequered history in India, but still constitutes an important institutional form for livelihood generation of large segments of the population. It has also achieved significant success in areas such as milk production and marketing through NDDB. The
Government of India has recently created a new Ministry at the central level for this type of institutions, which needs to be closely watched for its progress. At the state level, programmes such as the Kudumbashree in Kerela has used such federations effectively to generate livelihoods.
Summarizing, if we are to be effective in generating livelihoods for a very large number of poor people in the country, it is not enough to have ‘progressive’ policies and programmes that are centrally designed and enacted. They provide a conducive enabling environment. For practice to be generated at scale quality institutions are critical, not only in livelihoods but other domains as well. Institutional development has often been a neglected area of both study and practice in India. Many other countries have focused on this dimension of development and actually left it to the institutions and market forces to determine how livelihoods will be generated at the micro level. The role of the state as a direct implementer versus the role of the state as one more player is a much bigger question that cannot be answered here. What is important is that even in the livelihood space in India, there is a wide variety of effective institutions, many of them outside the government, whose strengths need to be nurtured rather than seen as competitors. For that, policymakers in the government have to change their mindset.
1.8. Summary and ConclusionsThe COVID-19 pandemic, combined with the absence of targeted policy measures focused on livelihoods of the vulnerable, have affected the lives and livelihoods of different sections of the population in very different ways and to a varying extent. These factors need to be kept in mind when we review the overall livelihood situation in India during the current year within the longer run overall trends. To comprehensively understand the State of Livelihoods in India currently, it is essential to look at the problems and issues from multiple perspectives, ranging from overall macroeconomic growth and employment/unemployment to more disaggregated analysis in terms of different cohorts of the population

16 STATE OF INDIA'S LIVELIHOODS REPORT -2021
(youth, women), different sectors and subsectors, and different geographies (states/districts). However, underlying these perspectives, there also needs to be a sensitivity to the vulnerable groups, particularly the poor, whose numbers have alarmingly increased during the COVID-19 period, and put the clock back on India’s endeavour for inclusive development. Poverty, in all its dimensions, needs to be integrated with livelihoods.
It is possible to discuss livelihoods in a limited sense within the framework of macro-trends defining the economy’s broad parameters, such as GDP growth only. There is a tendency in the dominant economic and policy domains to do this, and hence both policies and programmes tend to take a path of pure economic growth for the country on the one hand and centralized welfare dole outs for the poor on the other. However, such an approach is neither inclusive nor sustainable in the long run, when a very large percentage of India’s population is still poor and vulnerable; in the sense of their inability to cope with shocks, such as COVID-19, that drive them back to poverty on the one hand and a very low asset base to generate sustainable livelihoods on the other. It is therefore important that a report such as the SOIL Report 2021 goes beyond the traditional boundaries of analysing data sets that do not take into account issues of equity and poverty. Such evidence has an overbearing relevance to millions of people in India, living in both rural and urban areas.
At the level of the state, policies and programmes (with enabling laws, budgetary support and implementation structures) are key instruments for generating livelihoods for the population in general, and the poor households in particular. Civil society institutions do not have the reach and resources to replace governments, even when they are doing effective work. In India, even though mass employment has always been politically, socially and economically critical, when we study the policies, they have been more focused on the economic development of
the organized sector. However, the organized industry sector only employs a small percentage of the total workforce and has shown poor growth in employment numbers in the last decade. The two large employment generating programmes, currently the MGNREGA and NRLM, are both focused on the rural areas. While both these programmes have been effective and useful, even in the COVID-19 crisis, they do not directly address the problem of urban employment. India is rapidly urbanizing, and it is estimated that a majority of the population will shift to urban areas over the next decade. As the economy shifts structurally to the urban areas, including small towns, a new set of policy measures is required to address the livelihood and related social security issues of this now very large segment of the population, especially of the young people.
Further, if we are to be effective in generating livelihoods for a very large number of poor people in the country, it is not enough to have ‘progressive’ policies and programmes that are centrally designed and enacted. They provide a conducive enabling environment. For practice to be generated at scale, the quality institutions implementing such policies are critical, not only in livelihoods but other domains as well. Institutional development has often been a neglected area of both study and practice in India. Many other countries have focused on this dimension of development and actually left it to the institutions and market forces to determine how livelihoods will be generated at the micro level. The role of the state as a direct implementer versus the role of the state as one more player is much bigger question that cannot be answered here. What is important is that even in the livelihood space in India, there is a wide variety of effective institutions, many of them outside the government, whose strengths need to be nurtured rather than seen as competitors. For that, policymakers in the government have to change their mindset.

Overview 17
ReferencesCentre for Monitoring Indian Economy. (2021).
Consumer pyramid household survey. The author.Centre for Policy Research. (2021). Has the
MGNREGA helped the rural economy in 2021. The author.
Department for International Development. (2000). Sustainable livelihoods guidance sheets. The author.
Kollmair, M., & Gamper, St. (2002). The sustainable livelihood approach (Input Paper for the Integrated Training Course of NCCR North-South). Development Study Group. University of Zurich.
Mahajan, V. (2020). Jobless growth—Overview (SOIL Report). SAGE.
Mahapatra, R. (2021). Mass poverty is back in India. Down to Earth. https://www.downtoear th.org. in/blog/governance/mass-poverty-is-back-in-india-76348
Ministry of Skill Development and Entrepreneurship. (2015). Skill Development Mission. Government of India.
NITI Aayog. (2020). Best practices under Aspirational Districts Programme (Vols. 1 and 2). The author.
NITI Aayog and United Nations. (2021). SDG India: Index & Dashboard 2020–21—Partnerships in the Decade of Action. The authors.
North, D. (1990). Institutions, institutional change and economic performance. Cambridge University Press.
Sengupta, A. (2007). Report on conditions of work and promotion of livelihoods in the unorganised sector. Government of India.
Shakespeare, W. (1600). Merchant of Venice. Fingerprint Publishing.
Sharma, Y. S. (2021). Share of agriculture sector in employment sees steady increase: CMIE. The Economic Times. https://economictimes.indiatimes.com/news/economy/indicators/share-of-agriculture-sector-in-employment-sees-steady-increase-cmie/articleshow/85266073.cms
World Bank. (2011). Project appraisal document—National Rural Livelihood Project. The author.


Women in Informal Sector
2
2.1. IntroductionDrawing from the categorization in Ghosh (2021), the broad umbrella of informality includes employment in informal enterprises as well as in households or formal enterprises. It also includes those who are self-employed or wage employed. Following the ILO (2003) and Chen (2012), informal employment is described as ‘persons employed in the informal sector (including those who are formally employed in the informal sector, and)’:
Deepika Pingali, Kasturi Sharma, Priti Gulati, Saumya Premchander, Smita Premchander
• Employers and employees in informal enterprises
• Employees in informal enterprises• Own-account (self-employed) workers in
their own informal enterprises• Contributing family workers working in
informal enterprises• Members of informal producers’
cooperatives, i.e. those that are not formally established as legal entities
• Persons in informal employment outside the informal sector, specifically: ○ Employees in formal enterprises not
covered by social protection through
their work, including contract workers, temporary and part-time workers, unregistered or undeclared workers, home-based workers, sub-contracted or out-workers,
○ Paid domestic workers not covered by social protection through their work, and
○ Contributing family workers in formal enterprises.
The formalization of work has long been seen as both desirable and a natural result of the process of development, but many now argue that the formal economy relies on the existence of the informal economy to exist. A reverse trajectory also exists, whereby formal activities move into the informal economy to avoid regulation or under the pressure of competition.
As Ghosh (2021) and others indicate, ‘there are strong gender differences in the nature of informal employment and its implications’—women have access to less credit than men, and the costs of formalization tend to be higher for women entrepreneurs as they are less equipped to deal with formal taxation. Additionally, the general focus of the Indian government on

20 STATE OF INDIA'S LIVELIHOODS REPORT -2021
100
90
80
70
60
50
40
30
20
10
0
69
16
12
21
46
5
38
1
10
64
14
17
23
Domestic worker Street vendor Waste worker
Home based worker Construction labourers Other informal worker
Figure 2.1. Gender-wise Selected Categories of Informal Workers in India during 2017–2018Source: computed from the Periodic Labour force Survey (2017-18) unit-level dataNote: Usual Status of employment is considered
Labour economists Ferrant et al. (2014) argue that gender inequality in unpaid care work influences gender gaps in labour outcomes having ‘significant implications for women’s ability to actively take part in the labour market and the type/quality of employment opportunities available to them’. The gender roles that shape the division of labour within the household have a corresponding impact upon labour participation, job quality and wages (G. Sen & C. Sen, 1985).
Even before the pandemic, India was facing low and declining women workforce participation rates (Chakraborty, 2020). As per the 66th round of NSSO data, as a percentage of non-agricultural employment, 84.7 per cent of women are in informal employment. The past one year and a half has seen a slowing of economic growth; the COVID-19 pandemic has exposed the vulnerability of informal workers at the bottom rung of the employment ladder. In 2020, the ILO (2020) estimated that about 400 million informal sector workers were at risk of abject poverty in India because of the COVID-19 crisis.
The dire macroeconomic situation in India, characterized by low employment generation, low GDP growth and high inflation levels, has had uniquely adverse effects on women in work. The success of the Mahatma Gandhi National Rural Employment Guarantee Act (MGNREGA) in reducing rural gender wage gaps has shown that large-scale measures can be undertaken to improve conditions for women workers, but much work remains to be done to ensure good quality employment for women and men in both informal and formal economies.
2.2. The Analytical FrameworksThis section introduces certain frameworks that are useful for examining gender in the informal economy. The authors apply the Decent Work framework of the International Labour Organization (ILO) to assess the quality of work that women are engaged in. Decent Work, as envisaged by the ILO, is a multidimensional concept, which includes
formalizing enterprises rather than employees has led to a neglect of the conditions of informal workers (Chandrasekhar et al., 2021), and women workers often tend to be worst affected by formalization measures due to their blindness to gendered differences in working conditions.
Gender discrimination in society is reflected in the labour market in the sense that women informal workers receive less than half of the wages of males (Initiative for What Works to Advance Women and Girls in the Economy, 2021). Women are likely to be employed at the lower paying end of the occupational spectrum, with home-based workers and domestic workers receiving much less than workers in sectors like construction which tend to be dominated by men. The preponderance of women in cleaning and care jobs highlights the stability of gendered employment patterns. Figure 2.1 taken from the Initiative for What Works to Advance Women and Girls in the Economy report, shows gender-wise selected categories of informal workers in India during 2017–2018.

Women in Informal Sector 21
Rights at work
Social Dialouge
Social Protection
Jobs and employment
• Social security
• Equal treatment and opportunity
• Workers representation
• Employers representation
• Employment opportunities
• Safe workplace
• Decent working time
• Adequate earnings and productive work
• Stability and security
Figure 2.2 The Four Pillars of Decent Work
opportunities for work that is productive and delivers a fair income, security in the workplace and social protection for families, better prospects for personal development and social integration, freedom for people to express their concerns, organise and participate in the decisions that affect their lives and equality of opportunity and treatment for all women and men.
According to the ILO’s (2017) Decent Work agenda, the four pillars of Decent Work, as depicted in Figure 2.2, are as follows:
1. Guaranteeing rights at work2. Promoting jobs and enterprise3. Extending social protection4. Promoting social dialogue
The ILO has also highlighted the need to apply the concept of Decent Work to ‘the entire continuum from the informal to the formal end of the economy, and in development-oriented, poverty reduction-focused and gender-equitable ways’ (ILO, 2002). In this chapter, we examine specific sectors of women’s work through the Decent Work lens.
Further, we apply the Gender Equality and Social Inclusion (GESI) framework to analyse
the issue of women and informal work. The GESI framework highlights the importance of three sets of factors that constrain the ability of excluded groups (gender is one of the axes of exclusion, with gender being interpreted to include women and LGBTQ, and other axes include caste, ethnicity, locations, disability, etc.) to participate in society, and these are then indicated as the three domains for development action for inclusion. For all excluded groups, the framework espouses that they not only lack access to assets and resources but also lack voice and, in addition, the norms and institutions in the society are biased against them. In order to bring about equality and inclusion, action is therefore needed on all three fronts: • Assets and services in the hands of those
excluded, which improves their condition and their ability to enhance, influence and hold the state and other social actors accountable.
• Voice, influence and agency, which provide access to decision-making and is largely determined by representation and organization building.
• Rules of the game are norms, policies and institutional changes. They may also be referred to as the broad enabling environment.

22 STATE OF INDIA'S LIVELIHOODS REPORT -2021
These three domains of change are depicted in Figure 2.3. The GESI analysis enables an overall understanding of the policy and enabling environment, women’s voice and networks, which determine their ability to influence their environment and their access to resources and services, which is the key determinant of women’s condition in the society and the economy. The chapter will develop its recommendations to reflect these three domains of change.
A discussion on inclusion must pay attention to the fact that there are many interim stages in the continuum from exclusion to inclusion. Sometimes groups may be included, but not on equal terms, a state which may be termed ‘adverse incorporation’ (Hickey & du Toit, 2013). This amplifies the idea that though there may be an illusion of inclusion of vulnerable groups in initiatives, or systems, but in fact their inclusion is based on discriminatory terms. This is particularly relevant for women’s work, where though they work on government agendas, they are considered volunteers, which has led to decades of struggle to be recognized as workers. This chapter discusses two such sectors: Accredited Social Health Activist (ASHA) workers and Anganwadi workers (AWWs). Domestic work, the third sector discussed, demonstrates experiences of women in completely informal work who have not benefited from any policy changes in their favour.
2.3. The MethodologyThis chapter relies heavily on secondary research, supplemented by a few interviews of key resource persons and women in the informal sector. For instance, the perspective of AWWs were gleaned through interviews with 8–10 current and erstwhile AWWs and village women. The authors’ team also held interviews with entities rolling out support in rural areas across Karnataka, Maharashtra, Andhra Pradesh, Jharkhand, Gujarat, Uttar Pradesh and Bihar. A lot of what was mentioned by the AWWs and others corroborated with past reports. Some new assessment of their situation has also been indicated in the note below.
We take cognizance of the fact that when we create narratives around women and gender, the linguistic conventions used are context specific and reflect the situations, audience, dynamics of exclusion, historical and political discourses of that context (Kondo, 1990). Accordingly, we question the use of terms and notions of ‘volunteerism’ to deny women’s recognition and rights as workers.
2.4. Women’s Work in the Informal EconomyWe start with a definition of the informal economy and a discussion on women’s work being largely in the informal economy. We follow it up with a brief discussion on whether and how a transition to formality may be a pathway for better jobs.
Employment in the informal economy is not just limited to the informal sector but can include jobs outside of the informal sector as well. This includes jobs that are traditionally seen as household jobs and can even include jobs in the formal sector.
The informal economy is here to stay. India has seen a significant growth in private sector jobs post-liberalization in the 1990s but, alongside this, there has also been a significant growth in informal employment due to the growing use of contract labour and outsourcing of production. It is, however, important to note here that the informal economy doesn’t just exist
Voice, Influence and Agency
Livelihood Assets and Services
Inclusive Policies and Mindsets
Figure 2.3. The GESI Framework

Women in Informal Sector 23
within the ambit of the private sector, but jobs in the government sector may carry characteristics of informal jobs. The spectrum of informal to formal jobs is shown in Figure 2.4.
The figure shows that the term informal economy is inclusive of informal sector and informal jobs in the formal sector or jobs that are traditionally seen as household jobs. The diagram highlights that there may be jobs in government departments of organizations that are closer to informal than formal jobs. These include sectors such as ASHA workers and AWWs. The chapter discusses these sectors. On the informal spectrum, the chapter discusses domestic workers and construction workers.
2.5. Lack of Recognition of Women’s WorkAcross India, especially in rural areas, women put in equal number of hours of work, if not more, in managing not just their farms but also managing their homes, cooking, taking care of children and family.
A Hindustan Times report in September 2020 highlighted National Statistical Office (NSO) survey report (Jha, 2020), conducted between January and December 2019, that stated that an average Indian woman spends 19.5 per cent of her time engaged in either unpaid domestic work or unpaid caregiving services. It further brought out that Indian women bear the brunt of household work and domestic chores. According to the report:
Employment in the informal
sector
Employment in the formal
sector
Informal employment in the formal sector: ASHA
and AWWs
Domestic workers
the average Indian woman spends 243 minutes, a little over four hours, on these, which is almost ten times the 25 minutes the average man does. Thanks to the greater burden of domestic work, men spend more time than women in every other activity—working, studying, even just taking care of themselves. (David, 2020)A survey by the Azim Premji University of
5,000 workers across 12 states, of whom 52 per cent were women workers, found that women workers were worse off than men during the lockdown. Among rural casual workers, for example, 71 per cent of women lost their jobs after the lockdown; the figure was 59 per cent for men. Data from the Centre for Monitoring Indian Economy also suggest that job losses in April 2020, as compared to April 2019, were larger for rural women than men (Swaminathan, 2020). This clearly reflects the sense of insecurity that women must encounter. They are never the priority despite the extra hours of hardship that they face.
Figure 2.4. Women’s Employment across Formal and Informal Sectorswork
2.6. Enabling Decent WorkInternational agencies such as the International Labour Organization propagate a theory of change that the transition of work and enterprises from informal to formal results in Decent Work for the workers and benefits for the enterprises. At the same time, recognizing that informal economy will grow, during the

24 STATE OF INDIA'S LIVELIHOODS REPORT -2021
COVID-19 pandemic, there are measures to introduce elements of Decent Work in the informal economy without necessarily moving to formality. An example is the move to introduce social protection to workers in the gig and platform economies and in the plantation sector (Labour Code 2020). The extensions of these protections are arbitrary measures, and no alternate theories of change have yet been articulated about how to achieve Decent Work within the informal economy.
Government policies and measures are incomplete. The e-Shram portal registers informal workers on a central database, but the task of linking them with state social protection schemes or on state employment exchanges has not yet been fully conceptualized or operationalized.
Although the government recognizes the need for support to the informal sector, the measures taken seem contradictory. At first sight, the introduction of the e-Shram portal seems an important step towards Decent Work, as it opens the door for informal sector workers to social protection schemes. The reality on the ground, however, is that those registering on the e-Shram portal have access to only one benefit: insurance in case of accidents. The government has so far not made any linkage between the data uploaded on the e-Shram portal with state schemes for poverty reduction and women’s employment. So while data will be collected, currently there is very little link to either social protection, or any other measure for transition to Decent Work.
As of 23 October 2021, the e-Shram portal shows complete registrations of 47,473,227 workers, out of which 49.66 per cent are males and 50.33 per cent are females. The portal also shows that only 28.14 per cent of the registered workers have AADHAR-linked bank account. But with AADHAR authentication being mandatory to avail cash transfer benefits from many government schemes, registration in the e-Shram portal is of no use for the remaining 71.86 per cent who have not linked their AADHAR with their bank accounts.
2.7. Feminized Sectors: Formal or Informal?The social and economic categories that women belong to have a clear relationship with which economic activities they are engaged in. Dalit and Maha-Dalit women may be subject to social and economic discrimination by being relegated to devadasi/sex work, manual scavenging, municipality workers, AWWs and other similar occupations. The laws relating to wages, working condition, occupational safety and health remain, and the affirmative schemes for these groups stay less implemented too. The state effectively reinforces existing inequality in the social and economic structures, while it does have the power to affect equality.
India has 0.158 billion children below 6 years of age (of which 0.117 billion are in rural India), enrolled in a large network of about 1,300,000 AWCs. All AWCs are managed by women AWWs, who number 1.39 million across India. They are supported by 1.28 million Anganwadi helpers. A total of 2.67 million women workers are employed in early childhood care in India’s AWCs.
Some of the important areas where this is prevalent include ASHA workers, AWCs and Mahatma Gandhi National Rural Employment Guarantee Scheme. As these programmes of the government provide significant employment opportunities across the country, it is essential to include these within the ambit of the paper. These jobs, particularly the AWCs and ASHA for instance, also bring out the critical component that the paper will focus on: gender and informal work.
The Wage Code Bill of 2019 seeks to consolidate and simplify existing wage legislation, protect workers interests and provide them with decent working conditions in terms of minimum wages, reasonable working hours, etc. However, it excludes feminized sectors such as domestic workers, home-based workers, AWWs, ASHA workers, auxiliary nurse-midwives (ANMs) and MGNREGA workers from its provisions. In fact, ASHA workers and AWWs are excluded because

Women in Informal Sector 25
they are considered ‘honorary workers’ only (Mohanty, 2020). These activities are considered to be the natural extension of housework in the domain of care, nutrition and health, which is assumed to be a woman’s natural responsibility.
We analyse in detail the situation of domestic workers, ASHA and AWWs with a Decent Work and GESI lens and then develop the recommendations for the way forward.
2.8. Anganwadi WorkersIndia is a country with a population of 1.3 billion people (1.21 billion as per 2011 census) which accounts for approximately 17 per cent of the world population. The majority of India’s people reside in rural areas (68.8% as per 2011 census; Chandramouli, 2011). Health and education remain key concerns in our country and more so in these areas. The pandemic has brought out inadequacies and is, consequently, also accelerating the thrust on healthcare improvement in our country.
India has, fortunately, already got in place the largest network of childcare facilities set up since 1975 and which has grown substantially now. These are the AWCs run by the AWWs the primary responsibility of which is to take care of the nutrition, education and health of children in the age group of 0–6 years of age (including for pregnant and lactating mothers).
The Anganwadi scheme of the Integrated Child Development Services (ICDS) under the Ministry of Women & Child Development aims to ensure supplementary nutrition, preschool education, nutrition and health education, identification of immunization needs and health check-ups to children in the age group of 0–6 years of age (and to pregnant and lactating mothers). The AWC is run by the AWW and an Anganwadi helper (AWH). The AWWs are also known as sevika and the AWH as sahita in some regions. The AWW typically manages the centre and takes care of the teaching and the overall healthcare management and the AWH prepares the food, keeps the centre clean and ensures attendance by the children of the village even if she must go out to fetch them (Ministry of Women and Child Development, n.d.).
For some of these activities, AWWs work in coordination with the ANMs who are located at the primary healthcare (PHC) centre/sub-centre and who visit the AWC centres either once or a few times a month. They are also supported by the ASHA workers whose role is to manage the basic health of all the villagers. The immunization and healthcare check-up or any referral services come under the Ministry of Health and Family Welfare (MWCD, 2020).
There are 1.39 million AWWs (and aided by 1.28 million AWHs), as per 2019 data covering the length and breadth of the country and based on the population of the village, the number of AWCs or mini-AWC is set up. Typically, an AWC caters to an 800–1000 people village and the number of AWCs in the locality increases as a multiple of that number. A mini-AWC is set up for a population size of 150–400 people. The revised budget allocation for Anganwadi services for the year 2020–2021 is `17,252 crore (Ministry of Women and Child Development, 2021).
The AWWs are supposed to receive 26 days of training upon induction, or at times a 5-day training in case of a backlog. Under the Poshan Abhiyaan scheme, they are put through further training under the Incremental Learning Approach having 21 training modules. They are entitled to 180 days of maternity leave, uniforms and insurance coverage under a few schemes. They are also entitled to be considered for a supervisor role based on vacancies and certain eligibility criteria (MWCD, 2015).
Practically, the AWC becomes a kind of hub or a congregation ground for women for any health-related activity by the AWWs, ANMs and ASHA workers, who work in close coordination with each other. The AWWs also encourage the women of the village to come by and discuss best health practices or any other such matters pertaining to women and children.
This gigantic machinery, rolling out basic nutrition and pre-education, is functioning well across the country, even with base-level compensations and multitude of hurdles. At the same time, several reports have highlighted problems being faced by the AWWs, and key among those have been infrastructure related, excessive workload and low honorariums.

26 STATE OF INDIA'S LIVELIHOODS REPORT -2021
2.8.1. Rights at WorkAWWs and the AWHs are given an honorarium for their work. They receive some other benefits but are not part of an organized system and are not formal ‘employees’ of the government. Apart from this, a key concern is of the amount of the honorarium which, though enhanced in 2018, is yet low. The current basic honorarium is `4,500 per month and this is supplemented by the state government in the form of incentives. An AWW, thus, may earn anywhere from `5,000 to 11,000 per month, as per reports, since the state incentive varies. The basic honorarium to AWWs at the mini-AWCs is now `3,500 per month and to the AWHs it is `2,250 per month (Ministry of Women and Child Development, 2018; Press Information Bureau, 2019).
Most AWWs state that the amount is too little to manage their households, and the expectations of most across states is for at least the minimum wages, if not a fixed `15,000 or `18,000 per month. Another aspect is one of delay in payment of honorarium at some places. The delay can be anywhere between 2 and 4 months, which they may even receive sporadically, in lots of few months or so, and this can cause a fair amount of uncertainty for them.
AWWs are given an honorarium, and not a wage, which keeps compensation low for the workers. Even this meagre payment is usually delayed, creating uncertainty about their incomes. Their wages are not inflation adjusted, and a standardized increment system is not implemented. Further, age limits may prevent them from taking supervisor positions, and the higher incomes associated with those positions.
which is low as per some of the AWWs in certain areas, since some have likely already crossed that age limit when they get eligible on the basis of number of years of service put in. So there may be a disconnect between age and years of service for some which leads to a missed opportunity for them.
Added to these, poor working conditions and lack of recognition result in AWWs having low motivation levels and low pride in their work. However, they continue to work because they can ill afford to discontinue whatever little they earn. Contradictory as it may sound, they do have a sense of self-achievement in the work they do, recognizing it as socially relevant for the society.
The pandemic has resulted in most centres remaining closed. The duty of these workers, however, continues. They visit the homes of the children, distribute the pre-cooked or dry ration received, ensure the health and immunization needs of children are met and some innovatively get the kids involved in an online activity. Earlier, the working hours would range anywhere from 4–7 hours a day in different locations. AWWs sometimes also restrict their working hours, as they feel the payment is not commensurate with the hours of work. Some stay on long after the children have gone back home to sort out the paperwork and the reporting, and some wind up the day quickly. An average of 20 children used to report to the centre, many of whom needed to be fetched to the AWC.
Some AWWs raise the issue of excess workload, again since it is not commensurate with the amount they receive per month. Maintaining of records of the children is another aspect they bring up, an activity which some find tedious. Of late, some stated that their workload has increased on account of various events/activities organized by the authorities such as a nutrition week or vaccination drives for which they do not get compensated additionally. They are sometimes sent for booth-level duties such as voter management, but for which they do receive an honorarium, which is about `1,000–1,500 for the entire exercise which may run into a few days.
AWCs generally have basic infrastructure facilities. A key point raised by an AWW was that of space. Just a kitchen and hall were not sufficient. There needs to be a separate study
There is also no standardized increment system for any AWW and even after 10–15 years of service, an AWW receives the same fixed honorarium rate with no benefits even for graduates or postgraduates. They also do not get any advantage of an inflation-linked payment system.
Further, there have been age limits for being considered for a supervisor level in some states,

Women in Informal Sector 27
room with table and chairs for the children, and a separate play area. A place where children can look forward to visiting daily and staying longer. There are issues of inadequate supply of water and electricity, and, in some cases, there is no water arrangement at all, which they need to fetch from a distance. Drainage issues, a lack of sufficient playing material for the children, lack of chairs for either the workers or the children, and no blackboards in some centres are other concerns sometimes raised. The number of registered children has been increasing on account of increased population and, also, sometimes on account of reverse migration, but the facilities may remain the same.
An Economic Times report in 2019 referred to a Department of Women and Child information that ‘a total number of 3,62,940 Anganwadi centres do not have toilets facilities and 1,59,568 Anganwadi centres do not have drinking water facilities’ and that the process of planning and upgradation with greater facilities such as creche and smart teaching and learning aids at the AWC was on. It was reported that ‘the ministry plans to initiate “Saksham Anganwadis” under which 0.25 million AWC will be upgraded over next 5 years’ (PTI, 2019).
Anganwadi centres do not offer good working conditions for the workers, or a good environment for the children. The infrastructure needs improvement, which due to lack of government budgets, could be improved through public private partnerships or CSR. Often, the nutrition for children is also of poor quality or insufficient, resulting in the parents being upset with the AWWs.
AWCs are saddled with multitude of infrastructure-related issues such as lack of basic water, electricity, insufficient playing and learning tools and chairs. Lack of these facilities at many centres combined with insufficient or poor-quality food for distribution, excessive workload considering low remuneration and some technology-related issues impact the efficacy of the system.
In some centres, the ration, whether dry or precooked, is supplied based on the requisition provided by the AWWs, but that is not the case at all centres. Several times, the food is not sufficient to meet the requirement of the children registered at the centre and, at times, the cooked food or dry ration is not received at all so then nothing is distributed. Sometimes, the food quality may not be good. Some states provide the AWWs with fixed cash amount to meet the expense of food purchase, and this can sometimes be delayed. Although they manage somehow, this arrangement becomes an issue in case the number of children has increased or if the price of the food items has gone up. So they distribute what they get. AWWs feel troubled on these aspects, but say they are helpless and can’t do much. Villagers are not always supportive and often complain about this.
Technology is a great enabler, alas, since the access is still low in villages, it sometimes poses as a stumbling block. Some AWWs quit their jobs when they were required to start inputting data of their work on a mobile app since they couldn’t learn to do it.
Another story that came to light was of an OTP-related issue. To avail the benefits provided by AWCs, pregnant women need to get registered via the AWC mobile app and for which they need to provide a mobile number. Since there are just a handful of phones in the village, it is not always handy by their side, and so they often miss the OTP number sent to complete the registration, which then gets into a glitch. Until lower cost mobile handsets and cheaper talk time are available, it may be good to try another system to ensure their registration.
Generally, the AWCs get additional support from donors, or CSR team of companies in the vicinity. An AWW, who had joined the CSR team of a corporate house, reported improvements in AWCs over the last decade, due to efforts of the community, private sector and the government.
As AWWs are unaware of their rights, they are unable to effectively articulate their need, yet they do highlight the inadequacy of or delay in honorariums, infrastructure-related issues or insufficiency of food received for distribution.

28 STATE OF INDIA'S LIVELIHOODS REPORT -2021
2.8.2. Working Conditions Much of the need for better working conditions is not visible to the AWWs. They are unable to articulate if they are well equipped to deliver their work efficiently, and their response to the questions on whether they are satisfied with the level of nutrition and timeliness of healthcare provided, whether they have sufficient toys and impart reasonable playtime, as also whether they are satisfied and well-equipped to provide basic pre-education to children, is mostly in the affirmative. This ‘everything is okay’ approach with respect to their service delivery is a matter that deserves deeper attention.
The AWWs need to be made aware of what is possible, what a look and feel of a good centre may be, what higher level of pre-education can be imparted, how different learning tools and toys can stimulate the intellectual thinking of the children and why better hygiene levels are imperative.
To address the quality and efficiency of delivery, training is paramount. AWWs do occasionally attend training programmes conducted by the government, and NGOs/foundations also have been providing training, but the pandemic put that on hold. It would be great if mini-learning video clips were sent to the AWWs on a weekly basis on different aspects of their work. It could be translated into different languages and disseminated via WhatsApp or any other medium that they use.
AWWs are entitled to certain life and accidental insurance benefits but seems that they may lack in health insurance as a benefit. Many are not aware of their entitlement for personal growth to supervisor level and may likely miss their opportunity on account of other eligibility criteria.
What little protection they have are either unknown or not known in full, nor are they aware of the mechanism to go about it.
Other than educational clips for the teachers, a video can be used to showcase what an ideal centre can look like. Video clips on how to keep centres uncluttered and clean, how planting of
flowers or placing something colourful in the centre can make it attractive, playful and fun for the children.
2.8.3. Social Dialogue Gender disparity among women and men in work is well known and oft-reported, hence the question arises whether women find ways to negotiate better deals.
Women continue to stand on their own and generally lack any support of a wider network. Coordination among the AWWs, ASHA and ANMs is, however, good since each cannot work without the other, and the approach there is collaborative. They also have a voice with the local NGOs and self-help groups (SHGs) with whom women in rural areas may be involved with.
AWWs maintain reasonable dialogue with their supervisor who are helpful and supportive to the extent they can and resolve minor issues, else, they ask them to keep going since they too can make no difference. A few times, the supervisor becomes like a family member but mostly, it is a professional approach. Other than this, they are not aware of any other forum where their voices can be heard and tend to, generally, keep their issues to themselves.
Today, though NGOs and SHGs also play a major role in providing support and space for growth to the women by involving them in many activities, alas, that is not sufficient. The attitude of AWWs is, thus, one of quiet acceptance. Either they fear to talk against anyone or the system, or they have just accepted their condition since they do not know better. This latter aspect deserves more focus with an imperative need for overall upliftment of their status by building awareness of what is possible for them as a person and instilling in them a sense of confidence.
2.8.4. Social Protection Social protection comes from having access to tangible benefits such as insurance, healthcare and financial security as also from the feeling of being supported.
At the first level, the social support and protection they get from the local villagers is of paramount importance; however, this may not always be the case. An AWW recently mentioned

Women in Informal Sector 29
that the villagers refused to support her on repairing the fan at the centre and asked her to go to the ‘Sarkar only’ or fend for herself. The villagers may not always look upon them so kindly due to multiple reasons. It has been reported in the past that difference in caste can also play a role in villagers holding a grudge against the AWW, and by some who are not entitled to the food supplies which go to families with young children. The few educated people in the villages may lend their support, but that can differ from place to place.
AWWs continue to brave their lonely journey, continue to toil harder and continue to accept the status quo, even as their resilience increases with minimal support of other stakeholders.
AWWs also face the challenge of trying to get village women to heed to their advice and instructions, on matters pertaining to health, hygiene and childcare, which at times encounter resistance. This gives the AWWs a fair amount of tension since they then get hauled up by the authorities for not doing their job adequately in either ensuring proper hygiene or adhering to the laid-out instructions. All these create a sense of unrest in their minds since they operate on their own.
The support from the authorities, their supervisors, is another key level and more groundwork needs to be done to understand how much the supervisors can protect them in case any mishap were to occur.
As regards promotions and an opportunity of being absorbed into the mainstream (and thus be reckoned for more financial benefits and security), there are guidelines for this based on the reservation, age, qualification and experience, and it may differ from state to state based on vacancies, etc. As per a notification by the Ministry of Women and Child Development dated 15 Sep 2015, 50 per cent of supervisors’ role is required to be filled in by AWWs based on different criteria such as years of service and qualification. On the ground, however, a number of such vacancies are limited and often these workers miss their chance because of some
eligibility criteria, with some workers not even aware that they can be eligible for a supervisory level, so basic rights of the women are also not known (Ministry of Women, 2015).
The insurance coverage they are supposed to receive is under the Pradhan Mantri Jeevan Jyoti Bima Yojana, Pradhan Mantri Suraksha Bima Yojana and Anganwadi Karyakartri Bima Yojana (Press Information Bureau, 2019). These policies take care of risk in case of death, accidental death and full or partial disability, and certain critical female illness; however, some AWWs seem unaware of the insurance coverage they get and those who do know may not have the details.
The AWWs do not have a strong network of support, nor any listening…to their voices, to their needs, to their rights
They rely on their first point of contact, that is, their supervisors who can help to an extent for any transactional issues, they coordinate and network well with their immediate counterparts, that is, the ASHA and ANMs, get additional support from the local NGOs and any CSR teams in their vicinity, and they must hold their own with the villagers.
Some states are known to provide cashless healthcare insurance for these workers, and they do feel comforted by this. Those registered under the Ayushman Bharat scheme also get covered irrespective. The question is are these sufficient and do they provide coverage to all workers across the country and whether a standardized roll-out is possible so that workers and their families are assured good health facility in case of any illness without having to resort to borrowing at exorbitant interest rates from the local lenders and fall into a debt trap.
Another matter is that of claims in case of a mishap. Family members often lack awareness about how to raise medical claims and receive the benefits in full. Sometimes, more educated villagers, or organizations may help the villagers with their documentation and the paperwork, etc., for payment of a small fee. This could be facilitated if the government provides handy kits clearly outlining the processes that need to be followed.

30 STATE OF INDIA'S LIVELIHOODS REPORT -2021
2.8.5. Impact of the New Education PolicyThe question arises whether new policies have the potential for change. For example, the New Education Policy 2020 (Ministry of Education, 2020) states that ‘over 85% of a child’s cumulative brain development occurs prior to the age of 6, indicating the critical importance of appropriate care and stimulation of the brain in the early years in order to ensure healthy brain development and growth.’ The emphasis on this could not have come a day sooner, and now several states are in different stages of implementation.
The policy aims to restructure school curriculum and pedagogy in a new design and consists of a foundational stage in two parts for children in the age group of 3–8 years: 3 years of Anganwadi/preschool and 2 years in primary school in Grades 1–2.
A concept of ‘Balavatika’ is part of the policy where every child before the age of 5, that is, before class 1, will be moved to a ‘Preparatory Class’ under an ECCE-qualified teacher (Early Childhood Care and Education). This roll-out would happen through stand-alone Anganwadis, co-located in existing primary schools, pre-primary schools/sections covering at least age 5 to 6 years co-located with existing primary schools and stand-alone preschools.
So the AWCs are likely to undergo some change in structure, and workload may either increase or lessen. These changes would, however, only be known in time since implementation may differ from state to state and may happen in clusters. The road ahead is uncertain for the AWWs, with the only hope that they get to benefit from this scheme by way of not just increased training, upgradation of skills but also by way of increased compensation. As of now, many are yet unaware of the scheme.
2.9. ASHA WorkersThe WHO aims to create decent work and appropriate compensation for health professionals and other health personnel working at the PHC level to respond effectively to people’s health needs in a multidisciplinary context. They will continue to invest in the
education, training, recruitment, development, motivation and retention of the PHC workforce, with an appropriate skill mix, and strive for the retention and availability of the PHC workforce in rural, remote and less developed areas.
While the 2018 WHO declaration on PHC does not lay down any female–male ratio of engagement for workers in this sector, the ASHA scheme is aimed to engage primarily women for community healthcare. One of the key components of the National Rural Health Mission is to provide every village in the country with a trained female community health activist ASHA.
The National Health Mission guidelines state that the general norm of engagement of ASHA workers would be one ASHA per 1,000 population. It further states that an ASHA must be primarily a woman resident of the village—‘married/widow/divorced’ and preferably in the age group of 25 to 45 years with formal education up to class 8 (National Health Mission, 2021). The feminization of the sector is thus written in the government norms, so is the biased norm of employing a married woman in preference to an unmarried woman. Seen through the Decent Work framework, the situation is as follows.
2.9.1. Rights at WorkASHA workers are residents of a community who are selected, trained, deployed and supported to function in their own villages to improve the health status of the people through securing their access to healthcare services. An ASHA worker’s job responsibilities are threefold, including the role of a link-worker (facilitating access to healthcare facilities and accompanying women and children), that of a community health worker (depot-holder for selected essential medicines and responsible for treatment of minor ailments) and of a health activist (creating health awareness and mobilizing the community for change in health status).
In order to serve as a technical and advisory body for the ASHA Programme and to extend support to the centre and state governments in overall implementation, mentoring and monitoring of the programme, the Ministry of Health & Family Welfare in July 2005 constituted the National

Women in Informal Sector 31
ASHA Mentoring Group (NAMG). However, the NAMG is yet to provide adequate social security to ASHA workers. On several occasions, ASHA workers have raised their concerns over the lack of social security. Especially during the pandemic, ASHA workers, across states such as Maharashtra, West Bengal and Delhi demanded hike in wages, health insurances, vaccination for their families and safety kits.
As per the government’s own statistics, there are 1,047,324 ASHA workers across the country as of September 2019. However, there is no uniform pay for ASHA workers in the country. Instead, different states have flexibility to decide on type of incentive to be given to ASHAs as per their specific context/need in addition to routine and recurring incentives under NHM (Government of India, 2020).
Nevertheless, some states have ensured financial support to ASHA workers apart from incentives. Like in the case of Assam, the ASHA Kiran scheme was launched in the year 2010–2011 to provide life insurance and medical cover to ASHAs and ASHA facilitators. The scheme is funded entirely by the state budget under the Assam Bikash Yojana.
The state of Jharkhand under the Sahiya Sahayta Nidhi provides financial assistance to families of ASHAs in case of accident of ASHA while she is performing her tasks, that is, travelling to attend meeting, training or visiting health facility, etc. Similarly, ASHA Kiranam in Kerala is an accident insurance scheme for ASHA workers.
But barring these few states, the lack of social and financial support to ASHA workers is evident. To understand the fault lines in the scheme, it is essential to understand the Indian public health services vis-à-vis our social construct. Healthcare services are normally hierarchical structures and, to top that, the Indian public health services originate from services for British. It is not surprising that the foot soldiers/CHWs bear the brunt of authoritarianism. We also see unofficial ‘task-shifting’ at local levels, and a general lack of regard for the work of CHWs, who are in no position to complain, being volunteers. The civil society is largely preoccupied in the healthcare rights of the community, and not the rights of CHWs, with a few notable exceptions. This in
the backdrop of an increasing shift of workforce from the formal to the informal sector has given rise to an assumption that the employer is no longer accountable for women workers’ safety at the workplace.
The update on the status of ASHA selection, training and support structures by the Ministry of Health and Family Welfare, based on data till 30 June 2016 report stagnation in training at the ASHA levels implying a lack of resources: both financial and human.
On the key issue of rights against sexual harassment, a Human Rights Watch (2020b) report titled ‘No #MeToo for Women Like Us’ released in October last year has carried some testimonies of ASHA workers that have flagged a silent crisis due to the heightened risk of sexual harassment involved due to the nature of their work in the community. A 36-year-old ASHA worker from Haryana stated:
When we go to the sub-centre to work, sometimes when we are alone, our male colleagues comment on how we are dressed, ask personal questions about our husbands, and it becomes awkward. Sometimes, when we go to people’s homes to vaccinate children for polio, the young and old men crack jokes like, ‘Give us also two sips, we will also become young and virile’.
Another account of a 38-year-old ASHA worker from Haryana speaks volumes about the lack of knowledge among ASHA workers about the law even when an ambulance driver tried to molest her but was asked to not file a police complaint and compromise after the driver apologized.
One victim was subjected to sexual harassment from October 2015 when she was on a post-partum home visit. A relative (accused) of the patient accosted the ASHA for a relationship which she denied. The problems began thereafter as the perpetrator started to stalk her and text her despite she informed him that she had children almost his age. This continued for 3 months after which he asked her to marry him and started

32 STATE OF INDIA'S LIVELIHOODS REPORT -2021
threatening her. Subsequently, a horrifying video of the victim being gang raped by the accused and few other men with vivid details surfaced and was widely circulated in early January. The victim’s husband in his statement to the fact-finding team stated that on 11 January 2016, his wife did discuss with him about the videos and ‘seemed determined to lodge a complaint about the rape with the police’. But the very next day on 12 January 2016, she was found lying dead by the road when she had gone out to take her son to a doctor. That evening itself, her husband along with the village Pradhan lodged an FIR and sections for punishment for rape (Sec 376 IPC), abetment to suicide (Sec 306) and offensive messages under Section 66A of the IT Act were filed. The accused and his two accomplices were arrested within few days (Dasgupta et al., 2017).
These testimonies show how ASHA workers are subjected to sexual offences such as molestation, lewd commenting and eve-teasing while at work.
In states such as Uttar Pradesh or Rajasthan where communities are deeply patriarchal, casteist and polarized, gender-based violence is fairly common. The Annual National Crime Records Bureau’s ‘Crime in India’ 2019 report show that UP reported the highest number of crimes against women (59,853), accounting for 14.7 per cent of such cases across the country. It was followed by Rajasthan (41,550 cases; 10.2%) and Maharashtra (37,144 cases; 9.2%).
The 2016 gang rape and the mysterious death of an ASHA worker in Muzaffarnagar, UP, before even she could lodge a formal complaint sets a perfect example that illustrate the lacunae in the ASHA scheme for woman workers. According to the ASHA Guidelines on the NRHM website, meetings of ASHAs are supposed to be held every month, and at these meetings, ‘they should be given (an) opportunity to share...their own experience, problems, etc’ (6). Yet, in this case, for entire three months, the health department had no idea that the victim was facing sexual harassment and being stalked and threatened, including at work. Nor did she think of complaining to her employers or asking them for help, even though she was clearly in considerable distress. This indicates that ASHAs do not perceive that there is a support structure in their districts that they can
access for help; nor are they equipped with the legal awareness to know that stalking itself can be reported to the police.
It is interesting to note that considering her death, a case of suicide has shifted the onus on the deceased ASHA worker and diverted attention from the gaps in her support system. The men, women and youth in the village viewed the videos of her gang rape, yet none of them was prepared to stand up for her rights and help her to seek justice, even though she had served the community for eight years. This lack of support from the community from which she was selected, and among the members of which she had been working for so long, points to a breach between the reality and the ideal envisaged role of ASHAs as ‘social activists’, grounded within their neighbourhoods.
2.9.2. Working ConditionsThe NHM guidelines categorically state that ‘ASHA would be an honorary volunteer and would not receive any salary or honorarium. Her work would be so tailored that it does not interfere with her normal livelihood.’ So they do not have the status of employees and, consequently, the associated rights.
On 24 September 2021, workers, including AWWs, ASHAs and mid-day meal staff, observed nationwide strike in states including Maharashtra, Madhya Pradesh, Kerala, Uttar Pradesh, Karnataka and Andhra Pradesh. Some of the demands made were regularization of work, better pay and insurance cover.
The workload of ASHA workers has increased drastically during the pandemic. They have to go for door-to-door surveys and contact tracing, convince people to get tested, distribute essential medicines and ration and stick COVID-19 seals on households, apart from carrying out other responsibilities (ANI, 2020; the Indian Express, 2021). However, the contribution of ASHA workers remains unrecognized (India Today, 2021). The Women in Global Health (2020) India organized a series of dialogues in June 2020 to make COVID-19-related contributions

Women in Informal Sector 33
and concerns of the ASHAs and AWWs better known. The report cited that there had been no raise in the incentives or any compensation of ASHA workers for the additional time during the pandemic.
2.9.3. Social ProtectionWith ASHA workers being defined as ‘honorary volunteer’, there is a clear absence of social security for these workers (Bhatia, 2019). This extends to the lack of maternity leave, health coverage and life insurance, and they get no special benefits for being ‘volunteers’. Further, the health facilities do not offer the ASHA a room or a bed for the night, even if it is very late when she completes her work there. In fact, there is no transport allowance or conveyance in case they need to travel back home at night alone. As per the ASHA Guidelines of 2013, ASHA workers were supposed to be provided resting rooms in hospitals and an ASHA grievance redressal committee was supposed to be set up, but neither of these has been implemented.
During the pandemic, ASHAs were not equipped with adequate PPE even as they performed contact tracing and interacted with newly infected cases in the community. So even though ASHAs are frontline workers during the pandemic just like doctors, they are not treated the same way. This has not only risked the lives of ASHA workers and their families to the COVID-19 virus but has also led to multiple cases of violence against ASHAs and their families as per this report. In this light, the assault and abuse meted out to an ASHA in Gorakhpur, Uttar Pradesh, in June 2021 during a vaccination survey portrays the lack of support to ASHA workers even during the pandemic.
In the lack of any additional financial assistance, a number of ASHA workers were paying from their own pockets for purchasing gloves, masks and sanitizers. They also did not have access to priority or free testing. If tested positive for COVID-19, ASHAs were not receiving support for their treatment.
As per statistics reported from ASHA worker’s union, 20 ASHA workers died during the pandemic in Telangana and 16 ASHA workers died due to COVID-19 in Karnataka as per Samyuktha ASHA Karyakarteyara Sangha—
the union of ASHA workers in Karnataka. As per official records, 44 ASHA workers died due to the pandemic in Bihar as of 22 January 2021. However, Bihar ASHA Workers’ Union estimates that over 15 ASHA workers have died during the second wave in the state.
Whereas due compensation to affected families have been denied, an Oxfam 2020 survey gives some insight into the working condition and incentives to ASHA workers during the COVID-19 pandemic. The survey conducted across four states—Uttar Pradesh, Odisha, Bihar and Chhattisgarh, a total of 306 ASHA workers were contacted over the phone for the survey. The survey reveals that nearly 29 per cent respondents were working more than 8 hours, while 42 per cent were working between 6 and 8 hours every day. However, 64 per cent ASHAs claim to have received no incentives for the COVID-19-related responsibilities undertaken by them. The survey also revealed the lack of basic protective gear to ASHA workers. According to the survey, just 23 per cent workers have received hazmat or bodysuits and only 76 per cent of the respondents received training on PPE usage and infection control.
ASHA workers have made a seminal contribution to the population across different parts of the country during the COVID-19 pandemic. Some of their personal accounts during the pandemic have been picked up by national media while many have gone unreported and unnoticed.
The story of 33-year-old Kamla, an ASHA in Dungarpur district in Rajasthan, gives us a glimpse of the hardships in which ASHAs continued their work during the pandemic. The residents of the two islands—Odapala and Betphala in Salakhadi village area under Seemalwada block of Dungarpur district—were reportedly finding it difficult to reach the nearest PHC centre due to increased water level in the river. However, Kamla rowed a boat in the middle of a swollen Mahi River for 45 minutes with four nursing staff on board to reach the tribal village located on an island. Upon reaching, she motivated villagers to get vaccinated and cleared misconceptions about vaccines. She ensured vaccination of the residents of the village and rowed back her staff safely. ASHAs like Kamla

34 STATE OF INDIA'S LIVELIHOODS REPORT -2021
have braved extreme weather conditions and risk of infection. It must be noted here that the official duties assigned to Kamla were limited to informing and motivating tribal villagers about the need to attend to health and family welfare, but she went beyond her duties given her commitment to the cause.
Another ASHA worker Bulu Bhuyan in Solmora health sub-centre, Block Kamalabari, District Majuli in the state of Assam was responsible for monitoring people under home quarantine. In an interview, she states about the extreme conditions in which she had to navigate to deliver her duties during the pandemic (WHO, 2021). Similar plight of ASHA workers was seen in Jammu as well. Jameela, an ASHA worker in Rajouri, trekked 6–7 hours to reach the upper reaches of Rajouri in Jammu. A mother of three children, she says, ‘I used to start early in the morning, leaving home at 6 for the Primary Health Centre to collect the vaccine… a two-hour walk one way with a nullah on the route. The nullah used to be swollen many times.’
Another ASHA worker from Majuli, Assam, informs that there are about 600 households in her assigned area. These houses are located far beyond the embankment and roads get flooded during the monsoons. In September, when the entire area was submerged, she rowed a boat to reach the homes. Even when water levels receded, she walked through wilted plants and silt to deliver health services.
The government of Uttar Pradesh had deployed 0.154 million ASHA workers during the pandemic to screen locals in rural pockets of the state. In 2020, ASHA workers carried out the herculean task of tracing more than 3 million migrant returnees in the state. An ASHA worker in Kanpur’s Bhadras village was reported to have made at least 40 home visits a day.
Despite the contributions made by ASHAs during the pandemic, the lack of social protection to these workers is very evident as was seen in many incidents across different states. An ASHA worker in Sadiq Nagar of East Bengaluru was reportedly manhandled by a group of 40–50 people in April 2020 where the ASHA was carrying out surveillance for COVID-19 report. Similar incidents of abuse and assaults were also reported from several other parts of the country
such as Nagpur in Maharashtra, Ballabhgarh in Haryana, Balasore in Odisha or Darbhanga in Bihar.
2.9.4. Social DialogueThe support mechanism for ASHAs prescribed under NHM requires monthly meetings at the PHC level to avoid unnecessary travel expenditure and wastage of time. The idea is that apart from the meeting with officials, they should be given opportunity to share sometime of their own experience, problems, etc.
An account of a 38-year-old ASHA worker from Haryana speaks volume about the lack of knowledge among ASHA workers about the law even when an ambulance driver tried to molest her but was asked to not file a police complaint and compromise after the driver apologized. She was not told that there was a law and that she could file a complaint at a local committee.
In summary, ASHA workers’ contribution needs recognition not only through appreciation but also through adequate payments and improved working conditions. They also need greater awareness, and organization, to be able to negotiate their working conditions.
2.10. Domestic WorkersIn the case of domestic work, 90 per cent of workers are women and girls, of whom almost 25 per cent are below the age of 14 (APWLD, 2010). Domestic workers have multiple employers and are not covered by labour law, preventing them from having access to social protection, workplace safety and health.
Although as per NSSO 2005 estimates, there are 4.75 million domestic workers in India, these numbers could be a gross underestimation with projections up to approximately 50 million domestic workers in India. Domestic work usually comprises household chores such as cleaning, washing clothes and utensils, cooking, childcare and elderly care. It is mostly the poor and unskilled migrant women from marginalized communities and vulnerable rural districts in India that are employed to carry out the aforementioned domestic work. This sector suffers from low wages, lack of formal contract, decent work conditions and poor social security

Women in Informal Sector 35
measures. The COVID-19 pandemic and the subsequent national lockdown further aggravated the situation of the already vulnerable sector (Indian Social Studies Trust, 2020).
When defining the term ‘domestic worker’, the delegates to the 2011 International Labour Conference did not rely on listing the specific tasks or services performed by domestic workers—these vary from country to country and may change over time. Rather, they supported a general formulation that draws on the feature common to domestic workers that they work for private households (ILO Convention No. 189)
The Domestic Workers Convention, 2011 (No. 189), reflects this when it defines ‘domestic workers’ in Article 1:1. The term ‘domestic work’ means work
performed in or for a household or households
2. The term ‘domestic worker’ means any person engaged in domestic work within an employment relationship
3. A person who performs domestic work only occasionally or sporadically and not on an occupational basis is not a domestic worker.
Earlier this year, the ILO recommended inclusion of domestic work as a form of work in relevant legislations and polices. Exclusion from national labour laws and high levels of informality continue to take a heavy toll on the working conditions of domestic workers in the Asia and the Pacific region.
2.10.1. Rights at WorkThe low levels of remuneration among domestic workers are the result of a range of factors, including a large labour supply, undervaluation of domestic work and its contribution to society, the low bargaining power of domestic workers, the lack of representation in the sector and frequent exclusion from labour protection, particularly minimum wage coverage—all of which tend to be interlinked. Establishing a minimum wage for these workers is a key means to ensure their right to decent work and a decent life.
Nearly 60 per cent of the 795 domestic workers interviewed in December 2020–January 2021 said that their employers did not pay them during the lockdown (Business Standard, 2020).
In December 2020, six months after the 2020 lockdown, 31 per cent of domestic workers had not found employment and even fewer had received support from their employers. Of these workers, 29 per cent were the sole earning members of their household, 21 per cent cared for an elderly family member, while 20 per cent dealt with someone who had a serious health condition. The respondents, who knew no other work, could not find alternative sources of income (Rai Chowdhury et al., 2020).
In its 2018 India Wage Report, the ILO stated that 66 per cent of wage workers in ‘scheduled employment’ were covered under the minimum wage system. For instance, the survey stated that domestic workers were covered under minimum wage laws in only 18 states and union territories. It also pointed out that while the law did not discriminate between men and women, analysis of different wages showed a bias. According to the survey:
For instance, women dominate in the category of domestic workers while men dominate in the category of security guards. While both these occupations fall within the category of unskilled workers, the minimum wage rate for domestic workers within a State is consistently lower than that for the minimum wage rates for security guards.
Apart from increasing the ambit of the minimum wage system, it recommended deciding minimum wages on the basis of skills and split across geographical regions. The survey supported the Code on Wages Bill that was passed in Parliament in August 2019 and endorsed the rationalization of minimum wages proposed by the Bill. The code has brought together the Minimum Wages Act, 1948, the Payment of Wages Act, 1936, the Payment of Bonus Act, 1965, and the Equal Remuneration Act, 1976, into a single legislation. The survey suggested that the government should notify a ‘national floor minimum wage’ across five regions, after which states can fix their own minimum wages, but not lower than the floor wage. This, it said, would bring uniformity and make states ‘almost equally attractive from the point of view of labour cost for investment as well as reduce distress migration’.

36 STATE OF INDIA'S LIVELIHOODS REPORT -2021
2.10.2. Working ConditionsA survey conducted by Rajasthan Mahila Kaamgar Union (RMKU) and the Indian Institute for Human Settlements shows that in 2020 the average income for domestic workers in February is about `8,000. It dropped by 35 per cent in March 2020 and by 93 per cent in April 2020. While wages for March were expected to be paid at a later date, there was uncertainty around receiving wages for April altogether.
Moreover, domestic workers are also faced with increase in debts due to the pandemic. A survey conducted by interviewing nearly 260 domestic workers in Delhi, Mumbai and Kochi points out that debts increased for 10 per cent of the families and more than 11 per cent families were forced to sell their personal assets for survival (Sumalatha et al., 2020). About 57 per cent domestic workers reported stigma and discrimination at workplace, and 40 per cent worked without any safety measures. It was found that 35 per cent of the respondents managed the household expenses with the reduced income, whereas 24.2 per cent families made use of the existing savings to meet their needs. About 44 families (17%) are taking help in cash/kind from immediate relatives, while 49 families (18.8%) are managing the household expenses with funds borrowed from moneylenders (Rai Chowdhury et al., 2020).
At a collective level, the cumulative income for all participants reduces from `40 lakh to a meagre `2.7 lakh. The report also points out that 52 per cent households report no income for the month of April. Overall, the monthly household income sharply drops by 75 per cent during April and May, from `16,159 to `4,010. 87 per cent of the participants had their last day of active employment in the week before the sudden announcement of lockdown-I, only 3 per cent had resumed work by the time this survey was conducted in May. Of the total, 28 per cent reported termination of work during lockdown, and another 23 per cent were uncertain of the status of their employment (Rai Chowdhury et al., 2020).
What is observed is that women’s income earned from domestic work constitutes 50 per cent of the total household income in most
cases. In addition to the quantum of income, what is important to note is the nature of it. Most domestic workers report that their spouse is employed in casual jobs. The income fluctuates on a monthly basis if not daily. Hence, in comparison, the income drawn from the woman from domestic work forms the stable income—a rare certainty in lives marked by constant flux and crisis (Rai Chowdhury et al., 2020).
2.10.3. Social ProtectionThe report also talks about relief networks and expectation for domestic workers during the COVID-19 pandemic. It states that there is a gap in coverage of domestic workers as beneficiaries of relief organized by the state. Only 37 per cent received any relief extended by either political leaders, police or ‘government’. Less than 1 per cent reported collecting dry ration entitlements from the PDS shops. The Union’s relief activities form a safety net for those otherwise left to their own means. Nearly 11 per cent also reported receiving support from within the community. Going ahead, cash transfers and rent support were identified as the most urgent and critical forms of relief by the participant group to ameliorate the impact of lockdown on their livelihoods, followed by a moratorium on employment loss.
Under the Unorganised Workers Social Security Act, 2008, state governments are mandated to establish welfare boards, register all workers (including DWs) and formulate/notify social security schemes. However, many state government are yet to constitute a welfare board even when domestic helpers unions have raised this issue in some states. The Code on Social Security 2020 introduced by the centre has also excluded DWs from its ambit. As a result, DWs remain outside the purview of government welfare schemes. Paucity of data is often cited as an excuse for non-registration of DWs. However, records existing in mechanisms such as police verification forms, resident welfare associations, union memberships or letters from placement agencies/civil society organizations have thus far remained unutilized.

Women in Informal Sector 37
2.10.4. Social DialogueDomestic workers are especially at risk due to their isolation in private homes and their exclusion from many key labour protections. The sexual harassment law denies them a civil remedy guaranteed to other workers, requiring local committees to refer the case to the police. But studies show that women often face humiliation, mistrust and lack of assistance at police stations when they report sexual violence, making most reluctant to bring a complaint.
Despite a growing national and global movement to recognize domestic workers and bolster protections for their safety, India has not ratified the International Labour Organization’s Domestic Workers Convention (Marichetti, 2018). For domestic workers, the 2013 POSH Act states that local committees have to refer the case to the police, leaving no civil remedy. Human Rights Watch has previously documented that women often face humiliation and mistrust at police stations when they go to complain of sexual violence, and that criminal cases can drag on in courts for years, leaving survivors vulnerable to threats and loss of workdays when they attend hearings. This same phenomenon also makes most women domestic workers reluctant to complain (Human Rights Watch, 2020a). Earlier this year, nearly 3,000 domestic workers in India reportedly mailed postcards to the Indian government with a request ‘As a woman domestic worker, I want a safe workplace.’
In 2013, India had enacted the Sexual Harassment of Women at Workplace (Prevention, Prohibition and Redressal) Act, meant to protect workers in both formal and informal sectors, including domestic workers. But there remains a huge gap when it comes to accessibility and awareness of this law for women especially in the informal economy.
Although the launch of the e-Shram portal has enabled registration of domestic workers, there remain huge information and implementation gaps, which constrain access of domestic and other informal workers to social protection and any workers’ rights.
2.11. Construction WorkersThe WHO highlights the consequences of ‘the continued lack of safe and regular migration pathways and gender responsive policies’ which puts migrant women (68 million globally in 2017) at ‘high risk of employment rights abuses, sexual and gender-based violence, racism and xenophobia’ (WHO, 2017).
Only 54 per cent of global governments report having formal mechanisms to ensure migration policy is gender responsive (UN, 2020). Among the EU member states, only 7 of 32 had policies that focus on the integration of women migrants (EU Agency for Fundamental Rights, 2018; EU Court of Auditors, 2018).
In India, the primary responsibility for childcare prevents women from working and earning incomes, exposing children to malnutrition and to harm when uncared for, including child rape.
With over 35–40 million people engaged in the construction sector, women occupy nearly 20–30 per cent of the workforce in the construction sector. Almost 65 per cent of the women work as construction labourers since their families are already in the workforce or male members of their family are employed there. Many women in construction work follow their husbands to the cities due to unsustainable livelihoods in the villages, such as drought-prone villages in central India, Rajasthan or Bihar. Two or three times a year, the workers go back to their villages to see children they left behind with grandparents and pay off debts mounted over the years (Bhalla, 2015; Choudhari, 2019).
2.11.1. Rights at WorkWomen construction workers work hard, but as their work falls in the domain of unskilled work, it is assigned lower value than men’s work. Women’s work involves hard work, cleaning dirt and soil around construction sites, carrying the cement and bricks to masons, shovelling gravel, breaking into drains with hammers, etc., but contract perceive men’s work as harder than that of women, and keep their wages lower. Women contest this and say that their work is as hard.

38 STATE OF INDIA'S LIVELIHOODS REPORT -2021
Not only is women’s work perceived as unskilled, access to skills such as carpentry, masonry, plumbing is gendered, which further prevents them from gaining skills. Wages for skilled workers have seen an upward trend, which is not the case for unskilled workers.1 Female workers in Delhi said that they earned `250 ($4) a day compared to 450 paid to men for the same work as it is generally accepted in the industry that women be paid less (Bhalla, 2015).
Industry officials admit the discrimination in wages and recognition of skills of female workers but say that attitudes are beginning to change among the country’s bigger companies. ‘The bias toward not recognizing the skills of the women is rather strong,’ said Sunil Mahajan, additional director general of the Construction Industry Development Council, a government–industry body.
Some NGOs/CSOs have tried to change the situation. For example, Mahila Housing Trust offers technical training to women. A survey of their trainees showed promising findings. Nearly 50 per cent of the trainees found skilled work, and over one-third found additional days of work. 80 per cent of them reported rise in monthly incomes up to over `1,000 per month. Many reported increased confidence and respect at work (Brahmbhatt, 2013).
2.11.2. Working ConditionsThe workers are recruited from villages by contractors who employ them for public and private projects. The contractors are responsible for accommodation, transport to and from the site and decide their pay and working conditions (Bhalla, 2015).
Before arriving at the work sites, women do not realize how difficult the working conditions could be, and that they would not be able to see their children for long periods. Martha Chen of the global network Women in Informal Employment: Globalizing and Organizing states that: ‘They have no community, except the other workers. Their living conditions are much worse. They have no water supplies and toilets, and nowhere to leave the children when they work.’
Their infant children play among the piles of bricks and gravel as their parents labour under the blazing summer sun.
ECCE services are an effective measure to address the health, nutrition and education needs of migrants’ children. It helps to realize the twin goals of increasing countries’ ability to compete in the global market and alleviate the effects of persistent poverty. Well-designed investments in ECCE services can have major economic and social pay-offs for families, individuals and societies at large by (a) facilitating women’s participation in the labour force (Premchander et al., 2021), (b) enhancing children’s capabilities and (c) creating decent jobs in the paid care sector (Premchander et al., 2021).
V. Prameela, the head of a programme for empowerment of migrant construction workers, informs that the local Anganwadis and government schools are not close enough to construction sites and miss out on children of construction workers. Sampark operates 18 creches for children of migrant construction workers in Bangalore. V. Prameela says, ‘Creches are essential for both women and children. The children need safety, nutrition and education, and the mothers need to be able to go out and work.’ Women’s ability to engage in paid work is hugely constrained by lack of creches, which are an essential service that the government needs to provide.
The importance of creches is, however, been recognized. Sampark, an NGO that works with construction workers in Bangalore, reports that companies provide creches for the children of workers on construction sites, partly to comply with the regulations but also to enable women and men to work without worries about their children’s safety and nutrition. C. Harish, who works for the empowerment of migrant construction workers, says:
When workers live on sites of construction companies, they are better provided for. Workers who live outside these sites have no access to safe drinking wager and toilets, or creches for their children. Women construction workers in these labour settlements have a very tough life.
1 https://www.mahilahousingtrust.org

Women in Informal Sector 39
Sampark runs day care centres in Bangalore, India, for children (6 months–14 years old) of migrant workers. These early childcare and development centres are located on construction sites/labour settlements which provide childcare, nutrition and immunization support, education and health awareness (Ramakrishnan, 2019). Since 2007, Sampark established 50 such centres throughout Bangalore, reaching more than 7,000 children of construction workers. The stimulating child-led learning environment at the centres using English and regional languages builds confidence in migrant children. Since 2007, Sampark teachers have facilitated admissions for over 1,000 migrant children into public schools to which the children should have rightful access. 80 per cent of mothers have been able to join the labour force and work without having to leave their children unprotected.
Assessment of children using new WHO child growth standards is an important component of the intervention, 26 per cent of children enrolled in these centres are malnourished; these children are given special diets to ensure growth and well-being. Pregnant women in the labour colonies are identified and linked to state childcare centres to receive pre- and postnatal nutrition, vaccines and medicines. Linkages for immunization are prioritized and in the last 3 years 660 children were immunized. Regular health check-ups identify children’s illnesses and over 1,500 children were linked to health centres/hospitals for treatment in the last 3 years. Even during the COVID-19 pandemic, 42 per cent of malnourished children improved their nutrition levels.
With Sampark’s advocacy, the centres, initially funded by corporate and charitable donors, were funded by Karnataka Building And Other Construction Workers Welfare Board (KBOCWWB). Following Sampark’s success for the pilot government–NGO partnership, the KBOCWWB upscaled their project to run 100 more centres across Karnataka. These creches are seen to be easily replicable across different contexts, where key linkages can be made with NGOs, local government, health centres and schools.
Women construction workers are often prone to safety hazards and sexual harassment. Researchers say women complain of the toll the
labour-intensive work takes on their bodies, the lack of childcare and abuse by their contractors or agents. Priya Deshingkar of the Migrating out of Poverty Research Consortium, a programme run from Britain’s Sussex University, reports that contractors are known to make passes and lewd comments at women workers and may try to touch them or even physically molest them. Yet women are not able to tell their men about it because they feel that they will be ex-communicated or punished by their husbands for behaving in a way that attracts this attention.
2.11.3. Social DialogueThe question arises whether women construction workers benefit from collectivization and engage in collective bargaining.
Activists who campaign for better treatment of women in the construction industry report that women construction workers are often unaware of their rights or are scared to complain (Bhalla, 2015). The Self Employed Women’s Association (SEWA), India’s oldest and largest female trade union with over 1.3 million members, also reports that most female labourers are unaware of their rights.
SEWA has formed a cooperative of female labourers in the Western city of Ahmedabad, where they are given on-the-job training to develop skills ranging from cleaning, carrying and shovelling to masonry, carpentry and plumbing. The cooperative also has an insurance scheme for workers, in which they are given half their daily wage for any sick days.
Women also navigate bias and negative attitudes. But cooperative organizers say it is not easy for them to get contracts due to the bias against women in construction. They report that contractors believe that women cannot complete jobs at the same speed and quality as men do. The SEWA staff finds it difficult to convince them that women are capable of constructing a house or a road or doing waterproofing or electrical or plumbing work. Strong efforts are needed to change gender-biased attitudes.
Although SEWA and a few other organizations organize women, a lot more work is needed before the collective voice of women construction workers can be strengthened.

40 STATE OF INDIA'S LIVELIHOODS REPORT -2021
2.11.4. Social ProtectionBoth women and men do not have access to financial compensation when they get sick. Since women climb scaffoldings with bricks and soil on their heads, they face higher hazards than men. This makes health and safety a crucial issue. Further, as they lose wages when they fall ill, both women and men in the construction sector face the challenge of lack of financial compensation. As they work in many different places, for different employers and are paid on a daily basis, they get no additional benefits.
2.12. Decent Work for Women in the Informal Economy: Analysis and RecommendationsWe summarize the decent work deficits in the sub-section below and outline potential action items for the way forward.
2.12.1. Decent Work Deficits The discussions above highlight that women’s work in the informal economy has several decent work deficits, even if they are in sectors that are predominantly related to government services. The large care-related sectors have deficits relating to all four pillars of decent work: wages, working conditions, social dialogue and social protection. We have depicted that care sectors are highly feminized, and that feminized sectors have high decent work deficits.
These deficits are in all aspects of the Decent Work spectrum. To begin with, work in feminized sectors is not recognized as work, so that even if employed by government departments, the women workers are provided with ‘honorariums’ and not wages. This is the case even when government norms, for example, for ASHA workers, specify a preference for employment of women. The norms are further gender biased as they specify that only married/widowed women will be employed, thus implicitly barring an unmarried woman from becoming an ASHA worker. The Wage Code Bill of 2019 is silent on the AWWs and ASHA workers since they are considered
honorary workers. So these women do not have any formal status as government employees even though they get their payment from the government. Their honorariums are low and delayed, and there is no standardized increment system, nor is there any inflation adjusted system for increases in honorarium like in the case of other government employees. Domestic and construction workers have the same issues: their work is seen as unskilled and of low value, and payments are much lower than those for men. They do not have access to training or skill upgradation. Further, there is no clarity on their personal growth with many not even being aware of any such policy for absorption to the next level.
Their working hours are not certain, and they are not paid for additional hours of work. They have no paid maternity leave, no place to rest or sleep and no transport allowance in case of delays at work. They have no social security and no health facilities. Women domestic and construction workers, ASHA and AWWs, all lack maternity benefits. They lack awareness about and access to medical and life insurance products and services.
Their workspaces are not well provided, and often not safe. The sexual harassment they face goes unchallenged, by society, employers and them, as they do not know where and how to access justice. They are not organized, so their collective voice is not strong. Their employers are often dispersed, and when the employers are known, for example, government departments and labour contractors, the power balance is too skewed in favour of the latter, for the women workers to negotiate better wages and working conditions for themselves.
Despite these conditions, ASHA and AWWs engaged and were given additional government duties during COVID-19 pandemic, but they were provided no additional payments, and no facilities or PPE kits during their COVID-19 duties. Construction workers not only lost work but also had additional childcare duties. All women faced domestic violence during the pandemic, so did women in informal work. Women informal workers have no access to a grievance redressal committee, no protection or redressal against violence faced at work, no priority or free testing for COVID-19, no support
Women in Informal Sector 41
for treatment in case of contracting COVID-19. The cases of death of ASHA workers due to COVID-19 are underreported, and their families have not received compensation.
The women workers, in the four sectors discussed here, are unable to raise their voice, because they are not aware of their rights and are not part of collectives which would enable them to engage in collective bargaining. In domestic work, employers are dispersed, rendering social dialogue difficult. In construction work, the contractors have power over the workers, who are often migrants. The power equations between employers and workers are so unequal, and competition in the market it so high that it is becomes difficult for the women to demand any improvement in their work situations.
The women have very low access to social protection. While they are eligible for various types of insurance, they have little awareness of and little access to these. Women workers in the construction sector have access to social protection schemes if they are registered with the construction workers welfare boards of the Department of Labour. However, domestic workers and other informal workers do not have such access. Although the e-Shram portal has started registration of informal workers, the welfare schemes are not broad-based, and serious policy changes would be needed to provide official social protection to women informal workers in the near future.
Women in informal work have shown great commitment and tenacity during the COVID-19 period and have reached far-flung areas to reach health, immunization and vaccination services, and provide supplementary nutrition where possible. The new policies expect them to improve their performance. However, recognition by integrating them as employees, or giving decent wages still seems like a dream far away and can be achieved only with collective voice and long struggles.
2.12.2. The Way ForwardBased on the above analysis, the strategies for moving forward for providing decent work to women in the informal sector would include those related to the three domains of change and are presented as follows.
Access to Assets and ServicesWomen need improved access to assets and services, as the Ministry of Women and Child Development recognizes too. They need improved access to education and skill training in all sectors in which they work, including the four sectors discussed in this chapter.
The improvement of the working conditions of women informal workers also calls for better infrastructure in their places of work, for example, in AWCs, construction sites. The government also needs to provide adequate resources for food, nutrition and immunization of children, especially in sites difficult to reach, such as construction sites where children of migrant workers live.
Greater community involvement and NGO initiatives would also be key in improving health and childcare services, and in ensuring respect for the work delivered by informal workers, such as the AWWs, ASHA, and construction and domestic workers. This recognition would in turn enable higher compensation for women’s informal work.
Building Voice, Influence and AgencySocial dialogue, collective bargaining and access to rights and entitlements is constrained by lack of voice. We have shown how voice building has been important for women in these sectors to gain any advances in their wages or working conditions. Organization building appears as a critical pathway to increasing voice. Although workers in the three sectors have some organization, and support of their contractors, together their voice is too weak to bridge the decent work deficits that they face. They would need support from the larger civil society and international agencies such as the International Labour Organization and United Nations Development Fund for Women.
Changing the Rules of the GameThe most critical issue for informal work of AWWs and ASHA workers is that it needs recognition as work through inclusion in the labour codes. In the case of domestic work, a

42 STATE OF INDIA'S LIVELIHOODS REPORT -2021
law is needed, whereby the work gets recognized for pay and protection. This would result in these women workers moving properly into the formal sector, with access to wages at a level commensurate with their work.
Although the mechanisms by which AWWs and ASHAs are employed have existed many years, they are not included as part of the formal organization structure. One alternative would be to formalize their employment, the second would be to create an organization (a public sector or a public–private partnership arrangement) which can employ all AWWs and AWHs across the country. This would enable establishment of a formal system of recruitment, promotion, salary, increments, leaves and other perks and benefit. Such a structure would also address the needs for formal training, skills upgradation, social protection and social dialogue.
The India Post Payments Bank offers a case for replication. It was established as a 100 per cent government-owned entity under the Department of Post, Ministry of Communication, and was launched in 2017 to provide every household easy access to banking. It expanded its reach using the entire network of post office across the country. A masterstroke created within the Department of Posts, whereby the post office upgraded their activities to encompass financial inclusion and through which the postman now provides door-to-door banking, different types of accounts, insurance policies and facilitates remittances. A similar set-up may be evaluated for the AWWs under the Ministry of Women and Child Development.
Policy reforms that prioritize women’s organizations for preferential awards in public construction projects are needed to enable women in the construction sector to access good working conditions. An example of such policies may be found in Kerala, where public housing and infrastructure are preferentially awarded to women’s organizations, if they can demonstrate technical competence and administrative ability to implement them.
Policies that enable trained workers to enter and be retained by the construction sector can also be beneficial to skilled women. The state government of Madhya Pradesh, for example,
incentivizes private builders with a 5 per cent tax exemption for employing certified workers on its construction sites. While the main intention of this policy is to raise construction quality to WTO-enforced global standards, policies like this enable organizations like MHT to make the case for introducing more trained women workers into construction sites (Baruah, 2010).
It is important to work on all three domains of change to ensure skilling of women in the construction sector, raise their confidence and agency, and promote policy reforms that promote women’s interests (Baruah, 2010).
2.13. ConclusionThe chapter highlights how women’s economic and social lives are deeply intertwined and how the impact of deep-rooted patriarchy on women’s lives can only be addressed by reforming structures, institutions and policy.
The chapter analyses women’s informal employment, with a focus on four sectors: domestic work, construction work, AWWs and ASHA workers. The issues faced by women workers are clearly embedded in a patriarchal social structure whereby women are employed as frontline workers in childcare, health, education, domestic work and construction, but do not get the deserved recognition as workers, good working conditions, social status and the means for decent livelihoods. They lack organization, voice and social protection too. Some good practices are discussed, which show the way towards bridging the Decent Work deficits in women’s informal work.
The findings point to a need for changes in policy, government structures and systems, and investment in building capacities of women workers and their organizations. Women’s informal work needs recognition even if it continues to be informal, as in domestic work, and women’s informal work in formal sectors, such as government departments, needs to be formalized for women to have access to Decent Work.

Women in Informal Sector 43
ANI. (2020). ASHA worker assaulted in Dar-bhanga. https://www.aninews.in/news/national/general-news/asha-worker-assaulted-in-darb-hanga20200417234847/
APWLD. (2010). The right to unite: A handbook on domestic worker rights across Asia. The author.
Baruah, B. (2010). Women and globalisation: Chal-lenges and opportunities facing construction workers in contemporary India. Development in Practice, 20(1), 31–44.doi:10.1080/09614520903436935
Bhalla, N. (2015). Building India’s cities, silent workforce of women goes unrecognized. Thomson Reuters Foundation.
Bhatia, K. (2019). The contemporary rights-based debate on community health workers: An analytical perspective from India. The Indian Journal of Social Work, 80(2).doi:10.32444/IJSW.2019.80.2.141-14
Brahmbhatt, B. (2013). India: Karmika School for Women Construction Workers (Presentation at the Regional Seminar on Gender Equality in Secondary Education, TVET and Skills for Employment, 11–13 Sep 2013, Beijing, PRC).
Business Standard. (2020). 60% domestic work-ers not paid in lockdown, faced poverty, debt: Report. https://www.business-standard.com/article/current-affairs/60-domestic-workers-not-paid-in-lockdown-faced-poverty-debt-report-121090800385_1.html
Chakraborty, S. (2020). Covid-19 and women informal sector workers in India. Economic & Polit-ical Weekly. https://www.epw.in/journal/2020/35/commentary/covid-19-and-women-informal-sec-tor-workers-india.html
Chandramouli, C. (2011). Census of India 2011. Rural urban distribution of population (provisional population totals). https://censusindia.gov.in/2011-prov-results/paper2/data_files/india/Rural_urban_2011.pdf
Chandrasekhar, C. P, Ghosh, J., Yadav, N., & Sharma, S. (Eds.). (2021). Insecurity of women work-ers and the chimera of formality in India. In J. Ghosh (Ed.), Informal women workers in the Global South: Policies and practices for the formalisation of wom-en’s employment in developing economies.
Chen, M. (2012). The informal economy: defi-nitions, theories and policies. Women in Informal Employment Globalizing and Organizing.
ReferencesChoudhari, S. (2019). Women workforce in the
male-dominated construction industry In India. BusinessWeek.
Dasgupta, J., Velankar, J., Borah, P., & Nath, G. H. (2017). The safety of women health workers at the frontlines. Indian Journal of Medical Ethics.doi:10.20529/IJME.2017.043
David, R. (2020). State ASHA workers battle abuse, poor salary and lack of proper training. Hin-dustan Times. https://www.hindustantimes.com/cit-ies/state-asha-workers-battle-abuse-poor-salary-and-lack-of-proper-training/story-98mtrqPfCjRavHIJvt-VETO.html
EU Agency for Fundamental Rights. (2018). Fun-damental rights report. The author.
EU Court of Auditors. (2018). The integration of migrants from outside the EU (Briefing paper). The author.
Ferrant, G., Pesando, L. M., & Nowacka, K. (2014). Unpaid care work: The missing link in the analysis of gender gaps in labour outcomes. OECD Development Centre.
Ghosh, J. (2021). Introduction: The gender implications of formalising informal activities. In J. Ghosh (Ed.), Informal women workers in the Global South: Policies and practices for the formalisation of women’s employment in developing economies. Routledge.
Government of India. (2020). Answer to Lok Sabha unstarred question no. 3418 to be answered on 13th March 2020. http://164.100.24.220/loksab-haquestions/annex/173/AU3418.pdf
Hickey, S., & du Toit, A. (2013). Adverse incor-poration, social exclusion, and chronic poverty. In A. Shepherd & J. Brunt (Eds.), Chronic poverty. Rethink-ing international development series. Palgrave Mac-millan. https://doi.org/10.1057/9781137316707_7
Human Rights Watch. (2020a). India: women at risk of sexual abuse at work. h t tp s ://www.h rw.o rg/news/2020/10/14/india-women-risk-sexual-abuse-work
Human Rights Watch. (2020b). ‘No #MeToo for women like us’. Poor enforcement of India’s sexual harassment law. https://www.hrw.org/repor t/2020/10/14/no-metoo-women-us/poor-enforcement-indias-sexual-harassment-law

44 STATE OF INDIA'S LIVELIHOODS REPORT -2021
ILO. (2002). Decent work and the informal econ-omy. International Labour Conference 90th Session. The author.
ILO. (2003). Guidelines concerning a statistical definition of informal employment. The Seventeenth International Conference of Labour Statisticians (ICLS). The author.
India Today. (2021). Overworked, underpaid: Asha workers, the frontline warriors in rural UP’s Covid battle | Ground Report. https://www.indiato-day.in/coronavirus-outbreak/story/uttar-pradesh-ru-ral-corona-asha-anganwadi-anm-nurses-under-paid-1802310-2021-05-13
Indian Social Studies Trust. (2020). Impact of Covid 19 national lockdown on women domestic workers in Delhi. The author.
Initiative for What Works to Advance Women and Girls in the Economy. (2021). Women in the Indian informal economy: February 2021. https://www.google.com/url?sa=t&rct=j&q=&esrc=s&-source=web&cd=&cad=rja&uact=8&ved=2a-hUKEwi_stem1dLzAhU8_7sIHWkEDrcQFnoE-CAUQAQ&url=https%3A%2F%2Fwww.indias-pend.com%2Fuploads%2F2021%2F03%2F26%2F-file_upload-446784.pdf&usg=AOvVaw2Yaar_ Jtj4w6hMNcuFwfTZ
International Labour Organization (ILO). (2020). ILO Monitor: COVID-19 and the world of work. Second edition. Updated estimates and analysis. The author.https://www. ilo.org/wcmsp5/groups/public/---dgreports/--dcomm/documents/briefing-note/wcms_740877.pdf
Jha, A. (2020). Women do most of the heavy lifting in Indian households: NSO report. Hindu-stan Times. https://www.hindustantimes.com/india-news/women-do-most-of-the-heavy-lifting-in-indi-an-households-nso-report/story-EKQpkpQLEpX-S85vFePH5NP.html
Kondo, D. K. (1990). Crafting selves: Power, gen-der, and discourses of identity in a Japanese work-place. University of Chicago Press.
Marichetti, S. (2018). The global governance of paid domestic work: Comparing the impact of ILO Convention No. 189 in Ecuador and India. Interna-tional Labour Organization.
Ministry of Education. (2020). National Edu-cation Policy 2020. https://www.education.gov.in/sites/upload_files/mhrd/files/NEP_Final_Eng-lish_0.pdf
Ministry of Women and Child Development.
(n.d.). Integrated Child Development Services (ICDS) Scheme. https://icds-wcd.nic.in/icds.aspx
Ministry of Women and Child Development. (2015). Reservation of 50% vacancies from amongst AWWs. https://wcd.nic.in/sites/default/files/Res-ervation%20of%2050%25%20of%20vacancies%20from%20amongst%20AWWs.pdf
Ministry of Women and Child Development. (2018). Revised rates of honorarium. https://wcd.nic.in/sites/default/files/Revised%20rates%20of%20Honorarium_0.pdf
Ministry of Women and Child Development. (2021). Demand no. 100. https://www.indiabudget.gov.in/doc/eb/sbe100.pdf
Mohanty, D. (2020). Asha worker attacked for collecting data on Covid-19 patients in Odisha. Hin-dustan Times. https://www.hindustantimes.com/india-news/asha-worker-attacked-for-collecting-data-on-covid-19-ve-patients-in-odisha/story-AZxHd8Y-HM1zGLnPkBdMUmN.html
National Health Mission. (2021). National ASHA Mentoring Group. https://nhm.gov.in/index1.php?lang=1&level=2&sublinkid=178&lid=251
Premchander, S., Jenkins, A., Al-Dajani, H., Sriram, K., Bennett, D., Formica, S., Babovich, M., Masini, F., Onyalo, S., Ning, S., & Thomas, M. (2021). Promoting economic and social inclusion of migrant workers. Task Force 10.
Press Information Bureau. (2019). Angan-wadi sevikas. https://pib.gov.in/PressReleasePage.aspx?PRID=1578557
PTI. (2019). Government plans to upgrade 2.5 lakh Anganwadi centres in next 5 years: Women and Child Development Ministry official. The Economic Times. https://economictimes.indiatimes.com/news/politics-and-nation/government-plans-to-up-grade-2-5-lakh-anganwadi-centres-in-next-5-years-women-and-child-development-ministry-official/articleshow/72828637.cms
Rai Chowdhury, A., Bhan, G., Sampat, K., & RMKU. (2020). Impact of COVID-19 and lockdowns on domestic workers. Indian Institute of Human Settlements.
Ramakrishnan, A. (2019). Some hand-holding for migrant workers’ kids. Deccan Herald. https://www.deccanherald.com/specials/insight/some-hand-holding-for-migrant-workers-kids-740652.html
Saini, S. (2021). Rajasthan Asha worker rows boat in tough condition to vaccinate island residents. Hin-dustan Times. https://www.hindustantimes.com/

Women in Informal Sector 45
cities/jaipur-news/rajasthan-asha-worker-rows-boat-in-tough-condition-to-vaccinate-island-resi-dents-101628415249512.html
Sen, G., & Sen, C. (1985). Women’s domestic work and economic activity: Results from National Sample Survey. Economic & Political Weekly, 20(17), WS49–WS56. http://www.jstor.org/stable/4374341
Sumalatha, B. S., Bhat, L. D., Chitra, K. P. (2020). Impact of Covid-19 on informal sector: A study of women domestic workers in India. The Indian Eco-nomic Journal, 69(3), 441–461.
Swaminathan, M. (2020). Reset rural job policies, recognise women’s work. The Hindu. https://www.thehindu.com/opinion/lead/reset-rural-job-poli-cies-recognise-womens-work/article31984168.ece
The Indian Express. (2021). Hills, jungle and a snake: How vaccinators did it. https://indianexpress.com/article/india/hills-jungle-and-a-snake-how-in-dia-covid-19-vaccinators-did-it-7584051/
UN. (2020). World migration report. International Organization for Migration.
WHO. (2017). Women on the move: Migration, care work and health. The author.
WHO. (2021). Where there is a will, there’s a way: Bulu Bhuyan, an ASHA worker from Assam shares her story. https://www.who.int/india/news/feature-stories/detail/where-there-is-a-will-there-s-a-way-bulu-bhuyan-an-asha-worker-from-assam-shares-her-story
Women in Global Health. (2020). WGH India Dialogue Series: Amplifying the engagement of Female Frontline Health Workers in India’s COVID-19 Response. https://www.internationalhealthpol-icies.org/featured-article/wgh-india-dialogue-se-ries-amplifying-the-engagement-of-female-front-line-health-workers-in-indias-covid-19-response/


Future of Jobs in India
3
3.1. OverviewThis chapter discusses major trends and issues related to the state of jobs and employment in India. Last 18 months have been like no other in the recorded human history. The COVID-19 pandemic has not left any country or individual on the planet untouched. It has affected every student, everyone who is already in a job and everyone who is ready to enter the job market. Millions of jobs have been lost in sectors such as travel, tourism, hospitality and entertainment industries, restaurants, facilities management, malls and multiplexes, sports, fitness and personal care services and so many others. At the same time, there has been an unprecedented gold rush among the investors looking to get a pie of the start-ups, particularly those in the space of digital platforms, mobile, digital and Internet-based services. The number of start-ups entering
Prabhat Labh1
unicorn status in the last 12 months both in India and globally has no precedent.
The available talent pool of jobseekers is nowhere close to the demand from sectors as diverse as artificial intelligence, machine learning, augmented reality, virtual reality, e-commerce, healthcare services, EdTech, fintech, AgriTech, medical research, etc. We truly live in a VUCA (Volatile, Uncertain, Complex and Ambiguous) time. Whenever someone writes about the economic history of the years 2020–2021, they will undoubtedly write about the deepest cut in GDP and employment in the recorded history. At the same time, they would probably also report about a smaller percentage of people/industries who never had it so good.
The ‘State of Jobs in India Report 2019’2 had brought perspectives from three young people—Siddharth, Ashita and Pranav (this was written in the pre-pandemic era). From the
1 Prabhat Labh is the CEO of Grameen Foundation India. The views expressed in this chapter are individual views of the author and do not reflect the views of Grameen Foundation India or any of its affiliate entities. The chapter is based on secondary data and reports; mostly from government sources that are available in the public domain.
2 https://grameenfoundation.in/wp-content/uploads/2019/12/State-of-the-Jobs-Report-Final-Version.pdf

48 STATE OF INDIA'S LIVELIHOODS REPORT -2021
stories of these young people pursuing different educational programmes in different parts of India, several common themes emerged. They all were hopeful and yet concerned about their future career paths. Siddharth and Ashita talked about the rapid changes in technology, which the university curriculum was not able to keep pace with. It put extra burden on them to learn about new technologies and tools outside their curriculum and came at the cost of their other interests that they would have liked to pursue. Pranav talked about weak regulation in the education sector, which posed a question mark on the quality of education and created an uneven playing field for the students, creating barrier for entry into the vocation of their choice. Two top concerns on the minds of these young people were (a) will there be right job opportunities for me? and (b) will I have the right skill set to be successful in the job market?
In the two intervening years since the report was published, Pranav completed his Masters and started working with a reputed non-profit organization. But within a year after getting into a job, he is already getting anxious, as he feels his learning curve is stagnating. He is not sure how he will learn the skills needed to move up in his career. Ashita completed her Bachelor’s in Business Administration and started her MBA course at IIM Rohtak. Siddharth is now in his 3rd year of engineering and has used his summer breaks to get some real-life organizational experience and exposure through internships. He also joined hands with a friend to start a web portal that focuses on the developments in the HR industry, a domain that he wants to be in after completing engineering followed by an MBA with specialization in HR.
The aspirations and trajectories of these students tell us a lot about the state and future of jobs in India. Good education and having the right set of skills is valued to get ahead in life. In a world turned upside down by the COVID-19 pandemic, digital capabilities figure right at the top of the list of competencies that have served the jobseekers well. But even more importantly, the ability to quickly pivot and embrace change in a world that is changing fast in rather unpredictable ways, and the skills needed to establish and maintain deeper connections in a
virtual world, have emerged as two of the most critical traits for being successful.
3.2. Impact of COVID-19 on Economic Growth and Employment3.2.1. GDP Growth TrendsThe first quarter of the financial year 2020–2021 saw the steepest fall in GDP ever recorded in India at a negative 24.4 per cent. First quarter of the financial year 2021–2022 also saw the sharpest GDP growth of 20.1 per cent. The sharp bounce back was predictable due to the low base effect and return to normalization after the end of lockdowns. However, actual economic output, even after this spectacular bounce back remains below where it was before the pandemic. This is causing despair, misery and hardships in the lives of so many people.
The unemployment rate (UER) at 6.86 per cent (CMIE) at the end of September 2021 is still above the 5 per cent normal UER expected in a well performing economy—a level last seen in December 2017.
When the first wave of COVID-19 struck, and the entire country went into a lockdown, we saw haunting images of millions of migrants walking thousands of kilometres to get back to their home, with nothing to eat and no hope. Economists predicted a sharp recovery in economic activity and employment after a sharp fall. However, predicting the pathway taken by the economy has been as difficult as predicting the mutation of the virus itself. The predictions changed from a V-shape recovery to a U-shaped recovery to a K-shaped and W-shaped recovery.
During the nine-year period starting from 2011–2012 up to 2020–2021, India’s GDP grew at an average compounded annual growth rate of 4.97 per cent at constant prices. The last six quarters, starting from last quarter of FY 2019–2020, were massively impacted by the disruptions related to the COVID-19 pandemic and lockdowns, which resulted in depressed GDP growth during the last quarter of 2019–2020 and the first two quarters of FY 2020–2021.

Future of Jobs in India 49
The COVID-19 second wave also impacted the growth during of 4th quarter of FY 2020–2021. Therefore, in order to discount the impact of COVID-19, if we look at a 7-year period from 2010–2011 to 2018–2019, then the average GDP growth rate during those seven year rises to a relatively healthier 6.97 per cent.
However, all sectors of the economy do not grow at the same pace. During the last two years which were impacted by COVID-19, agriculture (combined with forestry and fishing) emerged as the fastest growing sector. However, if we looked at the overall period year 2010–2011 to the year 2020–2021, then agriculture, forestry and fishing come in as the third slowest growing sector, having grown at the rate of CAGR of 3.46 per cent at constant prices during this period. The slowest growing sector was mining and quarrying which grew at 1.35 per cent CAGR, followed by construction which grew at CAGR of 2.1 per cent during this period. Even if we discount the last two years and only looked at the period 2011–2012 to 2018–2019, agriculture was the slowest growing sector during that period having grown at a CAGR of just 3.32 per cent at constant prices, compared to the overall GDP growth rate of 6.97 per cent. This is worrying because agriculture happens to be the single largest job creator accounting for over 50 per cent of entire jobs in India.
The fastest-growing sectors during the pre-COVID-19 period were trade, hotels, transport, communication and services related to broadcasting (8.72%), financial, real estate and professional services (8.55%) and manufacturing (7.41%).
Agriculture was the least impacted sector during COVID-19. It was the only sector with a positive growth (3.6%) during financial year 2020–2021, while all other sectors with the exception of electricity, gas, water supply and utility services posted negative growth rates. Not surprisingly, trade, hotels, transport services were the most severely impacted sector, having contracted by 18.2 per cent during FY 2020–2021.
3.2.2. Impact of COVID-19 on Jobs We now look at how employment was impacted by COVID-19 in last year and half. While
COVID-19’s impact on economy and jobs started during the quarter of January–March 2020 itself, employment during the quarter ended March 2020 stood at 406 million.
In comparison, after a year, in the quarter ended March 2021, employment is estimated at 399.7 million. Therefore, one year after the onset of COVID-19, India was left with a shortfall of 6.3 million jobs. While many of the lost jobs came back, not all jobs could be recovered. The net shortfall of 6.3 million jobs implies a loss of 1.5 per cent of the jobs.
Comparison of the quarter ended March 2021 with the quarter ended March 2020 provides a view of how COVID-19 impacted jobs. In January 2020, employment was estimated at 410 million. This dropped to 406 million in February and then to 396 million in March 2020, as lockdowns came into effect. Taking March 2020 as the baseline for pre-COVID-19 employment understates the pre-COVID-19 conditions. Still that total employment during the quarter ended March 2020 was at 406 million.
Under the impact of COVID-19 for a year, the employment in the quarter ended March 2021 was estimated at 399.7 million. Therefore, one year after the onset of COVID-19, India had a shortfall of 6.3 million jobs. While many of the lost jobs came back, not all jobs could be recovered. The net shortfall of 6.3 million jobs implies a loss of 1.5 per cent of the jobs due to COVID-19 or during the COVID-19 impact.
The second wave of COVID-19, which hit India a year after the first wave, led to an additional loss of 13.3 million jobs. Employment dropped from 399.7 million in the quarter ended March 2021 to 386.4 million in the quarter ended June 2021. So compared to the pre-COVID-19 March 2020 quarter, India faces a massive loss of 19.6 million jobs.
While the immediate impact of COVID-19, as seen in the employment figures for June 2020, was much more severe, a loss of a whopping 78 million jobs was largely recouped in subsequent quarters, leaving a shortfall of only 6.3 million jobs as of the quarter of March 2021.
As of the quarter of March 2021, of the 399.7 million jobs, women accounted for only 41.8 million jobs (or approx. 10%). But, of the

50 STATE OF INDIA'S LIVELIHOODS REPORT -2021
6.3 million jobs lost over the preceding year, women accounted for 1.5 million lost jobs, or 23 per cent of the lost jobs.
Urban women had the most disproportionate loss of jobs due to COVID-19 first wave. Urban women account for about 3 per cent of total employment but had to suffer 39 per cent of total job losses in the first wave. However, in the second wave, urban women suffered the least loss of jobs, while urban men suffered the highest loss of the jobs. While many of the lost jobs have come back, or will come back, many of those who got their jobs back or found alternate jobs got these at lower wages.
COVID-19 however also led to hastening of an important structural transformation in the economy towards digitalization across industries and work processes. COVID-19 lockdown restrictions crippled many of the traditional business models and processes. At the same time, many industries quickly embraced digitalization not only as way to ensure business continuity but also looking at digital enablement as a critical part of their future growth strategy. Abundance of liquidity caused by stimulus package announced by the governments the world over to fight the impact of COVID-19 on economy and employment led to a surge in the appetite of the investors to look for those businesses which could thrive in a digitally connected world. The COVID-19 restrictions also forced an important change in customer behaviour towards the adoption of products and services where digital technologies play an important role in delivery. Diminishing customer resistance to adoption of digital services opened the floodgates of investment into digitally enabled businesses.
More venture capital (VC) and private equity (PE) investments went into Indian start-ups in last one year than ever before. In just the first 9 months of 2021, PE and VC investors have pumped over US$49 billion (INR 353,000 crore) in Indian companies and start-ups through 840 deals, surpassing the PE-VC investment during the entire previous year. Zomato, a tech-driven food delivery platform, which directly employs only about 5,000 people, but creates self-employment for over 350,000 delivery partners, became a
poster boy of digital platform-driven business model, getting valued at over INR 100,000 crore (US$13.51 billion) after its initial public offering. Platform companies such as Zomato have become an important driver for job growth. Growing interest in the start-ups is helping them to grow at a fast pace and create many jobs.
While the delivery partners are not employees of Zomato, in the tech-platform-driven business models, we are seeing emergence of millions of job opportunities for independent workers linked to digital platforms. A typical delivery partner working for Zomato or its competitor Swiggy, or Delhivery, may earn between `15,000 and `30,000 per month, depending on the number of hours worked, location and season. While these are very modest incomes, they compare favourably with the minimum wages. It also provides flexibility to the delivery partners to work as per their convenience.
While such jobs may not come with social security and other long-term benefits such as medical insurance, sick leave, paid leave, gratuity and provident fund, there are some signs of progress in this regard. In many countries, unions of independent platform economy workers are getting together to demand for their rights, fair wages and other benefits. Even though such self-employed people may not receive all these benefits, during the pandemic we did see taxi aggregators such as Ola and Uber making efforts to raise funds for their taxi driver partners and support them during the lockdown. In many instances, the platform aggregators, like other employers, paid their workers to get vaccinated. Some platform aggregators also offer accidental death and permanent disability insurance coverage to their partners.
Even though the number of unicorns and VC deals getting done is unprecedented, it represents a rather small proportion of the overall economy. If we looked at the broader economy, every single sector except agriculture has had a negative growth in FY 2020–2021 and has had an impact on the unemployment scenario.
COVID-19 first wave in 2020 and second wave in 2021 caused the UER to spike, breaking all previous records. During the COVID-19 second wave, the UER climbed to nearly 12 per

Future of Jobs in India 51
3.2.3. Structural Changes in EmploymentIndian job market has been undergoing a secular structural transition over several decades. One such transition is the move away from agricultural to non-agricultural employment. The other shift is migration from rural to urban areas. Third, a structural shift has been taking place in how different sectors of the economy stack up in the overall economic output. Agriculture, which used to contribute to nearly 50 per cent pf the GDP 70 years ago has seen its share constantly fall to just about 18 per cent now. With industrialization, there was an uptick in the manufacturing sector. However, the manufacturing sector contribution to the GDP has also remained static over last two decades. Only sector that has witnessed a secular growth is the services sector, which now accounts for the largest contribution to the GDP.
As the jobs shift from agriculture to non-agriculture sectors, the need for more educated and skilled workforce increases. However, the growth in non-agricultural jobs has not been keeping pace with the increment in the labour force (LF) as well as migration of existing workers to non-agricultural sectors. As a result, the UER increases as one gets more education and seeks non-agricultural jobs, as can be seen in Table 3.2.
Source: Centre for Monitoring Indian Economy Pvt. Ltd.
Table 3.1. Urban and Rural Unemployment Rate in India in Last 12 Months
Month Unemployment Rate (%)
India Urban Rural
Sep-21 6.86 8.62 6.06
Aug-21 8.32 9.78 7.64
Jul-21 6.96 8.32 6.34
Jun-21 9.17 10.08 8.75
May-21 11.84 14.72 10.55
Apr-21 7.97 9.78 7.13
Mar-21 6.5 7.27 6.15
Feb-21 6.89 6.99 6.85
Jan-21 6.52 8.09 5.81
Dec-20 9.06 8.84 9.15
Nov-20 6.5 7.07 6.24
Oct-20 7.02 7.18 6.95
Table 3.2. Unemployment Rate in % for Persons 15 Years and Above under Usual Status with Different Educational Attainments
Source: PLFS 2019–2020.
Rural Urban Rural + Urban
Male Female Persons Male Female Persons Male Female Persons
Not literate 0.9 0.0 0.5 2.3 0.3 1.5 1.1 0.1 0.6
Literate, and up to primary
1.4 0.6 1.2 2.6 1.1 2.3 1.7 0.7 1.4
Middle 3.5 1.6 3.1 4.3 3.0 4.1 3.7 1.9 3.4
Secondary and above
9.3 12.2 9.9 8.7 16.2 10.3 9.0 14.1 10.1
All 4.5 2.6 3.9 6.4 8.9 6.9 5.0 4.2 4.8
cent, with the urban UER touching almost 15 per cent.
With the opening up of the economy, there has been a steady decline in the UER. Table 3.1 provides monthly trends in UER in last 10 months, corresponding to the period of recovery from COVID-19 first wave, onset of the second wave and recovery from the second wave.
Dissecting the UER between urban and rural, we find that rural areas are doing slightly better than urban areas, as the lockdown and pandemic have had a deeper impact on urban economic activities than rural.

52 STATE OF INDIA'S LIVELIHOODS REPORT -2021
3.2.4. Labour Force Participation of Men and WomenWhile unemployment is an important issue from the perspective of jobseekers, from the perspective of the economy, LF participation rate (PR) is an even more important issue. Almost one-third of the men (33%) and 9 out of 10 women are not participating in the LF in India as depicted in Figure 3.1.
In Aug 2021, the LF PR in the urban areas stood at 37.5 per cent, compared to 41.6 per cent in rural areas. The big divide in the LF PR is between men and women. While men had a LF
PR of 67.1 per cent, only 9.4 women participated in the LF (see Figure 3.2).
UER increases as the level of education increases. The difference between the skill level of educated people and what the industry demands from the workforce increases for skilled jobs. As a result, a lot of people who get educated do not have the right set of skills to be gainfully employed. After getting educated, they are also reluctant to go for unskilled jobs.
In October, David Card, Joshua D. Angrist and Guido W. Imbens were awarded the 2021 Sveriges Riksbank Prize in Economic Sciences in Memory of Alfred Nobel 2021 (popularly referred to as the Nobel Prize in Economics).
Figure 3.1. Labour Force Participation Rate in India: Urban and Rural (Aug 2021)
37.5
37.5
Urban Rural Male Rural FemaleRural
45
40
35
30
25
20
15
10
5
0
70
60
50
40
30
20
10
0
Source: Centre for Monitoring Indian Economy Pvt. Ltd.
Source: Centre for Monitoring Indian Economy Pvt. Ltd.
41.6
7.0
Figure 3.2. Labour Force Participation Rate in India: Male and Female (Aug 2021)
67.1 68.5
9.4 10.6
Male Rural Male Rural FemaleFemale
70
60
50
40
30
20
10
0
70
60
50
40
30
20
10
0

Future of Jobs in India 53
Table 3.3. Estimate of Labour Force and Unemployment by Max Educational Qualification
Max EducationalQualification
Population (’000s)
LF(’000s)
LF PR(%)
Employed (’000s)
(E)
Unemployed Willing toWork and
Active Jobseekers
(’000s)(UE)
Unemployed Willing to Work but
Inactive inSeeking Jobs
(’000s)
Greater LabourForce
(’000s)(GLF)
Unemploy-mentRate(%)
(UER)
Greater Unemploy-ment Rate
(%)(GUER)
A B C D = C/B E F G H = C + G I = F/C J = (F + G)/H
No Education 8,868 2,664 30.04 2,597 67 54 2,718 2.51 4.45
Up to 5th Std 237,967 79,808 33.54 77,376 2,432 2,022 81,830 3.05 5.44
6th–9th Std 300,019 120,605 40.20 116,376 4,229 4,153 124,758 3.51 6.72
10th–12th Std 424,874 168,212 39.59 150,022 18,190 10,478 178,690 10.81 16.04
>= Graduate 98,964 59,394 60.02 47,392 12,002 2,400 61,795 20.21 23.31
Source: Annual Report: Periodic Labour Force Survey, July 2019–June 2020.
Their work has been around finding causality in natural experiments, and one of their most famous pieces of research demonstrated the association between education and income, as illustrated in Figure 3.3.
Figure 3.3 uses data from Angrist and Krueger (1991). People with 12 years of education have incomes that are 12 per cent higher than those of people with 11 years of education. People with 16 years of education have 65 per cent
Figure 3.3. The Association between Education and Income
higher incomes than people with 11 years of education.
However, in the Indian context, we also see a rising trend of unemployment with increasing level of education. As we can see from Table 3.3, UER is the highest for those who are graduate or above (20.21%) and lowest for those who are uneducated (2.51%). At each stage, as the level of education increases, the UER increases. So while education is good for incomes, unless education
Years of education
Source: Johan Jarnestad/The Royal Swedish Academy of Sciences.
6 137 148 159 1610 1711 1812 19 20

54 STATE OF INDIA'S LIVELIHOODS REPORT -2021
Table 3.4. Labour Force, Employment and Unemployment by Age Groups
Age Group(Years)
Population (’000s)
LF(’000s)
LPR(%)
Employed (’000s)
(E)
Unemployed Willing toWork and
Active Jobseekers
(’000s)
Unemployed Willing toWork but
Inactive inSeeking Jobs
(’000s)
GLF(’000s)
UER(%)
(UER)
Greater Unemployment
Rate(%)
(GUER)
A B C D = C/B E F G H = C + G I = F/C J = (F + G)/H
15–19 158,913 6,660 4.19 2,769 3,891 6,201 12,861 58.42 78.47
20–24 136,877 46,977 34.32 27,466 19,511 5,602 52,579 41.53 47.76
25–29 76,728 46,882 61.10 40,457 6,425 1,703 48,586 13.71 16.73
30–34 77,869 37,830 48.58 36,433 1,397 1,084 38,915 3.69 6.38
35–39 87,610 46,533 53.11 45,424 1,109 1,162 47,695 2.38 4.76
40–44 119,008 58,125 48.84 56,964 1,161 1,184 59,309 2.00 3.95
45–49 119,925 71,081 59.27 69,790 1,291 891 71,973 1.82 3.03
50–54 103,093 55,300 53.64 54,251 1,049 547 55,847 1.90 2.86
55–59 80,328 43,086 53.64 42,324 762 441 43,527 1.77 2.76
60–64 45,107 11,694 25.92 11,507 186 158 11,852 1.59 2.91
>=65 65,233 6,513 9.99 6,377 137 134 6,648 2.10 4.08
>=15 1,070,692 430,682 40.22 393,762 36,920 19,107 449,790 8.57 12.46
Source: Annual Report: Periodic Labour Force Survey, July 2019–June 2020.
Table 3.5. States with Highest and Lowest Levels of Educational Attainments
Source: PLFS-Annual Bulletin on Additional Indicators Jul 2019–June 2020.
State Percentage of Population of Age 25 Years and above with at Least Secondary Education Successfully Completed
Ratio of Female of Age 15–64 in LF in Usual Status to Persons of Age 15–64 Years in LF
Top 10 states Female Male Total (%) Rural Urban Total
Nagaland 73.3 83.5 78.6 35.2 31.4 34.3
Mizoram 72.8 81.6 77.2 32.2 35.2 33.6
Chandigarh 66.5 80.8 73.9 19.9 21.5 22.2
Manipur 64.5 81.1 72.7 28.2 34.9 30.2
Puducherry 63.6 81.8 72.2 33.2 29.1 30.6
Delhi 63.7 79.4 72.1 21.4 15.3 15.5
Kerala 69.9 72.9 71.3 37.0 32.8 35.0
Lakshadweep 67.5 74.0 70.7 28.0 26.4 26.8
Goa 61.6 75.5 68.4 27.1 27.7 27.5
Himachal 50.3 73.4 61.1 47.7 32.8 46.0
Bottom 5 states
Bihar 25.4 50.0 37.7 11.3 10.6 11.2
Rajasthan 25.1 52.5 38.7 37.2 19.2 33.2
Odisha 33.4 49.1 41.0 32.2 23.9 31.0
MP 30.0 51.9 41.1 33.9 22.5 31.2
Jharkhand 31.7 53.4 42.2 36.3 17.2 32.8
India 40.1 58.7 49.3 30.1 23.6 28.2

Future of Jobs in India 55
Table 3.6. Best and Worst Performing States on Ratio of Female 15–64 Years in Labour Force as a Percentage of Total Persons
Table 3.7. Best and Worst Performing States on Ratio of Female Workers to Male Workers and Percentage of Female Population with Secondary Education
Source: Annual Bulletin on Additional Indicators, PLFS Jul 2019–June 2020.
Best Performing States Worst Performing States
Himachal Pradesh 46.0 Bihar 11.2
Chhattisgarh 40.2 Delhi 15.5
Sikkim 39.9 Haryana 16.7
Meghalaya 39.1 Chandigarh 21.4
Ladakh 38.4 Daman and Diu 22.2
India 28.2 India 28.2
imparts the right skill set, higher education may also have a correlation (not causation) with higher unemployment.
The other big challenge in the jobs market is the problem of youth unemployment. Many young people start working as early as 15 or 16 years. Table 3.4 shows that labour participation rate (LPR) in the age group of 15 to 19 years is 4.9 per cent, but UER for people in this segment is as high as 58.42 per cent. With the increase in age, there is a corresponding increase in LPR, reaching a peak of 59.27 per cent for the age group of 45–49 years. After this, the LPR ratio starts to fall. Till the age of 59 years, the LPR stays above the threshold mark of 50 per cent (53%). However, the moment we cross this age, there is a drastic fall in the LPR to 25.92 per cent for those between 60 and 64 years, as 60 is the
normal retirement age, and also the threshold for some of the social security benefits such as pension and old-age pension.
The correlation between higher educational attainment and female workforce participation is not straightforward. As can be seen in Tables 3.5 and 3.6, on the one hand, there are states like Bihar at the bottom end of not only the educational attainment overall but also on female LF participation. On the other hand, there are states/UTs such as Delhi and Chandigarh, which are leading in terms of educational attainment, but feature in bottom five when it comes to female LF participation.
In general, with a few exceptions, participation of women in the LF decreases with urbanization, and with access to higher education. In urban areas, there are not many non-agricultural jobs,
Best Performing Worst Performing
Ratio of female workers to male workers in usual
status working as professional and technical workers
% of female population
above 25 years with secondary
education
Ratio of female workers to male workers in usual
status working as professional and technical workers
% of female population
above 25 years with secondary
education
Sikkim 120.2 46.3 Ladakh 16.6 30.0
Daman and Diu 110.7 51.1 Jharkhand 23.1 31.7
Meghalaya 101.5 49.6 Bihar 26.2 25.4
Kerala 91.6 69.9 Chandigarh 35.6 66.5
A&N Islands 90.1 50.0 Uttar Pradesh 35.7 33.4
India 50.1 40.1 India 50.1 40.1
Source: Annual Bulletin on Additional Indicators, PLFS Jul 2019–June.

56 STATE OF INDIA'S LIVELIHOODS REPORT -2021
3.3. Employment in Factories1
As per the Annual Survey of Industries 2017–2018 (Ministry of Statistics and Programme Implementation), India had a total of 237,684 factories which created a total of 15.61 million jobs. 41.31 per cent of all the factories were in the rural areas, whereas 58.9 per cent were in the urban areas. Total capital invested in these factories was INR 44.61 lakh crore. Factories in the rural areas accounted for 61.2 per cent of the total invested capital, whereas the proportion of total invested capital going to factories in urban areas was 38.8 per cent.
However, when it comes to employment, only 45.4 per cent of the total workers were engaged in factories in the rural areas, and the balance 54.56 per cent of the workers were employed by factories situated in the urban areas.
Average wage per worker in rural areas was `148,493, whereas average wage per worker in urban areas was `165,401. The wages paid to workers represented 2.57 per cent of the total output for factories in rural areas, whereas for the factories situated in urban areas wages represented 3.53 per cent of the value of total output. Besides the fact that urban wages are higher compared to wages in rural areas, this could also be indicative of relative skill level of employees in these two areas, warranting payment of higher wages in urban areas.
61.2 per cent of the total invested capital went to factories situated in rural areas, whereas the factories situated in the urban areas attracted the balance 38.8 per cent of the invested capital.
and the pace of job creation in urban areas is not keeping pace with the number of youths entering the workforce.
However, when it comes to the ratio of female workers to male workers in usual status working as professional and technical workers, we do see a correlation with educational attainment, as demonstrated in Table 3.7.
However, factories situated in the rural areas accounted for only 44.72 per cent of the total employment generation, whereas those in the urban areas accounted for 55.28 per cent of the total employment generation. This indicates that the factories situated in the rural areas are relatively larger as they are attracting larger amount of investment, but they are also creating fewer jobs. In other words, larger factories, which happen to be situated more in rural areas are more capital intensive, while the factories in the urban areas are less capital intensive and create a larger proportion of employment.
3.3.1. Investment versus Job CreationA total of `44.61 lakh crore of investment was made in 237,684 factories, or an average of `18.77 crore per factory. The average investment per factory located in rural area was 27.81 crore, whereas, in the urban areas, it was `12.81 crore. Each factory in rural area created an average of 71.12 jobs, whereas those in the urban areas created an average of 61.88 jobs.
There is a stark difference in the amount of investment needed for creating a job in rural versus urban areas. At the national level, creating each job in the factory required an investment of `28.57 lakh. While factories in rural areas needed to invest `39.10 lakh, the same in urban areas needed only `20.05 lakh.
Two plausible causes need to be looked into. In urban areas, the availability of land for setting up factories is a major constraint. Therefore, larger factories that require more land have to be set up outside urban areas. This is also reflected in more jobs created in each factory located in rural areas compared to urban.
However, that still does not explain why it should require more investment to create a factory job in a rural area compared to urban area. The answer perhaps lies in availability and access to infrastructure. Urban areas have ready infrastructure such as road, power supply, water and sewage facilities which reduces the need for
3 It covers all factories registered under Sections 2m(i) and 2m(ii) of the Factories Act, 1948, that is, those factories employing 10 or more workers using power; and those employing 20 or more workers without using power.

Future of Jobs in India 57
investment in these ancillary aspects. While land may be cheaper and available in larger quantities in rural areas, the factories might be required to make additional investments to make up for the deficient infrastructure, which bumps up the total investment needed for each job created in factory located in a rural area.
The implication from a policy perspective is that more investment by the government on basic rural infrastructure such as road, transportation, logistics, electricity and water could reduce the investment needed to create jobs in rural areas and also lead to more number of jobs created. Availability of such infrastructure will also attract more investment, as it enhances the technical and financial viability of the enterprise.
Different industries also demonstrate varying characteristics when it comes to investment versus job creation. As highlighted above, at the national level, an investment of `28.57 lakh is required to create each job. But this ranges from as much as `363.35 lakh of investment per job created in a coke and refined petroleum products industry to as low as `2.92 lakh of investment needed creating a job in a tobacco factory.
In other words, industries such as coke and refined petroleum products are capital intensive, requiring much larger investment for creation of each job. The level of mechanization and automation in different industries explains why the transmission effect of investment into
job creation varies so widely across industries. Industries such as furniture, leather products, wearing apparel and tobacco products still have a lot of manual processes. Therefore, focus on these industries may have much larger multiplier in terms of job creation, compared to capital-intensive industries, such as petroleum, metals or chemical products. While it is really for the private sector investors to choose, in which industry segment they wish to invest, when it comes to supporting the industry with policy and fiscal incentives, such as protection from cheap imports, production-linked incentives and tax rebate, the government needs to look at the job creation potential of different industries in addition to other factors.
Table 3.8 provides top five most capital-intensive and least capital-intensive industries from a job creation perspective.
Another dimension worth investigating is the aggregate number of jobs created in different industries.
Top five industries accounted for as much as 43.32 per cent of all jobs created, and top 10 industries account for 69.88 per cent of all jobs created. Food products followed by textiles and wearing apparel are the three largest job creators. Table 3.9 provides the aggregate number and percentage of all jobs generated by the top 10 and bottom 10 industries.
Table 3.8. Most and Least Capital Intensive Industries
Five Most Capital-intensive Industries Investment (In Lakhs) Per Job Created
Coke and refined petroleum products 363.35
Basic metals 80.59
Chemicals and chemical products 48.65
Waste collection, treatment & disposal activities; materials recovery 37.74
Beverages 27.75
Five least capital-intensive industries
Manufacture of furniture 11.59
Salt production by evaporation of sea water or other saline waters (08932) 8.03
Leather and related products 5.74
Wearing apparel 4.71
Tobacco products 2.92
Source: Annual Survey of Industries 2017–2018.

58 STATE OF INDIA'S LIVELIHOODS REPORT -2021
Table 3.9. Largest Job-Creating Industries
Ten Largest Employment Generators Number of Jobs Generated
% of Total Employment Generated
Food products 1,772,399 11.35%
Textiles 1,678,671 10.75%
Wearing apparel 1,189,520 7.62%
Other non-metallic mineral products 1,090,629 6.98%
Basic metals 1,032,613 6.61%
Motor vehicles, trailers and semi-trailers 1,017,614 6.52%
Machinery and equipment N.E.C. 848,502 5.43%
Chemicals and chemical products 828,315 5.30%
Pharmaceuticals, medicinal chemical and botanical products 740,251 4.74%
Rubber and plastics products 713,214 4.57%
Source: Annual Survey of Industries 2017–2018.
Table 3.10. Industries Creating Least Number of Jobs
Beverages 161,065 1.03%
Printing and reproduction of recorded media 159,164 1.02%
Coke and refined petroleum products 146,866 0.94%
Wood and products of wood and cork, except furniture 98,674 0.63%
Manufacture of furniture 81,465 0.52%
Cotton ginning, cleaning and bailing (01632); seed processing for propagation (01640)
79,471 0.51%
Repair and installation of machinery and equipment 30,081 0.19%
Publishing activities 25,328 0.16%
Waste collection, treatment & disposal activities; materials recovery 19,920 0.13%
Salt production by evaporation of sea water or other saline waters 10,766 0.07%
Source: Annual Survey of Industries 2017–2018.
The bottom 10 industries, on the other hand, accounted for only 5.21 per cent of all jobs created.
Data in Tables 3.9 and 3.10 (as per the annual survey of industries), however, do not present the complete picture, since they pertain to only those establishments which employ at least 10 workers with power or 20 workers without power. For example, food products industry is the largest employer. But a very large number of food product enterprises are household enterprises or fall under the micro and small enterprises and may be an informal enterprise. Therefore, the number of persons reported to be employed in the food products industry, even
though it is the largest single employer, may still have a significant undercounting bias.
Also, if we look at some of the smallest employment creators (such as waste collection, treatment and disposal activities, materials recovery, salt production by evaporation of sea water or other saline waters, repair and installation of machinery and equipment), such enterprises are much more likely to be informal, micro and small enterprises and hence may not be reported in the ASI Report.
Given the imperative to create jobs for a large number of youths entering the workforce each year, there is a need to facilitate investment flow into those sectors which are less capital intensive

Future of Jobs in India 59
and more labour intensive. Less capital-intensive industries such as manufacture of furniture, salt production by evaporation of sea water or other saline waters, leather and related products, wearing apparel, tobacco products, can all create a significant number of jobs. These industries also represent examples where informal enterprises can convert to formal sector with access to more capital and be a driver for job and economic growth.
One important data point to take note of is the aggregate number of jobs created by industries, which at 15.61 million represents just about 4 per cent of the total LF in the country.
3.3.2. Insolvency and Bankruptcy Code for Revival of Sick Industries and Job Creation Thousands of industrial units and corporates are sick due to accumulated losses. Lenders and investors are stuck with billions of dollars of investment in these corporates. Insolvency of enterprises also creates massive job losses. The new Insolvency and bankruptcy Code (IBC) with a focus on quick resolution of insolvent enterprises on a going concern basis is a very significant step in the policy arena. By swift resolution of long pending insolvency cases and bringing on board new management, the IBC process can lead to revival of many sick units.
A total of 4,450 cases of corporate insolvency were admitted under the new IBC. Out of this, 394 cases were resolved under the IBC by June 2021, resulting in recovery of over `237,000 crore.4 Recovery from insolvent enterprises is good from the perspective of the banks improving their financial health and balance sheets. Recoveries from assets classified as non-performing will add to the capacity of lenders to lend for future growth. More importantly, the fast-track process followed by IBC results in the corporate takeover by a new management and corporate restructuring leading to revival of the sick industries, which will save many job losses
as well as create new jobs in future. We do not have any estimate on the number of jobs saved or created as a result of the 394 cases resolved under the IBC. But as this process moves forward, public agencies may look at collating data on this aspect. Further, the IBC process had envisaged resolution of corporate insolvency cases in a strict time-bound manner. However, the cases admitted under the IBC process continue to be marred by delays caused due to countless and unending litigations, sometimes, on technicalities or even on frivolous grounds as the original promoters do everything they can to retain control of the enterprise. Out of the 3,847 cases of corporate insolvency admitted under the IBC process till March 2020, 1967 cases (over 50%) were ongoing resolution. Almost a thirds of this (610 cases) had been ongoing for over 270 days (Insolvency and Bankruptcy Board of India, 2020). The IBC process may need further refinement to keep to the specified timelines once a case is admitted under IBC. There is also the need to enhance capacity in the IBC courts to deal with a large number of cases admitted in order to give impetus to growth and job creation.
3.4. Review of Selected Sectors for Job Creation3.4.1. Agriculture and Allied Sector
Agriculture is the primary source of livelihood for about 58 per cent of India’s population. Gross value added (GVA) by agriculture, forestry and fishing was estimated at INR 1,948,000 crore (US$276.37 billion) in FY2020. Share of agriculture and allied sectors in GVA of India at current prices stood at 17.8 per cent in FY2020.
For decades, economists have argued that given limited size of landholding, and the fact that already over half of India’s LF is engaged in agriculture sector, the sector cannot create
4 https://www.business-standard.com/article/finance/creditors-got-rs-2-45-trn-from-394-resolution-cases-under-ibc-finmin-121071901160_1.html

60 STATE OF INDIA'S LIVELIHOODS REPORT -2021
more jobs. In fact, economists argue that labour should move out of agriculture towards more productive segments of economy. However, a deeper analysis of agriculture and allied sectors indicates that the sector can not only create more new jobs, but these jobs will also have higher remunerative potential due to the value creation opportunity.
India is largely food sufficient in primary commodities. But growing incomes, changing lifestyle and urbanization are creating massive opportunities for growth and employment in food processing, logistics, etc.
The Indian food industry is poised for growth and increase its share in the world food trade due to potential for value addition, particularly within the food processing industry. Indian food and grocery market is the world’s sixth largest, with retail contributing 70 per cent of the sales. The Indian food processing industry accounts for 32 per cent of the country’s total food market, one of the largest industries in India and is ranked fifth in terms of production, consumption, export and expected growth.
In FY2021, total food grain production was recorded at 303.34 million tonnes, compared to 296.65 million tonnes in FY2020. Production of horticulture crops is estimated at 326.6 million tonnes. India has the largest livestock population of around 535.78 million, which translates to around 31 per cent of the world’s population. Milk production in the country in FY2020 was 198 million tonnes. India is among the 15 leading exporters of agricultural products in the world. Agricultural export from India were US$35.09 billion in FY2020.
India is the world’s second-largest producer of rice, wheat, sugarcane, cotton, groundnuts, and fruits and vegetables. It also produces 25 per cent of the world’s pulses. The processed food market in India was `1,931,000 crore (US$263 billion) in FY2020. The food processing industry employs about 1.77 million people. India also exported INR 43,798 crore (US$6.02 billion) worth of processed food in FY2021.
Historically, employment in agriculture sector was largely concentrated in primary production. Opportunities exist for job creation in food processing and value addition. While primary production of agricultural commodities may
not create more employment, as farming moves towards greater mechanization, opportunities for job creation exist in allied sectors such as dairy, poultry and fisheries. Under the government’s ambitious plan to double the farmer’s income, a push is being given to formation of farmer producer organizations (FPOs) and 10,000 such FPOs are being formed. These FPOs create opportunities for employment in input supply and primary processing, post-production including activities such as aggregation, grading, sorting, packaging which add value to the agricultural produce.
Agriculture sector is also attracting foreign investment in the food processing segment, which allows 100 per cent foreign direct investment. There is a lot of excitement among investors for various AgriTech start-ups, which attracted close to US$1 billion in investment during 2017–2020.
Another growth segment in agriculture is ethanol. With rising crude prices, India wants to reduce its import dependency and also promote cleaner fuel by encouraging blending of ethanol in petroleum products. Investment of US$1.19 billion has been announced for ethanol production. A budget of US$1.46 billion has been earmarked for the ‘Production Linked Incentive Scheme for Food Processing Industry’ to develop global food manufacturing champions. An allocation of US$1.34 billion has been made under Pradhan Mantri Formalisation of Micro Food Processing Enterprises.
Farm mechanization through establishment of custom hiring centres, farm machinery bank and high-tech hubs in different states is being encouraged.
Efforts to put up a common data infrastructure for farmers in the country that will integrate Pradhan Mantri Fasal Bima Yojana, PM-Kisan and the Soil Health Card through a common database, along with land record details, have been initiated.
Growth in the organized retail sector and exports is leading to investment interest in the logistics and supply chain industry, given to need for efficient transportation of agricultural commodities and fresh farm produce.
The electronic national agriculture market (e-NAM) has created a unified national market

Future of Jobs in India 61
for agricultural commodities by networking existing APMCs. It had 16.9 million farmers and 157,778 traders registered on its platform until February 2021. Over 1,000 mandis are already linked to e-NAM.
The agriculture sector is expected to continue upward momentum in production, processing, value addition due to increased investment in agricultural infrastructure such as irrigation facilities, warehousing and cold storage, which open up avenues for creation of employment opportunities.
3.4.2. Imperatives for PolicyFrom a policy perspective, following measures can further boost employment in agriculture sector.
Recognizing farm as an enterprise: One of the long-standing challenges in agriculture sector is that the ‘entity’ concept in accounting, which separates the ‘entrepreneur’ from the ‘enterprise’ is not applied to farming. Thus, credit taken for farming becomes the personal liability of the farmer, rather than of the farm as an enterprise. Introduction of this fundamental change can have transformative impact in bringing investments in farming. This will also spur entrepreneurial youth to look at farming as a business and revive the interest of youth in farming. Further, it will make it easier for the financiers to lend to farming enterprises, since they will be dealing with an ‘entity’ rather than with an ‘individual’. The push towards digitization of land records is the first step in this direction and needs to be taken to the next level, where each farm can have a unique identifier and thus can be recognized as a business entity.
Easing flow of credit in agriculture and allied sectors: While lending to agriculture sector forms part of the priority sector commitment for the banks, the sector still reels with inadequate credit flow. With very liberal terms, including interest subvention and credit guarantees, schemes like Agriculture Infrastructure Fund (AIF) can support investment in agricultural infrastructures such as warehouse and logistics. However, against a target of `1 lakh crore under the facility, till date, only `5,977 crore have been approved and just `1,840 crore have been disbursed (National Agriculture Infra Financing Facility, Department
of Agriculture & Farmers Welfare, 2021). Clearly, just having a scheme and budget allocation is not adequate. Effort needs to be made to understand why these promising schemes have such low offtake and measures needed to drive demand for such schemes.
Addressing skill gaps in agriculture and allied sectors: The budgetary allocations in agriculture tend to be skewed towards agriculture extension activities, whereas what is really needed is to increase investment in vocational and technical training in agriculture business.
Technology integration and digitalization in agriculture sector: There are massive opportunities for value addition in agriculture and allied sectors through integration of technology and digitalization. Logistics, e-commerce, connecting producers to digital marketplaces, facilitating direct transactions between producers and consumers, reducing wastage, etc., can all create massive value addition and create many jobs in the sector. These interventions will also bring back the interest of youth in the agriculture sector and catalyse innovation.
Adoption of climate-smart agricultural practices: Agriculture is one of the largest contributors of greenhouse gas emissions and unsustainable consumption of resources such as water and energy. Adoption of climate-smart agricultural practices, such as renewable energy, precision agriculture, organic farming, promoting local production and consumption of food, increased use of bio-fertilizers and introduction of inter-cropping systems that contribute to nitrogen fixation are measures that can not only contribute the sustainability objective but also create jobs for each of these activities. A comprehensive policy push that combines fiscal incentives, investment in skill development and technology, facilitating credit flow is needed to make progress in this direction.
3.4.3. MSMEs for Job CreationMicro, small and medium enterprises are
the backbone of Indian economy, contributing 30.27 per cent of the GDP and 33.50 per cent of the GVA in the year 2018–2019.
As per the 73rd round of National Sample Survey (Table 3.11), the MSME sector had

62 STATE OF INDIA'S LIVELIHOODS REPORT -2021
created 110.99 million jobs, including (36.04 million in manufacturing, 0.007 million in non-captive electricity generation and transmission, 38.72 million in trade and 36.28 million in other services) in rural and urban areas across the country. Figure 3.4 shows the distribution of employment in the MSME sector across major categories.
Table 3.11. Estimated Employment in the MSME Sector (Activity Wise)
Broad Activity Category Employment (in Million) Share (%)
Rural Urban Total
Manufacturing 18.66 17.39 36.04 32
Electricity* 0.006 0.002 0.007 0
Trade 16.06 22.65 38.72 35
Other Services 15.05 21.17 36.22 33
All 49.78 61.21 110.99 100
Source: 2020–2021 Annual Report of Ministry of MSMEs, Government of India.
Figure 3.4. Distribution of Employment in the MSME Sector Category WiseSource: Annual Report 2020–2021: Ministry of Micro, Small and Medium Enterprises.Note: *Non-captive electricity generation and transmission.
Within the MSME sector, the smallest category of micro-sector with 63.05 million enterprises provided employment to 107.62 million persons, accounting for around 97 per cent of total employment in the sector (Table 3.12). Small sector with 331,000 and medium sector with 5,000 estimated MSMEs provided employment to 3.19 million (2.88%) and 0.17
Table 3.12. Distribution of Employment by Type of Enterprises in Rural and Urban Areas (Numbers in million)
Sector Micro Small Medium Total Share (%)
Rural 48.93 0.79 0.06 49.78 45
Urban 58.69 2.41 0.12 61.21 55
All 107.62 3.19 0.17 110.99 100
Source: Annual Report 2020–2021: Ministry of Micro, Small and Medium Enterprises.
Employment in MSME sector (Nature of Activity Wise)
Trade 387.18 35%
Other Services 362.2233%
Manufacturing360.5232%
Electricity*0.070%

Future of Jobs in India 63
million (0.16%) persons of total employment in MSME sector, respectively.
The government has brought several schemes to support growth of the MSME sector, so that the MSME sector not only increases its economic output but also creates more jobs.
One of the persistent issues in the MSME sector is the informal nature of enterprises. Out of the 63 million or so MSMEs, over 90 per cent are estimated to be informal MSMEs. Only 1.40 million MSMEs have an Udyam registration, representing mere 2.22 per of all MSMEs. 10.23 million MSMEs or 16.23 per cent had filed their information on Udyam Aadhaar Memorandum.
Informal MSMEs are not able to leverage benefits from various schemes of the government, such as subsidized or formal credit access, interest rate subvention schemes and capital subsidy.
One of the most ambitious schemes for supporting the MSMEs is the Pradhan Mantri MUDRA Yojana (PMMY), under which refinance for loans for three categories of enterprises is provided. The enterprises falling under Shishu category covers loans up to `50,000. Enterprises under Kishore cover loans between `50,000 and `5 lakh. The enterprises falling under Tarun category are provided loans between `5 lakh and `10 lakh.
Table 3.13 provides details on refinance extended by MUDRA during 2019–2020.
The PMMY loans include all the loans given under National Bank for Agriculture and Rural Development refinance scheme to self-help groups, National Rural Livelihood Mission and National Urban Livelihoods Mission groups, loans extended by microfinance institutions and banks. Since the classification of MUDRA loans is as per the size of the loan and not based upon the activity, it cannot be assumed that each MUDRA loan account represents a unique MSME enterprise. Since majority of the MUDRA loans are given to microfinance clients and self-help group members, the number of MUDRA loan accounts is able to count the number of borrowers and not the number of enterprises.
65.6 per cent or two out of every three MUDRA loans in the Shishu category went to the women entrepreneurs. The share of women in the outstanding loans in Shishu is also at a similar rate of 66.45 per cent.
However, as one moves to larger loans under Shishu category to Kishore and Tarun, the percentage of women entrepreneurs as well as outstanding loan amounts falls, as can be seen in Table 3.14.
Table 3.13. Number and Amount of Loans Disbursed under PMMY
Table 3.14. Number and Amount of Loans under Different Categories of MUDRA Loans
Enterprise Category No. of Loan Accounts Amount Disbursed (in Lakh Rupees)
Amount Outstanding (in Lakh Rupees)
Shishu (Loans <`50,000) 54,490,617 16,281,320 11,819,420
Kishore (>50,000, <500,000) 6,471,873 9,142,700 8,240,320
Tarun (>500,000, <10,00,000) 1,285,116 7,547,470 6,664,610
Total 62,247,606 32,971,500 26,724,360
Source: PMMY Performance 2019–2020, Pradhan Mantri MUDRA Yojana, https://www.mudra.org.in/.
Source: PMMY Performance 2019–2020, Pradhan Mantri Mudra Yojana, https://www.mudra.org.in/.
Shishu Kishore Tarun
# Loan Accounts
Loan Outstanding
# Loan Accounts
Loan Outstanding
# Loan Accounts
Loan Outstanding
Total 54.49 1,181,942 6.47 824,032 1.28 666,461
Women entrepreneurs 35.72 785,491 2.99 220,007 0.39 78,919
% Share of women entrepreneurs
65.55 66.45 46.21 26.69 30.46 11.84

64 STATE OF INDIA'S LIVELIHOODS REPORT -2021
For larger loan sizes under the Kishore and Tarun categories, the share of women in the outstanding loan amounts is significantly lower than their share in the number of loan accounts. This implies that women not only have a smaller share in the larger loan categories, but the average loans given to women entrepreneurs also tend to be smaller compared to men in the Kishore and Tarun categories.
Majority of MSMEs in India (85%) are informal unregistered enterprises. Informality is a huge constraint for growth, productivity and employment generation potential of MSMEs. The MSME sector is heavily cash dependent, has limited capital and reserves. Demonetization was a one-time shock which temporarily affected the normal functioning of informal systems; the introduction of the GST is an important structural change in the way businesses function. The structure of GST inherently pushes enterprises towards formalization and digitization. This has a potential to improve the medium- to long-term growth prospects of the MSME sector.
3.4.4. Imperatives for Policy For realizing the potential of MSMEs for job creation, following impediments need to be addressed.
Skill development in the MSME sector is required for development of both workers and entrepreneurs. Given the rapidly evolving nature of business and technology, upskilling of the existing workforce is critical. Majority of workers and entrepreneurs in the MSME sector have not received any vocational/technical training.
MSME financing: Against the total addressable demand for external credit in the MSME sector estimated at `3,700,000 crore, the overall credit supply from formal sources is estimated to be only `1,450,000 crore, leaving a gap of almost `2,300,000 crore. Informal funding sources frequently used by the MSMEs tend to be expensive and inadequate. MSMEs tend to avoid taking informal credit as long as they can. As a result, they work at suboptimal capacity utilization or lower profitability.
Strategies to rejuvenate the MSME sector: To make the MSME segment more employment and growth oriented, a two-pronged approach
is needed to simultaneously address skilling and financing. Some strategies that may support the growth and job creation by MSMEs includes (a) rejigging government support to MSMEs based on enterprises’ growth and performance; (b) undertaking MSME census to establish accurate data about the sector; (c) ramping up efforts to formalize and digitize the MSMEs; (d) alternative digital lending platforms; (e) introducing Reimbursable Industry Contribution for skill financing; (f) remapping skilling framework and (g) focusing on women in the MSME sector.
Timely payment to MSMEs: Delay in payment release to MSMEs is one of the biggest challenges faced by them. According to an estimate, over `5 lakh crore is stuck with various government departments and agencies for payment to MSME units. Early and timely release due to MSMEs will unlock `5 lakh crore in capital inflow to the MSME units, which is much more than what any directed lending programme can achieve. This would also enable the MSME units to rotate their capital more efficiently and improve their overall productivity, efficiency and profitability, and thereby create many more jobs.
3.4.5. Green Jobs for Addressing Climate Change and Job CreationClimate change has emerged as a key concern for everyone. The damage done to the ecosystem by greenhouse gases, rising temperatures and sea levels and loss of biodiversity are irreversible. A number of actions are possible to mitigate the worst effects of climate change, which can also create a large number of jobs.
At the just concluded UN Climate Conference (COP26), India committed to become a carbon-neutral country by the year 2070. While this is an additional two decades compared to the emerging global consensus to become carbon neutral by 2050, what is commendable is the commitment to have the renewables contribute 50 per cent of India’s energy needs within next 9 years. This will require investment to generate 500 gigawatts of renewable energy generation capacity. This will open up new job opportunities in solar and wind energy production and maintenance, energy storage and transmission, etc.

Future of Jobs in India 65
Green jobs will protect the ecosystem by reducing energy, materials and water consumption, de-carbonize the economy and minimize all forms of waste and pollution. Given the global goal to limit global warming to below 2 degrees, green jobs have emerged as a critically important sector. Renewable energy, solid waste management, recycling and upcycling, organic food, clean transportation solutions, sustainable agricultural practices, etc., are all attracting a lot of interest and creating jobs.
Green job potential: Clean energy alone can add 11 million new jobs in India by the year 2050. Subsectors within renewable energy where jobs will be created include solar photovoltaics (45%), solid biomass heating (7%), storage/batteries (7%), heat pumps (7%) and wind power (5%).
Waste management: 7,934 towns in India generate over 143,000 tonnes of solid waste and 61,948 million litres of wastewater each day, out of which only 23,277 MLD is treated. Treatment of wastewater, solid waste management, rainwater harvesting, etc., can all create a large number of jobs. Skills, appropriate tools and gears and competitive wages will attract more people to these jobs, which will contribute to the green objectives.
Organic food: There are more than 700,000 producers and more over 500 exporters associated with organic production and exports in India. With growing interest in organic production, a large number of jobs can be created in production, certification and supply chain.
Soil and Water conservation: Arresting further degradation of land, rehabilitation of degraded areas, promoting efficient water use techniques, proper soil and crop management, micro-irrigation, integrated farming system, etc., can create jobs in addition to preventing environmental degradation.
Shelter: Green new buildings can achieve reduction in water and energy consumption. Slightly higher upfront investment in green building pays off by itself and turns out to be cheaper due to lower operational costs.
Afforestation: Unsustainable exploitation of forests by paper, furniture industry and other industries such as handicrafts, latex and gums has made it imperative to preserve forests and
encourage sustainable forestry. Afforestation can not only address India’s environmental challenges but also lead to job creation.
Renewable energy: Exploiting the abundantly available and cleanest forms of energy, namely solar and wind energy, can not only address India’s energy poverty, but it will also create a large number of jobs. The government has scaled up the target for renewable power capacity to 175 GW, including 100 GW from solar, 60 GW from wind, 10 GW from biopower and 5 GW from small hydropower to be achieved by 2022.
Green transportation: India is one of the major car markets globally. Shifting to public transport, dedicated bicycle and pedestrian lanes, electric cars, etc., can significantly reduce the emissions and also create jobs.
3.4.6. Imperatives for Policy The green economy brings with it the need for a whole new set of skills. Initiatives are needed to align vocational training to competence requirements to facilitate realization of green job opportunities. While expedient phasing out of greenhouse gases may not be possible, a consensus and commitment is needed to move to clean energy solutions. Fiscal incentive for clean fuel, public transportation infrastructure, waste management, etc., will not only protect the environment but will also create million of new jobs. There is also a need to focus on skill development needed to move towards green jobs.
Another perspective to green jobs is the balance between urban and rural. The urban lifestyle tends to be much more carbon intensive. The per capita emission of greenhouse gases in cities tends to be significantly higher than in rural areas. However, the jobs and economic opportunities as well as need for basic infrastructure such as education and healthcare drive the migration from rural to urban. In a post-pandemic world, where more and more people are becoming conscious of things like their carbon footprint and work-life balance, right policy initiatives have the potential to slow down the rural to urban migration. This would entail that the factors that attract people to migrate education and healthcare infrastructure, and economic opportunities can be made available in rural areas. Thanks to the wave of digitalization

66 STATE OF INDIA'S LIVELIHOODS REPORT -2021
sweeping across industries, it has now become possible for many categories of workers to work from anywhere. Such workers may choose not to migrate/stay in cities, provided basic amenities such as education and healthcare services are improved in rural areas. Investing on these basic amenities in rural areas can therefore have a long-term transformative impact on creating more green jobs and also while also addressing climate change.
3.4.7. Tourism and Hospitality Industry as a Job CreatorTourism is one of the largest job creators as well as earner of foreign exchange. During 2019, 10.89 million foreign tourists arrived in India, which is expected to grow threefold to 30 million by 2030. The sector contributed US$121.9 billion and likely to grow fourfold to over US$500 billion in the next decade. Tourism sector accounted for 31.8 million jobs, which represents 7.3 per cent of the total employment in the country. By the year 2030, the sector is projected to create 53 million jobs, an addition of over 20 million jobs.
One of the biggest advantages of the tourism and hospitality sectors is its ripple effect on a number of other sectors of the economy. Direct impact of tourism is obvious in travel, transport and hospitality sectors. Increased tourism activities are also linked to demand for arts and crafts, handicrafts and textiles, etc.
India enjoys multiple competitive advantages in tourism. It has geographical diversity, attractive beaches, world heritage sites, wildlife and nature parks, over 15,000 km of coastline dotted with several attractive beaches, mountains, rivers, religious sites, sites of archaeological importance and architectural marvels. In addition, India is one of the prime destinations for spiritual tourism and medical tourism. Being the origin of Buddhism, Jainism and Sikhism, India attracts followers of these religions from around the world to the holy sites for these religions. India is also a very affordable destination, which brings it within reach for tourists with a wide range of budgets. World-class medical facilities at competitive prices are a huge attraction for medical tourists
from around the world. Revenue from the medical tourism industry was estimated at US$9 billion in 2020.
The government has been taking a number of policy measures, as well as investing on creating marketing campaign for promoting India as a tourist destination under the Incredible India campaign. Campaigns such as Swadesh Darshan, a theme-based tourist circuit was launched to harness the tourism industry’s potential. The Ministry of Tourism has created a policy for development and promotion of caravan and caravan camping parks.
India has a diverse portfolio of niche tourism products—cruises, adventure, medical, wellness, sports, ecotourism, film, rural and religious tourism. The package of free loans extended to the MSMEs to help them deal with the COVID-19 crisis also included support to enterprises in the tourism sector.
Lighthouse and cruise tourism has been identified as a new segment for growth, harnessing India’s geographical advantage. Electronic tourist authorizations, known as e-tourist visa, has resulted in increase in number of tourist visa issued in the country. The facility is now extended to citizens of 171 countries, as of March 2021, making it easier for foreign tourists to visit India.
Growth in the tourism sector also creates a positive spiral for the economy as a whole, leading to growth in infrastructure, travel and hospitality sectors, handicrafts sector, healthcare sector, etc. Investment in infrastructure such as roads, airports and railways is a major catalyst for tourism demand. Rising per capita incomes and having disposable incomes in India are also leading to strong demand for tourism from the domestic travellers.
3.4.8. Emerging Tourism and Hospitality SegmentsRural tourism offering experiences in an idyllic village setting to experience and live a relaxed and healthy lifestyle is becoming popular among urban tourists. Combined with heritage, culture, conservation and culinary tourism, this offers a major growth segment. Many state governments as well as private sector firms are promoting
Future of Jobs in India 67
homestays, which offer clean, comfortable and secure tourism options. Travel-related e-commerce sites with user-generated content such as customer reviews, photographs and videos are helping in attracting tourist attention to hitherto unknown places.
Pilgrimage tourism is one of the biggest contributors to tourism industry in India. Being a hub for different religions and cultures, India attracts many religious tourists each year. Going on pilgrimage is a part of culture, and even low- and middle-income families plan and go for religious tours, creating demand for tourism-related services.
Ecotourism: Vast variety of flora and fauna in various states is a major factor behind their growing popularity as tourist destinations. India has a large number of wildlife parks, conservation sites, wetlands which attract a large number of people.
Sports and adventure tourism: A wide range of adventure sports are covered under this category with specialized packages. The activities include mountaineering, trekking, parasailing, rappelling, mountain biking, river rafting and rock climbing. Initiatives such as development of formula one circuit, car rallies, golf and other sporting events can be important attraction for attracting high-end tourists.
Medical tourists seek variety of specialized medical treatments, ayurvedic, naturopathy and other therapies. India offers world-class medical infrastructure and healthcare services and highly competitive prices compared. This draws a large number of people from both developing and developed world who visit India just for seeking medical treatment. There is immense scope for further increasing this.
Heritage tourism: The country’s rich heritage is amply reflected in the various temples, majestic forts, religious monuments, museums, art galleries, urban and rural sites, and are a major attraction for both domestic and international tourists.
The above-mentioned examples show the immense potential to grow the tourism sector and become a major driver for job creation. There are some policy imperatives as described below to realize this potential.
3.4.9. Imperatives for PolicyAll the opportunities as outlined offer immense potential for job creation in the tourism sector. From a policy perspective, focus is needed on a few areas to fully realize India’s tourism potential. This includes (a) safety and security measures to project India as a safe place to travel, (b) cleanliness and maintenance of tourist facilities, (c) soft skill development for people employed in the tourism sector, such as language and communication skills, marketing skills and customer service, (d) development of theme-based tourist circuits, (e) emphasis on branding and marketing, through themed fairs, trade fairs, handicraft fairs, cultural fairs, etc. Focused investment in creating digital assets, such as augmented reality/virtual reality-based applications that can offer immersive tourism experience can be an important driver for demand in the tourism sector. A public private sector partnership-based initiative to market India as a tourism destination can have multiplier effect on growth and job creation.
From a long-term perspective, the government should also look at promoting India as a hub for commerce, trade fairs, as well as promoting India for establishing regional and global offices of multilateral and global organizations. For example, the Spring and Fall meetings of the World Bank and the IMF draw thousands of professionals to Washington each year. If India facilitated the global organization to establish their regional and global offices here that will provide a permanent impetus to business travel through seminars, conferences, annual meetings, etc.
3.4.10. Education and EdTech Sector as a Job CreatorWith over 250 million children in the schools, India has one of the largest educational systems in the world. With over 300,000 unaided schools, 39,900 colleges, 700 universities and numerous other training institutes, the education sector is estimated to be one of the top five employment generators in India. Although there is no precise data, rough estimates put the number of direct jobs created by the education system to be over 30 million or catering to as much as 7.50 per cent of the entire LF in the country.

68 STATE OF INDIA'S LIVELIHOODS REPORT -2021
With ~26.31 per cent of India’s population in the age group of 0–14 years, India’s education sector provides numerous opportunities for growth. Government’s target of gross enrolment ratio (GER) of 30 per cent by 2020 and 50 per cent by 2035 for higher education is expected to drive investments in the education space. In FY2021, GER in higher education in India was 27.1 per cent. This will add 35 million seats in higher educational institutes. Assuming a student–teacher ratio of 20, and a teacher–support staff ratio of 1:1, this measure can create 3.50 million new jobs.
India has also become the second largest market for e-learning after the USA. The sector is expected to reach US$1.96 billion by 2021, with about 9.6 million users.
Notwithstanding the quality of education, there is massive demand for higher education, as it is seen as a necessary requirement for getting into better paying jobs. The education sector in India is already a US$117 billion industry. Given the massive opportunities to educate, train and upskill the 500 million plus young population in the country, India is also an attractive destination for foreign investment. The COVID-19 pandemic induced a significant boom in investments in the education-linked EdTech sector. During the first nine months of 2021, the EdTech sector saw mergers and acquisitions worth more than $3.35 billion, more than three times the consolidated amounts raised in the previous two years. Table 3.15 shows the trends in private equity and venture capital investment in the EdTech sector in recent years. PE-VC fundraises by EdTech firms totalled $3.77 billion in the first nine months of 2021, far exceeding the cumulative $2.22 billion and $968 million raised in 2020 and 2019, respectively (Source: Venture Intelligence).
As a higher number of students go for secondary and tertiary education, and other training and skilling programmes, the sector will continue to be a major job creator. EdTech start-ups like Byju’s have already become a decacorn (valuation of over US$10 billion), and there are numerous other unicorns.
Booming in investment in the EdTech sector has made this into one of the largest job creators. The sector has need for large numbers
of skilled human resources in areas such as content development, instructional design, graphic design, artificial intelligence, videos and animation, marketing, app developers (UI/UX design, database administrators, data analytics, android developers, QC and testers, augmented reality and virtual reality apps, etc).
In the union budget of 2021–2022, the government announced that over 15,000 schools, 100 new Sainik schools and 750 Eklavya model residential schools in tribal areas will be qualitatively strengthened to include all components of the National Education Policy 2021. Policies like 100 per cent FDI under automatic route being allowed in the education sector, the National Accreditation Regulatory Authority Bill for Higher Education and the Foreign Educational Institutions Bill, etc., besides demand side opportunities have created an environment that is highly conducive for massive growth in this sector, making it one of the largest job creators.
Availability of quality academic institutions that are also very affordable makes them a good value proposition for international students, opening up massive opportunities for export of education and training as a service.
Table 3.15. Private Equity-Venture Capital Investment in Education, EdTech Firms
Year No. of Deals Investment Amount ($ Million)
2021 (till Sep) 75 3,772
2020 78 2,224
2019 61 968
2018 57 831
2017 41 191
Source: Venture Intelligence.
3.4.11. Jobs in Education SectorJobs in the coaching classes: There is a large and rapidly growing market for coaching and tutoring services imparted through new innovative means, particularly through digital means. Even though private investment in setting up educational

Future of Jobs in India 69
institutions is increasing, still there is demand supply gap for high quality institutions.
K-12: Private Indian schools are collaborating with international brands to provide international standard quality education. All the sectors of K-12 industry have witnessed an increase in employment in the past 10 years. The number of teachers grew from 1.24 million in 2011–2012 to 1.52 million in 2015–2016.
Higher education: There is a considerable growth in the number of universities and colleges which led to the growth in the number of teachers. The number of teachers rose from 1.25 million in FY2012 to 1.37 million in FY2017.
Coaching classes: With increasing student base and availability of new courses, the coaching class segment has grown significantly. They also have a big market in training students for international entrance and language proficiency tests. Nearly 26 per cent of the total number of students in the country took private coaching and tuitions.
Online education: Content creation in online education has emerged as a huge opportunity. Many universities are offering e-learning to reach new students in different geographies and economies on staff costs.
India trails behind other countries such as China and Brazil in terms of student–teacher ratio in higher education, which adversely affects the quality of education and research. The faculty shortage has worsened over the time due to increasing enrolment rate of the students and low faculty recruitment.
With a strong policy support, growth potential, public–private partnership models and innovative services, the education and EdTech sector is poised to be one of the important job creators in coming years.
3.4.12. Imperatives for Policy As digitalization, artificial intelligence, machine learning, augmented reality, virtual reality, robotics, etc., pervade all aspects of life, they also have a massive implication for jobs. On one hand, these trends will eliminate many of the low-end, low-skill jobs. At the same time, they also create many new, high-end jobs. There is a need to educate, skill and reskill youth in line
with the demands of Industry 4.0, and that’s where education, skill development and vocation training sector have opportunity to create many jobs, as well as to contribute to job creation in other industries.
Several Indian academic institutions are now recognized globally for their high quality and affordable education. Policy measures are needed that would enable such education and training institutions to seamlessly expand their presence globally. At the same time, leading academic institutions from around the world are also interested in setting up campuses in India or to collaborate with existing India institutions. Facilitating these will not only create jobs in the education sector, but it would also contribute to improving the quality of education.
Another shift that is needed is in the domain of skilling programmes. The skilling programmes need to transform to align with the new economic structure, wherein services will remain the single largest job creator. Service sector job opportunities demand high degree of soft skills. Prowess in communications, negotiation skills, process facilitation skills, etc., will play a major role in helping youth to make the school to work transition.
3.4.13. Banking and Financial ServicesBanking, Financial services and Insurance (BFSI) sector is the backbone of India’s economy. The BFSI sector contribution to India’s GDP is estimated to be around 6 per cent. It has been one of the fastest growing industries in terms of its contribution to the GDP, employment creation and its share in the market capitalization.
Although there is no precise data available on the number of people employed in the sector, a study conducted by an ILO researcher in 2015 estimated the total number of jobs created by the BFSI sector to be between 4 and 5 million. Further, there is a projected addition of between 1 and 2 million new jobs in the sector.
Except for the period since 2018, when the Indian economy as a whole has been witnessing significant slowdown, the banking and financial services sector has had a consistent growth since the start of this century.
70 STATE OF INDIA'S LIVELIHOODS REPORT -2021
The emergence of private sector banks, emphasis on financial inclusion, emergence of fintech companies, growth in microfinance institutions and NBFCs, emergence of over two dozen private insurance companies, growing uptake of mutual funds and participation of retail investors in the capital markets, demand for investment banking to support the inflow of foreign investments, have all fuelled demand for talent and job creation from the BFSI sector.
Government push on financial inclusion through PMJDY, moving to digital payments through initiatives such as Direct Benefit Transfer (DBT) and Unified Payments Interface (UPI) have fuelled the growth of digital payments in India, making it the second fastest growing market in digital payments besides China. 425.5 million PMJDY accounts have been opened, having INR 144,000 crore in savings.
With Aadhaar, e-KYC, mobile ownership and emergence of interoperable digital platforms such as UPI, the stage is set for next phase of developments in the banking and financial services industry. While the PMJDY account ownership is reaching near universal, there is still a lot of ground to cover when it comes to services such as insurance, lending, wealth management, personal finance and investment.
The data trail generated by digital payments are leading to the emergence of new risk modelling systems, which can boost innovation in insurance and credit businesses, bringing hundreds of millions of hitherto unserved customers under the ambit of these services. Business correspondent model itself has probably created over 1 million jobs for self-employed people, working as business correspondent and business facilitator.
As India enters the middle-income economy, there is a trend towards increasing ‘financialization’ of the economy, as seen in other middle income and high-income economies. As a result, the share of banking and financial services in the overall GDP will increase further.
All these are likely to result growth in a lot of jobs creation in the BFSI sector. From the perspective of jobs creation, the jobs in banking and financial services are not only among the best paying jobs, but they also require higher degree of skill, thereby paving the way for absorbing
large numbers of highly educated/better skilled workforce.
Innovations in digital payments, such as mobile wallets and prepaid instruments, have enabled fast growth of mobile wallet industry, which is estimated to grow at a CAGR of 148 per cent to reach US$4.4 billion by 2022. UPI has emerged as the world’s fastest growing digital payments solution. Just in the month of June 2021, UPI recorded 2.80 billion transactions worth `547,000 crore (US$73.42 billion). India’s digital payment is estimated to increase to US$1 trillion by 2023. The number of transactions through immediate payment service (IMPS) increased to 279.81 million (by volume) and amounted to `266,000 crore (US$40.85 billion) by value in May 2021.
The India Stack, comprising Jan Dhan, Aadhar and Mobile, combined with e-KYC system, has created a digital ecosystem in which many fintech companies are coming up with new, innovative business models. Low penetration of life, health and asset insurance provides an opportunity for exponential growth in the insurance sector. With the upcoming privatization of Life Insurance Corporation of India, other private sector insurance companies will be able to compete better and grow the insurance market. New distribution channels such as bank assurance, online distribution and non-banking financial companies (NBFCs) have widened the reach and reduced operational costs.
Pension funds have just 8.7 million subscribers, and there is immense room for this to grow. Boosted by the JAM trinity, digital lending as a segment has been increasing at a growth rate of over 20 per cent for last several years and is likely to continue growing. From a jobs perspective, innovations such as digital lending do not create jobs for people engaged in these product lines. These products can have a wider impact, as efficient access to the underserved MSME segment through digital lending products can have a multiplier effect by contributing to growth and job creation in the MSME sector also.
NBFC sector is growing in prominence. They are rapidly gaining prominence as intermediaries in the retail finance space. NBFCs finance more

Future of Jobs in India 71
than 80 per cent of equipment leasing and hire purchase activities in India. There were 9,425 NBFCs registered with the RBI as of January 2021. During 2016 to 2020, lending by NBFCs increased at a CAGR of 14.04 per cent to reach US$470 billion. NBFCs have served the non- banking customers by venturing into retail asset-backed lending, lending against securities and microfinance. NBFCs aspire to emerge as a one-stop shop for all financial services.
Mutual fund industry has had a robust growth: As of June 2021, AUM managed by the mutual funds industry stood at `3,367,000 crore (US$449.29 billion). AUM has grown at a CAGR of 11.1 per cent over the last 5 years, and the industry serves over 102 million accounts.
Huge untapped potential for banking and financial services exists at the bottom of the pyramid, which can be the driver for job creation in future.• Two-thirds of India’s population lives in
rural areas where financial services have little inroads thus far.
• There are several stand-alone networks of SHG, NGOs and MFIs in different parts of India. Cross-utilization of these channels can facilitate faster penetration of a wider suite of financial services.
• Increasing use of technology to reach rural India is the paradigm-shifting enabler. Mobile and Internet kiosk-based channels are expected to become the bridge that connects rural India to financial services.
• In November 2020, the government approved equity infusion plan for `6,000 crores (US$814.54 million) in the National Investment and Infrastructure Fund (NIIF) Debt Platform funded by the NIIF, which can boost infrastructure development and job creation.
• New categories of banks, such as payments banks and small finance banks, as well as intermediaries in the payments space, such as prepaid instrument issuers (those issuing digital wallets) are trying to reach new customer segments, who were not served well by the traditional banks.
• Establishment of International Financial Services Centres Authority (Banking) Regulations which enabled the promotion of
the International Financial Services Centre in GIFT City (Gujarat International Finance Tec-City) offers a massive opportunity to promote India as a major financial centre in the world.
3.4.14. Imperatives for PolicyOrderly growth in the BFSI sector can give a huge boost to not only job creation but also be a major contributor to the economic growth. India’s financial sector policies and programmes have been highly conducive to support the growth of the industry and inclusion of those people who were traditionally left behind the banking sector. Aadhaar, Jan Dhan as well as policies such as DBT have created a huge impetus for growth of the BFSI sector. Advances in digital platforms, artificial intelligence, machine learning and Big Data combined with mobile networks reaching deepest corners of the country are making it possible for the BFSI sector players to reach out to new customer segments, who were traditionally left out. There are some policy measures, which can not only increase the supply of financial services but also demand and usage of the same by the target customers. This includes the following.• Consumer protection and grievance
redressal: One of the biggest challenges that BFSI customers face is weak frameworks for consumer protection and grievance redressal. The regulations tend to be skewed towards the providers, and the customers find it hard to have their grievances redressed due to protracted processes.
• Pricing controls: Even though majority of BFSI sector happens to be driven largely by the private sector, the regulators such as RBI and NPCI often enforce pricing controls on services. It deters many interested players since it makes their services unviable. The business correspondent network that currently employs over 1 million people can further create many more jobs if attention is paid to not only rolling out services but also making sure that they are viable so that they can become sustainable.
• Financial and digital literacy: Given all the advances in the products and services as

72 STATE OF INDIA'S LIVELIHOODS REPORT -2021
well as advent of digital financial services makes it imperative that emphasis is given to financial and digital services. This will enable the customer segment who needs financial services but is not confident of using it, can also come forward and start using the products and services to improve their lives.
• Focus on segments that are not able to access the financial services: There are many segments, who are still not getting access to the financial services that they need. For example, 90 per cent of the micro and small enterprises are probably still depending on informal sources to access financing. Limits that were placed on size of loans issued by NBFC-microfinance institutions several years ago have remained static. As a result, the loan sizes are grossly inadequate for most MSME borrowers. Likewise, while subsidized agricultural loans have always enjoyed huge policy push, when it comes to financing of agri-businesses, the situation is far from satisfactory. Education and housing loans for low-income segments that do not have a regular source of income could also be a major growth driver.
3.4.15. Infrastructure SectorInfrastructure sector is a key driver for the economic growth and job creation. The sector is responsible for propelling India’s overall development and enjoys intense focus from government for initiating policies that would ensure time-bound creation of world-class infrastructure in the country. Infrastructure sector includes power, bridges, dams, roads, and urban infrastructure development. Infrastructure sector is attracting the maximum investment, both domestic and foreign. The infrastructure sector has become the biggest focus area for the Government of India. India plans to spend US$1.4 trillion on infrastructure during 2019–2023 to have a sustainable development of the country. The government has suggested investment of `5,000,000 crore (US$750 billion) for railways infrastructure from 2018–2030.
In FY2021, infrastructure activities accounted for 13 per cent share of the total FDI inflows
of US$81.72 billion. The 2021 budget has given a massive push to the infrastructure sector by allocating `233,083 crore (US$32.02 billion) to enhance the transport infrastructure. The ‘National Infrastructure Pipeline (NIP)’ was expanded to 7,400 projects. Through the NIP, investment of US$1.4 trillion has been made in infrastructure development as of July 2021.
The Central Water Commission is undertaking dam rehabilitation and improvement projects to cover 120 dams. Under Bharatmala Pariyojana, 1,080 km road construction projects worth `25,370 crore (US$3.4 billion) have been launched. The Ministry of New & Renewable Energy is undertaking a project encourage rooftop solar (RTS) throughout the country, with aim to install RTS capacity of 4,000 MW in the residential sector. The Ministry of Commerce and Industry has announced plans for ‘Freight Smart Cities’, with the goal of improving the efficiency of urban freight and lowering logistics expenses. The Ministry of Petroleum and Natural Gas and GAIL have lined up `5,000 crore (US$671.14 million) for setting up two plants each for producing ethanol and compressed biogas from municipal waste.
NTPC is setting up pilot projects for stand-alone fuel cell-based backup power system and a stand-alone fuel cell-based microgrid system with hydrogen production at NTPC premises to boost green and clean fuel. In next two years, the government aims to have investment of INR 1,500,000 crore (US$206 billion) in road construction.
Railways plans to monetize assets including Eastern and Western Dedicated Freight Corridors after commissioning, induction of modern rakes through PPP, station redevelopment, railway land parcels, multifunctional complexes, railway colonies, hill railways and stadiums.
The government also announced a long-term US$82 billion plan to invest in the seaports. ~574 projects have been identified, under the Sagarmala project, for implementation through 2035.
A specialized term lending institution National Bank for Financing Infrastructure and Development to fund infrastructure projects in India is being established. Budget 2021 included a number of interventions under Pradhan Mantri

Future of Jobs in India 73
Atmanirbhar Swasth Bharat Yojana, including an outlay of 64,180 crore (US$8.80 billion) over six years to strengthen the existing ‘National Health Mission’ by developing capacities of primary, secondary and tertiary care and healthcare systems and institutions to detect and cure new and emerging diseases. This scheme will strengthen 17,000 rural and 11,000 urban health and wellness centres. Integrated public health labs in all districts and 3,382 block public health units will be set up in 11 states. Critical care hospital blocks will be set up in 602 districts and 12 central institutions. The National Centre for Disease Control will be strengthened to have five regional branches and 20 metropolitan health surveillance units.
`18,998 crore (US$2.61 billion) have been allocated for metro projects. `305,984 crore (US$42 billion) have been allocated over the next five years for reforms-based and result-linked new power distribution sector scheme.
With this all-round focus on infrastructure, covering road, railways, sea, inland waterways, electricity, logistics, clean energy, health infrastructure, the infrastructure sector is going to be one of the largest drivers of employment generation. Besides direct employment, improved infrastructure will also propel investment in other industries and sectors, thereby creating a virtuous cycle of growth and job creation.
3.4.16. Imperatives for PolicyThe government is putting a huge emphasis on all aspects of infrastructure development, such as rural roads, highways, logistics, railways, airports, waterways, ports, dedicated freight corridors, high speed rail tracks, power, irrigation, drinking water and effluent and waste management. A few things that the government may need to look closely at is how to look at infrastructure development not only from the perspective of the needs of a growing economy but also from the perspective of a sustainable future. So while from a short-term perspective, reducing dependence on coal and oil that have a maximum contribution to greenhouse gas emission and climate change to taking a longer term perspective and invest in renewable energy that gradually reduces or eliminates
the dependence on coal and crude oil. Urban planning should not only look at creating world-class infrastructure and modern cities but also create liveable spaces that also look at the need for open spaces, greenery, sports and social life, promotes art, culture, culinary and caters to spiritual needs as well.
Another aspect to look at is how the time taken for completion of various infrastructure projects can be reduced. Invariably, infrastructure projects suffer from time and cost overruns. Factors such as land acquisition and clearance from various departments cause delays. A more streamlined process for these, while also paying attention to the needs of project affected people and environmental impacts, can provide further impetus to infrastructure sector and thereby create millions of jobs. Timely release of funds is another issue that needs to be addressed. Delay in funds release not only causes hardship for contractors and firms working on the infrastructure projects, but it also contributes to cost and time overrun for the projects.
3.4.17. Jobs in IT and IT Enabled Services and Tech Start-ups
The Indian IT sector contributes 7.7 per cent of India’s GDP, accounts for 49 per cent of total exports and has 55 per cent share in global sourcing. The industry employs around 3.97 million people directly. 5,300 tech start-ups, most of which came up in the last decade, will be a huge job creator in future.
IT services and exports account for an estimated 2 million people out of the 3.968 million people employed by the industry. In recent years, there has been a slowdown in the number of net new jobs created by the IT industry. The big opportunities today are in the tech-enabled enterprises rather than the tech enterprises themselves. Overall, the industry is on a growth path and will continue to be an important driver of jobs.
A closer look at the IT and ITeS sector reveals that the fear of job losses should not be so much about jobs becoming irrelevant as it is about the changing nature of jobs. In the face of AI replacing ‘humans’, automation and

74 STATE OF INDIA'S LIVELIHOODS REPORT -2021
machine learning playing a more significant role, upskilling should take the centre stage. Technology evolution, redundancy of jobs based on older skills and emergence of new jobs using new skills is a continuous process. With the strong headwinds both due to global trade wars and changing skill demands, seamless transition into new job roles still remains a question.
India is witnessing emergence of a huge number of start-ups. A significant number of these are based on high-end technologies such as AI, machine learning, Big Data, Cloud computing and blockchain. Over 7,000 start-ups have come on the scene during 2013–2018 and have raised US$4.3 billion in 2018 itself. The emergence of AgriTech has thrown open a whole new world for those interested in agriculture and modern technology such as AI, IoT, Cloud computing and Big Data. A number of ventures have started in this field. Tech giants such as TCS, Tech Mahindra, Infosys, Cognizant, Accenture and ITC all have AgriTech projects.
With the Internet connectivity and demand for vocational skilling and technical education, EdTech industry is expanding fast and employing more and more people, including sector experts. Emphasis on financial inclusion is also attracting a number of fintech start-ups, their current number estimated at about 2,700. 121 start-ups in this space attracted $1.4 billion in investment in 2018. There are over 550 health tech start-ups in India, out of which 64 attracted US$504 million investment in 2018. The start-up industry is poised for further expansion, and its growth shows a promise for job creation.
While there is an excess supply of engineers, there is also a shortage of talented workers in emerging fields such as machine learning, AI and blockchain. Upskilling is the only bridge to connect the workforce to the emerging opportunities. Fostering tech-enabled start-up culture in India is the answer to the job saturation in IT sector, as they require a range of leading-edge IT sector expertise as also domain expertise.
The opportunities for tech-based start-ups are immense in sectors such as Cloud computing, IoT-based products and services, blockchain-based solutions in fields as diverse as arts, land records, organic food, emergency relief, etc.
The emergence of a new breed of entrepreneurs, who are ambitious, who do not shy away from taking risks and interest of VC firms to make outsized bets on start-ups is extremely positive from the job creation perspective in years to come. These can however be further harnessed with continuing policy reforms.
3.4.18. Imperatives for Policy There is room for improvement in areas such as the following.• Ease of doing business: Indian regulatory and
tax regime is not the most conducive for ease of doing business. Entrepreneurs spend more of their time on understanding and meeting the compliance and regulatory burden than running and growing their business.
• Tax reforms: The tax laws need a major reform to keep up with the evolution in the nature of businesses that are digitally enabled and where place of doing business, recognition of incomes and taxation are fluid.
• Data privacy laws: As data become the new currency and fuel for the digital enterprises, data protection and privacy laws need to evolve, so that public interest is safeguarded and trust is retained, in addition to meeting legal and regulatory compliance requirements.
3.5. The Effects of Digitalization on Jobs Computers, Internet and mobile brought the third industrial revolution (3IR) which led to a globalized economy and widespread use of digital technologies. 3IR has changed the ways in which several industries function, for instance, retail, media and advertising, banking and financial services, software, e-commerce, online streaming, social media and digital advertising, etc.
Besides the creation of new jobs, organization of work is also changing due to digital platforms, creating a ‘gig economy’. Platform acts as a ‘marketplace’ for work, enabling entirely new form of online freelancing at a global scale. Two broad categories of work are gaining prominence: (a) purely online work (such as graphic design or software development) and (b)

Future of Jobs in India 75
physical task-based service delivery (such as taxi aggregation or on-demand delivery of products). Gig is creating micro-entrepreneurs who find alternatives to formal employment.
The fourth IR and its implications for employment: The world is witnessing a rapid pace of technological evolution characterized as ‘fourth IR’ or ‘4IR’. Advances in Big Data, machine learning, artificial intelligence, Cloud computing and Internet of Things will take the world towards increased automation and data-driven mechanization in industrial processes. The COVID-19 pandemic and lockdowns in the last year has catalysed the speed of transition towards digitalization across industries. Industry after industry is leapfrogging years in adoption of digital technologies and digitalization of their businesses and employing the power of machine learning, artificial intelligence, robotics, Big Data, etc.
Whenever new technologies are introduced, fears are raised regarding technology substituting human labour at scale. A scenario of technological unemployment is painted—a situation in which over time, labour-saving machinery will destroy more jobs than it shall create, human work is automated and a workless future is created. Because such a wide range of tasks could be automated now, technological unemployment is a real possibility.
New labour-saving technology may both increase and decrease the demand of a particular job. As seen in the banking sector, where ATM machines took over the cash handling work performed by bank tellers, the bank tellers adjusted, reskilled and their functions within the industry changed. ATMs allowed the banks to bring down their operating cost and expand their services to new geographies and customer segments. When scaled at an economy-wide level, new technologies end up reallocating jobs across the economy, redefining entry requirements for jobs and redefining what skills workers must acquire to earn higher wages.
Technological change is an uncertain, gradual and disparate process. Developing countries have not only labour cost advantage but also lower levels of education and skill. The probability of their workers getting affected due to automation needs to be studied further in depth.
Instead of worrying about mass structural unemployment, one needs to instead focus on the jobs involving tasks most susceptible to automation. Examples include low-skilled work involving manual tasks (as in agriculture, construction and some types of manufacturing), and low- and medium-skilled work involving routine, rule-based tasks such as the tasks performed by cashiers, receptionists and travel agents in the services sector. The second aspect is that entirely new jobs will be created that will involve high-skilled work and much of this will be in the sectors where a high level of technological proficiency is required, such as the services sector.
This digitalization push in India as well as globally has in fact created a massive demand for IT skill. Numerous start-ups in digital and digitally enabled businesses have attracted billions of dollars in investment. However, they are struggling to hire and retain IT expertise to build and run their businesses. For the short to medium term, therefore, demand for skills and jobs in the IT and IT-enabled sectors are expected to remain high due to the tsunami of digitalization happening in industry after industry.
Digitalization: Applications to the Indian employment scenario: With a young and growing population, the structure of Indian demography is distinct from advanced economies. India currently enjoys a significant demographic dividend and has another five decades to capitalize on this. This makes it imperative to concentrate on increasing LF participation rate and generating jobs.
The second key aspect is a skill–productivity mismatch. Enrolment in schools does not guarantee educational outcomes. Technical and vocational skilling efforts have been much smaller in scale. Much of the workforce is currently engaged in the agriculture and construction. Within manufacturing, skill-intensive manufacturing industries have been more productive with such firms achieving some scale but are also capital-intensive (such as automobiles). In contrast, labour-intensive manufacturing industries have traditionally involved unskilled work. Within this, the lead sectors of IT and BFSI have historically not employed very significant numbers. Much of

76 STATE OF INDIA'S LIVELIHOODS REPORT -2021
India’s workforce is engaged in low-skilled, manual and routine work that does not contribute much to the GVA in the economy.
Relatively limited short-term risk of automation in India: Theoretically, advanced large-scale machinery or intelligent robotics could replace as much as 77 per cent of India’s workforce. However, this susceptibility to automation does not translate into reality since the conditions necessary for deployment of technology also need to be in place.
In the context of the services sector, there have been fears of automation especially raised in the software and business processing outsourcing services industry. Industry representatives consider these fears to be overblown. Prior to COVID-19 pandemic, some analysts accepted that a slowdown in hiring by up to 25 per cent may take place in the sector over the next few years. However, the COVID-19 pandemic has completely changed the landscape, with a huge spike in demand for people skilled in digital technologies. Since the digitalization process by the pandemic is unlikely to be a reversible trend. Instead, businesses after businesses are completely redefining their business models not only to stay relevant in a pandemic-stricken world but also in times to come after that. An important shift that has taken place is a much greater acceptance and adoption of digitally enabled products and services. In normal times, achieving such large-scale adoption could have taken many years. However, the pandemic catalysed the consumer awareness and willing to adapt to a digitally enabled world and embrace products and services delivered by digitally enabled businesses in their day-to-day lives.
Emerging skill requirements in the digital economy: While many sectors highlighted earlier may not see significant destruction of jobs due to digitalization, the real concern for India in the context of digitalization is reskilling and upskilling its existing workforce, especially in the organized manufacturing and services segment. Technological changes have increased the intensity of jobs involving non-routine cognitive analytical tasks. Jobs with a predominantly routine cognitive task content have not declined. Jobs in manually intensive
work have declined, largely driven by the shift towards a services-led economy and a rise in educational levels.
Looking towards the 4IR, in both organized manufacturing and services sector, 37 per cent of the workforce will be in jobs with new skill sets. Much of the new skill requirements will be on competence in new technologies with priority on high-skilled, non-routine and cognitive tasks. Soft skills will become increasingly important.
New technologies may also be relevant for the agricultural sector, with potential for machine learning, drones, smart sensors and IOTs to improve productivity through ‘data-driven agriculture’. In such a scenario, India’s educational and skilling sectors need to emphasize cognitive and ICT skills. The current situation appears to be discouraging. Employers routinely face difficulty in filling job vacancies due to skill and talent gaps.
With much of India’s young population recently coming online, a large digital market has been created. India’s growing digital economy has a huge potential for job creation. The government wants India’s growing digital economy to be a key driver of growth, creating up to $1 trillion of economic value, and productivity, with output sufficient to support 55 to 60 million workers by 2025.
3.5.1. Major ChallengesThere are two major challenges to employment in India as well as economic growth. These challenges are as follows.1. Skill development and employment for future
workforce: Skill development and learning new skills will be critical to stay employed. As nearly 10–12 million persons get added annually, India faces a huge challenge in providing gainful employment and, in turn, ensuring the income necessary for consumption. This challenge has three key dimensions: (a) knowledge-oriented rather than skill-oriented education; (b) informal rather than formal sector-led job creation and (c) regional disparity in employment opportunities.
2. Socio-economic inclusion of rural India: While rural aspirations have begun converging

Future of Jobs in India 77
with the rest of India, efforts are required to remove significant barriers preventing full socio-economic inclusion of rural India in India’s growth story. However, to fulfil their aspirations, three critical ‘access’ barriers of physical connectivity, digital connectivity and financial inclusion need to be prioritized.
3.5.2. Imperatives for PolicyFrom the above discussion, the imperatives for policy come out clearly.
The good thing is that the government has been proactive, agile and thinking ahead as far as digital future of India is concerned. But the policymaking needs to move at a faster pace, given the pace of change in the real world. For example, blockchain technology has been around for over a decade, and blockchain-based cryptocurrency already represents a trillion-dollar industry. Yet India is still to come up with a coherent policy on how it may enable and leverage different blockchain-based applications not only in the area of regulating digital currencies but also in numerous use cases that are possible. For example, leveraging blockchain to digitize land records and have greater trust and confidence instilled in property transactions or to facilitate the use of blockchain for facilitating trade in things such as gems and jewellery, art and artifacts, and protection of intellectual property.
There is a need to revamp the skilling efforts to align them with the emerging skill requirements of different industries. Regulation of educational and skilling institutions needs a forward-looking and agile approach, so that the educational institutions can fast-track development and introduction of new educational and skilling programmes that keeps pace with not only the current skill requirement of the industry but also empowers the educational institutions to quickly adapt to emerging requirements.
Regulation of various industries such as banking and financial services, fintech, insurance, retail trade, e-commerce, healthcare, communications and entertainment needs to become agile so as to keep pace with the changes in the business models, as all of these industries go through digitalization. Cyber security, risk management, privacy and data protection
have become more and more complex with digitalization of businesses. Not only policy and regulations will need to evolve in line with the digitalization but also functions like auditing would need to evolve in a digitalized world.
Digitalization across industries represents an opportunity to increase efficiency of business processes, drive affordability, increase customer demand, reach new customer segments and improve outcomes in core domains such as health and education, and is a massive opportunity to not only create millions of jobs but also good, well-paying jobs. The imperative is to invest in the right skill set to harness the opportunity, an enabling regulatory framework to harness the potential and a supportive, forward-looking policy that brings the support and investment to help different industries realize their growth potential.
3.6. ConclusionIn conclusion, four major themes emerge from this chapter as summarized below.1. Fear of job losses due to digitalization may
be overstated. But worker rights need to be protected in gig economy. New business models and opportunities arising out of digital platforms are taking a significant market share away from traditional businesses. However, they are also creating numerous new opportunities. Due to network effect, platform-driven business models can grow rapidly to a much larger scale than traditional businesses. Besides taking over market share from existing businesses, the platform businesses also create new demand by reaching out to new customer segments and, in the process, creating many altogether new jobs. Therefore, the fear of digital disruption causing major job losses may not be as credible. However, changing nature of employment in gig economy requires protection of worker rights. Informal, flexible working arrangements between the workers and the platforms are here to stay. Dialogue on aspects such as rights of workers, social security benefits, collective bargaining and minimum wages needs to move forward to ensure that gig work comes with a basic

78 STATE OF INDIA'S LIVELIHOODS REPORT -2021
quality of life and dignity. While some of these need to be mandated through policy instruments, a lot of this will also be driven by consciousness and considerations around environmental and social governance, brand image, productivity, competition and market forces of demand and supply.
2. Investment in skilling is needed to harness the emerging job opportunities. In almost all major sectors of the economy, numerous new jobs are coming up. As different industries undergo a transformation in their processes and business models driven by the effects of digitalization, competition and changing consumer preferences, the new jobs that emerge invariably require new skill sets. The jobseekers need to constantly invest in learning new skills in order to meet the job requirements. The skill development strategy needs to become more scientific and forward-looking, aligned to the structural changes in the larger economy and employment and addresses the skill gaps. Evolution in job roles and work processes across industries necessitates that the skill development work is undertaken with greater collaboration between skilling agencies and the industry. A model wherein skilling budgets are provided directly to the industry may be required with co-investment by the industry.
3. Need for sector-specific policies for job creation: There is a need for sector-specific policies to harness the opportunities for job creation and growth. There are major gaps in access to basic services, such as healthcare and education. Increased investment in these sectors will not only meet these basic needs, but it will also create many jobs. These sector-specific policies need to address both the
enabling investment climate and education and skilling needs of the sector. Sectors such as Khadi and Village Industries, textiles, handicraft, leather, furniture, bamboo, coir and coconut-based products create more jobs for each unit of capital investment. Schemes for promotion of these sectors need to become more market oriented by broadening focus from ‘production’ to aspects such as design development, branding and marketing, so that these sectors can grow and create more jobs. Sector-focused academic institutions, such as in forestry and natural resources, agriculture, horticulture, dairy, textiles, information technology, construction, telecommunications, urban planning, transportation, mining and petroleum need to engage more closely with the industry, look at the emerging skill requirements for the sectors and support the same through revamp in curriculum, investment in research and development and knowledge transfer.
4. Industry needs to move up in the value chain. Many of the industries in India, such as informational technology and automobile ancillaries, already have a global scale and are a part of the global trade and commerce. However, there is need for Indian industries to move up in the value chain, from services to also on the product side, from assembling to also basic research and development of latest technologies, such as clean fuels and engine design. Investment in R&D across industries will create the intellectual property that will not only help the industry move forward and be more competitive at the global stage but will also lead to job creation across them, as the firms will be playing across a greater part of the value chain.
ReferenceAngrist, Joshua D. and Krueger, Alan B.
(1991), Does compulsory school attendance affect schooling and earnings. Quarterly Journal of Economics, 106(4), 979–1014. https://uh.edu/~adkugler/Angrist&Krueger_CS.pdf
Insolvency and Bankruptcy Board of India.
(2020). Annual Report 2019–2020. The author.Ministry of Statistics and Programme
Implementation. (2018). Annual Survey of Industries 2017–2018. The author.
National Agriculture Infra Financing Facility, Department of Agriculture & Farmers Welfare. (2021). Dashboard. https://agriinfra.dac.gov.in/Home/Dashboard

Sustainable Agriculture
4
The centrality of agriculture in addressing hunger and poverty has been well recognized in the 2030 agenda for sustainable development. With world population expected to reach 9.8 billion and a projected global economic growth of 2.9 per cent, market demand for food is expected to increase from 35 per cent to 56 per cent between 2010 and 2050 (FAO, 2009; van Dijk et al., 2021). Food production needs to grow by almost 70 per cent to keep pace with this demand, and most of this growth would result from further agricultural intensification, given the global scarcity of farmlands (FAO, 2009). The Green Revolution-led agricultural intensification was the answer for global food scarcity during the 1960s. The Green Revolution tripled cereal production globally with just 30 per cent increase in cultivated area and had a significant impact on reducing hunger and poverty (John & Babu, 2021). India shifted its stature of a food-importing nation to one that was self-sufficient in food production with the Green Revolution (Brainerd & Menon, 2014).
However, the increase in food production achieved through the chemical input-intensive Green Revolution was not without trade-offs
M. Manjula
on environment and agricultural productivity in the long run (John & Babu, 2021). The loss of indigenous crop varieties, increasing water scarcity due to excessive water usage in agriculture, air, water and soil pollution from pesticide and fertilizer residues, loss of aquatic and terrestrial biota due to agrochemical poisoning and pollution, and the impact of agrochemicals on human health and quality of food are some of the scientifically proven adverse outcomes of the Green Revolution.
The negative externalities posed by the Green Revolution-led agricultural intensification in the early 1960s emphasize the need for an innovative agriculture and food systems that protect and enhance the natural resource base while increasing productivity (FAO, 2017). Sustainable agriculture and food systems that adopt transformative and holistic approaches, building on indigenous and traditional knowledge, gain significance in this context. Such systems that conserve and enhance natural resources while increasing productivity are considered to have positive impacts on the Sustainable Development Goals (SDGs) related to health (SDG3), gender

80 STATE OF INDIA'S LIVELIHOODS REPORT -2021
equality (SDG5), inclusive economic growth and decent work (SDG8), sustainable consumption and production (SDG12), climate change (SDG13) and healthy ecosystems (SDG15). However, the transformative role of sustainable agriculture in achieving Agenda 2030 will be very much dictated by the understanding of what constitutes sustainable agriculture, as programmes and strategies for achieving sustainability in agriculture at the global, national and subnational levels are largely dictated by this understanding.
4.1. International Political Discourse versus Scientific Discourse There is no commonly accepted definition of sustainable agriculture. The meaning and concept of sustainable agriculture has been influenced and shaped by political discourses just as much as scientific discourses (Janker et al., 2018; McNeill, 2019). The political discourse on sustainable agriculture is closely linked to the concepts of sustainability and sustainable development, as described by the Brundtland definition (WCED, 1987). The concept of sustainable agriculture did not figure in international political discourses until the launch of the Millennium Development Goals (MDGs) in 2000. The MDGs’ stress on food security refocused attention on food production and sustainable agriculture. However, food security issues dominated the MDGs with sustainable agriculture and environmental factors being sidestepped in the process. The SDGs which replaced the MDGs revived interest in sustainable agriculture, but, here again, the overarching goal of sustainable agriculture is to combat hunger and poverty through increasing productivity. In SDGs, agriculture again got addressed within the food security goal through the idea of sustainable intensification. With the concept of food security shifting emphasis from
availability to access and the right to food, the social dimension of sustainability got reflected in political discourse, with smallholder farmers gaining prominence as target groups from the perspective of local food security. The food security discourse’s connotation of sustainable agriculture is largely development oriented and does not describe what sustainability should look like for the broader agricultural sector. The discourse’s emphasis on smallholders, though brought in the social dimension, did not help address issues of sustainability for medium and large farmers.
Another major thread in the political discourse on sustainable agriculture is how it is viewed in relation to the environment (United Nations, 1972, 1992). Earlier decades emphasized agriculture’s incompatibility with environment and its contribution to environmental damage, while later decades saw an integration of agricultural production and environmental conservation, giving rise to ideas of conservation agriculture and agro-ecological practices. Within this thread in the political discourse, genetically modified pest-resistant crops are also viewed as an environmentally friendly alternative technology.
The focus and emphasis of UN agencies— Food and Agriculture Organization (FAO), International Fund for Agricultural Development (IFAD), World Food Programme (WFP)—working on agriculture, smallholder farmers and environmentally friendly agricultural practices in the context of climate change are all reflective of the buy-in for international political discourses on sustainable agriculture. But even within these agencies, there is no shared understanding of what constitutes sustainable agriculture. FAO is the only agency that attempts to define sustainable agriculture.1 Subsequently, the SDG indicator for what constitutes sustainable agriculture is given by the meta index—proportion of agricultural area under productive and sustainable agriculture—which again suffers from concretization of the concept of sustainable agriculture and leaves
1. Sustainable agriculture conserves land, water, and plant and animal genetic resources and is environmentally non-degrading, technically appropriate, economically viable and socially acceptable.

Sustainable Agriculture 81
it open to interpretation2 (UNSTATS, 2021). Further, with the primary focus of the UN’s political realm being anchored in development issues, the environment dimension of sustainable agriculture is less emphasized or vaguely defined within the political discourse (Binder et al., 2010; Johnson, 2006).
The scientific discourse on the other hand emphasizes on the environmental management and protection within the agricultural sector. It shifted from a productivity-centric approach—which was central to the paradigm of Green Revolution—to a more environmentally friendly approach. Environmental issues became the core of scientific discourses of sustainable agriculture post-1989 while still retaining the productivity and profitability elements (Struik et al., 2014). Scientists working on sustainable intensification emphasized the use of climate-friendly agricultural practices, biotechnology and nanotechnologies as means to improve farm profitability, achieve resource efficiency and reduce rural poverty. However, critiques of this approach argue that the twin goals of achieving productivity with environmental protection is not achievable and trade-offs are inevitable (Garnett & Godfray, 2012, p. 51).
The environmental protection and management emphasis within the scientific discourse has eventually shifted from an ‘agriculture and environment’ paradigm to ‘environment management in agriculture’ paradigm (Janker et al., 2018). Ecological or ecosystem approaches and resilience approaches gained predominance in the scientific discourse in this context. Nutrient management, soil quality, alternative fertilization, integrated pest management, improved resource management and environmentally best agricultural practices are all part of these approaches. Alternative farming practices are advocated as technological solutions to issues of environmental degradation. In contrast, technology in political discourse
referred to methods that enhance productivity of industrial farms through higher level of mechanization.
An important contrast of the scientific discourse vis-a-vis the political discourse is that it offers solution for local-scale environmental problems. It does not offer a comprehensive concept for addressing issues of environmental damage that results from intensification of production systems at a global scale (Garnett & Godfray, 2012, p. 51). The scientific discourse while providing a host of suitable alternative practices and approaches for sub-aspects of sustainable agriculture at local scale has not been able to provide a solution at a global scale that addresses agriculture sector’s central issue of balancing profitability and environment protection. The scientific discourses are also criticized for a lack of focus on aspects of economic viability of farming.
4.2. The Need for Transparency in Conceptual Understanding Discourse analysis clearly brings out the lack of clarity and concretization of the concept of sustainable agriculture across and within discourses. Hence, many of these global discourses have been contested by various stakeholder groups, including civil society organizations (CSOs), national and sub-national politics and scientists. This has given rise to a myriad of practices and approaches at local, regional, sub-national and national levels that are claimed as sustainable agriculture solutions.
Given the diversity of geographies and agro-ecological characteristics of agricultural production systems, it might not be potentially feasible to come up with a one-size-fits-all
2. The meta index also underplays and brushes over the tussle and disagreements between industrial agriculture and agro-ecology, the two contrasting approaches in agriculture that come with their respective discourses and interests. A composite set of nine sub-indicators covering the economic, social and environmental dimensions of sustainability is used to measure progress towards achieving progress towards sustainable agriculture. Owing to the complexity of measurement, the meta index is relegated to Tier III status, which means this indicator will not be used for global monitoring purposes (McNeil, 2019).

82 STATE OF INDIA'S LIVELIHOODS REPORT -2021
sustainable agriculture solution. But there is a great need for having transparency in understanding the concept of sustainable agriculture to highlight the divergence and complementarity of focus and interests across discourses, practices and approaches for sustainable agriculture. Transparency in conceptual understanding will be useful to design effective programmes and policies on sustainable agriculture. This will also help curtail the proliferation of overlapping approaches and practices using different nomenclatures under the broad banner of ‘sustainable agriculture’ but are based on very divergent interpretations of the underlying philosophies and principles of the said approaches and practices.
Agencies working on agriculture at the global and national levels also define sustainable agriculture using yardsticks which have both overlap and divergence. FAO describes sustainable agriculture based on the five key principles of sustainability.3 FAO describes agro-ecology as an approach to achieve sustainable agriculture using 10 key agro-ecological elements4 and another sustainable agriculture approach, namely sustainable food systems and agriculture using six key principles, respectively5 (FAO, 2014, 2018a, 2018b). India’s National Mission for Sustainable Agriculture (NMSA) defines sustainable agriculture based on 10 key dimensions.6 Soil and water conservation, water use efficiency, soil health management and rainfed area development are some of the principles of NMSA (GoI, 2007). These principles and dimensions are embedded and mainstreamed in the ongoing programmes/schemes in the agriculture sector by the government.
The discourses and conceptual understanding of sustainable agriculture get formulated at the macro level and is driven by international and
national-level agencies with participation of civil society. None of these discourses accommodate the perception of the actual practitioners—the farmers—of ‘sustainable agriculture’. This results in total divergence in translation of the concept of sustainable agriculture into practice at the field level. Further, the lack of clarity in understanding, knowledge and skill on ‘sustainable agricultural practices’ results in low adoption of ‘sustainable agriculture’ systems/practices.
4.3. Status of ‘Sustainable Agriculture’ in India 4.3.1. Policy and Budgetary SupportThe differences in the conceptual understanding of the pathways for sustainable agriculture is evident in the different policy approaches for improving farming and farmers welfare by the GoI. Major policy thrust to agriculture post-Independence began with the Third Five-Year Plan (1960–1965), which saw a shift in emphasis from industrialization-led growth to agriculture. This was followed by the launch of the landmark ‘New Agricultural Strategy’ or, alternately, Green Revolution during the mid-1960s. The Green Revolution heralded productivity breakthroughs in Indian agriculture with the introduction of high yielding varieties, accompanied with modern farm practices—comprising the use of inorganic fertilizers, agrochemicals and expansion of irrigation. The National Commission on Agriculture, set up in 1970, continued the focus on application of science and technology to enhance production, though it recognized land
3. (a) Increase productivity, employment and value addition in food systems, (b) protect and enhance natural resources, (c) improve livelihoods and foster inclusive economic growth, (d) enhance the resilience of people communities and ecosystems, and (e) adapt governance to new challenges.
4. Synergy, efficiency, resilience, recycling, human and social values, diversity, co-creation and sharing of knowledge, culture and food traditions, responsible governance, circular and solidarity economy
5. Availability, access, utilization, stability, sustainability and agency. 6. ‘Improved crop seeds, livestock and fish cultures’, ‘water use efficiency’, ‘pest management’, ‘improved farm practices’,
‘nutrient management’, ‘agricultural insurance’, ‘credit support’, ‘markets’, ‘access to information’ and ‘livelihood diversification’.

Sustainable Agriculture 83
and water management as integral with crop production. The National Agricultural Policy, 2000, was the first instance of a policy-level emphasis on the environmental dimension of agriculture in India. The policy emphasized efficient use of natural resources and spelt out the need for achieving agricultural growth that is sustainable technologically, environmentally and economically (GoI, 2004a). Following this, the National Commission on Farmers, 2004, brought focus on social dimension of agriculture. The Commission emphasized the need for ensuring livelihood security of farmers and included ‘sustainable livelihoods’ as one among its 10 goals for achieving faster and inclusive growth for farmers (GoI, 2004b).
The use of the term ‘sustainable agriculture’ as a policy approach for improving productivity and securing farming was first spelt out in the NMSA launched in 2014. The NMSA, which draws its mandate from the Sustainable Agriculture Mission of National Action Plan for Climate Change was formulated with the purpose of promoting sustainable agriculture practices in resource-scarce rainfed areas. NMSA aims to achieve productivity improvement through conservation and augmentation of natural resources. It advocates the adoption of sustainable development pathways for improving resource efficiency and productivity in agriculture by progressively shifting to environmentally friendly technologies, conserving natural resources and integrated approaches such as crop livestock, crop sericulture, agroforestry and fish farming.
Finally, the Committee constituted in 2017, under the aegis of NITI Aayog for ‘Doubling Farmers Income in India’, views agriculture as an ‘enterprise’. The growth of any enterprise is dependent on savings and investment, which in turn is determined by the extent of positive
net returns from the enterprise. The net returns from the agriculture enterprise determines the level of income of the farmers. This is the underlying rationale for farmers’ income being at the core of DFI deliberations and is a fulcrum of the DFI strategy (Chand, 2017). The DFI strategy is purely based on economic equation which states that net return is a function of gross return minus the cost of production. Owing to this, (a) improving productivity gain, (b) reducing cost of cultivation and (c) ensuring remunerative price are the three key variables around which the committee formulates its strategy. As a result, the DFI places emphasis on monetizing farmers’ produce and enabling agriculture to operate as an enterprise. Maintaining sustainability of production is one of the components and not the prime component around which the DFI strategy platform is built (Chand, 2017).
The budgetary allocation under the Ministry of Agriculture and Farmers Welfare does not have an expenditure head on ‘sustainable agriculture’. The programmes and schemes that cater to the 10 key dimensions used to define sustainable agriculture under NMSA are ironically clubbed under the head called ‘Green Revolution’. This includes schemes such as Paramparagat Krishi Vikas Yojana (PKVY) and National Project on Organic Farming among others.7 The total outlay for ‘Green Revolution’ in the 2021 union budget was `134,081.9 million, which accounts for about 11 per cent of the total allocation for central sector and centrally sponsored schemes for the year 2021–2022. The other major central sector scheme within the dimension of sustainable agriculture is the Pradhan Mantri Krishi Sinchai Yojana (PMKSY)—Per Drop More Crop—aimed at promoting precision farming, accounts for 3 per cent of the total budget outlay for central and centrally sponsored schemes in 2021–2022 (GoI, 2021).
7. Programmes/schemes listed under the Green Revolution in union budget 2021: Rashtriya Krishi Vikas Yojana, National Food Security Mission, National Project on Organic Farming, Organic Value Chain Development for North Eastern Regions, National Project on Management of Soil Health and Fertility, Rainfed Area Development and Climate Change, PKVY, National Project on Agroforestry, National Horticulture Mission, Sub-Mission on Seeds and Planting Materials, Sub Mission on Plant Protection and Plant Quarantine, Sub-Mission on Agricultural Extension, Information Technology, Sub-Mission on Agricultural Mechanization, Integrated Scheme on Agriculture Census, Economics and Statistics, Integrated Scheme on Agricultural Cooperation, Agriculture Marketing and National Bamboo Mission.

84 STATE OF INDIA'S LIVELIHOODS REPORT -2021
Thus, at a macro level, there are a lot of differences in the way sustainable agriculture is conceptualized and operationalized within various policy frameworks. Further, budgetary allocations for sustainable agriculture, which are an indication of the government’s commitment to sustainable agricultural strategies, is miniscule and is clubbed under the misnomer ‘Green Revolution’.
4.3.2. Prevalence of Sustainable Agricultural Practices in India A recent report ‘Sustainable Agriculture in India, 2021’ documents 30 sustainable agricultural practices/systems that are prevalent in India (Gupta et al., 2021). Prominent sustainable agricultural systems adopted in India include agroforestry, precision farming, system of rice intensification (SRI), organic farming and conservation agriculture. Systems such as natural farming, integrated farming systems, biodynamic agriculture and permaculture are practised on less than 1 million hectare or in specific geographies. Large majority of these practices are promoted by CSOs working on agricultural livelihoods.
The natural farming approach experimented in Andhra Pradesh and organic farming approaches in Sikkim are instances of sustainable agriculture efforts at national and sub-national levels. The Government of India came up with the ‘National Organic Farming Policy, 2005, to boost organic farming in India’ (GoI, 2005). The Bhartiya Prakritik Krishi Padhati (BPKP) which was introduced in 2020–2021, as a sub-scheme of PKVY for the promotion of traditional indigenous practices advocates natural farming to achieve this (GoI, 2021). The BPKP promotes the principles of agro-ecology and natural farming. The National Agroforestry Policy, 2014, is the first of its kind in the world, with India gaining the distinction of being the first nation to pass a policy on agroforestry. Agroforesty systems build resilience of agricultural systems and rural livelihoods to climate change and natural calamities (GoI, 2014).
However, none of these approaches of sustainable agriculture were estimated to be part
of mainstream agricultural systems/practices in India (Gupta et al., 2021). Many of these practices are restricted to specific geographies and have very low coverage and adoption level. This was the case with even approaches like organic and natural farming which received policy support at national and sub-national levels. Organic farming was observed to be practised in all the states in varying degrees, with an estimated coverage of 2.8 million hectares, roughly about 2 per cent of the net sown area and 1.9 million adopters (Khurana & Kumar, 2020). Coverage and adoption of natural farming, which is promoted under the popular term, zero budget natural farming (ZBNF) was observed to be less than 1 million hectares and 1 million farmers, respectively. Agroforestry was prevalent over 25 million hectares and about less than 5 million hectares (Gupta et al., 2021). The major sustainable agricultural systems/practices, its principles, core practices, sustainability, scale and agencies promoting them is provided in Annexure 4.1.
4.3.3. Salient Features of Sustainable Agriculture Systems: Focus on ZBNF and Organic Farming
Zero Budget Natural Farming: The Andhra–Karnataka Experience Natural farming though limited in acreage and geographies is gaining popularity as a model of sustainable agriculture. Natural farming embodies the principles of agro-ecology, and, in India, it is popularly referred to as ZBNF. ZBNF is prevalent across different states in India but practised at scale in South Indian states of Andhra Pradesh and Karnataka (Khadse et al., 2018; MoAFW, 2019).
ZBNF, popularized by Subhash Palekar, an agriculturist from Maharashtra, comprises four major components—bheejamrutham, jeevamrutham, mulching and waaphasa. Various kind of decoctions (kashayams) made from botanical extracts are used to control pests and disease. Unique to this practice is the use of cow dung and urine of indigenous cows, which is the primary ingredient in inputs

Sustainable Agriculture 85
in ZBNF. Bheejamrutham is seed coating with formulation of cow dung and cow’s urine. Jeevamrutham is a soil applicant prepared with cow dung, cow’s urine, jaggery, pulse flour, water and soil to enhance soil microbial activity. Mulching is the activity to prevent evaporation and helps in soil humus formation. Waaphasa is the process of improving soil aeration through managing soil microclimate. ZBNF is touted to improve smallholder resilience to climate and economic shocks. ZBNF as the name suggests is a system which does not source any inputs from outside.
ZBNF has been recognized as an important pathway for achieving SDGs and is said to have the potential to meet 169 targets of SDGs (Tripathi et al., 2018). The system has got policy attention from national government and international development agencies. NITI Aayog, the Government of India’s think tank, enlists ZBNF as a means for doubling farmers income. The practice has also found mention in the union budgets 2019–2020 (going back to the basics) and 2020–2021. The state initiatives on ZBNF in Karnataka and Andhra Pradesh has also got financial support from national and international funding agencies. State governments of Andhra Pradesh, Karnataka and Himachal Pradesh have specific allocation for ZBNF, while governments of Rajasthan, Gujarat and Meghalaya have set up programmes for ZBNF (Bharucha et al., 2020).
ZBNF is claimed to be one of the most important agro-ecological movement globally, with about 0.16 million farmers practising it nationally (GoI, 2019). In both, Karnataka, the state where the movement was pioneered and in Andhra Pradesh, where it has had an accelerated spread, the main protagonists have been the member farmers. It’s argued that it’s the social movement dynamic of the initiative and the spirit of volunteerism and enthusiasm exuded by its practising farmer members that has helped create scale for the movement (Khadse et al., 2018). Although spearheaded by the large and medium, upper landed farmers, the movement has been inclusive of all classes of the peasantry in the states of Karnataka and Andhra Pradesh. The movement, unlike other farmer movements, were based on profound ideological stance,
which went beyond market-related issues. ZBNF is part of the La Via Campesina, the agro-ecology-based global peasant movement.
An impact evaluation done on ZBNF systems across 13 kharif and 11 rabi crops in Andhra Pradesh in 2019–2020 shows substantial savings on expenditures on plant nutrient and protective inputs, paid out costs and gain in gross/net revenues across these crops (IDSAP, 2021). Out of the 24 crops included in the study, 21 crops showed positive net returns. In the crops, in which net returns was negative, the value of differences was less than 10 per cent. A study on a set of panel farmers show that net benefits from ZBNF sustains and improves in efficiency over the years. Correspondingly, the study also reports decline in farmers’ dependence on credit and interlocking markets. A study carried out by the CEEW maps the potential social, economic and environmental impact of ZBNF on specific targets under the 17 SDGS using specific case studies (Tripathi et al., 2018). However, ZBNF, as a sustainable system of farming has also its fair share of critics.
The first and foremost being the lack of an independent evaluation and conclusive evidence of the efficacy of ZBNF as an approach for increasing productivity and farmers’ income. The study initiated by the Indian Council of Agricultural Research on ZBNF approaches in select crops in select locations are yet to be published. ZBNF through its effect on soil fertility, water retention, soil microbial activity and the use of natural inputs for pest and disease management undoubtedly is an environmentally sustainable farming system. However, critics argue that this comes at a huge trade-off of economic viability. Further, the steady decline in indigenous cattle breed, the high cost of maintenance of cattle, the high labour cost involved in preparation of the inputs used in ZBNF are all claimed to contribute to high cost of production in ZBNF (Narayanamoorthy & Alli, 2019). The criticism needs to be seriously considered given the reports of several ZBNF farmers from Andhra Pradesh and Maharashtra going back to conventional chemical-based farming methods, owing to decline in yield from their ZBNF farms (Narayanamoorthy & Alli, 2019).

86 STATE OF INDIA'S LIVELIHOODS REPORT -2021
The indigenous cattle population in the country fell by an estimated 8.1 per cent during the period 2012–2019 (GoI, 2020). The price of cattle feed rose by 50 per cent as per the wholesale price index date for the period 2012 to 2018. The non-availability of raw materials for making the biological inputs and lack of extension services is also articulated as a challenge by practitioners of ZBNF. Added to this is the absence of premium market for the chemical-free environmentally sustainable outputs. Marketing has and continues to be remain a challenge for ZBNF farmers (IDSAP, 2021). States like Andhra Pradesh which is rolled out an ambitious plan of shifting to 100 per cent ZBNF by 2024 need to account for these challenges.
Organic Farming: The Sikkim Experience The status of organic farming, another popular sustainable farming system, that has got policy support is no different. India has the distinction of having the largest number of organic producers in the world and being the second largest exporter of organic products in Asia (Khurana & Kumar, 2020). Organic farming system emphasizes the stewardship of natural resources, harnesses traditional knowledge and contributes to achieving SDGs (Yekinni et al., 2019). Although the National Organic Farming Policy (NOFP) was formulated in 2005, focused effort at promoting organic farming at scale was initiated only a decade after under the NMSA, a sub-mission under the National Action Plan on Climate Change (GoI, 2007). Several states have come up with state-specific policies and strategies to shift to organic production. The state of Sikkim leads in this initiative and has the unique distinction of being the first ‘fully organic’ state in the world.
The resolution on transforming Sikkim to a fully organic state was taken in the State Assembly in the year 2003. Following this, the state framed a working policy on organic farming in 2004, launched the Sikkim Organic Mission in 2010 and formulated a full-fledged organic farming policy by 2015. The policy and mission incorporated the principles of health, ecology, fairness and care to ecological systems and relations, and provided end-to-end support
in conversion to organic farming systems. The backward linkages in the initiative include measures such as subsidization of on-farm production of organic inputs, facilitating off-farm certification of inputs, adoption of bio-villages, establishing large-scale infrastructure for organic input production and developing organic package of practices for the crops cultivated in the state. Facilitating market linkage through retail outlets for organic-based food products, large-scale awareness and training programmes on organic farming starting from the school curriculum level, certification through agencies accredited by the Agricultural & Processed Food Products Export Development Authority and encouraging involvement of the local youth in the initiative through establishment of livelihood schools are some of the forward linkage strategies implemented by the state to facilitate quick and easy transition to fully organic (GoS, 2015). The state also phased out the subsidies for chemical fertilizers and pesticides, thus making purchases of these synthetic inputs costlier and discouraging use. The state also stopped lifting its quota of fertilizers and pesticides from the central allocation. Sikkim was declared ‘100 per cent organic’ in January 2016. The state’s 66,000 farming families practice organic and agro-ecological farming on more than 76,000 hectares of land. The state put India on the global map of organic farming by winning the coveted Future Policy Gold Award in the year 2018 in recognition of the state’s holistic approach in adopting ‘Future Just Lawmaking Principles and Elements of Agroecology’ (FAO, 2018a, 2018b; Times of India, 2018).
The sustainability of Sikkim’s effort at conversion to organic systems and the issues of replicability and scalability of this approach across agro-ecologies are to this day, subject to debate. Can Sikkim’s experience with organic farming be replicated at scale is a question that policymakers are grappling with? The state of Sikkim, as critics point out, is naturally endowed with several predisposing factors that have facilitated its transition to fully organic. The NOFP identifies three priority zones for organic farming, namely Categories I, II and III (GoI, 2005). Category I are traditionally chemical input-free monocrop areas under rainfed agriculture and comprises

Sustainable Agriculture 87
the states of North-east region, Jharkhand, Uttaranchal and Rajasthan. Category II are again normally monocrop areas with rainfed farming. The states of Odisha, Himachal Pradesh, Jammu & Kashmir, Madhya Pradesh and Chhattisgarh fall under this category. Category III comprises those areas that are moderate to heavy chemical input dependent. These are areas largely under multiple cropping systems. The policy advocates balanced and conjunctive use of chemical and non-chemical input use in these areas till such time that a full conversion to organic is possible without productivity loss.
The state of Sikkim as per the priority zonation falls in Category I, which is traditionally chemical input free. The average chemical fertilizer consumption rate of Sikkim was 10 kg/hectare in the year 2003, compared to the national average of 90 kg/hectare (Avashte et al., 2016). Pesticide usage is very minimal or absent in the state. About 15,000 hectares of cardamom, an important commercial crop in the region, is grown with forest cover without fertilizer or pesticide application, and pesticides have never been applied. The largely rainfed farming system of Sikkim has been traditionally organic (Pradhan & Badola, 2008). There is abundant and rich biomass availability. The soils are naturally rich in organic matter, with the state’s soils reporting organic carbon range of 2–7 per cent. Further, just about 10.2 per cent of the total geographical area of the state is under agriculture with the remaining areas being largely undisturbed and free from chemical input use. Despite this natural disposition to organic farming, the responses to the ‘fully organic’ initiative in Sikkim is a mixed bag.
A survey conducted by the Centre for Science and Environment (CSE) in the four districts of the state yield drops due to pest attacks post-conversion to fully organic. Scientists at the National Organic Farming Research Institute, a nodal research institute for the north-eastern hill region, also acknowledges this fact. Post-conversion, the yield performance of crops in the state is not very promising, as per the average yield data comparison for the period 2010–2011 to 2015–2016. Sikkim mandarin, a native orange variety, reported yield decline post-conversion. In other crops, yield either stabilized, or showed
a mild increasing trend, after an initial yield drop in the early years of conversion. The CSE survey brings out many drawbacks in the implementation of the policy/programme of organic conversion in the state. The first and foremost was the lack of sufficient organic inputs. The phasing out of the chemicals was not sufficiently complemented with availability of organic products. Although the government managed bio-input production centres show sufficient stock, it has not really reached the end users: the farmers (Taneja, 2017).
Capacity building of farmers in on-farm input production, an important strategy to promote decentralized production and availability of organic inputs, suffered from insufficient funding support. During 2010–2014, just about 5 per cent of the total allocation in the organic mission has been utilized for farmer trainings. The other area that is suffered from fund paucity is the marketing of organic produce. The organic produce of the state is sold under the brand ‘Sikkim Organic’ in both domestic and international markets. However, with no regulation on food coming from other states, the organic food produce do not get the premium price, as it competes with cheaper conventional food from other states. Despite this, the state has spent the lion’s share of allocation under the organic mission on produce certification, both third party and Participatory Guarantee Scheme. The survey indicates that the state is far from being food secure with conversion to fully organic production and will continue to rely on food grown under conventional agriculture, from the neighbouring West Bengal. The net positive impact of ‘fully organic’ conversion in the state has accrued to the tourism industry, with the sector showing a 25 per cent increase in tourist influx post-conversion (Taneja, 2017).
The experience of Sikkim holds valuable lessons for replication and sustainability in the other states in India that are at different stages of intention and plan of promoting organic farming. The states of Mizoram, Himachal Pradesh, Madhya Pradesh, Maharashtra, Tamil Nadu, Karnataka, Kerala, Andhra Pradesh and Gujarat have either a policy or law on organic farming. Most of these states fall under the Category III of the organic farming zonation in the national policy and hence follow high chemical input

88 STATE OF INDIA'S LIVELIHOODS REPORT -2021
intensive agriculture. Scientists and experts in the states do not consider the Sikkim model to be readily adoptable or applicable in these states.
4.3.4. State-led ZBNF and Organic Farming Strategies versus Agro-ecology: Relevance for Inclusion The ZBNF experience of Andhra Pradesh and the Organic Mission of Sikkim are both state-led initiatives to scale up ecologically benign alternatives to conventional agriculture in the respective states. There are striking differences in the way in which the states played a role in deciding the scaling up design in the programmes. The impact of ‘fully organic’ conversion in Sikkim also has implications for larger agro-ecological policy formulations. The FAO hails Sikkim’s organic farming policy as the ‘best agro-ecology policy’ in the world and consider it as an excellent example for upscaling agro-ecology (FAO, 2018a, 2018b). Organic farming and agro-ecology though closely related are not similar (Meek & Anderson, 2019). Agro-ecology refers to agricultural systems that are based on ecological principles, are not prescriptive and is centred on the synergistic relationship between people and nature and emphasizes de-centring of profit, markets and top-down technology transfer (Altieri, 2018; Meek & Anderson, 2019). On the other hand, the Sikkim government’s approach in converting the state into fully organic is criticized for advancing monocultural market-led organic models rather than promoting it as a livelihood-led approach (Meek & Anderson, 2019). The state drives the scaling up of the model and the ‘progressive farmers’ who receive training under the programmes are projected as central protagonists and the face of organic movement in the state. In such an approach, the state overrides the desires and agency of farmers. Farmers not tied to the organic value chain promoted by the state are left with no support, violating the principles of equity in an agro-ecological approaches.
ZBNF, adopted as a method for scaling by the state of Andhra Pradesh, succeeded to some extent to keep people at the centre. As discussed
earlier, it’s the social movement dynamic of the initiative and the spirit of volunteerism and enthusiasm exuded by its practising farmer members that has helped in large-scale adoption and spread of this movement. This has a closer reflection to the agro-ecological principles of equity, synergistic relation between man and nature, and decentring of markets (Altieri, 2018; Khadse et al., 2018).
4.3.5. Impact of Sustainable Agriculture in India: Research GapsA systematic review of the studies conducted on the impact of sustainable agriculture practices/systems show them to be anchored on one or the other dimension of sustainability (Gupta et al., 2021). A large number of studies are plot-level agronomic trials, limited to estimating short-term impacts on yield, income, soil and water or focused on specific systems such as SRI, organic and precision farming. Yield assessments are largely carried out using conventional approaches—crop-cutting experiment—and often fails to incorporate elements of crop diversification and integrated farming systems which are common features in sustainable agricultural systems. There is also lack of any attempt at large-scale cross sectional studies looking at impacts at agro-ecological/regional level, and none/limited studies focusing on long-term impacts of sustainable agriculture practices/systems. Further, each of these studies adopts a different methodological framework which are anchored on agronomic, economic, biophysical, microbial, nutrient based and emission-based approaches to impact assessment. There has not been any attempt at estimating impact or measure trade-offs of these practices/systems using a common assessment framework.
The first attempt at a comprehensive study on sustainable agriculture in India was by CEEW (Gupta et al., 2021). The study documents the sustainable agricultural practices prevalent in India, their regional distribution, scale of adoption, contextual suitability and impact. The study further identifies impact evidence gaps that needs research focus. The approach included systematic literature review, stakeholder
Sustainable Agriculture 89
consultation and primary survey. Further, the study shortlisted sustainable agricultural practices/systems applying FAOs agro-ecological principles and undertook literature analysis on impact, scale and adoption of the shortlisted practices/systems. The study did not engage in an actual field-level assessment of the diverse practices/systems. In addition, the survey and stakeholder consultations carried out in the study were limited to CSOs/NGOs, researchers and academicians, and government institutions promoting or researching on sustainable agriculture in India. It did not include the views of farmers who are the actual adopters/practitioners of sustainable agriculture.
4.4. The Way Forward: Potential Solutions to Scale up Sustainable Agriculture in IndiaIndia has been home to several traditional farming practices that are based on ecological principles. These systems are knowledge intensive and have been adopted through a process of experiential learning, intergenerational knowledge transfer and farmer-to-farmer extension. Although the global and national-level discourses on sustainable agriculture delves on many of these dimensions of sustainability of traditional farming systems, none have been evolved with the participation of the actual practitioners of these systems. Hence, the discourses and the conceptual understandings are always top-down in their design and translation, and hence mostly do not resonate with farmers’ perception and aspirations. It would be useful to document the level of farmers’ understanding, buy-ins and acceptance of the macro-discourses that drives policy and programmes designs promoting sustainable agriculture in the country. Further, it would be worthwhile to assess the divergence and/or complementarity of farmers perception with the discourse narratives. This will provide useful inputs for customizing existing programmes and policies or design new programmes and policies that will have larger adoption among farmers. Towards this, it would be worthwhile to conduct a study on perception assessment among farmers
about sustainable agriculture across the different agro-ecologies.
As elaborated earlier in this chapter, there are a large number of practices and approaches in agriculture that are promoted as ‘sustainable agricultural practices’ in India. Many of them have overlapping principles and philosophies and, at times, are one and the same approach packaged under different names. At times, practices and systems are promoted in the name of sustainable agriculture with no understanding of underlying philosophies/principles. Instances of the practices and systems promoted using the same nomenclature but widely varying in their underlying premise of principles and philosophies is also observed. There has not been any prior attempt at assessing the ‘sustainability’ claims of these practices and systems using a common framework. Studies on impact are limited to three or four popular practices/system. They also suffer from scale, domain and geographical limitations.
While we recognize that a ‘one-size-fits-all’ approach is not feasible, given the diversity of agro-ecological systems in our country, there needs to be some means of systematically analysing the performance of these practices from the sustainability perspective. This calls for development of a comprehensive assessment framework that factors and accommodates the differential requirement of the agro-ecologies. The framework should also be amenable to multi/intercropping systems and integrated farming systems. Such a framework will be a useful tool to compare the suitability and impact of sustainable agricultural practices/systems on various dimensions of sustainability across agro-ecologies. Such an exercise will be useful to systematically combine local practices and measures, and identify and prioritize the most suitable practice/systems for specific climatic and agro-ecological zones. Further to this, field-based evidence on the performance of the identified agro-ecologically suitable practices/systems on the assessment framework could be demonstrated through demonstration plots showcasing these practices/systems across agro-ecologies. The demonstration plots could serve the purpose of peer learning among CSOs and farmers, and serve as policy advocacy material

90 STATE OF INDIA'S LIVELIHOODS REPORT -2021
for mainstreaming these practices/systems. This is expected to help evolve an enabling policy ecosystem for large-scale adoption of these systems/practices across agro-ecologies.
The space of sustainable agriculture in India is predominated by CSOs working on agriculture and allied sector livelihoods. Most of the sustainable agricultural practices are knowledge and skill intensive. Lack of knowledge and training on these practices are identified as one of the several limiting factors for adoption of these practices. Often, it’s the CSOs who fill the knowledge and training gap in the field of sustainable agriculture. The CSOs engage in awareness building, training and capacity building of farmers on sustainable agricultural practices/systems. They also provide training and support for input preparation and management. Many of them are engaged in field demonstration and technology transfer activities. The proposed assessment of sustainable agriculture practices/systems on the comprehensive framework will also provide useful insights for developing a ‘customized package of practices’ that can be used as guidelines/recommendations for agencies involved in promoting these practices/systems. The customized package of practices can also serve as an instruction manual for farmers adopting these practices.
Sustainable agriculture, as a science and practice, is concerned with social, biophysical, ecological and economic sustainability of farming systems (Carlisle et al., 2019). The management of sustainable agricultural systems is knowledge and skill intensive. It requires farmers and agricultural labourers to learn to take an ecosystem approach to farming. It requires skills to combine and translate field-level practices in line with the ecological principles of the science of sustainable agriculture. The knowledge and skill requirement ranges from skill in observing living soils, adapting and locally producing inputs to suit the changing climatic and human needs to establishing socially and ecologically resilient farming systems. In short, the large-scale adoption of sustainable agricultural practices/systems calls for farmers to shift to and adopt ecologically skilled practices. Many of the traditional farming practices across diverse agro-ecologies in India are based on ecological principles. But with a shift in policy
emphasis on ‘productivity enhancement’, many of these traditional practices are either lost or practised over very limited scale, confined to certain communities and geographies. Sustainable agricultural emphasizes locally adaptable principles and is adopted through experiential learning pathway and through farmer-to-farmer exchanges. However, the loss of traditional knowledge on farming practices based on ecological principles has created a gap in the experiential and farmer-to-farmer learning pathways. Currently, the CSOs/NGOs promoting ‘sustainable agriculture’ fill this gap of dying ‘traditional knowledge’ on farming practices based on ecological principles. And most of them recruit workforce with limited/practically no prior experience in farming to play the role of an ‘extension agent’ for sustainable agricultural practices. Thus, many of these practices are promoted with limited understanding of the underlying philosophies/principles resulting in trade-offs and externalities detrimental to farming and farmers in the long run. Capacity building of practitioners on the principle, philosophy and practice of sustainable agriculture would help bridge this knowledge and skill gap at meso and micro levels. A certificate programme that deals with science, philosophy and practice of sustainability with opportunity for experiential learning through field demonstrations would be very useful to build a cadre of ‘ecologically skilled workforce’. The transformative role of agriculture in achieving the SDGs is a much-discussed and recognized among policymakers and researchers. Many of the programmes and schemes floated under the umbrella of ‘sustainable agriculture’ are said to be designed to contribute to shifting Indian agriculture on the sustainability path. A systematic analysis of the existing programmes/schemes on sustainable agriculture at the national and sub-national levels, at a disaggregated agro-ecological level, applying the comprehensive framework of assessment would help identify the suitability and gaps, if any, in the transformative role of these initiatives in achieving goals of sustainable development. This will be useful evidence for policymakers, researchers and practitioners for mid-course correction and serve as useful input for programme design/redesign.

Sustainable Agriculture 91
4.5. ConclusionSustainable agricultural production systems with its influence on multiple SDG goals is attributed with transformative role in achieving the 2030 agenda for sustainable development. However, discourse analysis clearly brings out the lack of clarity and concretization of the concept of sustainable agriculture across and within discourses. None of these discourses accommodates the perception of farmers. This has implications for the nature of policy and programmes that are designed for sustainable agriculture at global, national and sub-national levels. In India, though there is a policy-level shift to more sustainable practices, differences were observed in the way sustainable agriculture was conceptualized and operationalized within policy
frameworks. This has given rise to a myriad of practices and approaches at local, regional, sub-national and national levels, which are claimed as sustainable agriculture solutions. The critical analysis of the two-hallmark state-led initiatives in sustainable agricultural transformation in India—ZBNF in Andhra Pradesh and Organic Farming in Sikkim—brings out the divergence in approaches and the potential impact on the actual practitioners—the farmers. The chapter suggests accommodation of the farmers’ perception of sustainable agriculture in policy and programme design, developing a monitoring framework that accommodates agro-ecological differences, building a cadre of ‘ecologically skilled workforce’, and developing customized package of practices as means to facilitate adoption of sustainable agricultural systems and practices at scale.
S. No. Principles Core practices Sustainability focus
Scale Major international/national agency
engagement
Agro-ecology
1 1. Diversity: Species and genetic resources
2. Synergist: Optimizing biological synergies through building synergies in food systems
3. Co-creation and generation of knowledge: Participatory approaches to facilitate co-creation
4. Efficiency: Improving resource-use efficiency
5. Recycling: Of nutrients, water and biomass within production systems
6. Resilience: Of people, communities and ecosystems
7. Human and social values: Protecting and improving rural livelihoods, equity and social well-being
8. Cultural and food traditions: Support healthy, diversified and culturally appropriate diets
9. Responsible governance: Responsible and effective governance at local, national and global scales
10. Circular and solidarity economy: Reconnect producers and consumers, provide innovative solutions for living within/without planetary boundaries
• Conservation tillage• Crop rotation and fallowing • Cover crops and mulching• Crop-livestock integration• Integrated nutrient management• Efficient water harvesting • Agroforestry • Use of local resources and
renewable energy • Holistic landscape management
Environment Social Economic
Micro: Local food chains
FAO has provided a comprehensive guiding principle for transforming to agro-ecological production systems
Annexure 4.1. Sustainable Agriculture Systems/Practices: Principles, Core Practices, Sustainability, Scale and Agencies
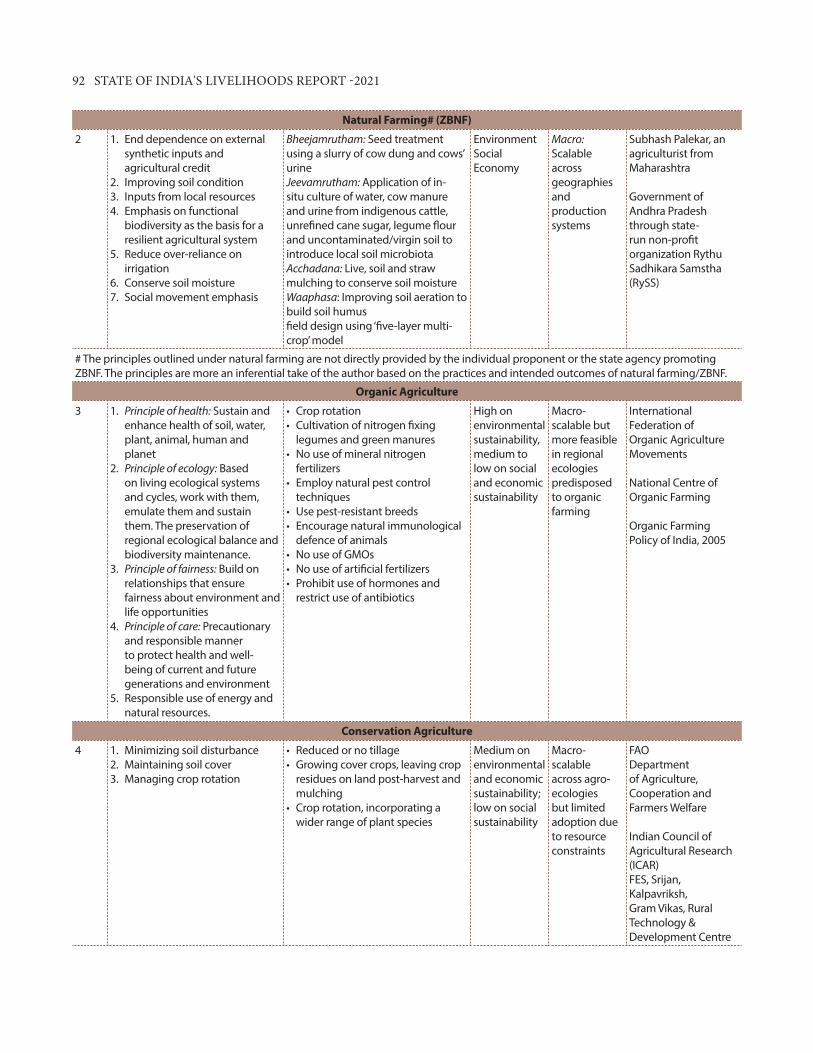
92 STATE OF INDIA'S LIVELIHOODS REPORT -2021
Natural Farming# (ZBNF)
2 1. End dependence on external synthetic inputs and agricultural credit
2. Improving soil condition 3. Inputs from local resources 4. Emphasis on functional
biodiversity as the basis for a resilient agricultural system
5. Reduce over-reliance on irrigation
6. Conserve soil moisture7. Social movement emphasis
Bheejamrutham: Seed treatment using a slurry of cow dung and cows’ urine Jeevamrutham: Application of in-situ culture of water, cow manure and urine from indigenous cattle, unrefined cane sugar, legume flour and uncontaminated/virgin soil to introduce local soil microbiota Acchadana: Live, soil and straw mulching to conserve soil moisture Waaphasa: Improving soil aeration to build soil humus field design using ‘five-layer multi-crop’ model
Environment Social Economy
Macro: Scalable across geographies and production systems
Subhash Palekar, an agriculturist from Maharashtra
Government of Andhra Pradesh through state-run non-profit organization Rythu Sadhikara Samstha(RySS)
# The principles outlined under natural farming are not directly provided by the individual proponent or the state agency promoting ZBNF. The principles are more an inferential take of the author based on the practices and intended outcomes of natural farming/ZBNF.
Organic Agriculture
3 1. Principle of health: Sustain and enhance health of soil, water, plant, animal, human and planet
2. Principle of ecology: Based on living ecological systems and cycles, work with them, emulate them and sustain them. The preservation of regional ecological balance and biodiversity maintenance.
3. Principle of fairness: Build on relationships that ensure fairness about environment and life opportunities
4. Principle of care: Precautionary and responsible manner to protect health and well-being of current and future generations and environment
5. Responsible use of energy and natural resources.
• Crop rotation• Cultivation of nitrogen fixing
legumes and green manures • No use of mineral nitrogen
fertilizers• Employ natural pest control
techniques • Use pest-resistant breeds • Encourage natural immunological
defence of animals• No use of GMOs• No use of artificial fertilizers • Prohibit use of hormones and
restrict use of antibiotics
High on environmental sustainability, medium to low on social and economic sustainability
Macro-scalable but more feasible in regional ecologies predisposed to organic farming
International Federation of Organic Agriculture Movements
National Centre of Organic Farming
Organic Farming Policy of India, 2005
Conservation Agriculture
4 1. Minimizing soil disturbance2. Maintaining soil cover3. Managing crop rotation
• Reduced or no tillage• Growing cover crops, leaving crop
residues on land post-harvest and mulching
• Crop rotation, incorporating a wider range of plant species
Medium on environmental and economic sustainability; low on social sustainability
Macro- scalable across agro-ecologies but limited adoption due to resource constraints
FAODepartment of Agriculture, Cooperation and Farmers Welfare
Indian Council of Agricultural Research (ICAR)FES, Srijan, Kalpavriksh, Gram Vikas, Rural Technology & Development Centre

Sustainable Agriculture 93
Permaculture
5 Basic norms1. Care for earth2. Care for people3. Set limits to consumption and
production 4. Redistribute surplus
Broad principles5. Observe and interact taking
time to engage with nature 6. Catch and store energy: Storing
resources when at peak abundance for use at a later period of scarcity
7. Obtain a yield: Emphasis on returns/rewards
8. Apply self-regulation and accept feedback: Discourage inappropriate activity to ensure functioning of systems
9. Use and value renewable resources and services
10. Produce no waste11. Use and value diversity12. Use edges and value the
marginal: Interfaces between things are the place where most interesting events happen
13. Creatively use and respond to change
• Rainwater harvesting, composting • Use of pollinators, nitrogen fixers,
birds, bats, etc. • Focus on production: Replacing
lawns and grass with productive crops/growing perennial food crops
• Healthy soil: No tilling, no chemical inputs, mulching and cover crops
• Agroforestry practice • Using animals for multiple
functions• Hugelkultur: Burying wood to
increase soil water retention• Keyline design: To manage water
flow• No pruning
EnvironmentSocial
Micro: Knowledge and community intensive
Local, smaller, self-sufficient scale
The Indian Permaculture Network
National Centre of Organic Farming
Low External Input Agriculture (LEIA)
6 1. Minimizing the use of external inputs into farm system (off-farm resources) by using them in a complementary way
2. Optimizing the management and use of internal production inputs (on-farm resources) and locally available resources
3. Sustained farmer livelihood systems
4. Competitiveness5. Low relative value of external
inputs6. Equitable adoption potential
(especially among small farmers)
7. Reduced dependency on external institutions
8. Enhanced food security at the family and local level
9. Contribution to employment generation
• Use of green and animal manures • Limiting herbicide, fungicide and
insecticide• Crop rotation, intercropping and
cover cropping• Crop diversification
High to medium on environment and social; medium to low on economic
Micro-suitable for agro-ecologies that is abundant in natural resources
FAO

94 STATE OF INDIA'S LIVELIHOODS REPORT -2021
Climate Smart Agriculture
7 1. Enhanced resilience and adaptation to climate change
2. Reduced greenhouse gas emission and/or carbon sequestration
3. Increasing food security through increasing agricultural productivity and income
• Integrated practices: Managing production systems and natural resources to ensure ecosystem service flow
• Crop production practices that adapt to climate change and has mitigating effects. Alternate wetting and drying, SRI, etc.
• Livestock measures: Reduce GHGs, zero grazing, grassland restoration and management; manure management, crop livestock integration, etc.
• Sustainable forest management • Genetic resources and diversity of
and within species and of ecosystem• Land and water management:
Restoration of peatlands, degraded lands, grasslands, range lands, water and irrigation management
• Proactive drought management: Effective monitoring and early warning systems, emergency response programmes
• Energy efficiency: Synergies between energy-smart and climate-smart agricultural practices, minimize use of non-renewable energy sources, integrating food and energy production, etc.
• Nuclear techniques: Applying nuclear and isotopic techniques to climate smart agriculture
Environment and economic, but low on social dimension of sustainability
Practices and technologies could be skewed more towards resourceful farmers
Macro-scalable and customizable to any agro-ecological systems
FAO, World Bank, IFAD, UNEP, WFP & CGIAR
Integrated Farming System
1. Cardinal principles of minimum competition and maximum complementarity
2. A holistic whole farm view to agriculture
3. Emphasis on strategic planning and management of the farm
4. Harnesses interconnectedness between agriculture and environment
5. Practice resource use efficiency 6. Ensuring profitability 7. ‘Every part of the whole can
influence another & when farm management & addresses this, profitability can increase and pollution can be reduced’
• Judicious mix and positive interaction between two or more components (such as horticulture crops, livestock, aquaculture, poultry/ducks, apiculture and mushroom cultivation)
• Agri-silvicultural systems• Silvo-pastoral systems• Mixed farming systems • Crop livestock systems • Crop fish farming systems
EnvironmentEconomicSocial
Macro-scalable across agro-ecologies
FAO, Central Research Institute for Dryland Agriculture (CRIDA)ICAR
CSOs: FES & others

Sustainable Agriculture 95
Agroforestry
1. Practice and science of the interactions between agriculture and forestry that involve farmers, trees (woody perennials), forests and livestock at multiple scales
2. Green corridor, enabling sensitive species to move between different habitats
3. Carbon sequestering systems
Traditional and modern land use systems where woody perennials (trees, shrubs, bamboos and palms) are integrated on purpose on the same land as crops and/or animals in various spatial or temporal arrangements
EnvironmentEconomics Medium to low: Social
Macro- scalable across diverse agro-ecologies
National Agroforestry Policy 2014
World Agroforestry (ICRAF)
Popular Sustainable Practices
SRI
A climate-smart agro-ecological approach for increasing productivity by changing management of soil, water and nutrients 1. Early, quick and healthy plant
establishment 2. Reduced plant density3. Improved soil conditions
through enhancing soil organic matter
4. Reduced and controlled water application
Rice seedlings are transplanted:• Very young › at the 2-leaf stage,
usually between 8 and 12 days old• Carefully and quickly › protecting
the seedlings’ roots and minimizing the transplanting shock
• Singly › one plant per hill instead of 3–4 together to avoid root competition
• Widely spaced › to encourage greater root and canopy growth
• In a square grid pattern › 25 × 25 cm or wider in good quality soil
Soil: Enriched with organic matterWater: Alternate wetting and drying (intermittent irrigation)Nutrients: Mix of organic and inorganicWeeds: Rotary hoe—a simple, inexpensive, mechanical push-weeder—is most often used starting at 10 days after transplanting, repeated ideally every 7–10 days until the canopy is closing (up to 4 times). • The weeder incorporates the
weeds into the soil, where they decompose and their nutrients can be recycled
• It provides a light superficial tillage and aerates the soil
• It stimulates root growth by root pruning
• It makes nutrients newly available to the plant by mixing water with organic matter enriched topsoil
• A re-greening effect of the plants can be observed 1–2 days after weeding
• It redistributes water across the plot, contributing to a continuous levelling of the plot and eliminating water patches in lower laying areas in the field that create anaerobic conditions for the plants
Environment, economySocial
Macro- adaptable to rice, wheat, sugarcane and pulses
ICAR, Indian Institute of Rice Research
CSOs

96 STATE OF INDIA'S LIVELIHOODS REPORT -2021
Integrated Pest Management
‘Control of pest, disease and weeds using a combination of cultural, physical, biological and chemical methods that are environmentally friendly, cost effective and socially acceptable’ (2020)
Maintains pest population below economic threshold level
• Mechanical and physical control: Scouting for economic threshold limit (ETL), traps, mulches, barriers such as screens, barbed wire fences, bird perches and steam sterilization
• Biological control: Use of natural enemies—predators, parasites pathogens and competitors
• Use of bio-pesticides • Cultural control: Changing
irrigation practices • Chemical control: Use of very
selective pesticides only when needed
EnvironmentEconomic Social
Macro: But will need location-specific IPM modules
FAOICAR• Directorate of
Plant Protection Quarantine & Storage
• National Institute of Plant Health Management
CSOs
Source: Bharucha et al. (2020), Gupta et al. (2021), Oberč and Arroyo Schnell (2020) and Rizvi et al. (2020).
ReferencesAltieri, M. A. (2018). Agroecology: The
science of sustainable agriculture. CRC Press. https://regabrasil.files.wordpress.com/2018/10/agroecology-the-science-of-sustainable-agriculture-altieri.pdf
Avashte, R., Pradhan, Y., & Bhutia, K. (2016). Transforming rural Sikkim. Sikkim Organic Mission (Government of India).
Bharucha, Z. P., Mitjans, S. B., & Pretty, J. (2020). Towards redesign at scale through zero budget natural farming in Andhra Pradesh, India. International Journal of Agricultural Sustainability, 18(1), 1–20. https://doi.org/10.1080/14735903.2019.1694465
Binder, C. R., Feola, G., & Steinberger, J. K. (2010). Considering the normative, systemic and procedural dimensions in indicator-based sustainability assessments in agriculture. Environmental Impact Assessment Review, 30(2), 71–81. https://doi.org/10.1016/j.eiar.2009.06.002
Brainerd, E., & Menon, N. (2014). Seasonal effects of water quality: The hidden costs of the Green Revolution to infant and child health in India. Journal of Development Economics, 107, 49–64. https://doi.org/10.1016/j.jdeveco.2013.11.004
Carlisle, L., Montenegro de Wit, M., Delonge, M., Iles, A., Calo, A., Getz, C., Ory, J., Munden-Dixon, K., Galt, R. E., Melone, B., Knox, R., & Press, D. (2019). Transitioning to sustainable
agriculture requires growing and sustaining an ecologically skilled workforce. Frontiers in Sustainable Food Systems, 3, 96. https://doi.org/10.3389/fsufs.2019.00096
Chand, R. (2017). Doubling farmers income: Rationale, strategy, prospects and action plan (NITI Policy Paper No. 1/2017). NITI Aayog, Government of India. 34. https://www.niti.gov.in/writereaddata/files/document_publication/DOUBLING%20FARMERS%20INCOME.pdf
FAO. (2009). Global agriculture towards 2050. High level expert forum—How to feed the world in 2050. https://www.fao.org/fileadmin/templates/wsfs/docs/Issues_papers/HLEF2050_Global_Agriculture.pdf
FAO. (2014). Building a common vision for sustainable food and agriculture: Principles and Approaches. https://www.fao.org/3/i3940e/i3940e.pdf
FAO. (2017). The future of food and agriculture—Trends and challenges. https://www.fao.org/3/i6583e/i6583e.pdf
FAO. (2018a). Sikkim, India’s first ‘fully organic’ state wins FAO’S future policy gold award. http://www.fao.org/india/news/detail-events/en/c/1157760/
FAO. (2018b). The 10 elements of agroecology: Guiding the transition to sustainable food and agricultural systems. http://www.fao.org/3/i9037en/i9037en.pdf
Garnett, T., & Godfray, H. C. J. (2012). Sustainable intensification in agriculture.

Sustainable Agriculture 97
Navigating a course through competing food system priorities. Food Climate Research Network and the Oxford Martin programme on the future of food, University of Oxford. http://www.marineagronomy.org/sites/default/files/Garnett%20%26%20Godfrey%202012%20-%20Sustainable%20Intensification%20in%20Agriculture.pdf
Government of India (GoI). (2004a). National Agriculture Policy, 2000. Press Information Bureau, Ministry of Agriculture and Farmers Welfare, GoI. https://pib.gov.in/newsite/erelcontent.aspx?relid=991
Government of India (GoI). (2004b). National Commission on Farmers. Ministry of Agriculture, GoI. https://agricoop.gov.in/sites/default/files/NCF%20Report-01.pdf
Government of India (GoI). (2005). Organic Farming Policy 2005. Department of Agriculture & Cooperation, Ministry of Agriculture. https://www.scribd.com/document/268564025/Organic-Farming-Policy-2005
Government of India. (2007). National action plan on climate change. Prime Minister’s Council on Climate Change. http://www.nicra-icar.in/nicrarevised/images/Mission%20Documents/National-Action-Plan-on-Climate-Change.pdf
Government of India (GoI). (2014). National Agroforestry Policy. Department of Agriculture & Cooperation, Ministry of Agriculture. https://agricoop.nic.in/sites/default/files/National%20Agroforestry%20Policy%202014.pdf
Government of India (GoI). (2019). Economic Survey 2018-19. Department of Economic Affairs, Ministry of Finance, GoI. https://www.indiabudget.gov.in/budget2019-20/economicsurvey/
Government of India (GoI). (2020). 20th Livestock Census, 2019. Department of Animal Husbandry & Dairying, Ministry of Fisheries, GoI. ht tps ://epashuhaat .gov. in/documents/ProvisionalKeyResultsof20thLivestockCensus.pdf
Government of India (GoI). (2021). Union budget 2021–22. Ministry of Finance, GoI. https://www.indiabudget.gov.in/doc/budget_speech.pdf
Government of Sikkim (GoS). (2015). State policy on organic farming, Government of Sikkim. Sikkim Organic Mission. FS&AD and H&CCD Departments, Government of Sikkim.
http://scstsenvis.nic.in/WriteReadData/links/Sikkim%20Organic%20Policy%202015-401740061.pdf
Gupta, N., Pradhan, S., Jain, A., & Patel, N. (2021). Sustainable agriculture in India 2021: What we know and how to scale up. Council on Energy, Environment and Water. https://www.ceew.in/publications/sustainable-agriculture-india
Institute for Development Studies Andhra Pradesh (IDSAP). (2021). Impact assessment of APCNF: Consolidated 2019–20 report. https://apcnf.in/impact-assessment-of-apcnf-consolidated-2019-20-report/
Janker, J., Mann, S., & Rist, S. (2018). What is sustainable agriculture? Critical analysis of the international political discourse. Sustainability, 10(12), 4707. https://doi.org/10.3390/su10124707
John, D. A., & Babu, G. R. (2021). Lessons from the aftermaths of Green Revolution on food system and health. Frontiers in Sustainable Food Systems, 5, 644559. https://doi.org/10.3389/fsufs.2021.644559
Johnson, R. B. (2006). Sustainable agriculture: Competing visions and policy avenues. International Journal of Sustainable Development & World Ecology, 13(6), 469–480. https://doi.org/10.1080/13504500609469696
Khadse, A., Rosset, P. M., Morales, H., & Ferguson, B. G. (2018). Taking agroecology to scale: The zero budget natural farming peasant movement in Karnataka, India. The Journal of Peasant Studies, 45(1), 192–219. https://doi.org/10.1080/03066150.2016.1276450
Khurana, A., & Kumar. V. (2020). State of organic and natural farming in India: Challenges and possibilities. Centre for Science and Environment. https://cdn.cseindia.org/webinar/State-Organic-amit.pdf
McNeill, D. (2019). The contested discourse of sustainable agriculture. Global Policy, 10(S1), 16–27. https://doi.org/10.1111/1758-5899.12603
Meek, D., & Anderson, C. R. (2019). Scale and the politics of the organic transition in Sikkim, India. Agroecology and Sustainable Food Systems, 44(5), 653–672. https://doi.org/10.1080/21683565.2019.1701171
Ministry of Agriculture and Farmers Welfare (MoAFW). (2019). Zero budget natural

98 STATE OF INDIA'S LIVELIHOODS REPORT -2021
farming. New Delhi: Press Information Bureau, Government of India. https://pib.gov.in/PressReleseDetail.aspx?PRID=1593123
Narayanamoorthy, A, & Alli, P. (2019). Is zero budget natural farming working? Business Line. https://www.thehindubusinessline.com/opinion/is-zero-budget-natural-farming-working/article29410335.ece
Oberč, B. P., & Arroyo Schnell, A. (2020). Approaches to sustainable agriculture. Exploring the pathways towards the future of farming. IUCN EURO.
Pradhan, B. K., & Badola, H. K. (2008). Ethnomedicinal plant use by Lepcha tribe of Dzongu valley, bordering Khangchendzonga Biosphere Reserve, in North Sikkim, India. Journal of Ethnobiology and Ethnomedicine, 4(1), 22. https://doi.org/10.1186/1746-4269-4-22
Rizvi, R. H, Handa, A. K., Sridhar, K. B., Kumar, A., Bhaskar, S., Chaudhari, S. K., Arunachalam, A., Thomas, N., Ashutosh, S., Sapra, R. K., Pujar, G., Singh, R. K., Londhe, S., Nayak, D., Dogra, A., Choudhary, R., Dhyani, S. K., Rizvi, J., Vagen, T. G., Ahmad, M., Prabhu, R., & Dongre, G. (2020). Mapping agroforestry and trees outside forest (jointly published by the ICAR, Central Agroforestry Research Institute [CAFRI], Jhansi and World Agroforestry [ICRAF], South Asia Regional Programme).
Struik, P. C., Kuyper, T. W., Brussaard, L., & Leeuwis, C. (2014). Deconstructing and unpacking scientific controversies in intensification and sustainability: Why the tensions in concepts and values? Current Opinion in Environmental Sustainability, 8, 80–88. https://doi.org/10.1016/j.cosust.2014.10.002
Taneja, S. (2017). Sikkim is 100% organic! Take a second look. Down to Earth. https://www.downtoearth.org.in/news/agriculture/organic-trial-57517
Times of India. (2018). ‘100 per cent organic state’ Sikkim gets FAO award for best policies. https://timesofindia.indiatimes.com/india/100-
per-cent-organic-statesikkim-gets-fao-award-for-best-policies/articleshow/66219884.cms
Tripathi, S., Shahidi, T., Nagbhushan,S., & Gupta, N. (2018). Zero budget natural farming for the sustainable development goals, Andhra Pradesh, India. Council on Energy, Environment and Water. https://www.ceew.in/publications/zero-budget-natural-farming-sustainable-development-goals
United Nations. (1972). Report of the United Nations conference on the human environment, Stockholm, 5–16 June 1972. https://wedocs.unep.org/20.500.11822/30829
United Nations. (1992). Report of the United Nations conference on environment and development, Rio de Janeiro, 3–14 June 1992. https://www.un.org/esa/dsd/agenda21/Agenda%2021.pdf
United Nations Statistics Division Development Data and Outreach Branch (UNSTATS). (2021). SDG indicators, metadata repository. Department of Economics and Social Affairs, Statistics Division, United Nations. https://unstats.un.org/sdgs/metadata/files/Metadata-02-04-01.pdf
van Dijk, M., Morley, T., Rau, M. L., & Saghai, Y. (2021). A meta-analysis of projected global food demand and population at risk of hunger for the period 2010–2050. Nature Food, 2(7), 494–501. https://doi.org/10.1038/s43016-021-00322-9
World Commission on Environment and Development (WCED). (1987). Our common future. Oxford University Press. https://sustainabledevelopment.un.org/content/documents/5987our-common-future.pdf
Yekinni, O. T., Bamidele, T. O., & Ladigbolu, T. A. (2019). Gender dimension to organic agriculture involvement in Southwest Nigeria. African Journal of Organic Agriculture and Ecology, 1, 45–50. https://noara.bio/wp-content/uploads/2019/09/7.-Gender-Dimension-to-Organic-Agriculture-Involvement-in.pdf

Farmer Producer Companies: From Quantity to Quality
5
5.1 IntroductionFarmer Producer Organizations (FPOs) figure prominently in multiple policies, schemes and interventions as a means of improving the condition of small farmers in the country. Collectivization of thousands of small producers into such enterprises offers multiple benefits such as ability to negotiate better terms for bulk purchases and trades, pooling of resources and expertise for value chain activities such as aggregation, storage, transport and processing. collectives can also reduce risk and vulnerabilities of members, as was observed in the case of many peri-urban FPOs which were able to continue operations during COVID-19 lockdown, a feat which would have been very difficult for small individual individual producers. Furthermore, in cases where collectives also become established
Richa Govil and Annapurna Neti
as local institutions, they have the potential to significantly contribute to improvements in social equity as well.
The majority of producer organizations in the country are registered as cooperative societies (there are almost 2 lakh dairy cooperatives alone) and thousands are registered as societies (e.g., SHG federations). The Companies (Amendment) Act, 2002 (henceforth called the Producer Companies Act) introduced a new form of collectives, namely, producer companies.1 Producer companies can have only primary producers (or groups of primary producers) as members and they integrate principles of mutuality with the structure of a company. This chapter focuses exclusively on producer companies (PCs), more than 90% of which are Farmer Producer Companies (FPCs).
1. The Companies (Amendment) Act, 2002, introduced producer companies by incorporating a new Part IXA into The Companies Act 1956. In 2013, the 1956 Act was replaced with The Companies Act 2013, which specified that Part IXA of the 1956 Act will continue to be applicable to producer companies. On February 11, 2021, the Ministry of Corporate Affairs introduced a new chapter on producer companies (Chapter XXI A) into The Companies Act 2013 to replace Part IX-A of The Companies Act 1956.

100 STATE OF INDIA'S LIVELIHOODS REPORT -2021
As of March 2019, there were over 7000 PCs registered in India since the introduction of the Companies Act, a period of 16 financial years (Neti et al., 2019). In February 2019, the Government of India announced a scheme to promote 10,000 FPOs (DACFW, 2020; PIB, 2021; SFAC, 2019b).2 Subsequently, FPOs have also been included in other schemes relevant for farmers in the country, such as the Agriculture Infrastructure Fund (PIB, 2020) and the 2020 Farm Acts (now in process of repeal).
In parallel, over the last two years, the total number of PCs registered has more than doubled, from 7431 at the end of FY19 to 15,948 by the end of FY21. The PCs range widely in terms of their paid-up capital (PUC). Currently, there are companies which have over 1 crore in capital paid-up by members, and a large number of companies with hardly `1000 in PUC. There are districts with over 200 PCs and many districts with none despite the presence of a large number of agricultural workers. Many states have state level and multi-district federations, while others do not.
This ground reality and its variations across the country raises many questions. For example, are the large number of companies being promoted in the country consistent with the policy objectives of improving livelihoods of marginalized producers? In regions which are too remote for profitable market linkages, how does one achieve this objective? Similarly, in cases where small producers do not have enough savings to pool together to start business operations, how can these collectives start operations?
Recognizing the importance of farmer collectives in supporting the incomes and well-being of small farmers, the Government of India has introduced several policies and schemes to promote and support FPOs. These include: (a) Equity Grant Scheme, (b) Credit Guarantee Scheme, (c) Scheme for Formation
and Promotion of 10,000 FPOs, (d) Agriculture Infrastructure Fund, (e) recent Acts such as the 2020 Farm Acts, the updated Companies Act and others.
This chapter aims to make sense of some of the above ground realities and policies as we look at a future with thousands of FPCs operating in the country. We start with describing the current landscape of FPCs in the country, possible impact of recent policy changes and some thoughts for possible approaches for the future.
5.2. Current Policy Environment3
In the last few years, many government policies and schemes have been introduced for promoting PCs and supporting their growth. This section examines some of the key schemes and their implications for PCs.
5.2.1. Equity Grant Scheme Since 2014, Small Farmers’ Agri-business Consortium (SFAC) has been offering an Equity Grant Scheme to support FPCs, by providing a matching equity grant up to a maximum of `15 lakh in two tranches within a period of three years (SFAC, 2019a). Over the past seven years of the scheme’s existence, 735 cases have been sanctioned (SFAC, 2021a). Maharashtra has the highest number of cases sanctioned, at 144, followed by Tamil Nadu at 104 and Uttar Pradesh at 96 (Table 5.1). In terms of percentage of PCs covered, the national average stands at approximately 5%. Note that each tranche of grant sanction is counted as a separate case and, any individual PC which receives both tranches is counted twice. Thus, this percentage is an overestimate. West Bengal has the highest coverage, followed closely by Karnataka and then Tamil Nadu.
2. While the scheme includes collective enterprises registered as cooperatives, companies, societies, etc., this chapter focuses exclusively on producer companies.
3. This section is partly based on Govil and Neti (2021).

Farmer Producer Companies: From Quantity to Quality 101
State No. of PCs
No. of Cases*
Amount Sanctioned (`Lakh)
% of PCs**
Maharashtra 5216 144 999 3%
Tamil Nadu 917 104 815 11%
Uttar Pradesh 1858 96 521 5%
Karnataka 701 90 833 13%
West Bengal 667 87 444 13%
Madhya Pradesh 876 78 372 9%
Rajasthan 571 29 156 5%
Bihar 710 25 131 4%
All India 15,948 735 4822 5%
Table 5.1 Total Equity Grant Scheme Sanctions from its Inception until 31 March 2021, among States with More than 20 Cases Sanctioned
Source: SFAC Equity Grant Scheme Statistics, September 2021, and authors’ calculations.Note: * Since each tranche of sanction is counted as a separate case, any individual PC which receives both tranches would be counted twice. ** This is an overestimate due to double counting of some PCs as separate cases.
5.2.2. Credit Guarantee SchemeThe Credit Guarantee Scheme provides risk cover to banks which advance collateral-free loans to FPCs up to `1 crore. The maximum Guarantee Cover offered is restricted to 85% of the eligible sanctioned credit facility, or to 85 Lakh, whichever is lower (SFAC, 2019a). However, most PCs are not in a position to avail of this scheme due to undercapitalization. In the seven years since the inception of the scheme, a total of 183 cases have been sanctioned (SFAC, 2021b). Since a company can avail of the scheme in multiple instances, the number of cases do not correspond to number of companies. As shown in Table 5.2, only about 1%
Table 5.2. Guarantees under Credit Guarantee Scheme since Its Inception, for States with More than 10 Sanctioned Cases
State No. of PCs No. of Cases* Amount Sanctioned (` Lakh)
% of PCs**
Tamil Nadu 917 47 1911 5.1%
Maharashtra 5216 30 1308 0.6%
Madhya Pradesh 876 27 1014 3.1%
Karnataka 701 22 744 3.1%
Gujarat 353 16 326 4.5%
All India 15,948 183 6346 1.2%
Source: SFAC Credit Guarantee Scheme Statistics, September 2021, and authors’ calculations.Note: * Since each tranche of sanction is counted as a separate case, any individual PC which receives both tranches would be counted twice. ** This is an overestimate due to double counting of some PCs as separate cases.
of registered produce companies in India have been able to avail of benefits under the scheme, as of March 2021. FPCs in some states, such as Tamil Nadu, Gujarat, Madhya Pradesh and Karnataka have fared better.
5.2.3. 10,000 FPO SchemeThe most prominent recent scheme is the scheme for ‘Formation and Promotion of 10,000 Farmer Producer Organizations (FPOs)’ (henceforth 10,000 FPO scheme), announced in February 2019. The scheme committed `6866 crore for this purpose for a period of nine years, until FY28 (PIB, 2020, 2021; SFAC, 2019b). The scheme allocated `4496 crore for registering and supporting 10,000 new FPOs between FY20 and

102 STATE OF INDIA'S LIVELIHOODS REPORT -2021
BUDGETARY ALLOCATION FOR PROMOTION OF 10,000 FPOs
S. N. Components Unit
Cost
Budget for 1 to 5 years (2019-20 to 2023-24)
Budget for committed liabilities for 6 to 9 years (2024-25 to 2027-28) Grand
Total Budget
for 10,000 FPOs
year year year year year Total (1 to 5 year)
year year year year year
1 2 3 4 5 6 7 8 9
Number of FPOs Nos. 250 1000 2500 4500 1750 10000 NA NA NA NA NA
1 FPO Formation & Incubation Cost (10,000 FPOs) including CBBOs engaging cost
0.25/ FPO for 5
years
12.5 62.5 187.5 412.5 500 1175 487.5 437.5 312.5 87.5 1325 2500
2 FPO Management Cost 0.18/ FPO for 3
years
15 75 225 480 525 1320 375 105 0 0 480 1800
3 Equity Grant (10000 FPOs) 0.15 0 38 150 375 675 1238 263 NA NA NA 263 1500
4 Credit Guarantee Fund L.S 0 0 150 150 250 550 200 NA NA NA 200 750
5 Monitoring & data management/MIS Portal including cost of NPMA
L.S 5 8 10 10 8 41 3 3 1.5 1.5 9 50
6 Capacity Building through specialized Training Institutes
L.S . 3 3 3 3 12 3 3 3 3 12 24
Sub Total (1+2+3+4+5+6) 32.5 186.5 725.5 1430.5 1961.0 4336.3 1331.5 548.5 317.0 92.0 2289 6625.0
7 Supervision Charges, Other administrative expenses cost for NCDC and SFAC (@5%)
1.0 6.0 24.0 48.0 66.0 145.0 45.0 18.0 11.0 3.0 77.0 222.0
8 Education and 3 party evaluation by DAC&FW
0.0 1.0 2.0 5.0 7.0 15.0 1.5 1.0 1.0 0.5 4.0 19.0
Grand Total (1+2+3+4+5+6+7+8) 34 193.5 751.5 1483.5 2033.5 4496.0 1378 567.5 329.0 95.5 2374 6866.0
Table 5.3. Budgetary allocations under Scheme for Promotion of 10,000 FPOs(Unit: FPOs in Number and Cost in INR crore)
Source: SFAC (2019b).
FY24, and an additional `2370 crore in support costs until FY28 (Table 5.3). This is an important step as it has the potential to cover large number of small producers and enhance their incomes and livelihoods.
A close examination of the budgetary allocations described in the strategy document published by SFAC reveals that majority of the funding allocated under the scheme will directly go to promoting institutions and not the PCs. The funding intended for FPOs can be categorized into three broad categories: (a) funding for Equity Grant and Credit Guarantee Schemes, (b) budget for salary of CEO and accountant, (c) budget for registration charges, office rent, etc.
As discussed in the previous sub-sections, very few producer organizations are able to avail funds through Equity Grant and Credit
Guarantee Schemes and this category of funding remains elusive for most producer organizations. As mentioned above, the Equity Grant Scheme offers a 1:1 equity match to eligible PCs in two tranches, when they reach `5 lakh and `15 lakh PUC, for a total of `15 lakh matching grant within five years. Currently, less than 2% of PCs reach `15 lakh within two years and less than 4% reach the target within five years. And, only 735 PCs have received Equity Grants from SFAC, cumulatively during the seven years from 1 April 2014 to 31 March 2021, out of a total of about 16,000 PCs currently registered in the country. Eligibility for credit guarantees shows similar patterns: Very few companies meet the minimum eligibility criteria even after many years of operation. The 10,000 FPO scheme appears to ignore these experiences and realities and

Farmer Producer Companies: From Quantity to Quality 103
imagines 100% of the companies to reach `15 lakh PUC within two years.
Secondly, `1324 crore is budgeted for CEO salaries. The CEO role is often performed by resource persons deputed by promoting institutions. In most such cases, when the project funding ends, the deputed CEOs leave the PCs together with their accumulated learnings about strategic and operational matters. Lastly, the total budget available to FPOs for registration charges, office rent, furniture, etc., amounts to `240 crore.
In terms of operational aspects, the scheme envisions establishing new FPOs in a cluster model, using a one-district-one-product approach. Rather than interpreting one-district-one-product literally, NABARD has developed a block-wise promotion plan which includes multiple crops in some blocks. This retains the cluster focus, while accommodating multiple crops in regions where focusing exclusively on a single crop would not be suitable.
Furthermore, the scheme envisions that these clusters would enable a federated model such that multiple single-commodity FPOs can be federated at district, state or national level for better market linkages. While such models are suitable for certain produce (such as dairies), it is unsuitable for most cultivated crops. Therefore, it is important to bring in model diversity into the policy, to include other models such as a two-tier model (Govil et al., 2020) and other suitable ones as well. A two-tier model combines one market-facing company with multiple ‘supplier’ PCs with tight interlinkages, external funding, multi-commodity and value-addition (described further in the section 5.4.
Under the scheme, entities responsible for forming and registering FPOs are called Cluster Based Business Organizations (CBBOs). They are responsible for community mobilization, registration of FPOs and training of board of directors of the FPOs, among other responsibilities. Since PCs of small farmers lack adequate business expertise, they rely on CBBOs for expertise and business acumen. CBBOs are required to have technical expertise in three of the five following domains: crop husbandry, agri-marketing/value addition and processing, social mobilization, law and accounts, and IT/MIS (DACFW, 2020; NABARD, 2020; SFAC,
2020). They are also expected to have expertise in business plan creation and implementation. However, the requirements for empanelment do not extend beyond business planning and implementation. Nurturing a start-up business in its early years requires business acumen for identifying opportunities, strategy development and discovering suitable operating models. If CBBOs are not required to bring such expertise, it will be difficult for producer-owners to bring it in themselves. This is a significant oversight in the stated requirements for CBBOs in the policy.
5.2.4. Agriculture Infrastructure FundThere have been other developments in the policy environment for FPOs too. The recently announced Agriculture Infrastructure Fund, which makes `1 lakh crore available for post-harvest infrastructure development, explicitly makes FPOs eligible for the scheme. Although it is too early to assess its impact, in principle, schemes for developing post-harvest infrastructure have the potential to contribute significantly to the success of FPOs, since value-addition activities are crucial for generating better returns and improving producer incomes.
5.2.5. Other Relevant Acts and PoliciesOur interviews with producer-members of FPOs revealed many difficulties faced by farmers in convincing local bank and government officials of eligibility of FPOs for various farm-related schemes (Govil et al., 2020). The 2020 Farm Acts, which have been recently repealed by the government, had attempted one positive change for FPOs by explicitly mentioning eligibility of FPOs for trading in APMC-regulated commodities. In the absence of this clarity, some ambiguity remains in certain states.
Furthermore, the Companies Act of 2002 was incorporated as Part IX-A of the Companies Act 1956. In 2013, the 1956 Act was replaced with the Companies Act 2013, which continued to rely on Part IX-A of the 1956 Act. On 11 February 2021, the Ministry of Corporate Affairs introduced a new chapter on PCs (Chapter XXI-A) in the 2013 Companies Act directly and

104 STATE OF INDIA'S LIVELIHOODS REPORT -2021
replaced the Part IX-A of the Companies Act 1956. However, the new chapter does not bring in any significant changes in the provisions of the Act, except for bringing in regulatory clarity.
There is one additional policy which is of interest for PCs, namely the proposed Social Stock Exchange. The idea of Social Stock Exchange was proposed by the Finance Minister in the FY 2019–2020 budget speech and SEBI has formed working and technical groups to operationalize the idea. The Social Stock Exchange is being designed to enable for-profit social enterprises (and non-profit organizations) raise funds through different kinds of funding instruments and structures from socially-minded investors, such as impact investors, philanthropies and foundations, CSR funds, retail and commercial investors.
SEBI’s Working Group Report on Social Stock Exchange defines social enterprises as either non-profit organizations or for-profit enterprises with a declared intent to create social impact and a commitment to measuring and reporting such impact (SEBI, 2020). However, the guidelines do not mention FPOs as a form of social enterprises, despite FPOs being the most prevalent and legally recognized form of social enterprises in the country today. The Social Stock Exchange aims to enable social enterprises in the country to raise funds through many types of funding structures and instruments. Listing on the stock exchange would allow FPOs to raise funds from socially-minded investors and
overcome one of the biggest factors limiting their growth today, namely a lack of funding (Neti & Govil, 2021).
5.2.6. Summary of Policy Environment
In summary, the policy environment has progressively become more conducive for PCs with some recent policies filling small gaps in previous ones. For example, attempts are being made to recognize FPOs as eligible under various schemes and removing ambiguity. There is also an attempt to consolidate initiatives by various entities under one umbrella. However, a close examination of FPCs registered in the country during FY20 and FY21 shows that the focus continues to be largely on promotion of companies and several gaps remain, as discussed in the next section.
5.3. Current Landscape of PCs4
The total number of PCs registered in the country as of 31 March 2021 is 15,948. In the last two financial years alone (FY20 and FY21), a total of 8517 PCs have been registered, with more than the 7431 PCs registered in the previous 16 years combined (until 31 March 2019). The recent rush to register PCs is evident in the year-wise registration trend shown in Figure 5.1.
4. Parts of this section are based on Govil and Neti (2021).
Source: Authors’ calculations based on database compiled and updated by them as part of their ongoing study of Farmer Producer Companies in India.
until FY13 FY14 FY15 FY16 FY21
6043
24741834
91215021689
552497445
FY20FY19FY18FY17
6000
4000
2000
0
No. of PCs Registered
Figure 5.1 Number of Producer Companies Registered by Financial Year

Farmer Producer Companies: From Quantity to Quality 105
Out of the 8517 companies registered since the launch of the 10,000 FPO scheme, a maximum of 1250 could have been promoted under the scheme (as the budgetary allocation limit was only for 1250). Thus, the rest of the companies are being promoted by foundations, philanthropies, CSR and other institutions. There are possibly many self-promoted companies as well, similar to the promoter mix observed in the previous 16 years (Govil et al, 2020).
There is significant disparity across states in promotion and registration of PCs. In fact, the
Table 5.4. State-Wise Distribution of Producer Companies, for Top 20 States
StateFY04–FY19 FY20 and FY21 Total as of FY21
Number % of Total Number % of Total Number % of Total
Maharashtra 1972 27 3244 38 5216 33
Uttar Pradesh 751 10 1107 13 1858 12
Tamil Nadu 541 7 376 4 917 6
Madhya Pradesh 459 6 417 5 876 5
Haryana 305 4 464 5 769 5
Bihar 303 4 407 5 710 4
Karnataka 364 5 337 4 701 4
West Bengal 274 4 394 5 668 4
Odisha 363 5 271 3 634 4
Telangana 421 6 191 2 612 4
Rajasthan 374 5 197 2 571 4
Andhra Pradesh 242 3 324 4 566 4
Gujarat 183 2 170 2 353 2
Kerala 215 3 88 1 303 2
Assam 114 2 155 2 269 2
Jharkhand 133 2 121 1 254 2
Chhattisgarh 114 2 51 1 165 1
Punjab 56 1 24 0 80 1
Delhi 54 1 9 0 63 0
Himachal Pradesh 22 0 40 0 62 0
Other states 171 2 130 2 301 2
Total 7431 100 8517 100 15948 100
Source: Authors’ calculations based on database compiled and updated by them as part of their ongoing study of Farmer Producer Companies in India Table 5.5.Note: Although the Producer Companies Act was passed in 2002, the first PC was registered in FY04.
geographic skew highlighted previously (Neti et al., 2019) has worsened over the past two years. Previously, as of 31 March 2019, four states accounted for roughly half the PCs in the country, with Maharashtra accounting for 27%, Uttar Pradesh 10%, Tamil Nadu 7% and Madhya Pradesh 6%. Among the PCs registered in the last two financial years (from 1 April 2019 to 31 March 2021), just two states account for about half of the registrations, with Maharashtra at 38% and Uttar Pradesh at 13% (Table 5.4).

106 STATE OF INDIA'S LIVELIHOODS REPORT -2021
Source: Authors’ calculations based on database compiled and updated by them as part of their ongoing study of Farmer Producer Companies in India.
No. of PCs registered in last 2 years (FY20 and FY21)
10 or more >3 and <10 6 or less
FPC density as of March 2021
0910-4950+
It can be observed from the map in Figure 5.2 that marginal farmers in most aspirational districts (most of which fall in the light blue areas of the chart) are being left out of the push for collectivizing small farmers though PCs. The persistent geographical disparity runs counter to stated aims of the policy, to promote 1500 FPOs in aspiration districts of the country. Almost 300 PCs were registered in Ahmednagar district (Maharashtra) alone, while only one was registered in a district like Kanker (Chhattisgarh).
Such geographical disparity is not surprising as there are many enabling and constraining factors which influence the choice of location for promotion of producer collectives. In areas where producer groups or other forms of collectives are already present, communities may already be familiar with such forms of collectivization and their benefits, as well as with promoting organizations. Promoting institutions would also be familiar with local context, have teams and local networks in place. In cases where other FPOs already exist, promoting institutions, farmers and other stakeholders would also have familiarity with nature of FPOs and operational processes. Such positive externalities would inevitably lead to concentration of FPOs in certain regions and a dearth of FPOs in other areas.
Another way of examining the intensity of promotion efforts is by calculating an FPC density, namely, the number of FPCs per one lakh agricultural workers. Out of the total 15,948 PCs in India, 14,697 are FPCs, or just over 92%. If we divide the number of FPCs in the country, with the total number of agricultural workers in the country, we can calculate that on an average there are 5.6 FPCs for every one lakh agriculture workers in the country, as of 31 March 2021. This FPC density of 5.6 has more than doubled in the last two years (it was 2.6 as of 31 March 2021).
Significant variations can be observed across states: Among the states with more than 1 lakh agricultural workers (per Census 2011), Maharashtra has the highest FPC density of 19.3, followed by Haryana at 16.9 and Kerala at 14.3. In contrast, states such as Bihar, Jharkhand and Chhattisgarh have FPC density of 3 or less. Figure 5.3 shows the FPC density variation across states.
Figure 5.2. Number of Producer Companies Registered in FY20 and FY21
Figure 5.3. FPC Density (Number of FPCs per 1 lakh Agricultural Workers) as of 31 March 2021
Source: Authors’ calculations based on database compiled and updated by them as part of their ongoing study of Farmer Producer Companies in India.

Farmer Producer Companies: From Quantity to Quality 107
A similar pattern of exclusion can be observed in terms of women producers. Although the Operational Guidelines for the scheme state an intent to include women farmers/SHGs, the percentage of women-only PCs have declined from 2.7% among PCs registered in the first 16 years to 2.1% among PCs registered in the last 2 years. The Equity Grant Scheme requires at least one woman to be on the board and states a ‘preference’ for women as shareholders for eligibility. However, requiring only a single female board member does not guarantee participation of female producers in the company’s decision-making processes. Although one could argue that there might have been an increase in mixed-gender membership which is undetectable due to lack of gender-segregated membership data, the experience of mixed-gender collectives in India is not encouraging (Parida & Sinha, 2010). In the Indian context, the best way for ensuring women’s inclusion and participation is through creation of women-only collectives. The lack of progress on inclusion of women is concerning since approximately 37% of agricultural workers in India are women, per Census 2011.
In summary, there has been a tremendous intensification of efforts for registering registering PCs in the country, with the total number of PCs more than doubling in the last years. However, this intensification does not necessarily match policy objectives. Despite the policy objective of improving the livelihoods of small and marginal producers, the reality is that most companies are being promoted in agriculturally better developed regions and not in aspirational districts. This geographical disparity has worsened in the past two years. Similarly, the policy objective of inclusion of women does not seem to be reflected in the numbers of women-only PCs registered in the country.
5.4. Continuing Strategic and Operational Challenges In addition to the concerns related to coverage, inclusion and equity at an aggregate level, individual PCs continue to face multiple strategic and operational challenges. These include
inadequate access to equity and debt, lack of business acumen, unsuitable operating models, and weak shareholder protection, among others. In addition, there is a marked dissonance among stakeholders in their imagination of the purpose of PCs, which pulls the PCs in different directions and compromises their viability as business entities.
5.4.1. Capitalization and Access to DebtIn the absence of data on turnover, the financial health of companies can be studied by examining their capitalization. The median paid up capital of all PCs registered in FY20 and FY21 was `1.0 lakh as of Apr–May 2021 (the average was `2.1 lakh). A small number of PCs with very high PUC tend to skew the calculation of averages; therefore, median is a better measure of the health of typical PCs.
According to NABARD’s estimates, PCs need at least 3–5 lakh in equity to start trading and value-addition operations, and to be able to raise short and long-term debt. Among all
PCs Registered during FY18 and FY19(Paid-Up Capital Values as of Apr–May 2019)*
PC Registered during FY20 and FY21(Paid-Up Capital Values as of Apr–May 2021)*
Number of PCs registered 2746 8517
Number of states accounting for approximately 50% of registrations
3 statesMaharashtra (31%)Telangana (10%)Haryana (8%)
2 statesMaharashtra (38%)Uttar Pradesh (13%)
Median paid-up capital within 2 years of registration
`1 lakh `1 lakh
Total paid-up capital within 2 years of registration
`75 crore `181 crore
Total paid-up capital of top 1% of PCs within 2 years of registration
`14 crore(~19% of above)
`32 crore(~18% of above)
Percentage of PCs with paid-up capital ≥ `5 lakh within 2 years of registration
23% 18%
Table 5.5. Comparison of Key Characteristics of Producer Companies Regis-tered in Latest and Preceding Financial Years
Note: *Since PUC values change over time, the table compares the values at the end of each two-year period.

108 STATE OF INDIA'S LIVELIHOODS REPORT -2021
PCs, approximately 10% have crossed `5 lakh in PUC as of April–May 2021. Among companies registered in the last two years (FY20 and FY21), only 18% have PUC greater than `5 lakh. This is lower than the comparable proportion of companies registered in the preceding two financial years of FY18 and FY19 (Table 5.5), which was 23%. This is despite the fact that the median PUC remained the same across the two time periods.
Multiple factors could have contributed to this situation. Some of the reduction can be attributed to pandemic-related disruption in mobilization of promoting institutions’ teams and the worsened financial situation of producer households. However, pandemic-related issues have not affected the registration of companies, since more companies have been registered in FY21 during the lockdown than the previous three and a half years (Figure 5.1).
As mentioned above, the government has tried to address the capitalisation issue through the Equity Grant Scheme. However, very few companies qualify for the scheme: As of March 2021, less than 5% of the almost 16,000 PCs registered in the country have received matching equity grant.
Similarly, the other forms of funding, namely short- and long-term debt remain elusive: Only about 1% of all registered PCs have been able to avail of the credit guarantee scheme, as mentioned above. Banks and other lenders are also hesitant to lend to PCs with very low capital base and no assets (despite PCs now being included in priority sector lending rules).
In the absence of access to funding, PCs are getting registered but are unable to start buying inputs or procure members’ produce for trading or value-addition. This defeats the purpose of establishing PCs in the first place.
5.4.2. Lack of Business AcumenAny business start-up requires business acumen for identifying opportunities, strategy development and discovering suitable operating models. They face challenges in inculcating these skills or hiring those with business acumen necessary for establishing successful businesses.
Producer-shareholders in remote parts of the country do not have an understanding or an imagination or what is required for business success and rely entirely on the promoting institution for such expertise. However, as most promoting institutions themselves are grant-based organizations, they do not have capabilities for opportunity identification, strategy development, conversion of strategy into plans, etc. Thus, often the success of FPOs depends on serendipity and a ‘surrogate entrepreneur’ (Phansalkar, 2020), where an external resource person plays the role of the entrepreneur. However, very few FPOs and their promoting institutions are able to identify such individuals or develop such capabilities locally, leading most FPOs to struggle with the basics of establishing a business.
5.4.3. Unsuitable Operating ModelsMost PCs continue to be promoted in a stand-alone mode. The experience of almost two decades of PCs shows that there are significant drawbacks to this approach. Stand-alone companies have to fend for themselves in developing sound business strategy, securing adequate funding and talent, establishing stable operations, managing relationships with stakeholders, etc.
Recognizing this, the 10,000 FPO Scheme suggests a federated model where multiple single-commodity FPOs can be federated at district, state or national level for better market linkages, as mentioned above. While such models are suitable for certain produce (such as dairies), it is unsuitable for most cultivated crops. Unlike in dairies, for cultivated crops, the frequency of interaction of an FPO with members is limited to a few times a year, depending on the number of commodities covered. Therefore, their operations are ‘spiky’ which makes it challenging to maintain relationships federations due to large periods of inactivity. Thus, in these contexts, other models with tighter integration of multiple layers of companies may be more suitable, such as a two-tier model.
A two-tier model combines one market-facing company with multiple ‘supplier’ PCs with tight interlinkages, external funding, multi-commodity,

Farmer Producer Companies: From Quantity to Quality 109
value-addition (Figure 5.4). Such a model allows distribution of responsibilities between the supplier and market-facing companies based on their respective capabilities, with procurement, aggregation and primary grading handled by supplier companies and more sophisticated marketing activities handled by the market-facing company. The market-facing company acts as an assured buyer for the produce of supplier PCs, providing them operational and financial stability. If it has enough funding, it can also undertake delayed marketing, build a common brand, establish sales relationships with larger buyers and negotiate favourable prices, and engage
Figure 5.4. Key Characteristics of a Two-Tier Model for FPCsSource: Govil et al. (2020).
in capital-intensive value-addition to generate higher returns for producers (Govil et al., 2020). Thus, a two-tier model facilitates higher volumes, better utilization of resources as well as better business management processes and practices.
A multi-commodity two-tier model also enables companies to engage in more frequent transactions with members, contributes to higher volumes and improves producer loyalty by increasing PCs’ relevance in the lives of producers. An additional benefit of such an arrangement is that it relaxes the capital and talent requirements in supplier PCs and instead, concentrates them at the market-facing company.
MARKET-FACING COMPANYat block or district level
(Social enterprise or producer company)
Business acumen and capacity building1. Competent talent2. Clear business strategy and planning3. Advocacy on behalf of all group
companies
1. Business strategy and planning 2. Enable compliance and internal
governance processes3. Agricultural extension, technical
expertise and certification (e.g. pesticide-free, organic)
4. Accounting and financial management expertise
5. Capacity building of board of directors
- Community mobilisation
- Aggregation- Primary grading and
sorting
Individual farmers own shares in their respective supplier PC as well as the marked-facing PC
SUPPLIER PC 1(500+ members,
multi-commodity)
SUPPLIER PC 2(500+ members,
multi-commodity)SUPPLIER PC ...
- Community mobilisation
- Aggregation- Primary grading and
sorting
- ...
Owns s
hares
Owns sharesOwns
shares
1. Procure inputs in bulk2. Assured buyer with non-
exploitative pricing3. Link with govt. schemes (e.g.
procurement at minimum support price, loans under priority sector lending, equity matching and credit guarantee schemes and other subsidies)
4. Monitoring business processes
Finance and operations1. Raise external capital2. Delayed marketing and value addition3. Marketing and sales, under common brand; as
appropriate4. Link with govt. schemes, as applicable (e.g. storage
and other infrastructure, processing facilities, loans under priority sector lending, equity matching and credit guarantee schemes)

110 STATE OF INDIA'S LIVELIHOODS REPORT -2021
5.4.4. Weak Shareholder ProtectionMajority of shareholders of PCs which are promoted by government or philanthropic institutions are small and marginal producers.5 They tend to be less educated and have limited understanding of companies as legal entities and lack awareness about their rights and responsibilities as shareholders. Most small producers are unaware that they are financially liable for losses up to the full value of paid and unpaid share capital committed by them (Govil et al., 2020). Furthermore, they have neither the awareness of their rights to review company documents nor the language and other capability to understand the documents.6 This makes them vulnerable to intentional fraud or unintentional mismanagement and negligence.
The recent case of Sangam Milk PC, where the chairman was arrested for diverting funds and assets of the company for personal use, brought such vulnerability in sharp relief (New Indian Express, 2021). Contrary to the generally accepted transparency norms, the Articles of Association of the company included clauses assigning powers usually vested with the full board exclusively to the chairman (Sangam Milk PCL, 2013).7
Our interviews with producer organizations as part of our study also revealed instances where the board members were exposed to fiduciary risks and liabilities for their decisions, such as approval of related party transactions, that is, borrowing funds from ‘sister’ SHGs.
Such incidents highlight the risks faced by small producers with limited awareness and understanding of corporate governance and limited English language fluency, and call for stronger shareholder protection in PCs.
In addition to the above, there is one aspect which often does not get adequate attention: that of additional risk incurred by small producers by becoming part of such enterprises (‘adverse inclusion’). For example, there are many cases where promoting institutions and FPOs encourage farmers to switch to unfamiliar crops or to organic farming, without adequately assessing long-term risks such as fluctuations in export market prices, sensitivity to weather patterns and pest ecology, etc. In case such efforts result in losses, small farmers do not have financial protection against losses or other kinds of recourse. This is often a result of inadequate assessment of production, market and financial risks of new business opportunities, which requires sound business acumen and expertise.
5.4.5. Differences in Normative ImaginationMultiple stakeholders, such as government departments, social sector organizations, funding agencies and primary producers themselves, are involved in the promotion of PCs.
Our study showed that, small producers who have been ‘mobilized’ by promoting institutions to form a PC, do not view themselves as owners of PCs, but rather as commodity suppliers to PCs and beneficiaries. Most of them imagine FPCs as non-exploitative buyers and service providers, as part of welfare interventions of NGOs or governments. Furthermore, unlike shareholders in large exchange-traded corporates, producer–shareholders’ relationship with their companies is multi-faceted—the producers are providers of equity capital, suppliers to the company, buyers of goods and services from the company, its
5. NABARD estimates that 85% of the shareholders of PCs promoted by them are small and marginal farmers.6. While a few producer companies reproduce their documents in regional languages, most do not do so.7. Sangam Milk Producer Company started as a well-established cooperative known as Sangam Dairy and was converted
into a producer company in 2013. In April 2021, its chairman was arrested for forgery and diverting the assets and funds of the company for personal use. The company’s Articles of Association include a clause barring members from inspecting the company’s books or seeking information regarding its operations without permission from the chairman, rather than the board (which is the norm for producer companies). Similarly, the power to appoint directors to the board is vested with the chairman, whereas the usual practice is for it to be vested with the board.

Farmer Producer Companies: From Quantity to Quality 111
board members and, in some cases, even its employees. In the minds of producers, these complex multi-faceted interactions overshadow the primacy of their ownership role. This also limits the sense of ownership of the company among the producers. In our interviews, we found that even those producers who initially claimed that ‘this is our company’ later referred to the company as belonging to the government (‘govt. dairy’) or the promoting institution.
On the other hand, most socially minded promoting institutions (e.g., NGOs) and government departments view FPCs as vehicles for pooling beneficiaries under their income enhancement and farmer welfare initiatives. Some NGOs also hope that the FPCs grow into local institutions and contribute to larger socio-economic goals. Some promoting institutions and large farmers see FPCs primarily as for-profit business entities.
Thus, the stakeholders involved in promoting producer organizations have significantly different normative imagination regarding the purpose of PCs, ranging from non-exploitative buyers, service providers, vehicles for livelihood enhancement and farmer welfare to (merely) business entities. These differences in imaginations result in differences in priorities. For example, those who view FPCs primarily as business entities tend to prioritize business operations such as establishing trade relationships and securing funds for operations, whereas those who focus on their welfare role, prioritize linkage to government schemes for farmer welfare.
While these imaginations are not mutually exclusive, they do determine the sequence of activities taken up by FPCs, and influence the kind of regulatory mechanisms, internal governance systems and enabling ecosystem established to support them.
Thus, overall, PCs continue to face many challenges related to funding, business acumen, operating models, shareholder protection and normative imagination. They also face additional challenges related to meeting compliance requirements, which are on a par with any private companies (such as e-filing of forms, geo-tagging of office locations, etc.). And, while the recent policy environment attempts to address
some of these challenges (e.g., by providing funding for post-harvest value-addition), it does not adequately address many others (e.g., capitalization, lack of business acumen, unsuitable operating models, weak shareholder protection, etc.)
5.5. Summary In principle, the current policy environment appears to be conducive for PCs. However, in practice there are several areas of concern, related to the ways in which the promotion and support of FPOs is taking place on the ground. Moreover, the overall situation of PCs has not improved in the past two years: Challenges identified previously continue to persist, and in some respects, the situation has worsened.
First, as highlighted above, there is geographical concentration in registration of PCs in certain regions, leaving out the most disadvantaged groups and regions, such as aspirational districts. The inclusion of women in PCs continues to be minimal. In fact, both these measures of inclusion have worsened in the last two years. This runs counter to the purpose of the policies established to support PCs.
Second, capitalization issues have also worsened in the last two years: There has been a reduction in the percentage of companies which achieve PUC ≥ `5 lakh within first two years of registration, from 23% among companies registered in FY18 and FY19, to 18% among companies registered during FY20 and FY21. Very few PCs have been able to avail of the Equity Grant and Credit Guarantee Schemes in the last seven years. PCs continue to find it difficult to raise working capital and long-term debt due to weak balance sheets and have a limited track record of achieving stability and success.
Third, there is very limited direct funding for FPOs in the 10,000 FPO Scheme. The bulk of the direct funding for FPOs is in the form of Equity Grant and Credit Guarantee Schemes which very few PCs are able to avail. Most of the remaining funding is intended for promoting institutions, and CEO salaries (which usually go to an NGO resource person temporarily deputed to act as the CEO).

112 STATE OF INDIA'S LIVELIHOODS REPORT -2021
Fourth, despite the policy recommending a federated model of promotion, majority of FPOs continue to be promoted in a stand-alone model. Furthermore, very few promoting institutions are attempting multi-commodity and multi-layer operating models, such as the two-tier model described above, thus requiring each company to fend for itself and develop its own ecosystem.
Fifth, despite past experience with promotion of FPOs clearly demonstrating the need for strengthening the business acumen and expertise of FPOs, this continues to be a lacuna for the vast majority of companies of small producers. Only companies started by larger, well-educated and well-connected farmers appear to be able to overcome this hurdle, while most of those focused on small producers continue to struggle.
Put together, the above scenario paints a picture of a ground reality where the following broad conclusions may be drawn: 1. Despite the introduction of schemes and
policies for supporting FPCs, most PCs continue to struggle with starting, stabilizing and growing their operations
2. In many ways, the aggregate coverage and inclusion metrics of PCs have become worse in the past two years, making the broader policy aims of inclusion of marginalized groups elusive.
3. There has been a focus on rapid expansion of the number of PCs at the expense of establishing structures and mechanisms for business sustainability such as capacity building, capitalization, linking with government schemes, developing business acumen, sound management and strong internal governance.
In fact, the recent frenetic activity for promotion of thousands of PCs with low quality has several characteristics of an industry ‘bubble’. This increases the likelihood of instances of deliberate fraud or poor governance occurring with sufficient frequency to undermine the entire sector, thereby tainting one of the best means of improving the livelihoods of small producers.
5.6. Way Forward Despite the challenges and the current situation, PCs continue to be one of the best means to significantly improve the incomes and reduce vulnerability of small producers in the country. While there has been adequate progress in terms of collectivizing farmers (if the number of registrations of PCs is treated as a proxy), there has not been much progress in terms of enabling their success.
A path forward which aims to enable PCs reach their true potential should focus on: 1. Inclusion and coverage
2. Selection of suitable operating models
3. Infusion of business acumen and capacity building
4. Improved funding (equity and debt)
5. Stronger shareholder protection
Coverage and inclusion of small and marginal farmers in PCs should be one of the main priorities of any program for promotion of PCs. Such a focus would ensure that producers in aspirational districts, rainfed areas and/or predominantly Adivasi areas have the opportunity to benefit from collectivization and government mechanisms for supporting PCs. It is equally important to increase the proportion of women-only PCs.
As mentioned above, there are many advantages of promoting PCs in groups rather than stand-alone mode. Equally important is the selection suitable operating models (e.g., federated and two-tiered) depending on the commodities and the local context. For example, while a stand-alone model may be suitable for some peri-urban PCs focusing on sales of fresh organic vegetables, this model would be inappropriate for most PCs in remote areas. Thus, choice of an appropriate operating model is key for enabling business success.
Promoting PCs in groups also makes it easier to develop business acumen and expertise, and build capacities in operations, financial management and compliance in a cost-effective manner. The expense of hiring and retaining managers with strong expertise can be spread over a group of companies rather than a single

Farmer Producer Companies: From Quantity to Quality 113
one. Where possible, it would also be valuable to support such groups of PCs through social enterprise incubators which may be interested in exploring alternative models rather than conventional ones.
Currently the Companies Act does not allow PCs to receive investment from non-producers. It may be good to consider modifying the provisions in the Act to allow limited external investments while protecting small producers’ interests (e.g., through different class of non-voting shares and other mechanisms). Promoting PCs in a two-tier model can also help bring external investment if the top-tier market-facing company is registered as a private company rather than a PC. In such a situation, it would be important for the PCs to have substantial ownership of the private company to ensure that their interests are protected. Other methods for improving access to funds include re-examining the eligibility requirements for Equity Grant and Credit Guarantee Schemes, as well as enabling listing of FPCs on the proposed Social Stock Exchange.
1 DACFW. (2020). Formation and promotion of 10,000 farmer producer organizations (FPOs): Operational guidelines. Department of Agriculture, Co-operation and Farmers’ Welfare. Retrieved 24 May 2021, from ttps://agricoop.nic. in/sites/default/fi les/Operational%20Guidelines%20for%20Formation%20and%20Promotion%20of%20Farmer%20Producer%20Organizations%20%28FPOs%29-English.pdf
2 Govil, R., & Neti, A. (2021). Beyond promotion: Need for effective incubation of producer companies. XVI International Conference on Public Policy and Management, 23–25 August 2021, Centre for Public Policy, Indian Institute of Management Bangalore, Bangalore, Karnataka, India.
3 Govil, R., Neti, A., & Rao, M. R. (2020). Farmer producer companies: Past, present and future. Azim Premji University.
4 NABARD. (2020, November 19). Advertisement for empanelment of Cluster-Based Business Organizations (CBBOs) for Implementation of Central Sector Scheme for Formation and
References
As mentioned above, it is also imperative to strengthen shareholder protection in PCs since small and marginal producers have limited understanding of their rights and very few ways to protecting themselves in case of intentional or unintentional malpractice or losses. In parallel, it would also be beneficial to systematically inculcate a stronger sense of ownership of PCs among their shareholders.
Despite the current situation of PCs and the persistent challenges faced by them, they continue to offer the best means for improving incomes of small and marginal farmers, and enhancing social equity. Trends over the past two years have made it evident that there is an urgent need to shift focus (of policy and practice) from quantity to quality of PCs, from promotion to thoughtful incubation. PCs already cover millions of small producers and have the potential to benefit millions more. For such collectivization to be effective, PCs have to become inclusive in their coverage and must be supported to grow turnover and producer incomes.
Promotion of Farmer Producers’ Organizations (FPOs). Retrieved 15 May 2021, from https://www.nabard.org/ftrcontent.aspx?id=1734.
5 Neti, A., & Govil, R. (2021, August 26). Social Stock Exchange should allow listing of producer companies. Retrieved 30 August 2021, from https://www.deccanherald.com/opinion/social-stock-exchange-should-allow-listing-of-producer-companies-1023759.html.
6 Neti, A., Govil, R., & Rao, M. R. (2019). Farmer producer companies: Demystifying the numbers. Review of Agrarian Studies, 9(2).
7 Parida, P. C., & Sinha, A. (2010). Performance and sustainability of self-help groups in India: A gender perspective. Asian Development Review, 27(1), 80–103.
8 Phansalkar, S. (2020, January 22). How some FPC balloons can become durable high flyers—I. Retrieved 24 January 2020, from https://www.villagesquare.in/2020/01/22/how-some-fpc-balloons-can-become-durable-high-flyers-i/
9 PIB. (2021, March 23). Promotion of FPOs by SFAC. Ministry of Agriculture & Farmers

114 STATE OF INDIA'S LIVELIHOODS REPORT -2021
Welfare, Press Information Bureau. Retrieved 28 October 2020, from https://pib.gov.in/PressReleaseIframePage.aspx?PRID=1707020.
10 PIB. (2020, July). Union Minister of Agriculture and Farmers’ Welfare Shri Narendra Singh Tomar holds meeting with states through video conferencing. Ministry of Agriculture & Farmers Welfare, Press Information Bureau. Retrieved 17 April 2021, from https://pib.gov.in/PressReleaseIframePage.aspx?PRID=1637820 .
11 Sangam Milk PCL. (2013). Articles of Association of Sangam Milk Producer Company Limited. Retrieved from Ministry of Corporate Affairs.
12 SEBI. (2020, June 1). Working group report on Social Stock Exchange. Retrieved 1 September 2020, from https://www.sebi.gov.in/reports-and-statistics/reports/jun-2020/report-of-the-working-group-on-social-stock-exchange_46751.html.
13 SFAC. (2019a). Annual report 2018–19.14 SFAC. (2019b). Strategy paper for promotion of
10,000 farmer producer organisations (FPOs).
15 SFAC. (2020, September 23). Expression of interest for empanelling as CBBOs under Central Sector Scheme for formation and promotion of 10,000 FPOs. Retrieved 15 May 2021, from http://sfacindia.com/UploadFile/Statistics/Express ion%20of%20Interest%20for%20empanelment%20as%20Cluster%20Based%20Business%20Organizations%20(CBBOs).pdf.
16 SFAC. (2021a). Equity Grant Scheme. Retrieved 5 September 2021, from http://sfacindia.com/Equity_grant.aspx.
17 SFAC. (2021b). Credit Guarantee Scheme. Retrieved 5 September 2021, from http://sfacindia.com/Equity_grant.aspx#.
18 The New Indian Express. (2021, April 24). Dhulipalla arrested over Sangam Dairy ‘scam’. Retrieved 31 May 2021, from https://www.newindianexpress.com/states/andhra-pradesh/2021/apr/24/dhulipalla-arrested-over-sangam-dairy-scam-2294187.html.

Reshaping of CSR during COVID-19
6
6.1. IntroductionThis chapter essentially builds on the 2019 chapter in the SOIL report on five years of CSR practice and tries to assess and comment on how CSR has changed and how much of these changes will continue. However, it is important to also note the changes that have occurred since, as they will have a bearing on CSR thinking and practice.
6.1.1. Changes since 2019So what changes have occurred in the ecosystem since 2019 that have contributed to the reshaping of CSR? Undoubtedly, the biggest has been COVID-19, changing as it did almost aspects of human action. Hence, trying to analyse how COVID-19 reshaped CSR practice is completely relevant and useful, and most of this chapter will focus on this. But that was not all.
The Ministry of Corporate Affairs (MCA) also revised the CSR rules several times in response to COVID-19. This included allowing contributions to PM CARES, vaccine development, awareness on vaccines, etc., all of which happened between March 2020 and January 2021. In January 2021,
Shankar Venkateswaran
the MCA announced several new amendments covering a wide range of subjects, including acting on the recommendations of its High-Level Committee. Some changes of relevance include the following:1. Inclusion of expenditures on R&D for
vaccines, devices and drugs relating to COVID-19.
2. Introduction of the concept of an ‘ongoing project’ as a multi-year project for up to 3 years, thus recognizing the need for long-term interventions and allowing funds to be carried over from one financial year to another.
3. Clarity that expenses incurred in project design, implementation, monitoring and evaluation will be considered project expenditure rather than administrative expenditure (which carries a cap of 5% of total CSR spends).
4. NGOs wishing to receive CSR funding must register themselves on an MCA portal to become eligible to receive such funds.
5. Companies whose CSR expenses exceeds 10 crore in the 3 preceding years must obtain

116 STATE OF INDIA'S LIVELIHOODS REPORT -2021
an independent impact assessment for all projects costing more than Rs 1 crore.
The 2019 analysis drew a link between responsible business conduct and CSR, underlining the need to see this holistically. Early in 2019, the MCA issued the National Guidelines on Responsible Business Conduct (NGRBC), which again placed CSR in the context of larger business. This was followed by its companion disclosure framework, the Business Responsibility and Sustainability Report, which has since been mandated by the stock exchange regulator for the top 1000 listed companies from the financial year 2022–2023. Both are updates to earlier versions that have been around since the last decade.
6.1.2. Growing Importance of CSR The importance of CSR funding for development has been growing over the years, and there are three big reasons for that. First, it has increased the pool of funds for development beyond foundations, INGOs and governments. Second, several traditional Indian grant-making organizations (such as the Tata Trusts) are shifting to direct implementation and, hence, granting less. Third, FCRA rules are continuously being made more rigid, and the amendments in 2020, especially those relating to on-granting of foreign funds and limits on the proportion of administrative expenditure, further reduce the availability of such funds, particularly for small NGOs with limited budgets and proposal-writing capabilities. CSR disruptions therefore present a big challenge to NGOs and other development actors.
6.1.3. MethodologyIt must be remembered that the analysis presented here is a work in progress. COVID-19 has not gone away—India has been averaging just under 40,000 cases daily all August—and there are mixed opinions on whether there is a third wave just around the corner. MCA’s official CSR Portal does not have data for 2020–2021, and it is a moot point whether the classification of spends used till now will provide a good picture of which sectors have received CSR contributions.
In the absence of hard data, it was felt that the best way to understand how COVID-19 has reshaped CSR was to speak with some CSR heads of companies, NGOs that have been receiving CSR contributions in the past and research organizations. A checklist of areas to explore was created and sent out and responses were sought. Additionally, and where it was feasible, conversations were held with respondents to get their thoughts and views. These were then synthesized by the author.It may be noted that Chatham House rules were strictly followed, hence the views presented here are a synthesis of what the author heard from the respondents and are not attributable to any individual. The author takes full responsibility for every point of view presented here.
6.2. Getting on the Same Page on CSR The modern practice of CSR—understood as community development or corporate initiatives/investments in the community—has been a long tradition with businesses in India and predates the Companies Act of 2013. Driven (with some exceptions) largely by the owners, the CEO and the family, it is only in the last few decades that specialized departments and functions with experienced development professionals to plan and execute CSR have become the norm.
At its core, the practice of CSR in India was, and continues to be, about social and human development. It is about providing opportunities for the poor and marginalized communities to build a better and more sustainable life for themselves while remaining within planetary limits—the latter figuring in the equation relatively recently. Therefore, in terms of purpose, CSR has never been very different from the work undertaken by the other development actors—the state, NGOs, multilateral and bilateral agencies—but with some important differences.
One difference between the practice of CSR and development is that most traditional CSR practices can be best described as ‘welfare’ or giving a person a fish (with due apologies to the vegetarians). The more mature ones are now moving to the ‘empowerment’ mode, that is,

Reshaping of CSR during COVID-19 117
‘teaching a person how to fish’, which is about building capacities, awareness of rights and entitlements, and the agency to ask that they be provided. Very little is done in the space of ‘rights’, which advocates for and creates new entitlements where these do not already exist in law; this advocacy space is largely occupied by NGOs (they occupy the other two spaces too), with very few companies venturing there. The provision of rights and entitlements is done by the state, whose principal role is to provide and protect rights and right holders as well as to take remedial action when these are infringed.
A second difference is that CSR is aligned with company interests even as it meets community needs. For instance, CSR initiatives of manufacturing companies typically focus on the communities and the environment around their plants, attempting to mitigate the negative impacts that are inherent in manufacturing and seeking a ‘community license to operate’. Service companies, on the other hand, are usually location agnostic as they are relatively light on people, the planet and society. Further, this business alignment enables them to leverage their expertise and the expertise of their employees for better impact, as companies increasingly look for ways to provide volunteering opportunities to their employees, which not only brings their expertise to bear but is also an excellent way to attract and retain talent, as employees increasingly want to work with companies that care. In that sense, CSR initiatives have always had a business benefit component, sometimes described as enlightened self-interest; however, they are neither designed to make profits nor divorced from meeting the needs of communities they serve.
The Companies Act of 2013 changed this completely voluntary practice to a mandatory one. This Clause 135 of the Act, often referred to as the CSR Clause, evolved from the premise that companies in a post-liberalized India were not just engines of growth but also needed to contribute towards equitable development by leveraging their resources—funds, skills and competencies (organization and management, result orientation and efficiency focus, to name a few) to enhance the quality of development initiatives which were hitherto the domain of
government and NGOs. The latter was also given as the reason why the amounts that were to be set aside—2 per cent of the average profit before tax of the preceding three years—were to be spent as companies thought fit, within some parameters defined in the Act and, hence, were not to be considered a tax!
While the pros and cons of the CSR Clause continue to be debated, there is some consensus on some of its positive features, namely the following.• Board’s involvement: The roles of the
mandatory CSR Committee of the Board to approve and make public CSR policy, ensure activities mentioned therein are undertaken, the prescribed amount spent and reported on in the relevant format, along with the reasons for underspending, if any, have elevated the level of importance given to CSR.
• Public disclosures: The fact that a company is required to publicly disclose the composition of the CSR Committee of the board, CSR policy (covering projects, programmes and monitoring mechanisms) and report of activities makes intent, practice and outcomes more transparent to its stakeholders.
• Activities considered as CSR: These were listed as Schedule VII of the Companies Act (and amended from time to time) with a provision that they be ‘interpreted liberally so as to capture the essence of the subjects’ determined what activities are considered as CSR.
6.3. CSR Trends in Pre-COVID-19 Times—An Overview The 2019 edition of the SOIL report had a chapter titled ‘Five Years of CSR in India’. This covered the period 2014–2015 to 2018–2019 during which `64,000 crore (since updated to `71,500 crore) was spent by companies on CSR. In 2019–2020, the only subsequent year for which official data are available, an additional `21,900 was spent, bringing the total to about `93,500 crore over 6 years. A quick analysis suggests that the nature of CSR spends in 2019–2020 was similar to earlier years. Some of these are detailed below.

118 STATE OF INDIA'S LIVELIHOODS REPORT -2021
6.3.1. Compliance with the 2 Per Cent Requirement on the RiseThere has been a lot of speculation on how many companies end up spending the 2 per cent that is required by law. The data are somewhat mixed and unclear, but trends suggest that compliance is steadily on the increase. For instance, in 2014–2015, the number of companies that underspent was marginally higher than the number of those that spent 2 per cent more. In every year subsequently, this was reversed and, in 2019–2020, the number of compliant companies was 75 per cent more than those that spent less than 2 per cent. The number of companies that reported zero spends too has declined as a proportion, though the reasons for zero spends were not available.
The other interesting trend is that the number of companies spending more than the 2 per cent requirement has steadily increased over the years from 1701 in 2014–2015 to 6224 in 2019–2020. Further, these companies outnumbered those who spend exactly 2 per cent by a factor of 5.4 in 2019–2020. This is in stark contrast to the belief that after the CSR Clause came into being, companies reduced spending to stay at exactly 2 per cent.
6.3.2. Three Sectors Account for Most of the SpendFour sectors accounted for almost 85 per cent of total spends. These are as follows:• Education (including differently abled and
livelihoods), which accounted for around 38 per cent of total spend. Over the years, these have remained in the range of 32–42 per cent of spends.
• Health (including eradicating hunger, poverty, malnutrition, water and sanitation), which accounted for further 27 per cent. This has remained unchanged.
• Rural development and environment, which were around 10 per cent and 8 per cent, respectively, of total spend.
6.3.3. Third of Total Spends Are in Five StatesThere was also a skew when it came to states where CSR spends occurred. Five states accounted for about 34 per cent and these included (in descending order of spends) Maharashtra, Karnataka, Gujarat, Tamil Nadu and Andhra Pradesh. Of these, Maharashtra itself accounted for 15 per cent of total spends. Interestingly, some of these states also ranked reasonably high in terms of human development, suggesting that the focus of companies was driven more by where their operations were located than by states that had development deficits.
However, it must also be noted that several companies, especially the larger ones with a national presence, supported work across multiple states, which accounted for 38 per cent of total spends, but the break-up of this by state is not available.
6.3.4. Spending through NGOsIn terms of mode of implementation, most CSR initiatives are either implemented directly by companies through their own entities or through partner NGOs. Although data suggested that NGOs as implementing partners have become the preferred choice over the years, suggesting an increased trust between companies and NGOs, anecdotal evidence, mainly from NGOs, suggests that more and more companies are setting up their own implementing agencies. Be that as it may, there is no doubt that NGOs are very much in the mix as implementing partners.
6.3.5. Most Companies Individually Spend Very LittleMost companies end up spending very little on CSR. In 2014–2015 (when the CSR clause came into effect), 72 per cent of the companies that had reported CSR expenditure spent under `50 lakh each annually, while 14 per cent spent between `1 and `10 crore each. These proportions remained unchanged in 2019–2020, though the total number of companies that spent on CSR increased by almost 88 per cent.
This presents interesting possibilities. Companies with smaller spends will not be able

Reshaping of CSR during COVID-19 119
to individually support interventions that impact at scale, but they can fund smaller and innovative NGOs, provided they have the capacity to identify such opportunities. Alternatively, they could contribute to a pool of funds created by an industry association or an NGO, which can then invest at scale. There is a strong case to explore both of these options to enable effective use of these large number of small sums of money.
6.3.6. Limited Data on BeneficiariesData on the disadvantaged groups targeted by CSR programmes are rather scanty. This is largely because the prescribed reporting formats do not specify this, though there is reason to believe that companies do define these internally and track their performance. Mention is often made in CSR reports and conversation of women and children (including the girl child) and people with disability being priority. Also, this can be inferred from the nature of livelihoods programmes, which cover agriculture (hence farmers), handicrafts (hence traditional artisans) and so on.
6.4. Development Challenges Arising from COVID-19 To understand how COVID-19—the pandemic itself, the consequent lockdowns and their combined effects—impacted CSR thinking and practice, it is vitally important to highlight the development challenges that emerged and were accentuated, and the fault lines exposed by COVID-19. Development practitioners argue that many of these were all known but simply not invested in or cynically ignored. To companies, some of these were apparently new, but not to those who had invested in understanding these challenges as they strove to make their CSR interventions effective.
6.4.1. Health: Infrastructure and Human ResourcesEnough has been said about the inadequate public investments in healthcare in India (under
1% of GDP, which is lower than several BRICS countries, Sri Lanka and Nepal) and its model of privatization, which gives the poor almost no option but to either depend upon a creaky public health system or spend well beyond their means on private practitioners, making them ‘one illness away’ from destitution, as Anirudh Krishna’s book of the same name suggests.
COVID-19 cruelly exposed not just the weaknesses of public infrastructure—which bore the brunt—but also the inadequacy of doctors, nurses and paramedics who performed heroically despite being understaffed and with little support, financially and otherwise. While the first wave largely hit urban India which is anyway better endowed with health facilities, the second wave hit both urban and rural, and the effect of poor rural health infrastructure was visible to all.
What was less visible was how COVID-19 impacted the ‘frontline’ public health workers—ASHA workers, Anganwadi workers, ANMs (the AAAs as someone called them), sweepers, waste pickers—the list is endless. In fact, the AAAs are the first point of contact with communities in rural India but when the pandemic broke, they were ill-equipped in terms of knowledge, protective gear and protocols on how to deal with the situation. These were off the gaze of media and much of the corporate sector, more so in the second wave.
With much of the health infrastructure and resources being diverted to COVID-19, other health services that were provided by the public health system to the poor were compromised. This included immunization, maternal and child health, family planning, TB treatment, etc. Thus, not only was the health system overwhelmed by COVID-19-related issues, but it was also unable to provide the other services expected from it.
6.4.2. Migrant WorkersThat informal sector workers—that have no access to social security, job security, terrible conditions of work, etc.—constitute over 90 per cent of India’s workforce has been known publicly ever since the Arjun Sengupta report was published in 2007. That migrants constitute a sizeable proportion of the informal workforce was perhaps less widely known but the first

120 STATE OF INDIA'S LIVELIHOODS REPORT -2021
wave of COVID-19 brought this out most vividly, despite several attempts to downplay its magnitude. What makes migrants—and among them, women—especially vulnerable is simply the fact that they are far from home, isolated from their communities and completely dependent on the middlemen (and they are inevitably men) who brought them there for wages, housing and everything else. Because they are not local, many do not appear on muster rolls and so have no access to entitlements such as the public distribution system for food and facilities to deal with occupational health issues. And many of them are self-employed such as street vendors/hawkers, waste pickers and daily wage labourers.
To development practitioners, the issues faced by migrant workers is not new, and many NGOs have been working with them, both in the areas where they migrate from (referred to as source or sending areas/geographies) but also to where they migrate to (destination areas/geographies). NGOs have been trying to address issues related to working conditions, living conditions, occupational health and safety, wages, forced labour and so on but with sporadic success. COVID-19 yanked the cover off these somewhat hidden group and suddenly their plight became national news and has after a long time brought some hope of reform.
What was less understood but had a devastating effect was what happened in the sending areas when the migrants returned and stayed. Livelihoods pressures that triggered migration in the first place were accentuated because there simply was not enough work for everyone. NREGA therefore provided a significant cushion thereby underlying its importance as a means of social security. Local resources—drinking water, firewood, food, etc.—could simply not support the additional demands of this increased population that were forced to stay on longer than usual.
The migrant worker crisis seems to have caught corporate India completely unaware. Even though many people working in companies perhaps knew from personal interactions that much of any city’s services are provided by informal migrant workers, they did not seem to know how fragile their terms of employment were and were unfamiliar with their terrible living
and working conditions. COVID-19 completely changed that, judging from their response which will be discussed later. With few exceptions, companies also seemed unaware of the extent to which informal migrant workers formed a part of their supply chains, as few seem to have line of sight beyond their tier 1 suppliers. As will be discussed later, companies saw the migrant crisis from a food security lens, and this was reflected in their response.
6.4.3. LivelihoodsAt a broad level, it was apparent that many white-collared functions could be accomplished online, and jobs were generally well protected while others—which formed the bulk—that required physical contact could not function during the extended lockdowns; further, people engaged in latter types of jobs were naturally more vulnerable to contracting COVID-19 when lockdowns were lifted as maintaining physical distances was often impossible.
But the livelihood impacts of COVID-19 were far more complex than that. Some occupations which were inherently vulnerable have been completely wiped out, for example, street vendors, waste pickers, performance artists, bar dancers, restaurant workers, pastoralists, cobblers, barbers, artisans and weavers. Of relevance to companies is the fact that MSMEs that form the supply chains of the larger companies are a major employer, especially of informal labour, and loss of these livelihoods was a contributor to the reverse migration that was seen in the early days of the lockdown.
It is well known that migration out of rural India is essentially an economic response to the lack of remunerative and decent local livelihood opportunities in the source geographies. COVID-19 only highlighted the fact that this challenge remained unaddressed by state governments. Further, as migrants returned to their source geographies, not only did they did not find gainful employment (the often-criticized MNREGA was literally a lifesaver), but they also put extra pressure on natural resources such as drinking water, firewood and food.
It is generally believed that the first COVID-19 wave largely hit urban India and so agriculture

Reshaping of CSR during COVID-19 121
was not adversely impacted. Discussions with development practitioners suggested that this was not always the case. For one, lockdowns happened just as the rabi crop was ready for harvest but there were severe labour shortages. Moreover, with some mandis shut down and transport services impacted, small farmers found it very hard to sell their produce. And finally, April and May are the months when water harvesting structures are built and repaired, and seed procured for the main kharif crop—limited labour availability and supply chain disruptions adversely impacted these activities.
This livelihood challenge highlighted above was not on the radar of most companies. Those that worked in the source destinations or with some vulnerable groups such as artisans continued to do so but as will be discussed later, companies by and large did not recognize this challenge as something to address.
6.4.4. Children—Well-being and EducationThe consequences of shutting schools down as a response to COVID-19 has been well understood by all—development practitioners, companies and the government. For those children who did not have physical or financial access to smartphones or computers or the Internet—and these constitute the bulk—the impact has been catastrophic and, some argue, almost irreparable. Girl children continued to be further disadvantaged as they had the last right on the limited online resources available to a family. Restoring learning levels even to pre-COVID-19 levels, unsatisfactory as they are, is widely acknowledged as a huge challenge.
What is less widely known, understood and even acknowledged is the combined impact of shutting schools, limited physical interactions and lost livelihoods of parents on the well-being of children. Anecdotal evidence from NGOs suggests mental health of children is a cause for worry. Many experts believe that well-functioning schools prevent child labour, but with schools closed, combined with dropping incomes of parents, child labour is on the rise, as is child abuse and trafficking, particularly of girl children.
One of the most devastating outcomes of the second wave was that many young children were left with either one or no surviving parent. COVID-19 orphans will remain a huge development challenge for years to come and while the state has recognized this and responded, the number of cases of child trafficking and illegal adoption of children is a huge cause of worry.
Again, these challenges were familiar to development and education practitioners, and to companies that focused on education and children in their CSR. Other companies did recognize the impact of the digital divide on education but were unable or unwilling to do very much. Even fewer companies appeared to be aware of or focused on issues relating to mental health, trafficking, child labour and COVID-19 orphans.
6.4.5. WomenDevelopment practitioners recognize that the impact of COVID-19 on women is more significant and worrisome than what has been documented and acknowledged. Again, anecdotal evidence points to increased violence against women and girls, and with lockdowns in place, access to helplines was severely compromised and the ability to respond to calls of distress even more so. Further, workplace discriminations were magnified, and several studies have shown that fewer women were able to secure jobs after lockdowns. The perineal problem of unequal wages and poor work conditions for women continued and often became worse.
Perhaps less understood and researched is the fact that many of the frontline workers are women—the AAAs, nurses and a significant proportion of doctors and paramedics. These women had to deal with both their professional responsibilities and their household roles, causing immense stress. The fact that the AAAs were inadequately trained and equipped, as mentioned earlier, further accentuated this stress.
While some companies did recognize that women were disproportionately impacted by COVID-19, with a few exceptions, it did not significantly change CSR practice, as will be discussed later.

122 STATE OF INDIA'S LIVELIHOODS REPORT -2021
6.4.6. Other Marginalized Groups and IssuesVery little is known of the condition of marginalized groups such as the disabled and LGBTQs due to COVID-19 other than the fact that their isolation deepened, and lockdowns further prevented whatever limited services were available to them.
Apart from physical problems, COVID-19 also presented significant mental health problems and all the vulnerable groups identified in the above sections were affected. Apart from all the challenges faced by the AAS discussed above, mental health was mentioned anecdotally, but little documentation is available.
6.5. CSR Response to COVID-19How did companies respond to the development challenges that COVID-19 posed through their CSR interventions? In many cases, there was a difference between their interventions during the first and second waves. Several CSR practices changed, some positive and others less so, and these are discussed here.
6.5.1. Strengthening the Health SystemData show that the health sector receives the second highest CSR contributions after education. Thus, it was only natural that many companies pivoted their health CSR budgets to respond to COVID-19. Additionally, several companies who did not traditionally support healthcare also set apart some of their budgets for health. These were used in the following ways: • Procurement and provisioning of PPEs,
face masks, sanitizers and protective gear for frontline hospital staff and consumables and testing kits for hospitals, especially in the first wave. In a few cases where companies had a significant rural footprint, protective gear were also provided to AAAs.
• Installation of capital-intensive items like ventilators, etc., in both waves and oxygen plants and concentrators in the second wave.
In a few cases, companies supported the setting up of COVID-19 care centres and additions towards in government hospitals, mainly in the second wave.
• Innovations such as telemedicine and IT for health consultations with qualified doctors, though this was again not widespread.
• Creating awareness about and enabling vaccinations.
Interestingly, several companies that did not usually work in the health sector but used some of their CSR budgets as described above did so for the first few months of the first wave and then reverted to funding their traditional sectors.
The development challenge of strengthening the human resource base outside of the health institutions was apparently not on the radar of most companies. The AAAs identified earlier, who were the key frontline workers in the rural areas, remained less equipped in terms of knowledge and safety gear largely remained outside the purview of CSR funding. There were notable exceptions, of course, especially from companies that already had a significant rural footprint; some of them engaged women’s groups to produce face masks, etc., which were then provided to the AAAs.
6.5.2. Responding to the Needs of MigrantsAs was mentioned earlier, most companies were new to the plight of the informal sector in general and migrant workers and hence April and May 2020 were an eye-opener for them. Those that worked with NGO partners quickly responded to what they saw by funding the provision of hot meals, ration kits and, in a few cases, helping migrants with transportation support so that they could return home. By all accounts, companies that responded did so swiftly and flexibly, depending fully on their NGO partners to execute these interventions as well provide them regular updates on the changing needs on the ground. Their concern and empathy were palpable.
However, the CSR response, critical though it was, was essentially humanitarian and philanthropic, and did not address fundamental and structural issues that have affected migrant workers and informal sector workers for long.

Reshaping of CSR during COVID-19 123
Many migrant workers are part of supply chains and suddenly found themselves out of work, wages unpaid and unable to pay for food and rent. The conditions in which they lived was abysmal and this again was exposed. The complete absence of any form of social security became obvious as did their lack of access to their entitlements. Yet there are few examples, if any, of companies trying to address these basic issues. Companies may argue—and there is some merit in that argument—that providing support to workers in the supply chains may be construed as ‘normal course of business’ and hence disallowed as CSR. Whether companies will address this soft underbelly of human rights of workers in their supply chain as an integral part of responsible business conduct (the NGRBC explicitly mentions this) remains to be seen.
6.5.3. Increased Use of ITA big positive that emerged from the COVID-19 crisis was the increased deployment of IT solutions by companies. These covered two broad areas—partnership management and programme interventions. This was universally acknowledged, both by NGOs and companies.
Traditional CSR practice required NGO partners to provide regular progress reports, sometimes even quarterly, as well as submission of financial statements. This involved regular field visits by CSR staff, physical visits by auditors and other third-party service providers and so on, not unlike any donor. When lockdowns were announced and travel restrictions were enforced, many companies switched to online reporting, with some even creating portals where partners could file their reports and get feedback. Meetings became virtual and everyone quickly became comfortable with this new way of working. Of course, field staff continued their work in the communities, especially in rural areas where lockdowns were less severe, but safety was foremost in everyone’s minds.
Several education and skilling initiatives were slowly moving from a face-to-face model to a hybrid model anyway, leveraging the strengths that IT brought to these spheres. COVID-19 accelerated this move and to their credit, companies both led and supported this move. Reference was made earlier to increasing use of IT in healthcare, which again was accelerated
by COVID-19 with companies being willing allies. Companies that either ran or supported e-commerce platforms extended this to enable rural and peri-urban producers sell fruits and vegetables, artisanal products, etc. Awareness and programmes that were traditionally face to face pivoted quite successfully to Internet-based and modules were rapidly created and deployed. Use of IT also enabled greater employee involvement in these interventions, thus widening the skills and knowledge that could be deployed and hence benefiting students, while bringing significant gains to companies in terms of employee engagement.
6.5.4. Livelihood EnhancementLike many others, the livelihoods challenge faced by India’s poor predates COVID-19, and these were exacerbated by COVID-19. The migrant crisis only demonstrated the weak livelihoods base of the source geographies and highlighted how little had been done to address this. It also shone the light on the fact that many of the self-employed are in the services sector and their own livelihoods depends upon the income levels, and hence the livelihoods of their clients as well as permissions to operate when lockdowns were lifted: barbers, cobblers and restaurant workers.
The CSR response to the livelihoods challenge was somewhat muted. Companies that had CSR programmes in the source geographies found their investments to be not only extremely relevant but also inadequate, and their reduced budgets made it difficult for them to do much; how they will respond in a post-COVID-19 crisis era is yet to be seen but the importance of such interventions is well understood. Companies that invested in skilling programmes continued to do so and supported greater use of IT. As was mentioned earlier, attempts were made to address livelihoods of farmers and artisans in various ways, including leveraging IT, but the extent is now known. Little is known about CSR programmes aimed at supporting restoration of livelihoods of the self-employed.
The picture that emerges is that companies that were already invested in livelihoods continued to do so but additional resources were not deployed to this sector.

124 STATE OF INDIA'S LIVELIHOODS REPORT -2021
6.5.5. Supporting Marginalized GroupsAs far as children were concerned, most CSR interventions traditionally focused on education and this continued, using IT as the tool. Other aspects of children’s well-being have not really been seen as a CSR issue by companies and this continued during COVID-19.
As far as women are concerned, several companies traditionally identify them as an important target group and their interventions cover various aspects such as empowerment (typically through SHGs and literacy programmes including financial literacy), livelihoods (both skilling and enterprise) and girl child education. All indications are that except for the initial few months of COVID-19, these investments continued though they were scaled back both because funds were diverted to relief activities and reduced budgets as companies’ activities contracted. Again, IT was leveraged wherever possible to overcome the difficulties of making face to face interactions happen.
Companies that focus on disability too continued to do so after an initial pause. Very few companies appear to support work with LGBTQs, and it is not clear how COVID-19 affected these interventions.
6.5.6. CSR ManagementQuestions relating to what sectors to support, which target groups to focus on and where these interventions should be located are integral components of a company’s CSR strategy. These are typically deliberated upon by its CSR Committee and once determined are followed diligently. However, COVID-19 threw all of this out of gear—it was initially seen as a health emergency and while the first wave was largely urban, no part of the country was spared. Also, the specific needs on the ground were diverse and changed frequently.
By all accounts, companies responded swiftly in the first wave, especially in the first few months when the whole country was under lockdown and were quite flexible in terms of what activities they were willing to fund and where. This was particularly the case with companies that had
long-term relationships with grassroots NGOs whose information on ground realities they were willing to trust. Interestingly, some companies also reached out to NGOs they had not worked with before but given the newness of this relationship, indications are that they were less swift and flexible with such partners.
In the second phase, however, companies took longer to respond and were less flexible. Several explanations have been offered for this change. First, in the first wave, companies like everyone else had a limited understanding of how to respond and so they just reacted to what they were hearing from trusted sources, while in the second wave, they were better prepared to analyse requests for support. Second, the requirements in the second wave were more capital-intensive involving larger budgets, which by nature required more deliberation and this was also not within the core competence of their traditional NGO partners.
Several NGOs and companies mentioned that in the initial months of the pandemic, many companies were persuaded to contribute to PM CARES, facilitated by the notification that all corporate donations to this fund would be considered as CSR. This not only impacted the quantum of funds that companies could directly deploy for COVID-19 relief, in some cases, programmes already agreed with NGOs were either cancelled or their allocations reduced. The extent of this is not clear as data on total CSR funds to government agencies for COVID-19 relief in 2020–2021 is not available in the public domain.
6.6. COVID-19’s Impact on CSR Thinking and Practice So how did COVID-19 really change CSR thinking and practice, and which of these are likely to continue?
6.6.1. GeographiesAs was mentioned earlier, 5 states individually receive over a third of CSR spends and another 40 per cent is spent across multiple states. In

Reshaping of CSR during COVID-19 125
the case of manufacturing companies, these are typically concentrated around their plants both because the CSR section of the Companies Act encourages companies to work in their neighbourhoods and that companies recognize that they need to mitigate the negative impacts of their operations in order to obtain their ‘social license to operate’.
COVID-19 was essentially seen by companies as a disaster and as was stated earlier, several companies suspended their ongoing programmes and immediately supported the provision of general relief in the form of cooked food, ration kits, etc., and specific needs of COVID-19 such as PPEs and masks for individuals and consumables, and small equipment for hospitals and care centres. Because COVID-19 was not restricted by geography, companies were in the initial few months willing to go beyond their traditional geographies to where the needs were, on the basis of advice from their implementing partners and requests from various governments and their agencies. After the first few months, many companies went back to supporting their ongoing projects in their traditional geographies but continued to respond in a limited way to any relief requests from their partners in other geographies.
6.6.2. SectorsWhile several companies have traditionally responded to natural disasters, the pandemic saw a more widespread response than before. Several companies mentioned that supporting health interventions was a first for them and the limitations of the existing healthcare delivery system was a revelation. This was more exaggerated in the second wave when shortages of beds, ventilators, oxygen supply and other equipment were acutely felt, and companies were approached by governments and NGOs for greater financial support.
However, apart from these interventions which were in short bursts, most companies stayed with their sectors that they were traditionally supporting. In fact, some NGOs were disappointed that companies were unwilling to budge; for instance, an NGO that was working on water for agriculture from CSR
funds was unable to convince its corporate partner to support work on drinking water which became a challenge once migrants returned home from cities. Companies working on education, women’s empowerment, etc., reverted to ongoing programmes, innovating along the way to deal with the challenges that COVID-19 threw at them.
6.6.3. Target CommunitiesFrom a company point of view, COVID-19 threw the spotlight on new marginalized groups such as migrants and informal sector workers and frontline community workers like the AAAs. It also highlighted the vulnerability of more familiar groups such as women, children, the disabled and various occupational groups.
However, apart from providing relief to migrant workers, companies tended to stay with the groups that they were already supporting and did not foresee this changing going forward. It is yet unclear to both companies and NGOs as to how companies support migrant workers going forward, especially in their supply chains, as there is a sense that this may not be permissible under CSR rules. There are no indications that marginalized groups such as LGBTQs will get the attention of CSR practitioners.
6.6.4. Nature of InterventionsMost CSR budgets are deployed for what may broadly be termed as development interventions usually in a welfare mode, as opposed to disaster response. In the past, some companies have responded to natural disasters such as floods, cyclones, earthquakes and droughts, especially if these were near their operations. No separate budgets were set aside for disaster response, and existing budgets were repurposed to respond to this. The PM National Relief Fund was also a vehicle that companies used for such a response.
COVID-19 has made a few companies to think about disaster response as a separate vertical in their CSR strategy. Although this is still a work in progress, companies recognize that to be effective, there are some important building blocks such as speed of decision-making, flexibility/agility to respond to changing needs on the ground and the need to do this

126 STATE OF INDIA'S LIVELIHOODS REPORT -2021
without significantly affecting their ongoing programme budgets while staying within CSR rules. Indications are that this will be a part of a larger review of CSR strategy that several companies are thinking about in the light of COVID-19.
6.6.5. Implementing MethodsCompanies use a mix of their own implementing foundations or grants to NGO partners to implement their CSR priorities. In the case of natural disasters, companies also donate to the PM National Relief Fund.
COVID-19 response was different in two ways. First, donations were made by companies to the PM CARES fund, though there is information in the public domain as to how much this amounted to and so how significant these contributions were. The other was that many companies made direct contributions to government hospitals, usually in kind, to take care of shortages of safety gear, consumables and, especially in the second wave, capital equipment.
Indications are that these were responses to unprecedented challenges that COVID-19 brought and is unlikely to be the norm going forward.
6.7. Change in CSR RulesAll organizations contacted were asked what changes they would like to see in the CSR Rules in the light of the COVID-19 experience. There were some contrasting responses from companies and NGOs.
Companies were largely of the view that no significant changes were necessary; in fact, most felt that frequent changes were not helpful, and some stability should be the order of the day. A few did express some reservations about the new requirement of parking unspent funds in designated accounts annually after 3 years and felt that this might be a burden. Another suggestion was to relax rules for eligible NGOs since they play a significant role.
NGOs also felt that the issue of parking unspent funds could pose a problem. What they felt somewhat more strongly was that funding
capacity building and infrastructure of NGOs should be specifically allowed as CSR expenditure given the key role they played in responding to COVID-19, despite being poorly resourced.
6.8. Looking Ahead While many aspects of CSR practice will remain unchanged as discussed earlier, COVID-19 certainly has made many companies rethink their strategy and approach to CSR and indications are that these are being reviewed. Changes that are likely to be the norm going forward are outlined below.
6.8.1. Companies and Industry AssociationsGreater use of digital: Many companies and NGOs are of the view that the use of digital technologies is here to stay, both in managing programmes and implementing them. Some of these were already in the making before COVID-19, but sheer necessity accelerated the process of adaption and adoption. Education, skilling, literacy, etc., will be hybrid—a combination of face-to-face interactions between students and teachers/instructors and the use of digital content, with the latter getting more and more widely used. Awareness programmes too will be hybrid as communities have also become quite digital savvy. Telemedicine was seen with some suspicion but no longer. The list of applications is endless. Companies have also tasted success in using digital to market agricultural produce, handicrafts, textiles, etc., and this investment is likely to continue.
Migrants on the radar: There is no doubt that companies have become extremely sensitive to the plight of migrants and informal sector workers. Their response so far has largely been providing relief and, in some cases, and not necessarily because of a specific migrant labour focus, supporting livelihoods in the source geographies, rather than structural issues. That a few companies have begun to support interventions such as migrant resource centres and registration of migrants in government portals suggests that they may be more willing than ever before to include migrants as a target

Reshaping of CSR during COVID-19 127
community going forward, though much will depend upon the nature of proposals they receive from NGOs working with migrants and informal sector workers.
Increased sensitivity to health issues: While companies stayed with the sectors they were supporting pre-COVID-19, and health-related interventions in COVID-19 were more in the nature of an emergency response, there is reason to believe that they are more sensitive now to the deficiencies in the health system. It remains to be seen how many companies deepen and widen their health portfolio to include major structural and human resource issues that plague the sector but there is reason to believe that many more of them will look at health proposals they receive from partners more positively.
Deepening focus on livelihoods: Companies have traditionally supported livelihoods, be it in agriculture, skilling for jobs and self-employment, artisans, etc. COVID-19 magnified the importance of these interventions, including in the source geographies of migrants, and all indications are that this focus will deepen.
Greater recognition of the role of NGOs: The positive and credible role played by NGOs was largely recognized by companies and this should result in more and long-term partnerships between companies and NGOs. On the other hand, there is a perception that more companies are looking to set up their own implementation foundations. How these two counter trends will play out remains to be seen.
Aggregating CSR funds of companies with small budgets: As was mentioned earlier, a bulk of companies have CSR spends that are quite small and may not get spent optimally. Industry associations—local, state, regional or national—could set up a mechanism to aggregate these contributions from members and deploy them professionally on interventions that address local and national priorities.
6.8.2. NGOsLeveraging the goodwill: Many companies spoke of the positive experiences of working with NGOs during the pandemic. While this is often the case after any disaster, and often limited to relief work, the extended period of engagement
during COVID-19 has the potential to convert this into long-term partnerships. NGOs will do well to leverage this opportunity.
Providing solutions: Reference has been made to the several development challenges that have emerged and deepened during COVID-19, many of which were new to the corporate sector. The issue of migrants and the critical role played by frontline workers such as the AAAs are examples of this. NGOs would do well to go beyond highlighting these challenges to developing useful and practical solutions that they can advocate to companies, both as a part of their CSR but also, and importantly, as a way of running their business.
Strengthening IT capacity: With greater use of digital, companies must become more ‘digital-savvy’. They will have to strengthen their internal systems and processes of accounting, reporting, etc., to be able to respond more quickly and accurately to the needs of all their partners, both corporate and philanthropic. Further, NGOs will also have to start deploying IT tools in their programme work, not only to communicate with communities and staff on the ground but also in the delivery of programmes. NGOs that can quickly move in this direction are likely to have an advantage when it comes to CSR partnerships. This will require investments and so all grant proposals must include components that enable them to do this.
Aggregating CSR funds of companies with small budgets: Just as industry associations could create mechanisms to aggregate small CSR contributions, NGOs too could create such mechanisms and use their expertise to deploy these funds effectively.
6.8.3. GovernmentAmendment of CSR rules must be kept to a minimum as it takes a while for these to be understood, and disbursement usually comes to a standstill while companies and NGO try to understand its implications.
By and large, very little investment is made by companies in NGO capacities and the main reason is that this does not form a part of Schedule VII. Given the important role played by NGOs during COVID-19 (which was also

128 STATE OF INDIA'S LIVELIHOODS REPORT -2021
recognized by the NITI Aayog), such investments should become a part of the schedule as this will result in more efficient and effective CSR implementation.
The 3-year rule for NGOs to become eligible for receiving CSR funds may be reviewed as relaxing this requirement to 1 or 2 years will increase the number of eligible NGOs that companies can partner. Arguably, it is the capacity
of NGOs (see above point) that enables them to be effective, not necessarily the numbers of years they have been around, and companies should be allowed to make this choice.
While the January 2021 amendments were largely welcomed, there remains some confusion on the parking of unspent funds in the case of ongoing projects. This requires clarification.

Livelihoods Policies in COVID-19 Times
7
7.1. Introduction When I wrote this chapter last year, COVID-19-induced stress on livelihoods had already manifested itself in loss of jobs, income loss, deepening insecurities and the reappearance of hunger. Nearly 18 months have passed by. There seems to be almost no respite to that stress, and indeed an uncertain future is staring at the faces of millions of households in the country. The national and state governments have claimed to have taken several measures in ameliorating human conditions. However, the overall situation continues to be grim. Therefore, it is time to reflect on policies and programmes through the lens of their overall efficacy under the long shadow of COVID-19.
In the past, we have examined budget allocation in relation to programmes that have a direct impact on livelihoods. In the last SOIL report, we also looked at specific policy interventions in response to COVID-19-induced stress on livelihoods in terms of their coverage, continuity and impact. Our attention has mostly been on measures taken by the
Ashok Sircar
union government, as it bears the lion’s share of the Indian state’s efforts to improve as well as ameliorate livelihood conditions. As we continue to do the same this year, we will make attempts to capture specific measures taken by a few state governments that are noteworthy. Further, as in the past, our attention will be futuristic in trying to imagine effective pathways for addressing policy gaps.
To start with, an understanding of the scale and intensity of COVID-19-induced stress on livelihoods is called for. As the financial year of 2020–2021 began, the country went into a long COVID-19-induced national lockdown for more than two months. It meant a stoppage of all productive and remunerative activities. Workers lost their wages, self-employed people lost their incomes, and farmers and livestock growers lost market access. In contrast, as workers returned home, the demand for MNREGA work skyrocketed to an all-time high. The so-called ‘unlock’ periods from June to September 2020 did not mean much, as trains and buses did not operate, restricting people’s mobility, large gatherings were banned and the vast informal

130 STATE OF INDIA'S LIVELIHOODS REPORT -2021
sector employers did not open their shutters. The scenario can be captured in various data points, as Table 7.1 below shows.
While the period between March 2020 and September 2020 saw a decline in almost areas of livelihood activities, the biggest exception was agriculture. Due to the good monsoon, kharif sowing and eventually production did quite well, touching 144 million tonnes, and it provided reasonable relief to farmers and wage labourers.1 What was somewhat negatively affected was the horticulture crops, much of which faced the problem of transportation to reach the market.
The period between September 2020 and April 2021 witnessed the resumption of multiple livelihoods activities, particularly in agriculture as well as in self-employment. But incomes did not return to pre-pandemic levels. Azim Premji University’s analysis showed that the monthly per capita income came down from around `6000 to `3000 and later improved to just about `4500 in November 2020.2 Before the pandemic, 5 million people were lifted out of poverty each year for several years, but the year 2020 alone pushed 0.23 billion people to poverty, according to the same report.
The second wave of COVID-19 did not result in a national lockdown, so much of
the livelihood activities continued, albeit in a restricted way. The Rabi production did not suffer, but non- agricultural livelihoods activities did suffer due to low demand. Remittances, which support a significant section of the rural households, declined drastically, adding to the woes. Unlike 2020–2021, the budget allocation on MNREGA in 2021–2022 did not increase to provide additional work to demanding rural households. Mahesh Vyas, the CEO of CMIE, summed it up by saying that 97 per cent of Indians became poorer as a result of COVID-19 and lockdown-induced stress on livelihoods.3 Even as the economy is recovering, employment and wages are falling, and retail inflation is rising, indicating that the vast majority of people in India are still struggling to make ends meet.
The policies and programmes of the state are to be situated in this deeply disturbing context. The questions we should ask are as follows: (a) what is the overall policy framework of the government’s interventions in response to the continued stress in livelihoods? (b) to what extent it met with expectations of the people who suffered? And (c) what more can possibly be done? Our discussions in this chapter will follow these three questions.
Stress on Livelihoods during COVID-19 First Phase Reported by
01 0.122 billion jobs lost in April 2020 The Hindu, 7 May 2020 quoting CMIE
02 0.02–0.03 billion migrant workers lost job IDR 19 November 2020 quoting Chinmoy Tumbe and Amitabh Kundu
03 8.3 million new job cards were issued in MNREGA between April and September 2020, highest increase in seven years
IDR 19 November 2020 quoting Chinmoy Tumbe and Amitabh Kundu
04 0.0762 billion people worked in MNREGA during April–June 2020, a record of all times
https://www.indiawaterportal.org/articles /nrega-tracker-looks-schemes-performance
05 Decline in market arrival between 15 March 2020 and 31 May 2020 for 15 crops: 35%–65%
Ramkumar, Review of Agrarian Studies, 10(1) January–June 2020
06 Producers’ price index has crashed to one-third of the pre-pandemic level between March and May 2020
IPFRI note on July 2020 quoting Narayan and Saha
Table 7.1. A Few Indicators of Livelihood Distress Due to COVID-19 and Lockdown
1 https://agricoop.nic.in/sites/default/files/Web%20copy%20of%20AR%20%28Eng%29_4.pdf, p. 7.2 https://cse.azimpremjiuniversity.edu.in/wp-content/uploads/2021/08/SWI2021_Executive-Summary_August.pdf, p. 5.3 https://scroll.in/article/996028/97-of-indians-have-been-left-poorer-by-the-pandemic-says-economist-mahesh-vyas,
an interview with The Scroll on 29 May 2021.

Livelihoods Policies in COVID-19 Times 131
7.2. Budget ResponseThe central government’s intervention in rural livelihoods in normal times has three overarching components—infrastructure development (irrigation, watersheds, roads, cold storages, machineries, etc.), wage–loan–cash transfers and insurance. In addition, the National Livelihoods Mission is a programme which attempts to build community institutions to channelize credit towards skill building and micro-business opportunities. This apart, a large set of indirect support from the union and state governments manifests in the form of multiple subsidies—fertilizer subsidy for urea and DAP, electricity subsidy for irrigation pumps, government procurements of sugar, paddy, wheat, cotton and some other crops and others (Table 7.3).5
What does the budget allocation in 2021–2022 tell us? Two overall patterns are discernible. The
programmes such as PM Kisan and MNREGA received substantial rise in allocations from 2019–2020 to the revised budget of 2020–2021, in addition to fertilizer subsidy and government procurement of paddy. These allocations have a direct impact on ameliorating livelihoods condition—PM Kisan provides cash, MNREGA provides wages, fertilizer subsidy pushes up agricultural production and government procurement helps increase rural income. There is every reason to believe that such increases can only be in response to COVID-19 and lockdown-induced stress. At the same time, the trends almost completely reverse in the budget of 2021–2022, where PM Kisan and MNREGA, two big livelihood lifelines, witness either a drastic fall or no further increase in allocation. The Green Revolution, PM Sinchayee Yojana and National Livelihoods Mission did witness a good increase, but it was on top of a reduced
Table 7.2. Livelihoods Policy Response in Union Budget4
Actuals 2019–2020 (A)
Budgeted 2020–2021 (B)
Revised2020–2021 (C)
Budgeted 2021–2022 (D)
% D/C
MNREGA 71,687 61,500 111,500 73,000 –37
PM Kisan 48,714 75,000 65,000 65,000 0
PM Awas Yojana 24,964 27,500 40,500 27,500 –33
PM Fasal Bima 12,639 15,695 15,307 16,000 4.5
PM Gram Sadak Yojana 14,017 19,500 13,706 15,000 9
NRLM 9755 10,005 10,005 14,473 44
Green revolution in eastern areas 9895 13,320 10,475 1348 28
PM Krishi Sinchayee Yojana 8200 11,127 7594 11,588 45
Table 7.3. Government Subsidies to Support Agri-production and Procurement
Budget Item (In Cr.) 2019–2020(A)
2020–2021 Revised (B)
2021–2022(C)
C/B in %
Fertilizer subsidy (urea) 81,124 133,947 79,530 –40
Fertilizer subsidy (DAP) 54,755 94,957 58,767 –38
Government procurement of paddy in kharif (FCI and states together)
777.93 LMT 889.74 LMT Not declared yet
Government procurement of wheat (FCI and states together)
341.32 LMT 389.92 LMT 433.44 LMT 11
4 https://prsindia.org/budgets/parliament/union-budget-2021-22-analysis 5 https://prsindia.org/budgets/parliament/union-budget-2021-22-analysis

132 STATE OF INDIA'S LIVELIHOODS REPORT -2021
allocation in the revised budget of 2020–2021. There is actually no increase if one compares the allocation with that of 2019–2020. Fertilizer subsidy did show the same trend, with a drastic reduction in allocation. If one has to only go by the budget allocation, the central government did make a serious effort to address rural livelihood issues during the first wave but withdrew most of it during the second wave.
Some state governments tried to do their bit to respond to the livelihoods stress. For instance, Odisha presented a supplementary budget deploying additional resources to the extent of `2067 crore to Panchayati Raj, of which `1514 crore was for rural housing and `500 crore was for material components for MNREGA. In addition, Odisha also provided `1067 crore for food supplies at the rate of `1000 per household, as well as additional good grain supply at the rate of `1 per kg.6 Jharkhand started a supplementary food security programme for 1.5 million beneficiaries who are for some reason or the other excluded from the beneficiary list under the National Food Security Act (NFSA).7 Odisha also announced an urban employment scheme for the urban poor, aiming to benefit 0.5 million individuals. Similarly, West Bengal made the Public Distribution System (PDS) ration free for 6 months from April to September 2020. Rajasthan government decided to do a one-time cash transfer of `1000 to 1.578 million construction workers.8 A similar cash transfer of `1000 was announced for poor people who were deprived of livelihoods during the lockdown, particularly those people with no social security benefits. Eligible families would be selected through the Aadhaar database. Further, an additional one-time cash transfer of `1500 to needy eligible families from different categories was announced by Rajasthan. More information can be found on the state governments’ efforts in the next section.
Most of the measures taken up by state governments were post-budgetary allocations. State budgets were mostly done by February–March 2020, when the pandemic just started. State budgets of 2020–2021 did not therefore reflect any significant emphasis post-COVID-19 livelihoods response. Also, the general attention was on curfew, lockdown, isolation and so on. Some governments, such as Odisha and Jharkhand, did make a supplementary budget, but the majority of other states declared these programmatic supports as emergency measures. Interestingly, however, the states’ budgets for 2021–2022 did not reflect any substantive measures to respond to livelihood distress, while reports of joblessness, increase in poverty and overall drastic reduction in private consumption filled the media pages. Even the union budget for 2021–2022 did not reflect any significant recognition of the continued distress in livelihoods.
7.3. Specific Policy Response to Livelihood Distress Three types of responses can be identified from the various measures taken up by the union and state governments through 2020–2021. One pertains to food grains, the second pertains to direct cash transfers and the third refers to increased MNREGA allocation. A fourth type refers to various measures to support MSMEs with the hope that these will restart and continue operations which in turn can continue to employ labour, thus providing wages and incomes.
The current PDS arrangement covers nearly 0.8 billion beneficiaries throughout the country. This covers nearly 62 per cent of the current population of about 1.3 billion. Therefore, any provision for large masses of people can be channelled through this system. The latest such announcement was on 23 April 2021 that 5 kg
6 https://finance.odisha.gov.in/sites/default/files/2020-11/Peoples_Budget_Supplementary-2020-21_Eng_0_0.pdf, pp. 7–8.
7 https://www.hindustantimes.com/india-news/jharkhand-launching-food-security-scheme-for-15-lakh-people-uncovered-under-nfsa/story-fAkEUbD3xSGuHRIUESf1aI.html
8 https://prsindia.org/files/covid19/notifications/2623.RJ_Fin_Aid_1000_Construction_Workers_Apr%201.pdf

Livelihoods Policies in COVID-19 Times 133
of food grain would be made available for free to 0.8 billion beneficiaries under the PDS system for the month of May and June 2021, the peak period of the second wave (The Hindu, 2021). A similar provisioning was made in May 2020 as well. The union government declared to double the allocation for the same 0.8 billion beneficiaries for 3 months, that is, April, May and June 2020; the additional allocation was made available to
the beneficiaries for free.9 The state governments also did their bit—a compilation by Debesh Roy and others show the extent of state governments’ food grains provisioning, which in most cases were for 1–2 months with the exception of West Bengal, Odisha and Uttarakhand, which did for 6, 3 and 3 months, respectively (Table 7.4).
As can be seen, these were mostly additional food grains for free. Given that all of the surveys
Table 7.4. States’ Response to Livelihood Distress10
State Beneficiaries Provision Period
Kerala NFSA ration cardholders/people under quarantine/passengers stranded in the state
BPL families: 30 kg of rice with kit/those entitled to 2 kg of rice will get free 15 kg rice/hh and food kit (sunflower oil: 1 kg; coconut oil: 1/2 kg; salt: 1 kg; wheat flour: 2 kg; rava: 1 kg; green gram: 1 kg; black chana: 1 kg; tur dal: ¼ kg; mustard: 100 g; fenugreek: 100 g; coriander: 100 g; urad dal: 1 kg; chilli powder: 100 g; sugar: 1 kg; tea: 250 g)
One month
Delhi 7.2 million (including people without ration cards who need to apply online and rations to be disbursed on that basis)
NFSA ration with 50% more quantity (7.5 kg rice/wheat instead of 5 kg)
One month
Haryana NFSA ration cardholders NFSA wheat & rice, *mustard oil & 1 kg, sugar/hh
One month
Uttar Pradesh 6.5 million construction workers, AAY card holders (poorest), destitute old-age pension holders, PWD pensioners, daily wage labourers
20 kg wheat/hh & 10 kg rice/hh Two Months
Karnataka 38.3 million 5 kg rice and 2 kg wheat per person Two Months
Andhra Pradesh
14.2 million (beneficiaries already identified under the YSRCP last year)
1 kg tur dal, 4 kg rice per person, oil and salt
One Month
Telangana 8.75 million white ration cardholders, BPL, unorganized sector (beneficiaries were chosen based on a ‘comprehensive household survey’ held last year)
2 kg rice/person (double the monthly supply)
One Month
Bihar 16.8 million NFSA wheat and rice* One Month
Maharashtra NFSA ration cardholders 5 kg wheat and rice One month
Tamil Nadu NFSA ration cardholders 15 kg rice, 1 kg dal and 1 kg cooking oil/hh
One month
9 https://pib.gov.in/PressReleasePage.aspx?PRID=1621536 10 http://ebrary.ifpri.org/utils/getfile/collection/p15738coll2/id/133830/filename/134028.pdf

134 STATE OF INDIA'S LIVELIHOODS REPORT -2021
done by various agencies during COVID-19 clearly point out household food shortages to the extent of 40–70 per cent,11 this was certainly a desirable act. The good news is that the same article also points out that the delivery was done effectively, with 80–90 per cent families receiving the same. The union government extends its free food grains scheme up to November 2020 on the last day of June 2020 (The Hindu, 2020). This too was certainly a step in the right direction, as the CSE-APU survey round 2 reported that even during the September to November 2020 period, 60 per cent of surveyed responded were eating less than before.12
While such provisioning is certainly desirable, it is meant to avoid hunger deaths while leaving the households penniless due to the loss of paid work. Therefore, it is understandable that the union
government also took a few measures to provide cash to these households. These were as follows: 1. An upfront payment of `2000 as the first
quarterly instalment of PM Kisan in April 2020 to an estimated 0.087 billion farmers in April 2020, instead of releasing it in May end or June 2020.
2. 0.03 billion senior citizens, widows and disabled to get one-time ex gratia amount of `1,000 in two instalments over the next 3 months. This amounts to `3000 crore.
3. 0.2 billion woman Jan Dhan account holders to be given ex gratia amount of `500 per month for the next 3 months to run the affairs of their household. This amounts to `30,ooo crore.
4. Women in 0.083 billion families below poverty line covered under the Ujjwala scheme will get
State Beneficiaries Provision Period
Punjab 1 million (daily wagers and labourers)
10 kg wheat, 2 kg dal and 2 kg sugar One month
West Bengal 79 million 5 kg rice and 5 kg wheat per person Six months
Jharkhand NFSA ration cardholders 2 months ration in advance Two months
Gujrat 6 million 1 kg pulses/hh, 1 kg sugar/hh and 1 kg salt/hh
One month
Rajasthan 48 million NFSA ration cardholders
Wheat Two Months
Chhattisgarh NFSA ration cardholders, disabled, free single destitute and Annapurna ration cardholders
NFSA rice Two months
Odisha 2.6 million NFSA ration cardholders and 0.45 million State Food Security Scheme beneficiaries
3 kg rice, 2 kg wheat/person, oil Three months
Uttarakhand 2.3 million NFSA wheat and rice* Three months
11 For a compilation of such surveys, please see https://www.ideasforindia.in/topics/poverty-inequality/the-covid-19-crisis-and-food-security.html, Table I.
12 Quoted in https://www.ideasforindia.in/topics/poverty-inequality/the-covid-19-crisis-and-food-security.html

Livelihoods Policies in COVID-19 Times 135
free LPG cylinders for 3 months. Considering approximately `700 per Ujjwala cylinder, this amounts to `17,430 crore.
5. The Employees’ Provident Fund Organisation (EPFO) has announced that employees who contribute to EPF can withdraw up to 75 per cent of the account balance or 3 months’ basic salary and dearness allowance, whichever is lower. Of this, the first one, namely the cash
transfer under PM Kisan, is not an additional transfer, it’s just releasing it earlier than usual. So is the PF withdrawal facility, which is essentially withdrawing the accumulated money earlier than later. The LPG provision is strictly not a cash transfer, but it is intended to improve cash flow of poor households.
Before we go into looking at the efficacy of these interventions, we would like to mention that the biggest cash transfer provisioning was done in MNREGA, which saw a huge spurt in demand as non-farm rural and urban wage work and self-employed work almost completely collapsed. While the union budget for 2020–
2021 allocated `61,500 crore, considering the situation, the allocation was increased to `111,500 crore. As the year came to a close, a hopping 3.4 billion person days of work was generated, which was 31 per cent more than the previous year. During 2020–2021, 0.0165 billion new job cards were issued.13 However, a drastic reduction occurred in the budget for 2021–2022, reducing the allocation to `73,000 crore only. Table 7.5 provides a glimpse of the work demand and person days generated in 2019–2020, 2020–2021 and up to 30 August 2021 (Mukherjee, 2021).
Table 7.5 is almost self-explanatory. The work demand and work generated during 2021 is somewhat less than 2020, but still significantly higher than 2019–2020. Also, if we compare work demand for only July–August, we find that work demand is almost the same in 2020 and 2021, while work generated is less. Overall, this means that MNREGA demand is still very high, as corroborated by the fact that 70 per cent of this year’s allocation is already finished in five months!14
Table 7.5. MNREGA Work Demand and Person Days Generated: Change during the Pandemic Years
2019–2020 2020–2021 2021–2022 % Change between 2021 and 2020
% Change between 2021 and 2019
Households demanding work (in billion)
April 0.021 0.0134 0.0273 1.037 0.30
May 0.0247 0.0373 0.276 –0.260 0.1174
June 0.0254 0.0447 0.0351 –0.2148 0.1174
July 0.0185 0.032 0.032 –0.0025 0.7428
August 0.0145 0.243 0.024 0.0021 0.677
Person days generated (in billion)
April 0.3409 0.1416 0.2709 1.407 0.2584
May 0.3719 0.5696 0.3654 –0.347 0.0178
June 0.4523 0.6407 0.3195 –0.294 0.4177
July 0.3802 0.3911 0.1933 –0.0279 0.9673
August 0.1510 0.2603 0.1526 –0.4198 –0.0104
Source: Mukherjee (2021).
13 Standing Committee Report, 17.14 https://www.nationalheraldindia.com/india/over-70-per-cent-of-modi-govts-mgnrega-budgetary-allocation-for-fy-
2021-22-exhausted-within-five-months.
136 STATE OF INDIA'S LIVELIHOODS REPORT -2021
In this context, we must mention that a couple of states, such as Kerala and Karnataka, paid two months of MNREGA wages in advance. Tamil Nadu also paid 50 per cent of lost wages from March to May 2020.
7.4. MNREGA Performance by StatesLast year, the countrywide lockdown resulted in a massive return migration of workers to their home states. Since most economic activities were out of bounds, the demand for MNREGA increased substantially, thus calling for an additional allocation in MNREGA budget, which was done. The question therefore is how did the states fare in MNREGA performance in 2020–2021 in comparison to 2019–2020, and how does the 6 months of 2021–2022 look like? Table 7.615 compiled by the author from the MNREGA website provides some insights. The MNREGA portal gives a good amount of detailed and aggregate information, from which we attempted to understand the nature of the increase in demand disaggregated across states. We have therefore picked up a few parameters that closely proxy work demand due to COVID-19 and lockdown. We find the following: • In poorer states such as Bihar, Jharkhand,
Odisha, Assam, Uttar Pradesh and West Bengal, the number of individuals worked in MNREGA showed a massive increase of 1.5–3 million. This is shown in grey arrow.
• Surprisingly, even the relatively non-poor states such as Gujrat, Tamil Nadu, Kerala and Karnataka too have shown significant increase in individuals who worked on MNREGA, ranging from 0.5–0.8 million. This too is shown in grey arrow.
• Equally important to notice is that in several states such as Andhra Pradesh, Bihar, Assam, Gujrat, Haryana, Karnataka, Odisha, Uttar Pradesh, Madhya Pradesh, Chhattisgarh and West Bengal, individuals working on MNREGA have already crossed 65–70 per
cent of last year’s figure in just 6 months. This clearly reflects continuing rural income distress.
• In most states, however, the state average of number of days of work provided has not increased more than 5 additional days.
• Only states such as Andhra Pradesh, Kerala, Odisha and Tamil Nadu have been able to provide additional 6 or more days of work, on an average, in the last year. So the emphasis was to provide some work to more individuals, rather than combining it with more days of work. These are shown in Table 7.6 as
• At the other extreme though, many more states witnessed a substantial increase in number of HHs who got 100 days of work. These are Andhra Pradesh, Jharkhand, Kerala, Odisha, Rajasthan, Uttar Pradesh, West Bengal, Tamil Nadu and Telangana. The actual increase in 100 days of work for these states are shown as
• Some states such as Bihar, Assam, Gujrat, Haryana and Karnataka show a dismally low figure of the number of households getting 100 days of work provided in the year 2020–2021, while the individuals worked on MNREGA did witness a significant increase. Question therefore arises as to the overall state commitment on providing work under MNREGA in such a year of distress. Overall, its critical to note that the demand
for MNREGA works in rural India remains unusually high, as shown in the cases of 12 major states of India (marked*), where the demand seems to be almost doubled this year (2021–2022) in comparison to the normal year 2019–2020. This needs immediate policy attention.
7.5. Post-COVID-19 Cash/Benefit Transfers The efficacy of the post-COVID-19 cash transfer interventions can be measured in various ways. One can look at timeliness, coverage, usefulness, inclusion–exclusion errors, etc. For the sake of
15 Author’s compilation based on MNREGA ‘At a Glance’ data for states from https://nrega.nic.in/netnrega/home.aspx
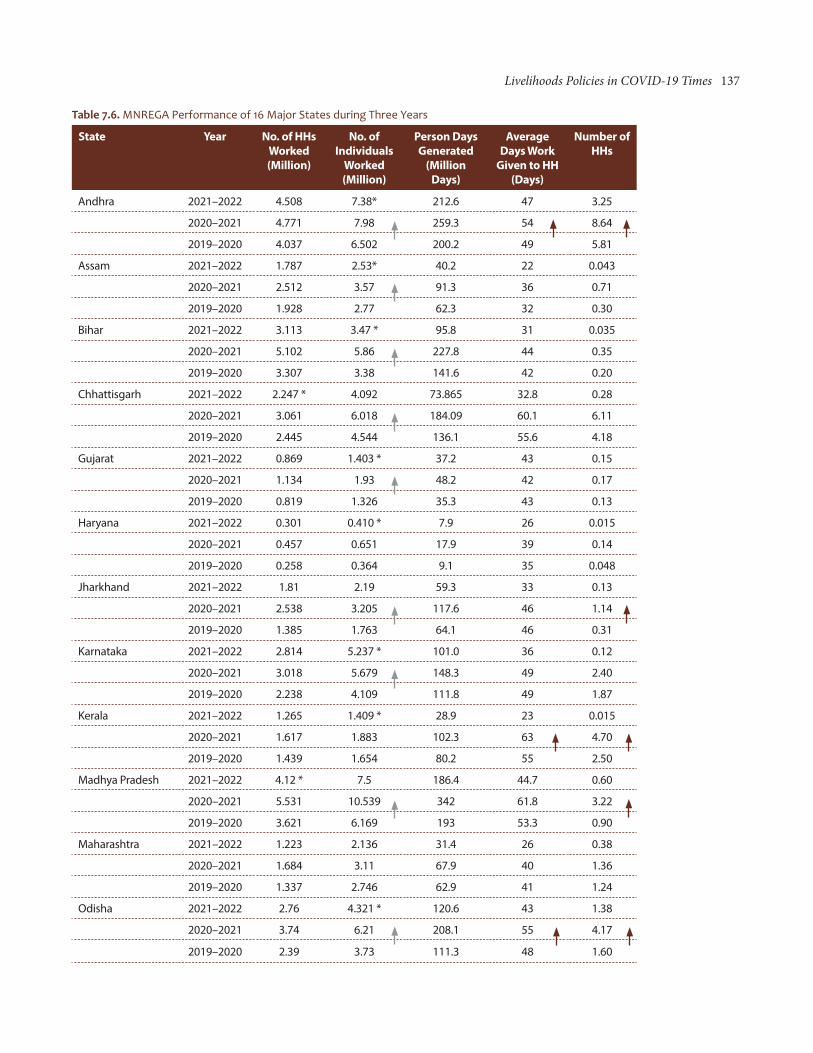
Livelihoods Policies in COVID-19 Times 137
Table 7.6. MNREGA Performance of 16 Major States during Three Years
State Year No. of HHs Worked (Million)
No. of Individuals
Worked (Million)
Person Days Generated
(Million Days)
Average Days Work
Given to HH (Days)
Number of HHs
Andhra 2021–2022 4.508 7.38* 212.6 47 3.25
2020–2021 4.771 7.98 259.3 54 8.64
2019–2020 4.037 6.502 200.2 49 5.81
Assam 2021–2022 1.787 2.53* 40.2 22 0.043
2020–2021 2.512 3.57 91.3 36 0.71
2019–2020 1.928 2.77 62.3 32 0.30
Bihar 2021–2022 3.113 3.47 * 95.8 31 0.035
2020–2021 5.102 5.86 227.8 44 0.35
2019–2020 3.307 3.38 141.6 42 0.20
Chhattisgarh 2021–2022 2.247 * 4.092 73.865 32.8 0.28
2020–2021 3.061 6.018 184.09 60.1 6.11
2019–2020 2.445 4.544 136.1 55.6 4.18
Gujarat 2021–2022 0.869 1.403 * 37.2 43 0.15
2020–2021 1.134 1.93 48.2 42 0.17
2019–2020 0.819 1.326 35.3 43 0.13
Haryana 2021–2022 0.301 0.410 * 7.9 26 0.015
2020–2021 0.457 0.651 17.9 39 0.14
2019–2020 0.258 0.364 9.1 35 0.048
Jharkhand 2021–2022 1.81 2.19 59.3 33 0.13
2020–2021 2.538 3.205 117.6 46 1.14
2019–2020 1.385 1.763 64.1 46 0.31
Karnataka 2021–2022 2.814 5.237 * 101.0 36 0.12
2020–2021 3.018 5.679 148.3 49 2.40
2019–2020 2.238 4.109 111.8 49 1.87
Kerala 2021–2022 1.265 1.409 * 28.9 23 0.015
2020–2021 1.617 1.883 102.3 63 4.70
2019–2020 1.439 1.654 80.2 55 2.50
Madhya Pradesh 2021–2022 4.12 * 7.5 186.4 44.7 0.60
2020–2021 5.531 10.539 342 61.8 3.22
2019–2020 3.621 6.169 193 53.3 0.90
Maharashtra 2021–2022 1.223 2.136 31.4 26 0.38
2020–2021 1.684 3.11 67.9 40 1.36
2019–2020 1.337 2.746 62.9 41 1.24
Odisha 2021–2022 2.76 4.321 * 120.6 43 1.38
2020–2021 3.74 6.21 208.1 55 4.17
2019–2020 2.39 3.73 111.3 48 1.60

138 STATE OF INDIA'S LIVELIHOODS REPORT -2021
simplicity, we will look at coverage and timeliness. The Times of India quoting an RTI enquiry found that by 28 May 2020, 0.095 billion farmers were paid the first instalment. The total number of farmers covered during the April–July 2020 was 0.1049 billion. Since it’s a scheme in which registration and renewal is concurrent, it is slightly difficult to make comparison. One finds that compared to 0.895 billion farmers who were paid the PM Kisan instalment in December–March of the FY 2019–2020, it rose to 0.1049 billion farmers in April to July 2020, dropping to 0.1022 billion in August to November 2020 and then slightly up to 0.1023 billion farmers in December–March of the FY 2020–2021. While the actual coverage in various states, as shown in the PM Kisan portal mentions 83–94 per cent of the registered farmers. In Chhattisgarh, Odisha and
Assam, these coverage figures were 75 per cent, 58 per cent and 39 per cent, respectively. And in Madhya Pradesh, the coverage was 103 per cent!
The year 2021–2022 saw some increase in the coverage of farmers as the first instalment reached to 0.1109 billion farmers, an increase of about 6 million farmers overall. One of the factors was that West Bengal joined the programme in this period, while for the entire erstwhile period, West Bengal ran a parallel programme called Krishak Bondhu paying Rs 5000 in three instalments from its own budgetary allocations. West Bengal alone added 3.591 million farmers to PM Kisan. Overall, the PM Kisan payments did cover between 0.1 and 0.11 billion farmers during this period.
Cash transfers using Jan Dhan Bank account of women presents a more interesting story.
State Year No. of HHs Worked (Million)
No. of Individuals
Worked (Million)
Person Days Generated
(Million Days)
Average Days Work
Given to HH (Days)
Number of HHs
Punjab 2021–2022 0.676 0.8 16.26 24.06 0.14
2020–2021 0.954 1.183 37.68 39.32 0.27
2019–2020 0.753 0.908 23.52 31.22 0.07
Rajasthan 2021–2022 5.57 7.39* 207.1 37 0.57
2020–2021 7.54 11.09 460.5 61 12.31
2019–2020 5.575 8.05 328.6 59 8.48
Tamil Nadu 2021–2022 6.16 7.107 * 178.6 29 0.07
2020–2021 6.649 7.85 333.9 50 1.78
2019–2020 5.649 6.489 248.5 44 1.20
Telangana 2021–2022 2.612 4.37 112.5 43 1.79
2020–2021 3.11 5.43 157.9 51 3.42
2019–2020 2.179 4.07 107.1 43 1.75
Uttar Pradesh 2021–2022 5.878 7.021 * 153.4 26 0.29
2020–2021 9.437 11.656 394.6 42 7.78
2019–2020 5.314 6.454 244.4 46 1.33
West Bengal 2021–2022 6.123 8.42 * 196 32 0.62
2020–2021 7.966 11.827 414 52 6.78
2019–2020 5.458 7.969 272.3 50 3.65
Source: Compiled by the author from MNREGA website https://nrega.nic.in

Livelihoods Policies in COVID-19 Times 139
First, it confines to 0.2 billion women Jan Dhan account holders. This referred to the 0.207 billion women (out of 0.38 billion accounts under Jan Dhan) who already had a Jan Dhan account as on 1 April 2020. It gives rise to four broad questions: (a) how much is 0.2 billion among poor women of India and/or poor households represented by women in India; (b) what will happen to the new accounts opened by poor women, after 1 April 2020 and (c) the probability of women not having a Jan Dhan account and (d) how many of the existing accounts may not receive any cash transfer due to technical issues?
In an article, Rohini Pande and others have tried to answer these questions (Pande et al., 2020). They show that among Jan Dhan accounts, 75 per cent are by poor women. They also point out that among the poor women as determined by financial inclusion survey 2018, only about 23 per cent have a Jan Dhan account. Most importantly, they calculate the probability of women not having the Jan Dhan account and found it to be staggeringly high—43 per cent for all poor rural households may not have a Jan Dhan account by the female member. And finally, nearly 20 per cent of the accounts opened under Jan Dhan are inoperative. In addition, the technical issues around cash withdrawal, access to banks and ATMs, etc., always exist.
However, with all these limitations, at a times when incomes have crashed, even whatever is received is always welcome. Therefore, the obvious question to ask is that did the money really come to the Jan Dhan accounts. The Dalberg survey conducted in April 2020 found that only 28 per cent of the Jan Dhan account holders received the money (Dalberg, 2020, p. 8), another survey done in May 2020 by a group of NGOs across many states found that 66 per cent of Jan Dhan account holders have got the money.16 Jan Dhan accounts regularly saw withdrawals of `2000 crore per week,17 which, for 0.2 billion customers, would mean a per capital withdrawal of `100 per week.
In relation to the two above, the experience of three free Ujjala gas cylinders to women for the period of April to September 2020 was not encouraging. Down to Earth, quoting several RTI queries, reports that in the same period only 1.62 refills per household have been obtained. During normal times, typically 3 refills are taken in a year, so 1.62 refills is no increase effectively in usage. The usage has gone up 1.76 refills per household by the end of December 2020.18 The same report also mentions that 3.1 million beneficiaries did not get the DBT associated with the Ujjala purchase due to technical issues up until September 2020. There are also significant variations in the actual uptake of cylinders—Madhya Pradesh at 2.38 and Chhattisgarh at 1.61 cylinders a year are indeed much lower than many other states which had an uptake of 3 cylinders a year or more. In contrast, Delhi showed an uptake of 2.6 cylinders for the same six months’ period from April to September 2020.
MicroSave in its two policy briefs19 highlights the challenges faced by the households in this programme. If the poor has to be supported by subsidized gas refills, one of the key supports is to provide the subsidy in cash in advance and not reimbursed later. During their first round of survey in May 2020, MicroSave found that only 58 per cent received cash in advance, which gradually improved to 75 per cent during their second round in September 2020. The second major issue is accessibility. In rural areas, the gas cylinder is not delivered at home, so an individual has to travel to the refill agency and bring back the cylinder on his/her own. This has two cost implications—one day’s wage/income loss, coupled with carrying cost of a 14 kg cylinder. Travelling 5–10 km costing `50–100, as well as day’s loss of wage amounting to `100–150, as found by MicroSave, works as a disincentive to access the refill cylinder. The IVR and SMS-based services pose the third challenge; among the respondents, 54 per cent of females and 69 per cent of males could read SMS, and 31
16 RCRC survey, as reported in IDR, https://idronline.org/is-jan-dhan-money-actually-reaching-people/ 17 https://www.thehindubusinessline.com/money-and-banking/covid-19-relief-jan-dhan-accounts-see-withdrawal-of-
over-2000-cr-per-week/article31735966.ece18 https://www.microsave.net/wp-content/uploads/2021/05/210528-PMUY-COVID-19.pdf19 https://www.microsave.net/wp-content/uploads/2021/05/210528-PMUY-COVID-19.pdf and https://www.
microsave.net/wp-content/uploads/2018/11/Pradhan_Mantri_Ujjwala_Yojana_A_demand_side_diagnostic.pdf

140 STATE OF INDIA'S LIVELIHOODS REPORT -2021
per cent of females and 44 per cent of males can write an SMS! Overall, the efficacy of 3 free gas refills as a COVID-19 response measure has been found to be modest and not substantive!
The government allowed partial withdrawals from the provident fund savings of the employees. There is no cash outgo in this from the union government, but simply providing a special window to withdraw one’s own savings (including employers’ contribution). The following data will provide a clear sense of what really happened.20 • 9.4 million employees’ claims were settled
by the EPFO during April–August 2020 compared to 6.4 million claims in same period in 2019.
• Around 55 per cent of EPF claims (5.2 million) were related to the COVID-19 special advance withdrawal window launched in April 2020.
• 75 per cent of the COVID-19 advance withdrawals belonged to workers earning less than Rs 15,000 a month.
• Partial withdrawal of EPF money doubled in April–August 2020 compared to same period last year.
• 35 per cent dip in final settlement of EPF money which takes place in case of no job or at the time of retirement.
• 7.2 million employees withdrew the COVID-19 special advance by the end of 12 May 2021 as reported by the Economics Times.21
• If we take total withdrawals from PF accounts from 1 April 2020 to 12 May 2021, it amounted to `125 lakh crore in comparison to `81,200 crore in the same period a year before. This was done by 0.035 billion employees having PF accounts, which is more than 50 per cent of all PF account holders.22
The numbers speak for themselves. Needless to say that those having an EPF account did
utilize this window to the maximum they could. It did not involve any financial outgo from the government though!
7.6. One Nation One Ration Card A specific programme which can be of enormous livelihoods support to migrant workers across districts and states of the country is portability of a person’s ration card to his/her workplace. Irrespective of the person’s home state/district, a migrant worker having a ration card should get his/her ration under the NFSA, 2013, in any state or district where she is currently working. This programme was announced in 2019 and prioritized under the Covid Livelihoods Policy response to complete its operation across the country by May 2021. Operationalization of One Nation One Ration Card (ONORC) is not easy. Food distribution system under the PDS is operated by the states; therefore, the cards are not uniform. Barring West Bengal, all states have one card for the entire family. The language of the card, the information contained in it, etc., are not uniform. But, most importantly, a migrant is often one or two members of a household, while others remain in the village or the town. Therefore, one can’t simply carry the card with him/her, even if he/she does, the ration shop owner in another state can’t read it. Operationalization of ONORC meant that Aadhaar seeding of all members of the family and to prevent corrupt practices, biometric authentication is introduced. That also required a specific POS machine to be installed in the ration shop which can do biometric authentication.
These technical and other issues have been preventing easy implementation of the ONORC
20 https://www.business-standard.com/article/economy-policy/epfo-settles-9-4-mn-claims-of-formal-sector-workers-since-covid-19-outbreak-120090801562_1.html
21 https://www.moneycontrol.com/news/business/economy/covid-19-impact-35-million-workers-withdraw-retirement-savings-worth-rs-1-25-lakh-crore-from-pf-accounts-6905581.html
22 https://www.moneycontrol.com/news/business/economy/covid-19-impact-35-million-workers-withdraw-retirement-savings-worth-rs-1-25-lakh-crore-from-pf-accounts-6905581.html

Livelihoods Policies in COVID-19 Times 141
system. In particular, the data show that interstate migrants are rarely using it, while intrastate, and specifically intra-district, transactions are more.
Table 7.7 illustrates the point. Table 7.7 captures the interstate ONORC data for the month of September 2021.23
Table 7.7. ONORC Data for Interstate Migrants for the September 2021
Number of Migrants Used ONORC System in the Destination State
Source States from Which Number of Migrants Have Come and Made Use of ONORC System
Destination state No. of migrants Source state No. of migrants
Delhi 68,619 UP 55,480
Haryana 11,333 Bihar 36,208
Maharashtra 6193 Madhya Pradesh 3654
Uttarakhand 3035 Haryana 2007
Gujrat 2444 Maharashtra 1182
Daman Diu 2246 Other states <1000
Uttar Pradesh 1579
Punjab 1012
J&K 1026
Other states <1000
Source: Author’s compilation from https://impds.nic.in/portal
23 Author’s compilation from https://impds.nic.in/portal
Table 7.8. ONORC Data for Intra-district and Inter-district Migrants within the Same State
States No. of Inter-district Portable
Transactions (Million) in
FY2020–2021
No. of Inter-district Portable
Transactions (Million) in 6 Months
in 2021–2022
No. of Intra-district Portable
Transactions (Million) in FY
2020–2021
No. of Intra-district Portable
Transactions (Million) in 6 Months
in 2021–2022
Andhra Pradesh 1.271 0.367 28.2 8.896
Bihar 0.336 0.372* 39 2.392*
Chhattisgarh 0 0.011* 0.210 0.250*
Gujrat 0.066 0.067* 0.200 0.187*
Haryana 0.076 0.076* 4.60 3.03*
Jharkhand 0.121 0.212* 0.006 0 ?
Karnataka 0.879 0.645* 7.060 4.519*
Kerala 0.559 0.266 8.667 3.894
Madhya Pradesh 0.455 0.295 3.654 1.990
Maharashtra 0.793 0.454 6.432 3.54
Punjab 0.008 0.011* 1.056 0.694*
Rajasthan 0.238 0.209* 16.790 9.325*
Tamil Nadu Neg 0.045 Neg 0.090
Telangana 2.571 1.414 1.376 6.209
Uttar Pradesh 1.047 0.772 1.172 6.338
Source: Author’s compilation from https://annavitran.nic.in/annavitranPortableiiRptFi

142 STATE OF INDIA'S LIVELIHOODS REPORT -2021
If we compare the same with September 2020, migrants from not a single source or destination state have crossed 1000 in the ONORC system, reflecting its infancy. This was true for the entire FY 2020–2021.
In contrast, the intra-district and inter-district portability has been used by relatively large number of migrants, as can be seen from Table 7.8. Table 7.8 captures the inter-district and intra-district portability transactions in 2020–2021 and 6 months of 2021–2022.24
The rows marked with *show significant improvement in access to ONORC system in 2021 in comparison with 2020. On the other hand, the major state missing in Table 7.8 is West Bengal, which has just started implementing the ONORC system after given the clear diktat by the Supreme Court of India in its order dated 11 June 2021. However, we can’t make a real assessment as to the number of migrants accessing the ONORC system in the absence of data of number of actual inter-district and intra-district migrants for this period.
7.7. Key Programmes Supporting Livelihoods For a few years now, emphasis on rural livelihoods, apart from cash–wage support, has shifted to agricultural insurance, micro-entrepreneurship and expanding the area of Green Revolution through two programmes, namely Bringing Green Revolution to Eastern India and Krishi Sinchayee Yojana. The efficacy of such programmes can be assessed through coverage and actual outcomes/benefits at the households or individual level. The latter is difficult to do particularly in the absence of robust empirical studies. Therefore, we choose to discuss the Pradhan Mantri Fasal Bima Yojana where the trends are clearly discernible.
The PM Fasal Bima Yojana was inaugurated in 2016. Agricultural insurance is not new; it started in 1972, and its coverage, design and benefits have expanded over time. The current scheme requires the farmers to pay 1.5 per cent of the premium for the Rabi season, 2 per cent for the Kharif season
24 Author’s compilation from https://annavitran.nic.in/annavitranPortableiiRptFi
Table 7.9. PM Fasal Bima Yojana Performance during Kharif Season of 2020–2021 and 2021–2022
No. of applications in 2020–21 (kharif;
in Million)
No. of applications in 2021–2022
(kharif; in Million)
Area coverage in 2020–2021
(in thousand ha)
Area coverage in 2021–2022
(in thousand ha)
Assam 0.834 0.605 576 310
Chhattisgarh 4.455 4.948 2091 1979
Haryana 1.626 0.742 1011 826
Kerala 0.042 0.046 22.58 20.6
Madhya Pradesh 4.452 4.705 7069.8 6382
Maharashtra 11.03 8.52 5936 4962
Odisha 9.459 8.112 1138 1010
Rajasthan 6.731 7.397 7346 6506
Tamil Nadu 0.62 0.142 203 43
Uttar Pradesh 2.232 2.14 1698 1550
Total for 10 states 41.481 37.367 27,091.1 23,588.6
Gujrat, Andhra Pradesh, Bihar, West Bengal, Telangana and Karnataka have opted out of PMFBY.
Source: Author’s compilation from Fasal Bima Yojona dashboard https://pmfby.gov.in/adminStatistics/dashboard

Livelihoods Policies in COVID-19 Times 143
and 5 per cent for all commercial crops, irrespective of seasons. The balance premium is paid by the state and central government in equal proportions, though in 2020, the central government reduced its premium share to 30 per cent. The risks covered are expansive, including localized calamities (loss from the occurrence of hailstorms, landslides or inundation affecting isolated farms in the notified area); post-harvest losses (up to a maximum of 14 days from harvesting) and mid-season adversity due to floods, droughts or prolonged dry spells (that reduce yield by 50%). Compensation to the farmer is linked to the shortfall in yield, that is, the difference between the threshold yield and the actual yield. The threshold yield, as announced at the time of launch of the scheme, was the average yield for a crop in a notified insurance unit over the past seven years (excluding a maximum of two calamity years), multiplied by the indemnity level (from 70% to 90%, corresponding to low, moderate and higher risk areas).
For loanee farmers, it was compulsory to take insurance, but from the last year it is now made voluntary. As Table 7.925 shows, the number of applications as well as the area coverage has reduced significantly after it became voluntary. Karnataka, Andhra Pradesh, Telangana, Bihar, Gujrat and West Bengal have come out of this scheme and started their own insurance schemes.26
International Food Policy Research Institute (IFPRI) has conducted a review of what is going wrong with the PMFBY programme. Its main findings are lack of an appropriate institutional mechanism to guarantee efficiency, transparency, coverage, coupled with inadequate awareness and lack of a grievance redressal mechanism. The current system is fraught with payment delays, lack of transparent information sharing with the farmers and lack of any grievance redressal mechanism. A specific contentious area is the crop-cutting experiment that determines the extent of loss or damage of crops. The manual system is fraught with corruption, inefficiency and opacity. IFPRI’s study also makes a few specific recommendations to improve the
functioning of PMFBY. The states which opted out from PMFBY
complained against high premiums being charged by the insurance companies and also complaints of opacity. West Bengal and Maharashtra introduced a model to ensure parity in insurance premium deposits and claim settlements. Put simply, if the insurance company has received the total premium deposit of `100 in a financial year, and its claim payment is more than `110, then the state government will compensate the company the amount excess of 110. Conversely, if the insurance company’s claim settlement payment is less than `100, it can keep another 20 per cent and return if there is any amount left out of `100. This means if its outgo was `80, it pays back the government nothing, if its outgo were `70, it pays back `10. Madhya Pradesh has also adopted this model now.
7.8. The Three Farm Acts The most debated recent policy on livelihoods is that around the three farm bills passed by the Parliament during September 2020. Not only it raised debates but also farmers across the country, and more particularly from Punjab and Haryana, have come out and launched a mass farmers’ movement against the three Acts asking for their withdrawal. Nearly 10 months down the line, the issue is still on the headlines. Therefore, a discussion on the three farm Acts is called for.
All the three Acts refer to lifting some of the existing controls on agricultural marketing. The premise on which these Acts were promulgated was that agri-products in the country are largely surplus and, therefore, state controls designed during the period, when agri-production was much less than the country’s needs, are largely irrelevant today. One of the Acts put in place in September 2020 aims to lift the restrictions on essential commodities. The union government has the power to declare certain commodities as essential to life and thereby assert control on its prices, trade and most importantly on stock. Hoarding of commodities declared essential
25 Compiled by the author from https://pmfby.gov.in/adminStatistics/dashboard for 2020 kharif and 2021 kharif for 10 major states.
26 https://www.ifpri.org/publication/when-implementation-goes-wrong-lessons-crop-insurance-india

144 STATE OF INDIA'S LIVELIHOODS REPORT -2021
is regarded as a criminal offence in Indian law. Typically, some of the food items such as paddy, wheat, maize, potato, onion, pulses and edible oils are in this list. The amendment to the Essential Commodities Act took out rice, wheat, potato, onion, tomato, pulses and edible oils from this list, thereby permitting traders to stock them as they please. The only restrictions remained was that those could be brought under the essential commodities category if their prices exceed certain limits (100% for potato, onion and tomato or 50% for pulses, sugar and rice wheat) or in a war or famine situation. However, for exporters, there will be no restrictions to stock the quantity they want.
In practice though, within a month of this Act coming into operation, onion was brought back into the essential commodities list, as its price went up by 107 per cent.27 Then again on 2 July 2021, and on 19 July 2021, pulses were brought back under the list of essential commodities.28 CMIE data show that in the past decade prior to passing the amendment in September 2020, potato, onion and tomato prices have exceeded by 100 per cent for 21 times, and pulses, edible oil, sugar and rice wheat prices have exceeded by 50 per cent for 48 times.29 This means price increase which would have called for such action has happened once in every 45 days!
The intrinsic logic of the amendment is also questionable. Price rise happens when there is shortfall in supply and that gives rise to hoarding to sell at a higher price a few weeks later. If a commodity is declared essential for the larger public good, there can’t be any logic to support the argument that exporters can continue to stock beyond the prescribed limit, while domestic traders can’t.
One other farm Act is about paving the way for contract farming. Contract farming started in India almost two decades ago, and the legal framework has unfolded across the country in
a gradual manner. It has not attracted potato, tomato, cucumber, basmati rice, edible oils, a few vegetables and fruits. While the model APMC Act promulgated by the union government in 2003 allowed contract farming, the states had to adopt it, as agricultural marketing is a state subject. Gradually over next 17 years, 19 states have amended their agricultural marketing acts to allow contract farming. The union government too brought a comprehensive model legislation in 201830 for contract farming and encouraged the states to adapt it. This legislation had provisions of a state-level authority to oversee contract farming, an institutional mechanism through APMC or otherwise to record every contract, legal binding on the part of companies and their agents to declare and record the contract with the agriculture department offices at the local level and, of course, a comprehensive grievance redressal mechanism including the authority of the court.
Surprisingly, the farm bill passed in September 2020 gave away much of the regulatory provisions of the 2018 model act. The provision of a state-level authority became optional, the need to declare and record the contract was done away with, grievance redressal mechanism excluded the authority of the court and left it to a low-level government bureaucrat. This amendment left the contract farming almost completely to vagaries of the market. We must mention here that the actual experience of contract farming has been largely good for the farmers, though the primary benefit to the farmers, a fixed price and a committed quantity, has largely accrued to the large- and medium-sized educated farmers having good irrigation facility (Singh, 2021). All over the world, contract farming takes place under a robust regulatory regime which ensures fairness, transparency and grievance redressal. There is no reason why Indians would not learn from them.
The third farm Act aims to do away with
27 Business Standard, The Hindu Business Line, the Economic Times, 24 December 2020. 28 https://consumeraffairs.nic.in/sites/default/files/file-uploads/essential-commodities-order/228077.pdf and https://
consumeraffairs.nic.in/sites/default/files/file-uploads/essential-commodities-order/228359.pdf29 Kishore (2020), quoting CMIE retail inflation data.30 This was called State/UT Agricultural Produce & Livestock Contract Farming and Services (Promotion & Facilitation)
Act, 2018.

Livelihoods Policies in COVID-19 Times 145
the APMC system altogether. It did not abolish APMCs, but it completely freed farmers from the requirement to sell their produce at APMCs. In doing so, the Act also debarred the states from collecting any revenue from such non-APMC transactions incurred by the farmers and traders, unlike APMCs. The Act also freed the farmer to sell anywhere and to anyone in the country and thereby lifted state boundary restrictions that existed in all the state agricultural marketing laws.
Apparently, this might look like a bold progressive move to have farmers access the market in the way they prefer and not remained tied in the chained relationships with APMCs, commission agents and other middlemen. The APMC Act in any case was going through dilutions starting from 2003, when a new model APMC Act was proposed and eventually many states adopted it. A further model Act brought in by the union government in 2017 did try to break the monopolies of the APMCs by creating provisions for new APMCs, kisan markets, online marketing platforms, etc. But a slightly deeper look presents us with a more complex picture.
It is well known that depending on the produce, 50–70 per cent of agricultural production anyway gets sold outsides APMCs, whose numbers are just about 8500 in the country. Therefore, empirically, there is nothing radically new on offer for the farmers. Second, there is little empirical evidence that removing APMC restrictions have price benefits to farmers. Bihar, for example, abolished APMCs in 2006. A study by the National Council of Applied Economic Research in 2017 found that the abolition of APMCs in Bihar has not led to any benefit at all to the farmers (National Council for Applied Economic Research, 2019, p. 70). The study in fact recommends return of the APMCs in Bihar. Maharashtra, for example, has removed fruits and vegetables from APMCs’ compulsory list in 2016. Four years later, it’s found that 305 APMCs have cumulatively made a business in fruits and vegetables an amount of `84,829 crore, while 60 private markets and 1165 licensed traders together have done `8360 crore worth of business in 2020.31 Kerala’s story is
even more insightful. Kerala never had APMCs in the first place. It’s a rice culture, but only 10–11 per cent of Kerala’s land is used to grow paddy. Kerala’s main produce are rubber, black pepper, turmeric, cashew nut, coconut, spices, etc. These are commercial crops, so it could be expected that large-scale infrastructure for private markets would have grown in Kerala. That, however, did not happen. Kerala’s 1076 panchayat markets and 214 municipal markets are all state controlled which handle bulk of the marketing and trade in these products (National Institute of Agricultural Marketing, 2010–2011, p. 15). Therefore, there is no guarantee that freeing the agricultural markets would automatically result in organized private trade in which farmers would benefit.
A more fundamental question has also been asked in this context. It’s known that agricultural marketing is a state subject, whereas trade and commerce is a concurrent subject. The three farm acts belong to the area of agricultural marketing which constitutes ways and means by which a farmer can sell his/her produce. Trade and commerce constitute trading and commercial activities done by individual and institutional players with agri-produce. Therefore, the union government does not even have the authority to make law on this.
7.9. Policy Response for the Urban PoorTypically, the urban poor constitutes households engaged in casual labour, a section of the informal sector workers, a section of the self-employed people and also a section of the formal sector workers. Urban poor is often located in specific localities; therefore, a more or less sharp spatial identification can also be made. Migrants constitute a significant section of the urban poor. The Periodic Labour Force Survey (2017–2018) has found that only 47 per cent of urban workers have regular, salaried jobs. Even among workers in formal employment, over 70 per cent do not have contracts, 54 per cent are not entitled to paid sick leave and 49 per cent do not
31 https://timesofindia.indiatimes.com/india/deregulated-apmcs-rule-in-maharashtra/articleshow/78630519.cms

146 STATE OF INDIA'S LIVELIHOODS REPORT -2021
have any form of social security benefits. These workers, who may not be identified as ‘poor’ as per the consumption data, are at grave risk of falling into poverty due to wage and livelihood losses triggered by shrinking economic activity (Bhattacharya & Roy, 2021, p. 6).
The first wave and the lockdown witnessed massive return migration from urban areas of the North, West and South India to the eastern and central parts of India. Answering a parliamentary enquiry in February 2021, the union government provided the data of 0.0114 billion migrant workers who returned home during the first wave and its aftermath.32 The Centre for Economic Performance of the London School of Economics did a study of the impact of the COVID-19 and lockdown in urban India and found the following:• Unlike many developed and some developing
economies, 52 per cent of urban workers in India went without work or pay and received no financial assistance to tide over the crisis.
• On average, earnings fell by 48 per cent in April and May, compared to pre-COVID-19 months of January and February. Financial assistance from the government or employers was available to less than a quarter of the workforce.
• COVID-19 exacerbated pre-existing labour income inequality—those in the top quartile of pre-COVID-19 income saw their share in total income increase by 16 percentage points within three months.33
We would like to state that that there was no sharply articulated policy response for the urban poor by either the union or the state governments. The supports under PM Garib Kalyan Yojana—extra ration, free gas cylinders, Jan Dhan and pension support—covered relevant rural as well as urban population. Desegregated data on how the cash and food transfer programmes under the PM Garib Kalyan Yojana fared are rare. The World Bank did a survey which can shed some
light on this. Layering a few additional questions on the CPHS survey conducted by the CMIE on 17 May and 31 August 2021 on 110,975 urban households, the study finds that between May and August, 69.1 per cent of the poor urban households in India have either received cash or food supply under the PMGKY. But only 21.1 per cent have received both. If only eligible (as defined for each component of the PMGKY) households are taken, the study found that 81.1 per cent of such urban households received food, while 34.3 per cent of such households received cash (Bhattacharya & Roy, 2021, p. 10).
The union government in its second tranche of support announced on 14 May 2020 a special working capital loan for street vendors to restart their business; the intervention aimed at supporting 5 million such vendors and providing liquidity up to Rs 5000 crore.34 But no data are available as to its actual disbursement! The union government also announced that it will launch a scheme for providing affordable rental housing accommodation for migrant labourers and urban poor. The scheme called Affordable Rental Housing Complex was launched in July 2020, and its operational guidelines were released.35 However, not much is known of its implementation.
Some of the states have come out with their own initiatives. Notable among them is Kerala’s urban work guarantee programme initiated 11 years ago, but it gained prominence during COVID-19 due to its impact on urban poor. The scheme is called Ayyankali Urban Employment Guarantee Scheme (AUEGS). It aims to provide 100 days’ work for willing urban dwellers on self-selecting basis. A willing worker has to register his/her name in the ward council of the municipality, and he/she is given a job card. The scheme is operated by the municipality, where works such as renovation of streams, ponds, wells, tree plantation, waste disposals and house construction (some 25 of them), are listed as
32 http://164.100.24.220/loksabhaquestions/annex/175/AU1056.pdf33 https://cep.lse.ac.uk/pubs/download/cepcovid-19-008.pdf34 https://www.bloombergquint.com/economy-finance/nirmala-sitharaman-live-finance-minister-to-unveil-second-set-
of-economic-measures-at-4-pm 35 http://arhc.mohua.gov.in/filesUpload/Operational-Guidelines-of-ARHCs.pdf

Livelihoods Policies in COVID-19 Times 147
permissible works under the scheme. However, as the data show, the house construction became the major provider of work. What is interesting though is that 89 per cent of registered workers for the scheme are women. In the initial 7–8 years, the scheme performed very poorly as can be seen from the data.36 Kudumbashree got involved in the scheme for the house construction programme in 2018–2019, which boosted its performance. About 0.226 million households were given job cards, which is about 10.4 of the households in the municipalities where AUEGS has been rolled out. An average of 23 days of work was provided in the year 2019–2020 (Chathukulam et al., 2021, p. 59). The performance of the scheme is not up to mark, but it showed a way how urban poor’s livelihoods can be supported by the state. Odisha, Himachal Pradesh and Jharkhand have now initiated their own version of an urban employment scheme in 2020.37
7.10. Financial Measures towards MSMEsThere are about 63 million MSMEs in India spanning rural and urban landscape, employing about 110 million workers as per the latest nationwide survey (Ministry of MSME, 2020–2021, p. 24, 26). During the entire period of COVID-19 and the different phases of lockdown under the first and second waves, these MSMEs suffered complete or near-complete breakdown due to shortages of supply, demand and workers. During the first wave, the workers returned to their home states, as there was no work. As the lockdown lifted, a section started coming back, and another remained at home due to multiple uncertainties. The owners–operators of the MSMEs too found themselves in a bind, as their supply chains were still broken, and the demand was still low. This continued through the second wave with the difference that since there was no national lockdown, the MSMEs operating with the states in terms of their supplies and market
could operate albeit at a lower capacity. The union government announced a series of
financial measures to be implemented through banks. These were as follows:• `3 lakh crore collateral-free loan with 100 per
cent credit guarantee• `20,000 crore subordinate debt for stressed
MSMEs• `50,000 crore equity infusion for MSMEs
with growth potential and viability• New definition of MSMEs—investment
limit revised upwards; additional criteria of turnover introduced
• No global tenders for government contracts up to `200 crore
• E-market linkage to be promoted as replacement of trade fairs and exhibitions
• MSME dues to be cleared within 45 daysAs one can see, the critical financial stimulus
is contained in the first three interventions which are to be done by the banks/financial institutions where MSMEs are supposedly linked for their long-term/working capital credit. The first question to be asked is what percentage of MSMEs are linked to banks or even registered with under any Act or authority? The latest round (the 73rd round) of survey reveals certain key realities in this regard. Only 31 per cent of the MSMEs are registered with some authority or under any Act; and 88 per cent of all MSMEs do not maintain any sort of accounts, and 84.6 per cent of MSMEs are own account enterprises meaning enterprises that are run without hiring any worker! (NSSO , 2018, pp. i–iv). The International Finance Corporation of the World Bank Group estimated that only 16 per cent of MSMEs access formal finance, while the rest depend on informal finances (IFC, 2018). The registration of the MSMEs have since the last NSSO round improved substantially after the introduction of the GST regime, which however does not provide any easy access to formal credit. Given this scenario, expectations of any significant impact from MSMEs-related announcements of relief are bound to be quite low.
36 Chathukulam et al. (2021, p. 60). This article takes a deep dive into the working of the Kerala scheme. 37 https://scroll.in/article/1003041/how-urban-employment-schemes-can-offer-social-security-to-the-poor-and-
empower-women#:~:text=Governments%20in%20Odisha%2C%20Himachal%20Pradesh,no%20special%20provisions%20for%20women

148 STATE OF INDIA'S LIVELIHOODS REPORT -2021
In this context, the study done by the International Labour Organization (ILO) on MSMEs in three states—Maharashtra, Uttar Pradesh and Tamil Nadu—is insightful. Uttar Pradesh has the largest number of MSMEs, numbering nearly 8.9 million, whereas Tamil Nadu ranks third with 4.95 million MSME units followed by Maharashtra having 4.78 million units. A total of 1525 owners and 3111 workers were surveyed over phone, which had its own challenges. The survey was conducted in Oct 2020, when the first wave subsided. With all the limitations of such a study, it reveals crucial insights into the working of the MSMEs, impact of government supports and coping mechanism of the workers in this units. Some of the insights are (International Labour Organization, 2021, pp. 72–73) as follows:• 65 per cent of the units started normal
operations, 14 per cent are still shut and 10 per cent are working only partially.
• 61 per cent did not apply or did not receive any support from the schemes announced, and 7 per cent applied, but there was no response.
• Only 9 per cent of the MSMEs in samples have accessed the credit line guarantee scheme, and 14 per cent have accessed the loan deferrals.
• 47 per cent of the MSME unit owners asked for interest-free or low-interest loans, and 35 per cent asked for temporary tax breaks or tax waivers. These percentages are not exclusive though. This is the only study available as regards
the coverage and impact of the MSMEs-related financial assistances announced in response to the COVID-19 stress. On the other hand, the study actually provides deep insights into the conditions of workers in the MSMEs which calls for an entirely different approach to addressing their livelihoods needs, instead of clubbing their needs with the needs of the MSMEs themselves.
7.11. Concluding Remarks Many discussions have happened about the nature and extent of the policy response of
the governments to address COVID-19 and lockdown-induced distress on livelihoods. The critics of the government have rightly pointed out that governments’ responses were minimalist, inadequate and poorly designed. I will point out more on the design elements as these often get less attention in comparison to money allocation.
First, the MNREGA. It’s now well known that as a result of end-to-end digitization, the autonomy of the gram panchayats, the primary implementor of the MNREGA programme based on Gram Sabha resolutions, has significantly diminished. The pace in which any crisis response must work must exceed usual bureaucratic pace. In case of MNREGA, this would mean providing the gram panchayats with more autonomy to decide and execute works under MNREGA. Also the labour material norm needs to be adjusted to the needs of crisis response for which a calibrated guide must be provided. The reason for the average number of days per household remaining at the pre-COVID-19 level is because adherence to the same bureaucratic norms and processes of decision-making and execution.
Second, the actual person days worked in six months of 2021–2022 in many states are a sharp pointer to the fact that severe distress still continues in rural areas, which calls for additional resource allocations at least for some states. One need not think that distress levels are same in all states, so selective additional allocation is called for.
Third, urban response. The shear absence of an imagination of urban livelihoods response is striking. The typical livelihoods response has taken three routes: cash transfer, wage transfer and food transfer. While MNREGA could help provide wages, no urban counterpart was even imagined for urban areas, even after nearly two years into COVID-19. This requires extremely urgent attention. I must alert here that implementing an urban employment scheme through municipal administration will be doubly difficult due to the distant nature of its relationship with citizenry (unlike between gram panchayats and villages), and also extreme class and spatial divide in urban areas. So a careful design will be called for. While registration of work seekers can be done ward wise, provisions of work have to be

Livelihoods Policies in COVID-19 Times 149
imagined based on larger spatial–administrative units comprising two, three wards or even more. To make the scheme effective, private sector employers and community organizations have to be roped in as part of the design. Alongside public works, private works of specific types have also to be brought in.
Fourth, the coverage. While it’s true that the union government as well as state governments did think of livelihoods support in a minimalist way, it’s clear that the thought process of support revolved around existing avenues of reaching the money and food to the poor. This had two design implications: first, the limit of coverage is set by the design limits of each scheme and, second, a good number of people who would not have needed such support in pre-COVID-19 times, but would need it during COVID-19, can’t be reached at all. For example, PM Kisan typically excludes farmers who may not have land in their names. This sets the design limit, that is, the land is in the name of person’s father, and the father has passed away, then the farmer is not eligible. For PDS, on the other hand, the limit of number of potential beneficiaries is set by the 2011 census, which is 10 years old. There may be people who in normal circumstances may not need the PDS ration support but may need now due to loss of income. The coverage could easily have been expanded by bringing an additional 20 per cent population through Aadhaar seeding. This opportunity was lost. Several such innovative inclusion could have been made.
Fifth, programme efficiency. In order to be effective during the crisis, it’s absolutely imperative that general welfare programmes targeting the poor must run effectively. PDS is one example. After the PDS became a component of NFSA, 2013, the functioning of the PDS has improved substantially in almost all states. This is why the World Bank’s study found nearly 90 per cent coverage of COVID-19 food response in rural as well as urban India (Bhattacharya & Roy, 2021, p. 10). However, in comparison, cash
transfers were only effective to the extent of 60 per cent in rural and 34 per cent in urban India in the same study. This is precisely because the cash transfer programmes do not run effectively even during normal times.
The same issue can be seen on ONORC programme, particularly its interstate component. This is a much-needed programme to support the migrant workers who typically form part of the urban poor in India. The current design is clumsy, too dependent on high-tech which is intrinsically socially exclusive and not functioning even with minimum efficiency. There are many ways the design can be simplified, which is the need of the hour.
Sixth, agricultural insurance. The basic tenets of the current design are far better than all the previous avatars of agricultural insurance programme. However, there is a great missing element. Insurance as a financial instrument works on the principle of solicitation. Much of its design elements are hidden and opaque to the consumer. This can’t work for farmers. The farmer needs to understand every aspect of insurance as a right, not as a sales pitch! Second, the efficiency of premium collection must be reciprocated at the time of claim settlements.
Seventh, MSMEs and their workers. The basic fault in the design is to think of the MSME owners and workers in the same policy category. The ILO study shows that while the MSMEs owners’ distress was regarding their operations, in particular, rent, bad loans, payment delays, etc., the owners were responsible, at least partially, in aggravating the negative impacts to their workers.38
Design deficiencies apart, the overall paradigm of COVID-19 livelihoods policy response of the state remained survival centric to the poor, devoid of a vision, that the policy response could also be revival centric. That would have required putting money in the hands of nearly 40 per cent of the adult population which in turn could have generated demand and help the vast informal sector to revive.
38 The workers did not have ESI and PF, and their work hours increased, their payments were delayed, female workers’ harassments increased, wages were reduced, etc., as reported by the International Labour Organization (2021, p. 67, 68).

150 STATE OF INDIA'S LIVELIHOODS REPORT -2021
ReferencesBhattacharya, S., & Roy, S. S. (2021). Intent
to implementation : Tracking India's social protection response to COVID-19 (Social Protection and Jobs: Discussion Paper No. 2107). World Bank.
Chathukulam, J., Joseph, M., V., Rekha, Balamurali, C. V., & George, S. (2021). Ayyankali Urban Employment Guarantee Scheme in Kerala: Well envisioned but poorly executed. Economic & Political Weekly.
Dalberg. (2020). The efficacy of government entitlements in helping BPL families navigate the financial impacts of Covid-19. https://www.indiaspend.com/wp-content/uploads/2020/04/14-Apr i l_Execut ive-Summary_DEA-Meeting_vFINAL_HG.pdf
IFC. (2018). Financing India’s MSMEs: Estimation of debt requirement of MSMEs in India. The author.
International Labour Organization. (2021). Situation analysis on the COVID-19 pandemic’s impact on enterprises and workers in the formal and informal economy in India. The author.
Kishore, R. (2020). Will farmers get a better deal after recent reforms? The Hindustan Times. https://www.hindustantimes.com/india-news/will-farmers-get-a-better-deal-after-recent-reforms/story-8wrOzXKTL7J94cuInodOmK.html
Ministry of MSME. (2020–2021). Annual report. The author.
Mukherjee, S. (2021). MGNREGA work demand up: 77% of budget used up in five months. Business Standard. https://www.business-s tandard .com/ar t ic le/economy-pol icy/mgnrega-work-demand-up-77-of-budget-used-up-in-five-months-121083001029_1.html#:~:text=The%20Morning%20Show-,MGNREGA%20work%20demand%20
up%3A%2077%25%20of%20budget,used%20up%20in%20five%20months&text=In%20terms%20of%20person%2Ddays,the%20same%20months%20in%202019
National Council for Applied Economic Research. (2019). Study of agricultural diagnostics for the state of Bihar in India. The author.
National Institute of Agricultural Marketing. (2010–2011). Investment in agricultural marketing, market related infrastructure, and agricultural marketing system in the absence of APMC Act in Kerala. The author.
NSSO. (2018). Operational characteristics of unincorporated non-agricultural enterprises (excluding construction) in India (73rd Round Report). The author.
Pande, R., Schaner, S., & Moore, C. T. (2020). Food before cash: Because PMJDY cash transfers will exclude many of India’s poorest. The Indian Express. https://indianexpress.com/article/opinion/columns/coronavirus-india-lockdown-food-relief-poor-migrant-workers-mass-exodus-essential-commodities-supply-6403528/
Singh, S. (2021). Understanding practice of contract farming in India: A small producer perspective. National Centre for Agricultural Economics and Policy Research.
The Hindu. (2020). PM extends free foodgrains scheme till November. https://www.thehindu.com/news/national/coronavirus-lockdown-prime-minister-narendra-modi-addresses-nation-on-june-30-2020/article31953944.ece
The Hindu. (2021). Centre to give 5 kg foodgrains free to poor. https://www.thehindu.com/news/national/govt-to-provide-free-food-grains-to-poor-under-pm-garib-kalyan-ann-yojana-in-may-june/article34392466.ece
151
About the Sponsors

152 STATE OF INDIA'S LIVELIHOODS REPORT -2021
Rabo Foundation
Established in 1974, Rabo Foundation is the social fund of Rabobank focused on helping people become self-reliant. Aligned with the ‘Growing a better world together’ agenda,
Rabo Foundation`s interventions are along two primary themes: Access to Finance and Supporting Small Producers. Rabo Foundation seeks to support small-holder farmers’ aggregate in to cooperative producer organizations and strengthens them to make them operationally and financially sustainable. This helps generate sustainable livelihoods for farmers so as to increase their income levels. Rabo Foundation is focused on strengthening the upstream value chains(closer to the farmer) and reduces the length of the chain, connecting different stakeholders.
Rabo Foundation works across 23 countries across Asia, Africa and Latin America, other than the Netherlands. Interventions in these areas are done through instruments such as grant support for capacity building and technical assistance, credit guarantees and soft loans. Rabo Foundation`s interventions have positively impacted the livelihoods of millions of small-holder farmers worldwide through 401 projects in 2020 with a project allocation of EUR 36.2million

153
About the Authors
Biswajit SenBiswajit Sen retired as Senior Rural Development Specialist from the World Bank. He has over 35 years experience in rural livelihoods, community led development, institutional development, Currently he is also the Chairperson of PRADAN Board. Mr. Sen during his long career in rural development worked for varied assignments with World Bank, UNICEF, MacArthur Foundation USA and Swiss Development Cooperation (SDC) of Government of Switzerland. He was one of the initial members of PRADAN and has founded many other development organisations such as GDS, Nalanda and Iimpact in the field of rural development.He is a Graduate of Economics from Delhi University and then did his MBA from the IIM Ahmedabad.
Deepika PingaliDeepika is a development professional motivated by the objective of women’s empowerment and gender equality. She holds an engineering degree from BITS Pilani and an MBA from IIM Ahmedabad. At Sampark, she takes up research, capacity building and field assignments that reach women who are highly vulnerable due to their poverty levels, their occupations (informal labour, entertainment sector, sex work), or the social oppression they face. She also conducts research on issues related to labour migration, especially international migration of women in domestic work that place them at the risk of trafficking.
Kasturi SharmaI am currently working as a Senior News Analyst with Times Now. I am a law graduate from Campus Law Centre, University of Delhi and have worked as a lawyer on variety of cases ranging from civil and criminal suits to environmental law. I have also worked as a legal consultant to the Ministry of environment, forest and climate change in areas of Waste and Chemical Management and Air Pollution laws.In my current role, apart from providing research and analysis for television media, I have also pursued issues of environmental concern, wildlife conservation and issues of social relevance. I have curated interviews, written bylines and scripted podcasts on issues like the status of India’s sewage treatment plants or unemployment during the pandemic or the increased frequency of landslides and cyclones over the years. I have worked on various other similar issues that have been published in digital media.

154 STATE OF INDIA'S LIVELIHOODS REPORT -2021
Priti GulatiPriti Gulati is a senior management professional having spent two decades in the financial sector - in retail banking, treasury and debt markets with Punjab National Bank and DSP Merrill Lynch, and thereon, a decade plus in training, facilitation & recruitment. She, now, runs EXPERTIES, an Executive Interim Management firm in India. She recently embarked into the social sector through short stints with NGOs wherein she submitted an internal paper on covid management strategy at village level, and then studied the condition of Anganwadi women in India. Priti is a B. Com Honours graduate from the University of Calcutta, an MBA in Finance & Marketing from the Faculty of Management Studies, Delhi, and is certified in MBTI® and CAIIB. She has been a travelogue writer for the Economic Times and been giving talks at different forums and institutions.
Saumya PremchanderSaumya Premchander Is a PhD student and lecturer in the Department of Geography at the University of Bayreuth, teaching courses related to digitalization, labour, globalization, development, and quantitative methods. She is also a researcher and consultant currently collaborating on a study of the informal economy and social dialogue mechanisms in India, having worked in the past on labour standards, small enterprise development, security sector reform, poverty alleviation, and microfinance.
Smita Premchander Prof Smita Premchander is a development consultant of international repute, with 40 years’ experience in the fields of sustainable development, poverty reduction and women’s empowerment. She is the founder of Sampark, a Bangalore-based NGO that works for the empowerment of women and migrant workers. She is Visiting Faculty at the Indian Institute of Management, Ahmedabad, where she teaches courses on microfinance, gender and development policies and programmes. Smita chairs the International Advisory Committee of the United Nations University’s Institute of Environment & Human Security (UNU-EHS) in Bonn. She is on the board of Munich Climate Insurance Initiative, a leading global think tank on climate change and insurance, focused on developing solutions for the risks posed by climate change for the poorest and most vulnerable people in developing countries. She specializes in microfinance, gender equality, labour issues, social inclusion, social protection, and sustainable development. She has worked in several countries across Asia, South East Asia, Central Asia, Middle East, Europe, America, Latin America and Africa.
155
Prabhat LabhPrabhat is an international development leader with more than 25 years of experience in leading social impact organizations and programs across Asia, Africa, and North America. As CEO of Grameen Foundation India, Prabhat led the diversification of Grameen’s program portfolio in the domains of agriculture, women’s economic empowerment, and health and nutrition besides financial inclusion. Prabhat is also the co-founder and Managing Director of Grameen Impact Ventures, a social business that creates self-employment opportunities for women and brings valuable financial, agricultural, and livelihoods services to low-income people. Prabhat holds a post Graduate Degree in Forest Management and has undergone specialized training programs at Harvard Business School, Southern New Hampshire University, and at the International Training Centre of ILO. He also serves on the boards of several leading social impact organizations.
Richa GovilRicha Govil is Director of School of Development at Azim Premji University, Bangalore. She teaches topics related to critical thinking, agricultural and rural livelihoods. Richa’s areas of interest include agricultural livelihoods, household nutrition, farmer producer organisations, women’s livelihoods, micro-enterprises and social entrepreneurship. Early in her career, as Asha for Education’s National Coordinator, and later Board Member and President, Richa led its growth from a small student group focusing on basic education of underprivileged children into a multimillion dollar organization with over 50 chapters across the world. During her time in the business sector, Richa developed and implemented business strategy for large and small corporates in the US and India. Richa is a co-founder of TREE Society, an which offers training programs for micro-enterprises and producer organisations. Richa has a Ph.D. in Physics from University of California, Berkeley, U.S.A.
M. ManjulaDr. M. Manjula is a member of the faculty of School of Development, Azim Premji University, Bangalore, Karnataka. She holds a Ph.D in Agricultural Economics and teaches and engages in research at the interface of ecology-economy-society using a multidisciplinary approach. Her specific research interests are in the fields of sustainable production systems, climate change adaptation, ecology, food security, gender, and livelihoods. Along with research her work extends to practice, especially in the interface of gender and agriculture., Before joining APU, she was associated with the MS Swaminathan Research Foundation (MSSRF), where she worked on ecological, social, and economic concerns of rural livelihood. She also engages in critical analyses of the link between the macro, meso and micro aspects of policy formulation, implementation, and uptake. She has several peer reviewed journal publications, book chapters and popular articles to her credit

156 STATE OF INDIA'S LIVELIHOODS REPORT -2021
Annapurna NetiAnnapurna Neti is an Associate Professor of the School of Development at Azim Premji University, Bengaluru. She has worked as a researcher and consultant to multiple organizations in the development sector. She has over 17 years of experience covering practice, research and teaching in the areas of MSMEs, microfinance, women's collectives and informal livelihoods in India, Nepal and Bangladesh. Her current research interests include urban informal livelihoods, financial inclusion and producer companies. She serves as an Expert Director on the Board of an all-women dairy producer company. She is a Fellow (Ph.D.) of Indian Institute of Management Bangalore.
Shankar Venkateswaran Shankar’s career has been almost equally divided between business consulting, corporate sustainability and social development. His last full-time position was as the head of sustainability of the Tata group. He is currently a part of the founding team of ECube Investment Advisors that focuses on ESG investment, stewardship and climate lending. He also advises several companies and NGOs on sustainability and development and is a visiting faculty to various institutions on these topics.He serves on the board of several NGOs and corporate foundations and is currently the Chairperson of Oxfam India and CSR Trust for SDGs in India. He also serves as Grantham Ambassador at the Grantham Centre for Sustainable Futures, University of Sheffield, UKShankar has advised the Ministry of Corporate Affairs (MCA) on matters such as CSR and Responsible Business Conduct. He was very closely involved in the drafting of the National Guidelines for Responsible Business Conduct, released by the MCA in March 2019, and its companion Business Responsibility and Sustainability Report which was mandated for the top 1000 listed companies in India by SEBI in May 2021. He has also participated in the MCA’s initiatives on developing a National Action Plan on Business & Human Rights.He holds an engineering degree from IIT Madras and is an MBA from IIM Calcutta. He is a Distinguished Alumnus of IIM Calcutta.
Ashok Kumar SircarDr. Ashok Kumar Sircar currently anchors the Centre for Local Democracy at the Azim Premji University. Ashok is associated with the University from 2011, and for the last five years, has been the Director of School of Development. He teaches a course on political economy of land, another on local democracy and development in India. He spent more than 15 years of his working life in the Electronics industry, in production and R&D, followed by another 15 years in the social sector working in grassroots to international organisations. His interests are in the Land Question, Local Democracy, and Civil Society.:


STATE OF INDIA’S LIVELIHOODS
REPORT 2021
An ACCESS PublicationEdited by: Biswajit Sen
Supported by
The State of India’s Livelihoods (SOIL) Report is an annual publication addressing the contemporary issues emerging in the livelihoods sector. It is the only document that aggregates the experiences and challenges of the sector, analyses case studies and Report on the progress of both government-run and privately-run programs. It is released at the Livelihoods India Summit, a national level event organised by ACCESS.
For the last 13 years ACCESS has continued to bring out the State of India’s Livelihoods Report year after year, with an aim to inform policy makers and practitioners on the various issues that the poor constantly grapple with. This year’s Report assimilates current debates and developments around the livelihoods of the poor and their plight especially in view of the ongoing pandemic and its devastating second wave.
Given the diversity and complexity of the livelihoods landscape, the SOIL Report can never be comprehensive and complete. While some core themes are continued from the previous year’s Reports, to provide stability to the Report structure, interesting new themes have also been added. The continuing coverage includes an overall scenario of the livelihoods of poor and policy and programme interventions by the Government in response to COVID 19. The Report also covers two themes relating to the agriculture sector. While one tries to make sense of ground realities as it relates to the central sector scheme on formation and promotion of 10,000 FPO, the other looks at sustainable agriculture policies and practices as it is evolving in India. The coverage on future of jobs and women in informal sector, critically looks at livelihoods of youth and women and explores more inclusive policies. The Report also builds on previous coverage in SOIL Report 2019 on five years of CSR practice in India and further presents a commentary on how CSR has changed and how much of these changes are likely to continue.
Editor:Biswajit Sen
Contributing Authors:Biswajit SenDeepika PingaliKasturi SharmaPriti GulatiSaumya PremchanderSmita Premchander Prabhat LabhM. ManjulaRicha GovilAnnapurna NetiShankar Venkateswaran Ashok Kumar Sircar
ISBN 978-81-955245-2-5
9788195524525
STATE OF IN
DIA’S LIVELIH
OO
DS REPO
RT 2021