THE IMPACT OF THE ECONOMIC CRISIS ON DEVELOPMENT OF THE ESTATE CROPS
Upload
independentCategory
view
0download
0
Overview: Economic Crisis & LivelihoodsOverview Chapter of Status of Indian LivelihoodReport 2013
Resmi P Bhaskaran9/1/2013

Overview: Economic Crisis and Livelihoods1
1. INTRODUCTION
The Indian economy is going through one of its toughest periods sincethe implementation of neo-liberal economic policies in 1991. Down fromwhat was hoped was a routine high of eight to nine per cent growth ayear, we are now at five per cent. At the same time, Pranab Mukherjeein his first speech as the President of India admitted that “trickle-down theories do not address the legitimate aspirations of the poorand cannot eliminate poverty”i. While the Indian economy has grown totenth largest in the worldii, it also accounts for a third of theworld’s poor people (around 230 millio), a sharp increase from a fifthin 1981iii.
As per the current population growth, the economy must produce 20million new jobs every yeariv, a rate which was not achieved even whenthe economy was growing at eight percent. Slipping growth affects theoverall living conditions of the majority of the population,especially those close to or below the poverty line (BPL), about 841million people or nearly 70 percent of Indian populationv. Growth isnow the key challenge for this and the subsequent government followingnext year’s elections. Any delays now contribute further to theplummeting confidence of industrialists, traders, farmers and the “aamaadmi”, and thus risk deepening the impact of the economic downturn.
At present, India is facing unhistorical levels of depreciation in thevalue of the Rupee, a sharply fluctuating Sensex, declining foreignexchange reserves and uncontrolled inflation. Industrial stagnationfollows. By contrast, the agricultural sector, still the mainstay ofwell over half of India’s workforce, has shown good growth, while thesustainability of this continues to be in question, as farm sizesdecline, farming practices tax the environment and low investmentkeeps infrastructure and supply chains starved of development funds.1 This is the overview chapter of Status of Indian Livelihood Report 2013, published by Sage Publication, New Delhi for Access Development Services, New Delhi. Acknowledge the comments from other authors of the report, especially Orlanda.
Besides, the country has had to bear a fair quota of droughts in someparts and floods and landslides in other parts, with agriculturalproduction and procurement taking the hit and throwing a challenge tothe ambitious food security agenda.
The macroeconomic drama and contraction of growth have heightened thecall for the government to play a protective role, in helping the poorto avoid dramatic deterioration of income and to provide someprotection against shocks. At the same time, the capability of thework force to work productively - whether in field, factory, office orhome - is critical, since a productive workforce fit for purpose isboth a pillar of growth and a solution to poverty in the long term.While India has no shortage of young able bodies, their employabilityis a question. The private and non-profit sectors each play a criticalrole in building this human resource and strengthening the economy asthey adapt and innovate to turn the crisis into an opportunity.Urbanization, with its concentrated markets and infrastructure,expands the scope of livelihood options for rural people across thecountry.
The global economic melt-down of 2008 and subsequent turbulenceaffected the Indian economy far less than most other countries in theworld. The current discourse is that the diverted hurricane hasreturned with a vengeance. What is the truth in this fear? Or is thesituation rather the result of lack of reforms and ‘policy paralysis’?What are the opportunities, embedded within, which provide the meansto tackle the situation? The present chapter discusses thesequestions. First, we reflect on the past to get a fresh view of thepresent, by revisiting some of the tenets of economic nationalism –growth and industry, poverty and welfare, the role of the state versusthe market, and local democracy - built by the post-Independenceleaders. Second, we review the macro-economic situation, the status ofinvestment and the policy jam that has surrounded it, and some of thecritical political challenges faced by the Indian state in overcomingcrisis. Third, we discuss the foundations – education, health,infrastructure and finance – which underlie industrial and privatesector growth. Finally, we introduce the other five chapters of thisreport.
2. REVISITING ECONOMIC NATIONALISM
Before Independence, the nationalist leaders shared an integrated,inter-related picture of the Indian economy, its sicknesses, theremedies to be applied and its relation to alien rule (Bipan, 1966)vi.With this ‘economic nationalism’, they approached the problem ofeconomic development holistically rather than by separating growthfrom human development and one sector from another. The focus was onsocio-economic, industrial and infrastructural development to improvethe material status of the people, and on equal representation of allclasses.
The ‘abject and stark’ poverty of so many Indians was a corepreoccupation and the analysis of economic woes showed a strongunderstanding of the reality of poverty. For example, while debatingthe linkages between increasing food prices and other consumer goods,they agreed that the cause was not the improved purchasing power ofthe poor but the falling production, increased exports and increasedhoarding by middle menvii. We can observe similar arguments in themilieu of activist and civil society organizations, but the level ofconsensus and shared values on such points, is much less today thanpost-Independence.
Today, economic development is near synonymous with economic growth.The neo-liberal view that growth will fund education and health overtimeviii is not well borne out more than 20 years after liberalization.Nearly seventy years after Independence, the debate is divided, and ashared vision which would provide the impetus for policy making,implementation and nation-building, seems further than ever. With thislens, this section reviews current debate and evidence on those topicswhich India’s post-colonial leaders prioritized: poverty andinequality, welfare, economic growth, sustainable development andlocal democratic representation.
2.1 Poverty and Inequality
Poverty eradication is the ultimate goal of all social policy. Povertyestimates are constantly debated, while the latest estimates of thePlanning Commission have proved particularly controversialix. Theestimate of ‘head count’ is crucial because so many benefits and

schemes hang on it. According to the newly defined poverty line, thosewith a monthly per capita income of less than Rs.1000 in urban, andRs.816 in rural areas (or Rs.33.3 and Rs.27.2 per day respectively)fall below the poverty line (BPL). Based on this new line, 13.7percent of urban and 25.7 percent of rural population are poor. Usingthe new figures, the overall poverty ratio (proportion of poor intotal population) is said to have declined from 37.2 percent in 2004-05 to 21.9 percent 2011-12, an impressive 15.3 percent point fall overonly seven years.
With general elections on the cards, the government is of course keento claim impact for its social policies. But the figures arechallenged by economists, media and CSOs who question how theestimates were made.x They argue that the Planning Commission simplyapplied the new price indices to the old ‘consumption basket’ on whichthe original poverty line (1973-74) was based. Thereby, the wholeissue of what kinds of costs and needs – in the contemporary context -should fall into the basket was sidestepped. For example, what shouldbe a minimum nutritional diet today? What are the other manufacturednecessities, utilities, rents, transportation, health and educationcosts which are, today, in the basket of essential expenses basket ofa poor person? When such expenses are added, the poverty ratio for2009-10 actually goes up to 75.5 percent from 69.5% in 2004-05.
The government came out with another set of poverty figure soon afterreleasing the Planning Commission estimates, based roughly on those tobe covered under the new National Food Security Ordinance (NFSO).According to NFSO, nearly 67 percent of the population needssubsidized food-grains. Derived from 2012-13 consumption expenditure,the estimates put the poverty line significantly higher, at per capitaRs.1506 per month (Rs.50 a day) for rural, and Rs.1850 per month(Rs.62 a day) for urban. This figure is very close to the World Bank’spoverty line of US$ 2 (PPP) corresponding in 2011-12 to Rs.45 in ruraland Rs.57 in urban, per capita per dayxi. In the prevailing economicturbulence, the politics of poverty headcount is disturbing because itdetracts from serious analysis of what works and does not work toreduce poverty (if evidence of poverty reduction can be jumped up bystatistical gimmicking, then why bother with real evidence)?
The evidence of recent shifts in real wages in India is mixed.Increasing prices, especially of food, eliminates much of the nominalgain in wages, and this is reported by the ILO as the major cause ofshrinking purchasing power of workers (ILO, 2013)xii. The ILO furtherreports that India’s real wages fell one percent between 2008 and 2011while its productivity grew at 7.6 percent over the same period. Therelationship between wages, productivity and skill is examined in moredetail in Chapter 6.
The ILO report contrasts with evidence from the NSSO rounds(employment survey) which reports that salaried and casual workers’earnings increased by 150 per cent in the five years between2004‐05and 2009‐10. How much these increases are explained by growth andhigher productivity in industry, versus the inflationary pressure onwages brought about by high agricultural production and the expansionof the National Rural Employment Guarantee Scheme (NREGS) is a matterof debate (Gulati at all, 2013)xiii.
The increasing wages on a base of NREGA and growth in the informal andagricultural sector, contrasts with the corporate sector’s very slowcreation of decent employment. While the number of poor people mayhave declined between 61st and 66th NSSO rounds (2004-5 to 2009-10),inequalityxiv rose for the first time in 35 years in rural areas (from0.26 to 0.28), and increased at a faster pace in urban areas. Risinginequality is also reflected in divergent consumption patternxv.
2.2 Social-Economic Rights and Welfare
A third of the world’s hungry live in India. Over 230 million Indianssleep hungry every night. Over 7000 Indians die of hunger every day.On the global hunger index India ranks 66th out of 88 countries.According to UNICEF, one in every three malnourished children in theworld lives in India and every second child is mal-nourished. InIndia, about 50 percent of all childhood deaths are attributed tomalnutrition.
Hunger and malnutrition is ‘a shame’, said Prime Minister ManmohanSingh in February 2012. On the other hand, India experiencesimpressive growth and is one of the major producers of food itemsxvi. If

India produces enough food to combat hunger, then why do millions liveand die in hunger?
There are several factors which have stalled the expansion and theprofitability of agriculture in India. Among these are:- the declinein agricultural investment since the 1980s; the liberalization of foodimports through WTO agreements; increasing input costs particularly inphosphate fertilizer and fuel for irrigation, and high losses in thesupply chain. These factors are discussed in more detail in Chapter 4.
The relationship between agriculture’s health and profitability, andfood security, is close, but not complete: food security also dependson smoothening supply and ensuring entitlement to the poorest. Foodsecurity is itself fundamental to the equitable development envisagedby post Independence leaders, being a base on which other humandevelopment depends. This view is reflected in the contemporary Rightto Food Campaignxvii, which argues that any spending on food securityneeds to be viewed as an investment in growth and development. Withthe National Food Security Act (NFSA), just passed by Ordinance in theLok Sabha, the government renews its commitment to address foodsecurity and hunger. It will be discussed briefly in Chapter 2 and inmore detail, in Chapter 5.
2.4 The Shape of Growth: Investment
The level of investment in an economy is determined by gross capitalformation (GCF)xviii, an indicator of the economy's ability to produceincome. It is one of the expenditure components of GDP, together withfinal consumption and net exports. Proper and equitable distributionof capital formation promotes economic welfare and eradicates poverty.
There is a clear correlation between the overall economic growth andinvestment growth. When the economy grew at 9 percent, investment wasaround 35 percent of GDP. The private sector (household and corporate,respectively 14 per cent and 11 per cent of GDP) constitutes the majorinvestor in India. Domestic savingsxix (30.8 per cent of GDP in 2011-12)is the major contributor to capital formation. As a result of theglobal meltdown and the decline in corporate but also householdsavings, the gap between saving and investment has widened, leading to

negative growth in the net capital formation (see the table). Thisgap climaxed in 2011-12, but has since declined since foreigninvestment has also plummeted.
Declining Net Capital Formation
Years
Savings(% ofGDP)
Capitalformation (%of GDP)
Netcapitalformation
GDPGrowth
2007-08 36.8 38.1 -1.3 9.32008-09 32 34.3 -2.3 6.72009-10 33.7 36.5 -2.8 8.62010-11 34 36.8 -2.8 9.32011-12 30.8 35 -4.2 6.2Source: Economic Survey 2013-14
Sector wise investment shows that industry (47.8%) and services (44%)dominate. Agriculture - still employing more than 50 percent of theworkforces - struggles to raise investment and to modernize productionand supply chain, a topic examined more closely in Chapter 4. On theother hand, manufacturing and services which contribute more than 85percent of the GDP get the maximum share of investment, whileemploying less than half the workforce. This indicates that the highergrowth and capital formation in these sectors have failed to transfera significant proportion of the workforce from low productiveactivities to high productive activities. The employment outcomes ofsector growth is discussed more in Chapter 2.
2.4 The Shape of Growth” Import-Export
Indian foreign trade has witnessed drastic change in the last twodecades. The growth model followed since reforms has focused onexpanding exports while discarding the import substitution modelfollowed since Independence. India’s exports grew from US$ 50 billionin 2002-03 to US$ 300 billion in 2012-13, but imports grew at an evengreater pace, from US$ 61 billion to US$ 492 billion, leading towidening of the current account deficit (CAD). India now accounts for
1.44 percent of exports and 2.12 percent of imports for merchandise,and 3.34 percent of exports and 3.31 percent of imports for commercialservices, worldwide.
The foreign trade basket of India shows an interesting pattern.Petroleum products constitute the largest forex earning commodity (USD60 billion), followed by gems and jewellery (USD 43 billion) andtransport equipment (USD 18 billion) during 2012-13 fiscal. From itsexport of services, India gained USD 144 billion. On the other hand,petroleum and crude oil constitute nearly 32 percent of total importsin 2012-13, while gold (USD 54 billion), electronic goods (USD 31billion), machinery (USD 29 billion) and precious and semi-preciousstones (USD 23 billion) are the other major import items. Thisindicates that the sectors that received heavy support and subsidyfrom reforms during the liberalization period (i.e. services andmanufacturing) hardly made any significant improvement in the exportcommodity basket. The contribution of traditional and labour intensivesectors to exports is still significant, and they continue to performwith fewer incentives than those of the new economy.
The lessons of the last few years is that high CAD and depleting forexboth result from inappropriate increases in the import of goods andservices, which in turn threatens the value of the rupee and growthoverall. Another fact clearly emerging is the need to focus oncapital formation or investment in agriculture and boost exports inthis most inclusive of sectors.
2.5 Environment and Sustainable Development
Since the 1980s, sustainable development has been mainstreamed indevelopment economics. Globally, the conduct of unbridled corporatesas well as state socialist regimes in exploiting and consolidatecontrol of resources, brought environmental sustainability to thefore. The climatic volatility and extremes experienced with growingfrequency in many parts of the globe is the backdrop to this. Thegoals for the post-2015 period are now formulated, based on aframework of balanced and sustainable growth, by the United Nations inits Rio + 20 summit, June 2012.

Thanks to the efforts of CSOs and activists in India andinternationally, the Twelfth Plan (2012-17) has foregrounded the issueof environmental sustainabilityxx. The government has set up acommittee to develop a framework for 'Green National Accounts',measuring economic well-being on the basis of a comprehensivedefinition of wealth covering natural and human capital, rather thanGDP alonexxi. India leads the international negotiations under theUnited Nations Framework Convention on Climate Change (UNFCC) and hasagreed to reduce the carbon emission intensity of its GDP by 20-25percent of 2005 levels by 2020xxii.
In the 2013-14 Union budget, the government promoted alternativeenergy especially solar. In the last ten years, the government hasfurther come out with various policies, such as the Joint ForestManagement Act, Green Rating for Integrated Habitat Assessment,Coastal Regulation Zone, a clean energy drive through eco labeling andenergy efficiency labeling and fuel efficiency standards.Implementation of many such policies is delayed and diluted so thatresults are weak. In the case of the Forest Management Act and CostalZone Regulations, for example, the community has been inadequatelyconsulted, resulting in public agitation in many places.
2.6 A Place for Public and Private
The Twelfth Plan document proposes public private partnerships (PPP)in almost all sectors, from social to infrastructure. PPP has beenrobustly promoted in the last ten to 15 years, as a neo-liberal modelfor development. But some Indian states used PPP effectively muchearlier, as early as the 1960s. The role of PPP is often viewed asambivalent because it exempts the government from responsibility,while gaining ground and support in inverse relation to the decline ofpublic service delivery: the worse public services, the more supportfor PPP models. .
The record of achievement under PPP is mixed. Generally, achievementhas been considerably less than projected goals and implementation,while inclusiveness (reach and price to consumer) have also beenpoorer than expectedxxiii. PPP clearly works better where profits areassured, while it often inflates prices, thereby curbing access.
One of the problems is the paucity of monitoring or analysis ofdifferent PPP models. The poor accountability of many PPP projects,even those in essential services such as health and water, has beencriticized by CSOs, government audit agencies, courts and media.Neither installation costs nor service quality is adequately monitoredor regulated. There is also poor transparency in the PPP contractingprocess, with social audit mechanisms not properly installed.
On the other hand, effective installation of PPPs in fields such asinfrastructure development and supply chain development, can ensure ahigher standard of provision and broaden the scope for employment.Appropriate regulation of PPPs needs strong political will andcapacity, and there is some distance to travel before the governmentis willing or able to provide this.
2.7 Local Elected Bodies: Twenty Years of Panchayati Raj
The Acts of 73rd and 74th Constitutional Amendments, passed in 1992,established three tier rural local governments and convertedmunicipalities into self-elected governments. These bodies weremandated to serve people not only with municipal services but also toinitiate participatory social and economic development. TheConstitutional Amendments asked the state to devolve functions,functionaries, finance and freedom to these local governments.Further, it mandated that elections should take place every five yearsand ensure reservation for women, SCs and STs. Central and statefinance commissions were mandated to allocate funds to these localbodies and to transfer to these entities the powers of taxation.Finally, the Constitutional Amendment created a new entity, the GramSabha (village council) with powers to be decided by the states.
There are two clear achievements of these Amendments. First, electionsto these local governments have become regular and reliable. Second,the reservation of women, SCs and STs has been consistently ensured.India can be proud that it has 1.2 million elected womenrepresentatives, more than the rest of the world combined!
Unfortunately, the successes are limited to these two. Overwhelmingly,most states have failed in delivering other constitutional provisions.
For example, an analysis of the devolution of the ‘3Fs’ (finance,functionaries, and functions) across the country by the IndianInstitute of Public Administration reveals that overall devolution isonly 33 percent (report of the expert committee 2013).xxiv While centralfunds transfer to local governments is more or less regular, thequantum remains tiny relative to demand and needs, while stategovernment transfers hardly feature at all.
Local governments have the mandate to work on 29 subjects as per theEleventh Schedule of the Constitution, of which, thirteen are directlyrelated to livelihoods. What has the local governments done on thesesubjects? The only answer we get is that local governments areimplementing some of the central government’s schemes. Not a singlelocal government in India has formulated its own programme on any ofthe thirteen subjects of livelihoods. George Mathew summed it up thus,“Although panchayats got constitutional status twenty years ago,politicians have managed to subvert the decentralization of power, outof fear of the emergence of rival political forces. So Panchayati Rajremains a pipe dream, while bureaucracy’s writ runs large” (Mathew2013)xxv
The apathy and reluctance of state and central government to empowerlocal governments with authority and resources couples with the localgovernments’ dependency on the state level political and bureaucraticforces. From a livelihoods perspective, this has taken its toll in thecontinued gap in essential public services of water, sanitation,roads, housing, healthcare, nutrition, and school education.
3. POLICY JAM, PRICES AND POPULISM
When the economic growth declined to 4.4 percent in August 2013 andinflation and rupee depreciation touched new extremes, the lack ofsupportive policy reform was cited as the main cause of the problem.International rating agencies like Standard and Poor downgraded India,citing lack of reforms which were blamed for reducing the pace ofeconomic growth. While focusing on its defense around the variousscams and corruption charges unraveling around it, the governmentignored or delayed many critical policy decisions for which it is nowpaying the price. This section focuses on the macro-economic and

sectoral issues which have felt the cost of these delays andindecisions, and explores their effects on the livelihoodopportunities of the people.
3.1 Macroeconomic challenges
Inflation and volatility in the rupee along with depleting forexreseve are the major macro-economic challenges that the government isgrappling with in the last one year. These issues are highlyinterlinked and have multiplier effects on the economy, politics andthe livelihoods of the poor.
Inflation
Since 2008, the Indian economy has undergone severe inflationaryconditions. Food inflation was averaged around 10 percent from 2008 toDecember 2012. As a result, 50 percent of the income of an averageIndian household is now spent on food items and the figure is morethan 60 percent in the case of poor households (NSSO, 2011)xxvi. Foodinflation is explained by production shortfalls, the propping up ofthe Minimum Support Price (MSP), the quantum of the PublicDistribution System (PDS) versus open market sales, and the risingcost of imports as the Rupee declines. Open liberal economies usemonetary policy to address inflation: money supply is tightened;credit becomes costlier and disposable income declines. Creditcrunchiness is affecting almost all sectors that generate employment,like real estate, automobile, cement, steel, durable goods,transportation and hospitality.
The brief respite in early 2013 was reversed by July 2013 as priceinflation rose to 5.79 percent. In this regard, it is evident thatmonetary policy has not delivered any significant impact and theconstantly falling rupee adds more woes. In contrast to itsintervention in monetary policy, the state has abandoned interventionin the supply chain activities of food and other essential items. ThePDS – limited on a macro scale - is the only mechanism that thegovernment can use, and the transformation of this scheme through theNFS will be discussed in more detail in Chapter 5.
Depreciation of Rupee and Depleting Forex Reserves
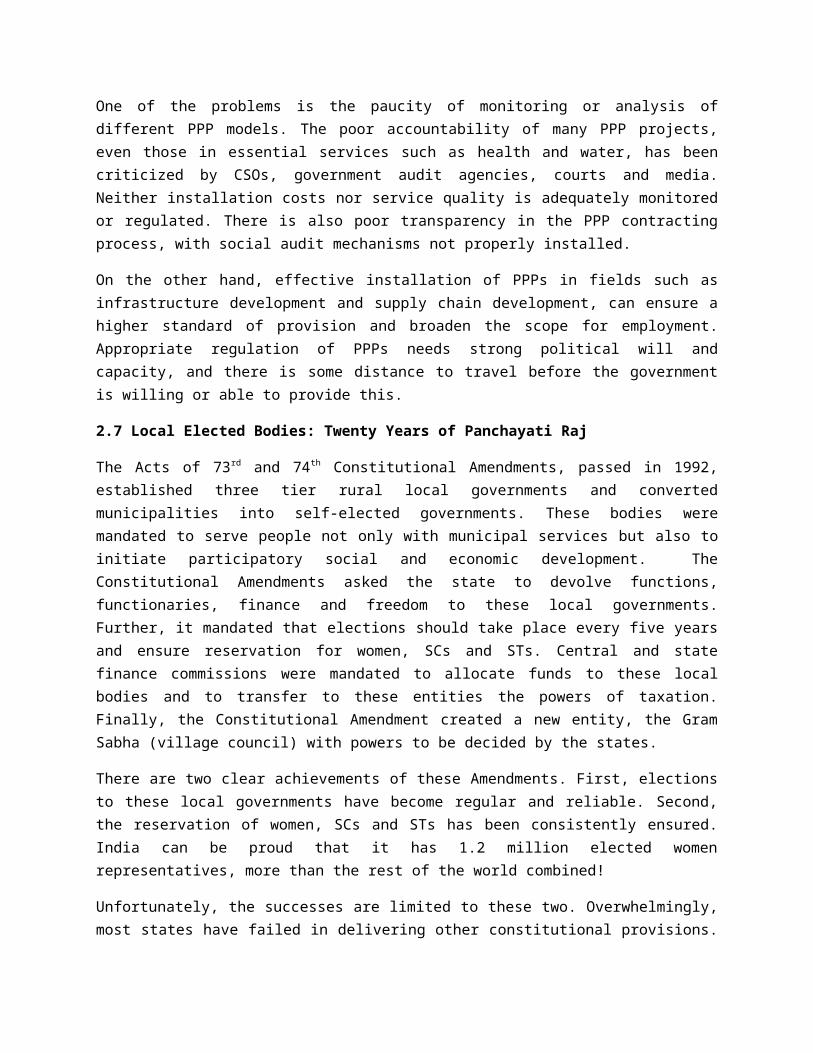
India’s forex reserves are once again fast declining. The rise in theinternational crude oil price and the appreciation of the US dollardue to the recovery of the US economy is now cited as the reason. TheCAD has gone up to 4.8 percent of GDP, much worse than in 1991 (whenit was 2.5%). India’s debt burden is, furthermore, in an alarmingcondition at 35 percent of current account receipts and 3.7 percent ofthe GDPxxvii.
2001-02
2002-03
2003-04
2004-05
2005-06
2006-07
2007-08
2008-09
2009-10
2010-11
2011-12
-400000-300000-200000-100000
0100000200000300000400000500000
Current ...
Source: Various Years Union Budget, Ministry of Finance, Government ofIndia
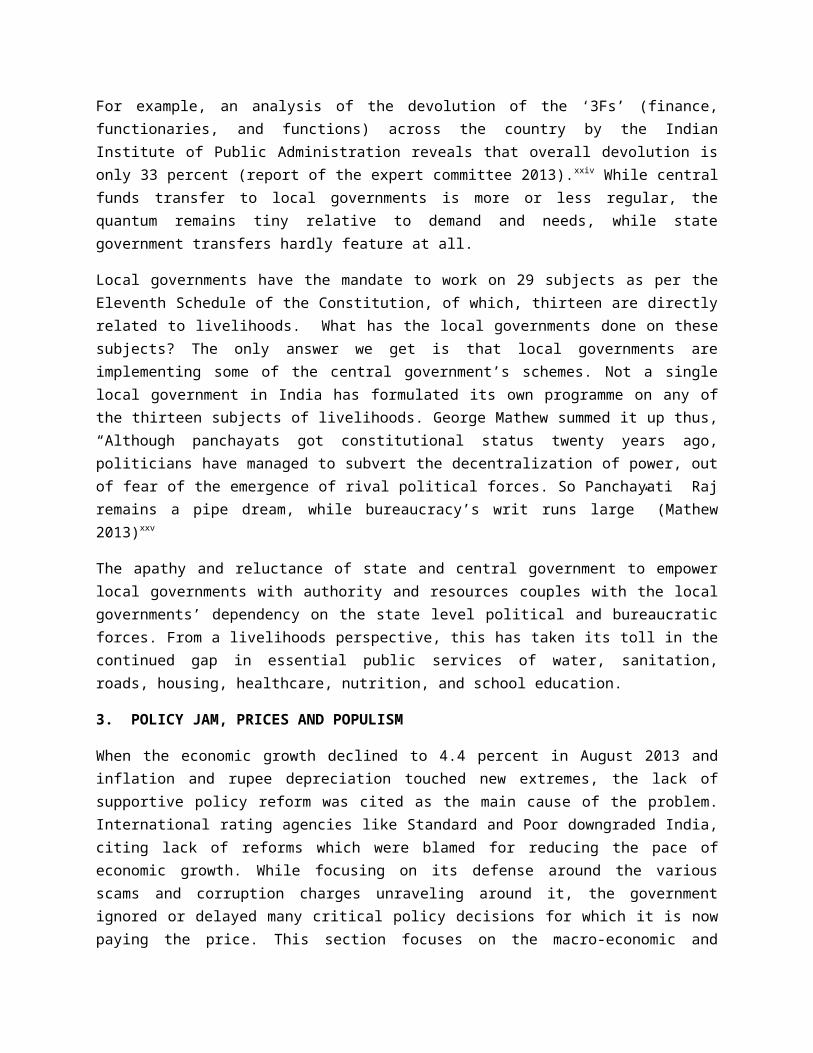
Declining rupee is a major economic issue as it inflates the alreadyinflating economy. The policy to restrict investments and remittancesabroad to reduce the out flow of dollar has not worked. Meanwhile,India continues to increase its capital goods imports which increasedby 79 percent during 2008-12. Although increasing capital goodsimports is considered to be an indicator of economic growth, it isalso cited as a major reason for widening CAD. It indicates on the onehand, an unprecedented growth in the import of foreign manufacturedgoods, alongside a sharp decline in production on the otherxxviii. Thisanswers why we escaped from the global slowdown in the post-2008period and why we are getting into crisis at present.
Jan-11 Jan-12 Jan-13 Aug-13
44 52 57 61
Value of Rupee Against US Dollar
Source: Various Years Union Budget, Ministry of Finance, Government ofIndia
It is imperative that policy makers intervene to restrict the importof goods on a priority basis. Reduction in CAD should be the corepriority with sufficient improvement in the creation of domesticdemand and supply. To tackle the present crisis, the government mustaddress itself to the domestic market rather than focus on externalmarkets. The size and the multi-dimensionality of the Indian economyand rapid growth of the middle class all offer wide opportunity. Thegovernment and other critical stakeholders need to focus on policiesand programmes that support expansion of the domestic market.
3.2 FDI emerging trends
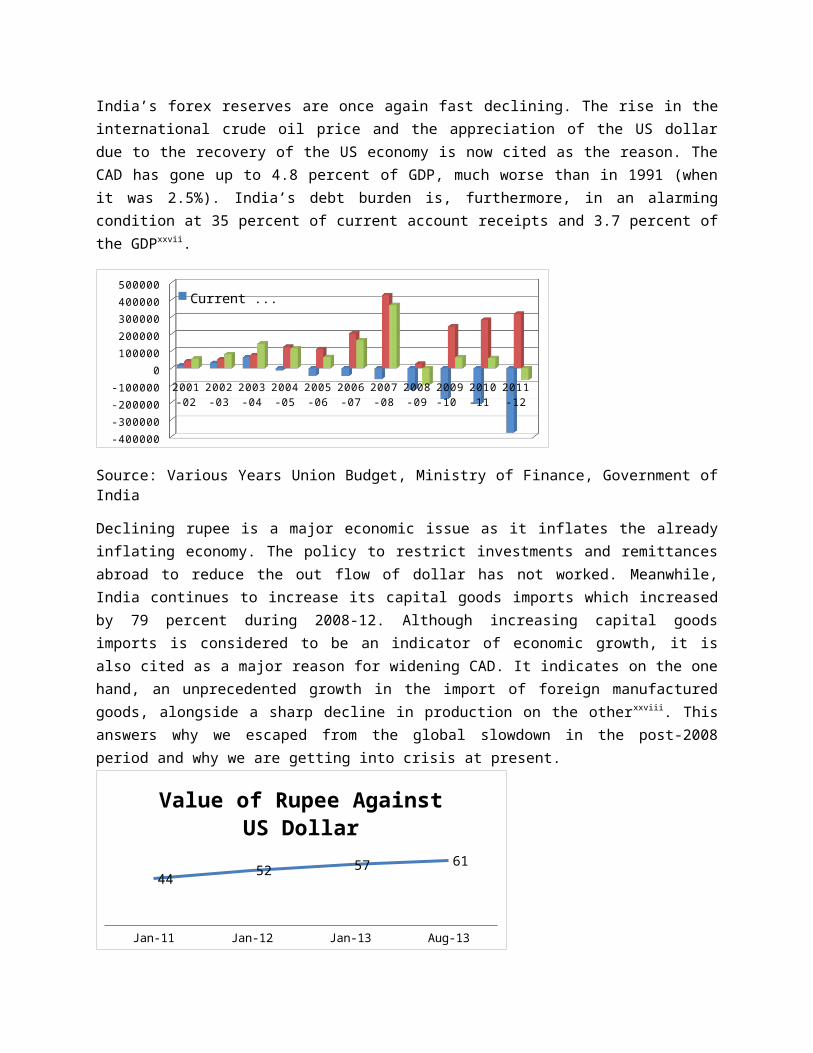
It is expected that foreign investment will provide the requiredcapital, technology support and expansion support to industries.Foreign direct investment (FDI) is more crucial than ForeignInstitutional Investment (FII), since it is more constructive infacilitating infrastructural development and technological up-gradations, and less linked to market perceptions and volatilities.Since 1991, the FDI inflow to the country has grown from USD 1billionto a cumulative FDI of USD 299.2billion in June 2013 . The followingtable illustrates the sectors that attracted higher inflows and thecountries that took lead in investing in India. The service sector,including hotels & tourism and trade, bagged more than 50 percent ofthe total investment between 2000-2013. Notably, more than 50 percentof the investment came from countries generally known as tax havens(Mauritius, Singapore). This means the FDI is essentially the returnof black money originating in India, after ‘whitening’ overseasxxix.
Sector wise Inflow of FDI - April 2000 to June2013
SectorsFDI inUS$
% share oftotal FDI
Service sector 38189 19.22Construction - Realestate 22247.5 11.2Telecommunications 12865.83 6.48Computer software/hardware 11862.37 5.97
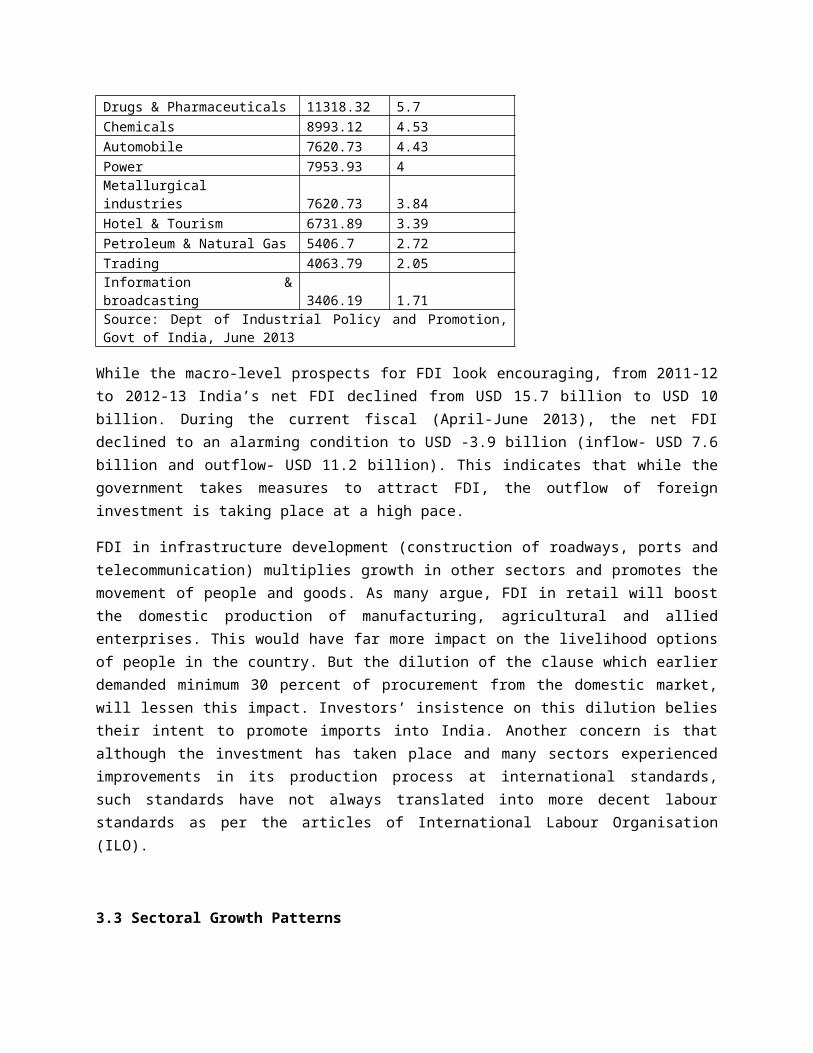
Drugs & Pharmaceuticals 11318.32 5.7Chemicals 8993.12 4.53Automobile 7620.73 4.43Power 7953.93 4Metallurgicalindustries 7620.73 3.84Hotel & Tourism 6731.89 3.39Petroleum & Natural Gas 5406.7 2.72Trading 4063.79 2.05Information &broadcasting 3406.19 1.71Source: Dept of Industrial Policy and Promotion,Govt of India, June 2013
While the macro-level prospects for FDI look encouraging, from 2011-12to 2012-13 India’s net FDI declined from USD 15.7 billion to USD 10billion. During the current fiscal (April-June 2013), the net FDIdeclined to an alarming condition to USD -3.9 billion (inflow- USD 7.6billion and outflow- USD 11.2 billion). This indicates that while thegovernment takes measures to attract FDI, the outflow of foreigninvestment is taking place at a high pace.
FDI in infrastructure development (construction of roadways, ports andtelecommunication) multiplies growth in other sectors and promotes themovement of people and goods. As many argue, FDI in retail will boostthe domestic production of manufacturing, agricultural and alliedenterprises. This would have far more impact on the livelihood optionsof people in the country. But the dilution of the clause which earlierdemanded minimum 30 percent of procurement from the domestic market,will lessen this impact. Investors’ insistence on this dilution beliestheir intent to promote imports into India. Another concern is thatalthough the investment has taken place and many sectors experiencedimprovements in its production process at international standards,such standards have not always translated into more decent labourstandards as per the articles of International Labour Organisation(ILO).
3.3 Sectoral Growth Patterns
Although the growth of industry and service sectors provides a majorpush in the overall economic growth, the growth of agriculture on theother hand ensures the sustainability in terms of equity, employmentand food supply. The contribution of agriculture and allied activitiesin the GDP accounted for 13.7 percent (at constant prices 2004-5) in2012-13xxx, but it still provides employment to nearly 52 percent of thepopulation. Although this indicates very low productivity of thesector, it is still the major source of income for every second workerin the country. On the other hand, agriculture grew at an average rateof 3.6 percent during the Eleventh Plan and is expected to grow at anaverage rate of 4 percent during the Twelfth Plan. These issues arediscussed in more detail in Chapter 4.
In 2012-13, India ranked 10th in global agricultural and food exportsand agricultural products account for 10 percent of the total exportearnings (Economic Survey 2013). Agricultural and Processed FoodProducts Export Development Authority (APEDA) forecasts that export ofagricultural products will cross USD 22 billion by 2014 and willaccount for 5 percent of the global total. Currently (2012-2013), itis UDS 20.74 billion. It is crucial for the government to sustain aswell as increase the production as the National Food Security (NFS)Act 2013 will be in implementation in the current year across thecountry.
Agriculture’s resilience and capacity to withstand macro-economiccrisis is well-known. Thus government investments potentially havemore impact here than elsewhere. The economic slowdown resulted in fewjobs lost in the food and agriculture sectors (Shah 2012)xxxi. Inparticular, jobs involved in the production, procurement, transport,storage, processing and retailing of cereals, oilseeds and pulses,remained intact. On the other hand, India may need to revisit itspricing regime and international trade agreements in order to enhanceagricultural production to meet the increased demand from NFSA. Thefollowing table shows the relative subsidy in India compared to otherkey countries and regions. It shows the vulnerability of Indianfarmers in the global market. India has taken an active stance inchallenging the practices under WTO and any wins in India’s

negotiations would definitely provide a fillip to the entireagriculture sector in India.
Comparative Figure of Agricultural Subsidies
Country
Subsidyamt/hector
% agriculturesubsidy tototal subsidy
% ofpopulationdepend on
EEC $82 37 8USA $32 26 5Japan $35 72 4China $30 34 24S.Africa $24 61 18India $14 2.33 52Source: WTO Report 2012
Services constitute 64.8 percent of the GDP in 2012-13 (AdvancedEstimates). The services sector includes the most sophisticated fieldslike telecommunications, satellite mapping and computer software tosimple services like carpentry, plumbing, to highly capital intensiveaviation and shipping, to labour intensive activities like tourism andhotels, to infrastructure intensive activities like roadways and portsand social sector activities like health and education. Service sectorgrowth is closely linked to growth in urbanisation. New generationeconomic activities like courier services, security services andhospitality services are now absorbing unskilled rural labour on alarge scale into urban areas. Government policy and privateinitiatives are further discussed in Chapter 6.
Indian manufacturing industry is largely driven by low-cost, skilledlabour, adequate land laws and reasonable cost of capital. The betterperformance of the manufacturing sector during 2007-2009 worked as ashock absorber against the global economic crisis domestically.According to an estimate of McKinsey and Co, Indian manufacturingsector has the potential to create up to 90 million jobs by 2025,almost double the present capacity of 45 million. In this, 80 percentwill be in the unorganised segment. Even in a gloomy environment,Indian manufacturing industry ranked as the fourth most competitivemanufacturing nation, behind China, the US and Germanyxxxii and it
positioned as the second highest after China in the GlobalManufacturing Competitiveness Index, 2013xxxiii. All these indicate thecapacity of Indian manufacturing to generate employment during thecrisis days.
Considering the positive aspect of fall in rupee value (a boost forglobal demand and export in the coming days), these sectors,manufacturing and services, should gear up to produce more employment.To facilitate this, the government is announcing multiple reforms andpolicies. Some of the key policy measures include establishment ofNational Investment Manufacturing Zone (NIMZ) in Prakasham District ofAndhra Pradesh which will lead to total 13 NIMZs in the country,National Policy on Electronic 2012 aim to have investment of USD 100billion by 2020.
3.4 Conflict and Extremism
The intensity of internal political, social and communal conflict hasincreased in India in the last 20 years. The number of districts whereextremist forces are active have been expanded from one district inWest Bengal in the late sixties to nearly 180 districts in 14 statesat present.xxxiv Over the years, statutory enactments and institutionalmechanisms for addressing the various aspects of deprivation have beenbrought into being. But the experience has been that the discontentand unrest continue to surface notwithstanding such measures.
The government approach to address this issue as a law and orderproblem has impeded the role of socio-economic development.Development deprivation prevails in these regions and has played amajor role in aggravating the situation. Social service deliverychannels are increasingly defunct. Besides, the frequent fights andcounter fights between extremist groups and security forces havelimited and even destroyed livelihood options of the people. The issueof livelihoods in civil strife regions emerged as a key developmentissue as these regions report high rates of internal displacement.Further, there is a high geographical congruence between poverty,adivasi populations and civil strife.

The civil strife areas are in general rich in natural resourcedeposits. The movement to install Maoist principles of revolution,while it may be led from the top by ideologues and follows in a longtradition of adivasi revolt against the state, also takes place in thecontext of wider conflicts between corporate industry and indigenouspeople over land and resources. These are coveted for livelihoodsustenance of the indigenous people; these regions meet naturalresources needs of corporate interests and also preferred locationsfor energy and power requirements. This, in general, results in thedisplacement of the local communities in favour of private capitalthat gives very limited attention to the sustainability of theenvironment and the livelihoods of the people. The Land Bill which ismaking its way into policy is discussed in detail in Chapter 3. Theshift in the land usage or non-voluntary displacement creates an issueof livelihood security. Simultaneously, there is lack of opportunityto update skills to adapt to the requirements of the new capital-basedindustries. The challenges of skilling and the government’s skillspolicy are discussed in detail in Chapter 6.
4. FOUNDATIONS OF GROWTH AND DEVELOPMENT
This section is about the factors which ensure growth and itsequitable distribution, about removing its impediments and structuringit to be more pro-poor and poverty-elastic. The section will cover thekey human development and supporting sectors which are required toensure a high poverty impact of growth: education and skills, health,financial inclusion, infrastructure and urban services.
4.1 Education and Skill Development
Education is the most important tool for socioeconomic mobility sinceit is a requisite for many new opportunities and openings and a keyway through which ascriptive social identities can be overcome andtransformed. It provides skills and competencies as it equips peoplewith the relevant knowledge, attitudes and skills to adapt to therequirements of the rapidly evolving labour market and the opportunityfor social mobility. It also enhances the negotiation power of thelabour.

India made significant progress in improving access to education inthe first decade of the 2000s. The mean years of schooling of theworking population (those over 15 years old) increased from 4.19 yearsin 2000 to 5.12 years in 2010. Enrolment of children at the primaryeducation stage has now reached near-universal levels. Youth literacyincreased from 60 percent in 1983 to 91 percent in 2009–10 and adultliteracy improved from 64.8 percent in 2001 to 74 percent in 2011.Itis estimated that emerging economies like China will face a shortageof highly skilled workers by 2020, while, based on current projectionsof higher education, India is likely to see a surplus by 2020. Thus,India could capture a higher share of global skilled work, if there isfocus on higher education and its quality is globally benchmarked.
The Twelfth Plan identified four main priorities for educationpolicy:- access, equity, quality and governance. A major thrust of thePlan is on improving learning outcomes and rendering secondaryeducation more job-relevant through skill training within schools. Forthis, higher investments will be needed to equip secondary schoolswith facilities (workshops, machines, computer equipment) andteachers/ trainers who have technical skills.
When it comes to fund allocation to achieve these goals, educationstill receives only 3.3 percent of GDP, far below the 6 percentsuggested by Kothari Commission in 1960s. It is envisage that in theTwelfth Plan, it will go up to at least 4 percent, if the fundallocation for school education enhances as per the norms of Right toEducation (RTE) Actxxxv. Till the end of eighties, school education waslargely in the public sector. Currently the share of public sector hasdeclined to nearly 80 percent of the schools and 27 percent ofchildren access private school education. According to ASERstatisticsxxxvi, demand for private school education is increasing inurban India at such a high rate that 50 percent of Indian children areexpected to attend private school by 2020. Unfortunately, this shiftdoesn’t necessarily reflect the quality improvement as there is noregulation to monitor the teaching and learning quality standards.
As per the review document of Eleventh Plan, two third of highereducation is already in the private sectorxxxvii. In the Twelfth Plan,

although government proposes growth in the Gross Enrollment Rate (GER)of higher education at 25.2 percent by 2017-18, governmentintervention is limited and gives extreme thrust to the private sectorwhich is unregulated and operating on for profit principles. Toaddress affordability, the government has provisioned for educationalloan schemes in the last Budget.
As per the plan document, India is expected to enhance its skilledlabour force from 12 percent at present to 25 percent by 2017 throughvocational training, when around 70 million skilled people will enterinto the work force. As mentioned above, vocational education andskill training is increasingly a critical component to develop anemployable workforce. In the last few years, several interestinginitiatives have taken place in this regard, by a largely private setof skills providers and investors. In an India where only 12 percentof the total enrolled children in the primary school reach atuniversity for higher education, the dropout could be absorbed byvocational education. But close dovetailing to industry job roles andrequirements is essential to deliver this shift in employability.These issues are further discussed in Chapter 6.
4.2 Health
The size of the working population in the age group of 15-59 years inIndia is expected to increase from 58 percent to 64 percent by 2021.For India to reap the benefit of a young and huge workforce, it shouldbe healthy, as well as skilled.
Health issues spread across nutrition, RMCHxxxviii, diseases, publichealth issues like safe drinking water, and sanitation. Thenutritional aspect of adolescent girls, pregnant women and childrenare critical as there is a cyclical pattern involved in the healthydevelopment of the populationxxxix.The Twelfth Plan document hasidentified availability (access), quality and affordability as thecore issues of the health sector in India in achieving universalhealth care goals. To achieve these goals, the government has toincrease the allocation for the health sector from 1.04 percent of GDPin the Eleventh Plan to 3 percent of GDP by the end of the Twelfth

Plan as suggested by the High Level Expert Group (HLEG)xl. The numberof hospital beds has to be increased to 2.8 million by 2014 to matchthe global average of three beds per 1000 population from the present0.7 bedsxli and to ensure the availability of the health workers at theminimum requirement of 250 per lakh of population, India needs to addanother 2.6 million health workersxlii. In addition, there is asignificant gap in the number of health care systems in rural, semi-urban areas. According to the Census 2011, India faces a shortfall of35,762 sub-centres, 7,048 primary health centres and 2,766 communityhealth centres. These are very critical to address the core of thehealth care system of the poor households in the country.
The plan of public investment in health is limited. Instead, PPPinterventions are promoted at various levels of health care includingimparting skill training. According to the National Family HealthSurvey-3 (NFHS-3), the private sector dominates the health careservice in both urban (70%) and rural (63%) areas. The Indianhealthcare sector expects to touch USD 280 billion by 2020. Thehospital services market alone will be worth USD 81.2 billion by 2015.This reflects in the FDI flow to the sector: while hospitals anddiagnostic centres received USD 1395.82 million, medical and surgicalappliances received USD 523.54 million, and drugs and pharmaceuticals,USD 9,659.26 million. In addition, government promotes health tourismby incentivizing it and, as the rupee falls, the sector shouldbenefit.
All these indicate that through achieving the health sector goals,India should not only achieve a healthy population, but also gainmajor employment as well.
4.3 Financial Inclusion
The priority sector lending (PSL) prescriptions to India’s banks are akey pillar of support to livelihoods. PSL broadly includes advances toagriculture, small scale industries, weaker section, exports,education and SHGs. The revised guidelines issued by the RBI on 20July 2012, mandate commercial banks to tender 40 percent of theiradvances towards priority sector, while for foreign banks the limit isat 32 percent of their total advances. The total outstanding of the

priority-sector advances of PSB reported a 10.6 percent growth during2011-12 period, but declined in the last fiscal. The consolation isthat during 2012-13, the lending to agriculture sector was higher thanthe target. The banks’ credit to the small and medium enterprises(SME) sector registered a growth of 29.8 percent in 2012-13 over theprevious year. Though the NPA and decline in credit flow adverselyaffects the banking sector, the PSL to agriculture and SME give ascope for breath. They play a critical role in supporting thelivelihood development of the rural sector and the banking policyshould promote livelihood credit.
Microfinance was Rs 400 billion industry in 2010. Over a period of twodecades, the SHG Bank Linkage Programme (SBLP) incrementallyaccelerated to reach out to rural poor through 8 million SHGs,maintained a balance of Rs. 65 billion in the savings accounts withthe banks, while they are estimated to have harnessed savings of overRs. 220 billion, of which nearly Rs. 150 billion was for internallending. Over 4.4 million SHGs are regularly availing creditfacilities from the banksxliii. On the other hand, the entrepreneur-ledMFIs grew significantly in the last one decade. Along with growthcomplexities, a disastrous crisis evolved in Andhra Pradesh in 2010,resulting in the dramatic shrinkage of the sector. Loans disbursedthrough MFIs came down to Rs. 226 billion in 2011-12 from Rs. 350billion in 2010-11. Various measures have been taken by RBI and otherstakeholders to bring the sector back on track, directing greatertransparency, customer protection and adherence to the code of conductwithin the sector. Towards this, RBI issued guidelines for Banks’lending to the MFIs and introduced a new category of NBFC-MFIs inDecember 2011. It also deferred the implementation of assetclassification and provisioning norms for NBFC-MFIs to April 01, 2013,and put in place a unified code of conduct for the sector and itsimplementation.

In this context it is imperative to look at the status of financialinclusion in the country. The banking penetration in India remains lowat 58.7 percent of the total population and only 55 percent havedeposit accounts. According to the Ministry of Finance (2012), only 5percent of the villages in the country have banks and nearly half ofthe districts in the country are under-banked. Government of India hasaccepted financial inclusion as a key strategy to improve thelivelihood of the people in India, and in 2004, RBI set up the KhanCommission for this purpose. Accordingly, RBI relaxed the bankingnorms with the following measures:- permitted "no-frills" bankaccounts for holders wtih annual deposits of less than Rs.50,000;relaxed know your customer (KYC) norms; issued general credit cards(GCCs) to the poor and the disadvantaged with a view to help themaccess easy credit; and permitted commercial banks to make use of the
Box: CRISIL Inclusix Index of financial Inclusion 2013
To monitor the status of financial inclusion activities in India, CRISILcreated a tool that would help policy-makers, regulators, and financial sector intermediaries at large in measuring the extent of financial inclusion, both at a broader and disaggregated level as their corporate social responsibility intervention. CRISIL Inclusix measures financial inclusion by evaluating the penetration of banking services. The first report analysed the financial inclusion metrics based on data collected from 165 banks in 632 districts of the country over a three-year timeframe (2009-2011). Some of the key findings of CRISIL Inclusix:-
1. Deposit penetration (DP) is the key driver as the number of savings bank accounts, at 624 million, is near four times of the number of loan accounts at 160 million.
2. Enhancement of branch presence and credit availability are very critical. The bottom 50 scoring districts have only 4,068 loan accounts/100000 population, which is nearly 1/3rd of the all India average of 11,680. They only 3 branches/100000 population, against7.6 branches/100000 population at an all-India level.
3. CRISIL Inclusix score improved over the past three years to 40.1 in 2011, from 37.6 in 2010 and 35.4 in 2009.
4. Wide disparities exist across India in terms of access to financial services. Six largest cities have 11 percent of the
services of NGOs/SHGs, MFIs and other civil society organizations asintermediaries for providing financial and banking services.xliv.
As the result of the financial inclusion campaign, states or unionterritories like Puducherry, Himachal Pradesh and Kerala announced 100percent financial inclusion in all their districts and over 62,000villages have been covered by bank branches or business correspondentsby January, 2012. RBI also aims to open nearly 600 million newcustomers' accounts and service them through a variety of channels byleveraging on new technologies by 2020. Since financial education isconsidered as an impediment to achieve financial inclusion objectives,the RBI launched the National Strategy for Financial Education with avision to build “a financially aware and empowered India” on July 16,2012. With the help of CRISIL, the rating agency, RBI and Ministry ofFinance started a financial inclusion monitoring system, CRISILInclusix (see the box).
4.4 Infrastructure Growth
Infrastructure growth is instrumental in transforming India in manyways. Transportation, technology (which includes informationtechnology and telecommunication) are revolutionizing the life andlivelihoods of the people of India. Investment in infrastructuredevelopment, hence, should be considered as the channel for trickledown in the neoliberal period, as it increases the access toservices, connectivity (both physical and virtual), facilitates quickaccess to information, increases access to markets (both labour andcommodity) and helps to strategise production plans according to theweather conditions and external market scenarios.
The huge investment in infrastructure development in the country inthe last two decades was largely focused on the requirements ofindustry and service sector. The investment for rural and agriculturalsector declined substantially.xlv Infrastructure investments arguablyneed to be revived in these two sectors, as the economy gets deeperinto a challenging period. This investment will not only boostemployment opportunities in rural and semi-urban areas, but alsoimprove the quality of critical services.
Investment in transportation and information communication technologyis a great livelihood facilitator. It helps people to opt for the bestlivelihood choice as per the available information. The internalmigration patterns in India in the last few years are very clearlylinked with access to information on labour markets and increasedcapability to respond to this using improved transportationfacilities. For example, road transportation received good investmentin the last one decade in which the national highways attracted FDIs.The national highways cover two percent of total roads but cater to 40percent of transport and attract more than 50 percent of theinvestment. The rural road system in the country is also receivingmore policy attention and fund allocation in the Twelfth Plan.
Considering the livelihood challenge that might affect the country inthe present scenario, pumping more money into infrastructuredevelopment will enhance the livelihood options of people by wideningtheir access to and broadening markets for their products. It willalso facilitate the movement of people from one location to anotherfor livelihoods and education, for example. Unlike the policy makersof the post-Independence period who sidelined growth while shapingeconomic priorities, present day policy makers must combine growthwith development.
4.5 Urbanisation and livelihoods
Urban centres are known as the engine of economic growth. Urbancentres attract inflows of people from rural and semi-urban areas.Patterns of ‘step migration’ and seasonal migrationxlvi are visiblethroughout India, from rural to urban areas. In absolute terms nearly377 million Indian live in 7935 towns. One third of the urban peopleare poor in 2011.
The urban oriented sectors (secondary and tertiary) report impressivegrowth in income and employment generation during the post 2008period. Sectoral employment performance is discussed in more detail inChapter 2. In the last two decades, urban India witnessed an amazingdiversification in the semi-skilled and unskilled occupations. Most ofthese activities (security guard services, courier services, florists,house keeping services and domestic services) require basic literacy.

Meanwhile, basic service delivery in urban areas such as housing,water supply, sanitation, solid waste management and public transportis still inadequate. In case these sectors receive sufficient fundsfor infrastructure development, their potential to provide employmentis huge.
To sustain inclusive growth in the urban environment, it is essentialto address the basic needs of the urban poor by equipping them withnecessary skills to take advantage of the growth process and at thesame time reducing institutional dys-functionalities that hamperinclusive and sustainable development of urban conglomerations.Twelfth Plan documents on urban development suggest a multi-prongedstrategy to meet the following objectives:
1. Accelerate the rate of job creation in urban areas2. Impart relevant skills to urban poor3. Facilitate self-employment for urban poor wherever this viable4. Proactive and mandatory creation/allocation of spaces within city
boundaries to ensure livelihood opportunities to the urban poor.5. Provide basic services to the urban poor, especially through
rehabilitation of slums6. Ensure financial inclusion of urban poor7. Ensure legislative inclusion of urban poor8. Facilitate the transition of the urban poor from the informal
sector to the formal one and extend the provisions of socialsecurity
The plan is expected to fund programme and projects to achieve theseobjectives mainly through the flagship programme, JNNURMxlvii. The fundallocation raises some concerns as during Eleventh Plan JNNURM hasreceived Rs.123,711 crore, while it is now reduced to Rs. 101,917crore in the Twelfth Plan. The other major initiative to address urbanpoverty by employment promotion is the National Urban LivelihoodsMission (NULM). This will provide policy and programmatic attention onthe issue of urban livelihoods in a structured way. This will replacethe existing SJSRY from the beginning of the Twelfth Plan. NULM willbe target oriented with specific focus on the primary issuespertaining to urban poverty, such as skill up-gradation,

entrepreneurship development and employment creation through wageemployment and self-employment opportunities opened up by the emergingmarkets in urban areas using a mission approach. The vision of thesetwo flagship programmes is very encouraging, but the budget allocationto achieve the mission goals needs to be increased.
Considering the growth of urban areas in the country, it is essentialto increase the capital formation in the urban infrastructuredevelopment in a huge way. This will help to reduce the burden ofagriculture in one way and on the other hand, promote the inclusivegrowth that is envisaged by the policy makers.
REFERENCES
Government of India (2012), Draft Twelfth Five Year Plan (2012-17)document, Vol I, Faster, More Inclusive and Sustainable Growth,Planning Commission.--------------(2013) Economic Survey 2012-13, Ministry of Finance. --------------(2013) Union Budget 2013-14, Ministry of Finance. ‐‐‐‐‐‐‐‐‐‐‐‐‐‐(2012) Report of the Working Group on “EffectivelyIntegrating Industrial Growth and Environment Sustainability”Twelfth Five Year Plan (2012-2017), Planning Commission. ‐‐‐‐‐‐‐‐‐‐‐‐‐‐(2013) Strategy Document Part 1 and 2 of Twelfth FiveYear Plan, Planning Commission. ‐‐‐‐‐‐‐‐‐‐‐‐‐‐(2012) Review of Eleventh Five Year Plan, PlanningCommission.
Websites
Planning Commission Ministry of FinanceMinistry of Rural DevelopmentMinistry of Human Resource DevelopmentMinistry of Small Scale Industries and Micro-enterprisesMinistry of LabourCensus of India

Reserve Bank of IndiaNABARDVarious newspapersIndia TogetherWorld BankUN Agencies

ihttp://www.dnaindia.com/india/1719749/report-trickle-effect-wont-work-in-india- feels-president-pranabda, accessed on August 3, 2013ii This figure is by nominal GDP (nearly USD 2trillion). In purchasing power parityterms, it is the third largest. During 1981-85 the GDP was USD 179 billion and it was ranked 17th in 1981-85 (Narendra Yadav, India and the Global Economy, at http://drnarendrajadhav.info/drnjadhav_web_files/speeches/EXIM%20Bank%20Speech%20-%20India%20Global%20Economy.pdf ) . Accessed on August 23, 2013.iiihttp://www.worldbank.org/content/dam/Worldbank/document/ State_of_the_poor_paper_April17.pdf. . Accessed on August 6, 2013.iv Gaurav Choudhury and Zia Haq, Spinning new jobs, critical for India’s long-term economic equilibrium, Hindustan Times May 13, 2013. v Based on a World Bank estimation 2013.vi Bipan Chandra, (1966), The Rise and Growth of Economic Nationalism in India, People’s Publishing House Pvt Ltd, New Delhi.viiNaoroji, (1887) Essays, Speeches and Writings, Edited by CL Parekh, Bombay and itis cited in Bipan Chandra, (1966), The Rise and Growth of Economic Nationalism in India, People’s Publishing House Pvt Ltd, New Delhi.viii Jagdish Bhagwati, Arvind Panagariya (2013). Why Growth Matters: How Economic Growth in India Reduced Poverty and the Lessons for Other Developing Countries. Public AffairsixMethodology of Suresh Tendulkar committee to estimate poverty rate used the NSSO consumption expenditure data for 2011-12. Poverty line divides the poor from the non-poor put a price on the minimum required consumption levels of food, clothing, shelter, fuel and health care, etc. Tendulkar estimation does not consider the expenditure on health and education, both of which are expected to be provided by the State. But, now 80% of the health care is with private and education is increasingly moving to the private. x Tendulkar Committee methodology used the CPI of agricultural labourer weighted bythe consumption pattern of the rural people at the national level for 1973-74 for rural areas and a simple average of the index of the industrial workers weighted by the consumption pattern of the people and the CPI for urban non-manual employeesfor the urban areas used to update the urban poverty line(Report of the Expert Group on Estimation of Proportion and number of Poor, Planning Commission, New Delhi 1993).xihttp://www.thehindu.com/news/national/beyond-the-debate-govt-accepts-65-indians- are-poor/article4948698.ece?ref=relatedNews . Accessed on August 5, 2013.xiiGlobal Wages Report, 2012‐13, International LabourOrganisation.xiiiGulati, Ashok; Jain, Surbhi and Satija, Nidhi (2013): Rising Farm Wages in India– The ‘Pull’ and ‘Push’ Factors, Discussion Paper No 5, Commission for AgriculturalCosts and Prices, Department of Agriculture & Cooperation, Ministry of Agriculture,Government of India, New Delhi, April 2013.xiv Measured by the Gini Coefficient. The coefficient ranges from zero to one, with zero representing perfect equality and one showing perfect inequality. Hence, the more the coefficient, the more the inequality.xv The spending and consumption by the richest 5 percent shot up by over 60 percentbetween 2000 and 2012 in rural areas while the poorest 5 percent witnessed only an increase of 30 percent. In urban areas, it is 63 percent and 33 percent respectively.xvi Food and Agricultural Organisation of United Nations, The State of World Fisheries and Agriculture, 2010.
xvii http://www.righttofoodindia.org/ . Accessed on August 23, 2013.xviii GCF was earlier known as gross domestic investment and also referred to as “capital stock”.xix It generates through bank deposits, small saving schemes, mutual funds, equity market, insurance, corporate bonds gets channeled to private and public enterprisesthat then use it for investments.xx This is well reflected in this year’s Economic Survey, 2012-13.xxi Address by Dr. K. C. Chakrabarty, Deputy Governor, RBI at the Yes Bank–GIZ–UNEP Sustainability Series event on Environment and Social Risk Management, on April 23,2013 at Mumbai.xxii This was agreed at the UNFCC meeting held in Doha in December 2012xxiii Most of the expressway/ national high way toll fees are set in such a way that the builder will receive the investment within the first 5 to ten years, but the collection of fee will go on till the end of the lease period or agreed period which is in some cases went up to 99 years. http://newindianexpress.com/cities/chennai/article545416.ece?service=print. Accessed on August 4, 2013xxiv Report of the expert committee, “Towards Holistic Panchayati Raj: Twentieth anniversary report of the expert committee on leveraging Panchayats on efficient delivery of public goods and services.” Vol-I, Policy Issues 24th April 2013, pp16-17xxv Mathew 2013, “Panchayati Raj or Collector Raj, Times of India, April 15th, Page 10xxviReport on Key Indicators of Household expenditures in India, 2009-2010, NSS 66th Round, 2011. xxviiFinance Minister P Chidambaram’s statement in Parliament on 11 August, 2013. In 1991, India’s dept was 21% of current account receipts.xxviii Production measured in terms of the Index of Industrial Production (IIP) whichdetails out the growth of various sectors in an economy.xxix Department of Industrial Policy &Promotiongxxx Advanced Estimate of Central Statistical Organisation tabled in the Parliament on 7 February, 2013.xxxi Shah, Deepak (2012): Implications of Economic and Financial Crisis for Agricultural Sector of India, MPRA Working Paper, 39298. See http://mpra.ub.uni-muenchen.de/39298/1/MPRA_paper_39298.pdf . . Accessed on August 8, 2013xxxiiDeloitte’s global index, 2013.xxxiiiBased on a survey of CEOs, executives and other officials of 550 global manufacturing companies.xxxiv Expert Group Report on “Development Challenges in the Extremist Affected Regions,” Planning Commission, Government of India, 2008xxxvTo maintain minimum quality standards in school infrastructure, teachers training and recruitment of teachers under Sarva Sikha Abhyan (SSA).xxxvi ASER (2012): Annual Status of Education Report, published by ASER, New Delhi.xxxviiIn Eleventh Plan period, the private sector grew at 64 percent and public sector at 50 percent.xxxviii Reproductive, Maternal and Child Healthxxxix Malnutrition among the adolescent girls will lead to malnutrition among young pregnant mothers. This will result in the child survival and birth of under-weight children. In case the child underfed and didn’t receive nutrition in the 0-6 year

period, the probability of the child to grow as a malnutrioned person is very high which will lead to the another cycle of malnutrition. xl Government of India (2012), Report of High Level Expert Group on Health, Planning CommissionxliIndia needs 100,000 beds each year for the next 20 years.xlii This does not indicate the optimum situation. For that the ratio should be increased to 354 health workers per lakh of population by 2017 (Human Resources forHealth: Overcoming the Crisis, 2004, Joint Learning Initiative). This number includes doctors, nurses, ANMs and ASHAs or community health workers.xliii Microfinance Status Paper, NABARD 2012xlivThese intermediaries could be used as business facilitators or business correspondents by commercial banks.xlvThe financial requirements of Ministry of Human Resource Development (MHRD) to meet the infrastructure requirements as per the RTE Act and the suggestion of HLEG on health to increase the availability of health care facility in the rural India and district/ block levels including training centres has been declined by the planning commission while finalizing the Twelfth Five Year Plan document.xlviRecent studies on Indian internal migration reveals clear step pattern to migration whereby people move initially from one rural are to another during the harvest/ cultivation period; then they shift to rural to semi-urban areas that have manufacturing units. Finally they have become semi-permanent migrants to urbanareas. Seasonal or circular migration refers to perhaps the 100 m Indians who spendbetween four and ten months a year working away from their villages but have no fixed abode during this time, returning annually for the farm season (Deshingker&Aktar 2009). Deshingkar, Priya and Akter, Shaheen (2009), Migration andHuman Development in India, Human Development Research Paper 2009/13, United National Development Programmes, India.xlviiJNNURM is a massive city-modernisation scheme launched by the Government of India under Ministry of Urban Development in 2005 December. The scheme was meant toimprove the quality of life and infrastructure in the cities. Initially it was launched for a seven-year period (up to March 2012) to encourage cities to initiatesteps for bringing phased improvements in their civic service levels. The government has extended the tenure of the mission for two years, i.e., from April 2012 to March 31, 2014 and it is likely to continue under the Twelfth Five year plan as well.
Copyright © 2022 FDOKUMEN