Bacterial cellulose as a biodegradable material for textile industries
Upload
khangminh22Category
view
0download
0
Report No. 18857-IN
IndiaCotton and Textile IndustriesReforming to Compete(in Two Volumes) Volume !: Main Text
January 14, 1999
Rural Development Sector UnitSouth Asia Region
Document of the World Bank
Pub
lic D
iscl
osur
e A
utho
rized
Pub
lic D
iscl
osur
e A
utho
rized
Pub
lic D
iscl
osur
e A
utho
rized
Pub
lic D
iscl
osur
e A
utho
rized
Pub
lic D
iscl
osur
e A
utho
rized
Pub
lic D
iscl
osur
e A
utho
rized
Pub
lic D
iscl
osur
e A
utho
rized
Pub
lic D
iscl
osur
e A
utho
rized

CURRENCY
Rs/ US$Currency Official Unified Market
Prior to June 1966 4.76June 6, 1966 to mid-December 1971 7.50Mid-December 1971 to end-June 1972 7.28
1971-72 7.441972-73 7.711973-74 7.791974-75 7.981975-76 8.651976-77 8.941977-78 8.561978-79 8.211979-80 8.081980-81 7.891981-82 8.931982-83 9.631983-84 10.31198485 11.891985-86 12.24198647 12.79198748 12.971988-89 14.481989-90 16.661990-91 17.951991-92 24.521992-93 26A1 30.651993-94 31.361994-95 31.401995-96 33.461996-97 35.501997-98 37.16
Jan 1998 39.36Feb 1998 38.91Mar 1998 39.50
Note: The Indian fiscal year runs from April 1 through March 31.
Source: IMF, International Finance Statistics (IFS), line "rf"; Reserve Bank of India.
a A dual exchange rate system was created in March 1992, with a free market for about 60percent of foreign exchange transactions. The exchange rate was reunified at the beginning ofMarch 1993 at the free market rate.
Vice President: Mieko NishimizuDirector: Edwin LimSector Unit Leaders: Ridwan Ali/Michael BaxterStaff Members: Benoit Blarel/Dina Umali-Deininger

Abbreviations andAcronyms
AICCIP All India Cotton Coordinated improvement ProjectAMPA Agricultural Product Markets ActATC Agreement on Textiles and ClothingBIFR Board for Industrial and Financial ReconstructionCACP Commission for Agricultural Costs and PricesCCI Cotton Corporation of IndiaCIB Central insecticides BoardCICR Central Institute for Cotton ResearchCIRCOT Central Research on Cotton TechnologyCV Coefficient of VariationEC Act Essential Commodities ActELS Extra-Long StapleEOUs Export Oriented unitsEPCG Export Promotion Capital Good SchemeFAO Fair Average QualityFC(R)A Forward Contracts (Regulation) ActGATT General Agreement on Tariffs and TradeGOI Government of IndiaHYO Hank yarn ObligationICDP Intensive Cotton Development ProgramICMF Indian Cotton Mills FederationIPM Integrated pest ManagementITMF International Textile Manufacturers FederationIPR Intellectual Property RightsMSCCGMF Maharashtra State Cotton Cooperative Growers' Marketing
FederationMCPS Maharashtra Cotton Procurement SchemeMEP Minimum Export PriceMFA Multi-Fiber AgreementMMF Man Made FibersMOA Ministry of AgricultureMODVAT Modified Value Added TaxMSP Minimum Support PriceNPC Nominal Protection CoefficientNTC National Textile CorporationNTSD Non-transferable Specific Delivery Cotton ContractsOGL Open General LicenseOTC Office of the Textile CommissionerQRs Quantitative RestrictionsRBI Reserve Bank of IndiaSITRA South Indian Textile Research AssociationVABAL Value Added Based Advanced License
Weights and Measures
qtl - quintal (100 kg) kg - kilogram bale - 170kgsha - hectare mt - metric ton
INDIA
COTTON AND TEXTILE INDUSTRIES:REFORMING TO COMPETE
Volume I
Contents
CurrencyAbbreviations and AcronymsAcknowledgmentsEconomic Development DataExecutive Summary
Chapter 1 Textile: Adjusting to Competition ..................................................... 1
A. Introduction ..................................................... 1B. Structure ..................................................... 2C. Export-Led Boom ..................................................... 3D. Textile Supply .................................................... 5E. Spinning Performance ..................................................... 6F. Manmade Fiber Products ..................................................... 9G. Weaving Performance .................................................... 10H. The Handloom Sector .................................................... 12I. Apparel Makers .................................................... 12J. Conclusion .................................................... 14
Chapter 2 Cotton: Farming and marketing .................................................... 15
A. Cotton Production .................................................... 15B. Policy and Productivity .................................................... 17C. Technical Constraints .................................................... 19D. Marketing and Quality .................................................... 22E. Conclusion .................................................... 27
Chapter 3 Program for Action .................................................... 28
A. For a More Efficient More Competitive Textile Industry ................................................... 28B. Improving Cotton Production and marketing ....................... ............................. 31C. Conclusion .................................................... 36D. References .................................................... 37

List of Tables
Table 1.1: Exports of Textile Products .......................................................... 3Table 1.2: India Cotton and Textile Exports as a Percentage Share of Production
and World Textile Trade ....................................... 3
Table 1.3: Production Trends of Cotton Yarn and Cotton Fabrics ....................................... 5Table 1.4: Policy Environment in the Textile Industry, 1997 ....................................... 6Table 1.5 Index of Manufacturing Cost Components of Spinning Mills using
Thailand as Reference ................................................... 7Table 1.6 Effective Protection of yarn EOUs and Domestic-oriented Firms, 1995 ............................... 7Table 1.7 Competitiveness of Different Categories of Mills by Yarn Counts at
World Cotton and Ya rn Price s, Rs/kg ................................................ 8Table 1.8 Hank yarn Obligation Transfer Prices ................................................ 8Table 1.9 Impact of Excise Duties on Market Prices for Different yarn Types ..................................... 9Table 1.10 Import Tariffs on Cotton and Manmade Products ............................................... 10Table 1.11 Comparison of Cost of Production of Gray Cloth,
$US/yard of 6.3 inch wide cloth.1 Table 1.12 Public Textile Enterprises: Cumulative net Profits and Losses (89/90-93/94)
and Net Worth (93/94) and Number of Employees.1 Table 1.13 Cost per Standard Minute Produced of a Standard Clothing Item,
Selected Countries, 1995 DM per standard minute ................................... 13Table 2.1 Cotton Production and Export Quotas ................................... 17Table 2.2 Outbreaks of Major Pests by Year and State ................................... 20Table 2.3 Total Requirement and Supply of Quality Seeds 1994/95,
100% Replacement Rate ........................................ 22Table 2.4 Summary of Cotton Marketing Regulations and Controls ........................................ 25Table 3.1 Short-term Changes in Net Income and Export Values ........................................ 30Table 3.2 Incremental Impact of Domestic Reforms on India's Welfare
in Year 2005 (1992 US$ million) .31Table 3.3 Summary Incremental Impact on Net Textile Export Revenues
of Selected Policy Reforms ......................................................... 32
List of Boxes
Box 1.1: The Agreement on Textiles and Clothing and the Phase-out of the MFA .4Box 1.2: Evolution of India's Cotton Textile Policy. 5Box 2.1 GOI Integrated Pest Management Program ......................................................... 20Box 2.2 Cotton: Marketing and Distribution of Improved Seeds ........................................................ 21Box 2.3 Seed Cotton Fiber Properties and Textile Product Output ...................................................... 24Box 3.1 Mexico's Cotton Price Support Scheme ......................................................... 35
List of Text Figures
Figure 2.1 Cotton Production, Area, Yield 1974/75 to 1995/96 ......................................................... 16Figure 2.2 Average Cotton Lint Yields in Selected Countries and Indian Regions, 1992-94 .................. 16Figure 2.3 Nominal Protection Coefficients for MCU-5, S-4, and J-34
Cotton Lint (Exportable hypothesis) ..................................................... 18Figure 2.4 Nominal Protection Coefficients for Cotton Seed (Importable Hypothesis) .......................... 18Figure 2.5 Nominal Protection Coefficients for Seed Cotton (Exportable Hypothesis) ............................. 19

Volume II
Annex 1 Textile Industry PolicyAnnex 2 Cotton Sector PolicyAnnex 3 Structure and Performance of the Textile IndustryAnnex 4 Cotton Production Performance and ProspectsAnnex 5 Structure & Performance of Cotton MarketsAnnex 6 MFA Phase-out and Cotton and Textile PolliciesAnnex 7 Policy Options for Liberalizing the Cotton Textile Industry

ACKNOWLEDGEMENTS
The report was prepared by Dina Umali-Deininger and Benoit Blarel. It is based on thefindings of a World Bank team which visited the states of Maharashtra and Haryana to studycotton marketing in April-May 1995, and India to study the textile industry in December 1995. Itdraws from contributions by A.K. Basu on cotton seed industry and policy, S. Jayaraj on pesticidepolicy and pest management, and M. Balasubramanian on these topics; Thomas Bell, MadhooPavaskar and Elton Thigpen on cotton marketing; Deepak Ahluwalia on cotton policies; PanosVarangis on cotton price behavior and risk management; Garry Pursell and Geetha Sethi on theprotection coefficient of the cotton and cotton-spinning industries; Mona Haddad, HarBhattacharya and Sumitra Chaudhuri on the spinning industry, and Sanjay Kathuria on theapparel industry; Aziz Elbehri, Thomas Hertel, and Will Martin on the Multi-Fibers Agreementphase-out, and Masanori Kondo on the policy options to liberalize the cotton and textileindustries. Peer reviewers are Richard Henry (IFC), Alberto Valdes and Gershon Feder. Theteam is also grateful for the support and advise from Shawki Barghouti (former Division Chief,World Bank), Roberto Zagha (Sector Manager), Rui Coutinho (Principal Economist) and JohnWilliamson (Chief Economist) in producing this report.
The report benefited and reflects discussions held with the Indian authorities in September1997. We gratefully acknowledge the cooperation and valuable assistance of central governmentofficials, state government officials from Maharashtra and Haryana for their collaboration andsupport, and the officials from the Cotton Corporation of India. We wish to express our gratitudeto members of professional and inter-professional associations of the cotton, and textileindustries, members of the business and cotton farming community for their valuable time,assistance, and for sharing with us their intimate knowledge of their respective industry.
Arrangements for the mission to India were made by Marilyn Chatterjee and PadmaGopalan. Production assistance was provided by Roko Morith and Theodosia Karmiris. AlfredFriendly provided editorial support to this report.

ECONOMIC DEVELOPMENT
GNP Per Capita (US$, 1996-97): 380
Gross Domestic Product (1996-97)
Annual Growth Rate (% p.a., constant prices)%of 70-71- 75-76- 80-81- 85-86- 92-93 93-94-
US$ Bln GDP 75-76 80-81 85-86 91-92 96-97GDP at Factor Cost 323.7 90.0 3.4 4.2 5.4 5.2 5.3 7.1GDP at Market Prices 359.7 100.0 3.3 4.2 5.6 5.4 5.3 7.0Gross Domestic Investment 90.7 25.2 5.3 3.7 5.7 6.6 12.3 11.4Gross Domestic Saving 78.8 21.9 4.4 2.6 4.6 7.9 9.7 12.5Current Account Balance -4.4 -1.2 -- -- -- -- -- --
Output, Employment and Productivity (1990-91)
Value Added Labor Force b V. A. per WorkerUS$ Bin. % of Tot Mill. % of Tot. US$ % of Avg.
Agriculture 82.5 31.0 186.2 66.8 443 46.4Industry 78.0 29.3 35.5 12.7 2198 230.2Services 105.7 39.7 57.2 20.5 1848 193.7Total/Average 266.2 100.0 278.9 100.0 954 100.0
Government Finance
General Government cCentral GovernmentRs. Bln. % of GDP Rs. Bln. % of GDP96-97 96-97 90-91-96-97 96-97 96-97 90-91-96-97
Revenue Receipts 2424.1 19.0 19.3 1531.4 12.0 11.5Revenue Expenditures 2936.8 23.0 23.1 1834.1 14.4 14.9Revenue Surplus/ Deficit (-) -512.7 -4.0 -3.8 -302.7 -2.4 -3.4
Capital Expenditures d 436.6 3.4 4.4 399.9 3.1 3.7
External Assistance (net) e 29.9 0.2 0.6 344.3 2.7 2.3
Money, Credit, and Prices
90-91 91-92 92-93 93-94 94-95 95-96 96-97(Rs. billion outstandinz. end of neriod)
Money and Quasi Money 2658.3 3170.5 3668.3 4344.1 5314.3 6040.1 7001.8Bank Credit to Government (net) 1401.9 1582.6 1762.4 2039.2 2224.2 2577.8 2888.2Bank Credit to Commercial Sector 1717.7 1879.9 2201.4 2377.7 2927.2 3446.5 3753.6
(percentage or index numbers)Money and Quasi Money as % ofGDP 49.6 51.4 52.0 53.6 55.2 54.0 54.8Wholesale Price Index (1981-82 = 100) 182.7 207.8 228.7 247.8 274.7 294.8 314.6
Annual Percentage Changes in:Wholesale Price Index 10.3 13.7 10.1 8.4 10.9 7.3 6.7BankCredittoGovernment(net) 19.7 12.9 11.4 15.7 9.1 15.9 12.0Bank Creditto Commercial Sector 13.2 9.4 17.1 8.0 23.1 17.7 8.9
a. The per capita GNP estimate is at market prices, using World Bank Atlas methodology. Otherconversions to dollars in this table are at the prevailing average exchange rate for the period covered.
b. Total Labor Force from 1991 Census. Excludes data for Assam and Jammu & Kashmir.c. Transfers between Centre and States have been netted out.d. All loans and advances to third parties have been netted out.e. As recorded in the government budget.
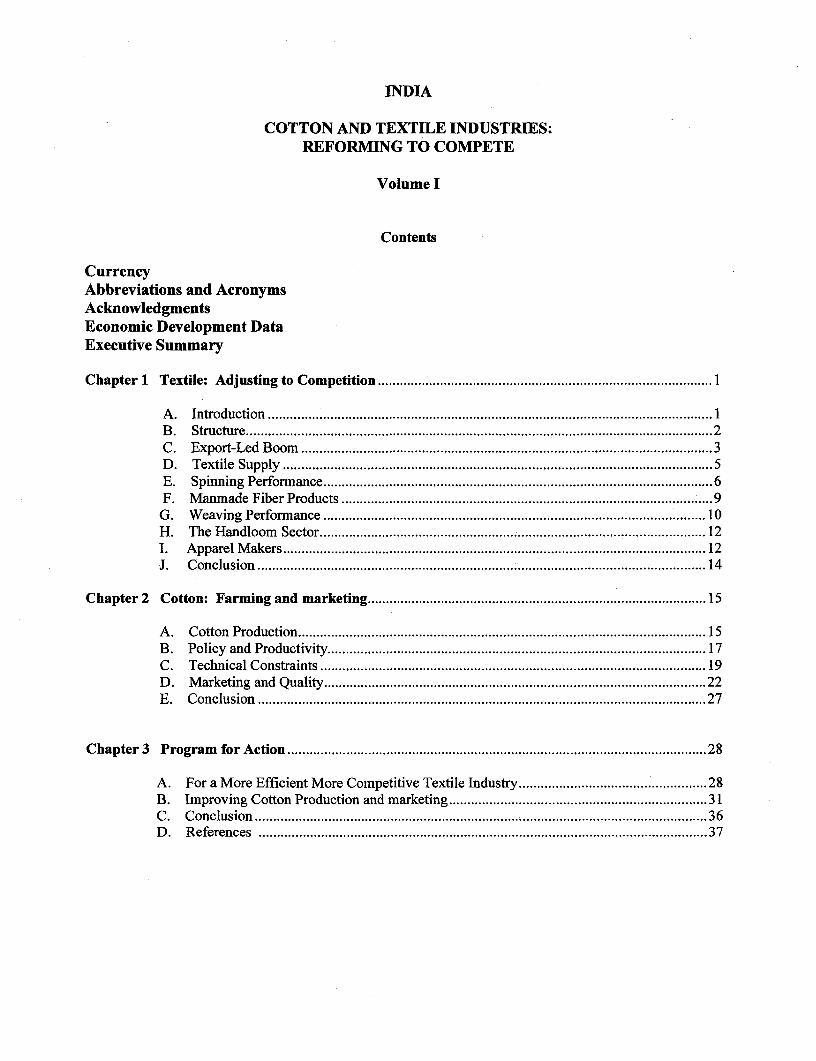
Balance of Payments (US$ Millions) Merchandise Exports (Average 1990-91-1996-97)
1994-95 1995-96 1996-97 US$ Mil % of Tot.
Exports of Goods & NFS 32,990 39,668 42,379 Tea 386 1.6Merchandise, fob 26,855 32,311 33,764 Iron Ore 486 2.1
ImportsofGoods&NFS 41,437 51,213 54,271 Chemicals 1,919 8.1Merchandise, cif 35,904 43,670 48,063 Leather & Leather products 1,457 6.2of which Crude Petroleum 3,285 3,442 4,797 Textiles 3,000 12.7of which Petroleum Products 2,396 3,759 5,239 Garments 2,875 12.2
Trade Balance -9,049 -11,359 -14,299 Gems and Jewelry 3,894 16.5Non Factor Service (net) 602 -186 2,407 Engineering Goods 3,229 13.7
Others 6,363 26.9Resource Balance -8,447 -11,545 -11,892 Total 23,610 100.0
Net factor Income' -3,711 -3,497 -3,584 External Debt, March 31, 1997Net Transfersb 8,093 8,506 11,071
US$ Mil.Balance on Current Account -4,065 -6,536 -4,405 Public & Publicly Guaranteed 74,406
Private Non-Guaranteed 7,382Foreign Investment 4,922 4,794 5,834 Total (Including IMF and Short Term) 89,827Official Grants and Aid 416 345 410Net Medium & Long Term Capital 2,357 562 -758 Debt Service Ratio for 1996-97
Gross Disbursements 7,533 7,585 6,483Principal Repayments 5,175 7,023 7,240 % curr receipts
Public & Publicly Guaranteed 20.6Other Capital FlowsC 2,410 -2,113 1,582 Private Non-Guaranteed 1.3Non-Resident Deposits 818 944 3,536 Total (Including IMF and Short Term) 24.5Net Transactions with IMF -1,174 -1,719 -972
1BRD/ IDA Lending, March 31, 1997 (US$ Mil)Overall Balance 6,858 -2,004 6,199
IBRD IDAChange in Net Reserves -5,684 3,723 -5,227 Outstanding and Disbursed 8,768 17,616Gross Reserves (end of year)d 21,160 17,436 22,664 Undisbursed 3,097 4,368
Outstanding incl. Undisb. 11,865 21,984Rate of Exchange
End-Mar 1998' US$ 1.00 = Rs. 39.50
-- Not available.
a. Figures given cover all investment income (net). Major payments are interest on foreign loans and charges paid to IMF,and major receipts is interest earned on foreign assets.
b. Figures given include workers' remittances but exclude official grant assistance which is included within official loansand grants, and non-resident deposits which are shown separately.
c. Includes short-term net capital inflow, changes in reserve valuation and other items.d. Excluding gold.e. The exchange rate was reunified at the market rate in March 1993.f. Total exports (commerce); net of crude petroleum exports.
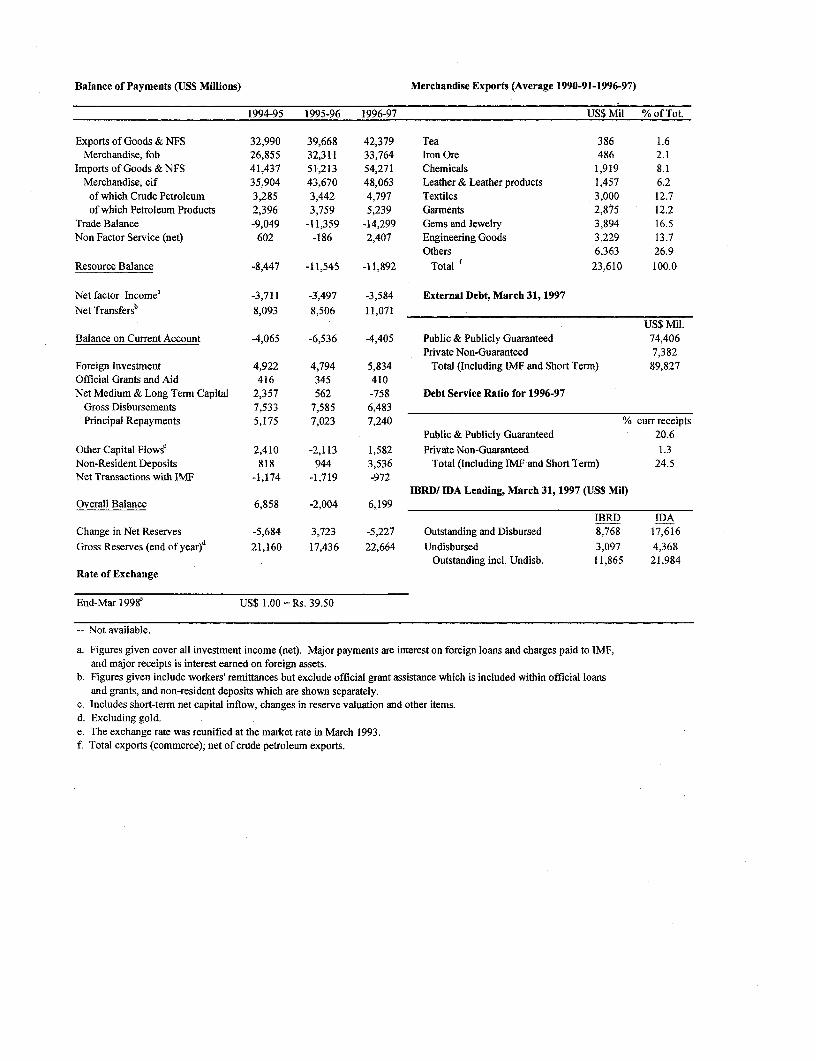
India Social IndicatorsLatest single year Same region/income group
South Low-1970-76 1980-85 1990-96 Asia income
POPULATIONTotal population, mid-year (millions) 613.5 765.1 945.1 1,265.8 3,236.2
Growth rate (% annual average) 2.3 2.1 1.8 1.9 1.8Urban population (% of population) 21.3 24.3 27.1 26.6 29.1Total fertility rate (births per woman) 5.6 4.4 3.1 3.4 3.2
POVERTY(% of population)National headcount index .. .. 35.0
Urban headcount index .. .. 30.5Rural headcount index .. .. 36.7
INCOMEGNP per capita (US$) 180 280 380 380 490Consumer price index (1 987=100) 45 85 227 233 275Food price index (1987=100) .. 83 238
INCOME/CONSUMPTION DISTRIBUTION(% of income or consumption)Lowest quintile 5.9 .. 9.2Highest quintile 49.4 .. 39.3
SOCIAL INDICATORSPublic expenditure
Health (% of GDP) .. .. 0.7 0.8 1.5Education (% of GNP) .. 3.4 3.8 3.0 3.6Social security and welfare (% of GDP) .. ..
Net primary school enrollment rate(% of age group)
TotalMaleFemale
Access to safe water(% of population)
Total 31 54 81 78 76Urban 80 80 85 83 80Rural 18 47 79 74 72
Immunization rate(% under 12 months)
Measles .. 1 84 82 80DPT .. 41 86 83 81
Child malnutrition (% under 5 years) .. .. 66Life expectancy at birth(years)
Total 50 52 63 62 63Male 51 52 62 61 62Female 49 51 63 63 64
MortalityInfant (per thousand live births) 132 101 65 73 68Under 5 (per thousand live births) 202 173 85 93 94Adult (15-59)
Male (per 1,000 population) 324 261 229 239 231Female (per 1,000 population) 353 279 219 230 206
Matemal (per 100,000 live births) .. 460 437
World Development Indicators 1998 CD-ROM, World Bank

Cotton and Textile Industries: MeetingEmerging Market Opportunities and Challenges
Executive Summary
Introduction
1. Like many of India's large agriculture-based industries, cotton and textiles have beenrecording impressive growth in recent years as controls on external and domestic trade havebegun to relax. That growth -- a 13% annual increase in cotton-textile exports between 1990 and1997 and a 3.9% rise in cotton output over the last decade -- can continue and even significantlyaccelerate if the industry's productivity and quality levels rise to make Indian products trulycompetitive. The phase-out of the Multi-Fiber Agreement (MFA) which long restraineddeveloping country exports is opening tremendous opportunities for India to enlarge its share ofexisting markets and capture new ones.
2. With more open global trade, however, comes heightened competition for India in bothexport markets targeted by other exporters including China, Korea, Thailand, and Vietnam andfrom imports in the domestic market, notably of yarn and fabrics, which are projected to increasedramatically over the next eight years. At the same time, Indian mills will have to begin payingworld prices for cotton fiber as changes in oilseed policies eliminate the implicit subsidy of thedomestic product, and the cotton export quota policy may need to adapt to meet WTO rules.Although growth has already made cotton-based textiles nearly a $6 billion export industry thataccounts for 20% of total Indian merchandise exports, further, rapid expansion is not assured.
3. A host of policies and regulations relating to firm size, product composition, labor andtaxation, combined with inadequate export infrastructure and cumbersome customs proceduresnow limit the capacity and incentives of textile firms to pursue adjustment and modernization.The necessary efficiency gains require both very large private modernization investments andextensive government regulatory changes to undo a pronounced bias in favor of small-scale,labor-intensive operations. That long-standing preference, in effect almost across the board inIndian agriculture and the industries based on it, was meant to sustain and improve the lives ofpoor rural people, now numbering some 250 million. In the case of textiles, regulation hasprotected the livelihood of an estimated 6-7 million handloom operators (mostly otherwiseunskilled women in small and mid-size villages), of nearly 100,000 workers in sick mills takenover by the government, and of about one-third the workforce in mills obliged to manufacture aspecial, low grade yarn primarily for handloom weavers.
4. India's 5,000-year-old cotton sector also faces several new challenges, above all toremain competitive with imports not only in terms of price but also in product quality andconsistency. Hampered in that pursuit by the slow pace of investment in higher productivity andquality and by practices at the farm, market and ginning levels, cotton growers must also dealwith a textile industry historically oriented toward undemanding domestic customers, and, untilrecently, an over-regulated domestic trade and ginning sector. Public-sector weaknesses, as inproviding extension services and irrigation, and inattention to such inputs as pesticides and seedsfurther constrain farmers' ability to reduce crop losses and raise yields. If the sector is to remaincompetitive now that cotton fiber imports have been completely liberalized, however, efforts toraise productivity, reduce costs and upgrade cotton quality are imperative.

ii
5. Unless they receive higher prices for their crop, India's cotton growers are not likely toinvest time, energy, and money in improving the quality or widening and bettering the varietiesthey cultivate. India's textile makers--the farmer's ultimate consumers--sorely need higher gradeand more varied raw materials to win buyers in an increasingly open global market for fabric andapparel, and to stave off competition from imports. Export-oriented mills, the textile industry'sleaders, have no choice; they must pay more for cotton fiber as it makes it way up the productionchain. And, this report argues, textile makers can absorb these higher costs if the Government ofIndia removes or reduces a variety of regulatory and policy obstacles to their efficiency,encourages new investments to improve their productivity and, back on the farm, extends muchneeded support to introduce and sustain modern practices.
6. Regulatory and investment policies aimed at promoting the industry's overallmodernization can be defined with relative ease and, with greater difficulty, integrated with oneanother in a sequence of productive transformations. The central, though not the exclusive focusof such reform packages - especially in the manufacturing and apparel sectors -- should be thedirect and indirect restraints on the size of operations and the efficiency costs such limits impose.At the same time, however, reformers will have to take into account the social goals behindIndia's traditional preference for smaller enterprises. The revenue that a more efficient cotton andtextile industry can generate can also repay massive investments in modernization and covermany of the costs of providing potentially more remunerative employment for the rural poor.Still, it is important to acknowledge the considerable dislocations that reform may engender andto include that human factor in planning for change. Carefully sequenced, a comprehensiveprogram of reform has the potential to mitigate the social costs of transition to more competitiveand rapidly expanding cotton and textile industries.
Textile Industry Efficiency
7. Composed of spinning, weaving (and knitting), fabric processing and garment-makingunits, the textile industry accounted for about one-fifth of India's total industrial output in 1994-95 and about 7 percent of GDP. Uniquely Indian in its complexity, it is characterized by: (i) thecoexistence of a broad spectrum of production techniques -- from hand-operated to sophisticatedautomated technology; (ii) a dualistic structure dominated by a fast expanding, decentralized or"unorganized" small-scale segment in weaving, knitting and apparel/garment-making along witha declining vertically integrated, large-scale "composite" mill segment (spinning and weaving);(iii) a predominantly domestic-oriented industry with cotton (rather than synthetic fibers) as theprimary raw material; and (iv) the existence of a public sector (2% of domestic fabricproduction), composed mainly of nationalized and "sick mills" taken over by the government.With exports of $9 billion responsible for over one quarter of total merchandise exports and withnearly 20 million people employed, the textile industry has the potential to serve as an engine forfaster, highly labor-intensive GDP growth. Operating now below its potential, the industry ischaracterized by low productivity and a wide variation in firm performance; a few internationallycompetitive firms coexist with a large number of inefficient ones.
8. The main driving force behind growth to date is the rapid expansion of exports,outpacing the 3% annual increases since 1990 and previously stagnant domestic demand. Cotton-based textile export revenues (fabrics, yarn, garments and made-ups) reached $6.2 billion in1995/96, increasing by 13 percent per year in real terms between 1990/91 and 1995/96 andreflecting increases in textile output of 30 to 40 percent over the 5-year period. Because of theMFA, the bulk of Indian cotton textile exports (yarn, fabric, and made-ups) before 1991 went tothe EU (41.5%), USA (16.5%), and the Eastern Bloc countries (12.5%). Binding export ceilingsin these traditional quota markets have since compelled India to diversify and to achieve its

iii
recent growth mainly from non-quota countries. Despite their rapid expansion, exports stillaccount for only around 10 percent of domestic production and about 1-2 percent of world textiletrade.
9. Spinning. Inferior by both international and domestic standards, with a recent SITRAsurvey finding that 60 percent of spinning mills operate well below Indian productivity norms,the performance of the subsector is significantly affected by three government policies: the yarnexport quota, the hank yarn obligation (see below) and discriminatory taxation against man-madefibers. The quota on yarn exports, instituted to ensure an adequate supply of yarn to the weavingindustry, works as an implicit tax on spinners that holds domestic yarn prices about 10% belowworld market prices. Cotton export quotas compensated mills by keeping supplies of cotton lintso cheap that, even though India's manufacturing outlays on average were comparable to those ofKorea and Thailand, overall costs were lower. With cotton lint prices now rising and stillrestrained by quotas from taking advantage of higher world yarn prices, firms in this capital-intensive specialty find their profitability and financial capacity to modernize and restructurethreatened. Often marked by antiquated technology and widespread inefficiencies in production,spinning mills catering to the domestic market lack access to export quotas and to the benefits ofsuch export incentives as tax holidays and duty-free imports of machinery.
10. They are particularly affected by the profitability squeeze and, according to a simplemulti-market model of the entire textile industry, would be the least competitive segment of theoverall textile industry in an environment where raw materials fetch world market prices. As longas high import tariffs and fiscal levies on man-made fiber (MMF) make them prohibitivelyexpensive either as a supplement to cotton in blended yarns or as a substitute, Indian spinningmills have no choice but cotton. Increasing domestic and international consumer preferences forMMF products and mixed blends would normally dictate their increasing use, which would inturn allow the textile industry to expand further into the blended and synthetic textile markets.
11. An added burden on spinning mills, the Hank Yarn Obligation (HYO) requires them inpractice either to process about a quarter of their deliveries in the form of a yarn used byhandlooms or to transfer the obligation to other firms. Manually reeled, hank yarn is rarely madein-house since production uses older machinery and requires a work-force (mostly women) halfas large as that of the total factory. Instead, most mills pay others from 25 paise to Rs 1 per kiloto fulfill the obligation, itself calculated on the basis of a percentage of the net qualifying amountafter exemptions for exports, for own consumption in composite mills, and for hosiery andblended yarn output.
12. Nonetheless, the HYO distorts production. Tax exemptions on hank yarn, for instance,make it profitable to declare cone yarn (used by powerlooms and composite mills) illegally ashank yarn. Since the combined effect of tax exemptions and production controls is to lower hankyarn prices relative to cone yarn, non-handloom weavers often use the former. The leakage isestimated at 15-25 percent. Simultaneously, the HYO acts as both an implicit export tax on coneyarn (reducing the volume available for sale abroad) and as a productivity tax (estimated at about0.14% of the value of total spinning industry output) that mandates the use of an inferiortechnology and lowers cone yarn production. The duty relief on hank yarn, moreover, subsidizesold, inefficient and costly production processes, many of which are in the state sector. Finally,the HYO influences investment decisions by encouraging investments in hosiery yarn spinning orthe establishment of a 100 percent EOU -- exempt from the HYO -- to circumvent the obligation.
13. Weaving. What the HYO does to impair the productivity of spinners, stringent laborregulations under the 1948 Factories Act and tax concessions do to fragment the weaving

iv
industry. Restrictive labor rules governing "large" firms (10 or more workers in processes thatuse power, 20 or more workers if not electrified) that foster employment rigidities and vest strongpowers on labor unions raise labor costs to the point that wages in the organized sector are 50-60% above those in unorganized enterprises. Together with a variety of incentives associatedwith small-scale operations (tax concessions, lower power tariffs, etc.), these regulationsencouraged the rapid development of a dualistic industry structure dominated by small-scale butless efficient powerlooms because larger firms are denied the flexibility to take advantage ofeconomies of scale, to improve efficiency through vertical integration, and to enhance qualitymanagement. Unsurprisingly, the weaving industry is also characterized by a large number ofclosed and sick (mostly public sector) mills whose accumulated financial losses between 1989-90and 1993/94 totaled $799 million ( in 1993/94 real dollars). Current labor laws and the absence ofa clear exit policy for bankrupt enterprises are slowing progress in restructuring or liquidatingthese failing firms in a subsector where capacity utilization is low and competitiveness reliantprimarily on cheap yarn prices and, until recently, on protection from imports.
14. Handlooms. What protects the operators of India's 3.6 million handlooms is thetranslation of a fundamental social goal - the priority given to generating employment andalleviating rural poverty - into a set of operational economic policies affecting far moreenterprises and lives than the estimated 6-7 million people whose looms cater primarily to thefabric requirements of rural folk and who also specialize in saris in many areas. The share of thehandloom subsector in fabric output remains stable (around 35 percent), but its influence ontextile policy remains large as the GOI attempts to provide a counterbalance through suchprotective measures as the HYO. Additional support schemes for handloom weavers include theexclusive right to produce certain fabric varieties, low-interest working capital, modernizationfunds, tax exemptions, and rebates on prices of fabrics sold through cooperatives.
15. Apparel and Knitting. At the opposite end of the scale of sophistication, a companionbias against large enterprises keeps apparel and knitting firms so far behind the productivitycurve that, in spite of rapid and recent investments, successive international surveys point to awidening gap of about 50% between Indian firms and such main East Asian competitors asChina. Several factors explain this trend. First, the inclusion of the apparel and knitting industryunder the Small-Scale Industry (SSI) reservation hinders it in satisfying large orders andmaintaining quality consistency. For most garment-makers, the investment ceiling was onlyrecently raised to Rs. 30 million (US$ 840,000)- subject, however, to a requirement that withinthree years the firm export half its output to non-quota countries, an obligation that largerenterprises must also fulfill. Restrictive labor policies that apply to organized firms and varioustax incentives and reduced utility rates that encourage enterprises to stay small further deterproductivity and the kind of investments that would improve quality while increasing size.
Textile Industry Reform Options
16. From spinners to garment-makers, India's textile producers all face basically the samechallenge: to raise productivity through gains in efficiency that will still allow them to compete athome and abroad in the face of higher cotton prices resulting from policy adjustment to WTOrules and demand pressures. To achieve those gains, they require major changes in the domesticpolicies that have become obstacles to modernization. And reforms - such as abolishing the HankYarn Obligation, removing limits on yarn exports and reducing tariffs and taxes on man-madefiber imports, selling off or closing sick mills, relaxing labor regulations and eliminating the SSIreservation - will require not only sequential packaging but compensatory action as well toaddress the economic impact of change on the rural poor.

v
17. Spinning. So that mills can expand capacity and modernize and absorb higher cottonprices, they need both the freedom to export yarn - for which world demand and prices are high -- and relief from the Hank Yarn Obligation. Eliminating the yarn export quota would quickly easethe current profitability squeeze on spinning mills, buttress them against threats from cotton yarnand fabric imports that could increase by as much as 300 percent by 2005, and strengthenincentives to improve efficiency and attain greater international competitiveness. The recentreduction of import duties on several kinds of textile machinery to 10 percent, while an importantmeasure facilitating the process of modernization, needs to be complemented by measures thataddress the future of public sector composite mills. (See Weaving, below.)
18. The projected tripling of yarn imports raises serious policy questions about theappropriate level of yarn import tariffs, currently 20 percent. It is likely that lowering yarn tariffsfurther could hasten the restructuring of the textile industry, provided that import tariffs forfabrics are revised accordingly. It is certain, however, that cutting MMF import tariffs and traderestrictions and eliminating the discriminatory taxation of MMF -- as the 1997-98 Budget beginsto do -- by lowering the cost of synthetics, will boost domestic consumption, including those ofthe poor who appreciate their greater durability, and exports of blended and synthetic products.With appropriate modernization investments to permit greater use of MMF, these reforms permitthe textile sector to capture market opportunities in the growing blended and synthetic productmarkets, without necessarily depressing cotton prices, provided cotton exports--which offer aprice floor-- are kept free (para 36). A positive spillover for garment manufacturers would be theopportunity to use valuable spare capacity for such products to supplement the manufacture ofcotton garments for which demand is highly seasonal.
19. Handlooms.. HYO abolition will reduce efficiency losses in spinning but needs to bepaired with effective social protection measures for handloom weavers who are generally poorand relatively unskilled. Since their welfare is properly a major GOI concern, it is important todevise ways to address their low productivity and to compensate their loss of competitiveness.Three complementary options merit consideration, beginning with an explicit, targeted, demand-based, per unit subsidy for hank yarn or handloom fabric. Such a scheme would be moretransparent and avoid the economic costs imposed by the current HYO approach. Effectivelytargeted, it would minimize the incentive problems of over-supply of hank yarn, leakage to othersegments of the industry, misreporting, and uncertainty about the actual number of handloom unitsand the volume of yarn they require. While possessing the added advantage of greater transparencyin terms of costs to taxpayers of this social obligation, such a program will be complex toadminister. Decentralizing implementation to local governments or village-based organizationscould help ensure effective targeting of handloom weavers. Another option, programs to converthandlooms to powerlooms and to upgrade product quality may offer a viable and effective strategyfor raising weavers' productivity. A third course involves mitigating employment and incomelosses in the handloom industry through training and job conversion programs to help weaversmove to more productive employment, including garment-making.
20. Sick Public-Sector Mills. Either privatization or liquidation or both will be required todeal with sick public-sector mills, in particular the National Textile Corporation, the umbrellacorporation of mills taken over by the government. The recently established DisinvestmentCommission represents one significant step toward setting clear policies on bankruptcy and theending of government involvement. The problem of cost, however, in an environment oftightening fiscal constraints requires comparisons between continuing direct and indirectfinancial support for chronically loss-making mills or authorizing large, one-time outlays fordisplaced workers. A rough estimate of the cost of Voluntary Retirement Schemes for the 95,000

vi
workers in these mills is about US$380 million, equivalent to about 87 percent of accumulated1992/93 and 1993/94 losses. The sum is also a small fraction of the potential efficiency gainsdomestic reforms can bring to the textile industry as a whole. Because sector-wide growth andemployment opportunities are quite large, training programs in the highly labor-intensive apparelsector could ease the move of these workers to other activities.
21. Scale-Neutral Labor Regulations and Tax Incentives. While relaxing current laborregulations and adjusting tax policies would be highly beneficial to the textile industry, theirimpact extends beyond it, and reform needs to be seriously considered and conducted in aneconomy-wide context. The 1997/98 budget is proposing preliminary and constructive steps inthis direction by simplifying the excise duty structure and concessions for small-scale units andby excluding cotton yarn and texturized man-made yarn from the purview of the SSI exemptionscheme.
22. Apparel and Knitting. A shift towards manufacturing for export, with concomitantgrowth in productivity, could score significant increases in income for manufacturers of garmentsand knitwear and employment opportunities for the economy. If India could achieve China'slevel of labor productivity (a 67% increase), the apparel sector by the year 2005 could generateadditional net cotton apparel exports of over US$2 billion (1992 dollars) even if the MFA is fullyabolished. It is not an easy transformation to achieve, however. The small-scale structure of thesubsectors, having served India well in the past in carving a niche for small, low-to-mediumquality orders in the world market, now impedes a transition into the growing market for higher-quality as well as mass-consumption products. The elimination of the SSI reservation, asproposed by the Abid Hussain Committee, would enable manufacturers to process large ordersefficiently, to take advantage of economies of scale, and to justify larger investments to improvequality.
23. Streamlining handling systems and customs procedures and improving often dilapidatedport infrastructure so as to halve current 90-120-day lead times for export deliveries would alsogreatly improve the competitiveness of the apparel and knitting industries -- and of every Indianexporter. The garment industry's ability to provide timely and reliable delivery is also predicatedon dependable availability of high quality raw materials (fiber, fabric, and accessories) at shortnotice. To compete successfully abroad, the textile industry requires either quick access toimports or higher operational efficiency and better quality control in the domestic cotton,spinning, and weaving sectors. That imperative underscores the necessity of comprehensivetextile and cotton reforms.
Cotton Productivity and Marketing
24. Cotton Production. With 9.1 million hectares planted in cotton in 1995-96 andproducing 2.4 million metric tons of cotton fiber, India's cultivated area covered about one fourthof all land dedicated to cotton in the world, and its output -- up 3.9% over the last decade --equaled 13 percent of the planetary total. Over the last 15 years, even with stagnation incultivated area, yields have increased significantly though remaining low by internationalstandards. Yields per hectare in the irrigated northern areas are only half or less those ofcomparable cotton producers (China, Egypt) while farmers in rainfed areas get only 70% as muchas Brazilians. Such increases as have been attained are due to the spread of irrigation to 30% ofall cotton farms and the increasing adoption of improved varieties now planted on 55% percent ofthe total cotton area.
vii
25. Thanks to its long tradition as a cotton grower and its diverse climatic zones, India is oneof the few countries in the world that can grow about 100 varieties of cotton; of which 20-25account for 90% of the crop, with staple lengths, ranging from short ( under 10 millimeters) toextra long (over 30 mm). Staple length is an important determinant of final fabric quality, andIndia's ability to produce a broad range gives it great flexibility to expand sales across manymarkets. Short staple cottons, for example, are generally used for knitwear and denim, while fineshirts and knits need longer staples.
26. In addition to the cotton fiber or cotton lint that is separated by ginning from kapas(unprocessed cotton) to be spun into yams, the boll also yields seeds that can be crushed toextract an edible oil and leave meal behind to be used as livestock feed. Until 1994, GOI oilseedpolicies (see companion report "The Indian Oilseed Complex: Capturing Market Opportunities"for details) provided an indirect subsidy to the textile industry at no cost to cotton growers.India's second most important cash crop, after oilseeds, cotton grows predominantly (70%) inrainfed areas where the incidence of poverty is high and growth opportunities are typicallylimited for small farmers, two-thirds of whom cultivate less than two hectares of land. The stapleof a major industrial sector, cotton is the basic raw material in textile products that account forthree quarters of the output value and two-thirds of the export revenues of the textile industry. Itcan play a central role in generating employment, raising incomes, reducing poverty, andstimulating development in lagging rural areas.
27. Cotton Lint Pricing. By imposing export quotas on cotton lint and setting minimumexport prices until 1994/95, GOI ensured spinning mills supplies of raw material at prices belowworld market levels - about 35% lower for Extra Long Staple (ELS) and 15% for short staplecotton fiber during the last 15 years. Medium staple cotton prices fluctuated around export paritylevels. While bolstering the competitiveness of the textile industry until now, low prices did notdrive farmers out of cotton since oilseed policies kept the price of cottonseed significantly aboveworld price levels. This compensatory benefit was unevenly distributed. While kapas prices forshort and medium staples, which are grown mostly in the north and contain seeds worth 25% ofthe cotton's total value, remained at or above export parity levels, prices for the longer stapleswith only 6% seed content in value terms, mainly produced in central and southern states, fellwell below export parity.
28. The liberalization of edible oil imports in 1994-95, the reduction of import tariffs to 20%in 1996, and rapidly rising domestic cotton lint demand are lifting domestic cotton prices closerto international levels and depressing those for cottonseed. So far, cotton growers have not yetbeen seriously affected by this downward trend, because the demand for fiber fueled by the1990s textile export boom coupled with pest-related production shortfalls has kept cotton lint andkapas prices moving upward, providing farmers with strong incentives to increase output.
29. Cotton lint export quotas nonetheless still depress domestic lint prices, especially of ELScottons and thus discriminate particularly against farmers in the rainfed areas where most ELScotton is grown. In addition, the export limits prevent cotton farmers and traders from capturingthe gains that arbitrage offers by enabling the export of cotton varieties which have aninternational price advantage and the import of others in short supply. These counter-productiverestrictions also fuel greater lint price instability, because they eliminate the buffer against thesharp price drops that bumper harvests produce and disguise the very real need for farmers toraise the quality and consistency of their cotton before higher grade imports draw their customersaway. Finally, cotton lint export quotas may be challenged under WTO rules.

viii
30. Policy and Technical Constraints. Central to those shortcomings are poor on-farm pestand seed management, inadequate availability of improved seeds adapted to rainfed conditions,and inadequate access to reliable water supply. The increasing frequency of major pest outbreaks(six in the last ten years), is a serious threat against which the GOI launched an Integrated PestManagement (IPM) Program in 1992 to help farmers use natural enemies, pest-resistant crops,cultural management and judicious use of pesticides. Engaging growers in the program, however,has been slow work hindered by pesticide subsidies, poor enforcement of pesticide regulationsand quality control, weak extension systems, poor water delivery management in irrigated areas,and weak incentives that would encourage farmers to minimize pest damage.
31. The limited availability of high-yield cotton varieties adapted to India's predominantlyrainfed conditions rather than to irrigated environments means that many improved varieties areyielding on average less than half their potential. Moreover, low-quality, mixed seeds are usedon 45% of the planted area partly because low prices for cotton lint and limited quality premiumsprovide few rewards for improved seed-quality management and partly because of the small-scale cotton production system that requires several farmers to pool their produce before ginningit and that encourages them to sell kapas rather than lint.
32. Cotton Marketing. Among the major players in India's well-established cotton-marketing system, private traders (owners of gins, local and terminal market merchants or theiragents and textile mills) account for 77% of marketed kapas. Next in size with an 11% share, theMaharashtra State Cotton Cooperative Growers' Marketing Federation (MSCCGMF) implementsthe state government's Monopoly Procurement Scheme. Finally, the Cotton Corporation of India(CCI) is a government parastatal originally charged with managing GOI's cotton price-supportprogram and now competes with the other bidders - including state-level cooperatives -- to holda small (8%) and declining share of the market. With free market prices consistently abovesupport prices, CCI's role has shifted to procuring cotton for public and private mills andexporting cotton.
33. Deregulation. Over the last three years, the GOI has lifted or repealed regulatoryimpediments to improved cotton marketing, voiding the 1923 Cotton Transport Act in 1995 andits controls on the movement of cotton and, in 1997, the 1925 Cotton Ginning and PressingFactories Act that had administratively set ginning and pressing fees. Further, the Reserve Bankof India in October 1996 lifted the Selective Credit Controls, which limited access to commodityand trade financing, and the 1997/98 Budget speech officially lifted the Cotton Control Order(1955, 1986 and 1995) that granted the Textile Commissioner power to set kapas, lint, and cottonseed prices, to fix limits on stock levels, to control movement of cotton, and to control entry intoginning and pressing through licensing. Finally, the ban on trading in cotton lint futures contractswas also lifted in 1997. Reducing marketing costs and allowing a true common and morecompetitive national cotton market to develop, deregulation will also stimulate neededmodernization investments and improved quality management.
34. Constraints on Marketing Efficiency. But deregulation is incomplete. The 25-year-oldMaharashtra Cotton Monopoly Procurement Scheme remains as the sole regulatory impedimentto a common market in India, a program that gives the Maharashtra State Cooperative CottonGrowers' Marketing Federation (MSCCGMF) exclusive rights to procure all cotton in the state.By assuring local growers fixed, variety- and grade-specific prices for kapas for the wholeseason, the Scheme seeks to ensure the state's farmers fair, remunerative prices without recourseto middlemen and to bring about stability and growth in overall cotton production. Theselaudable objectives have proven very costly to pursue, generating reported losses of Rs. 5 billion($142 million) in the 1995-96 season coming on top of earlier ones amounting to Rs2.6 billion

ix
($75 million.) Over the years the Maharashtra government has subsidized the MSCCGMF withtransfers (according to available information) ofRs 514 million (US$ 43 million) in 1984/85, Rs2.8 billion (US$ 229 million) the next year, and Rs 2.8 billion (US$ 89 million) in 1993/94.
35. Several factors contribute to the monopoly's fiscal failure. First, the commitment to aseason-long purchase price at the cultivation cycle's start carries high risks, especially becauseannounced MSCCGMF guaranteed prices can go well above their theoretical base, the GOI'sMinimum Support Price, itself generally below free market levels. Porous borders andcompetition with neighboring states make enforcement extremely difficult and Maharashtra'sexposure to risk larger. Extensive misgrading of cotton also affects losses, against which thereplenishment rule of the Price Fluctuation Fund (PFF) fails to building adequate reserves.Finally, the absence of competition under the Monopoly Scheme reduces incentives to improvethe efficiency of marketing operations, including accurate grading, and unnecessarily raisesoperating costs.
36. Poor market infrastructure and weak support services. The regulated markets or mandisthat are the primary sales conduits for kapas (and for other produce) in India lack adequate -sometimes any -- facilities for weighing, handling, moving, and storing cotton. In some markets,space shortages lead to the mixing of different lots, while poor handling practices increase lossesand contamination of the cotton, reducing the quality of the stock. Mechanisms for thedissemination of market information are also weak or non-existent, in spite of intensive collectionefforts. Grading standards for lint exist but facilities to apply them do not except in top-of-the-line mills that use scientifically advanced High Volume Instruments and in such states asKamataka and Maharashtra. As a result staple length may be gauged visually but not otherattributes -- fiber strength, uniformity, maturity - that are important quality indicators for anincreasingly export-oriented textile industry. Although mandis generate considerable revenuesfrom collecting a cess to improve market facilities, these funds are frequently diverted to non-market related activities. Lack of fiscal authority of the respective marketing committees constrainsaccess to the necessary capital to properly operate or upgrade the facilities and services of thesemarkets.
37. Cotton Futures Trading. Although parliament recently approved the reintroduction offutures trading in cotton, the commodity futures market may not function efficiently, partlybecause the ad-hoc implementation of cotton export quotas creates unhedgeable risks for lint futurescontracts and partly because the discretionary interventions by the Forward Markets Commissioninto the trading operations of the cotton exchanges runs counter to the development ofcompetitive futures markets. Existing rules and procedures in the commodity exchanges,moreover, are not strong enough to banish improper trader behavior. Even if these obstacleswere overcome, the absence of a standardized grading system for cotton lint will impededevelopment of an appropriate cotton lint futures contract.
Reform Options
38. Improving Price Incentives. Besides achieving consistency with WTO rules, phasingout the cotton lint export quota would eliminate the implicit tax on farmers, stimulate increasedproduction, and open opportunities for profitable trade arbitrage, enabling Indian farmers tocapture a larger share of the benefits of the growing domestic and international textile markets.Foreign sales will provide a price floor for farmers, especially during bumper harvests and permitIndia to export cotton for which it has a price advantage, while complementing with importsthose types of cotton that are in short supply in domestic markets. From a short-term perspective,rising cotton lint prices would adversely affect the whole textile industry and spinners most

x
directly, since cotton accounts for 50% to 70% of the final yarn cost and thus parallel policymeasures to mitigate the impact of rising cotton prices are likewise needed (seeearlier section:Textile Industry Reform Options). Retaining or reducing the size of current export quotas on theother hand might hold domestic prices down for a time, but at the cost of discouraging domesticcotton production and forcing spinning mills to rely more on relatively costlier imports. Recentprojections to 2005 indicate that rapidly rising raw material demand by the textile industry,despite a 72% growth in cotton output, could still leave India a net importer of cotton lint.Eliminating the cotton export quota can generate an additional growth in output that would helpreduce the trade imbalance -- or the net import value -- by about one-third. Faster growth indomestic cotton output through more rapid productivity enhancement, or higher manmade-cottonfiber mix in the textile industry, would lower cotton import needs.
39. Within the spinning industry, the higher prices of cotton that will follow exportliberalization will impose the most acute loss of competitiveness on mills that use the longest-staple cotton. While quota elimination could proceed relatively quickly for fiber with shorterstaples, it might be wiser to replace the export quota on ELS cotton with an export tax that woulddrop to zero over two to three years. Alternatively a "textile modernization fund" could assist theoperations of the mills hardest hit by increased raw material costs. The first option generatesgovernment revenues and is easy to administer but it is non-targeted and more likely to distortmarket activities. The second option introduces fewer distortions and is more transparent, fiscallyexplicit and targeted. On the downside, it involves direct fiscal cost to the government, is moredifficult to implement, and from past experience could be subject to abuse. Whichever path ischosen, the policy reforms and investments that encourage productivity growth in the textileindustry, discussed in the previous section, are needed to improve the capacity of textile firms toabsorb rising cotton prices.
40. Technical and Institutional Constraints. Whatever price their crop fetches, farmers willneed to embrace technological change to stay ahead of foreign competition. With improvedseeds, appropriate pest control, improved on-farm water, fertilizer, seed management andintegrated pest management techniques, government can help them achieve higher levels ofproductivity while minimizing production costs. In the case of pest management, the phase-out ofpesticide subsidies and tighter government enforcement of pesticide regulations and qualitycontrol are warranted to strengthen incentives for adoption of the IPM approach. Just asimportant as price incentives in encouraging the adoption of new technologies, non-price factorsinclude the availability and quality of technologies suited to local, mostly rainfed conditions; thequality and delivery of agricultural support services, particularly extension; and investments inreliable water supply, roads, and soil management. Especially in areas neglected by the privatesector, continued financial support by the public sector to cotton research will strengthen theexisting base for technological advances. Government should also provide an enablingenvironment for private research (e.g. improved seed legislation and certification processes,IPRs, competitive grants, and public-private research collaboration. Research priority areascould include developing high yielding varieties for rainfed and irrigated areas, drought and pestresistance, shorter duration varieties, environmentally friendly cultivation practices and pestmanagement technologies. More effective delivery of support services would facilitate access toand promote awareness by farners of these technological advances. Measures to improve theeffectiveness of public extension services and promote greater private, and NGO extensionwould be critical to the rapid diffusion of these technologies. In rainfed areas, improved publicsector funding and design of watershed programs would play an important role in improvingaccess to water and/or moisture retention, that could have large expected impacts on yields.

xi
41. Market Management and Services. The recent deregulation of domestic marketing andginning represents significant progress which needs to be complemented by government action toimprove the operations of regulated markets and helping them strengthen their support services.The decentralization of financial and management controls in regulated markets through greaterdelegation of authority to market committees or, where possible, divesting control to users wouldgive operators greater leeway to invest in creating more efficient market infrastructure andservices so as to cut wastage in market yards and minimize quality deterioration during theexchange process. Relaxing government control would also enable the markets to improve theirgrading services and, with GOI and state financial assistance, to use radio transmission andelectronic hookups to disseminate market information more effectively and deliver extensionmessages for cotton and other commodities. Textile industry associations and cotton commodityexchanges could also play an important role in disseminating prices and prevailing qualitypremiums and discounts.
42. Cotton Quality. Since quality, not volume, is key to the competitiveness of India'scotton and textiles in a liberalized foreign trade setting, focused efforts are needed from farm tomill to upgrade the grade and consistency of raw and finished materials. For manufacturers, thestakes are high - reduced wastage and under-spinning mean critical cost savings. For farmers andtraders higher quality means higher prices and steadier demand. For GOI and state governmentsthe quality imperative requires vital interventions to facilitate and help implement collectiveinitiatives related to quality management in cotton marketing.
43. A starting point could be a thorough review and evaluation of existing cotton lint qualitystandards and grading procedures. Conducted by a distinguished private sector committeeconsisting of cotton producer associations, industry, exporters, and trade, with representationfrom government (e.g., Ministry of Textile, Ministry of Agriculture, state governments), andwhose establishment could be facilitated by government, the review could also examine ways toachieve greater consistency between Indian and international cotton lint standards. A similarprivate sector committee composed of ginners, private traders, cooperatives, farmers,professional cotton trade associations, and exporters, with participation from the GOI, and stategovernments could work to develop nationally recognized quality standards - now non-existent --for seed cotton and quality norms and grading procedures in cotton markets.
44. Since quality begins at home, in the cotton fields, farmers are on the front lines of thebattle and urgently need effective support from the rear, from public, private, NGO, cooperativeand farmers' association extension services that can help them adopt quality improving practicesresponsive to the changing variety requirements of textile manufacturers. These extensionproviders could also play an important role in fostering farmer self-regulation of the varietiesplanted to minimize variety mixing, a practice which should also be fought through speedierofficial denotification and withdrawal of old seed varieties. Improved coordination between theirrigation department and farming community (possibly facilitated by the extension system, wateruser groups, NGOs) would minimize the quality-reducing effects of improperly timed waterdeliveries and over-application of water.
45. Cotton Futures Markets. Government has a major supportive role to play in facilitatingthe reintroduction of cotton lint futures trading, first and foremost by providing a stable andpredictable external trade environment for the fiber, one without cotton export quotas. Second, tOeregulatory and institutional frameworks governing the Forward Markets Commission and variouscotton commodity exchanges need to be revised to foster the orderly development of cottonfutures markets, exchanges in which FMC discretionary interventions are curbed and the FMCconfines itself to approving exchanges and setting the general legal and regulatory framework for

xii
them. Not only would brokerage rules need to be strengthened but so would cotton commodityexchanges' rules and regulations for trading procedures, delivery systems, and supervision, aswell as their clearing operations and promotional and development activities. The development ofa commodity warehousing system would also facilitate futures trading.
46. Maharashtra Monopoly Procurement. More effective than the current, troubledmonopoly purchasing system in achieving remunerative cotton prices and stable productiongrowth for Maharashtra cotton farmers are measures that would help them in raising their yields,such as improved local research and extension and more effective expenditures in watershedprograms, irrigation and rural infrastructure. Increased funding and further improvement of theEmployment Guarantee Scheme would also provide better income protection from drought-related crop failures. Crop insurance is an alternative, but not a viable and attractive one sinceadverse selection and moral hazard problems generally necessitate government subsidies to makecrop insurance accessible to more farmers. Restructuring the MSCCGMF along the linesfollowed by the Gujarat State Cotton Marketing Federation to permit greater participation byfarmers-owners, to reduce government involvement, and to allow the federation to compete withother traders, would help eliminate misgrading and higher marketing costs. If the Federation doesnot use forward and futures markets to hedge procurement against price instability, state-provided price insurance mechanisms similar to the Cotton Price Support Scheme provided byASERCA, a Mexican parastatal, might serve the same end without getting involved in thephysical handling of the crop.
Postcript
47 The report was discussed with concerned government agencies at the central and statelevels. There is a broad agreement among government representatives about the need andobstacles to raising the productivity and competitiveness of both the cotton and textile industries.While there is agreement on the objectives and thrust of the reform options identified in thisreport, there is a divergence of views between Government of India and the World Bank reporton the sequencing of reforms. First, due to adverse consequences of rising cotton prices on thetextile industry of removing the cotton export quota, the government strategy is to retain thequota and focus instead on cotton productivity and quality enhancing programs to meet theincreasing domestic demand for cotton and raise profitability at the farm level. The CottonTechnology Mission announced since by GOI would aim at supporting productivity and qualityenhancement at the farm and ginning level. Second, concerns about the social costs the de-regulation of the textile industry may impose on the small-scale textile enterprises in the shortrun, are prompting the government to place a greater emphasis on special incentive schemes topromote productivity improvements among the small-scale segments of the textile industry.

xiii
Program for ActionImproving the Competitiveness
of the Textile Industry Recommendation
(1) Increasing efficiency of GOI: (i) Eliminate hank yarn obligation; (ii) Eliminate yarn export quota.
spinning industry Accompanying Actions in Other Sectors:
GOI: (i) To assist handlooms in coping with higher hank yarn prices, explore altematives including: targeted explicit subsidy to handloom weavers; convertin
handlooms to powerlooms; and training programs for alternative professions;(ii) To enable weaving mills to cope with higher yarn prices, reduce excise dutie
and import tariffs on MMF and eliminate barriers to increased weaving sector efficiency (see below);
(2) Increasing efficiency of GOI: (i) Rationalize national labor regulations; (ii) Phase-out differential taxation according to enterprise size; (iii) Eliminate small scale reservation on
weaving/knitting knitting; (iv) Privatize or liquidate sick public sector mills while providing transitional programs for retrenched workers.
Accompanying Actions in Other Sectors:
GOI: (i) Promote more efficient power generation and delivery to reduce costs; (ii) Facilitate upgrading of transport and port infrastructure and improve
customs procedures to reduce costs.
(3) Increasing efficiency of GOI: (i) Eliminate small-scale reservation of garment manufacturing.
garment manufacturing Accompanying Actions in Other Sectors:
GOI: (i) To reduce lead time and export costs, upgrade transport and port infrastructure and improve customs procedures; (ii) Reduce excise duties and impor
tariffs on MMF products and intermediate inputs to permit improved capacity utilization through production of cotton and synthetic garments.
Improving the Competitivenessof Domestic Cotton Recommendation
(1) Overcoming price GOI: (i) Eliminate cotton export quota on small and medium staple cotton. For ELS cotton, temporarily (2yrs) replace with alternative instrument (e.g. export
disincentives to higher cotton tax or targeted modernization fund to spinning mills); (ii) Facilitate upgrading of transport and port infrastructure to reduce export costs.
quality and yields Accompanying Actions in Other Sectors:
GOI: (i) Eliminate spinning mill yam export quota to mitigate cotton price increase; (ii) Reduce excise duties and import tariffs on MMF products and
intermediate inputs to ease upward pressure on cotton prices on spinning mills; (iii) Eliminate hank yam obligation.
(2) Facilitating adoption of GOI & State: (i) Support public sector cotton research to develop high-yielding varieties and improved crop and pest management practices, while promotinE
improved farm practices an enabling environment for private sector research; (ii) Increase effectiveness of public sector extension, while promoting private sector participation ir
extension; (iii) Improve implementation of watershed programs
(3) Increasing cotton marketing GOI: Facilitate efficient functioning of commodity futures markets by rationalizing regulatory role of FMC. Establish national brokerage rules.
efficiency Private Sector: Commodity exchanges to upgrade rules and regulatory systems to ensure orderly trading.
State: Transfer control of regulated markets to market committees and adjust cess to fit market operation requirements. Explore divestment to users.
Maharashtra: Replace Maharashtra Monopoly Procurement Scheme with more cost-effective mechanisms. Options to ensure reasonable farmer incomes
include: (i) increased investments in rural infrastructure and improved support services; (ii) income protection through social programs (e.g. employmenl
guarantee schemes); (iii) allowing the MSCCGMF to compete with private sector to promote efficiency. Pilot/experiment with alternative price rtsk
management mechanisms.
(4) Fostering improved cotton Private Sector: Private industry participants, with GOI facilitating process, to review and develop nationalkapas and cotton lint grading standards and
quality management undertake promotion campaigns for nationwide dissemination and adoption.
I GOI & State: Assist in strengthening market information systems to improve transmission of quality premiums and discounts.
Textile: Adjustingto Competition
A. INTRODUCTION
1.1 A leading export performer earning revenues of $5.9 billion by the mid-1990s (one-fifth of total merchandise exports), India's cotton textile industries has built competitive strength- 15 percent real annual growth rates since 1990 -- during a decade of diminishing policyrestrictions and five years of economy-wide liberalization. With the phase-out of the Multi-FiberAgreement (MFA), beginning in 1995 under the Agreement on Textiles and Clothing (ATC) ofthe General Agreement on Tariffs and Trade (GATT), India's textile industry is in position toenlarge its share of existing markets and to capture new ones. But in contrast to previous years,the setting for its operations is changing drastically as competition rises abroad and imports,especially of yarn and fabrics, press harder at home to blur the distinction between export-oriented and domestic-oriented units. Finally changed oilseed policies that eliminated an implicitcotton subsidy are rapidly lifting cotton prices to export parity levels.
1.2 In these circumstances, only increased productivity and improved product quality cankeep the industry competitive and expanding against goods from other major exporters likeChina, Korea, Thailand and Vietnam both in foreign markets, and at home where apparel demandis due to grow along with the largely export-generated demand for intermediate textile inputs (i.e.yarn and fabrics). Measures to enhance productivity and quality will require massivemodernization investments but a host of policies and regulations relating to firm size, productcomposition, labor and taxation, combined with inadequate export infrastructure andcumbersome customs procedures still limit firms' capacity and incentives to undertake theformidable task of adjustment and modernization.
1.3 New challenges also face India's cotton sector in which output - responding toaccelerating export-led demand from the textile industry -- posted the second highest growth rate(3.9 percent) among major crops during the last decade. Needing to compete with imports interms of price, quality and consistency, cotton growers, traders and ginners are making only slowprogress toward productivity and quality enhancing investments and practices at the farm, marketand gin. Low cotton fiber prices, a domestic-oriented textile industry that ranked quality wellbelow other priorities, and, until recently, over-regulated domestic trade and ginning sectorsreduced incentives for cultivating better grades and varieties of cotton. Weak delivery of suchagricultural services as extension and irrigation and input policies (i.e. pesticides and seeds)further constrained farmers' ability to reduce pest-induced crop losses and to raise yields. Withfiber imports now completely liberalized, the need to raise productivity, reduce costs and upgradequality is a competitive imperative.
1.4 To capture emerging market opportunities and overcome challenges from imports,cotton growers and textile makers will have to focus on improving efficiency and achievinginternational competitiveness. As support, they will need a diverse and complex package ofpolicy and regulatory changes and investments in agriculture, marketing and manufacturing thatcan strengthen incentives to modernize, raise productivity and improve product quality.Integrated reforms are necessary, since the garment industry, for example, cannot make itself astronger competitor unless its suppliers - farmers and weavers - also raise their efficiency andquality. Conflicting yet complementary objectives of cotton farmers, traders, and textile

-2 -
manufacturers will require the careful sequencing and pairing of reforms and complementaryinvestments.
1.5 Since cotton is important to both the textile industry and the rural economy, especiallyin rainfed areas where 70 percent of the crop is grown, higher cotton output growth can not onlyaid textile firms, but more importantly can generate employment, raise incomes, reduce poverty,and stimulate rural development. Freeing the textile industry of growth constraints, as this reportrecommends in the following chapters, carries macro-economic significance in terms ofexpanding employment, generating foreign exchange, sustaining GDP growth and spurringcotton sector growth.
1.6 To understand the challenges ahead for the cotton and textile industries, this chapterand the one following describe the structure, operation and policy and regulatory constraints togrowth and increased competitiveness of the textile industry and the cotton sector, drawing at alltimes on the strong linkages between manufacturing and agriculture. Chapter 3 proposes aprogram for action to meet these new challenges. Volume II presents more in-depth discussionof the textile and cotton policy environment (Annex I and 2); the structure and performance ofthe textile industry (Annex 3), the cotton production sector (Annex 4), cotton markets (Annex 5);the impact of the MFA phase-out on the cotton and textile sectors (Annex 6); and short run,distributional consequences of domestic cotton and textile reforms (Annex 7).
B. STRUCTURE
1.7 Complex and uniquely Indian, the cotton-based and, for the most part, domesticallyoriented textile industry shelters spinning, weaving, fabric-processing and garment-making firmsranging in sophistication from the hand-powered looms operated by 6-7 million, mostly poorvillagers to the advanced, automated technology found in some privately owned textile mills.(Figure A3.1, Annex 3 depicts the industry's structure). While large-scale, composite mills(mills that spin, weave, dye, print, and finish fabric in vertically integrated operations) are indecline, decentralized or "unorganized" small-scale operations are expanding rapidly. Bothcoexist with a public sector that turns out about 2 percent of domestic fabric production andconsists mainly of nationalized and sick mills taken over by the government. Predominantlysmall-scale, the roughly 77,000 apparel enterprises - 80 percent of which use no more than 20sewing machines -- employ about 1.8 million mostly piece-rate workers.
1.8 Viewed in terms of function, the structure in which garment-makers figure last includestwo supporting specialties. The first, spinning, is the province of composite mills that turn outfinished textiles and of mostly private independent spinning mills. The weaving segmentconsisted in 1994 of 266 "organized" composite mills, 145 of them privately owned, and a hostof "unorganized" powerloom, handloom, knitting, and yarn and fabric processing units thatproduce 90 percent of India's fabric. Coordinated by a master weaver or loom owner, alloperations in the unorganized weaving segment (weaving, dyeing, printing, etc.) are generallysubcontracted out to different enterprises.
1.9 Riding a decade-long boom which raised its output of yarn, fabric, and apparel by about30-40 percent, India's textile industry has prospered and become a major exporter despite thewidespread inefficiencies of many textile manufacturers. Containing only a small proportion ofinternationally competitive enterprises, the industry as a whole is performing below potential andsuffering from the effects of a large number of yet-to-be-liberalized policies and regulations thatimpede productivity growth. Considering the on-going phase-out of the Multi-Fiber Agreement(MFA) and the consequent opportunities for enlarging India's share of the growing globalmarket, such growth - rooted in improving efficiency and competitiveness - is doubly urgent.
-3 -
Freer post-MFA trade, including unrestrained entry of imports, will bring tighter competition fordomestic as well as overseas sales. This following sections examine the textile industry'sreadiness to respond to those opportunities and challenges and the impact of existing governmentpolicies and regulations on the prospects for successful adjustment.
C. EXPORT-LED BOOM
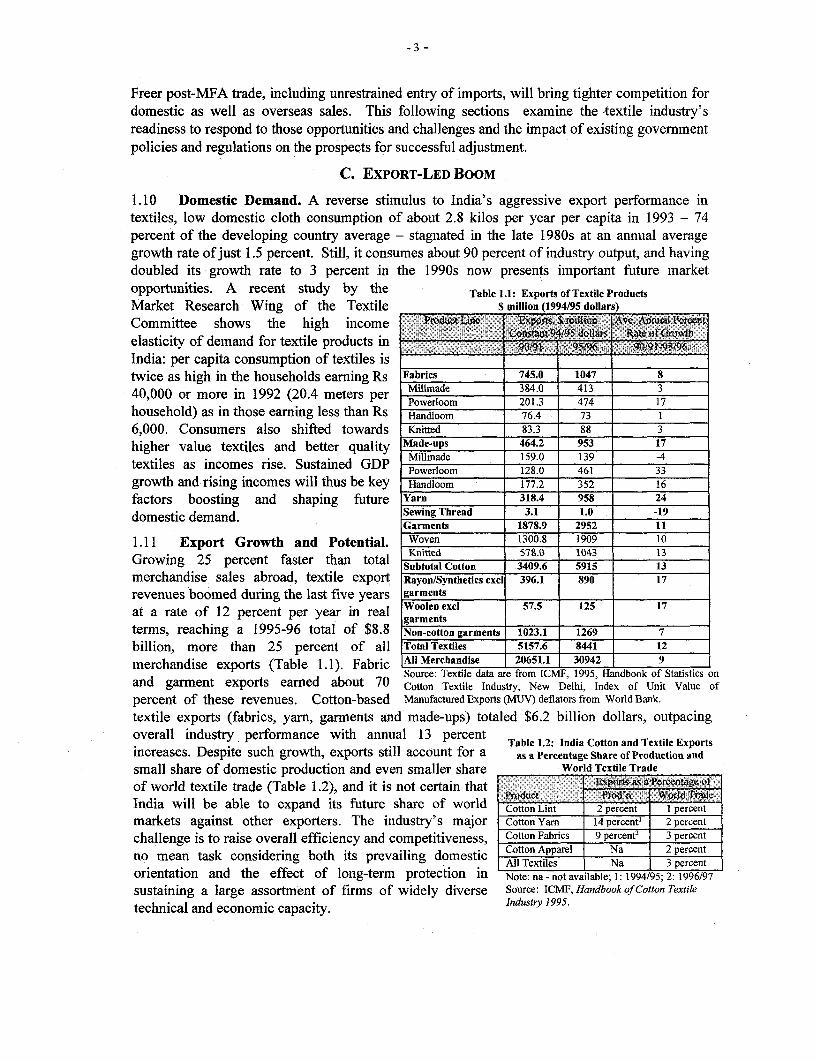
1.10 Domestic Demand. A reverse stimulus to India's aggressive export performance intextiles, low domestic cloth consumption of about 2.8 kilos per year per capita in 1993 - 74percent of the developing country average - stagnated in the late 1980s at an annual averagegrowth rate of just 1.5 percent. Still, it consumes about 90 percent of industry output, and havingdoubled its growth rate to 3 percent in the 1990s now presents important future marketopportunities. A recent study by the Table .l: Exports of Textile Products
Market Research Wing of the Textile $ million (1994/95 dollars)
Committee shows the high income rd e.A
elasticity of demand for textile products in s wIndia: per capita consumption of textiles istwice as high in the households earning Rs Fabrics 745.0 1047 8
40,000 or more in 1992 (20.4 meters per Miirnade 384.0 413 3Powerloom 201.3 474 17
household) as in those earning less than Rs Handloom 76.4 73 1
6,000. Consumers also shifted towards Knitted 83.3 88 3
higher value textiles and better quality Made-ups 464.2 953 17Millmade 159.0 139 -4
textiles as incomes rise. Sustained GDP Powerloom 128.0 461 33
growth and rising incomes will thus be key Handloom 177.2 352 16
factors boosting and shaping future Yarn 318.4 958 24
domestic demand. Sewing Thread 3.1 1.0 -19Garments 1878.9 2952 1 1
1.11 Export Growth and Potential. Woven 1300.8 1909 10Growing 25 percent faster than total Knitted 578.0 1043 13Growing 25 percentfaster than totalSubtotal Cotton 3409.6 5915 13merchandise sales abroad, textile export Rayoni/Synthetics excl 396.1 890 17revenues boomed during the last five years garments 57_5_125_17
at a rate of 12 percent per year in real Woolentec 57.5 125 17garments__ _ _ _ __ _ _ _ _ _ _ _
terms, reaching a 1995-96 total of $8.8 Non-cotton garments 1023.1 1269 7
billion, more than 25 percent of all Total Textiles 5157.6 8441 12
merchandise exports (Table 1.1). Fabric All Merchandise 20651.1 30942 9Source: Textile data are from ICMF, 1995, Handbook of Statistics on
and garment exports earned about 70 Cotton Textile Industry, New Delhi, Index of Unit Value of
percent of these revenues. Cotton-based Manufactured Exports (MUV) deflators from World Bank.
textile exports (fabrics, yarn, garments and made-ups) totaled $6.2 billion dollars, outpacingoverall industry performance with annual 13 percent Table 1.2: India Cotton and Textile Exports
increases. Despite such growth, exports still account for a as a Percentage Share of Production and
small share of domestic production and even smaller share World Textile Trade
of world textile trade (Table 1.2), and it is not certain that xosasacceg f
India will be able to expand its future share of world Cotton Lint 2 percent I percent
markets against other exporters. The industry's major Cotton Yarn 14 percent' 2 percent
challenge is to raise overall efficiency and competitiveness, Cotton Fabrics 9 percent 3 percent
no mean task considering both its prevailing domestic Cotton Apparel Na 2 percentAll Textiles Na 3 percent
orientation and the effect of long-termn protection in Note: na - not available; 1: 1994/95; 2: 1996/97
sustaining a large assortment of firms of widely diverse Source: ICMF, Handbook of Cotton Textile
technical and economic capacity. Industy 1995.

-4 -
Box 1.: The Agreement on Textils sod Clotingand the faegt of the IMFA
The GATT provides the leal framework for the ten-year, threc-We phng out of ?he MEA ad its igrati intothe GATI/WTO framework by the year 2005. On January 1, 1995, iipotn cous wee dqud to *'hteg a cetainportion of textile and clothing product categories by teroving thm from the MMA. Existing quotas resrting imports of theseproducts, which had to represent at Icast 16 p n of t90 iport volue, at to be abolidvd permanriiy. Moreover, productsselected had to include at least one catgory from ech of the folowingsubseclrrs yams, Mfics, clod , and other xtleproducts. Growth rates of rmaining quots were to incase by 16 percent dwrn the yfirst phLse, Le. a quot sibject to a 10percent growth rate in 1994, will grow by 11.6 pement during 199547. he sbocid urqb en Jiuny 1998,. anotew17 percent of 1990 import volune wil be chosen from a product list for iO epor Wm ates wDI be _Asdby 25percent. From January 2002-2005, another 18 pcent will be integrd and thk g_ will be iacrae to 27 perenmt.On January 2005. all remaining produbts, represening at leat 49 percent of t99 impot vome, wDit bc itrted. Forproducts which rman on the Ist, ft heM bila ea fraework (e.gI US and EU biler apawni) _c00as. his prmitsdifferential growth tates dating from te stWat of ingtion to moinue to app to dffelst cotg cowe and diffeentproducts until the end ofthe proes.
Source: M. Majmudar, 1996, -The MA Phase-out and EU ClothiSourcing:* Forecas to M, Textlk Outlook Jnrnational,March 1996.
1.12 The clocking is ticking as the MFA (summarized in Box 1.1 and discussed in detail inAnnex 6) phases out over ten years beginning in 1995 and leaves behind a radically altered textiletrading environment. Before 1991, the bulk of Indian cotton textile exports (yarn, fabric, andmade-ups) went to the EC (41.5 percent), USA (16.5 percent), and the Eastern Bloc countries ledby the former USSR (12.5 percent). When binding ceilings on exports to those traditional quotamarkets were reached in the early 1990s, India had to diversify its foreign customers, findingthem - and its recent export growth - in such developed countries as Australia, New Zealand, andCanada; in Asia (Japan, South Korea, and Malaysia); and in entrepot centers like Dubai,Singapore, Hong Kong, Bangladesh, Mauritius, Sri Lanka, Taiwan, and the Canary Islands whichprocess intermediate textile products for re-export. On top of this push into new territory, Indiawill have widening opportunities to sell in traditional markets as the provisions of GATTAgreement on Textiles and Clothing, which established the framework for phasing-out the MFA,take progressive effect. Export quotas will expand in three stages: by 16 percent during 1995-1997, 25 percent in 1998-2002, and 27 percent for 2003-2005. At each phase, the MFA will alsodrop quotas for portions of product categories (16 percent, 17 percent and 19 percent of 1990export volumes respectively).
1.13 The changes already reshaping international textile trade could mean substantial jumps inIndian apparel and textile output (11 percent and 8 percent per year respectively) between 1995and 2005 and in export revenues -- 15 percent for apparel and 5 percent for textiles. Using theGlobal Trade Analysis Project (GTAP) general equilibrium model, a recent analysis of the impactof the combined full MFA phase-out, US-EU bilateral agreements with India and sectoral growthon the Indian cotton textile sector by 2005, projected significant increases in production andearnings.' (See Annex 6.) Although textile imports are projected to increase (driven mainly byimports of intermediate products like yarn and fabric to support apparel export growth), India'slabor-cost advantage is expected to be critical in helping it remain a significant net exporter,especially of garments expected to account for about 80 percent of a projected $8.9 billionincrease in net export revenues. The degree to which the textile industry will be able to capturethese and even greater gains will depend on the pace at which India eliminates the domesticpolicy and regulatory constraints which inhibit investment and productivity growth.
A. Elbehri, T. Hertel and W. Martin, 1997, "Estimating the Impact of Trade Reforms on the Indian Cotton and Textile Sectors: AGeneral Equilibrium Approach, "Background working paper; see Annex 6.

- 5 -
D. TEXTILE SUPPLY
1.14 As demand for cotton textiles rose at home and abroad, so did industry output, especiallyof fabric, which had experienced a long period of stagnation inthe late 1980s (Table 1.3). Crucial to the industry's ability to Yarn and Cotton Fabrics
respond were two profound shifts in government policy: the Year Yarn Fabric
Textile Policy of 1985 and the economic liberalization million mt billion sqm
program that the GOI launched in 1991. After long reliance on 85/86 1.51 12347
import substitution and the protection of labor interests as the 93/94 1.89 18.9
foundations of its strategy for textiles (Box 1.2), the Rate of Growth ( percent)
government began to recognize in the mid-1980s both the need 85/86-93/94 3.1 4.4r8 5/86-89/90 1.9 0.1
to generate foreign exchange and expanding international 190/91-93-94 4.9 6.9
market opportunities. Easing some domestic industrial Source: ICMF, 1995, Handbook of
regulations and trade policies, the 1985 Textile Policy (i) Statistics of the Cotton Textile Industry.
dismantled the sector approach to the industry, while retaining a special role for handlooms; (ii)adopted a multi-fiber orientation and fiber flexibility; (iii) provided adequate raw materials atreasonable and stable prices; (iv) reduced the level of duties on synthetic raw materials; (v)easing entry and exit barriers; (vi) emphasized modernization and technology and machineryimports at international prices; and (vii) made Indian textiles more competitive in the worldmarket.2 The Statement of Industrial Policy, 1991 and the Textile (Development and Regulation)Order, 1992 followed by easing entry into the spinning and weaving industry. The IndustrialPolicy 1991 eliminated the need for mills to obtain licenses for new capacity, removed therestrictions that had kept large companies coming under the Monopolies and RestrictivePrevention Act from making new investments, and provided for some automatic clearances forforeign investment proposals. The Textile (Development and Regulation) Order 1992 madecertification of powerlooms automatic, except in very special cases.
;o: 1.2: Evolution of India's Cotton Ttxtile Polity
Long-standing gtornser entphasis on import substttution and the protection of labor interests shaped the structure oftextile industr Covered 1by te genal economic policy of self-reliance dating to the 195Os, the industry treated exports as amarginal ott for spuses. X large labor base and the C01's strong concem for employment produced a multitude of laborregulations fvoring handlooms but 4iscrinatig against composite mills tbrough various regulations under the Factories Act of1i48 that imposed employment rigidities and increased labor costs on them. Restrictions on expanding mill loorn capacity and onautomation in the 1950s, price contols and lower tax rates forpowerlooms and handlooms than for composite mills in the 1960sand 1970s added to th policy burden.
To prott the handloom indust y, the Hank Yarn Obligation was introduced in 1974 to require spinning mills to process50 percent of their deliveries in hank form, with at most 85 percent in 40s count or below. Government concern for adequatc accessby the poor to their ferd cotton clothing (Synthetics were for the rich.) translated into a heavy tax burden on manmadefiber, licensing to rtict entry and the c M li of the industry in terms of cotton, synthetics, or wool units. Fiscaland trade policies further discrimninated against increased domestic use of synthetic fibers.
1.15 The new emphasis on export-led growth also translated into incentives for ExportOriented Units (EOUs), the Export Promotion Capital Good Scheme (EPCGs), elimination of theminimum export price in 1995, and relaxation of the export quota for yarn. The principalbenefits to EOUs include: a tax holiday for a block of five years out of eight, the free import ofraw materials and capital goods, permission to sell up to 25 percent of their output domestically
2 p. Anubhai and V.L. Mote, 1994, "India's Textile Industry: A Case Study of Subsectoral Restructuring," in S.D. Meyanathan (ed),Managing Restructuring in the Textile and Garment Subsector, Examples From Asia, Washington, D.C.: EDI, World Bank.

-6 -
provided that at least 30 percent of the raw material is of Indian origin, and expanded yarn exportquota exemptions.
1.16 Such incentives, however, have little impact on the fundamental competitive weakness ofthe textile industry, its dualistic and highly fragmented structure as shaped by the prior policy ofreplacing imports and preserving jobs. (See Table 1.4.) That legacy includes a predominantconcentration on markets for low-quality textile products and tremendous variation in levels ofefficiency and competitiveness in spinning, weaving, and apparel firms, ranging from very high --the industry-leading exporters -- to very poor - firms oriented toward the historically protecteddomestic market.3
Table 1.4: Policy Environment in the Textile Industry, 1997Polkcy . Sector ImplementingAgency IRemarks
Domestic Regulations
Textile (Development and Weaving Min. of Industry Removed licensing requirement.Regulation) Order, 1992 SpinningThe Factories Act, 1948, & Weaving Min. of Industry, State No clear "exit" policyLabor Policies Spinning govt.Small-scale Reservation, 1977 Garment Min. of Industry Ceiling recently raised from Rs 6 to 30 million on
Knitting fixed investment of SSIsTax Policy Spinning Min. of Finance Differential taxation between cone & hank yarn,
Weaving handlooms and powerlooms/mills, cotton and MMFMMF ___
Hank Yarn Obligation, 1974 Spinning Min. of Textiles Except yarn for export, hosiery yarn, >60 counts,l_______ <blended & industrial yarn
Handlooms (Reservation of Handloom Mim. of Textiles Covers 22 productsArticles ofProduction) 1985 l l
Janata Cloth Subsidy Scheme Handloom Min. of Textiles Subsidy financed by addl. 15 percent duty ontextile products
Trade PoliciesExport Quotas Apparel Apparel Export Yarn counts > 40s, EOU and EPCG yarn, processed
Fabrics Promotion Council, yarn, & bilateral yarn exports exempted, Fabric andYarn Min. of Textiles garment export quotas under ATC and bilateral
agreements allocated by OTC based on pre-setcriteria
Import Restrictions Apparel Min. of Textiles EOUs and EPCGs exemptedFabric
Import Tariffs Apparel Min. of Textiles Reduction subject to US and EU bilateralFabric agreementsYarn
E. SPINNING PERFORMANCE
1.17 As government restrictions eased and export-promotion incentives grew after 1985,private investors financed almost all the capacity additions and modernization made in spinningmills, setting up about 50 new export-oriented enterprises, often with the help of a soft loanscheme established in 1976 and the Textile Modernization Fund Scheme introduced in 1986.Current spinning sector capacity stands at about 30 million spindles, 70 percent of them in theprivate-sector producing 83 percent of all 1995 output and almost all yarn exports. While someten million spindles process only pure cotton yarn, another 21 million - in all 70 percent ofspinning capacity - are exclusively tailored to handle 100 percent-cotton and cotton-viscoseyarns. The remaining capacity processes manmade fibers in combination with others(polyester:viscose, polyester:cotton, polyester:wool; viscose:cotton) or in pure form likepolyester, acrylic, and viscose yarns. The current stock of technologies impose some short-termlimits on cross-fiber substitutions.
3 See Annex 5 for a more detailed analysis of the performance of the textile industry.

-7-
1.18 Benefits of Cheap Table 1.5: Index of Manufacturing Cost Components of Spinning Mills UsingThailand as ReferenceCotton. Because only limited ig-g 3, ' T @, i Thailan i4il
amounts of cotton could be Waste 0.89 1.00 0.98 1.00 081 1=00 8
exported, spinners have Labor 5.30 10.00 8.90 1.80 2.10 1.00 0.50enjoyed a raw material Power 0.78 2.57 1.00 0.87 0.91 1.00 1.43
Stores 0.82 1.00 0.76 0.82 0.76 1.00 0.71subsidy that held down their Financial charges 1.25 0.95 1.05 1.02 1.48 1.00 1.11
input costs on as much as 70 Mfg. expense 1.28 1.55 1.36 1.02 1.25 1.00 1.02
percent of the final value of Cotton raw 0.93 1.00 0.98 1.00 0.87 1.00 0.88
yam spun from coarse counts materials___Total cost 1.10 1.27 1.17 1.01 1.06 1.00 0.95and at least 50 percent for Total cost without 1.28 1.55 1.36 1.02 1.25 1.00 1.02
higher counts. This apparent raw materials _ _
relative manufacturing Source: ITMF, 1995 International Production Cost Comparison.
advantage derived from discounted domestic prices is, along with cheap labor, a majorcompetitive strength of Indian spinning mills. As shown by a seven-nation comparison of themanufacturing costs of yarn (Table 1.5) conducted by the International Textile ManufacturersFederation (ITMF), India's manufacturing expenses are comparable to those of Korea andThailand, but the additional benefit of cheaper raw materials brings Indian costs below thosecountries. India's cost disadvantage with respect to electric power - unreliable in supply andbilled at higher rates for industrial consumers -- and financial charges - traceable to tightercapital markets and higher budget deficits -- is more than compensated by lower labor andmaterial costs. While Brazil's cotton is a penny cheaper than India's, its wages are more thanfour times as high.
1.19 The availability of low-cost cotton more than Table 1.6Effective Protection of Yarn EOUs and
compensated spinning mills (with benefits varying Domestic-oriented Firms, 1995
according to levels of efficiency) for the implicit tax on =.yarn - about 20 percent during the early 1980s as measured Count Dated Modem EOUs
by nominal protection coefficients - imposed by export 20s count 1.02 1.02 1.4130s count 1.41 1.41 1.28
quotas. Sharp production shortfalls in the late 80s and 40s count 1.36 1.36 1.28
early 90s, however, drove domestic prices up, eliminating Source: computed; Anntex 3
the implicit tax until continued export controls and therupee devaluation restored it at a lower rate of about 10 percent in the 1990s. The benefits ofcheap cotton vary according to the performance levels of spinning mills in three categories:EOUs, modern and dated mills. EOUs consist of new mills using more modem technologies tocater primarily to the international market. They account for about 21 percent of capacity and 25percent of yarn production of 60s count or less. Modem mills that hold the largest share ofcapacity (40 percent) and of output (40 percent) are usually older ones that upgraded theirequipment during the 80s. The less efficient, mostly public-sector dated mills use old equipmentand account for the other large chunk of capacity (35 percent) and production (38 percent). Mostof the yarn exported comes from export-oriented units and the well-run, modern units. Dependingon the yarn count, it was estimated that the rate of effective protection of spinning mills in 1995ranged from 2 to 40 percent (Table 1.6). Export-oriented units captured the most significantpositive effective protection.
1.20 Trading in an Open Environment. Even without such shelter, dedicated exporters andmodern mills should be able to compete in international markets, but older mills will need tomodernize to adapt to liberalized global trade and probably move to lower yam counts whereIndia's comparative advantage seems stronger. If cotton and yarn prices are allowed to rise toworld market levels, EOUs - on the basis of their total costs and prices per kilo -- remainprofitable across most yarn counts. Modern mills also earn profits for 20s and 30s yarn counts,

- 8 -
but, unless they modernize further, would incur losses of about Rs 6.28/kg in producing highercounts. Dated mills, because of their high operating costs, are unlikely to remain competitive inthe international market in all yarn counts (Table 1.7). Restructuring and modernizing datedmills producing 20s and 30s counts of yarn may be enough to put them in the black, sinceestimated losses per unit of Rs 1.48/kg and Rs 5.03/kg are small, compared to those of Rs11.36/kg. at 40s count and above. Table 1.7: Competitiveness of Different Categories of Mills by Yarn
To remain cost competitive, the Counts at World Cotton and Yarn Prices, Rslkgdated mills in the higher counts that Y YawCoimt Export Oiented Units Modem Milis Dated Mills
produce 15 percent of all cone yarn 30s 6.34 0 0.38 -1.48
would need to move down the scale 40s 0.66 -6.28 -11.36to yarn India has been most Source: H. Bhattacharya, 1996, "India Cotton Sector Study".
successful in selling abroad.
1.21 The Hank Yarn Obligation. A constraint on the competitiveness of all spinning mills,the Hank Yarn Obligation (HYO) was conceived as a way to ensure affordable supplies to poorvillage and rural handloom weavers. Technically, the HYO directs spinning mills either toprocess 50 percent of their deliveries as hank yarn, a hand-reeled type used by handlooms andrequiring a large workforce, or transfer the obligation to other firms. Since the 50 percentobligation is calculated on the basis of a percentage of the net qualifying amount after exemptionsfor exports, own consumption (for composite mills), and hosiery and blended yarn output, actualdeliveries of hank yarn generally average about 25 percent of total yarn output. Many older millshave phased out their hand-reeling operations and most new ones do not set them up at all, sincethey take up additional space, require older systems and such a large labor force that the mostlyfemale hand-reelers in some mills with both automatic spinning and hand-reeling facilitiesnumber half the total of all other factory employees. Table 1.8: Hank Yarn Obligation
Facing such high costs, mills that do not have in-house Transfer Prices
reeling transfer their hank yarn obligations, generally to Year _ TransferCharge Rs/kg
public-sector and cooperative mills. In the active market for ini Max91/92____ 0215 0.70
HYO transfers, charges range from 25 paise per kg to Rs I 92/93 0.30 0.30
per kg (Table 1.8). The premium on transfers, up to Rs 5 93/94 0.30 1.00per kilo at the 1994 peak of the cotton shortage, had Jan96 0.40 999
Source: ICMP, 1995, in H. Bhattacharya, "Cotton and Textiledropped to 40 paise/kg by January-February 1996. Markets, Linkages, Performance and Prospects"; S. Chaudhury,
1996, "Cotton Sector Study," ICRA.
1.22 Meant to sustain low-income weavers, the obligation acts as an incentive for illegalmisrepresentation of hank yarn, which is exempt from excise duties and sales tax, as cone yarn,which is subject to a 5 percent excise duty and a 2 percent sales tax. Although hank yarn is Rs4/kg more expensive to produce, the combined effect of tax waivers and administrativelyprescribed production is to make its price about 10 percent lower than cone yarn, a differentialthat results in leakages of output (estimated at 15 to 25 percent) to non-handloom weavers. Thisimproper diversion of hank yarn occurs because machine dyeing of cone yarn is more costly thanhand-dyeing of hank yarn. Some spinning mills even find it economical to convert hand-dyedhank yarn back into cone yarn to meet the demand of powerlooms for dyed cone yarn.
1.23 Raising cotton spinning costs by compelling the use of obsolete hand-reeling technologyand by requiring firms to divert resources to hank yarn production, the HYO is a productivity taxthat forces mills to limit their cone yarn production and thus forego both higher export volumesand advantageous economies of scale. The observed transfer cost of the obligation - anestimated Rs 0.5/kg on one quarter of total production -- provides a market-based approximationof the HYO's associated costs: a productivity loss equal to roughly 0.14 percent of the output ofthe cotton spinning sector. The HYO also influences investment decisions by encouraging

-9 -
investments in hosiery yarn spinning or the establishment of a 100 percent EOU to get around theobligation.
1.24 In addition to the effect of the implicit tax in discouraging private investments inmodernizing spinning mills, the duty relief on hank yarn subsidizes old, inefficient, and costlyproduction processes, many of them in the state sector. This implicit subsidy to inefficient mills isover and above the direct government support to the handloom industry for hank yarn. Worse, itis not targeted. The explicit subsidy at least goes to socially disadvantaged handloom weavers. Asnew mills come on stream - almost certainly without hand-reeling facilities -- the continuation ofthe HYO will simply mean higher implicit subsidies to the state sector and widespread transfersof public revenues to private mills that falsify their declared hank yarn output.
F. MANMADE FIBER PRODUCTS
1.25 Lower Man Made Fibers (MMF) prices will boost domestic consumption of synthetictextile products-- including those of the poor who appreciate their greater durability--and exportsof blended and synthetic products. Although traditionally perceived by government as a "richman's product," over 50 percent of synthetic textile products according to a recent study are nowconsumed by lower income households in India (earning less than Rs 20,000 per year). Blends ofcotton and MMF have gained domestic and international popularity because they combine theeasy-wear properties and durability of synthetic fibers with the comfort of cotton. Increasedproduction of blends would permit increased textile output with the available supply of cottonand help ease the upward pressure on cotton prices, while substituting manmade filament yarnsfor cotton would help accommodate rising domestic textile demand.
1.26 Production and Export Trends. The continuing cuts in fiscal levies and tariffs onmanmade fiber intermediates initiated by the 1985 Textile Policy as well as various programs topromote exports have already fostered greater domestic and export demand for manmade fibersand spurred higher investments in new manufacturing capacity. Between 1985/86 and 1993/94,installed capacity for the production of manmade fibers and filament yarn grew at an annualaverage of 14 percent and 19 percent respectively, resulting in the near tripling of domesticoutput. Synthetic product export revenues rose 17 percent per year in real terms to reach $900million in 1995/96 (Table 1.1). Even so MMF products have only a small, though increasing,
Table 1.9 market share in domestic output andImpact of Excise Duties on Market Prices for Different Yarn Types in exports. Blended and 100 percent
MMF spun yarn, for example, had_P ;s^/^ g i X only 25 percent of India's yarn market
PolyesterNiscose 102 20 122 107 in 1994/95, and manmade fabrics
Polyester/Cotton percent 121 106 account for 37 percent of the fabricpercent market. The share of synthetic
Cotton 110 5 percent 1116 16 product exports (excluding garments)source: R. Ramakhrisna, 1995, "Textile Export Targets, The Role of in total textile export revenues is onlyPolyester," Association of Synthetic Fiber Industry. mimeo. about 9 percent.
1.27 Those shares might well rise if higher tariffs and taxation did not inflate the relative costsof MMF products and discourage growth in domestic consumption. Higher excise taxes, forinstance, make 40s count blended and non-cotton spun yarns 5 percent more expensive thancotton yarn. If the 5 percent duties applied to cotton yarn were levied uniformly on all 40s countyarns, blends would be as much as 7 percent cheaper than cotton (Table 1.9). Higher tariffs onMMF intermediate products, however, raise the costs of synthetics even further relative to cottonproducts (Table 1.10).

- 10 -
G. WEAVING PERFORMANCE
1.28 As cotton fabric production rose 40 percent between 1985/86 and 1995/96 to 18.9 billionsquare meters, a distinct shift in market position carried the share of organized mills down from22 percent to 7 percent as the unorganized and small-scale segment (handloom, powerloom andhosiery) of the weaving and knitting industry rose substantially. Powerlooms expanded theirshare of cotton fabric output from 35 percent to 41 percent and hosiery's grew from 11 percent to26 percent. A relative newcomer in the market, the small-scale hosiery/knitting subsector, hasalso been expanding particularly fast since 1990/91 (20 Table 1.10: Import Tariffs on Cotton andpercent per annum until 1995/96.) Manmade Products
1.29 What eroded the competitive position of organized Comodity Imills was a government-imposed package of regulations Jun-on the composite mill sector designed to promote their -Pocunorganized rivals and protect labor. (See Annex 1.) Cotton Apparel 50
Burdened by these rules with a work force with low percent
productivity, mills gradually lost their capacity to Cotton fabric 50percent
modernize and survive. By 1995, the number of closed Cotton yarn 25
mills rose to 61 units, their idle spindles and looms percent
accounting for about 13 percent and 23 percent of industry Cotton lint 0 percent
capacity respectively. Average capacity utilization in the Raw cotton 0 percentMan-Made Fiber Products
mill sector dropped to 73 percent for installed spindles and Apparel 50
43 percent for looms, very low by international standards. percent
In addition, there are currently 275 mills registered as sick Fabrics 50
with the Board for Industrial and Financial Reconstruction Nylon, Polyester, and Viscose percent(BIFR). Of these 124 are under the National Textile Filament yarn 30
Corporation (NTC), a government parastatal created in Other manmade filament yarn 30
1968 by the GOI to oversee the mergers and revival of percent
ailing private mills. Among the better private performers, a Artificial and synthetic fibers 30
large (about 40 percent) share of their production is DMT_PTA _&MEG_ percentexported, a reflection both of their greater capacity - DMT, PTA, & MEGpe
compared to the unorganized sector -- to meet export Source: GOI and G.Pursell , 1996, "Indian
volume and quality requirements and of their difficulty Trade Policies Since the 1991/92 Reforms,"
competing against powerlooms in domestic markets. forthcoming.
1.30 Export Competitiveness. Thanks in part to low labor costs, India's private weavers canbe internationally competitive in the low-to-medium-price/quality market. (See Table 1.11.) Inthe gray cloth market, for instance, assuming similar yarn prices in India and four other countries,low manufacturing costs in powerlooms and new mills give India considerable advantages. Acomparison of hourly wages in the clothing industry (inclusive of social contributions) in 1993shows that India has one of the lowest costs of labor (27 cents/hr) in general and relative to otherAsian countries. India rivals Pakistan; only Vietnam (26 cents), Romania (25 cents), China (25cents) and Bangladesh (16 cents) rank lower.4 Because of this competitive strength, the weavingindustry is attracting substantial investments, such as those to set up 13 denim projects at a totalinvestment cost of Rs 17.4 billion ($519 million) with a total capacity of 156.2 million meters.Of these, 42.8 million were commissioned by March 1996, with a further 50 million meters ofproduction capacity added in March 1997.
4 European Commission, 1995, in M. Majmudar, 1996, "The MFA Phase-out and EU Clothing Sourcing: Forecasts to 2005," TextileOutlook International, pp.3 1-61.

Table 1.11 1.31 Public SectorComparison of Cost of Production of Gray Cloth, $US/yard of 63 inch wide cloth Mills. In contrast to
M~,Nlofi Ofi IR 1.- ~, M hs encouragin
04 0.44 0.44 04 0 0.4 04 signs of renewal is theEnergy 0.06 0.03 0.03 0.03 0.04 0.04 0.18 reality, as recorded byLabor 0.22 0.14 0.04 0.03 0.03 0.02 0.01 the Annual Survey ofCapital 0.21 0.18 0.16 0.20 0.18 0.16 0.06 Industries, that taken asOthers 0.03 0.04 0.05 0.06 0.14 0.08 0.03Total cost: a whole, the cotton
w/o yarm 0.52 0.39 0.28 0.32 0.39 0.30 0.28 textile industry isw/ yam 0.96 0.83 0.72 0.76 0.83 0.74 0.72 persistently incurring
Note: Cloth specification 60x60 using 20s count yam. Yam requirement per yard is 21(gms, 20s losses. Of itscotton yarn taken at $2.1/kg.Source: ITMF, Switzerland 1993 data, powerloom date from ICMF, in H. Bhattacharya, in "India component 8,896Cotton and Textile Markets:Linkage, Performance and Prospects". factories in 1992-93,
spinning and weavingmills accounted for a fifth. That year the entire industry incurred total (financial) losses ofRs7,960 million ($301 million), nearly double the drain in 1987/88.5 Losses of public textileenterprises (NTC or private mills taken over by GOI) alone amounted to Rs 6 billion in 1993/94,equivalent to 75 percent of the reported industry-wide losses in the previous year. In real1993/94 rupees, their cumulative deficits over the five years from 1989/90 to 1993/94 came toabout Rs 21.6 billion ($787 million), funds which could have been invested more productively inother areas (Table 1.12). States also operate a number of sick textile enterprises, but no data areavailable on their performance.
1.32 Cutting some ofTable 1.12: Public Textile Enterprises: Cumulative Net Profits and these losses, officials had
Losses (89/90-93/94) and Net Worth (93/94) and Number of Employees closed 25 public mills by
December 1994 and; mi1i4Qn, , fil1i~n~ released Rs 743 millionCawnpore Textiles -10.98 0.47 1,446 from the Textile Worker'sElgin Mills -91.90 0.40 4,838 Rhbltto udShmNTC: _X_T Rehabilitation Fund SchemeNTC, Ltd 2.76 146.98 334 to compensate the 37,131AP, Kamataka & Kerala -49.79 24.07 11,437 workers laid off, an averageDelhi, Punjab & Rajasthan -30.98 11.23 7,618Gujarat -105.73 11.38 7,791 payment per worker ofMP -81.80 13.19 12,206 about Rs 20,000 (US$571).Maharashtra-North -85.01 24.10 10,770 Labor unions have stalledMaharashtra-South -93.29 22.86 13,339 further closings of theTN and Pondicherry 10.16 25.42 11,442reang12 pulcmlsUP -118.07 19.02 1,861 remaining 124 public mills,WB, Assam, Bihar & Orissa -132.84 17.48 12,003 objecting strongly to anyTotal -787.46 95,085 more worker layoffs. The
Note: a - 93/94 dollars; b - equity and reserves, c - non -casual employees in 1993/94 * , *i.Source: GOI, Public Enterprise Survey, various issues. Issue s acute political
sensitivity is heightened byquestions related to the sale of surplus land in affected mills.6
1.33 Still, some individual workers -- about 38,000 of them in NTC mills -- have opted forvoluntary retirement and received average payments of Rs 143,000 (about $4,000). Some stategovernments are also adopting the same policy, funding a Rs 2.5 billion VRS, in one instance,
In 1982/83, total textile industry losses amounted to Rs 1,880 million.
6 "The ICMF Urges Total Liberalization in Textile Sector," The Textile Monitor, Vol. 15, December 1995.

- 12 -
for 14,000 workers of the Gujarat State Textile Corporation Ltd (averaging Rs 180,000 perworker). The existing forms of VRS, however, have been criticized both for adverse Aselection,poor targeting and for built-in bias in the method of estimating surplus labor. A recent study7
found that most workers opting for VRS were close to retirement, making the retirement schememore an added retirement bonus than an instrument of retrenchment. It also encouraged thedeparture of more competent workers and officers in the 35-to-50 age group (almost 44 percentof the total), a large number of whom had already secured alternative employment in better paidprivate sector jobs. The poor targeting of redundancies is further exacerbated by stringent laborlaws which require complicated, hard-to-obtain proof that closing a plant or a section of it willalleviate substantial losses. This provision also impedes efforts to shut down unrelated orunprofitable lines of business when a firm is making profits.
1.34 The performance of almost all the mills listed in Table 1.12 has been so poor that theiraccumulated losses (1989/90 to 1993/94) exceed their net worth by close to $800 million, a gapprompting calls for an end to direct and indirect government support, especially in hard fiscaltimes. But any action to liquidate or privatize these mills will require large fiscal outlays toretrench workers. Assuming all 95,000 workers currently employed in these mills participate in aVRS at a rate of Rs 140,000 per worker, the cost of their departure would total some $380million, about 88 percent of the losses (in real terms) accumulated by these mills in 1992/93 and1993/94. For mills that need to be liquidated, an important issue would be the speed andefficiency of the process, a tortuously slow one in India. A recent study8 found that 51 percent ofcompanies in court to wind up their operations remained in limbo for at least 10 years; 32 percentat least 20 years.
H. THE HANDLOOM SECTOR
1.35 The share of hand-loomed fabric in total output increased from about 25 percent in theearly 80s to 37 percent in 1995/96, and there remains over 3.6 million handlooms and 6-7 millionpeople - most of them poor, rural and often illiterate women -- employed in working them invarious parts of the country. The majority are in the states of Tamil Nadu, Andhra Pradesh,Assam, Uttar Pradesh, West Bengal, and Haryana, catering primarily to the fabric requirementsof rural folk and also specializing in saris in many areas. Handloom operators have been on thelosing end of a competition with powerlooms which are better able to turn out mass consumptionproducts such as saris, shirts, suits, and dress materials. Through various schemes andregulations, however, the GOI is protecting the handloom subsector, as it is labor intensive andprovides supplementary wages in rural areas. In addition to the Hank Yarn Obligation, thesemeasures include the reservation of production of certain fabric varieties, low-interest working-capital loans, modernization funds, tax exemptions, and rebates on prices of the fabrics soldthrough cooperatives. This protection effort, as noted earlier, has come at a cost to the spinningindustry, especially because of the HYO.
1. APPAREL MAKERS
1.36 Another instance of the GOI's bias toward smaller-scale, labor-intensive enterprise is thesubsector that employs about 1.8 million people - most of them paid as piece-workers -- andincluded in 1990 an estimated 77,046 apparel manufacturers of which about 80 percent operatesmall or cottage-industry level operations. Recently, the investment ceiling for small-scaleenterprises in general was raised by a factor of five to Rs. 30 million with investors obliged to
0. Goswami, 1996, "India's Public Sector Enterprises, The Case for Reform and Privatization," mimeo, HIID, Harvard University.
s A. Mathur 1993, "Industrial Restructuring and the National Renewal Fund" mimeo, Asian Development Bank.
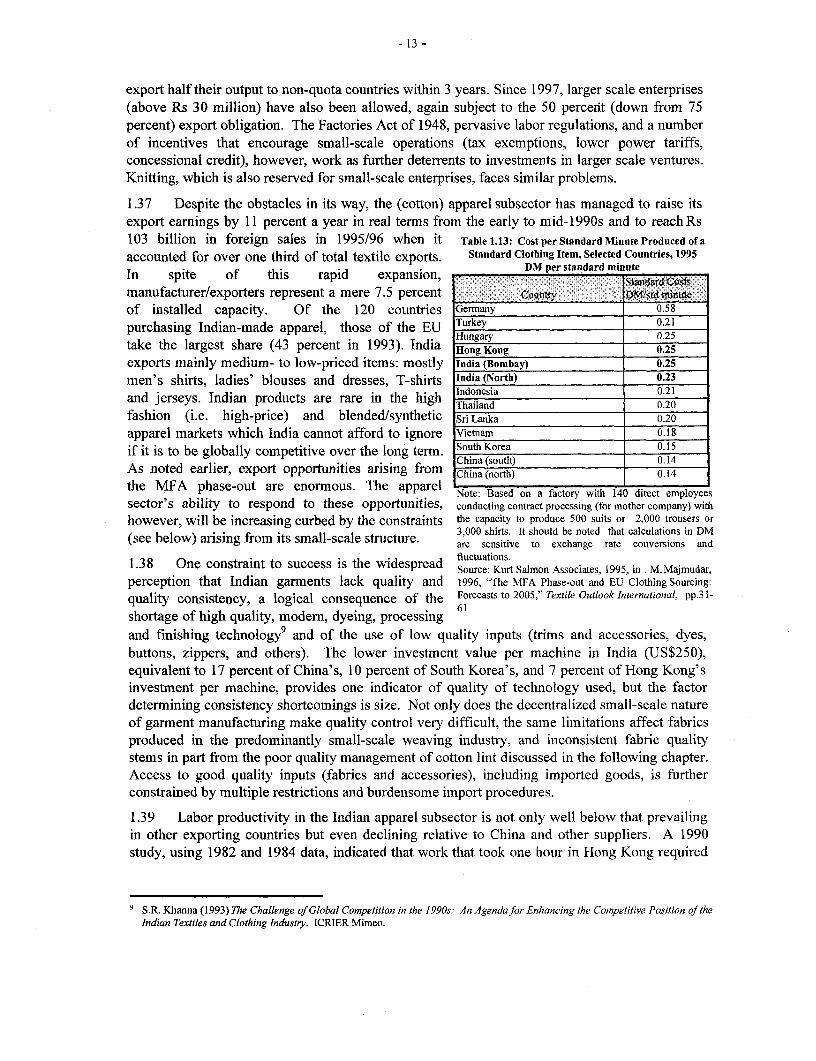
- 13 -
export half their output to non-quota countries within 3 years. Since 1997, larger scale enterprises(above Rs 30 million) have also been allowed, again subject to the 50 percenit (down from 75percent) export obligation. The Factories Act of 1948, pervasive labor regulations, and a numberof incentives that encourage small-scale operations (tax exemptions, lower power tariffs,concessional credit), however, work as further deterrents to investments in larger scale ventures.Knitting, which is also reserved for small-scale enterprises, faces similar problems.
1.37 Despite the obstacles in its way, the (cotton) apparel subsector has managed to raise itsexport earnings by 11 percent a year in real terms from the early to mid-i 990s and to reach Rs103 billion in foreign sales in 1995/96 when it Table 1.13: Cost per Standard Minute Produced of a
accounted for over one third of total textile exports. Standard Clothing Item, Selected Countries, 1995
In spite of this rapid expansion, DM per standard minutemanufacturer/exporters represent a mere 7.5 percent N WSIP____d __
of installed capacity. Of the 120 countries Germany 0.58
purchasing Indian-made apparel, those of the EU Turkey 0.21Hungary 0.25
take the largest share (43 percent in 1993). India Hong Kong 0.25
exports mainly medium- to low-priced items: mostly India (Bombay) 0.25
men's shirts, ladies' blouses and dresses, T-shirts India (North) 0.23
and jerseys. Indian products are rare in the high Indonesia 0.20
fashion (i.e. high-price) and blended/synthetic Sri Lanka 0.20
apparel markets which India cannot afford to ignore Vietnam 0.18
if it is to be globally competitive over the long term. South Korea 0.15China (south) 0.14
As noted earlier, export opportunities arising from China (north) 0.14
the MFA phase-out are enormous. The apparel Note: Based on a factory with 140 direct employees
sector's ability to respond to these opportunities, conducting contract processing (for mother company) with
however, will be increasing curbed by the constraints the capacity to produce 500 suits or 2,000 trousers orfrom its small-scale structure. 3,000 shirts. It should be noted that calculations in DM
(see below) arising from its small-scale structure. are sensitive to exchange rate conversions andfluctuations.
1.38 One constraint to success is the widespread Source: Kurt Salmon Associates, 1995, in . M,Majmudar,
perception that Indian garments lack quality and 1996, "The MFA Phase-out and EU Clothing Sourcing:
quality consistency, a logical consequence of the Forecasts to 2005," Textile Outlook International, pp.3 1-
shortage of high quality, modern, dyeing, processing 61
and finishing technology9 and of the use of low quality inputs (trims and accessories, dyes,buttons, zippers, and others). The lower investment value per machine in India (US$250),equivalent to 17 percent of China's, 10 percent of South Korea's, and 7 percent of Hong Kong'sinvestment per machine, provides one indicator of quality of technology used, but the factordetertnining consistency shortcomings is size. Not only does the decentralized small-scale natureof garment manufacturing make quality control very difficult, the same limitations affect fabricsproduced in the predominantly small-scale weaving industry, and inconsistent fabric qualitystems in part from the poor quality management of cotton lint discussed in the following chapter.Access to good quality inputs (fabrics and accessories), including imported goods, is furtherconstrained by multiple restrictions and burdensome import procedures.
1.39 Labor productivity in the Indian apparel subsector is not only well below that prevailingin other exporting countries but even declining relative to China and other suppliers. A 1990study, using 1982 and 1984 data, indicated that work that took one hour in Hong Kong required
S.R. Khanna (1993) The Challenge of Global Competition in the 1990s: An Agenda for Enhancing the Competitive Position of theIndian Textiles and Clothing Industry. ICRIER Mimeo.

- 14 -
5.4 hours in China and 6.5 hours in India.10 A 1996 study,I' using 1993 and 1995 data, impliesthat work that took 1 hour in Hong Kong requires 8.7 hours in China and 14.4 hours in India. Asa result, the potential advantage of India's low labor costs - a more significant factor in apparelmaking than in spinning -- is being dissipated by low labor productivity (Table 1.13) traceable tolow levels and quality of investments, management weaknesses, and lower labor quality, all ofwhich are expressions of the limits inherent in small-scale manufacturing.
1.40 Yet another obstacle to global competitiveness arises from the 90-120-day lead times forthe delivery of Indian exports, as against 45-60 days for Hong Kong/China suppliers, and fromnon-adherence to delivery schedules. At fault are poor transport and port infrastructure,cumbersome import and export procedures, and the decentralized nature of production. The lossof 30 to 40 days to the licensing process, the 5-7 days to receive imported goods, and the 10-15days needed to move exports through customs, and the difficulty of coordinating a large numberof participants put Indian companies that would convert imported fabric into garments at aserious international disadvantage. While low labor costs, lower overheads, operational flexibilityand the ability to accommodate greater product variety offer apparel exporters a potentialcompetitive advantage, that edge is blunted by low labor productivity, quality consistencyproblems, and long lead times for export processing.
J. CONCLUSION
1.41 The Indian textile industry faces tremendous domestic and export market opportunities aswell as new challenges in what is bound to be a more competitive market for textile products.Although its performance indicates tremendous scope for productivity catch-up with its maincompetitors, notably from East Asia, progress is delayed, if not blocked, by such policies as thecotton yarn export quotas, hank yarn obligation, discrimination against MMF, labor regulations,and restrictive policies on foreign and domestic investments. Sustained growth in the textileindustry would benefit cotton growers by increasing demand and stimulating improved qualitymanagement in cotton production and marketing, raising growth opportunities that also pose newchallenges to cotton policies traditionally shaped to fit textile industry interests. Eliciting a cottonsupply response, in volume and quality, may require sacrificing some of the cushion provided bythe cotton subsidy and squeeze profitability in various segments of the textile industry. The nextchapter addresses those issues.
" Trela, 1. and Whalley, J. 1990. "Global Effects of Developed Country Trade Restrictions on Textiles and Apparel." EconomicJournal 100:1190-2105.
Economist Intelligence Unit (1996), Textile Outlookinternational,. Economist Intelligence Unit, London.

2 Cotton: Farming and Marketing2.1 Rising domestic and export demand for textile products opens tantalizing opportunitiesfor cotton producers to improve their performance, both in quantity and quality, so that they cancompete with imports, and provide the textile industry the grade of raw materials it needs tosucceed against foreign contenders at home and in new export markets. Increasing productivity,however, requires broad policy changes. Low prices, over-regulated domestic trade and ginning,together with a historically domestic-oriented and highly protected textile industry have until nowacted in combination to hold farmers back from adopting the necessary improvements in thequality of their product and the control of the pests that threaten it. A central finding of thisreport, developed in this chapter on the performance and prospects of the cotton sector, is thatgrowers have much to gain from quality-enhancing changes in their practices and that the textileindustry, adapting to more demanding domestic and foreign markets, has little to lose from thehigher prices that higher-grade cotton should fetch.
A. COTTON PRODUCTION
2.2 Background. Five millennia of cotton growing and an ideal range of climatic conditionshave made India a major and diverse producer (16 percent of world cotton lint output in 1996/97)and one of the few countries that can grow a wide spectrum of cotton varieties with differentstaple lengths -- from short (<10 mm) to extra long staples (>38 mm). On 9.1million hectaresplanted in cotton in 1996-7 -- equivalent to about 25 percent of total world cultivated area --production amounted to 2.4 million metric tons (mt) of the fiber (lint) that is the ginned productof raw, unprocessed seed cotton, locally known as kapas, also the source of seeds that can becrushed to extract edible oil and of meal used as livestock feed. When lint is spun into yarn,staple length becomes an important determinant of final fabric quality with short-staple cottongenerally used for knitwear and denim, and longer staples woven into fine shirts and knits.Currently, about 100 varieties of cotton grow in India, of which 20 to 25 account for 90 percentof the crop, a mix that provides great flexibility in expanding sales in a wide range of textileproduct markets.
2.3 Specialization. Cotton produced in India is classified by the private sector into 5 staplecategories: Extra Long (27 mm & above); Long (24.5 to 26 mm); Superior Medium (22 to 24mm); Medium (20 to 21.5 mm); and Short (19 mm & below).12 The northern region (Punjab,Haryana, and Rajasthan) is the primary producer of shorter staples, and southerners in Karnataka,Andhra Pradesh, and Tamil Nadu mainly grow longer staples (mostly DCH 32 and Suvin). Thecentral region (Maharashtra, Gujarat, and Madhya Pradesh) produces a wider range of staples(mostly American and Desi varieties). As of 1995/96, , superior medium and medium staplesaccounted for 47 percent of domestic output, followed by long staples 43 percent. The extralong and short staples accounted for 2 percent and 8 percent respectively.
12 This is the classification followed by the East India Cotton Association, Ltd. The Cotton Corporation ofIndia follows a different system: Extra Long->32.5 mm; Long -27.5 to 32 mm; Medium Long - 25-27mm; Medium - 20.5 to 24.5; and short- <20 mm.

- 16 -
2.4 Sources of Growth. In the last 15 years as Figure 2.1: Cotton Production, Area, Yield
yields rose, overall production grew by about 800,000 1974/75 to 1995/96mt, from 1.27 million mt in TE 81/82 to 2.02 million 300 - 9
mt in TE 1995-96. Cotton output grew by 3.9 percent 250 mlp_. 8per year, second only to oilseeds, which grew at 5.5 200 6percent, faster than all cereals (2.6 percent) and .0
cm 150sugarcane (2.8 percent) and at about the same rate as c, 4
plantation crops (3.8 percent), fruits and vegetables 100 _ 3 °(3.9 percent). Overall yield improvements of about 3 so 2 *
percent annually more than compensated for the o 0stagnation in cultivated area (Figure 2.1). Cotton , n 00 v' t > O .
yields improved the fastest in the southem region and 4 & x- oenN' N0 0C 00 O
Maharashtra, explaining most of the cotton output Yield + Prodn _. Area
growth. In the northern region where yields are
highest but improved more slowly, area expansion Source: MOA, GOI, Agricultural Statistics at a Glance.
played the dominant role in explaining productionincreases..
2.5 Behind these increases lie both the spread of irrigation and the introduction between 1967and 1992 of over 100 improved varieties and hybrids with potential yields of 600 to 4,500 kg/ha.By 1992-93, high-yielding varieties covered about 55 percent of total cotton-cultivated area --hybrids 36 percent and improved varieties 19 percent.13 A strong domestic public and privateresearch program developed these that so reshaped the composition of the country's cottonstaples that it could shift from being a traditional importer to a major producer and occasionalexporter of long staple cottons. Begun in 1968, increased liberalization of the seed industryfostered the development of private enterprises that distributed the improved varieties widely and,by 1993/94, accounted for almost 80 percent of hybrid seed sales. Since improved varietiesgenerally perform better with irrigation, its expansion - though still on only 30 percent of all landplanted in cotton -- helped support the production increases. In the north, the 340,000 additionalhectares added between TE 81/82 and 93/94 are primarily in irrigated areas, and in the centralregion, although total cotton plantings dropped, Figure 2.2: Average Cotton Lint Yields in Selected Countriesthe irrigated share rose. and Indian Regions. 1992-94
2.6 Unexploited Potential. Better seeds 1.2.
and more water, however, have still left 1 L _
productivity low by international standards.The average yield of irrigated cotton in the 0.8Northern Region (India-N) during 1991-92 to ;, 0.61993-94 is less than or close to half of the other E 0.4major irrigated cotton producers in the world, 0 l2including China, Egypt, the United States, and 0.2Uzbekistan (Figure 2.2). Rainfed cotton yields 0 IN -in Maharashtra and the Central and Southern;. r- j a ni
_ ~~~~~~~~=.0 cmregions are likewise considerably lower than the -i _ Xv 0 . N
mostly rainfed cotton yields in Brazil. | -
2.7 Swelling Demand. As described in the Note: I - irrigated; R - rainfed; N -North, C-Center,preceding chapter, export-led growth, fueled by M-Maharashtra, S-South
Source: FAO.
A.K. Basu and R.S. Paroda, 1995, Hybrid Cotton in India--A Success Story, Bangkok, Thailand: Asia Pacific Association ofAgricultural Research Institutions.

- 17 -
the MFA phase-out, and surging domestic demand indicate such an increase in markets for textileproducts and cotton that a world textile general equilibrium model (See Annex 6) projects a needto boost cotton output an estimated 72 percent by the year 2005 if the MFA is fully phased-out(60 percent if the ATC/MFA quotas are not fully eliminated by then). Even then, since domesticsupply would probably still fall short of demand and quality requirements, cotton imports areprojected to rise by US$ 160 million by 2005. Driven by export criteria and even with exportquotas in effect, quality requirements will also become more stringent and create strongincentives to export some cotton varieties while importing others - using trade arbitrage to makethe choices -- so as to achieve product differentiation. Given the wide disparity between Indianand world yield levels, intensification, rather than area substitution, looks to be the strongestengine of future output growth. Achieving a 72 percent increase in domestic production requiresovercoming the policy, technical, and institutional constraints to intensification and qualitymanagement discussed below, and translates into a 4.2 percent annual production growth rate,compared to 3.9 percent achieved over the last 15 years.
B. POLICY AND PRODUCTIVITY
2.8 Export Quotas. To ensure textile manufacturers an adequate supply of raw materials,India sets yearly quotas for cotton lint exports, ranging from 7,000 mt to 300,000 mt, dependingon the local supply and demand situation. (Table 2.1.) Fluctuating from 1 percent to 16 percentas a share of domestic production, exports have until recently been a monopoly of governmentand cooperative agencies. Only during the 1995-96 were they opened to private trade, with exportallocations awarded through auction. For the 1996-97 season (October to September), the exportquota for staple cotton is set at 58,650 mt, equal to 345,000 bales.
2.9 Depending on official assessment of the cotton supply situation, export quotas arereleased in ad-hoc installments during the season, a practice that introduces considerableuncertainty - and consequent price discounts on world markets - and has gone so far as a sudden1994-95 suspension of quotas and temporary halt to shipments for contracts entered into withoverseas buyers. Aggravating these discounts are the Table 2.1
perceived lower and inconsistent quality of Indian cotton, Cotton Production and Export Quotas
the need for importers to regrade cotton (due to less i Pd :Quoi~ M Sh ofstringent local grading practices) and the lack of expertise 84-85 1446.2 50.2 3%
in international cotton trading of the state agencies that 85/86 1483.6 235.1 16%
dominate exports. Consequently, most CCI and state 86/87 1173.9 90.4 8%
agency export sales are made on a FOB basis to 88/89 1084.9 36.7 2%
international cotton merchants, who use Indian cotton 89/90 1940.4 251.8 13%
merchants as their agents. It is export quotas, however, 90/91 1673.2 228.7 14%
that have the strongest impact of any single policy factor 91/92 1651.4 23.0 1%9/3 1969.1 303.6 15%
in keeping cotton prices low. Using the nominal 93/94 1820.7 96.9 5%
protection coefficients of MCU-5, S-4, and J-34 cotton 94/95 2354.5 31.6 1%
varieties as indicators of the degree of protection or 95/96 270.3
disprotection for extra-long staples (ELS), medium and Source: Office of the Textile Commissioner.
short staple cottons, respectively, a recent study showed that Indian prices for Extra Long Staple(ELS) and short staple cotton lint ran on average about 35 percent and 15 percent below exportparity levels, respectively, since 1980 (Figure 2.3). Medium staple cotton prices fluctuatedaround export parity levels.
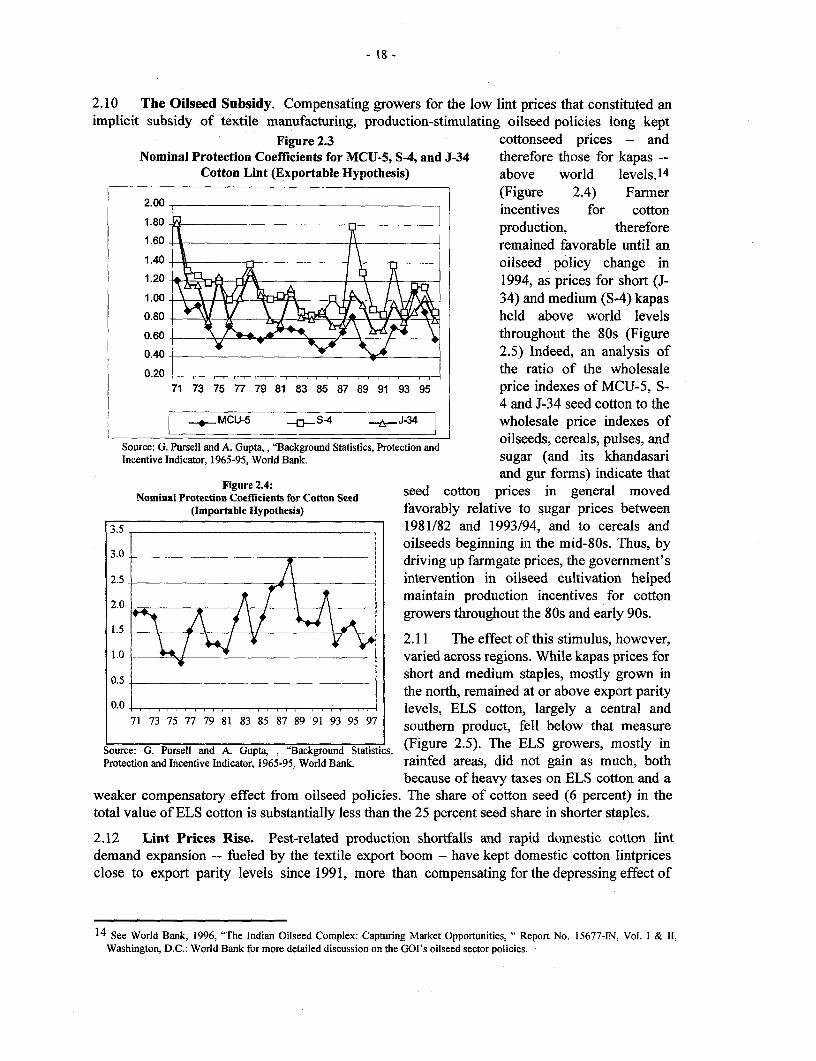
- 18 -
2.10 The Oilseed Subsidy. Compensating growers for the low lint prices that constituted animplicit subsidy of textile manufacturing, production-stimulating oilseed policies long kept
Figure 2.3 cottonseed prices - andNominal Protection Coefficients for MCU-5, S-4, and J-34 therefore those for kapas --
Cotton Lint (Exportable Hypothesis) above world levels.14
2.00 (Figure 2.4) Farmer2.00 incentives for cotton
1.80 0 production, therefore1.60 remained favorable until an1.40 oilseed policy change in1.20 1994, as prices for short (J-1.00 A 4, 34) and medium (S-4) kapas0.80 Y held above world levels0.60 - throughout the 80s (Figure0.40o 2.5) Indeed, an analysis of0 _20 the ratio of the wholesale
71 73 75 77 79 81 83 85 87 89 91 93 95 price indexes of MCU-5, S-4 and J-34 seed cotton to the
. MCU-5 S-4 J34 wholesale price indexes of
Source: G. Pursell and A. Gupta,, "Background Statistics, Protection and oilseeds, cereals, pulses, andIncentive Indicator, 1965-95, World Bank. sugar (and its khandasari
and gur forms) indicate thatFigure 2.4: seed cotton prices in general moved
Nominal Protection Coefricients for Cotton Seed sedcto presi gnra mvd(Importable Hypothesis) favorably relative to sugar prices between
3.5 1981/82 and 1993/94, and to cereals and
3.0 l oilseeds beginning in the mid-80s. Thus, byi driving up farmgate prices, the government's
2.5 intervention in oilseed cultivation helped
2.0 1 maintain production incentives for cottongrowers throughout the 80s and early 90s.
\.5 / 2.11 The effect of this stimulus, however,1.0 I varied across regions. While kapas prices for
0.s , short and medium staples, mostly grown inthe north, remained at or above export parity
0.0 .l. levels, ELS cotton, largely a central and71 73 75 77 79 81 83 85 87 89 91 93 95 97 southern product, fell below that measure
Source: G. Pursell and A. Gupta, , "Background Statistics, (Figure 2.5). The ELS growers, mostly inProtection and Incentive Indicator, 1965-95, World Bank. rainfed areas, did not gain as much, both
because of heavy taxes on ELS cotton and aweaker compensatory effect from oilseed policies. The share of cotton seed (6 percent) in thetotal value of ELS cotton is substantially less than the 25 percent seed share in shorter staples.
2.12 Lint Prices Rise. Pest-related production shortfalls and rapid domestic cotton lintdemand expansion -- fueled by the textile export boom - have kept domestic cotton lintpricesclose to export parity levels since 1991, more than compensating for the depressing effect of
14 See World Bank, 1996, "The Indian Oilseed Complex: Capturing Market Opportunities, " Report No. 15677-IN, Vol. I & 11,Washington, D.C.: World Bank for more detailed discussion on the GOI's oilseed sector policies.

- 19 -
Figure 2.5 oilseed policy reforms and bringingNominal Protection Coefficients for Seed Cotton farmers a windfall but, over the
(Exportable Hypothesis) longer term, jeopardizing the
competitive advantage textilemanufacturers gained from cheap
2.5 - raw materials. Even after the GOIlifted restrictions on edible oil
2 - imports in 1994/95 and reduced
\.5 I l import tariffs to 20 percent in 1996,1.5 -_ the export-fueled boom in textile
demand and the incursions of croppests kept seed cotton prices close to
0.5 world market levels --except forELS cotton-- diminishing the effect
0 ,,, ,,, , of the cotton export quotas and71 73 75 77 79 81 83 85 87 89 91 93 95 97
oilseed policy changes. Farmers are_______MCU_5 __S_4 1_ _ _ J34_ responding to these incentives by
continuing to increase output.
Source: G. Pursell and A. Gupta, "Background Statistics, Protection 2.13 Cotton export quotas are notand Incentive Indicator, 1965-95, World Bank. consistent with WTO rules, in part
because they imply an implicit subsidization of the domestic textile industry. Export quotas havea depressing effect on domestic lint prices, especially of ELS cottons, notably discriminatingagainst production in rainfed areas where ELS cotton is grown. In addition, export quotasprevent cotton farmers and traders from capturing arbitrage gains by exporting varieties whichhave an international price advantage and importing those in short supply. The quota, now likelyto become counter-productive and challenged under WTO rules, also contributes to greater lintprice instability by eliminating the safety net against sharp price declines that bumper harvestsbring. Eliminating quotas would help growers, but raise input prices for the textile industry,obliged in any case to gain in efficiency if it is to maintain competitiveness. The major challengefor the cotton sector, discussed below, is not only to remain competitive with imports both interms of price and of product quality and consistency. Quality management in the cotton sector isweak.
C. TECHNICAL CONSTRAINTS
2.14 Pests and Disease. Of the four major, technical concerns (pests, seed variety, seedmanagement and irrigation) hindering higher yields of higher quality cotton, the increasingfrequency of pest outbreaks -- six major instances in the last ten years -- is arguably the mostserious (Table 2.2). Among significant infestations of the cotton bollworm, whitefly andjassidsand the cotton leaf curl virus (of which the whitefly is the primary vector), one resulted inAndhra Pradesh farmers losing 59 percent of potential output - worth about $160 million(including $34 million in cottonseed) - to bollworms in 1986-87.15 The most recent bollwormoutbreak in Punjab in 1993/94 and 1994/95 leveled yields and sent domestic prices shooting overworld price levels, prompting GOI to liberalize cotton imports at zero tariff.
15 Nalin M. Kishore, 1992, "Pesticide Externalities, Comparative Advantage, and Commodity Trade, Cotton in Andhra Pradesh,"World Bank Policy Research Working Paper 928, Washington, D.C.:World Bank.

- 20 -
2.15 AlthoughI cotton growers use 45 percent 'able 2.2: Outbreaks of Major Pests by Year and State
of all pesticide in India - making their crop by State Bollworrn Whitefly ' Jassid
far the largest consumer - they appear to use Andhra Pradesh 87/88 84/85, 85186 89/90
the cheap, heavily subsidized chemicals so Gujarat 86/87Haryana 78,80, 83
inexpertly that secondary pests, insects resistant Maharana 84/85, 85/86
to pesticide, and resurgent infestations are Kamataka 84/85,85/86
becoming common. Behind this development Tamil Nadu late 60s, 70s 84/85, 85/86
lie official failure to enforce pesticide Punjab 93/94, 94/95 94Source: S. Jayaraj, 1996, "Pesticides and Pest Management in
regulations and quality control16 and to insure Cotton Production in India: Some Policy Issues," Consultant's
that farmers have the knowledge to use report.
pesticides properly. Although both GOI and state governments perceived the importance ofpesticides as an input to cotton cultivation and promoted the use of pesticides directly throughsubsidies of production, distribution, and application equipment, as well as agricultural extensionprograms, they did not adequately provide the necessary advice to forestall or control major pestoutbreaks (Table 2.2). As a result, growers tend to react first by increasing dosage and frequencyof application or to use ad-hoc mixtures of two or more insecticides - responses which onlyworsen their problems. In some cases, moreover, poor quality control results in the sale ofsubstandard products that are ineffective when they are needed. The UP Pesticide TestingLaboratory at Kanpur, for example, tested about 19,090 pesticide samples during 1969-95 andfound that 9.4 percent of the samples were substandard. Poor crop husbandry practices, such ascontinuous cotton cultivation or rotation with preferred alternative host plants, high densityplanting, excessive irrigation and fertilizer application, and/or improper timing of application, aswell as use of susceptible varieties contribute to pest build-up.
2.16 Integrated Pest Management. Recognizing the complex problems arising from pesticideuse, not only' in termns of escalating pest outbreaks, but also widespread problems ofenvironmental pollution and public health hazards, the GOI in the Eighth Five Year Plan (1992-97) launched the Integrated Pest Management Program (IPM) focused on research, technologyand knowledge dissemination, and pest monitoring (Box 2.1). Withdrawing some directsubsidies to farmers, GOI now limits central subsidies to special categories like Scheduled Castesand Scheduled Tribes for insecticides and fungicides but still allows a 25-50 percent subsidy onherbicides. Some state governments also continue to subsidize pesticides. The Intensive CottonCultivation Program (ICDP), a centrally-sponsored scheme initiated in the 1970s to improvecotton productivityv through the adoption of new technology, has also been modified to givespecial attention to plant protection measures.
Box 2.1: GO1 Integrated Pest MJnagement ProgramIntegrated pest management encourages natural control of pest populations by anticipating pest problems and prcventing
pests from reaching economically damaging levels by enhancing natural enemies, planting pest resistant crops, adapting culturalmanagement, and using pesticides judiciously. Three other major components of the 001 IPM program are research, technology andknowledge dissemination, and pest monitoring. Research pertaining to IPM in cotton is being conducted by the Indian Council ofAgricultural Research Institutes, State Agricultural Universities (SAUs) and a few private rcsearch organizations. coordinated bv theAll India Cotton Coordinated Improvement Project (AICCIP) . Research areas include the development of resistant varieties,biological control agents, bio-pesticides, pest monitoring tools, improved crop husbandry and pesticide management practices(cconomic threshold levels of pesticide applications, fertilizer and water management.) Demonstrations for farmers. training, ofcxtension workers and other state agents, and dissemination of user ftiendly publications arc techniques used to transfer technologyand knowledge by 19 Central Pest Surveillance Stations. 13 Central Plant Protection Stations, and 11 Biological Stations in variousparts of the country. The Central Plant Protection Training Institute under the Central Directorate of Plant Protection providestraining in plant protection consistent with the IPM approach.SAUs in cotton growing areas also producc user friendly publicationscovering improved agronomic practices, for agricultural extension workers to discuss with farmers. Central Surveillance Stations andCentral Plant Protection Stations in collaboration with various State Departtments of Agriculture conduct pest monitoring and
6 Sorecastin1g.S. Jayaraj, 1996 , "Pesticides and Pest Management in Cotton Production in India: Some Policy issues". Consultant's report.Source: S. ndayaraj 1996, "Pesticides and Pest Management in Cotton Production in India: Some Policy issues". Cotton textilebackground report.

- 21 -
2.17 Improvement at the farm level, however, is coming slowly because of the developedpreference for pesticide use. Continuing poor enforcement of pesticide regulations and of qualitycontrol mean continued sale of substandard or banned pesticides, and weak support (extension)services limit both the spread of improved technologies and practices at the field level and theextent of useful feedback to the research system of knowledge about farmers' needs. Finally,government policies that depressed cotton lint prices also cut back on the potential rewards foradopting relatively more costly measures such as more labor-intensive IPM practices or improvedseeds that could improve quality and, with quality, earnings.
2.18 Seed Management India's cotton farmers are about equally divided between those whouse higher quality seeds -55 percent of the cultivated area (19 percent improved varieties and 36percent hybrids) - and the remainder, predominantly in rainfed areas, who plant low-qualityseeds of mixed varieties that they acquired at market or from their own crops. (Box 2.2) Thechoice of which kind of seed to plant is almost forced by the reality that, until recently, very fewimproved varieties were well-adapted for rainfed areas, where most cotton is grown. Oneconsequence of the disparity is the much larger observed gap between potential and observedcotton yields in the mostly rainfed Central and Southern regions relative to the fully irrigatedNorthb7 (See Annex 4). It also highlights the need for more adaptive cotton research tailored tolocal farming conditions so that farmers can maintain the genetic purity of the (improved) seedover succeeding generations. Such purity is essential to maintain yield performance anduniformity in cotton fiber quality, attributes which the high percentage of mixed seeds seriouslyjeopardizes.
2.19 Progress on thi : Cotont:i madkepsible and Dtherleadyf arvaiad lt Sehyri sds, o
es ndats b the aMursingistry i of d privaltue1 sedandpof impuoved seedo gnis, genray prdce andpl isarlst cerinedpubicly develpern replv~ ariemiesnt hyra ds that wouldto abe s tehncal sufcetficednsed sol m everain geublic spuries
Are i asolaed R.S. mirpitioU a c5Hybrotfon- in Ildin- Sccese Srchk Bange, Taional and, Bsae Sef hAsorpation.,
C tt1am,CI n tispet are go erxets Several" coto ank grwr'coeatv te aloprdceea itd sed ft
esticulteurates ofnsetdinis agreicusltudeindiaetd sd improved leedss, fo rw et seds and CIoCe s neestash y prci bn tte replducetii cationagencyhat wroiuldure labeedeadsom uf it tho sAintanrd 1 aenoti beey
theirK Bseeads dRectl. Parlnsodat of95 tHebi qualtto standiards eStablishe Stoy, thegSeed Certifiatind AgenPcy,fic Asesocario set
2.9grogltraRessac onsthitios frnt ieseac maudies possible bythIrayRvalbitIoCybidsed,o
18Task Force on cotton production, Department of Agriculture and Cooperation of Ministry of Agriculture, 1995.

- 22 -
(Table 2.3) The location- Table 2.3: Total Requirement and Supply of Quality Seedsspecific seed shortages that 1994/95, 100% Replacement Rateoccur can be traced to Production Area Seed Rt SecedRate Seed Supply % Supply/
infrastructure (weak transport, zone mllionha kia u n| t ; a-eImproved Varieties
lack of road networks) and Norfthern zone 1.7 20 3400 na
economic constraints (weak Central zone 3.6 10 3600 nademand limit incentives for utal 5.3 r7000 2128 30%
Hyrdssome dealers to carry stock). Cenral& South 2.2 2.5 550 642 117%On the whole, because the Note: na - not availableseed industry grew rapidly Source: Ministry of Agriculture, GOI.
during the last decade and a half with the private sector competing more and more with public(parastatal) firms, access to good quality seeds is not a problem. The trouble lies elsewhere.
2.20 It can be traced to poor price and marketing incentives for farmers and ginners. Likemost other cotton-growing developing economies, good seed management is made inherentlydifficult in India by the small-scale structure of cotton production that requires several farmers topool their produce before ginning and by the fact that farmers mostly sell unginned cotton. Thisresults in the mixing of cotton that may also consist of different varieties, contributing to themixing the cotton seeds as well. Achieving greater quality improvement and consistency undersuch conditions will require collective action by farmers and ginners.
2.21 With cotton lint prices historically artificially depressed, grading standards unused, andquality premiums only notional, farmers get little or no reward for raising the quality of theiroutput and tending to the purity of their seeds. The same poor financial incentives, in addition toadministratively set ginning fees, also discourage cotton ginners from sorting raw cotton andcottonseed so as to produce better quality output and improve the purity of seeds they sell.Although the strong and well-established seed industry has the apparent capacity to respond toincreases in seed demand, the incentives that could stimulate those increases are still too weak.Prices are part of the equation, but the performance of the marketing system in transmitting priceand quality signals between cotton growers and the textile industry carries equal weight. Thatperformance, discussed below, is seriously flawed.
D. MARKETING AND QUALITY
2.22 Although it has long been mostly in the hands of private traders, India's decentralizedmarketing system for cotton (and many other agricultural products) is a poor provider of bothphysical support services and the economic signals necessary to steer farmers toward higherquality output. The lack of facilities for weighing, handling, moving, and storingkapas and lint;the obsolescence of almost half the gins; grading standards honored almost only in the breach;and minimal premiums for high-grade raw material are among the major factors discouraginggrowers from pursuing the quality improvements that can bring them higher prices for their cropand provide the textile industry the caliber of cotton it needs to be competitive over time. As acrucial early and weak link in the commodity system, the marketing system needs urgentattention and comprehensive improvements.
2.23 Marketing Structure. India is one of the few countries in the world where marketing andprocessing of seed cotton and lint have been historically decentralized and primarily (77 percent)handled by private traders and cooperatives, usually owners of ginneries, local and wholesalemarket merchants or their agents, and textile mills. Of the other major players, the MaharashtraState Cotton Cooperative Growers' Marketing Federation (MSCCGMF) takes an 11 percentshare in executing the state government's Monopoly Procurement Scheme, and the Cotton

- 23 -
Corporation of India (CCI), a government parastatal which purchases cotton in competition withprivate traders and local cooperatives, accounts for 8 percent of the cotton market. CCI wasoriginally charged with supporting cotton prices. But since free market prices have remainedabove support prices, its role has shifted to procuring cotton for public and private mills andexporting extra-long staple cottons. Its market share appears to be declining over time, and itsfinancial performance only turned positive in the 1990s after years of losses. Other state levelcooperatives have a 4 percent share of the market.
2.24 While largely private, trader and processor operations were tightly limited by pervasiveGOI and state interventions till 1997 and by inadequate market infrastructure and weak supportservices that reduce market efficiency. Although the farmer's share of cotton lint and cotton seedprice in India (78-89 percent) appears high, there is scope for reducing transaction costs andraising incentives for quality management A starting point would be the more than 1,000regulated markets (mandis) established under the State Agricultural Product Markets Act thatmake up a dense, nationwide network of delivery points where farmers use commission agents tosell three-fourths of their seed cotton.
2.25 Many of the mandis provide at best inadequate facilities to weigh, handle, move, and storethe seed cotton that passes through them. Most have no means of grading cotton or disseminatinginformation about sales. Some simply have no such services and such shortage of space thatdifferent lots are mixed together, one way - along with poor handling practices andcontamination of the seed cotton - to reduce the quality and even quantity of the stock. Thisdistinctly inferior performance contrasts with the mandis' success in raising funds that aresupposed to be spent on improving market facilities and frequently are diverted instead tounrelated activities. As per the State Agricultural Product Markets Act, mandi committees arepermitted to charge an ad valorem market cess for the purpose of generating revenues for marketimprovement and development activities. Those proceeds can be substantial: aboutRs 900 millioncollected by Rajasthan in 1994 and about Rs I billion by Andhra Pradesh, money that is to a largeextent diverted by the state Agricultural Produce Marketing Boards to other uses. In AndhraPradesh, for example, only about 45 percent of the market tax was reinvested in the markets, wheregoverning committees lack the financial authority to raise capital on their own to operate theirfacilities or upgrade them.
2.26 Cotton Grading. Among the more damaging shortcomings of the marketing system isthe widespread failure to utilize the seed cotton grading standards established by the GOIDirectorate of Marketing and Inspection. Except in a few states like Karnataka and Maharashtraand by the CCI, the marketing system largely ignores procedures that could provide accurategrading and classing information to spinners so that they can purchase the right quality of cottonfor the yarn their customers demand. Spinners, however, are not the only ones disadvantaged.Farmers, traders and ginners suffer as well when the market fails to signal the price premiumsthat higher grades will earn. In the absence of those signals, producers and processors see littleself-interest in adopting the methods of picking, storage, packing, transportation, and ginning thatwould deliver and preserve the quality characteristics that the market seeks.
2.27 Despite the existence of grading procedures, including cotton lint standards maintainedby the East Indian Cotton Association (EICA) for each of the commercially grown varieties (withdifferent staple lengths) as per the schedule in each season, most cotton lint traded is gradedvisually primarily on the basis of staple length. Other important attributes -- fiber strength,uniformity, maturity -- are not uniformly included in the value of the cotton fiber(Box 2.3). Therapidly increasing export-orientation of the textile industry is, however, encouraging the adoption ofimproved grading practices. According to industry sources, about 20-25 percent of total marketed

- 24 -
cotton lint is now subjected to more systematic and precise grading practices, and marketpremiums for quality cotton are developing. The use of more scientific grading methods, such asHigh Volume Instruments, however, is stilllimited to a few mills and traders. Box 2.3: Seed Cotton Fiber
2.28 Ginning. After seed cotton passes PrortitsandTextiletProduictO put
through the mandis, it is ginned to separate The quality of raw cotton is affected by a number of physicalthe lint from the seed which, on average, properies - color, luster, finss, trash content, level of
accounts for one-third of the weight of seed stained and immature fiber, feel and moistumr content - thatinflunce the typ and quality of fth fina product. The color ofcotton. After ginning, the cotton lint is the fiber afects blcaching, dye absorption capacity, andpressed into bales of standard sizes (170 kg) tinishing of yarns and ftbrics. Stains in cotton affect dyeing
unifooity. Fineness and maturity affect the strength and lengthin pressing factories. About 90 percent Of of the fiber and thus spinning efficiency and fibrous wastethese factories are privately owned; the rest levels. Luster measures ability to mflect light Trash increasesbelong to cooperatives. Almost half are over processing losses and lowers quality of output. Moistur affects
the cotton fiber strength.75 years old; some date back about acentury. Most importantly, the majority lack pre-cleaning facilities, thehandling power to makeup for poor transport infrastructure, storage facilities, cleaning and handling equipment, and well-trained, well-supervised workers. Not only do these defects lead to high contamination levels,mostgins - because of their antiquity -- suffer from low productivity, high costs and high percentagesof trash in the pressed bales.
2.29 Several factors discourage efficiency improvements and attention to quality duringginning and pressing. First, although price premiums exist across different qualities of cotton lint,they are too small to act as sufficient incentives (or penalties) to ginners to invest in improvingquality. Second, various regulations, such as state government fixing of the ginning and pressingfees under the Cotton Ginning and Pressing Act (lifted in 1996); licensing, storage, andmovement controls (lifted in 1997); and the Selective Credit Controls (lifted in 1996) all increaseoperating costs to the point that lowered profitability limits the capacity to invest in raisingefficiency.
2.30 This lack of attention to quality is reflected back to kapas trading as another signal thatmandis need not make grading a main focus of their work. Since "cotton consumers" (the gins) areindifferent and since farmers so often mix their crop with others to produce a bulk lot, even themandis understandably opt to give quality control a low priority. Farmers get the same negativemessage about changing their practices - the use of mixed seeds, the cultivation of old and newvarieties almost side by side to get high-volume (but not high-quality) output, the improper timingof applications of fertilizer and water, the excessive use of pesticides and inattention to integratedpest management. Even extension services are denied incentives to strengthen their performance,just as markets are deterred from improving (or creating) mechanisms to gather and disseminateinformation. To earn higher prices and produce the cotton that an increasingly export-orientedtextile industry will require, farmers will have to pay much greater attention to quality control.Markets will have to stimulate that transition. At present, they generally discourage it.
2.31 Liberalization of Marketing. One area of recent progress is the elimination orsuspension over the past three years of many government-imposed restrictions that increaseduncertainty and transaction costs. Raw or ginned, cotton is classified as an essential commodityunder the EC Act, a designation that empowered the Textile Commissioner of the Ministry ofTextiles to require licenses for entry into trading and ginning; to fix kapas, lint, and cottonseedprices; to set limits on stock levels; and to control movement of cotton under the Cotton (Control)Order, 1955 (amended in 1986 and 1995). Additionally, RBI Selective credit policies restrictedwould-be borrowers, licensing rules kept ginning small-scale, and state governments fixed ginning
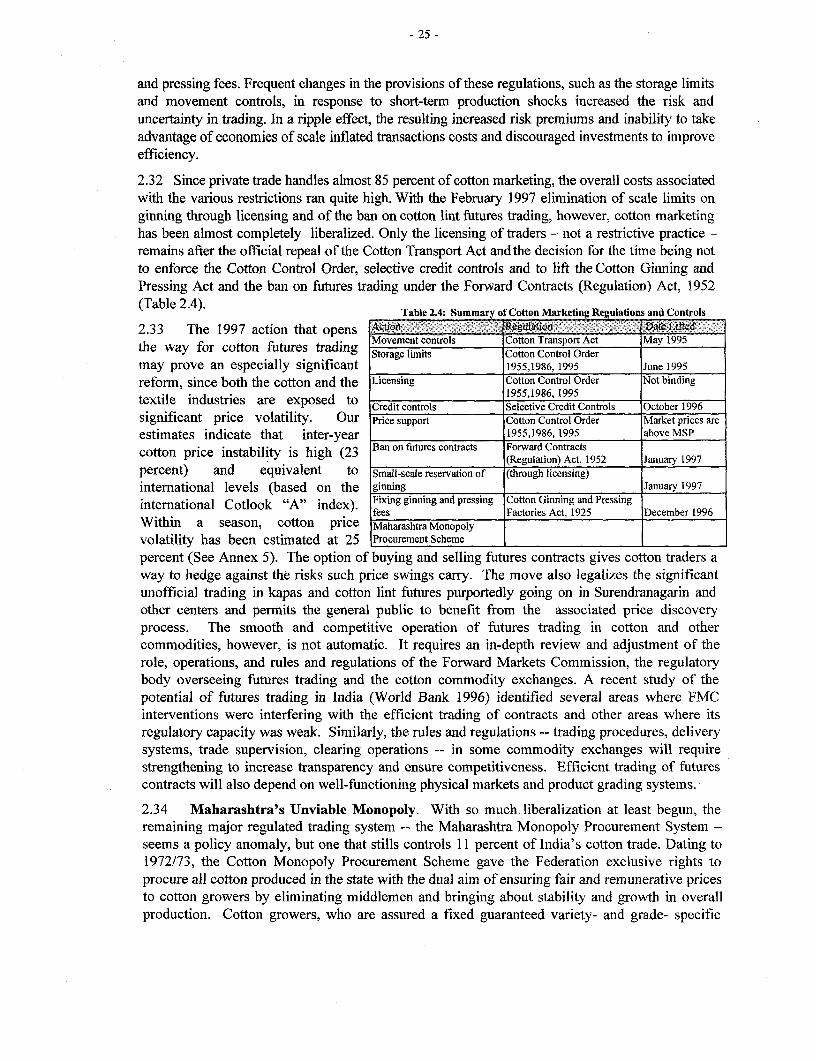
- 25 -
and pressing fees. Frequent changes in the provisions of these regulations, such as the storage limitsand movement controls, in response to short-term production shocks increased the risk anduncertainty in trading. In a ripple effect, the resulting increased risk premiums and inability to takeadvantage of economies of scale inflated transactions costs and discouraged investments to improveefficiency.
2.32 Since private trade handles almost 85 percent of cotton marketing, the overall costs associatedwith the various restrictions ran quite high. With the February 1997 elimination of scale limits onginning through licensing and of the ban on cotton lint futures trading, however, cotton marketinghas been almost completely liberalized. Only the licensing of traders - not a restrictive practice -remains after the official repeal of the Cotton Transport Act and the decision for the time being notto enforce the Cotton Control Order, selective credit controls and to lift the Cotton Ginning andPressing Act and the ban on futures trading under the Forward Contracts (Regulation) Act, 1952
(Table 2.4). Table 2.4: Summary Cotton Marketing Regulations and Controis
2.33 The 1997 action that opensthe way for cotton futures trading Movement controls Cotton Transport Act May 1995
Stotage limits Cotton Control Ordermay prove an especially significant 1955,1986, 1995 June 1995reform, since both the cotton and the Licensing Cotton Control Order Not binding
textile industries are exposed to 1955,1986, 1995Credit controls Selective Credit Controls October 1996
significant price volatility. Our Price support Cotton Control Order Market prices are
estimates indicate that inter-year 1955,1986, 1995 above MSP
cotton price instability is high (23 Ban on futures contracts Forward Contracts(Regulation) Act, 1952 January 1997
percent) and equivalent to Small-scale reservation of (through licensing)
international levels (based on the ginning January 1997
international Cotlook "A" index). Fixing ginning and pressing Cotton Ginning and Pressingfees Factories Act, 1925 December 1996
Within a season, cotton price Maharashtra Monopoly
volatility has been estimated at 25 Procurement Schemepercent (See Annex 5). The option of buying and selling futures contracts gives cotton traders away to hedge against the risks such price swings carry. The move also legalizes the significantunofficial trading in kapas and cotton lint futures purportedly going on in Surendranagarin andother centers and permits the general public to benefit from the associated price discoveryprocess. The smooth and competitive operation of futures trading in cotton and othercommodities, however, is not automatic. It requires an in-depth review and adjustment of therole, operations, and rules and regulations of the Forward Markets Commission, the regulatorybody overseeing futures trading and the cotton commodity exchanges. A recent study of thepotential of futures trading in India (World Bank 1996) identified several areas where FMCinterventions were interfering with the efficient trading of contracts and other areas where itsregulatory capacity was weak. Similarly, the rules and regulations -- trading procedures, deliverysystems, trade supervision, clearing operations -- in some commodity exchanges will requirestrengthening to increase transparency and ensure competitiveness. Efficient trading of futurescontracts will also depend on well-functioning physical markets and product grading systems.
2.34 Maharashtra's Unviable Monopoly. With so much liberalization at least begun, theremaining major regulated trading system -- the Maharashtra Monopoly Procurement System -seems a policy anomaly, but one that stills controls 11 percent of India's cotton trade. Dating to1972/73, the Cotton Monopoly Procurement Scheme gave the Federation exclusive rights toprocure all cotton produced in the state with the dual aim of ensuring fair and remunerative pricesto cotton growers by eliminating middlemen and bringing about stability and growth in overallproduction. Cotton growers, who are assured a fixed guaranteed variety- and grade- specific

- 26 -
price for seed cotton for the whole season, have earned average prices during the 1989-90 to1994-95 seasons 20-70 percent above the GOI's MSP. In contrast, free market prices exceededthe Minimum Support Price (MSP) by 30-50 percent
2.35 This price support, however, has proved costly. During the 1995-96 season, MaharashtraState Cotton Cooperative Growers' Marketing Federation (MSCCGMF) was reported to haveincurred additional losses --largely subsidized by the Maharashtra state government -- amountingto Rs. 5 billion ($142 million), a sum that raised its accumulated losses toRs 7.6 billion ($217million).19 The replenishment rule of the Price Fluctuation Fund (PFF) is clearly inadequate forbuilding reserves to deal with losses; only 25 percent of annual profits are credited to the PFF;farmers get the balance as bonus payments. Based on available information, the stategovernment covered losses of Rs 514 million (US$ 43 million) in 1984/85, Rs 2.8 billion (US$229 million) in 1985/86, and Rs 2.8 billion (US$ 89 million) in 1993/94.20
2.36 Several factors contribute to the high risks and poor commercial viability of the scheme.First, the Maharashtra Federation exposes itself to considerable price risks when, at the start ofthe season, it makes the required commitment to a season-long purchase price. That exposure isamplified by the absence of such price-risk management mechanisms as hedging on futuresmarkets. Although in principle the guaranteed price is to be set at the GOI's MSP -- usuallysignificantly lower than free market prices and thus a potential shelter against price risks -- inpractice the announced guaranteed prices can be much higher.21 The absence until early 1997 ofa futures markets as a price-discovery mechanism made it harder to arrive at a commerciallydefensible guaranteed price and exposed the price-setting process to political influence. Porousborders and competition with neighboring states reduce effective enforcement of the monopolyand severely limit the ability to set a first payment low enough to reduce the Federation'sexposure to risk. Instead, high guaranteed prices attracted cotton from other states, raising theFederation's risk exposure and subsidy costs if final prices were set too high.
2.37 The improper grading of cotton also contributes to signiftcant losses and higher riskssince, unlike other traders, MSCCGMF cannot adjust its announced prices within a season. Thisserious problem persists as over 50 percent of cotton procured between 1989/90 and 1993/94 wasgraded as superior and about 95 percent as FAQ or above. Finally, the absence of competitionunder the Monopoly Scheme reduces the incentives for improving the efficiency of marketingoperations and unnecessarily raises operating costs. India's Central Government has beenpressing Maharashtra over the last few years to devise an alternative to the MonopolyProcurement Scheme, but failing to get one, has granted it extensions, of which the most recent -lasting two years -- expires on July 1, 1998.
2.38 Quality Management The flaws in the marketing system need correcting because they,along with other weaknesses, impede improvements in cotton quality, a critical determinant ofthe sector's ability to maintain competitiveness and capture a major share of future demandgrowth. Higher and more uniform quality raises spinning efficiency and lowers conversion andproduction costs that increase when, for instance, high levels of contaminants result in frequentyarn breakage and frequency of knots. Poor quality cotton, moreover, produces lower grade
9 Cotton Statistics and News, No. 35, November 26, 1996. and A.Gulati, S. Bhide, S. Bhagat, and S. Shroff, 1996, "EconomicReforms and Agricultural Parastatals: The Case of Cotton Corporation of India and Maharashtra Federation," IRIS-India WorkingPaper No. 19 Center for Institutional Reform and the Informal Sector, University of Maryland.
21 A. Gulati, S. Bhide, S. Bhagat, and S. Shroff, 1996,. op. cit.
21 For example, although the MSP for the 1996-97 range fromRs 1150 to 1480 per qt., it is reported that the State is committed topaying Rs 2,100/qt.Cotton News and Statistics, No. 35, November 26, 1996.

- 27 -
yams, fabrics, and final products, resulting in costly product discounts or loss of potentialmarkets. Indeed, a 1991 survey of 201 mills worldwide by the Intemational TextileManufacturers Federation found that India had one of the highest levels of cotton contaminationand stickiness. In part because of the lack of quality raw materials, Indian exports are largelycomposed of low-to-medium priced textile products that are significantly discounted in the worldtextile market where India will have to remain competitive.
2.39 Several factors explain the low priority given to quality management. A basic reason isIndia's low average per-capita income level. Historically, poverty has limited the demand forquality textile products on the domestic market toward which the heavily protected textileindustry has been predominantly oriented. The implicit cotton subsidy to the textile industryenabled firms to absorb the increased production costs associated with processing lower qualityraw materials while the rapid expansion of the export market for low-to-medium priced textileproducts also made raw material quality less of a concern. The weak premium for raw materialquality, in turn, has filtered back through the marketing system to growers. Government policiesgoveming ginning and weak market and farmer support services further reduced the incentives toimprove cotton quality.
E. CONCLUSION
2.40 To capture the major share of expected volume and quality increases in cotton demand,India will need to address technical, structural, and policy-induced constraints to cottonproduction and marketing. Although eliminating the export quota could generate a price-drivensupply response, complementary textile policy reforms are also needed to reduce the adversedownstream effects on the textile industry. Maintaining cotton-sector competitiveness willrequire greater attention to increasing productivity, particularly measures that promote theadoption of higher yielding varieties and improved crop and pest management. Improving cottonquality can generate significant value-added to farmers and manufacturers, but that improvementwill come slowly or not at all if, along the cotton marketing chain from growers to traders toginners, signals remain too weak to show the rising value associated with desired qualitycharacteristics.

3 Program for Action
3.1 To sustain their recent growth and respond successfully to the MFA phase-out, the cottonand textile industries will need to implement a decisive strategy to make themselves moreproductive, more quality-conscious and more export-oriented. Along with rising domesticdemand for apparel, they face both a likely challenge from apparel, yarn, fabric and cottonimports and a growing opportunity to expand sales of cotton and textiles in world markets.Government action in three separate but complementary areas would help the cotton and textileindustries to raise their productivity and enhance their competitiveness:
* providing the enabling policy and regulatory environment to improve the incentivesand capacity of the private textile industry to undertake the modernization andrestructuring investments needed to improve efficiency,
* addressing the policy and institutional constraints that slow farmers' adoption ofproductivity and quality enhancing technologies and practices; and
* improving the regulatory framework for marketing as well as facilitating investmentsto upgrade the performance of cotton markets in the areas of quality and riskmanagement.
3.2 Since the cotton and textile industries have complementary yet conflicting interests,officials will need to weigh and design reform measures in the context of an integrated sector.Farmers, for instance, will benefit significantly if cotton prices rise to world market levels.Textile manufacturers, however, will be weakened in international competition if their rawmaterials costs escalate without a corresponding increase in their efficiency. Similarly,eliminating yarn export quotas to enable spinning mills to better cope with rising cotton priceswould have important downstream implications on the competitiveness of the weaving, knittingand garmenting industries. The careful packaging and sequencing of actions will therefore beimportant to minimize negative spill-over impacts across sectors. This chapter discusses policyoptions for strengthening both industries and, whenever possible, the likely impact of change inone industry on performance of the other. The gains that reform can bring appear substantial. Toachieve those benefits, sustained collaboration across the sector and between producers andregulators will be essential.
A. FOR A MORE EFFICIENT, MORE COMPETITIVE TEXTILE INDUSTRY
3.3 The domestic reforms that are critical to promote modernization investments to achievehigher levels of textile industry efficiency are those that will give it added strength as an exportproducer and a competitor against imports, especially of yarn and fabrics. That strength, in turn,will flow from greater flexibility and opportunity to modernize to achieve the levels ofproductivity growth that will permit textile mills and garment makers to mitigate the adverseimpact of rising cotton prices caused by pressures from domestic demand and/or to adjust cottonexport policies to WTO rules.
3.4 Spinning. Three separate but related policy changes would encourage productivityimprovements in spinning mills and raise their capacity to absorb higher cotton prices.Eliminating the yarn export quota in the near term would allow the mills to take advantage ofhigher world prices for their output and thus compensate for the rising cost of their raw materials.
- 29 -
Given the existing profitability squeeze and the rising threat from yarn imports, mills need theresources that can give them more realistic opportunities to modernize, restructure, and competeagainst imports. A recent study (Annex 6) projected that cotton yarn and fabric imports couldincrease by 300 percent by 2005 to meet the input requirements of the projected growth inexports. Free access to exports by all firms - not just the larger, more modern export-orientedones -- would also help level the playing field. The recent cut in import duties on several kinds oftextile machinery to 10 percent is an important complementary measure facilitating this processof modernization, but to move it farther, government needs to address the future of public sectorcomposite mills as discussed below.
3.5 Freeing yarn exports would seem to require a parallel approach to the projected increasein yarn imports on which a 20 percent import tariff is now imposed. It is likely that lowering yarntariffs further could hasten the restructuring and modernization of the textile industry, providedthat import tariffs for fabrics are revised accordingly. Although more detailed analysis is neededto define the ramifications of different levels and pace of removal of import tariffs, it is clear thatthe continued reduction of yarn import tariffs as part of the commitments under US & EUagreements will be critical for the future growth of the industry.
3.6 Further reducing import tariffs and trade restrictions on manmade fibers and eliminatingthe discriminatory taxation of MMF would help boost domestic consumption and exports ofblended and synthetic products and help mills cope with rising cotton prices. A positive spilloverfor garment manufacturers would be the opportunity to use valuable spare capacity to producesynthetic and blended clothing to supplement production of cotton apparel for which demand ishighly seasonal. The 1997/98 Budget has announced several measures that would reduce thediscriminatory taxation against MIF, but much more needs to be done. A recent study foundthat the reduction in the import tariff on manmade fibers (non-cotton textiles) would play a keyrole in keep the clothing industry competitive despite rising cotton and yarn prices. (Annex 6.)
3.7 Assisting Handloom Weavers. A fourth change -- but a move that would hurthandloom weavers -- would be the abolition of the Hank Yarn Obligation. On the plus side, itwould free spinning mills of the need to maintain labor-intensive, technologically inefficienthand-reeling operations, permit them to capture greater gains from economies of scale, remove apolicy that distorts investment decisions, and eliminate the implicit tax on cone yarn exports. Itwould also, however, raise the prices that 6-7 million mostly village-dwelling, mostly poorweavers pay for their yarn and, according to a recent multi-market study, possibly cut their netincomes by about 3 percent. (Table 3.1) Their welfare is a major concern of the GOI which willwant to pair the elimination of the HYO with alternative programs to mitigate the costs ofadjustment on the handloom industry.
3.8 Three possibilities can be quickly described, each complementing the others. One optionis an explicit and targeted subsidy either to cap hank yarn prices on a per unit basis or rewardproduction of handloom fabric. More transparent and less costly to the economy than the currentHYO approach, an explicit subsidy would move away from a supply driven quantity-based to ademand-based regime and minimize the incentive problems of over-supply of hank yarn, leakage toother segments of the industry, misreporting, and the uncertainty about the actual number ofhandlooms and their demand for yarn. Implementation of such a scheme, however, would becomplex and require a significant administrative complement. Another option, convertinghandloom weavers into powerloom operators and providing them help in up-grading their qualitywould offer a viable and effective approach to increasing productivity. Third, it may be possible, aswell, to effect a different kind of conversion, encouraging handloom weavers to take theircompatible skills into other jobs, including the highly labor-intensive apparel industry where

- 30 -
Table 3.1: Short-term Changes in Net Income and Export Values
.___________ ._____________ .cenario L S~ernario 3 Scenario 4 Sce_imSo 5Policy Changes Export Policy
Cotton Free Free Free FreeYarn Quota Free Free Free
HYO 50% 50% Abolished Abolished10% subsidy tohandloom No No No Yes
Net Income* Cotton 13% 14% 14% 14%Changes Yam -39% 1% 10% 10%
Textile -1% -10% -11% -9%Mill/Powerloom -1% -8% -9% _9%
Handloom -2% -12% -15% -9%Total -1% 0% 0% 1%
Export Value Cotton 46% _ _ 13% 6% 6%Changes Yam -6% 10% 12% 12%
Textile 1% -2 -2% -2%Total 2% 2 1% 1%
Note: * Net income is measured by the gross margin, defined as total revenue minus raw materials cost. For cotton growers, itcorresponds to gross income. All percentage changes are computed from the base case, at the end of year 1.Source: Computed. See Annex?.
employment opportunities are growing rapidly. Training and job conversion programs couldfacilitate such a transfer.
3.9 Sick Public-Sector Mills. The Government of India cannot long afford to keep itsnumerous publicly owned mills in business. The drain - nearly $800 million in one five-yearperiod -- of direct and indirect financial support to these perennial money-losers is too high. Thealternative policies are liquidation or privatization, and the recent establishment of aDisinvestment Commission signals a significant step toward those outcomes. Still missing,however, are clear government policies governing bankruptcy and exit policies and speedy,simplified liquidation processes. Any action to liquidate or privatize these mills would requireretrenching workers at a high one-time fiscal cost. Assuming all estimated 95,000 NTC workerschoose voluntary retirement at a rate of Rs 140,000 per worker, the total outlay would amount toabout US$ 380 million, roughly 87 percent of the 1992-94 losses these mills accumulated.Because of broad growth and employment opportunities in the textile sector, however, trainingprograms could ease the workers' move to other jobs, particularly in apparel-making.
3.10 Garment Exports. Eliminating the SSI reservation, adopting scale-neutral labor and taxpolicies (see next paragraph), upgrading port infrastructure and rationalizing customs procedureswould give the knitting and garment industries a significant boost toward internationalcompetitiveness. Having gained a niche for small, low-to-medium quality, orders in the worldmarket, these industries now need to diversify into the growing market for higher quality as wellas mass consumption products. Their atomistic structure stands in the way. The elimination of theSSI reservation, as proposed by the Abid Hussain Committee, and the reform of related labor andtax policies, would enable manufacturers to increase productivity, process large ordersefficiently, take advantage of economies of scale and possible efficiency gains associated withvertically integrated operations, and increase the viability of quality-improving investments. Theeconomic gains if India closes the productivity gap with China (raising Indian productivity by 67percent) in garment production and domestic yarn and fabric quality also improves could beenormous (Table 3.2). The apparel and knitting industries - and every export-oriented industryin India -- would also reap significant competitive gains from improving port infrastructure thatfacilitates shipment processing and from streamlined customs procedures that reduce 90-120 daylead times of export deliveries from India to international norms of 45-60 days. Meeting that

- 31 -
target would especially benefit Table 3.2: Incremental Impact of Domestic Reforms on India's
the garment industry, which Welfare in Year 2005 (1992 1$$ million) 'needs not only to export its POliY ReirniTota
product but also often to importhigh-quality fiber, fabric and MFA QUOTAS ABOLISHED in 2005: ___
accessories on short notice. The Removing cotton export quota -0.5garment sub-sector is at the Removing cotton and textile export quotas 119.5
Removing Hank Yarn Obligation 83.7high end of the textile Raising productivity on apparel 67% to China's level 1700.5
production chain, but its need All reforms combined * 1928.2
for speed, operational MFA QUOTAS NOT ELIMINATED in 2005:efficiency, and quality- Removing cotton export quota 3.3
improving investments is Removing cotton and textile export quota 163.7shared throughout the industry. Removing Hank Yarn Obligation 66.7Only comprehensive reforms Raising productivity on apparel 67% to China's level 577.4
All reforms combined * 809.2can effectively respond to that Note: *The sum of individual reforms do not exactly add up to the
need and set the stage for the combined effects due to rounding errors, and because of interactionsprojected, very large welfare between the reform options.
Source: Annex 6.gains to be won.
3.11 Scale-Neutral Labor Regulations and Taxation. The textile industry, especiallygarment making and weaving, is hardly alone in suffering the distorting effects of current laborregulations and tax policies. Considering the breadth of their impact, the reform of theseregulations deserves to be seriously considered and conducted in an economy-wide context. The1997/98 budget is proposing preliminary and constructive steps in this direction by simplifyingthe excise duty structure and concessions for the small-scale units, and by excluding cotton yarnand texturized manmade yarn from the purview of the SSI exemption scheme.
B. IMPROVING COTTON PRODUCTION AND MARKETING
3.12 To enable the cotton sector to respond effectively to the textile industry's growingdemand for raw material, demand and its changing quality requirements, three related policyissues need attention: (i) ways to improve price incentives; (ii) measures to lower technical andinstitutional constraints to productivity growth; (iii) actions to better market performance inexchanging cotton and in managing risks and quality. As a start the Cotton Technology Missionplanned by GOI proposes to support the cotton sector by strengthening cotton research (seeds,nutrient and pest management) and assisting the modernization of ginning and prressingtechnologies.
3.13 Price Incentives. Although domestic demand is strong, cotton growers would benefitfrom phasing out quotas that limit exports. Aside from opening new markets in ways that wouldelicit higher output, phasing out the quota would also enable farmers and traders to captureprofitable arbitrage opportunities. Changing market conditions, in any event, are bringingdomestic cotton prices at or very close to export parity levels and thus nullifying the rationale forthe export quota, which it is counter-productive to preserve. Quotas depress domestic lint prices,more so for ELS cottons, and discriminate against cotton production, notably in central andsouthern rainfed areas where ELS cotton are grown. The export limits contribute to greater lintprice instability by eliminating an obvious buffer against sharp price declines resulting frombumper cotton harvests. In addition, they bar access to the gains from exporting cotton varietieswhich have an international price advantage and importing those in short supply. A recent studyestimated that the elimination of export quotas alone could generate a supply response that raisescotton exports by an estimated 85 percent (Table 3.3)
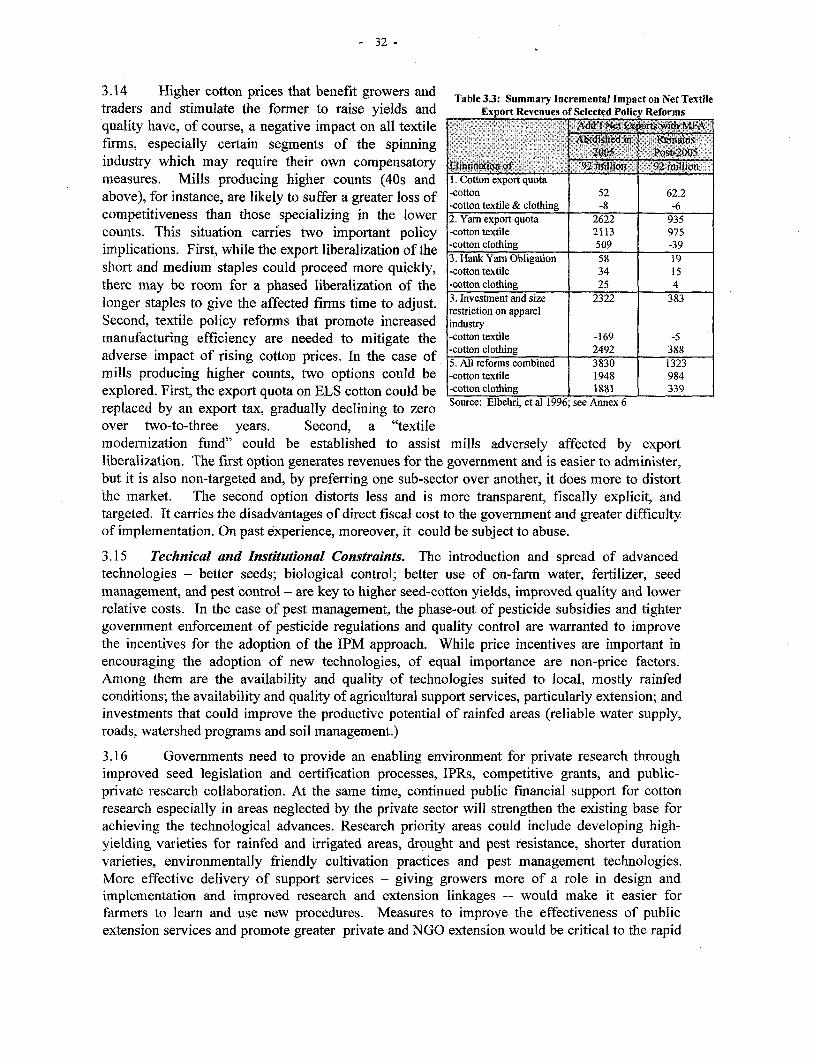
- 32 -
3.14 Higher cotton prices that benefit growers and Table 3.3: Summary Incremental Impact on Net Textiletraders and stimulate the former to raise yields and Export Revenues of Selected Policy Reforms
quality have, of course, a negative impact on all textile Add-l Ne tkorts with MFA
firms, especially certain segments of the spinning 20l5 Pdst2nains
industry which may require their own compensatory Eliminationof 92 illion 92imillion
measures. Mills producing higher counts (40s and 1. Cotton export quotaabove), for instance, are likely to suffer a greater loss of -cotton 52 62.2
-cotton textile & clothing -8 -6competitiveness than those specializing in the lower 2. Yarn export quota 2622 935counts. This situation carries two important policy -cotton textile 2113 975implications. First, while the export liberalization of the -cotton clothing 509 -39
3. Hank Yam Obligation 58 19short and medium staples could proceed more quickly, -cotton textile 34 15there may be room for a phased liberalization of the -cotton clothing 25 4longer staples to give the affected firms time to adjust. 3. Investr ent and size 2322 383
Second, textile policy reforms that promote increased industrymanufacturing efficiency are needed to mitigate the -cotton textile -169 -5
adverse impact of rising cotton prices. In the case of -cotton clothing 2492 3885. All reforms combined 3830 1323
mills producing higher counts, two options could be -cotton textile 1948 984explored. First, the export quota on ELS cotton could be -cotton clothing 1881 339replaced by an export tax, gradually declining to zero Source: Elbehri, etal 1996; see Annex 6over two-to-three years. Second, a "textilemodernization fund" could be established to assist mills adversely affected by exportliberalization. The first option generates revenues for the government and is easier to administer,but it is also non-targeted and, by preferring one sub-sector over another, it does more to distortthe market. The second option distorts less and is more transparent, fiscally explicit, andtargeted. It carries the disadvantages of direct fiscal cost to the government and greater difficultyof implementation. On past experience, moreover, it could be subject to abuse.
3.15 Technical and Institutional Constraints. The introduction and spread of advancedtechnologies - better seeds; biological control; better use of on-farm water, fertilizer, seedmanagement, and pest control - are key to higher seed-cotton yields, improved quality and lowerrelative costs. In the case of pest management, the phase-out of pesticide subsidies and tightergovernment enforcement of pesticide regulations and quality control are warranted to improvethe incentives for the adoption of the IPM approach. While price incentives are important inencouraging the adoption of new technologies, of equal importance are non-price factors.Among them are the availability and quality of technologies suited to local, mostly rainfedconditions; the availability and quality of agricultural support services, particularly extension; andinvestments that could improve the productive potential of rainfed areas (reliable water supply,roads, watershed programs and soil management.)
3.16 Governments need to provide an enabling environment for private research throughimproved seed legislation and certification processes, IPRs, competitive grants, and public-private research collaboration. At the same time, continued public financial support for cottonresearch especially in areas neglected by the private sector will strengthen the existing base forachieving the technological advances. Research priority areas could include developing high-yielding varieties for rainfed and irrigated areas, drought and pest resistance, shorter durationvarieties, environmentally friendly cultivation practices and pest management technologies.More effective delivery of support services - giving growers more of a role in design andimplementation and improved research and extension linkages -- would make it easier forfarmers to learn and use new procedures. Measures to improve the effectiveness of publicextension services and promote greater private and NGO extension would be critical to the rapid

- 33 -
diffusion of these technologies. In rainfed areas, improved public sector funding and design ofwatershed programs would play an important role in improving access to water and/or moistureretention methods that could have large expected impacts on yields.
3.17 Cotton Markets. There is tremendous scope for improving the performance of Indiancotton markets in three areas: the physical exchange of cotton across space and time, risk-management, and quality-management. In addition, there is a need to find cost-effectivealternatives that can meet the stated objectives of the Maharashtra Cotton MonopolyProcurement Scheme.
3.18 Improving the operations of the regulated markets and strengthening their supportservices will contribute to narrowing marketing margins so that producer prices can rise whileletting those paid by textile manufacturers decline, thus improving the competitiveness of Indiancotton and textile products. Although the recent de-regulation of domestic marketing and ginningrepresents significant progress towards improved market performance, government action is stillneeded to improve the operations of the regulated markets and to help strengthen market supportservices. The decentralization of financial and management controls in regulated marketsthrough greater delegation of authority to market committees - or, where possible, the fulldivestment of the markets to users -- would give market operators greater leeway to undertakeneeded investments to improve market infrastructure and services so that market yard wastagecan be reduced, quality deterioration minimized, grading services assured, and informationdisseminated.
3.19 GOI and state financial assistance in the use of mass communication technologies (e.g.radio transmission and electronic linkages between regulated markets) would serve a doublepurpose. It could be important in facilitating not only transmission of market information, but as amedium for delivering extension messages for cotton and other commodities. Textile industryassociations and cotton commodity exchanges could also play an important role in disseminatingprices and prevailing quality premiums and discounts, as regulated markets, cooperatives, and theextension system could in the case of kapas. Improved access to market information would assistginners/private traders and farmers in making better decisions and bolsters the use of gradingstandards and the transmission of quality premiums and discounts. Economies of scale incollecting and disseminating information permit large pay-off from such investments.
3.20 Developing Futures Markets. Once cotton export quotas have been lifted, futuresmarkets can play a helpful role in managing price risks. But beyond a stable and predictableexternal trade environment for cotton lint, GOI needs to ensure orderly trading by reviewing and insome cases strengthening the regulatory and institutional frameworks for the operations of theForward Markets Commission and various cotton commodity exchanges. For example, the FMCneeds to curb its discretionary interventions. It should give associations permanent recognition,automatically renew contracts, standardize regulatory measures, and withdraw price ceilings.Reverting to the original intent of the three-tier regulation model provided by the ForwardContracts (Regulation) Act, the FMC would still approve exchanges and set the general legal andregulatory framework. Thereafter, as a monitor, it would approve requests for the introduction ofnew futures contracts emanating from the commodity exchange associations and intervene whenthe situation warrants it. The GOI should also introduce a two-tier brokerage regulation for thespecific purpose of consumer protection and prudential rules for the use of risk managementinstruments by companies. Just as brokerage rules need to be strengthened so cotton commodityexchanges need to up-grade their rules and regulations (trading procedures, delivery system,supervision), clearing operations, and promotional and development activities.

- 34 -
3.21 The efficient trading of cotton lint futures contracts requires that traders and regulatorscarefully develop a delivery system that includes grading and contract enforcement at-the sametime that it balances the tradeoffs between liquidity and basis risks (i.e., the difference betweenmarket and futures price) among and within the large number of cotton varieties produced acrossIndia. Available evidence suggests that domestic deregulation of the domestic market is crucialto alleviating these tradeoffs. The development of a commodity warehousing system, in additionto improved performance of physical markets, would also facilitate development of futurestrading. At the national level, the introduction of one futures contract which allows the deliveryof the high grade medium and long staple cottons throughout the country could be considered. Inthe case of ELS, the forthcoming introduction of cotton future contracts in Turkey, if successful,may offer ready access to an already existing international contract.
3.22 Options in Maharashtra. Monopoly procurement in Maharashtra has proved a costlyway to assure remunerative prices to growers and stable growth of output. A more promising setof means to the same ends involves raising yields through improved local research and extensionand more effective expenditures in watershed programs, irrigation, and rural infrastructure. Mostof these programs already exist in Maharashtra, but are starved of funds - not least because of thelarge recurrent losses incurred under the Scheme. Increased funding and further improvement ofthe Employment Guarantee Scheme would also provide better income protection from drought-related crop failures. Although crop insurance is an alternative instrument, its inherentlimitations would not make it a fiscally viable and attractive alternative. Since adverse selectionand moral hazard problems generally necessitate government subsidies - with substantial fiscalimplications -- of insurance premiums for many farmers, such programs have typically limitedthe extent of their coverage in India, and probably wisely so.
3.23 Restructuring the MSCCGMF to permit greater participation by farmers-owners with lessgovernment involvement and allowing the federation to compete with other traders would helpeliminate the Federation's noted inefficiencies such as misgrading and elevated marketing costs.Maharashtra may learn useful lessons in this area from the experiences of the Gujarat StateCotton Marketing Federation. MSCCGMF use of forward and futures markets to hedgeprocurement operations by the Federation could help in managing price instability. Alternatively,the state government could provide price insurance mechanisms to growers without gettinginvolved in the physical handling of the crop, following the example of the Cotton Price SupportScheme provided by ASERCA, a parastatal, in Mexico (Box 3.1).
3.24 Cotton Quality. System-wide collective action, from textile manufacturers to farmers, isneeded to improve cotton quality and consistency, an advance that is critical both to minimizeprocessors' and manufacturers' costs by reducing wastage and under-spinning and to win throughimproved prices for higher quality output for farmers and traders. Rising cotton prices, freecotton imports, and the closer integration with a more discriminating world market set a starkchoice: either greater attention to quality considerations or a loss of competitiveness. GOI andstate governments have a critical role to play in facilitating the emergence and implementation ofcollective initiatives related to quality management in cotton marketing. Unless standard qualitynorms are set and are widely known and adopted in lint and seed-cotton contracts, improvedquality management will be largely wishful thinking. As a practical start, a nationally recognizedinter-sectoral committee composed of representatives from cotton producer associations,industry, exporters and trade, the textile industry, and government (e.g., Ministry of Textile,Ministry of Agriculture) could usefully review and evaluate existing cotton lint quality standardsand grading procedures and perhaps address the need to adopt greater consistency betweenIndian and international cotton lint standards. In the case of seed cotton, a similar body with

- 35 -
representative ginners, private traders, cooperatives, farmers, professional trade associations,exporters, the GOI, and state governments could develop quality norms where none now existand grading procedures in cotton markets.
Box 3.1Mexico's COtto Pie Support Scheme
Beca-r o the rcent liberalization of agricultural trade and internal markeing systems in Mexico, farm-level prices of severaagr Iltura products are now detemined mainly by intemational markets, and tarners havethad t , cope with price uncertaint between planting and harvest times to a degree unknown before. in rcsponse, theGov irnment of Mexico, through A E CA,a government organization providing support services for agriculturalcoi ninercialization. assists Mexicl n 0 in producers in managing their price risks during the harvest period as wellas guarantee a minimum price dt Xntg I heplanting season. Unlike other programs which simply transfer price risksfrom Pr p cdgt t h the floor price mechanism, ASERCA transfer pice risks fromgre arr to: intraiotal m C rke00ft;f00s.
During the planting sea in, ASERCA offers farmers the chance to Participate in a program guaranteeing amu mum cotton price for a fixe fee. The minimum price is fixed using the New York cotton futures exchange.For a f R f a ice (in US dollars) and hedges its own risk by using the fee to purchase aput n on the future delivery at hart time. (The put option gives ASERA the right to sellcottonona ifuturedate ataprescribedprice, kown as the strike price).: Should pr sequently fall,ASERCA pays farmers the difference between the New York price at harvest and te miimum price. Thediferece is exactly equal ito the payoffvalue of the putjopt if prices rise instead, ASERCA makes no paymentsto farmers. By paying a fee and participating in the program, a farmer in effect purchases insurance against a drop inprices below a cerain level -in fact,the program refers to the fee as a "premium". As with insurance, payouts donot always occur, so the program is not without costs to farmers. Private brokers could offer similar programs,althu the pvate sector has had little experience in providing such services directly to growers. SinceA Cs p a inexpnsive to inister and demand driven, ASERCA can readily reduce its presence
shuda markt for private bokrs develop.
Source: P. is0 Larson (October 1996): "Dealing with Commodity Price Uncertainty", Policy ResearchWorking Paper No. 01667, World Bank.;
3.25 Standardized grading - another feature absent in most markets - produces clear andtransparent incentives to farmers to raise the quality of their output and to ginners to do the samethrough investments in upgraded machinery and a move to quality management practices. Fortraders, standard quality norms provide an objective basis for meeting buyers' specifications andreducing the transaction cost of using many suppliers as sources. Markets that seek to providethis critical service -- the contractual basis for the orderly development of forward and futurescontracts -- can turn to such improved grading technologies as High Volume Instruments (HVI).A key complementary measure to setting up quality standards is the strengthening of existingmarket information systems so that markets can promptly and accurately transmit signalsregarding the textile industry's cotton quality preferences through the marketing chain to farmers.
3.26 Quality improvements, of course, begin - if they begin at all -- at the bottom of thatchain, on-farm, where government and growers need to mobilize multiple extension services --public, private, NGOs, cooperatives and farmer's associations -- to promote quality improvingpractices in response to awareness of the changing variety requirements of textile manufacturers.These extension providers could also play an important role in fostering farmer self-regulation tominimize mixing of the varieties planted. At the same time, to cut down opportunities for seedmixing, the GOI's Seed Commission could act more rapidly to notify users when varietiesbecome obsolete and to withdraw them promptly from the market. Improved coordinationbetween the irrigation department and farming community (possibly facilitated by the extensionsystem, water user groups, and NGOs) would help ensure more efficient water delivery and thusdecrease the harm done by improperly timed water delivery and over-application of water.

- 36 -
C. CONCLUSION
3.27 Already leading performers in the Indian economy, the cotton and textile industriescannot only hold but build on that position by making the improvements in efficiency that willmake them, as well, strongly competitive, international performers. If implemented, the reformsoutlined above can bring far-reaching benefits in bettering the use of domestic resources,positioning India's industry to stay competitive against imports and to capture markets being bornof on-going changes in world trading rules, and preserving cotton and textile competitiveness vis-a-vis major rivals with higher productivity. For example, available information indicates awidening labor productivity gap relative to China in the apparel industry. Similarly, India isbehind its competitors in tackling pest problems (e.g., China, Pakistan), quality management(e.g., Uzbekistan), or in managing price risks (e.g., China, Turkey). Most importantly, thesereforms would stimulate more equitable and more poverty-reducing growth, because theyencourage growth in industries that are inherently labor-intensive. The apparel industry, inparticular, offers easily accessible employment opportunities and could have significant impacton poverty and gender inequality -- due to lower skill requirements and accessibility to women.Reforms would also promote production of a predominantly rainfed crop in regions whereopportunities for growth typically tend to be more limited than in the irrigated areas.
3.28 A recent study that provides an indication of the potential gains from reform in thecontext of partial abolition of the MFA in 2005 projects that by then cotton and textile industryreform could generate additional net export revenues of $1.4 billion a year in 1992 dollars,additional cumulative growth of 3.5 percent in cotton output values, 9 percent in cotton-textilesand 11 percent in apparel and welfare gains amounting to as much as $800 million annually.(Table 3.2) The analysis suggests that a complete MFA abolition by 2005 would reap annualbenefits gains that are twice as high.
3.29 To realize those growth possibilities will require the close collaborative effort ofgovernment, private industry, and farmers to put a reformed field-to-factory structure in place.The central and state governments have an important role to play in maintaining a policy andregulatory framework that would enhance the incentives of both private industry and farmers toincrease productivity and improve their competitiveness. Private industry and farmers, in turn,face the challenging task of undertaking the productivity enhancing investments and adoptingefficiency improving management practices necessary to capture the gains from emerging marketopportunities. Having already made the sector such a strong performer at home and abroad, theyhave a solid base on which to build new wealth.

- 37 -
D. REFERENCES
A.F. Ferguson & Co., 1994, "Draft Report on Cotton Prospects Study," consultant's reportprepared for the World Bank, New Delhi, mimeo.
Agrawal, P.K., 1995, "Seed Industry Regulations in Relation to Seed Industry Development inIndia," in D. Gisselquist (ed.) "Easing Barriers to Movement of Plant Varieties for AgriculturalDevelopment., forthcoming
Ahluwalia, D., 1996, "Agricultural Growth in India: Trends, Sources and Challenges," DraftMimeo, World Bank New Delhi
Anubhai, P. and V.L. Mote, 1994,"India's Textile Industry: A Case Study of SubsectoralRestructuring," in S. Meyanathan (ed.), Managing Restructuring in the Textile and GarmentSubsector, Examples form Asia; Washington, D.C.: EDI.
Association of Synthetic Fibre Industry, 1995, 1994-95 Handbook of Statistics on Man-MadeSynthetic Fiber/Yarn Industry, Bombay: ASFI.
Bach, F.C. and K.R. Pearson. 1996. "Implementing Quotas in GTAP Using GEMPACK - or Howto Linearize an Inequality," GTAP Technical Paper No. 4.
Basu, A.K., 1996, "Current Status of Cotton Seed in India," Background working paper, WorldBank
Basu, A.K. and R.S. Paroda, 1995, Hybrid Cotton in India--A Success Story, Bangkok, Thailand:Asia Pacific Association of Agricultural Research Institutions
Basu, A.K. and S.S. Narayanan, 1992, "All India Coordinated Cotton Improvement Project:Achievements 1967-92", Central Institute for Cotton Research, Nagpur
Bell, T.A. and F.E.M. Gillham, 1989, The World of Cotton, Washington, D.C.: ContiCotton,EMR.
Bell, T. A. and E. Thigpen, 1996, "The Indian Cotton/Textile Industry, Policy Implications,"Background Working Paper, World Bank.
Bhattacharya, H, 1996, "Cotton and Textile Markets, Linkages, Performance and Prospects",Background working paper, World Bank mimeo
Business Standard, "Indian Raw Cotton Export," August 26, 1996
Chaudury, S., "Cotton Sector Study," Background working paper, World Bank, mimeo
Chaudhuri, S. 1994, "Cotton Yarn Spinning in India, The Competitive Advantage andProspects," ICRA Sector Focus Series #1, ICRA, New Delhi.
Da Costa, E.P.W. 1995, "Section 1: An Overview of the Trends in Handloom Market," QuarterlyEconomic Report of the Indian Institute of Public Opinion, Vol 38, No.2:9-26.
East India Cotton Association, India Cotton Annual, various issues
East India Cotton Association, 1995, Report of the Committee on Modernization of CooperativeGinning and Pressing Sector and East India Association, Bombay:EICA
East India Cotton Association, 1997/98, Cotton News & Statistics, No. 48
Economist Intelligence Unit, 1996, Textile Outlook International. Economist Intelligence Unit,London

38 -
Eisa, H.M., S. Barghouti, F. Gillham, and M.T. Al-Saffy, 1994, "Cotton Production Prospects forthe Decade to 2005," World Bank Technical Paper No. 23 1, Washington, D.C.: World Bank.
Elbehri, A., T. Hertel and W. Martin, 1997, "Estimating the Impact of Trade Reforms on theIndian Cotton and Textile Sectors: A General Equilibrium Approach," Background workingpaper, World Bank, mimeo.
European Commission, 1995, in M. Majmudar, 1996, "The MFA Phase-out and EU ClothingSourcing: Forecasts to 2005," Textile OutlookInternational, pp.31-61.
Food and Agriculture Organization, FAO Production Yearbook, various issues.
Gehlhar, M., 1994, "Economic Growth and Trade in the Pacific Rim: An Analysis of TradePatterns," Unpublished Ph.D. dissertation
Gillham, F.E. M., T.M. Bell, T. Arin, G.A. Matthews, C. le Rumuer, and A.B. Hearn, 1995,"Cotton Production Prospects for the Next Decade," World Bank Technical Paper No. 287,Washington, D.C.: World Bank
Gokhale, C.S. and V. Katti, 1995, Globalizing Indian Textiles, Threats and Opportunities,Bombay: Tecoya Disseminators.
Goswami, 0. 1996, "India's Public Sector Enterprises, The Case for Reform and Privatization,"HIID, Harvard University, mimeo
Government of India, Budget Documents, various issues.
Government of India, Public Enterprise Survey, various issues
Gulati, A., A. Sharma, & D.S. Kohli, 1996, "Self-sufficiency and Allocative Efficiency, Case ofOilseeds in India." NCAER, mimeo.
Gulati, A., S. Bhide, S. Bhagat, and S. Shroff, 1996, "Economic Reforms and AgriculturalParastatals: The Case of Cotton Corporation of India and Maharashtra Federation," IRIS-IndiaWorking Paper No. 19 Center for Institutional Reform and the Informal Sector, University ofMaryland.
Haddad, M. 1996, "Can the spinning sector compete if cotton export is liberalized?", BackgroundWorking Paper, World Bank, mimeo.
Harrison, G., T. Rutherford, and D. Tarr. 1995. "Quantifying the Uruguay Round," Paperpresented to the Conference on the Uruguay Round and the Developing Countries, Washington,DC: The World Bank
Hertel, T.W. ,1996, Global Trade Analysis: Modeling and Applications, New York: CambridgeUniversity Press.
Hertel, T.W. and M.E. Tsigas. 1996. "Structure of GTAP," Chapter 2 in T.W. Hertel (ed.),Global Trade Analysis: Modeling and Applications, New York: Cambridge University Press.
Hertel, T.W., W. Martin, K. Yanagishima, and B. Dimaranan. 1995. "Liberalizing ManufacturesTrade in a Changing World Economy," Chapter 4 in W. Martin and L.A. Winters (eds.), TheUruguay Round and the Developing Economies, World Bank Discussion Papers No. 307,Washington, DC (also forthcoming Cambridge University Press).
ICCI and R. Jaikumar, 1995, "Beyond the Multifiber Agreement, Strategies for the IndianApparel Industry," processed.

- 39 -
Indian Cotton Mills Federation, Handbook of Statistics of the Cotton Textile Industry, variousissues
Indian Cotton Mills Federation, 1996, The Indian Cotton Mills' Federation Report for the Year1995-96, Mumbai: ICMF.
Indian Institute of Public Opinion, 1995, "Textile Industry in India: Present Status and FutureProspects ", Quarterly Economic Report of the Indian Institute of Public Opinion, Vol. 38, No. 2,pp. 27-40.
International Textile Manufacturers Federation, 1995, 1995 International Production GostComparison, Spinning/Weaving/Knitting, Zurich: ITMF.
Indian Textile Monitor, 1996, "Survival and Growth, PSF Industry Asks for Succour, "(March),pp. 130-133.
Jayaraj, S., 1996, "Pesticides and Pest Management in Cotton Production in India: Some PolicyIssues," Background working paper, World Bank, mimeo
Khanna, S.R., 1993, The Challenge of Global Competition in the 1990s: an Agenda forEnhancing the Competitive Position of the Indian Textiles and Clothing Industry. ICRIERMimeo
Khanna, S.R., 1994, "Profile of India's Textile and Apparel Industries", Textile OutlookInternational (July), pp. 65-89.
Khanna, S.R and the IBC Research Team, 1996, "Profiles of Reliance, Arvind Mills, Raymond,Century and Morarjee," Textile Outlook International (May), pp.57-85.
Khanna, S.R and the IBC Research Team, 1996, "Foreign Investment in the Indian Textile andClothing Industry," Textile Outlook International (September), pp.38-77.
Kishore, N.K., 1992, "Pesticide Externalities, Comparative Advantage, and Commodity Trade,Cotton in Andhra Pradesh," World Bank Policy Research Working Paper 928, Washington, D.C.:World Ban
Kohli, D.N., P. Avasthi, and M.R. Sharma, "1994-95 Central Excise Tariff," Delhi: A Cen-cusPublication; GOI, Memorandum Explaining the Provisions in the Finance Bill, 1996
Kondo, M. ,1995,"Liberalization Policy for the Cotton Sector in India," South Asia II Agricultureand Water Division, World Bank
Krueger, A. 1977, "Growth, Distortions and Patterns of Trade Among Many Countries"Princeton Studies of International Finance, Princeton.
Krishna, K. R. Erzan, and L. Tan. 1994. "Rent-sharing in the Multi-Fibre Arrangement: Theoryand Evidence from US Apparel Imports from Hong Kong," Review of International Economics2(1):62-73
Kurt Salmon Associates, 1995, in . M. Majmudar, 1996, "The MFA Phase-out and EU ClothingSourcing: Forecasts to 2005," Textile Outlook International, pp.31 -61
Lal, M.B. and K.S. Parmar, 1995, Cotton Marketing, Bombay: TECOYA
Majmudar, M. 1996, "The MFA Phase-out and EU Clothing Sourcing: Forecasts to 2005,"Textile Outlook International, March 1996.

- 40 -
Market Research Wing, Textiles Committee, in ICMF, 1995, Handbook of Statistics on CottonTextile Industry, New Delhi: ICMF
Martin, W. 1996, "The Abolition of the Multi-fibre Arrangement and its Implications for FiberMarkets," International Trade Division, World Bank. Paper for presentation to Conference on theWTO and the Uruguay Round Agreement: Implications for South Asian Agriculture, Kathmandu,April 1996
Martin, W. and Warr P.G. 1993. "Explaining the Relative Decline of Agriculture: A Supply-SideAnalysis for Indonesia," World Bank Economic Review 7(3):381-401.
Mathur, A. 1993, "Industrial Restructuring and the National Renewal Fund", Asian DevelopmentBank, mimeo.
Mazumdar, D. 1981, "The Development of the Indian Textile Industry and Its Three Sectors,"Studies in Employment and Rural Development Series, No. 76, World Bank, Washington, D.C.
Meyanathan, S.D. (eds), 1994, Managing Restructuring in the Textile and Garment Subsector,Examples from Asia, EDI Seminar Series, Washington, D.C.: World Bank.
Ministry of Agriculture, Agricultural Statistics at a Glance, various issues
Ministry of Textiles, 1995, "Report of Working Group on Cotton Procurement, Marketing andGinning and Pressing Industry", Government of India, mimeo
Mirani, C.H. and K.S. Parmar, 1995, Baling the Gold, Bombay: Tecoya,
NSSO, National Sample Survey, 50th round
Office of the Textile Commissioner, Compendium of Textile Statistics, various issues
Pavaskar, M. and S.A. Shetty, 1995, "Cotton Marketing in India: An Appraisal," BackgroundWorking Paper, World Bank, mimeo.
Patel, B.B. and P.K. Das, 1997, "Retraining and Redeployment of Displaced Textile Workers inGujarat under the National Renewal Fund," Ahmedabad: Gandhi Labor Institute.
Parmar, K.S. and K. Ramchandran, 1992, Cotton Growing & Marketing in India, Bombay,India: Tecoya.
Pursell, G. and A. Gupta, 1995, "Background Statistics, Protection and Incentive Indicator, 1965-95, World Bank.
Pursell, G. and A. Sharma, 1995, "Indian Trade Policies Since the 1991/92 Reforms," mimeo,World Bank.
Ramakhrisna, R., 1995, "Textile Export Targets, The Role of Polyester," mimeo
Reserve Bank of India, Reserve Bank of India Bulletin, various issues.
Reserve Bank of India,, 'RBI Monetary Policy for the Second Half of 1996-97," October 19,1996
South India Textile Research Association, 1994, Productivity in Spinning, 2 5th Survey,Coimbatore: SITRA.
Srinivasulu, K. 1996, "1985 Textile Policy and Handloom Industry, Policy, Promises andPerformance", Economic and Political Weekly, pp. 3198-3206

41-
The Indian Textile Monitor, "The ICMF Urges Total Liberalization in Textile Sector," Vol. 15,December 1995.
The Indian Textile Monitor,, "Textile Industry, A Review 1994-95," Vol. 12, March 1996, pp.
Trela, I. and Whalley, J. 1990. "Global Effects of Developed Country Trade Restrictions onTextiles and Apparel." Economic Journal 100: 1190-1205.
USDA, Agricultural Research Service, 1993, "USDA Programs Related to Integrated PestManagement." USDA Program Aid 1506, Beltsville MD.
USDA/FAS, 1995, "Cotton Annual Report.", mimeo
Wiebers, U-C., 1993, "Integrated Pest Management and Pesticide Regulation in DevelopingAsia," World Bank Technical Paper No. 211, Washington, D.C.:World Bank
World Bank 1996, "Managing Price Risks in India's Liberalized Agriculture: Can FuturesMarkets Help?," Report No. 15453-lN, Washington, D.C.:World Bank
World Bank, 1996, "The Indian Oilseed Complex: Capturing Market Opportunities, "Report No.15677-IN, Vol. I & II, Washington, D.C.: World Bank
World Bank, 1997, India Sustaining Rapid Economic Growth, Washington, D.C.:World Bank.
Varangis, P. & D. Larson, 1996, "Dealing with Commodity Price Uncertainty", Policy ResearchWorking Paper No. 1667 (October) ,The World Bank
Yang, Y., W. Martin, and K. Yanagishima. 1996. "Evaluating the Benefits of Abolishing theMFA in the Uruguay Round Package," in T.W. Hertel, (ed.) Global Trade Analysis: Modelingand Applications, Cambridge University Press, Cambridge
Copyright © 2022 FDOKUMEN