India - Auto - IIFL Capital
104
India - Auto 4Q2019 Current headwinds more cyclical, less structural Gearing up for recovery
-
Upload
khangminh22 -
Category
Documents
-
view
2 -
download
0
Transcript of India - Auto - IIFL Capital

India - Auto
4Q2019
Current headwinds more cyclical, less structural
Gearing up for recovery

Joseph [email protected](91 22) 4646 4667
Suraj [email protected] (91 22) 4646 4656
Contents
SectorAuto’s “share of wallet” down sharply ...................................................... 5
Expect auto’s “wallet share” to rebound ................................................. 10
Adverse inventory cycle behind us ........................................................ 12
BS-VI transition: Expect a volatile 1HCY20 ............................................. 16
Scrappage policy: Exaggerated expectations .......................................... 18
PV segment: Least impacted by BS-VI ................................................... 20
2W segment: BS-VI may hurt in near-term ............................................ 24
MHCVs: Expect YoY growth from 2QFY21 .............................................. 28
Margins typically recover with volumes .................................................. 31
Valuations to remain elevated .............................................................. 34
CompaniesMaruti Suzuki (BUY) ............................................................................ 41
Ashok Leyland (BUY)........................................................................... 47
Tata Motors (BUY) .............................................................................. 53
Hero MotoCorp (BUY) .......................................................................... 61
Bajaj Auto (BUY) ................................................................................ 67
Eicher Motors (ADD) ........................................................................... 75
Mahindra & Mahindra (ADD) ................................................................. 83
TVS Motor (SELL) ............................................................................... 91
India - Auto

joseph.george@iif lcap.com
India - Auto
Gearing up for recovery We turn positive on the auto sector with a view that the industry will see a strong up-cycle over the next 2-3 years. In FY20, consumer spend on autos (PV+2W) undershot overall private consumption by 14%. Auto’s “share of wallet” is now almost 20% below its 15-year average. In our assessment, the underlying factors are more cyclical than structural. We expect auto’s "wallet share” to at least revert to mean (if not overshoot) over the next three years. This will result in a total revenue growth of >50% over FY20-23ii, with a magnified impact on earnings. The inventory correction cycle has played out already; when demand improves, we expect re-stocking. 1HCY20 is uncertain, given the weak economy and upcoming emission-norm changes. We believe weakness in stock prices, if any, would provide an opportunity to participate in the medium-term recovery in the sector.
Autos to regain “consumer wallet share”: Auto’s share of wallet is now almost 20% below its 15-year average. The ‘wallet share loss’ happened in FY19-FY20, and coincided with deceleration in the overall economy, NBFC issues (finance availability) and the impending BS-IV to BS-VI transition. As these cyclical factors recede, we expect auto’s "wallet share” to at least revert to mean. We expect this to drive a total revenue growth of >50% over FY20-23ii.
Adverse inventory cycle behind us; expect re-stocking in FY21: We are currently at the end of Stage 3 of the inventory cycle (See figure 16), marked by low wholesales and inventory correction. Inventory level across segments is currently lower compared to last year. We expect retail demand to improve YoY over the course of FY21, after 7-8 quarters of weakness. Reported wholesales may start seeing YoY growth in 2QFY20, as the above-referred Stage 3 enters the YoY comparison base.
Expect sharp earnings recovery in PV, MHCV: These segments have seen higher adverse impact on earnings in the down-cycle with rise in discounts and negative operating leverage on fixed costs. These factors would reverse in the up-cycle, driving sharp earnings recovery. Sector valuations, which have gone up in the past 3-4 years vs. preceding periods, may remain elevated in the recovery period. The auto sector boasts of higher RoCE, better FCFF generation and cash-rich balance-sheets vs. most other sectors.
Upgrade Ashok Leyland and Eicher: We upgrade Ashok Leyland to BUY with a view that the CV cycle would turn positive starting 2QFY21. We upgrade Eicher Motors to ADD as we believe that the company’s “volumes over margin” approach will improve affordability and volume-growth potential; the structural decline in margins has largely played out. We had recently upgraded Hero MotoCorp to BUY.
Auto OEMs – Valuation summary and key metrics
Company Rating Target
Price (Rs) CMP (Rs)
Mkt Cap (US$ bn)
EPS CAGR (FY20‐22ii)
P/E (x) EV/Ebitda (x) RoE (%)
FY20ii FY21ii FY22ii FY20ii FY21ii FY22ii FY20ii FY21ii FY22iiMaruti Suzuki BUY 9,000 7,242 30.8 23% 36.3 30.6 24.1 21.6 16.4 12.5 13% 14% 16%Ashok Leyland BUY 105 80 3.3 62% 39.6 34.1 15.1 16.7 13.9 7.7 8% 9% 19%Tata Motors BUY 220 175 8.7 138% 44.5 12.8 7.9 3.8 3.5 2.9 2% 8% 12%Hero MotoCorp BUY 3,100 2,312 6.5 12% 14.9 13.9 11.9 9.7 8.8 6.8 23% 23% 24%Bajaj Auto BUY 3,750 3,214 13.1 11% 19.4 17.9 15.9 14.4 12.7 10.7 21% 20% 20%Eicher Motors ADD 24,000 21,736 8.4 13% 27.7 26.4 21.6 18.6 16.5 13.4 22% 19% 20%M&M ADD 590 523 9.1 6% 13.6 13.5 12.2 8.6 8.3 7.3 11% 10% 11%TVS Motor SELL 380 446 3.0 19% 32.5 27.8 22.8 15.2 13.4 11.4 18% 18% 20%
Source: IIFL Research; Priced as on 18 December 2019
1

joseph.george@iif lcap.com
India - Auto
Key charts and tables
Auto’s “share of wallet” in FY20 is almost 20% below the 15‐year average
Source: IIFL Research
Rebound in auto’s “wallet share” to drive recovery; expect volume growth of 22%/16% for PVs/2Ws over FY21ii+FY22ii
PVs 2Ws
FY20ii FY21ii + FY22ii FY20ii FY21ii + FY22ii
Private Final consumption – Nominal Growth (A) 7% 17% 7% 17%
Gain / (Loss) of "share of wallet" (B) ‐13% 16% ‐15% 13%
Total consumer spend on Auto – Growth (C=A+B) ‐6% 33% ‐8% 30%
ASP increase + mix (D) 6% 10% 4% 14%
Volume growth (C‐D) ‐12% 22% ‐12% 16%
Source: IIFL Research
Different stages of the inventory cycle; we are currently at the end of Stage‐3
Source: IIFL Research; *Note: Inv.= Inventory, W= Wholesales, R(x)= Retails (trend)
3.00%
3.25%
3.50%
3.75%
4.00%
4.25%
4.50%
4.75%
5.00%
FY05
FY06
FY07
FY08
FY09
FY10
FY11
FY12
FY13
FY14
FY15
FY16
FY17
FY18
FY19
FY20ii
FY21ii
FY22ii
FY23ii
Spend on autos (PVs+2Ws) as % of pvt. consumption GDP
15‐yr average
0
20
40
60
80
100
120
140
160
180
Apr‐18
May‐18
Jun‐18
Jul‐18
Aug‐18
Sep‐18
Oct‐18
Nov‐18
Dec‐18
Jan‐19
Feb‐19
Mar‐19
Apr‐19
May‐19
Jun‐19
Jul‐19
Aug‐19
Sep‐19
Oct‐19
Nov‐19
Dec‐19
Jan‐20
Feb‐20
Mar‐20
Apr‐20
May‐20
Jun‐20
Jul‐20
Aug‐20
Sep‐20
Oct‐20
Nov‐20
Dec‐20
Retails Wholesales Inventory(Volumes)
Stage‐1 Stage‐2 Stage‐3 Stage‐4 Stage‐5
W > R (weak)Inv. rising
W = R (weak)Inv. stays high
W < R (weak)Inv. correction
W = R (flattish)Inv. stays low
W > R (recovers)Inv. rises to normal
2
joseph.george@iif lcap.com
India - Auto
We expect strong growth in wholesale volumes (across segments), starting 2QFY21
Source: SIAM, IIFL Research
Auto sector volume growth across cycles
Segments FY04 FY05 FY06 FY07 FY08 FY09 FY10 FY11 FY12 FY13 FY14 FY15 FY16 FY17 FY18 FY19 FY20ii FY21ii FY22ii
PVs 28 18 8 21 12 0 26 29 4 3 ‐7 4 7 9 8 3 ‐12 10 12
2Ws 12 16 14 12 ‐8 3 26 26 14 3 7 8 3 7 15 5 ‐12 5 11
3Ws 21 10 17 12 ‐10 ‐4 26 19 ‐2 5 ‐11 11 1 ‐5 24 10 ‐2 0 0
MHCVs 39 23 5 33 0 ‐33 33 32 8 ‐23 ‐25 16 30 0 13 15 ‐35 5 20
LCVs 31 22 20 34 12 ‐7 43 23 30 14 ‐18 ‐12 0 8 25 19 ‐12 3 12
Tractors 12 32 14 19 ‐4 1 32 20 11 ‐2 20 ‐13 ‐10 18 22 10 ‐8 5 5
*Avg. 24 20 13 22 0 ‐7 31 25 11 0 ‐6 2 5 6 18 10 ‐14 5 10
Source: SIAM, Crisil, IIFL Research; *Note: Avg. is a simple average of all segments; all numbers are YoY growth %
Valuations to remain high; Auto sector has much better return ratios, safer balance‐sheets and strong FCF generation vs. Nifty
Parameters FY15 FY16 FY17 FY18 FY19
RoCE (ex‐cash & investments) %
Auto OEMs (average) 81.7 76.6 117.8 139.5 107.8
Nifty (ex‐financials) 14.9 14.9 16.3 15.6 15.5
RoE (%)
Auto OEMs (average) 17.1 24.6 21.5 22.0 21.4
Nifty 14.7 15.7 14.7 13.2 13.9
FCF (as a % of PAT)
Auto OEMs (average) 112 102 82 109 24
Nifty (ex‐financials) 24 39 21 30 (32)
Net debt‐to‐equity (x)
Auto OEMs (average) 0.0 (0.2) (0.2) (0.3) (0.2)
Nifty (ex‐financials) 0.4 0.4 0.4 0.5 0.5
Source: Company, IIFL Research
‐60%
‐40%
‐20%
0%
20%
40%
60%
1QFY19
2QFY19
3QFY19
4QFY19
1QFY20
2QFY20
3QFY20E
4QFY20E
1QFY21E
2QFY21E
3QFY21E
4QFY21E
PVs 2Ws MHCVs(YoY growth %)
3

joseph.george@iif lcap.com
India - Auto
This page is kept blank intentionally
4

joseph.george@iif lcap.com
India - Auto
Auto’s “share of wallet” down sharply In FY20, consumer spend on autos (new vehicle purchases of PV+2W) undershot private final consumption by around 14%. Compared with the auto sector’s 15-year average “share of wallet”, FY20 was almost 20% below mean. In our assessment, the underlying factors are more cyclical than structural. As GDP growth picks up and cyclical impediments recede, we expect auto’s "share of wallet” to at least revert to mean (if not overshoot). Figure 1: Auto’s FY20 “share of wallet” is almost 20% below the 15‐year average
Source: IIFL Research
A slowdown in the economy and resultant weakness in overall consumption was bound to impact auto sales. However, the impact on the sector was much more magnified than the slowdown in GDP. We attribute this to multiple factors: 1: Weak economic growth India has seen a sharp deceleration in GDP growth, which has been evidently accompanied by a slowdown in private consumption. Our base case of revival in the auto sector is based on pick-up in GDP growth and private consumption in coming years. If overall economic growth continues at the same rate as now, a pick-up in the auto sector would be delayed. Figure 2: GDP growth slowed down substantially in FY20
Source: CEIC, IIFL Research
3.00%
3.25%
3.50%
3.75%
4.00%
4.25%
4.50%
4.75%
5.00%
FY05
FY06
FY07
FY08
FY09
FY10
FY11
FY12
FY13
FY14
FY15
FY16
FY17
FY18
FY19
FY20ii
FY21ii
FY22ii
FY23ii
Spend on autos (PVs+2Ws) as % of pvt. consumption GDP
15‐yr average
0%2%4%6%8%
10%12%14%16%18%20%
FY05
FY06
FY07
FY08
FY09
FY10
FY11
FY12
FY13
FY14
FY15
FY16
FY17
FY18
FY19
FY20ii
FY21ii
FY22ii
GDP growth ‐ Real Private consumption growth ‐ Nominal
5

joseph.george@iif lcap.com
India - Auto
2: Discretionary nature magnified the impact Needless to say, Autos as a category is discretionary in nature. During times of slowdown, spend on new vehicle purchases can be easily curtailed/postponed. This can be attributed to “prudence in consumer spending” and/or “sentiment”. This is what makes autos cyclical. Auto’s “share of wallet” is impacted by overall economic growth (Figure 3). During times of slowdown, it loses ‘wallet share’ but gains share as the economy picks up. Auto sector revenue is impacted by acceleration/deceleration in overall consumption as well as gain/loss of ‘wallet share’. Figure 3: Discretionary nature has a magnified impact, as GDP growth fluctuates
Source: CEIC, IIFL Research
3: Availability of financing hurt sales; easing now Availability of financing hurt PVs and CVs more than 2Ws. Strict credit assessment of potential vehicle-buyers and lower loan-to-value ratio resulted in loss of sales in the past 12 months. The trigger point for the tightness in financing was the NBFC crisis starting late-2018. While a fall in loan-to-value, from 90% to 80%, does not sound alarming, it effectively doubles the down-payment requirement, which may have been beyond the affordability limit of many potential vehicle-buyers. 4: Confusion over BS-IV to BS-VI transition has led to sales postponement Our dealer checks and interactions with OEMs reveal that some consumers have postponed buying decisions in view of upcoming emission-norm changes. This is because of such consumers preferring to wait for a few months and buying new technology vehicles rather than old-technology ones now. This factor is more valid in case of gasoline cars, where the price difference between BS-IV and BS-VI is not much (1-2%); hence, price is not a major consideration for pre-buying. As regards models where BS-VI upgrades have been launched by OEMs, some customers are waiting for availability of BS-VI fuel instead of risking BS-IV fuel in BS-VI vehicles. Starting April 2020, when BS-VI vehicles and fuel would both be available, these postponements should convert into real sales.
0%2%4%6%8%10%12%14%16%18%20%
3.00%
3.25%
3.50%
3.75%
4.00%
4.25%
4.50%
4.75%
5.00%
FY05
FY06
FY07
FY08
FY09
FY10
FY11
FY12
FY13
FY14
FY15
FY16
FY17
FY18
FY19
FY20ii
Auto's share of wallet (LHS) Private consumption growth (RHS)
6

joseph.george@iif lcap.com
India - Auto
Are there any structural factors that impede growth in autos? Undoubtedly yes. However, in our view, they are not significant enough to bring the sector to a standstill. Structural factors that have been cited as impediments to growth are: i) High levels of penetration (more relevant for 2Ws) ii) Road infrastructure, traffic congestion (more relevant for PVs) iii) Shared mobility (more relevant for PVs) i) High level of penetration The penetration argument is relevant more in the context of 2Ws than cars. Penetration of cars in India is about 2.5% of population and <10% of households. Surely, as income levels grow and so do aspirations, this penetration number is bound to increase. The other connected argument we hear is “everyone who can afford a car, already has a car”. This would largely be the case at any point of time in history. Yet, vehicle sale have grown over the years, as more individuals/households have entered the affordability bracket. In addition, there is the angle of replacement sales. Even a fully penetrated car-market buys a steady number of cars every year. USA, which is a 70-80% penetrated car market, still buys 15-18mn cars every year; this is primarily driven by replacement sales. In India, the first owner of a car typically holds on to the vehicle for 5-7 years; this extends or shortens depending on the state of the economy. The average number of cars that were sold in India 5-7 years ago was 2.6mn. These would come up for replacement in coming years. In comparison, FY20ii PV volume would only be about 3mn. Hence, replacement sales on their own can account for a large part of new-car sales in coming years. Surely, as income level/affordability increases and the above-referred cyclical impediments recede, there would be enough first-time buyers to drive growth in volumes. Figure 4: Replacement by itself would contribute a large chunk of FY21‐22ii sales
Source: SIAM, IIFL Research
Even for 2Ws, a large chunk of sales in FY21-22ii can be contributed by replacement sales. About 16m 2Ws were sold annually in the FY14-16 period; these can come up for replacement soon. In comparison, FY20ii 2W volume would only be about 18.5mn. Here again, replacement sales can account for a large part of new 2W sales in coming years.
0.0
0.5
1.0
1.5
2.0
2.5
3.0
3.5
4.0
FY10
FY11
FY12
FY13
FY14
FY15
FY16
FY17
FY18
FY19
FY20ii
FY21ii
FY22ii
(Domestic PV sales)
Avg sales 2.6mn
7

joseph.george@iif lcap.com
India - Auto
Figure 5: Replacement would contribute a large chunk of FY21‐22ii 2W sales
Source: SIAM, IIFL Research
As regards 2Ws, if we simply compare the 2W population of ~200mn to the ~300mn households in the country, it looks like a fairly penetrated category. However, if we adjust for the fact that there are, on an average, 1.9 2Ws per household, the household-level penetration is only ~40%, with further room for expansion. Figure 6: There are almost two 2Ws in households, which own 2Ws
2001 Census 2011 Census 2019 Est.
Total number of households (mn) 192 247 292
Household penetration of 2Ws 11.7% 21.0% 37.6%
Number of households with 2W (mn) 22 52 109
2W population (mn; 15yr life) 32 88 203
No of 2Ws per household 1.4 1.7 1.9
Source: Census of India, SIAM, IIFL Research
Figure 7: There is room for further expansion in 2W penetration
FY17 FY18 FY19 FY20ii FY21ii FY22ii
2W volumes (mn) 17.6 20.2 21.2 18.6 19.5 21.6
Growth (%) 7% 15% 5% ‐12% 5% 11%
2W population (mn; 15yr life) 159 175 190 203 215 229
Number of households (mn) 276 283 287 292 296 300
Household penetration 58% 62% 66% 70% 73% 76%
No of 2Ws per households 1.8 1.8 1.8 1.9 1.9 1.9
Adj. household penetration 32% 34% 36% 38% 39% 40%
Source: Census of India, SIAM, IIFL Research
Figure 8: No. of middle income & above households to double by 2030 (vs. 2018)
Source: Hero MotoCorp ‐ Corporate presentation (May‐19)
0.0
5.0
10.0
15.0
20.0
25.0
FY10
FY11
FY12
FY13
FY14
FY15
FY16
FY17
FY18
FY19
FY20ii
FY21ii
FY22ii
(Domestic 2W sales)
Avg sales 16mn
69%
43%
15%
31%
57%
85%
2005 2018 2030E
Mid income & above Low incomeHouseholds (mn)
293 386219
8

joseph.george@iif lcap.com
India - Auto
ii) Road infrastructure, traffic congestion There is no doubt that better road infrastructure would have supported higher growth, especially in PVs. Perhaps, that is why PV growth has trudged along at single-digit Cagr over FY11-19, after logging 27% Cagr for two years (FY09-11). In fact, over this period, 2Ws clocked higher growth vs. PVs. Analysis of state-wise data tells us that states with metro cities have not contributed to volume growth in the past 8 years. Almost the entire growth in the industry came from non-metro states. Figure 9: States with metros have not been contributing to industry growth
Urbanisation
Contribution to sales ‐
FY11
FY11 PV sales
FY19 PV sales
8‐year Cagr
Contribution to growth
Maharashtra 45% 13.8% 346,038 354,480 0%
Delhi 98% 7.5% 189,385 193,922 0%
Tamil Nadu 48% 7.4% 185,309 219,628 2%
West Bengal 32% 3.6% 90,267 104,819 2%
Sum 45% 32.2% 810,999 872,849 1% 7%
Other states 27% 67.8% 1,705,526 2,504,560 5% 93%
Total India 31% 100.0% 2,516,525 3,377,409 4%
Source: SIAM, IIFL Research; Note: Urbanisation is as measured by 2011 Census
Figure 10: Maruti – FY11‐19 growth mainly driven by rural markets
FY11 ‐ Share of volumes FY19 ‐ Share of volumes FY11‐19 Volume Cagr
Urban 80% 61% 2%
Rural 20% 39% 15%
Total 100% 100% 6%
Source: Company, IIFL Research
It is possible that larger cities may not contribute much to growth, even in the future, due to relatively higher level of penetration and infrastructure issues. However, growth may continue outside large cities, especially given the significant under-ownership of PVs. Over time, as the government builds more roads and infrastructure, this would be less of an impediment. iii) Shared mobility The third factor that has been talked about in this context is shared mobility (Uber, Ola). This, again, is a factor that impacts PVs more than 2Ws. Shared mobility accounts for mid-single-digit percentage contribution to PV industry sales. Shared mobility is currently restricted to cities. Outside these cities, shared mobility is not a factor. Even in places where shared mobility is a factor, we believe this would not hurt first-car purchases. The aspiration of owning a car is a huge motivation; this would not be satiated by the ability to hire a car using an App. If at all, this may impact the propensity to buy a second car in the family. As highlighted earlier, with a 2.5% penetration, car sales have a long way to go before “shared mobility” acts as an impediment to first-car purchases.
9

joseph.george@iif lcap.com
India - Auto
Expect auto’s “wallet share” to rebound As mentioned earlier, consumer spend on auto under-shot private final consumption by 14% in FY20ii, thereby losing an equivalent “share of wallet”. We expect the “share of wallet” to rebound over FY21-23ii to its 15-year average, coinciding with a recovery in the overall economy. We build 8% and 9% nominal growth in private final consumption in FY21ii and FY22ii respectively, implying a cumulative growth of 17% over two years. As the economy recovers and other impediments highlighted earlier recede, we expect auto’s “share of wallet” to improve by 15% by FY22ii (back to FY19 levels). Overall, we expect consumer spend of auto to increase by 32% over FY21ii + FY22ii. Of this, we expect about 11% to be lost on account of costs related to emission norm change and mix change, with the remaining 21% translating into volume growth. Figure 11: Rebound in “wallet share” to drive recovery over FY21‐23ii
FY20ii FY21ii + FY22ii
Private Final consumption – Nominal Growth (A) 7% 17%
Gain / (Loss) of "share of wallet" (B) ‐14% 15%
Total consumer spend on Auto – Growth (C=A+B) ‐7% 32%
ASP increase + mix (D) 5% 11%
Volume growth (C‐D) ‐12% 21%
Source: IIFL Research
In case of PVs, we forecast 33% growth in consumer spend over the next two years, driving a 22% volume growth, after adjusting for a 10% ASP increase over FY21ii+FY22ii (mainly BS-VI related). Despite building an 11% Cagr over the next two years, the 5-year PV volume Cagr over FY17-22ii would only be about 4%. Figure 12: PV − We expect 22% volume growth over FY21ii + FY22ii
FY20ii FY21ii + FY22ii
Private Final consumption – Nominal Growth (A) 7% 17%
Gain / (Loss) of "share of wallet" (B) ‐13% 16%
Total consumer spend on Auto – Growth (C=A+B) ‐6% 33%
ASP increase + mix (D) 6% 10%
Volume growth (C‐D) ‐12% 22%
Source: IIFL Research
In case of 2Ws, we forecast 30% growth in consumer spend over the next two years, driving a 16% volume growth, after adjusting for a 14% ASP increase over FY21ii+FY22ii (mainly BS-VI related). Despite building a 16% jump in volumes over two years, absolute 2W volume in FY22ii would only be 2% higher than FY19. Figure 13: 2Ws − We expect 16% volume growth over FY21ii + FY22ii
FY20ii FY21ii + FY22ii
Private Final consumption – Nominal Growth (A) 7% 17%
Gain / (Loss) of "share of wallet" (B) ‐15% 13%
Total consumer spend on Auto – Growth (C=A+B) ‐8% 30%
ASP increase + mix (D) 4% 14%
Volume growth (C‐D) ‐12% 16%
Source: IIFL Research
10

joseph.george@iif lcap.com
India - Auto
How does India stack up vs. USA and China? Indian consumers spend about 2.7% of their wallet on purchasing new cars. In comparison, USA spent about 4.4% and China spent 12.6%. In USA, PV is a matured consumption category with 70-80% car penetration. PV’s share of consumer wallet went up in the first half of 20th century but has been flattening and coming down in recent decades. Figure 14: USA ‐ PV’s share of consumer wallet coming off after peaking
Source: Bloomberg, World Bank, IIFL Research
In China, PV’s share of consumer wallet has gone up 12x since the turn of the century, coinciding with a multi-fold rise in PV volumes. Figure 15: China ‐ PV’s share of wallet significantly higher than in India
Source: Bloomberg, CAAM, World Bank, IIFL Research
0
2
4
6
8
10
12
14
16
18
0%
1%
2%
3%
4%
5%
6%
7%
8%
9%CY76
CY78
CY80
CY82
CY84
CY86
CY88
CY90
CY92
CY94
CY96
CY98
CY00
CY02
CY04
CY06
CY08
CY10
CY12
CY14
CY16
CY18
US PV spend as % of pvt. consumption PV volumes (mn) ‐ RHS
0
6
12
18
24
30
0%
3%
6%
9%
12%
15%
CY99
CY00
CY01
CY02
CY03
CY04
CY05
CY06
CY07
CY08
CY09
CY10
CY11
CY12
CY13
CY14
CY15
CY16
CY17
CY18
China PV spend as % of pvt. consumption PV Volumes (mn) ‐ RHS
11

joseph.george@iif lcap.com
India - Auto
Adverse inventory cycle behind us In the early part of the down-cycle, dealer inventory increases, as wholesales stay high, even as retails weaken. In the late stage of the down-cycle, wholesales are much lower than retails, as inventory gets corrected. This is the worst phase, from a reported volume perspective (wholesales). Different stages of the inventory cycle are depicted in Figure 16. The July-Oct 2019 period was marked by sharp inventory correction across segments (2Ws, PVs and CVs). Commentary from OEMs suggests that dealer inventory levels are currently at the lowest levels in the past two years. Inventory is unlikely to be built up in the next 3-4 months, as most OEMs are focussing on depleting BS-IV inventory ahead of the deadline (March 31, 2020). We believe dealers will enter FY21 with relatively lean levels of inventory. As end-demand (retails) recovers over the course of FY21, we expect wholesales to outpace retails, resulting in an even higher growth in reported volumes. Figure 16: Typical inventory cycle in downturns
Retails Wholesales Dealer inventory
Stage 1 weak > Retails increasing
Stage 2 weak = Retails stays high
Stage 3 weak < Retails reducing
Stage 4 flattish = Retails stays low
Stage 5 recovers > Retails increases to normal
Source: IIFL Research
Figure 17: Different stages of the inventory cycle
Source: IIFL Research
If end-demand holds up over the next 6-7 months, we may see high growth in reported wholesales in the Jul-Sep 2020 period, as companies would stock up before the festive season. The YoY base (Jul-Sep 2019) included inventory correction and no festive stocking-up and would offer a very easy comparable base.
0
20
40
60
80
100
120
140
160
180
Apr‐18
May‐18
Jun‐18
Jul‐18
Aug‐18
Sep‐18
Oct‐18
Nov‐18
Dec‐18
Jan‐19
Feb‐19
Mar‐19
Apr‐19
May‐19
Jun‐19
Jul‐19
Aug‐19
Sep‐19
Oct‐19
Nov‐19
Dec‐19
Jan‐20
Feb‐20
Mar‐20
Apr‐20
May‐20
Jun‐20
Jul‐20
Aug‐20
Sep‐20
Oct‐20
Nov‐20
Dec‐20
Retails Wholesales Inventory(Volumes)
Stage‐1 Stage‐2 Stage‐3 Stage‐4 Stage‐5
12

joseph.george@iif lcap.com
India - Auto
Maruti went through a sharp inventory-correction phase in Jul-Sep 2019, not necessarily in terms of number of units but by way of not filling-in inventory before the festive season (like it does every year). As a result, post the high-volume festive season, Maruti’s dealer inventory was lower compared with that at the end of the 2018 festive season. Figure 18: Maruti’s dealer inventory is lower on a YoY basis
Source: IIFL Research
CV players such as Ashok Leyland and Bharat Benz have reported much lower wholesales than retails in the past few months. As per our estimates, their dealer inventory would now be lower compared with the same time last year. Figure 19: Ashok Leyland’s dealer inventory has come down substantially
Source: IIFL Research
Figure 20: Bharat Benz corrected dealer inventory by a third in 1HFY20
Mar‐18 Jun‐18 Sep‐18 Dec‐18 Mar‐19 Jun‐19 Sep‐19
Bharat Benz Retail 5,759 5,534 4,946 5,270 4,469 4,053 3,548
Bharat Benz Wholesale
6,191 5,796 5,252 5,293 5,549 3,840 2,672
Bharat Benz Retail Growth
28% 70% 8% 9% ‐22% ‐27% ‐28%
Bharat Benz Wholesale Growth
66% 63% 8% 16% ‐10% ‐34% ‐49%
Source: Company, IIFL Research
0
50,000
100,000
150,000
200,000
Jan Feb Mar Apr May Jun Jul Aug Sep Oct Nov Dec
2018 2019(Dealer inventory)
0
4,000
8,000
12,000
16,000
Jun‐19 Jul‐19 Aug‐19 Sep‐19 Oct‐19 Nov‐19
(Dealer inventory)
13

joseph.george@iif lcap.com
India - Auto
Management commentary on inventory-level: Bajaj Auto – Rakesh Sharma (1-Nov-19) “I have not seen such low stock in the channel in the last 18 months.”
Hero MotoCorp – Sanjay Bhan (1-Nov-19) “Thanks to the record retail off-take, our inventory levels are now down to 30 days; this is lowest in the past 24 months”
Tata Motors – Mayank Pareek (1-Nov-19) “In this fiscal, network stock has been reduced by 38%. October end network stock is the lowest in last two years. This will help our network to be prepared for a smooth BS-VI transition.”
Tata Motors – Girish Wagh (25-Oct-19) “I think our stocks are now at a six quarter low and…”
SML Isuzu – Gopal Bansal (4-Dec-19) “The inventory level with the dealers is at the lowest, if you see the last four years data.”
Figure 21: We expect strong growth in wholesales, starting 2QFY21
Source: SIAM, IIFL Research
Seasonally adjusted annual rate (SAAR) shows bottoming out Monthly industry data reveals that SAAR for PVs and MHCVs bottomed out in Sep-2019, coinciding with the highest level of inventory correction. Since then, we have seen SAAR improve. In case of 2Ws, SAAR is still at lows and is yet to show an uptick. We believe 2W SAAR would bottom out sometime in the next six months. Figure 22: PV SAAR bottomed out in Aug‐Sep 2019
Source: IIFL Research
‐60%
‐40%
‐20%
0%
20%
40%
60%
1QFY19
2QFY19
3QFY19
4QFY19
1QFY20
2QFY20
3QFY20E
4QFY20E
1QFY21E
2QFY21E
3QFY21E
4QFY21E
PVs 2Ws MHCVs(YoY growth %)
0
1,000,000
2,000,000
3,000,000
4,000,000
5,000,000
Apr‐18
May‐18
Jun‐18
Jul‐18
Aug‐18
Sep‐18
Oct‐18
Nov‐18
Dec‐18
Jan‐19
Feb‐19
Mar‐19
Apr‐19
May‐19
Jun‐19
Jul‐19
Aug‐19
Sep‐19
Oct‐19
Nov‐19
PV SAAR
14

joseph.george@iif lcap.com
India - Auto
Figure 23: MHCV SAAR bottomed out in Sep 2019
Source: IIFL Research
Figure 24: 2W SAAR is still at lows; yet to show up‐tick
Source: IIFL Research
0
100,000
200,000
300,000
400,000
500,000
Apr‐18
May‐18
Jun‐18
Jul‐18
Aug‐18
Sep‐18
Oct‐18
Nov‐18
Dec‐18
Jan‐19
Feb‐19
Mar‐19
Apr‐19
May‐19
Jun‐19
Jul‐19
Aug‐19
Sep‐19
Oct‐19
Nov‐19
MHCV SAAR
0
5,000,000
10,000,000
15,000,000
20,000,000
25,000,000
30,000,000
Apr‐18
May‐18
Jun‐18
Jul‐18
Aug‐18
Sep‐18
Oct‐18
Nov‐18
Dec‐18
Jan‐19
Feb‐19
Mar‐19
Apr‐19
May‐19
Jun‐19
Jul‐19
Aug‐19
Sep‐19
Oct‐19
Nov‐19
2W SAAR
15

joseph.george@iif lcap.com
India - Auto
BS-VI transition: Expect a volatile 1HCY20 We expect vehicle prices to go up by 10-15%, when the industry mandatorily shifts from BS-IV to BS-VI, starting April 2020. The price hikes would be lower for gasoline cars (1-3%) and premium cars/2Ws (5-10%). BS-VI is not applicable to tractors. Figure 25: Major BS‐VI product launches in the market so far
Auto segment Model name Launch date Price hike over BS‐IV
Petrol car Maruti Baleno Apr‐2019 ~2%
Petrol car Maruti Alto 800 Apr‐2019 2‐3%
Petrol car Maruti Swift Jun‐2019 ~2%
Petrol car Maruti Wagon‐R 1.2L Jun‐2019 2‐2.5%
Petrol car Maruti Dzire Jun‐2019 ~2%
Petrol car Maruti Ertiga Aug‐2019 ~1%
Petrol car Maruti Wagon‐R 1.0L Nov‐2019 1.5‐2%
Petrol SUV Mahindra XUV 300 Dec‐2019 ~2%
Executive MC Hero Splendor iSmart Nov‐2019 13%
Premium MC TVS Apache RTR 160 4V Nov‐2019 8%
Premium MC TVS Apache RTR 200 4V Nov‐2019 8%
Scooters Honda Activa 125 Sep‐2019 10‐13%
Scooters TVS Jupiter Classic Nov‐2019 13%
Source: Company, News articles, IIFL Research; Note: price hike % based on ex‐showroom price; MC= Motorcycle
We expect the next six months to see volatility in reported wholesale volumes. OEMs would try to clean up their channel-wide BS-IV inventory over the next 3 months. There is a possibility of ‘pre-buy’ of BS-IV vehicles in 1QCY20, ahead of the BS-VI price hikes. Post the transition, retail volumes may be weak in the first few months due to the price shock and also due to reversal of ‘pre-buy’. During this period, dealers may resist OEMs’ attempt to fill up BS-VI vehicle inventory. We also expect Ebitda margins to be volatile over this period due to i) inability to charge a margin on the BS-VI cost increase or in some cases, inability to fully pass on costs; and ii) negative operating leverage, if volumes are weak. Among segments, for which BS-VI is applicable, gasoline cars would be the most insulated, as this segment would see the lowest price increase. Focusing specifically on Maruti, impact on the gasoline segment would be even lower, as the company has already transitioned majority of its model to BS-VI. Its inventory of BS-IV petrol vehicles is very low and not at all concerning. Maruti may be affected to some extent by its decision to discontinue diesel variants upon transition to BS-VI. If Maruti is not able to switch all its potential diesel customers to gasoline, there may be loss of volumes. This aspect is addressed in the PV section. The % price impact for Eicher (Royal Enfield) would also be comparatively lower, given that it caters to the premium segment. Bajaj would be relatively insulated at the company-level, as 45% of its volumes are exported. That said, we do not expect these companies to charge margins on BS-VI costs, as they are also coming off a weak-demand environment.
16

joseph.george@iif lcap.com
India - Auto
We expect “gross profit per vehicle” to hold In our forecasts for OEMs, we build flattish “gross profit per vehicle” under BS-VI (FY21ii over FY20ii), implying that OEMs are able to pass on the cost increase but not charge a profit margin on the additional cost. In effect, this will bring down gross margin for most OEMs. Ebitda margin for OEMs would be a function of the operating leverage based on volume growth. Maruti would be least impacted, as it has already transitioned most of its gasoline models to BS-VI with limited price increases. An exception to this rule of thumb would be companies that have given out high discounts in FY20. Assuming demand scenario improves in FY21ii over FY20ii, we may see some gross profit benefit as these discounts come off. PV and CV players would benefit on this account. Figure 26: We forecast flattish “gross profit per vehicle” in 2Ws
OEMs FY21 vol.growth
FY21 rev growth
GM/vehicle (Rs) Ebitda margin
FY20ii FY21ii FY19 FY20ii FY21ii FY22ii
Hero 5% 17% 14,078 14,070 14.7% 14.0% 12.7% 13.1%
Bajaj 7% 12% 18,457 18,682 16.5% 15.9% 15.4% 15.7%
Eicher 8% 12% 59,525 59,792 29.6% 25.5% 24.5% 24.9%
TVS 8% 18% 13,047 13,216 7.9% 8.4% 8.0% 8.3%
M&M 2% 8% 190,283 194,392 14.2% 13.6% 13.2% 13.4%
Maruti 8% 9% 139,168 146,315 12.8% 10.3% 11.9% 13.0%
Ashok 6% 19% 421,118 444,254 10.8% 7.1% 7.1% 9.7%
Tata (S) 8% 19% 256,089 265,893 8.3% 5.2% 5.8% 8.4%
Source: IIFL Research
Ashok Leyland and TVS have high EPS sensitivity to margins In the event of OEMs not opting to pass on the full impact of BS-VI cost increases to customers, for fear of losing volumes and/or on account of competitive reasons, industry-level profitability may come off. In this case, companies with low margins would be more impacted. The EPS sensitivity of a 100bps drop in margins is highest for Ashok Leyland and TVS. Figure 27: Auto OEMs – EPS sensitivity to the 100bps change in Ebitda margin
FY21ii Ebitda margin PBT margin EPS Sensitivity
Hero MotoCorp 12.7% 12.6% 7.9%
Bajaj Auto 15.4% 19.5% 5.1%
Eicher Motors 24.5% 26.3% 3.8%
TVS Motor 8.0% 4.9% 20.2%
M&M 13.2% 11.0% 9.1%
Maruti Suzuki 11.9% 10.4% 9.6%
Ashok Leyland 7.1% 4.1% 24.5%
Tata Motors (S) 5.8% ‐2.2% NM
Source: IIFL Research
17
joseph.george@iif lcap.com
India - Auto
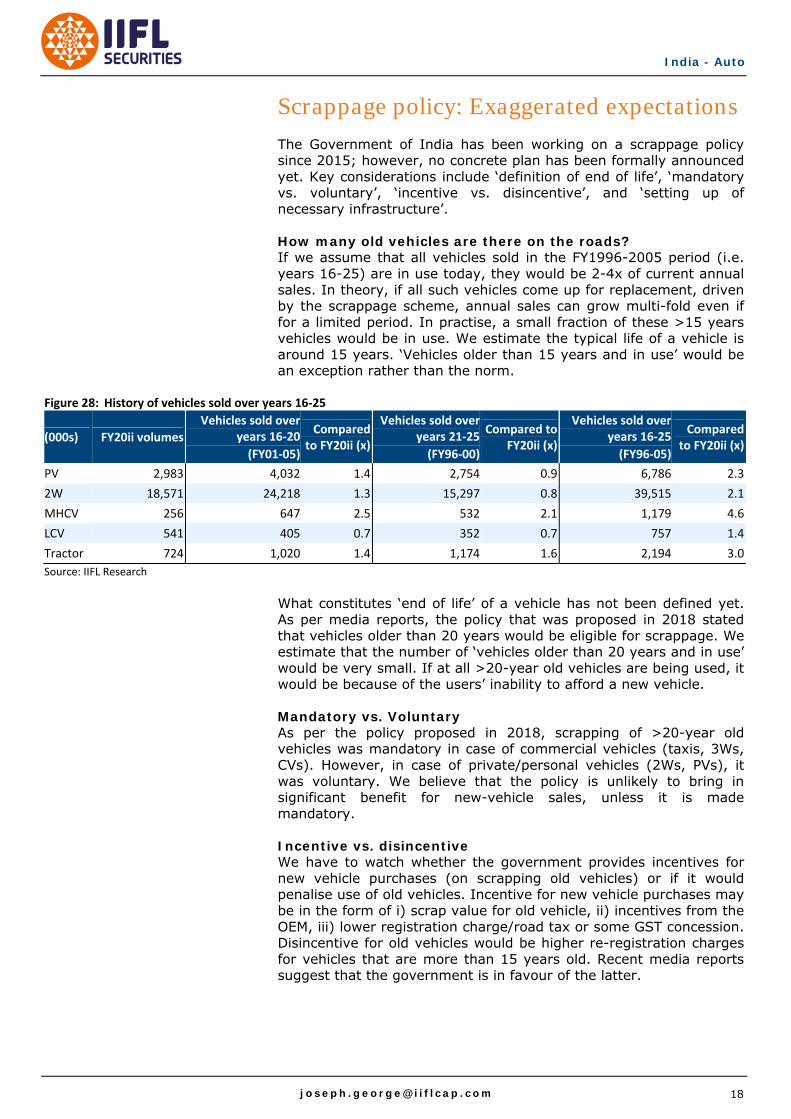
Scrappage policy: Exaggerated expectations The Government of India has been working on a scrappage policy since 2015; however, no concrete plan has been formally announced yet. Key considerations include ‘definition of end of life’, ‘mandatory vs. voluntary’, ‘incentive vs. disincentive’, and ‘setting up of necessary infrastructure’. How many old vehicles are there on the roads? If we assume that all vehicles sold in the FY1996-2005 period (i.e. years 16-25) are in use today, they would be 2-4x of current annual sales. In theory, if all such vehicles come up for replacement, driven by the scrappage scheme, annual sales can grow multi-fold even if for a limited period. In practise, a small fraction of these >15 years vehicles would be in use. We estimate the typical life of a vehicle is around 15 years. ‘Vehicles older than 15 years and in use’ would be an exception rather than the norm.
Figure 28: History of vehicles sold over years 16‐25
(000s) FY20ii volumes
Vehicles sold over years 16‐20
(FY01‐05)
Compared to FY20ii (x)
Vehicles sold over years 21‐25
(FY96‐00)
Compared to FY20ii (x)
Vehicles sold over years 16‐25
(FY96‐05)
Compared to FY20ii (x)
PV 2,983 4,032 1.4 2,754 0.9 6,786 2.3
2W 18,571 24,218 1.3 15,297 0.8 39,515 2.1
MHCV 256 647 2.5 532 2.1 1,179 4.6
LCV 541 405 0.7 352 0.7 757 1.4
Tractor 724 1,020 1.4 1,174 1.6 2,194 3.0
Source: IIFL Research
What constitutes ‘end of life’ of a vehicle has not been defined yet. As per media reports, the policy that was proposed in 2018 stated that vehicles older than 20 years would be eligible for scrappage. We estimate that the number of ‘vehicles older than 20 years and in use’ would be very small. If at all >20-year old vehicles are being used, it would be because of the users’ inability to afford a new vehicle. Mandatory vs. Voluntary As per the policy proposed in 2018, scrapping of >20-year old vehicles was mandatory in case of commercial vehicles (taxis, 3Ws, CVs). However, in case of private/personal vehicles (2Ws, PVs), it was voluntary. We believe that the policy is unlikely to bring in significant benefit for new-vehicle sales, unless it is made mandatory. Incentive vs. disincentive We have to watch whether the government provides incentives for new vehicle purchases (on scrapping old vehicles) or if it would penalise use of old vehicles. Incentive for new vehicle purchases may be in the form of i) scrap value for old vehicle, ii) incentives from the OEM, iii) lower registration charge/road tax or some GST concession. Disincentive for old vehicles would be higher re-registration charges for vehicles that are more than 15 years old. Recent media reports suggest that the government is in favour of the latter.
18

joseph.george@iif lcap.com
India - Auto
Scrappage infrastructure Incentives for scrapping old vehicles and being redeemable against new vehicle purchases would be based on scrappage certificates issued by authorised ‘vehicle scrappage facilities’. Currently, there is only one organised vehicle-scrappage facility. This facility is Cero Recycling, a JV between Mahindra Group and government-owned Metal Scrap Trading Corporation (MSTC) and is based in Greater Noida in the NCR region. Recently, Maruti Suzuki and the Toyota Tsusho Group announced plans to set up a vehicle dismantling & recycling joint venture ‘Maruti Suzuki Toyotsu India’ (MSTI). This unit would be based in Noida and may be commissioned in FY21. Figure 29: Organised vehicle scrappage facilities Entity name Operational from Monthly capacity Annual capacity
Cero Recycling Apr'18 500 vehicles 6,000 vehicles
MSTI FY21 2,000 vehicles 24,000 vehicles
Source: Company, IIFL Research
As is evident (Figure 29), the existing vehicle scrappage capacity is miniscule. In order for scrappage policy to result in even a 10% benefit to new vehicle sales, we need a 15x jump in annual scrappage capacity. There are several small and informal scrappage units in the country. But these are not authorised, nor would they meet the criteria set out by the government for being eligible to issue “scrappage certificates”. The draft scrappage policy put out by the government includes criteria such as “minimum useable treatment area of 4,000sq-mtr for 2Ws/3Ws and 8,000sq-mtr for all other vehicle types (PVs, LCVs, MHCVs, others). Figure 30: Need a 15x jump in ‘vehicle scrappage facilities’ for a 10% volume uplift
Segment Requisite annual scrappage capacity
PV 300,000
MHCV 25,000
LCV 55,000
Tractor 75,000
Total 455,000
Source: IIFL Research
Moreover, Cero recycling (Mahindra JV) and MSTI (Maruti JV) are both based in Noida. For the policy to be effective, a network of scrappage facilities across the country is required. Surely a vehicle based in Mumbai cannot be expected to be driven to Noida for being scrapped. In effect, the probability of the scrappage policy driving replacement demand in FY21 or FY22 is low. The only minor driver, if at all, would be the disincentive of higher re-registration charges on >15-year old vehicles.
19

joseph.george@iif lcap.com
India - Auto
PV segment: Least impacted by BS-VI Consumer spending on PVs (FY20ii) in terms of ‘share of wallet’ is at a 17-year low and 20% below its long-term average. We expect PVs’ wallet share to rebound to the 15-year average over the next three years, as overall GDP growth picks up and other cyclical impediments highlighted earlier recede. Figure 31: We expect PVs’ ‘share of wallet’ to normalise over FY21‐23ii
Source: IIFL Research
As per our estimate, the average on-road ASP would go up by 6% in FY20ii and a further 6% in FY21ii. The ASP increase in FY20ii includes the impact of higher insurance costs, safety norms, BS-VI launches and mix. In FY21ii, it would be driven by BS-VI, partly offset by mix. The price impact would moderate in FY22ii. On a base of 12% volume decline in FY20ii, we forecast an 11% volume Cagr over the next three years. Share of diesel in the industry to come off As price of diesel vehicles would go up significantly (10% or more) vs. that of petrol (1-3%), we expect diesel’s share in the industry to come off substantially. This may not possibly stand true for higher-end cars and large SUVs. Figure 32: We expect share of diesel to fall sharply
Source: IIFL Research
Currently, the difference between on-road prices of comparable diesel and petrol variants is about Rs110,000. Post BS-VI, the price difference would rise to around Rs200,000. Currently, a car-buyer
2.00%
2.25%
2.50%
2.75%
3.00%
3.25%
3.50%
FY05
FY06
FY07
FY08
FY09
FY10
FY11
FY12
FY13
FY14
FY15
FY16
FY17
FY18
FY19
FY20ii
FY21ii
FY22ii
FY23ii
Spend on PVs as % of pvt. consumption GDP
15‐yr average
0%
10%
20%
30%
40%
50%
60%
70%
FY09
FY10
FY11
FY12
FY13
FY14
FY15
FY16
FY17
FY18
FY19
FY20ii
FY21ii
Diesel share in industry (%)
20

joseph.george@iif lcap.com
India - Auto
would need to drive about 15,000km per annum for fuel savings, to offset the upfront higher cost of diesel cars. This break-even point would rise to about 25,000km under BS-VI. Since personal users of cars do not drive so many kilometres in a year, purchasing diesel cars may not make economic sense. However, taxi/commercial buyers may still find diesel more economical. Figure 33: Break‐even for diesel cars to increase to 25,000km per annum
Source: IIFL Research
Competitive intensity benign; many OEMs losing relevance Over the past few years, many multi-national brands have lost relevance in India. GM and Fiat are not selling cars in India anymore. Ford recently sold a majority stake in its India operations to Mahindra. VW, Skoda and Nissan have been continuously losing share and are now at 1% or lower, in terms of market-share. Mahindra, Tata Motors and Honda are also losing share. The only serious competition for Maruti seems to be from Hyundai and the new entrant Kia. Figure 34: Many OEMs losing relevance; Kia is the only new one to watch
OEM FY15 FY16 FY17 FY18 FY19 FY20YTD
Maruti 45% 47% 47% 50% 51% 50%
Hyundai 16% 17% 17% 16% 16% 18%
Mahindra 9% 8% 8% 8% 8% 7%
Tata Motors 6% 5% 6% 6% 7% 5%
Toyota 5% 5% 5% 4% 4% 4%
Honda 7% 7% 5% 5% 5% 4%
Renault 2% 3% 4% 3% 2% 3%
Ford 3% 3% 3% 3% 3% 3%
Volkswagen 2% 1% 2% 1% 1% 1%
Nissan 2% 1% 2% 2% 1% 1%
Kia 2%
Others 3% 2% 2% 1% 1% 2%
Total 100% 100% 100% 100% 100% 100%
Source: SIAM, IIFL Research
Maruti’s reported market-share may come off slightly We see slight risk to Maruti’s reported market-share due to three reasons: - Decision to exit the <1.3L diesel segment - Growing SUV market, where Maruti has a relatively lesser presence - Cross-badging arrangement with Toyota
0
5,000
10,000
15,000
20,000
25,000
30,000
FY10
FY11
FY12
FY13
FY14
FY15
FY16
FY17
FY18
FY19
FY20ii
FY21ii
Minimum annual mileage for Diesel car to make economic sense(kms)
21

joseph.george@iif lcap.com
India - Auto
Exit from the <1.3L diesel segment Maruti plans to discontinue diesel vehicles, up to 1.3L engine capacity. This is due to sharp increase in prices of diesel vehicles to make them BS-VI compliant, which may make them unaffordable for prospective buyers. While some of Maruti’s peers have announced a similar decision, others have not. This is where the market-share risk for Maruti emerges. Figure 35: Diesel contributes about 20% to Maruti’s domestic PV volumes
Source: Company, IIFL Research
Diesel currently accounts for about 22% of Maruti’s domestic PV volumes. If Maruti is able to switch all its potential diesel customers to gasoline, there may not be any loss of volumes or market-share. However, there may be some drop-outs: i) Taxi/commercial buyers may still find diesel more economical. ii) Some buyers may prefer driving diesel cars because they enjoy it, even if it does not make economic sense. iii) SUV buyers typically prefer diesel over gasoline. Maruti has not ruled out the possibility of launching BS-VI compliant diesel engines of >1.3L capacity. Media reports suggest that Maruti is planning to launch a BS-VI compliant 1.6L diesel engine in some of its models (Ciaz, S-Cross, Ertiga, XL6). If true, Maruti may be able to offset some of the market-share risk. Growing SUV segment UVs’ contribution to the PV industry has increased, from 28% in FY19 to 34% in FY20 YTD. In the last 3-4 months, it has been as high as 36%. In FY20 YTD, Maruti’s market-share in PV (ex-UV) stood at 63%. This has been rising over the years. However, in the SUV segment, its market-share is relatively lower, at about 25%. There is a risk to Maruti’s UV market-share, due to new launches from competition as well as its decision to exit the diesel segment. On an overall basis, given the sharp rise in UVs’ contribution to the industry, Maruti’s overall market-share may come off a bit.
0%
5%
10%
15%
20%
25%
30%
35%
40%
FY09
FY10
FY11
FY12
FY13
FY14
FY15
FY16
FY17
FY18
FY19
FY20ii
Diesel contribution to Maruti volumes (%)
22

joseph.george@iif lcap.com
India - Auto
Figure 36: Rising UV mix in industry may slightly hurt Maruti’s market share
Source: SIAM, IIFL Research
Cross-badging arrangement with Toyota Maruti is currently supplying the re-badged Baleno to Toyota, as per the agreement announced in March 2018. Toyota sells it under the brand-name Glanza. Maruti would supply the re-badged Vitara Brezza to Toyota under the same agreement as well as the re-badged Ciaz and Ertiga, as per the announcement in March 2019. To the extent that the aforementioned Toyota-branded sales cannibalise Maruti’s sales of the same model, Maruti’s reported market-share (credited to the OEM making final sale) would be lower. That said, these Toyota-badged volumes do form part of Maruti’s P&L and it makes manufacturing margins on sales to Toyota. Figure 37: Maruti Baleno and Toyota Glanza −Monthly sales
Source: SIAM, IIFL Research
0%
5%
10%
15%
20%
25%
30%
35%
40%
0%
10%
20%
30%
40%
50%
60%
70%
FY11 FY12 FY13 FY14 FY15 FY16 FY17 FY18 FY19 FY20ytd
UV industry contribution (RHS) OverallUVs Cars/Vans
(Maruti's mkt share)
0
5,000
10,000
15,000
20,000
25,000
Apr‐18
May‐18
Jun‐18
Jul‐18
Aug‐18
Sep‐18
Oct‐18
Nov‐18
Dec‐18
Jan‐19
Feb‐19
Mar‐19
Apr‐19
May‐19
Jun‐19
Jul‐19
Aug‐19
Sep‐19
Oct‐19
Nov‐19
Maruti Baleno Toyota Glanza(volumes)
23

joseph.george@iif lcap.com
India - Auto
2W segment: BS-VI may hurt in near-term Consumer spending on 2Ws (FY20ii) in terms of ‘share of wallet’ is at a 10-year low and 15% below its long-term average. As in the case of PVs, we expect 2Ws’ wallet share to rebound to the 15-year average over the next three years. Figure 38: We expect 2Ws’ ‘share of wallet’ to normalise over FY21‐23ii
Source: IIFL Research
As per our estimate, the average on-road ASP would go up by 11% in FY21ii, primarily due to the BS-VI transition. The rate of price hikes may be lower in premium 2Ws and higher in low-end segments. This may hurt affordability in the near-term; more so, if there is an element of pre-buy in 4QFY20. We expect retail volumes to stay subdued in 1HFY21. However, wholesales should show YoY growth starting 2QFY21 (inventory correction in 2QFY20). We forecast a 5% volume growth in FY21ii, followed by a sharper 11% growth in FY22ii. Competitive intensity high, but stable The competitive intensity in the industry is high, but largely stable. The four largest players (Hero, Honda, TVS and Bajaj) together hold close to 90% market-share in overall 2Ws. Figure 39: Market‐share movement over FY18‐20ii
2W segments Hero Bajaj HMSI TVS
Scooters ↓ ↔ ↑
Economy motorcycle ↓ ↑ ↔
Executive motorcycle ↑ ↓ ↑ ↓
Premium motorcycle ↓ ↑ ↓ ↑
Overall motorcycle ↔ ↑ ↔ ↔
Overall 2Ws ↓ ↑ ↓ ↔
Source: IIFL Research
Bajaj embarked on a price-led strategy starting early 2018, with price cuts in CT100 and Pulsar. This strategy helped Bajaj gain market-share in the economy segment. Bajaj’s overall motorcycle market-share improved from 15.6% in FY18 to 20% in 2HFY19. Since then, volumes of the CT100 model came off substantially, leading to some moderation in Bajaj’s motorcycle market-share, coming back to about 18% in 1HFY20. Recently, Bajaj launched a 125cc variant of its premium Pulsar model. This has been well
0.80%
0.90%
1.00%
1.10%
1.20%
1.30%
1.40%
1.50%
1.60%
FY05
FY06
FY07
FY08
FY09
FY10
FY11
FY12
FY13
FY14
FY15
FY16
FY17
FY18
FY19
FY20ii
FY21ii
FY22ii
FY23ii
Spend on 2Ws as % of pvt. consumption GDP
15‐yr average
24

joseph.george@iif lcap.com
India - Auto
received in the market and has helped some market-share revival in recent months. Figure 40: Four players account for almost 90% of the 2W market‐share
Source: SIAM, IIFL Research
In the last two years, the result of the fight for the No.2 position in scooter (behind Honda) is out, with TVS emerging as a clear winner vs. Hero. Figure 41: Scooters − Honda continues to dominate
Source: SIAM, IIFL Research
Bajaj’s price-led strategy has helped it gain share in motorcycles. Figure 42: Overall Motorcycles − Hero steady at ~50%; Bajaj made gains
Source: SIAM, IIFL Research
0%
5%
10%
15%
20%
25%
30%
35%
40%
45%
FY16 FY17 FY18 1Q19 2Q19 3Q19 4Q19 1Q20 2Q20 3Q20E
Hero Bajaj HMSI TVS(Overall 2Ws)
0%
10%
20%
30%
40%
50%
60%
70%
FY16 FY17 FY18 1Q19 2Q19 3Q19 4Q19 1Q20 2Q20 3Q20E
Hero HMSI TVS(Scooters)
0%
10%
20%
30%
40%
50%
60%
FY16 FY17 FY18 1Q19 2Q19 3Q19 4Q19 1Q20 2Q20 3Q20E
Hero Bajaj HMSI TVS RE(Motorcycles)
25

joseph.george@iif lcap.com
India - Auto
Bajaj’s price-led strategy brought temporary market-share gains in economy segment; it has since moderated.
Figure 43: Economy motorcycles − Bajaj’s CT100‐led gain was temporary
Source: IIFL Research
Hero continues to dominate the executive segment, although Honda has made gains in recent quarters.
Figure 44: Executive motorcycles − Hero continues to dominate
Source: IIFL Research
Lower-priced Pulsar variants has helped Bajaj gain share in the premium segment.
Figure 45: Premium motorcycles − Bajaj remains the leader
Source: IIFL Research
0%
10%
20%
30%
40%
50%
60%
70%
FY16 FY17 FY18 1Q19 2Q19 3Q19 4Q19 1Q20 2Q20
Hero Bajaj TVS(Economy MC)
0%
10%
20%
30%
40%
50%
60%
70%
80%
90%
FY16 FY17 FY18 1Q19 2Q19 3Q19 4Q19 1Q20 2Q20
Hero Bajaj HMSI TVS(Executive MC)
0%
5%
10%
15%
20%
25%
30%
35%
40%
FY16 FY17 FY18 1Q19 2Q19 3Q19 4Q19 1Q20 2Q20
Hero Bajaj HMSI TVS RE(Premium MC)
26

joseph.george@iif lcap.com
India - Auto
FY21: Who gains; Who loses Which OEMs win and which lose will be a function of a few factors: Overall state of the economy and hence, segmental shifts within 2Ws Rural vs. Urban: A sharper recovery in rural markets would benefit motorcycles more than scooters. This would benefit Hero more than others. Income growth: If per-capita income growth is low in FY21, as it was in FY20, we may see down-trading within 2Ws, especially given the sharp increase in vehicle prices. This may benefit Hero and Bajaj more than others, from a volume perspective. Between the two, it would benefit Hero more from an earnings perspective, as Bajaj does not make significant margins on the CT100. Successful adoption of BS-VI technology BS-VI technology adoption would result in material changes to the engine. As of now, we are not in a position to judge whether any OEM would face technological glitches in its BS-VI products. However, this is a factor that we would watch closely. In 2Ws, models competing within a segment are fairly similar to each other. Hence, any product glitches may result in substantial migration to competing products. Type of BS-VI technology – e-Carburetor vs. Electronic Fuel injection (EFI) Our assumption of 11% average ASP increase is based on all OEMs adopting the EFI under BS-VI. We believe that OEMs would stick to EFI for the premium and executive segments. However, at the low end of the spectrum, there is a possibility that OEMs may opt for e-Carburetor over EFI, as the former is much cheaper. Although EFI is more expensive, it boasts of higher fuel efficiency. If OEMs successfully integrate the e-Carburetor option, it may give them a price advantage over competition in the segment. Our market-share projections We have largely maintained our market-share projections for FY21ii and FY22ii at similar levels as FY20ii. As a result, our domestic 2W volume growth projections are largely similar across Hero, Bajaj and TVS. Figure 46: 2W market‐share projections
FY19 FY20ii FY21ii FY22ii
Hero 35.9% 35.1% 35.2% 35.2%
Bajaj 12.0% 12.4% 12.5% 12.5%
TVS 14.8% 14.3% 14.5% 14.5%
Source: SIAM, IIFL Research
27

joseph.george@iif lcap.com
India - Auto
MHCVs: Expect YoY growth from 2QFY21 The MHCV segment continues to see sharp YoY decline in volumes at both the wholesale and retail levels. Wholesales have been underperforming retails in recent months, as OEMs have been in sharp inventory correction mode. We believe that a large part of the inventory correction is behind us. Going forward, wholesales may at least track retails. If demand improves, we may see re-stocking, implying higher growth in wholesales. We expect wholesales to start growing slightly earlier in 2QFY21, as there is a sharp inventory correction in the YoY base (2QFY20). Retails may continue to decline YoY till 2QFY21, especially with the sharp 12-15% price hike scheduled in April 2020 (BS-VI). By the end of 1HFY21, the MHCV segment would have seen almost two years of YoY declines. Post that, we expect retails to also start growing. In the previous two down-cycles, MHCV volumes on a TTM basis had fallen 42% and 44% from the peak, over a period of 15 months and 29 months respectively. This time, we forecast TTM volumes to trough at 235k in June 2020, a 42% decline vs. peak of 407k in Oct 2018. We forecast a 35% decline in overall MHCV volumes in FY20ii, with trucks declining 37% and buses down 9%. In FY21ii, we forecast a 5% volume growth in overall MHCVs. This is split into a 29% decline in 1Q, followed by 19% YoY growth in the last three quarters. We expect the momentum to continue into FY22ii, with a 20% volume growth. We have also seen a sharp fall in tonnage mix. The 37% decline in truck volumes that we are accounting for in FY20ii comes with a 44% decline in tonnage. We believe that when the cycle recovers, the tonnage growth would be much higher than volume growth. This should translate into much higher revenue growth for CV companies. Figure 47: We expect MHCV to start growing YoY in 2QFY21
Source: IIFL Research
There are multiple reasons for the sharp down-cycle in MHCVs: i) Weak GDP/IIP growth ii) Increase in system-wide tonnage post change in axle load norms iii) Availability of financing; lower loan to value ratio
0
100,000
200,000
300,000
400,000
500,000
Mar‐95
Mar‐96
Mar‐97
Mar‐98
Mar‐99
Mar‐00
Mar‐01
Mar‐02
Mar‐03
Mar‐04
Mar‐05
Mar‐06
Mar‐07
Mar‐08
Mar‐09
Mar‐10
Mar‐11
Mar‐12
Mar‐13
Mar‐14
Mar‐15
Mar‐16
Mar‐17
Mar‐18
Mar‐19
Mar‐20
Mar‐21
MHCV volumes(TTM Volumes)
53% fall over 18 months
42% fall over 15 months
44% fall over 29 months
42% fall over 21 months
28

joseph.george@iif lcap.com
India - Auto
Weak GDP/IIP growth MHCV truck sales have a high correlation to IIP growth (Index of Industrial Production). In the past few quarters, we have seen a sharp deceleration in IIP growth, even turning negative during Aug-Sep 2019. Lower industrial production obviously results in lower freight generation in the economy, which in turn impacts demand for trucks, fleet utilisation and profitability. Needless to say, the recovery that we are building in the MHCV cycle is dependent on the Indian economy recovering in FY21. If overall GDP and IIP remain weak, the downturn may continue longer than our expectations. Figure 48: Truck sales vs. IIP growth
Source: SIAM, CEIC, IIFL Research
Change in axle load norms In July 2018, the Ministry of Road Transport and Highways had increased the maximum permissible axle loads and hence truck tonnage by about 15%. Although strict interpretation of the notification applied to new trucks, it was also made applicable to the existing fleet. Figure 49: Change in Maximum Permissible Load per truck
Max load per truck Old tonnage Revised tonnage Change
Rigid 16.2 19.0 17%
Rigid 25.0 28.5 14%
Rigid 31.0 36.0 16%
Semi‐articulated 26.4 30.5 16%
Semi‐articulated 35.2 40.0 14%
Semi‐articulated 40.2 46.0 14%
Semi‐articulated 35.2 40.0 14%
Semi‐articulated 44.0 49.5 13%
Tractor trailer 36.6 42.0 15%
Tractor trailer 44.0 51.5 17%
Tractor trailer 44.0 55.0 25%
Tractor trailer 49.0 55.0 12%
Average increase 15%
Source: Government Notifications, IIFL Research
Our understanding is that ~60% of the truck usage is volume-based (implying nil scope for increasing loads). If we assume that the remaining 40% did not indulge in any over-loading before this
0%
2%
4%
6%
8%
10%
12%
14%
16%
‐60%
‐40%
‐20%
0%
20%
40%
60%
FY86
FY87
FY88
FY89
FY90
FY91
FY92
FY93
FY94
FY95
FY96
FY97
FY98
FY99
FY00
FY01
FY02
FY03
FY04
FY05
FY06
FY07
FY08
FY09
FY10
FY11
FY12
FY13
FY14
FY15
FY16
FY17
FY18
FY19
FY20E
MHCV truck growth (LHS) IIP growth (RHS)(YoY %)
29

joseph.george@iif lcap.com
India - Auto
notification (difficult to believe), a 15% tonnage increase in 40% of the fleet would imply a 6% increase in system wide tonnage. Figure 50: Impact of axle load norm change on fleet
Current truck fleet (%)
Current truck fleet (volume)
Impact of revised norms
Comments
Volume‐based 60% 1,800,000 0 No impact
Weight‐based
(no overloading) 40% 1,200,000 180,000
15% higher tonnage availability
Sum 100% 3,000,000 180,000
Impact on fleet +6%
Source: IIFL Research
On a reported basis, the system-wide tonnage would increase only by about 2% in FY20ii, after growing at 9% in FY19. This is the lowest tonnage growth logged since FY01. If we adjust the growth in system-wide tonnage for the new axle load norms, the growth rates for FY19 and FY20ii would be 12% and 5% respectively. Since the new norms came mid-way in FY19, we estimate a 3% impact each on FY19 and FY20ii annual tonnage growth. Figure 51: System‐wide tonnage growth rate has fallen sharply in FY20ii
Source: IIFL Research
We believe that the additional tonnage generated from the changed norms would surely have been absorbed by the system, by mid-CY20 (almost two years from the date of announcement). Lack of financing Since almost all truck purchases are financed, constraints on finance availability has been a key cause for fall in truck sales. We understand that the financing situation has started easing.
7%
9%10%
14%
10% 10% 10%
9%
2%
12%
5%
0%
2%
4%
6%
8%
10%
12%
14%
16%
FY86
FY87
FY88
FY89
FY90
FY91
FY92
FY93
FY94
FY95
FY96
FY97
FY98
FY99
FY00
FY01
FY02
FY03
FY04
FY05
FY06
FY07
FY08
FY09
FY10
FY11
FY12
FY13
FY14
FY15
FY16
FY17
FY18
FY19
FY20E
Growth in system‐wide tonnage Axle‐norm change impact
30

joseph.george@iif lcap.com
India - Auto
Margins typically recover with volumes In autos, margin typically is a function of volumes/demand. After all, pricing power, promotions, operating leverage are all impacted by demand. The factor that complicates matters is the sharp price increases with adoption of BS-VI. We expect margins to bottom out in the Jun-2020 quarter. As highlighted earlier, gasoline PVs are unlikely to be impacted, as the price increase on account of BS-VI would be low. We forecast lower gross margin for 2W players, as we are not building-in any profit margin on the additional BS-VI cost. In case of PVs, fall in discounts (from FY20 high) would more than offset the gross margin impact due to BS-VI. In case of PVs, gross margin expansion would flow through to the Ebitda margin as well. In case of CVs, lower discounts would partly offset the BS-VI impact. We expect slight Ebitda margin improvement in FY21ii, due to the high fixed cost structure. For 2Ws, we expect gross margin contraction to flow through to the Ebitda margin level as well. Fixed cost as a % of revenue is relatively low for 2Ws. Figure 52: BS‐VI cost increase may hurt reported margins
FY21ii vs. FY20ii Gross margin Ebitda margin
Hero MotoCorp ↓ ↓
Bajaj Auto ↓ ↓
Eicher Motors (S) ↓ ↓
TVS Motor ↓ ↓
Maruti Suzuki ↑ ↑
M&M ↓ ↓
Ashok Leyland ↓ ↔
Tata Motors (S) ↓ ↑
Source: IIFL Research
Commodities: Lower steel prices to aid margins In recent quarters, prices of key inputs such as steel and aluminum have come off from their highs. The benefit of fall in aluminum price (more relevant for 2Ws) is visible in 2Q results. However, benefit of fall in steel price would be visible from 3QFY20. Figure 53: Price of key inputs (Steel, Al) have sizeably come off from the FY19 highs
Source: Bloomberg, IIFL Research
60,000
80,000
100,000
120,000
140,000
160,000
20,000
25,000
30,000
35,000
40,000
45,000
50,000
1QFY16
2QFY16
3QFY16
4QFY16
1QFY17
2QFY17
3QFY17
4QFY17
1QFY18
2QFY18
3QFY18
4QFY18
1QFY19
2QFY19
3QFY19
4QFY19
1QFY20
2QFY20
Curren
t
Steel (Rs/MT) ‐ LHS Aluminium (Rs/MT) ‐ RHS
31

joseph.george@iif lcap.com
India - Auto
Figure 54: Key commodities and currencies – Quarterly trend
3QFY18 4QFY18 1QFY19 2QFY19 3QFY19 4QFY19 1QFY20 2QFY20 3QFY20* Current
Commodities
Steel (Rs/MT) 39,331 44,250 45,835 45,673 45,507 41,933 41,277 36,400 34,675 35,750
QoQ chg 3.1% 12.5% 3.6% ‐0.4% ‐0.4% ‐7.9% ‐1.6% ‐11.8% ‐4.3% 3.1%
Aluminium (Rs/MT) 136,832 138,195 151,347 144,173 141,118 131,447 124,435 124,027 125,051 126,338
QoQ chg 5.9% 1.0% 9.5% ‐4.7% ‐2.1% ‐6.9% ‐5.3% ‐0.3% 0.8% 1.0%
Rubber (Rs per quintal) 12,926 12,525 12,367 13,072 12,363 12,564 13,827 14,240 12,592 13,200
QoQ chg ‐2.5% ‐3.1% ‐1.3% 5.7% ‐5.4% 1.6% 10.1% 3.0% ‐11.6% 4.8%
Brent crude (USD/bbl) 61.6 67.2 74.9 75.9 68.1 63.8 68.5 62.0 61.5 63.9
QoQ chg 18.2% 9.1% 11.4% 1.4% ‐10.4% ‐6.2% 7.3% ‐9.5% ‐0.7% 3.9%
Lead (Rs/MT) 160,936 162,016 159,556 146,939 141,936 143,657 130,838 142,999 147,741 134,084
QoQ chg 7.5% 0.7% ‐1.5% ‐7.9% ‐3.4% 1.2% ‐8.9% 9.3% 3.3% ‐9.2%
Copper (Rs/MT) 442,076 447,729 460,635 429,471 444,182 438,634 425,254 408,465 415,065 429,987
QoQ chg 8.4% 1.3% 2.9% ‐6.8% 3.4% ‐1.2% ‐3.1% ‐3.9% 1.6% 3.6%
Currencies
USD‐INR 64.72 64.37 66.99 70.14 72.02 70.50 69.56 70.37 71.25 70.84
QoQ chg 0.7% ‐0.5% 4.1% 4.7% 2.7% ‐2.1% ‐1.3% 1.2% 1.3% ‐0.6%
JPY‐INR 0.57 0.59 0.61 0.63 0.64 0.64 0.63 0.66 0.66 0.65
QoQ chg ‐1.1% 3.8% 3.2% 2.5% 1.6% 0.2% ‐1.1% 3.6% 0.1% ‐0.8%
Source: Bloomberg, IIFL Research; *Note: 3QFY20 average based on the quarter‐to‐date data
Currency The impact from currency depends on whether the OEM is a net importer or exporter. Bajaj and TVS being net exporters would benefit in the event of Rupee depreciation. Maruti and Hero have relatively higher import content (including imports by vendors) and hence would be adversely impacted in the event of Rupee depreciation. Figure 55: Currency − Sensitivity of margin and EPS
OEMs Export vol.
share ~Imports (as
% of revs)
Impact of 5% Rupee depreciation*
on Ebitda margin on EPS
Hero MotoCorp 3% 12% (45) bps ‐4%
Bajaj Auto 46% 3% 213 bps 11%
Eicher Motors 6% 4% 8 bps 0%
TVS Motor 25% 10% 77 bps 15%
Maruti Suzuki 7% 20% (67) bps ‐6%
M&M 6% 2% 21 bps 2%
Ashok Leyland 8% 3% 24 bps 6%
Tata Motors (S) 8% 5% 15 bps NM
Source: IIFL Research; * Note: theoretical, assuming no price adjustments
BS-VI costs As highlighted in the BS-VI section, we forecast flattish gross profit per vehicle, assuming that OEMs would not be in a position to charge a profit margin on the incremental costs. Operating leverage Operating leverage from lower volumes/capacity utilisation hurt margins in FY20ii. We expect this to reverse over FY21-22ii. The apparent operating leverage in FY21ii would be higher, as the revenue line would be bloated due to BS-VI price increase.
32

joseph.george@iif lcap.com
India - Auto
Figure 56: Fixed cost (as % of revenue) to come off across OEMs from FY20 highs
OEMs FY15 FY16 FY17 FY18 FY19 FY20ii FY21ii FY22ii
Hero MotoCorp 16.9% 17.4% 18.7% 17.6% 17.8% 20.2% 17.9% 17.8%
Bajaj Auto 13.2% 13.5% 13.9% 13.0% 12.3% 13.6% 13.2% 13.2%
Eicher Motors (S) 17.8% 18.9% 18.2% 18.8% 21.3% 23.5% 23.2% 22.6%
TVS Motor 22.8% 23.0% 22.4% 21.1% 18.3% 20.6% 19.1% 19.0%
Maruti Suzuki 21.5% 22.2% 19.9% 19.4% 20.7% 22.6% 22.3% 21.5%
M&M 20.9% 21.5% 23.3% 22.1% 21.4% 23.8% 23.3% 23.3%
Ashok Leyland 22.0% 21.0% 22.3% 20.7% 20.2% 25.9% 23.5% 22.0%
Tata Motors (S) 35.2% 30.6% 33.1% 27.0% 23.9% 29.5% 26.5% 24.8%
Source: Company, IIFL Research; Note: Fixed costs include depreciation
Figure 57: Recovery in volumes to drive up margins (operating leverage)
Source: IIFL Research
Lower discounts to aid margins in cars, CVs In case of PVs, discount as a % of ASP is currently at 6-7% vs. 3-4% during periods of good demand. In case of MHCVs, discounts are currently at 10-15% of ASP. Lower discounts would provide a margin kicker when the demand scenario improves. Figure 58: Maruti’s discount trend – Currently at a multi‐year high
Source: Company, IIFL Research
2.4%
0.5% 0.8%1.6%
1.0%0.4%
4.0%4.7%
0%
1%
2%
3%
4%
5%
Hero Bajaj Eicher TVS Maruti M&M Ashok Tamo (S)
Ebit margin benefit due to op. leverage over FY20‐22ii
0%
1%
2%
3%
4%
5%
6%
7%
0
5,000
10,000
15,000
20,000
25,000
30,000
FY11
FY12
FY13
FY14
FY15
FY16
FY17
FY18
FY19
1QFY20
1QFY20
Discounts per vehicle (Rs) ‐ LHS as % of ASP ‐ RHS
33

joseph.george@iif lcap.com
India - Auto
Valuations to remain elevated The auto sector has seen a significant re-rating in the last five years. Valuation multiples in the past five years has been much higher than the 2010-2011 period, despite the fact that the volume growth in recent years has not been able to match the highs of FY10-11. Maruti, Eicher and TVS have seen a sharp re-rating. Figure 59: Maruti, Eicher and TVS have seen a sharp re‐rating
1‐year forward P/E CY10‐14 avg. CY15‐19 avg. Re‐rating
Hero MotoCorp 12.6 15.5 23%
Bajaj Auto 12.8 16.8 31%
Eicher Motors 17.1 29.8 74%
TVS Motor 10.6 26.2 148%
Maruti Suzuki 14.4 22.7 57%
M&M 14.1 18.0 27%
Source: Bloomberg, IIFL Research
Valuation multiples may expand during period of volume/earnings recovery. After almost two weak years (2HFY19-1QFY21), we expect volume growth to pick over the course of FY21. This should drive a re-rating in cheaper names, while in case of already expensive ones, valuations should, at least, hold.
Figure 60: Auto sector volume growth across cycles
Segments FY04 FY05 FY06 FY07 FY08 FY09 FY10 FY11 FY12 FY13 FY14 FY15 FY16 FY17 FY18 FY19 FY20ii FY21ii FY22ii
PVs 28 18 8 21 12 0 26 29 4 3 ‐7 4 7 9 8 3 ‐12 10 12
2Ws 12 16 14 12 ‐8 3 26 26 14 3 7 8 3 7 15 5 ‐12 5 11
3Ws 21 10 17 12 ‐10 ‐4 26 19 ‐2 5 ‐11 11 1 ‐5 24 10 ‐2 0 0
MHCVs 39 23 5 33 0 ‐33 33 32 8 ‐23 ‐25 16 30 0 13 15 ‐35 5 20
LCVs 31 22 20 34 12 ‐7 43 23 30 14 ‐18 ‐12 0 8 25 19 ‐12 3 12
Tractors 12 32 14 19 ‐4 1 32 20 11 ‐2 20 ‐13 ‐10 18 22 10 ‐8 5 5
*Avg. 24 20 13 22 0 ‐7 31 25 11 0 ‐6 2 5 6 18 10 ‐14 5 10
Source: SIAM, Crisil, IIFL Research; *Note: Avg. is a simple average of all segments
Figure 61: We expect sharp improvement in industry Ebitda over FY21‐22ii
Source: IIFL Research
‐40%
‐20%
0%
20%
40%
60%
80%
100%
120%
FY05
FY06
FY07
FY08
FY09
FY10
FY11
FY12
FY13
FY14
FY15
FY16
FY17
FY18
FY19
FY20ii
FY21ii
FY22ii
Sector aggregate Ebitda ‐ YoY growth
34

joseph.george@iif lcap.com
India - Auto
One-year forward P/E valuation charts
Figure 62: Hero MotoCorp Figure 63: Bajaj Auto
Source: Bloomberg, IIFL Research Source: Bloomberg, IIFL Research
Figure 64: Eicher Motors Figure 65: TVS Motor
Source: Bloomberg, IIFL Research Source: Bloomberg, IIFL Research
Figure 66: Maruti Suzuki Figure 67: M&M
Source: Bloomberg, IIFL Research Source: Bloomberg, IIFL Research
6
8
10
12
14
16
18
20
22
Jun‐08
Dec‐08
Jun‐09
Dec‐09
Jun‐10
Dec‐10
Jun‐11
Dec‐11
Jun‐12
Dec‐12
Jun‐13
Dec‐13
Jun‐14
Dec‐14
Jun‐15
Dec‐15
Jun‐16
Dec‐16
Jun‐17
Dec‐17
Jun‐18
Dec‐18
Jun‐19
Dec‐19
P/E 5‐yr avg. +1 S.D. ‐1 S.D.(Hero)
6
8
10
12
14
16
18
20
22
Jun‐08
Dec‐08
Jun‐09
Dec‐09
Jun‐10
Dec‐10
Jun‐11
Dec‐11
Jun‐12
Dec‐12
Jun‐13
Dec‐13
Jun‐14
Dec‐14
Jun‐15
Dec‐15
Jun‐16
Dec‐16
Jun‐17
Dec‐17
Jun‐18
Dec‐18
Jun‐19
Dec‐19
P/E 5‐yr avg. +1 S.D. ‐1 S.D.(Bajaj)
6111621263136414651
Jun‐08
Dec‐08
Jun‐09
Dec‐09
Jun‐10
Dec‐10
Jun‐11
Dec‐11
Jun‐12
Dec‐12
Jun‐13
Dec‐13
Jun‐14
Dec‐14
Jun‐15
Dec‐15
Jun‐16
Dec‐16
Jun‐17
Dec‐17
Jun‐18
Dec‐18
Jun‐19
Dec‐19
P/E 5‐yr avg. +1 S.D. ‐1 S.D.(Eicher)
051015202530354045
Jun‐08
Dec‐08
Jun‐09
Dec‐09
Jun‐10
Dec‐10
Jun‐11
Dec‐11
Jun‐12
Dec‐12
Jun‐13
Dec‐13
Jun‐14
Dec‐14
Jun‐15
Dec‐15
Jun‐16
Dec‐16
Jun‐17
Dec‐17
Jun‐18
Dec‐18
Jun‐19
Dec‐19
P/E 5‐yr avg. +1 S.D. ‐1 S.D.(TVS)
0
5
10
15
20
25
30
35
Jun‐08
Dec‐08
Jun‐09
Dec‐09
Jun‐10
Dec‐10
Jun‐11
Dec‐11
Jun‐12
Dec‐12
Jun‐13
Dec‐13
Jun‐14
Dec‐14
Jun‐15
Dec‐15
Jun‐16
Dec‐16
Jun‐17
Dec‐17
Jun‐18
Dec‐18
Jun‐19
Dec‐19
P/E 5‐yr avg. +1 S.D. ‐1 S.D.(Maruti)
0
5
10
15
20
25
Jun‐08
Dec‐08
Jun‐09
Dec‐09
Jun‐10
Dec‐10
Jun‐11
Dec‐11
Jun‐12
Dec‐12
Jun‐13
Dec‐13
Jun‐14
Dec‐14
Jun‐15
Dec‐15
Jun‐16
Dec‐16
Jun‐17
Dec‐17
Jun‐18
Dec‐18
Jun‐19
Dec‐19
P/E 5‐yr avg. +1 S.D. ‐1 S.D.(M&M)
35
joseph.george@iif lcap.com
India - Auto
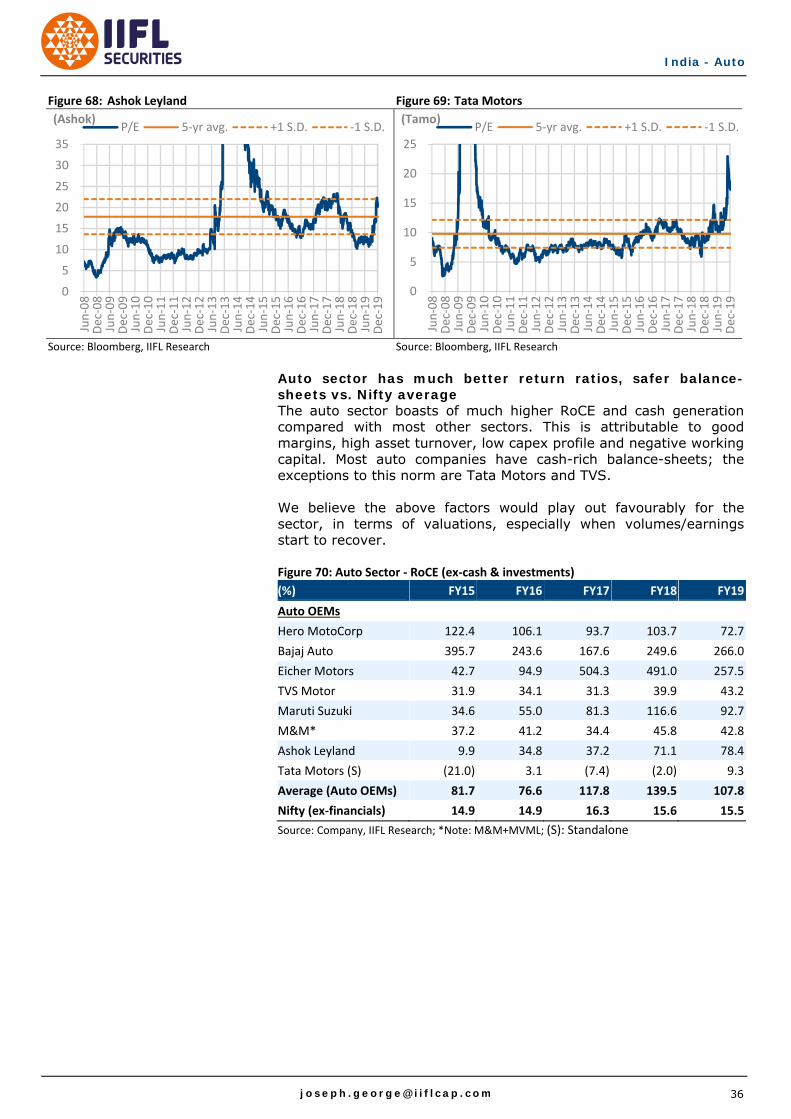
Figure 68: Ashok Leyland Figure 69: Tata Motors
Source: Bloomberg, IIFL Research Source: Bloomberg, IIFL Research
Auto sector has much better return ratios, safer balance-sheets vs. Nifty average The auto sector boasts of much higher RoCE and cash generation compared with most other sectors. This is attributable to good margins, high asset turnover, low capex profile and negative working capital. Most auto companies have cash-rich balance-sheets; the exceptions to this norm are Tata Motors and TVS. We believe the above factors would play out favourably for the sector, in terms of valuations, especially when volumes/earnings start to recover. Figure 70: Auto Sector ‐ RoCE (ex‐cash & investments)
(%) FY15 FY16 FY17 FY18 FY19
Auto OEMs
Hero MotoCorp 122.4 106.1 93.7 103.7 72.7
Bajaj Auto 395.7 243.6 167.6 249.6 266.0
Eicher Motors 42.7 94.9 504.3 491.0 257.5
TVS Motor 31.9 34.1 31.3 39.9 43.2
Maruti Suzuki 34.6 55.0 81.3 116.6 92.7
M&M* 37.2 41.2 34.4 45.8 42.8
Ashok Leyland 9.9 34.8 37.2 71.1 78.4
Tata Motors (S) (21.0) 3.1 (7.4) (2.0) 9.3
Average (Auto OEMs) 81.7 76.6 117.8 139.5 107.8
Nifty (ex‐financials) 14.9 14.9 16.3 15.6 15.5
Source: Company, IIFL Research; *Note: M&M+MVML; (S): Standalone
0
5
10
15
20
25
30
35
Jun‐08
Dec‐08
Jun‐09
Dec‐09
Jun‐10
Dec‐10
Jun‐11
Dec‐11
Jun‐12
Dec‐12
Jun‐13
Dec‐13
Jun‐14
Dec‐14
Jun‐15
Dec‐15
Jun‐16
Dec‐16
Jun‐17
Dec‐17
Jun‐18
Dec‐18
Jun‐19
Dec‐19
P/E 5‐yr avg. +1 S.D. ‐1 S.D.(Ashok)
0
5
10
15
20
25
Jun‐08
Dec‐08
Jun‐09
Dec‐09
Jun‐10
Dec‐10
Jun‐11
Dec‐11
Jun‐12
Dec‐12
Jun‐13
Dec‐13
Jun‐14
Dec‐14
Jun‐15
Dec‐15
Jun‐16
Dec‐16
Jun‐17
Dec‐17
Jun‐18
Dec‐18
Jun‐19
Dec‐19
P/E 5‐yr avg. +1 S.D. ‐1 S.D.(Tamo)
36

joseph.george@iif lcap.com
India - Auto
Figure 71: Auto Sector ‐ RoE (%) FY15 FY16 FY17 FY18 FY19
Auto OEMs
Hero MotoCorp 41.9 41.1 35.7 33.8 27.5
Bajaj Auto 30.7 32.8 25.3 22.7 21.7
Eicher Motors 26.9 34.7 38.1 35.2 27.8
TVS Motor 22.7 27.2 25.6 25.1 21.5
Maruti Suzuki 16.6 20.0 22.2 19.8 17.1
M&M* 16.6 15.8 13.8 14.7 16.6
Ashok Leyland 4.9 22.8 21.6 23.9 27.1
Tata Motors (S) (23.7) 2.3 (10.6) 1.1 11.5
Average (Auto OEMs) 17.1 24.6 21.5 22.0 21.4
Nifty 14.7 15.7 14.7 13.2 13.9
Source: Company, IIFL Research; *Note: M&M+MVML
Figure 72: Auto Sector ‐ FCF (as a % of PAT) (%) FY15 FY16 FY17 FY18 FY19
Auto OEMs
Hero MotoCorp 48 89 93 95 5
Bajaj Auto 75 123 107 127 86
Eicher Motors 31 59 80 93 54
TVS Motor (122) 54 1 3 (20)
Maruti Suzuki 91 154 127 125 58
M&M 21 84 53 61 26
Ashok Leyland 640 149 114 259 (57)
Tata Motors (S) NM NM NM NM 43
Average (Auto OEMs) 112 102 82 109 24
Nifty (ex‐financials) 24 39 21 30 (32)
Source: Company, IIFL Research
Figure 73: Auto Sector ‐ Net debt‐to‐equity (x) FY15 FY16 FY17 FY18 FY19
Auto OEMs
Hero MotoCorp (0.5) (0.5) (0.5) (0.6) (0.4)
Bajaj Auto (0.8) (0.7) (0.8) (0.9) (0.9)
Eicher Motors (0.6) (0.5) (0.6) (0.7) (0.6)
TVS Motor 0.6 0.4 0.4 0.4 0.4
Maruti Suzuki (0.5) (0.6) (0.7) (0.8) (0.8)
M&M (0.0) (0.1) (0.1) (0.1) (0.1)
Ashok Leyland 0.5 0.2 0.1 (0.4) (0.1)
Tata Motors (S) 1.4 0.7 0.9 0.9 0.8
Average (Auto OEMs) 0.0 (0.2) (0.2) (0.3) (0.2)
Nifty (ex‐financials) 0.4 0.4 0.4 0.5 0.5
Source: Company, IIFL Research
37
joseph.george@iif lcap.com
India - Auto
This page is kept blank intentionally
38

joseph.george@iif lcap.com
India - Auto
Companies
39

joseph.george@iif lcap.com
India - Auto
This page is kept blank intentionally
40

CMP Rs7242
Target 12m Rs9000 (24%)
Market cap (US$ m) 30,792
Enterprise value (US$ m) 25,793
Bloomberg MSIL IN
Sector Auto
Dec 18 2019 52Wk High/Low (Rs) 7950/5446
Shares o/s (m) 302
Daily volume (US$ m) 123
Dividend yield FY21ii (%) 1.0
Free float (%) 43.8
Shareholding pattern (%)
Promoter 56.2
‐‐‐Pledged (as % of promoter share)
0.0
FII 23.4
DII 15.0
Price performance (%)
1M 3M 1Y
Maruti Suzuki 2.0 18.8 (6.8)
Absolute (US$) 3.2 19.1 (6.4)
Rel. to Sensex (1.1) 5.2 (21.2)
CAGR (%) 3 yrs 5 yrs
EPS 11.8 21.0
Stock movement
Joseph George [email protected] 91 22 4646 4667 Suraj Chheda [email protected] 91 22 4646 4656
www.iiflcap.com
0
5,000
10,000
15,000
0
2,000
4,000
6,000
Dec‐17
Feb‐18
Apr‐18
Jun‐18
Aug‐18
Oct‐18
Dec‐18
Feb‐19
Apr‐19
Jun‐19
Aug‐19
Oct‐19
Dec‐19
Vol('000, LHS) Price (Rs., RHS)
Financial summary (Rs m)Y/e 31 Mar, Parent FY18A FY19A FY20ii FY21ii FY22iiRevenues (Rs m) 797,627 860,203 810,130 885,887 1,018,033 Ebitda margins (%) 15.1 12.8 10.3 11.9 13.0 Pre‐exceptional PAT (Rs m) 77,218 75,006 60,225 71,431 90,829 Reported PAT (Rs m) 77,218 75,006 60,225 71,431 90,829 Pre‐exceptional EPS (Rs) 255.6 248.3 199.4 236.5 300.7 Growth (%) 5.1 (2.9) (19.7) 18.6 27.2 IIFL vs consensus (%) (3.3) (10.4) (6.8) PER (x) 28.3 29.2 36.3 30.6 24.1 ROE (%) 19.8 17.1 12.6 13.8 15.9 Net debt/equity (x) (0.8) (0.8) (0.8) (0.8) (0.9) EV/Ebitda (x) 15.3 16.7 21.6 16.4 12.5 Price/book (x) 5.2 4.7 4.4 4.0 3.6 OCF/Ebitda (x) 1.0 0.6 0.9 1.0 0.9 Source: Company, IIFL Research. Price as at close of business on 18 December 2019.
Maruti Suzuki BUY
A leader by far We expect PV volumes to clock an 11% Cagr over FY20-23ii, after a 12% drop in FY20ii. With ~50% share in PVs, Maruti would be the best play on recovery. Earnings growth in the recovery phase would be magnified by margin expansion, as discounts come off and operating leverage on fixed costs kick in. We forecast 23% EPS growth over the next two years. Overall competitive intensity in the PV industry is benign, with many multi-national OEMs losing relevance in the Indian market. Although Maruti is trading at a premium to the sector, we expect valuations to hold in the recovery phase.
Sharp earnings growth in an up-cycle: Maruti's Ebitda margin is down from an average of 15% over 2HFY15-1HFY19, to ~10% in recent quarters. This is a result of sharp increase in discounts and negative impact of operating leverage. As volume growth comes back, we expect the above factors to reverse. We forecast a 23% EPS Cagr with a 10% volume Cagr and 300bps margin expansion from current levels.
Overall competitive intensity benign, but slight market-share pressure possible in the near-term: Over the past few years, many multi-national brands have lost relevance in India (GM, Fiat, Ford, VW, Skoda, Nissan). Many others are consistently losing share (M&M, Honda). The only serious competition for Maruti seems to be from Hyundai and new entrant Kia. That said, we believe there may be some pressure on Maruti’s reported market-share in the near-term due to i) its decision to exit the <1.3L diesel segment, ii) high growth in the SUV market, where Maruti has a relatively lesser presence, and iii) cross-badging arrangement with Toyota.
Premium multiples to hold: Maruti has seen sharp re-rating in recent years (3-year avg. P/E 25x) due to i) Maruti’s market dominance, and ii) better cash flow profile (FCFF = PAT), as Suzuki has been taking care of expansion capex. Valuations did not contract in 2019, despite the sharp down-cycle in the auto sector. Going into FY21ii, if volumes / earnings were to recover, we see no reason for valuations to contract.
41

joseph.george@iif lcap.com
Maruti Suzuki – BUY
Maruti’s PV market-share saw sharp improvement from ~38% in FY12 to ~51% in FY19. Although competitive dynamics in the industry remain largely benign, we expect market-share to come off slightly over FY19-21ii, for reasons explained earlier. This may be averted, if Maruti comes out with diesel variants in FY21 and/or if they launch new models successfully. Figure 1.1: We expect Maruti’s overall PV market share to come off slightly vs. FY19
Source: SIAM, IIFL Research; *Note: Maruti’s PV market share excludes supplies to Toyota
Rupee depreciation vs. Yen may have an adverse impact on margins in 3QFY20 (1-quarter lag), but may stabilise thereon if Rupee holds. Figure 1.2: Average JPY‐INR quarterly trend
Source: Bloomberg, IIFL Research
Figure 1.3: We expect ~300bps margin expansion owing to volume recovery
Source: Company, IIFL Research
38.4% 39.1%42.1%
45.0% 46.8% 47.4% 50.0% 51.2% 49.9% 48.7%
1.8% 14.3%11.6% 12.3%
16.1%
25.7% 27.5% 28.1%24.3%
19.1%
44.4% 45.6%50.2%
53.8% 55.0% 54.6%58.7% 60.2% 63.4% 63.0%
0%
10%
20%
30%
40%
50%
60%
70%
FY12 FY13 FY14 FY15 FY16 FY17 FY18 FY19 FY20ii FY21ii
Overall PVs* UVs PVs (ex‐UVs)(Maruti mkt share)
0.62 0.59 0.58 0.58 0.570.59 0.61 0.63 0.64 0.64 0.63
0.66 0.65
0.30
0.40
0.50
0.60
0.70
3QFY17
4QFY17
1QFY18
2QFY18
3QFY18
4QFY18
1QFY19
2QFY19
3QFY19
4QFY19
1QFY20
2QFY20
Curren
t
JPY‐INR average
13.4%15.4% 15.2% 15.1% 15.1%
10.2% 10.0% 10.5%
11.9%13.0%
0%
2%
4%
6%
8%
10%
12%
14%
16%
18%
FY15 FY16 FY17 FY18 1H19 2H19 1H20 2H20ii FY21ii FY22ii
Ebitda margin (%)
42

Maruti Suzuki – BUY
joseph.george@iif lcap.com
We expect Maruti’s Ebitda margin to improve from ~10% to ~13% over the next two years. Better demand environment would bring with it lower discounts/promotions and positive operating leverage. Figure 1.4: Strong FCF generation, as Suzuki is incurring expansion capex
Source: Company, IIFL Research
Expect 23% EPS Cagr over FY20-22ii Our forecast of 23% EPS Cagr over FY20-22ii is driven by a 10% volume Cagr and 300bps margin expansion from current levels. Figure 1.5: Maruti Suzuki – Summary of estimates
Financials (in Rs mn) FY18 FY19 FY20ii FY21ii FY22ii
Domestic volumes 1,653,500 1,753,700 1,537,280 1,661,071 1,871,472
Volume growth (%) 14.5% 6.1% ‐12.3% 8.1% 12.7%
Export volumes 126,074 108,749 107,174 115,748 125,008
Volume growth (%) 1.6% ‐13.7% ‐1.4% 8.0% 8.0%
Total Volume 1,779,574 1,862,449 1,644,453 1,776,819 1,996,480
Volume growth (%) 13.4% 4.7% ‐11.7% 8.0% 12.4%
ASP growth (%) 2.4% 0.5% 5.1% 1.1% 2.3%
Revenue 797,627 860,203 810,130 885,887 1,018,033
Revenue growth (%) 17.2% 7.8% ‐5.8% 9.4% 14.9%
EBITDA 120,615 109,993 83,253 105,731 132,804
EBITDA margin (%) 15.1% 12.8% 10.3% 11.9% 13.0%
PAT 77,218 75,006 60,225 71,431 90,829
PAT growth (%) 5.1% ‐2.9% ‐19.7% 18.6% 27.2%
EPS (Rs) 255.6 248.3 199.4 236.5 300.7
Source: Company, IIFL Research
0%
50%
100%
150%
200%
0
20
40
60
80
100
120
FY12
FY13
FY14
FY15
FY16
FY17
FY18
FY19
FY20ii
FY21ii
FCF (Rs mn) ‐ LHS FCF (as % of PAT) ‐ RHS
43

joseph.george@iif lcap.com
Maruti Suzuki – BUY
Company snapshot
PER
EV/Ebitda
‐10%
‐5%
0%
5%
10%
15%
0.0
0.5
1.0
1.5
2.0
2.5
3.0
3.5
4.0
FY12
FY13
FY14
FY15
FY16
FY17
FY18
FY19
Domestic PV industry volumes
Domestic PV Industry YoY growth
(mn units)
1.0
5.0
9.0
13.0
17.0
21.0
25.0
29.0
Apr‐08 Aug‐10 Dec‐12 Apr‐15 Aug‐17 Dec‐19
12m fwd EV/EBITDA Avg +/‐ 1SD
(x)
3.0
10.0
17.0
24.0
31.0
38.0
45.0
Apr‐08 Aug‐10 Dec‐12 Apr‐15 Aug‐17 Dec‐19
12m fwd PE Avg +/‐ 1SD
(x)
Domestic94%
Exports6%
Volume break-up (%) - FY19
Assumptions Y/e 31 Mar, Parent
FY18A FY19A FY20ii FY21ii FY22ii
Domestic volumes 1,653,500 1,753,700 1,537,280 1,661,071 1,871,472
YoY growth (%) 14.5 6.1 (12.3) 8.1 12.7
Export volumes 126,074 108,749 107,174 115,748 125,008
YoY growth (%) 1.6 (13.7) (1.4) 8.0 8.0
Total volumes 1,779,574 1,862,449 1,644,453 1,776,819 1,996,480
YoY growth (%) 13.4 4.7 (11.7) 8.0 12.4
Source: Company, IIFL Research
Management Name Designation
R C Bhargava Chairman
Kenichi Ayukawa MD & CEO
Ajay Seth CFO
Background: Maruti Suzuki is India’s largest passenger-car company, accounting for ~50% of domestic market share. It is a subsidiary of Suzuki Motor Corporation of Japan. The Indian market is dominated by compact cars and Maruti dominates this market by virtue of Suzuki’s expertise in small cars. The company has two manufacturing facilities at Gurgaon and Manesar, south of New Delhi, India. The two facilities have a combined capacity to produce ~1.6 million vehicles. In addition, Suzuki has set up a plant in Gujarat with phase-I capacity of 250k units. Phase-II with another 250k units capacity also became operational from early CY19. This plant will supply cars exclusively to Maruti.
44

Maruti Suzuki – BUY
joseph.george@iif lcap.com
Income statement summary (Rs m)
Y/e 31 Mar, Parent FY18A FY19A FY20ii FY21ii FY22ii
Revenues 797,627 860,203 810,130 885,887 1,018,033
Ebitda 120,615 109,993 83,253 105,731 132,804
Depreciation and amortisation (27,579) (30,189) (37,439) (43,328) (49,828)
Ebit 93,036 79,804 45,814 62,403 82,976
Non‐operating income 20,455 25,610 33,391 31,263 35,719
Financial expense (3,457) (758) (1,496) (1,496) (1,496)
PBT 110,034 104,656 77,710 92,169 117,198
Exceptionals 0 0 0 0 0
Reported PBT 110,034 104,656 77,710 92,169 117,198
Tax expense (32,816) (29,650) (17,485) (20,738) (26,370)
PAT 77,218 75,006 60,225 71,431 90,829
Minorities, Associates etc. 0 0 0 0 0
Attributable PAT 77,218 75,006 60,225 71,431 90,829
Ratio analysis
Y/e 31 Mar, Parent FY18A FY19A FY20ii FY21ii FY22ii
Per share data (Rs)
Pre‐exceptional EPS 255.6 248.3 199.4 236.5 300.7
DPS 80.0 80.0 65.0 75.0 95.0
BVPS 1382.3 1527.5 1630.8 1789.3 2000.0
Growth ratios (%)
Revenues 17.2 7.8 (5.8) 9.4 14.9
Ebitda 16.5 (8.8) (24.3) 27.0 25.6
EPS 5.1 (2.9) (19.7) 18.6 27.2
Profitability ratios (%)
Ebitda margin 15.1 12.8 10.3 11.9 13.0
Ebit margin 11.7 9.3 5.7 7.0 8.2
Tax rate 29.8 28.3 22.5 22.5 22.5
Net profit margin 9.7 8.7 7.4 8.1 8.9
Return ratios (%)
ROE 19.8 17.1 12.6 13.8 15.9
ROCE 28.4 23.6 16.4 17.9 20.5
Solvency ratios (x)
Net debt‐equity (0.8) (0.8) (0.8) (0.8) (0.9)
Net debt to Ebitda (2.8) (3.2) (4.7) (4.2) (4.0)
Interest coverage 26.9 NM 30.6 41.7 NM
Source: Company, IIFL Research
Financial summary
45

joseph.george@iif lcap.com
Maruti Suzuki – BUY
Balance sheet summary (Rs m)
Y/e 31 Mar, Parent FY18A FY19A FY20ii FY21ii FY22ii
Cash & cash equivalents 341,531 356,599 393,049 450,544 527,688
Inventories 31,608 33,257 32,083 34,547 39,501
Receivables 14,618 23,104 18,988 18,439 21,190
Other current assets 39,013 35,939 33,334 36,417 41,849
Creditors 104,970 96,330 90,723 99,206 114,005
Other current liabilities 64,461 64,437 74,935 87,747 99,760
Net current assets 257,339 288,132 311,796 352,994 416,463
Fixed assets 151,732 165,568 173,129 179,801 179,973
Intangibles 3,117 4,511 4,511 4,511 4,511
Investments 12,082 10,340 10,340 10,340 10,340
Other long‐term assets 0 0 0 0 0
Total net assets 424,270 468,551 499,776 547,646 611,287
Borrowings 1,108 1,496 1,496 1,496 1,496
Other long‐term liabilities 5,589 5,640 5,640 5,640 5,640
Shareholders equity 417,573 461,415 492,640 540,510 604,151
Total liabilities 424,270 468,551 499,776 547,646 611,287
Cash flow summary (Rs m)
Y/e 31 Mar, Parent FY18A FY19A FY20ii FY21ii FY22ii
Ebit 93,036 79,804 45,814 62,403 82,976
Tax paid (30,550) (31,428) (17,485) (20,738) (26,370)
Depreciation and amortization 27,579 30,189 37,439 43,328 49,828
Net working capital change 28,058 (13,196) 12,785 16,298 13,675
Other operating items (273) 563 0 0 0
Operating cash flow before interest
117,850 65,932 78,554 101,291 120,109
Financial expense (3,464) (732) (1,496) (1,496) (1,496)
Non‐operating income 878 1,328 33,391 31,263 35,719
Operating cash flow after interest 115,264 66,528 110,449 131,058 154,331
Capital expenditure (38,653) (47,000) (45,000) (50,000) (50,000)
Long‐term investments (3,456) 1,742 0 0 0
Others 23,050 22,544 0 0 0
Free cash flow 96,205 43,814 65,449 81,058 104,331
Equity raising 0 0 0 0 0
Borrowings (3,728) 388 0 0 0
Dividend (27,268) (29,134) (29,000) (23,562) (27,187)
Net chg in cash and equivalents 65,209 15,068 36,450 57,495 77,144
Source: Company, IIFL Research
46

CMP Rs80
Target 12m Rs105 (31%)
Market cap (US$ m) 3,302
Enterprise value (US$ m) 3,197
Bloomberg AL IN
Sector Auto
Dec 18 2019 52Wk High/Low (Rs) 109/57
Shares o/s (m) 2936
Daily volume (US$ m) 34
Dividend yield FY21ii (%) 1.3
Free float (%) 48.9
Shareholding pattern (%)
Hinduja Group 51.1
‐‐‐Pledged (as % of promoter share)
9.3
FIIs 17.1
Domestic MFs 13.0
Price performance (%)
1M 3M 1Y
Ashok Leyland (2.7) 33.9 (23.8)
Absolute (US$) (1.6) 34.3 (21.4)
Rel. to Sensex (5.9) 20.3 (38.1)
CAGR (%) 3 yrs 5 yrs
EPS 18.1 NA
Stock movement
Joseph George [email protected] 91 22 4646 4667 Suraj Chheda [email protected] 91 22 4646 4656
www.iiflcap.com
0
50
100
150
200
0
50,000
100,000
150,000
200,000
Dec‐17
Feb‐18
Apr‐18
Jun‐18
Aug‐18
Oct‐18
Dec‐18
Feb‐19
Apr‐19
Jun‐19
Aug‐19
Oct‐19
Dec‐19
Vol('000, LHS) Price (Rs., RHS)
Financial summary (Rs m)Y/e 31 Mar, Parent FY18A FY19A FY20ii FY21ii FY22iiRevenues (Rs m) 262,479 290,550 202,092 240,758 302,089 Ebitda margins (%) 10.4 10.8 7.1 7.1 9.7 Pre‐exceptional PAT (Rs m) 15,748 20,407 5,924 6,888 15,521 Reported PAT (Rs m) 15,626 19,832 5,074 6,888 15,521 Pre‐exceptional EPS (Rs) 5.4 7.0 2.0 2.3 5.3 Growth (%) 24.0 29.2 (71.0) 16.3 125.3 IIFL vs consensus (%) (40.0) (39.6) 0.0 PER (x) 14.9 11.5 39.6 34.1 15.1 ROE (%) 23.9 27.1 7.8 9.2 18.7 Net debt/equity (x) (0.4) (0.1) 0.1 0.0 (0.1) EV/Ebitda (x) 7.4 7.2 16.7 13.9 7.7 Price/book (x) 3.3 3.0 3.2 3.0 2.6 OCF/Ebitda (x) 2.0 (0.1) 1.0 1.0 0.9 Source: Company, IIFL Research. Price as at close of business on 18 December 2019.
Ashok Leyland BUY
Expect CV cycle to turn positive in 2QFY21 We expect the MHCV cycle to turn positive in 2QFY21, after seven quarters of YoY decline. Uptick in the CV cycle would bring in an improved mix (higher tonnage trucks), lower discounts and operating leverage. Picking-up of non-domestic CV revenues (exports, defence, engines, etc) will be an added benefit. In the interim (4QFY20-1QFY21), we may see continued pressure on volumes and margins (BS-VI). 1QFY21 may most likely mark the bottom, from a volume and margin perspective. We upgrade Ashok Leyland to BUY with a TP of Rs105. As it did in the previous up-cycles, valuation may expand if demand revives.
Expect MHCV cycle to turn positive in 2QFY21: This is based on TTM MHCV volumes bottoming out at 55-60% of the previous peak (as it did in previous down-cycles), as well as on hopes of improvement in the overall economy. The next six months may be challenging due to the impending transition to BS-VI. Vehicle prices may go up 10-15% post BS-VI, which may take some time to absorb.
Up-cycle should bring better mix, lower discounts, operating leverage: In FY20ii, MHCV truck volumes may decline up to 37%; however, decline in tonnage would be almost 45%, as higher-tonnage trucks see larger cuts. We expect this to reverse in the up-cycle, with better growth in higher-tonnage trucks. This would drive up ASPs. Discount per vehicle, which is currently at a multi-year high, is likely to come off as demand improves. This along with operating leverage on high growth is likely to bring in significant margin expansion. Although the full benefit of this virtuous cycle would be visible in full-year numbers only in FY22ii, we expect it to become visible in quarterly numbers starting 2QFY21.
Pick-up in non-domestic CV revenue to aid growth: Ashok Leyland’s non-domestic CV revenue (especially exports, defence) has been weak since FY18. Export volumes declined 24% in FY19 and a further 15% in FY20ii. Management indicated that export volumes have bottomed out and should start seeing growth very soon. Defence revenue is also down substantially (60-70%) vs. FY18. A pick up in these segments would add to the growth from domestic CVs.
47

joseph.george@iif lcap.com
Ashok Leyland – BUY
We expect the MHCV cycle to turn positive in 2QFY21, after seven quarters of YoY decline. Figure 2.1: MHCV industry in a steep down‐cycle; expect recovery starting 2QFY21
Source: SIAM, IIFL Research
Operating leverage on volume growth, lower discounts and pick up in non-CV revenue should push up margins close to 10% by FY22ii. Figure 2.2: AL’s Ebitda margin could see marked improvement in FY22ii
Source: Company, IIFL Research
Despite being a late entrant, Ashok has been able to improve its LCV market share steadily, from 6% in FY14 to ~9% currently. Figure 2.3: AL is consistently gaining share in the LCV segment
Source: SIAM, IIFL Research
‐60%‐40%‐20%0%20%40%60%80%100%
0
20,000
40,000
60,000
80,000
100,000
120,000
140,000
3QFY18
4QFY18
1QFY19
2QFY19
3QFY19
4QFY19
1QFY20
2QFY20
3QFY20E
4QFY20E
1QFY21E
2QFY21E
3QFY21E
4QFY21E
MHCV industry volumes (LHS) YoY growth % (RHS)
7.6%
11.9%10.9% 10.4% 10.8%
7.1% 7.1%
9.7%
0%
5%
10%
15%
20%
25%
30%
35%
0%
2%
4%
6%
8%
10%
12%
14%
FY15 FY16 FY17 FY18 FY19 FY20ii FY21ii FY22ii
Ebitda margin (LHS) Gross margin (RHS)
6.3% 6.7%7.4% 7.5%
8.2%8.6% 9.1%
0.0%
2.0%
4.0%
6.0%
8.0%
10.0%
0
10,000
20,000
30,000
40,000
50,000
60,000
FY14 FY15 FY16 FY17 FY18 FY19 FY20ii
Domestic LCV volumes (LHS) Market share (RHS)
48

Ashok Leyland – BUY
joseph.george@iif lcap.com 3
Export volumes declined by 24% in FY19 and a further 15% in FY20ii. Management indicated that export volumes have bottomed out and should start to see growth very soon. Figure 2.4: AL’s export volumes have been declining since 2QFY19
Source: SIAM, IIFL Research
Defense revenue (high-margin) has also seen a sharp decline from FY18 levels. Pick-up in new orders may bring in a revival in the segment. Figure 2.5: AL’s Defence revenue is down substantially, from FY18 levels
Source: IIFL Research
Figure 2.6: Ashok Leyland – Summary of estimates
Financials (in Rs mn) FY18 FY19 FY20ii FY21ii FY22ii
M&HCV volumes 131,432 142,858 91,760 96,808 118,156
% growth 16.0% 8.7% ‐35.8% 5.5% 22.1%
LCV volumes 43,419 54,508 51,275 52,238 58,507
% growth 36.6% 25.5% ‐5.9% 1.9% 12.0%
Revenues 262,479 290,550 202,092 240,758 302,089
% growth 30.3% 10.7% ‐30.4% 19.1% 25.5%
EBITDA 27,390 31,357 14,406 17,038 29,440
EBITDA margin 10.4% 10.8% 7.1% 7.1% 9.7%
PAT 15,748 20,407 5,924 6,888 15,521
EPS (Rs) 5.4 7.0 2.0 2.3 5.3
EPS growth 24.0% 29.2% ‐71.0% 16.3% 125.3%
Source: Company, IIFL Research
‐80%
‐60%
‐40%
‐20%
0%
20%
40%
60%
0
1,000
2,000
3,000
4,000
5,000
1QFY18
2QFY18
3QFY18
4QFY18
1QFY19
2QFY19
3QFY19
4QFY19
1QFY20
2QFY20
AL export volumes (LHS) YoY growth (RHS)
0
500
1,000
1,500
2,000
2,500
3,000
1QFY18
2QFY18
3QFY18
4QFY18
1QFY19
2QFY19
3QFY19
4QFY19
1QFY20
2QFY20
Defense revenues (Rs mn)
49

joseph.george@iif lcap.com
Ashok Leyland – BUY
Company snapshot
PE chart
EV/Ebitda
‐30%
‐20%
‐10%
0%
10%
20%
30%
40%
0.00.10.10.20.20.30.30.40.40.5
FY12
FY13
FY14
FY15
FY16
FY17
FY18
FY19
Domestic MHCV volumesDomestic M&HCV Industry
YoY growth (RHS)
mn units
3.0
11.0
19.0
27.0
35.0
43.0
51.0
59.0
Apr‐08 Aug‐10 Dec‐12 Apr‐15 Aug‐17 Dec‐19
12m fwd EV/EBITDA Avg +/‐ 1SD
(x)
0.0
15.0
30.0
45.0
60.0
75.0
90.0
Apr‐08 Aug‐10 Dec‐12 Apr‐15 Aug‐17 Dec‐19
12m fwd PE Avg +/‐ 1SD
(x)
Domestic MHCV67%
Domestic LCVs27%
Exports6%
Volume break-up (%) - FY19
Assumptions Y/e 31 Mar, Parent FY18A FY19A FY20ii FY21ii FY22ii
Domestic volumes 116,534 131,936 83,249 87,276 107,480
% Growth 13.9 13.2 (36.9) 4.8 23.1
Export volumes 14,898 10,922 8,511 9,532 10,676
% Growth 35.7 (26.7) (22.1) 12.0 12.0
Total volumes 131,432 142,858 91,760 96,808 118,156
% Growth 16.0 8.7 (35.8) 5.5 22.1
Source: Company, IIFL Research
Management Name Designation
Dheeraj G. Hinduja Chairman
Vipin Sondhi CEO & MD
Gopal Mahadevan CFO
Background: Ashok Leyland (AL), part of the Hinduja Group, is one of India's leading manufacturers of commercial vehicles such as trucks, buses, tippers, trailers and Defence vehicles. It is the second-largest player in the medium & heavy trucks segment in India, with market share of ~33%. AL is one of the leading players in heavy buses with market share of ~43%. The company also manufactures and sells engines for industrial and marine applications, spare parts and special alloy castings. AL currently operates six manufacturing facilities with combined capacity of about 230,000 vehicles, — three in Tamil Nadu, and one each in Maharashtra, and Rajasthan and Uttarakhand.
50

Ashok Leyland – BUY
joseph.george@iif lcap.com 5
Income statement summary (Rs m)
Y/e 31 Mar, Parent FY18A FY19A FY20ii FY21ii FY22ii
Revenues 262,479 290,550 202,092 240,758 302,089
Ebitda 27,390 31,357 14,406 17,038 29,440
Depreciation and amortisation (5,546) (6,210) (6,589) (7,416) (8,135)
Ebit 21,844 25,147 7,818 9,622 21,305
Non‐operating income 1,898 1,099 1,000 1,000 1,000
Financial expense (1,312) (704) (1,017) (782) (132)
PBT 22,429 25,543 7,800 9,840 22,173
Exceptionals (122) (575) (849) 0 0
Reported PBT 22,307 24,968 6,951 9,840 22,173
Tax expense (6,681) (5,136) (1,877) (2,952) (6,652)
PAT 15,626 19,832 5,074 6,888 15,521
Minorities, Associates etc. 0 0 0 0 0
Attributable PAT 15,626 19,832 5,074 6,888 15,521
Ratio analysis
Y/e 31 Mar, Parent FY18A FY19A FY20ii FY21ii FY22ii
Per share data (Rs)
Pre‐exceptional EPS 5.4 7.0 2.0 2.3 5.3
DPS 2.4 3.1 0.8 1.0 2.0
BVPS 24.5 26.9 24.9 26.2 30.3
Growth ratios (%)
Revenues 30.3 10.7 (30.4) 19.1 25.5
Ebitda 24.4 14.5 (54.1) 18.3 72.8
EPS 24.0 29.2 (71.0) 16.3 125.3
Profitability ratios (%)
Ebitda margin 10.4 10.8 7.1 7.1 9.7
Ebit margin 8.3 8.7 3.9 4.0 7.1
Tax rate 30.0 20.6 27.0 30.0 30.0
Net profit margin 6.0 6.8 2.5 2.9 5.1
Return ratios (%)
ROE 23.9 27.1 7.8 9.2 18.7
ROCE 28.4 30.5 10.2 12.4 25.7
Solvency ratios (x)
Net debt‐equity (0.4) (0.1) 0.1 0.0 (0.1)
Net debt to Ebitda (1.1) (0.2) 0.4 0.1 (0.3)
Interest coverage 16.6 35.7 7.7 12.3 NM
Source: Company, IIFL Research
Financial summary
51

joseph.george@iif lcap.com
Ashok Leyland – BUY
Balance sheet summary (Rs m)
Y/e 31 Mar, Parent FY18A FY19A FY20ii FY21ii FY22ii
Cash & cash equivalents 40,596 13,736 3,495 3,776 4,985
Inventories 17,099 26,847 19,433 23,910 29,376
Receivables 9,805 25,057 12,181 14,511 18,208
Other current assets 17,132 27,518 14,146 16,853 21,146
Creditors 46,586 50,189 34,909 41,588 52,183
Other current liabilities 34,620 39,910 23,544 30,175 36,112
Net current assets 3,426 3,059 (9,198) (12,713) (14,579)
Fixed assets 47,682 50,806 58,218 60,802 62,666
Intangibles 6,072 7,416 7,416 7,416 7,416
Investments 27,475 26,365 28,365 30,365 32,365
Other long‐term assets 0 0 0 0 0
Total net assets 84,655 87,646 84,800 85,870 87,868
Borrowings 10,023 6,324 9,324 6,324 (3,676)
Other long‐term liabilities 2,984 2,497 2,497 2,497 2,497
Shareholders equity 71,648 78,825 72,980 77,049 89,047
Total liabilities 84,655 87,646 84,800 85,870 87,868
Cash flow summary (Rs m)
Y/e 31 Mar, Parent FY18A FY19A FY20ii FY21ii FY22ii
Ebit 21,844 25,147 7,818 9,622 21,305
Tax paid (4,149) (5,603) (1,877) (2,952) (6,652)
Depreciation and amortization 5,546 6,210 6,589 7,416 8,135
Net working capital change 29,622 (29,638) 2,016 3,796 3,075
Other operating items 1,321 260 (849) 0 0
Operating cash flow before interest
54,184 (3,624) 13,696 17,882 25,864
Financial expense (1,464) (1,029) (1,017) (782) (132)
Non‐operating income 550 401 1,000 1,000 1,000
Operating cash flow after interest 53,269 (4,251) 13,679 18,099 26,731
Capital expenditure (5,321) (7,315) (14,000) (10,000) (10,000)
Long‐term investments (7,023) (523) (2,000) (2,000) (2,000)
Others (72) 362 0 0 0
Free cash flow 40,853 (11,727) (2,321) 6,099 14,731
Equity raising 46 86 0 0 0
Borrowings (12,700) (6,621) 3,000 (3,000) (10,000)
Dividend (5,495) (8,598) (10,920) (2,818) (3,523)
Net chg in cash and equivalents 22,704 (26,860) (10,241) 281 1,209
Source: Company, IIFL Research
52

CMP Rs175
Target 12m Rs220 (26%)
Market cap (US$ m) 8,670
Enterprise value (US$ m) 17,515
Bloomberg TTMT IN
Sector Auto
Dec 18 2019 52Wk High/Low (Rs) 239/106
Shares o/s (m) 2887
Daily volume (US$ m) 97
Dividend yield FY21ii (%) 0.6
Free float (%) 63.6
Shareholding pattern (%)
Promoter 36.4
‐‐‐Pledged (as % of promoter share)
4.0
FII 19.7
DII 19.0
Price performance (%)
1M 3M 1Y
Tata Motors 2.7 43.5 0.0
Absolute (US$) 3.9 43.9 (0.9)
Rel. to Sensex (0.5) 29.8 (14.4)
CAGR (%) 3 yrs 5 yrs
EPS (51.4) (35.8)
Stock movement
Joseph George [email protected] 91 22 4646 4667 Suraj Chheda [email protected] 91 22 4646 4656
www.iiflcap.com
0
100
200
300
400
500
0
50,000
100,000
150,000
200,000
250,000
Dec‐17
Feb‐18
Apr‐18
Jun‐18
Aug‐18
Oct‐18
Dec‐18
Feb‐19
Apr‐19
Jun‐19
Aug‐19
Oct‐19
Dec‐19
Vol('000, LHS) Price (Rs., RHS)
Financial summary (Rs m)Y/e 31 Mar, Consolidated FY18A FY19A FY20ii FY21ii FY22iiRevenues (Rs m) 2,915,505 3,019,384 2,877,034 3,158,730 3,448,650 Ebitda margins (%) 11.8 9.9 12.0 12.9 13.9 Pre‐exceptional PAT (Rs m) 63,035 17,312 13,857 49,905 81,220 Reported PAT (Rs m) 89,889 (288,262) 9,747 49,905 81,220 Pre‐exceptional EPS (Rs) 18.6 5.1 3.9 13.7 22.2 Growth (%) (38.5) (72.5) (22.9) 247.3 62.7 IIFL vs consensus (%) 48.0 12.4 9.3 PER (x) 9.4 34.3 44.4 12.8 7.9 ROE (%) 8.7 2.4 2.4 8.0 11.9 Net debt/equity (x) 0.4 1.2 1.2 1.2 1.0 EV/Ebitda (x) 2.9 4.2 3.8 3.4 2.9 Price/book (x) 0.6 1.1 1.0 1.0 0.9 OCF/Ebitda (x) 0.7 0.6 1.0 1.0 0.9 Source: Company, IIFL Research. Price as at close of business on 18 December 2019.
Tata Motors BUY
JLR and India business set to recover JLR’s earnings is on an upward trajectory, with China volumes growing in strong double-digits and Ebitda margins showing sharp YoY improvement. The margin improvement in JLR is a result of uptick in volumes and cost rationalisation, and appears sustainable. We believe JLR’s Sep-2019 debt would be its peak debt, with strong positive FCFF expected in 2HFY20 (seasonal) as well as rationalisation in capex and working capital. In the India business, we believe volumes/margins would bottom out in 1QFY21 and expect growth to be driven by an up-cycle in MHCVs. With both JLR and the India business on a growth path, we expect consolidated EPS to rise 5x over FY20-22ii.
JLR recovery gathers steam: JLR had marked a turnaround in volumes starting Jul-2019, when its China sales started growing YoY, after declining 40% on an average for 12 months. JLR’s 2Q result has exhibited a recovery on the margin front, with sharp improvement (13.8%, +960bps QoQ, 14-quarter high). Management expects most of the margin drivers to sustain and reiterated its near-term and medium-term margin guidance. Mgmt. has guided to further cost-cutting benefits on RM cost, staff cost and overheads over the coming quarters. Higher margins and trimmed capex implies that FCFF in FY20ii would be better than earlier expectations.
Expect CV up-cycle, starting 2QFY21: This is based on TTM MHCV volumes bottoming out, at 55-60% of the previous peak, as well as on hopes of improvement in the overall economy. The next six months may be challenging due to the impending transition to BS-VI. In FY20, we saw higher volume drop in higher-tonnage trucks; we expect this to reverse in the up-cycle, driving up ASPs. Discount per vehicle, which is currently at a multi-year high, is likely to come off as demand improves. This along with operating leverage on high growth is likely to bring in significant margin expansion. The India PV business, in our view, may continue to bleed.
Capital infusion by Tata Sons raises confidence: Tata Sons’ decision to infuse Rs65bn into the company should be seen as a positive reinforcement of promoters’ belief in the turnaround.
53

joseph.george@iif lcap.com
Tata Motors – BUY
2
JLR volumes grew 3% YoY in 2Q, after declining for five consecutive quarters. China retails started growing YoY from Jul-19, after falling 40% on an average for 12 months. Figure 3.1: JLR wholesale growth turned positive after 4 quarters of sharp declines
Source: Company, IIFL Research
Figure 3.2: JLR – China market rebounding strongly, on a low‐base
Source: Company, IIFL Research
JLR’s Ebitda margin has started improving after many quarters of YoY contraction. This is attributable to normalisation of warranty costs and VME from abnormally high levels as well as from aggressive cost cutting measures. Management has guided to these improvements being sustainable. Figure 3.3: Sharp improvement in JLR margins; largely sustainable
Source: Company, IIFL Research
‐15%
‐10%
‐5%
0%
5%
0
50,000
100,000
150,000
200,000
3QFY18
4QFY18
1QFY19
2QFY19
3QFY19
4QFY19
1QFY20
2QFY20
Wholesale volumes (LHS) YoY growth (RHS)
‐50%
‐25%
0%
25%
50%
1QFY18
2QFY18
3QFY18
4QFY18
1QFY19
2QFY19
3QFY19
4QFY19
1QFY20
2QFY20
China Total ex‐China Overall(YoY retail growth)
0%
4%
8%
12%
16%
32%
34%
36%
38%
40%
3QFY18
4QFY18
1QFY19
2QFY19
3QFY19
4QFY19
1QFY20
2QFY20
Gross margin (LHS) Ebitda margin (RHS)
54

Tata Motors – BUY
joseph.george@iif lcap.com 3
Figure 3.4: Warranty provision has normalised to 4% from recent highs (sustainable)
Source: Company, IIFL Research
Figure 3.5: VME has normalised after the spike‐up seen in 1QFY20 (sustainable)
Source: Company, IIFL Research
We believe JLR’s Sep 2019 debt would be peak debt, with strong positive FCFF expected in 2HFY20 (seasonal) and rationalisation in capex and working capital. Figure 3.6: JLR’s quarterly FCF trend – 1H is seasonally weak; positive FCFF in 2H
Source: Company, IIFL Research
2.2% 2.5%3.0% 3.0%
3.8% 4.0%4.8%
3.9%
6.8%
3.8%
0%
2%
4%
6%
8%
0
100
200
300
400
1QFY18
2QFY18
3QFY18
4QFY18
1QFY19
2QFY19
3QFY19
4QFY19
1QFY20
2QFY20
Warranty provision (£ mn) ‐ LHS as % of revenues ‐ RHS
5.8%
6.9%
8.8%
7.2%
0%
2%
4%
6%
8%
10%
FY18 FY19 1QFY20 2QFY20
Variable mktg expenses (VME %)
(2,000)
(1,500)
(1,000)
(500)
0
500
1,000
1,500
FY17
FY18
FY19
FY20
FY17
FY18
FY19
FY20
FY17
FY18
FY19
FY17
FY18
FY19
1Q 2Q 3Q 4Q
FCF (GBP mn)
55

joseph.george@iif lcap.com
Tata Motors – BUY
4
Figure 3.7: India business: Sharp deterioration in profitability of CV & PV segments Financials (Rs mn) 2QFY19 3QFY19 4QFY19 1QFY20 2QFY20
Revenues
CVs 139,393 127,088 144,961 102,097 77,858
PVs 37,793 34,703 40,429 30,958 21,865
Ebitda
CVs 15,891 14,742 13,697 8,780 2,959
PVs 76 312 13 371 (4,679)
Ebitda margin
CVs 11.4% 11.6% 9.4% 8.6% 3.8%
PVs 0.2% 0.9% 0.0% 1.2% ‐21.4%
Ebit
CVs 11,818 10,830 10,124 4,820 (642)
PVs (2,568) (3,279) (4,813) (3,105) (8,466)
Ebit margin
CVs 8.5% 8.5% 7.0% 4.7% ‐0.8%
PVs ‐6.8% ‐9.5% ‐11.9% ‐10.0% ‐38.7%Source: Company, IIFL Research; Note: PV Ebitda/Ebit includes an impairment charge of Rs2.3bn, equivalent to 10.7% margin impact on the segment (2QFY20)
Figure 3.8: Tata Motors – EBIT margin outlook
Company guidance IIFL estimates
FY20‐21 FY22‐23 Beyond FY20ii FY21ii FY22ii
JLR 3‐4% 4‐6% 7‐9% 3.2% 3.8% 4.2%
Standalone ‐ 4‐6% 5‐7% ‐2.5% ‐1.0% 2.2%
Source: Company, IIFL Research
Details of preferential issue Figure 3.9: Tata Motors – Details of preferential issue
Instrument type
Number of shares (mn)
Purchase/exerciseprice (Rs)
Amount raised (Rs bn) Equity
dilution
Shares 202 150 30.2 5.9%
Warrants 231 150 issue of warrants: 8.7
exercise of warrants: 26.0 6.8%
Total 433 64.9 12.8%Source: Company, IIFL Research
Figure 3.10: Tata Motors – SOTP‐based TP of Rs220
Rs mn Rs per share
Standalone Mar‐22 EBITDA 52,142
Standalone EV at 9x Mar‐22 EBITDA 469,281 128
JLR Mar‐22 EBITDA (pre‐R&D amortisation) 352,136
JLR Mar‐22 EBITDA (adjusted for R&D amortisation) 292,336
JLR EV at 2.5x Mar‐22 EBITDA 730,841 200
Less: Net Automotive debt 398,542 108
SoTP value 220Source: IIFL Research
56

Tata Motors – BUY
joseph.george@iif lcap.com 5
Figure 3.11: Tata Motors – Summary of estimates
FY18 FY19 FY20ii FY21ii FY22ii
JLR (EUR mn)
JLR volumes 633,510 565,306 558,804 586,744 616,081
% growth 5.5% ‐10.8% ‐1.2% 5.0% 5.0%
Revenues 25,786 24,214 24,995 26,660 28,431
% growth 5.9% ‐6.1% 3.2% 6.7% 6.6%
EBITDA 2,891 1,981 2,955 3,334 3,736
EBITDA margin 11.2% 8.2% 11.8% 12.5% 13.1%
Ebit margin 4.1% ‐0.7% 3.2% 3.8% 4.2%
PAT 618 52 491 671 790
Standalone (Rs mn)
Domestic M&HCV 168,013 195,712 127,899 135,197 162,705
% growth 12.8% 16.5% ‐34.6% 5.7% 20.3%
Domestic LCV 231,322 272,980 216,912 222,394 249,081
% growth 31.4% 18.0% ‐20.5% 2.5% 12.0%
Domestic Cars 187,321 210,143 137,054 160,347 179,588
% growth 22.3% 12.2% ‐34.8% 17.0% 12.0%
Exports 52,402 53,106 39,194 44,931 51,515
% growth ‐18.4% 1.3% ‐26.2% 14.6% 14.7%
Total volumes 639,058 731,941 521,058 562,868 642,889
% growth 17.8% 14.5% ‐28.8% 8.0% 14.2%
Revenues 578,965 692,028 494,213 586,912 702,023
% growth 30.6% 19.5% ‐28.6% 18.8% 19.6%
EBITDA 31,397 57,265 25,699 34,041 58,970
EBITDA margin 5.4% 8.3% 5.2% 5.8% 8.4%
PAT 2,230 24,389 (17,526) (10,218) 9,067
Consolidated (Rs mn)
Revenues 2,915,505 3,019,384 2,877,034 3,158,730 3,448,650
EBITDA 342,793 297,948 345,341 407,126 478,188
EBITDA margin 11.8% 9.9% 12.0% 12.9% 13.9%
PAT 63,035 17,312 13,857 49,905 81,220
EPS (Rs) 18.6 5.1 3.9 13.7 22.2
EPS growth ‐39% ‐73% ‐23% 247% 63%
Source: Company, IIFL Research
57

joseph.george@iif lcap.com
Tata Motors – BUY
6
Company snapshot
PER
EV/Ebitda
‐20%
‐10%
0%
10%
20%
30%
40%
0
100
200
300
400
500
600
700
FY11
FY12
FY13
FY14
FY15
FY16
FY17
FY18
FY19
JLR volumes
JLR volumes YoY growth('000)
2.0
6.0
10.0
14.0
18.0
22.0
26.0
Apr‐08 Aug‐10 Dec‐12 Apr‐15 Aug‐17 Dec‐19
12m fwd EV/EBITDA Avg +/‐ 1SD
(x)
0.0
15.0
30.0
45.0
60.0
75.0
90.0
Apr‐08 Aug‐10 Dec‐12 Apr‐15 Aug‐17 Dec‐19
12m fwd PE Avg +/‐ 1SD
(x)
JLR73%
M&HCV11%
LCV4%
Cars and UVs4%
Exports & Others8%
Revenue break-up (%) - FY19
Assumptions Y/e 31 Mar, Consolidated FY18A FY19A FY20ii FY21ii FY22ii
Domestic M&HCV 168,013 195,712 127,899 135,197 162,705
Domestic LCV 231,322 272,980 216,912 222,394 249,081
Domestic Cars 187,321 210,143 137,054 160,347 179,588
Exports 52,402 53,106 39,194 44,931 51,515
JLR volumes 633,510 565,306 558,804 586,744 616,081
Source: Company, IIFL Research
Management Name Designation
N. Chandrasekaran Non‐Executive Director and Chairman
Dr. Ralf Speth Non‐Executive Director
Guenter Butschek CEO and MD
Background: Tata Motors was established in 1945 as Tata Engineering and Locomotive Co Ltd, to manufacture locomotives and other engineering products. It is the leader in the Indian commercial vehicles space. It is also present in the passenger vehicles segment, although losing market share. Tata Motors has operations in the UK, South Korea, Thailand, Spain, South Africa and Indonesia. The biggest of the subsidiaries – Jaguar Land Rover (JLR), a business comprising two iconic British brands – was acquired in 2008. Through its subsidiaries, the company is engaged in engineering & automotive solutions, automotive vehicle components manufacturing & supply chain activities, vehicle financing, and machine tools & factory automation solutions.
58

Tata Motors – BUY
joseph.george@iif lcap.com 7
Income statement summary (Rs m)
Y/e 31 Mar, Consolidated FY18A FY19A FY20ii FY21ii FY22ii
Revenues 2,915,505 3,019,384 2,877,034 3,158,730 3,448,650
Ebitda 342,793 297,948 345,341 407,126 478,188
Depreciation and amortisation (250,855) (278,152) (262,609) (295,178) (328,825)
Ebit 91,938 19,796 82,733 111,948 149,363
Non‐operating income 39,576 29,653 30,326 31,673 33,147
Financial expense (46,818) (57,586) (69,393) (71,428) (70,478)
PBT 84,696 (8,137) 43,667 72,193 112,032
Exceptionals 26,854 (305,575) (4,110) 0 0
Reported PBT 111,550 (313,712) 39,557 72,193 112,032
Tax expense (43,419) 24,375 (15,972) (15,910) (27,594)
PAT 68,131 (289,337) 23,585 56,283 84,438
Minorities, Associates etc. 21,758 1,075 (13,837) (6,378) (3,219)
Attributable PAT 89,889 (288,262) 9,747 49,905 81,220
Ratio analysis
Y/e 31 Mar, Consolidated FY18A FY19A FY20ii FY21ii FY22ii
Per share data (Rs)
Pre‐exceptional EPS 18.6 5.1 3.9 13.7 22.2
DPS 0.0 0.0 0.5 1.0 1.5
BVPS 268.8 162.1 171.2 179.5 200.8
Growth ratios (%)
Revenues 8.1 3.6 (4.7) 9.8 9.2
Ebitda (7.1) (13.1) 15.9 17.9 17.5
EPS (38.5) (72.5) (22.9) 247.3 62.7
Profitability ratios (%)
Ebitda margin 11.8 9.9 12.0 12.9 13.9
Ebit margin 3.2 0.7 2.9 3.5 4.3
Tax rate 38.9 7.8 40.4 22.0 24.6
Net profit margin 2.3 (9.6) 0.8 1.8 2.4
Return ratios (%)
ROE 8.7 2.4 2.4 8.0 11.9
ROCE 8.2 2.8 6.7 8.2 10.1
Solvency ratios (x)
Net debt‐equity 0.4 1.2 1.2 1.2 1.0
Net debt to Ebitda 1.2 2.2 2.0 1.9 1.6
Interest coverage 2.0 0.3 1.2 1.6 2.1
Source: Company, IIFL Research
Financial summary
59

joseph.george@iif lcap.com
Tata Motors – BUY
8
Balance sheet summary (Rs m)
Y/e 31 Mar, Consolidated FY18A FY19A FY20ii FY21ii FY22ii
Cash & cash equivalents 492,777 415,872 403,356 347,942 344,667
Inventories 421,376 390,137 362,626 397,475 430,970
Receivables 198,933 189,962 178,308 195,826 214,057
Other current assets 457,017 523,334 521,099 575,762 635,736
Creditors 720,384 685,135 801,608 937,882 1,097,322
Other current liabilities 682,829 703,120 565,680 562,527 534,393
Net current assets 166,890 131,049 98,101 16,597 (6,285)
Fixed assets 1,102,650 919,530 1,055,761 1,192,953 1,275,956
Intangibles 511,823 511,653 514,077 519,029 519,029
Investments 87,342 69,946 57,109 51,731 49,513
Other long‐term assets 0 0 0 0 0
Total net assets 1,868,705 1,632,179 1,725,048 1,780,310 1,838,212
Borrowings 889,505 1,061,753 1,103,946 1,108,426 1,088,426
Other long‐term liabilities 66,509 20,141 22,482 26,221 27,221
Shareholders’ equity 912,692 550,285 598,620 645,662 722,565
Total liabilities 1,868,705 1,632,179 1,725,048 1,780,310 1,838,212
Cash flow summary (Rs m)
Y/e 31 Mar, Consolidated FY18A FY19A FY20ii FY21ii FY22ii
Ebit 91,938 19,796 82,733 111,948 149,363
Tax paid (30,212) (26,594) (14,632) (13,171) (27,594)
Depreciation and amortization 250,855 278,152 262,609 295,178 328,825
Net working capital change (64,337) (72,123) 20,433 26,090 19,606
Other operating items (9,670) (10,324) (18,409) (19,200) (24,281)
Operating cash flow before interest
238,574 188,908 332,734 400,846 445,919
Financial expense (54,106) (70,051) (69,393) (71,428) (70,478)
Non‐operating income 24,879 9,928 0 0 0
Operating cash flow after interest 209,347 128,784 263,341 329,418 375,442
Capital expenditure (350,486) (352,363) (357,012) (387,214) (354,400)
Long‐term investments 16,846 3,047 0 0 0
Others 31,657 (14,728) 0 0 0
Free cash flow (92,637) (235,260) (93,671) (57,796) 21,042
Equity raising 0 0 38,963 0 0
Borrowings 75,183 159,302 42,193 4,480 (20,000)
Dividend (960) (947) 0 (2,098) (4,317)
Net chg in cash and equivalents (18,414) (76,905) (12,515) (55,414) (3,276)
Source: Company, IIFL Research
60

CMP Rs2312
Target 12m Rs3100 (34%)
Market cap (US$ m) 6,499
Enterprise value (US$ m) 5,860
Bloomberg HMCL IN
Sector Auto
Dec 18 2019 52Wk High/Low (Rs) 3383/2226
Shares o/s (m) 200
Daily volume (US$ m) 34
Dividend yield FY21ii (%) 3.7
Free float (%) 65.4
Shareholding pattern (%)
Promoter 34.6
‐‐‐Pledged (as % of promoter share)
0.0
FII 36.5
DII 19.2
Price performance (%)
1M 3M 1Y
Hero MotoCorp (7.6) (10.3) (29.9)
Absolute (US$) (6.6) (10.0) (28.3)
Rel. to Sensex (10.8) (23.9) (44.2)
CAGR (%) 3 yrs 5 yrs
EPS 2.3 9.9
Stock movement
Joseph George [email protected] 91 22 4646 4667 Suraj Chheda [email protected] 91 22 4646 4656
www.iiflcap.com
0
1,000
2,000
3,000
4,000
0
2,000
4,000
6,000
Dec‐17
Feb‐18
Apr‐18
Jun‐18
Aug‐18
Oct‐18
Dec‐18
Feb‐19
Apr‐19
Jun‐19
Aug‐19
Oct‐19
Dec‐19
Vol('000, LHS) Price (Rs., RHS)
Financial summary (Rs m)Y/e 31 Mar, Parent FY18A FY19A FY20ii FY21ii FY22iiRevenues (Rs m) 322,305 336,505 301,304 351,537 395,164 Ebitda margins (%) 16.4 14.7 14.0 12.7 13.1 Pre‐exceptional PAT (Rs m) 36,974 33,849 30,922 33,211 38,885 Reported PAT (Rs m) 36,974 33,849 30,922 33,211 38,885 Pre‐exceptional EPS (Rs) 185.1 169.5 154.8 166.3 194.7 Growth (%) 9.5 (8.5) (8.6) 7.4 17.1 IIFL vs consensus (%) (6.1) (4.6) 1.8 PER (x) 12.5 13.6 14.9 13.9 11.9 ROE (%) 33.8 27.5 23.3 23.1 24.3 Net debt/equity (x) (0.6) (0.4) (0.4) (0.5) (0.7) EV/Ebitda (x) 7.5 8.4 9.7 8.8 6.8 Price/book (x) 3.9 3.6 3.4 3.1 2.7 OCF/Ebitda (x) 0.8 0.2 0.9 0.9 0.8 Source: Company, IIFL Research. Price as at close of business on 18 December 2019.
Hero Motocorp BUY
Stock pricing an unlikely structural decline We believe BS-VI transition would be the last hurdle for the 2W industry before a cyclical recovery. The Jun-2020 quarter should mark the bottom on volumes and margins. With a 51% share in motorcycles, Hero is a good play on recovery in 2W volumes. In FY19-FY20, motorcycles’ contribution to the 2W industry has increased, after falling for 11 consecutive years. If recovery in 2Ws is led by rural markets, the above trend may continue and benefit Hero more than others. At 14x FY21ii EPS with a 4% dividend yield, we find the stock attractive.
Holding on to motorcycle (MC) market share: Hero has held on to its 51% share in domestic MC in recent years, despite significant increase in competition, especially from Bajaj. Although Hero’s share in the premium MC segment has stayed very low, it has been offset by market-share gains in the executive MC segment.
Biggest beneficiary of rural recovery: Catalysts for rural recovery include surplus monsoon and, possibly, a good rabi crop. Hero would be the biggest beneficiary of a rural recovery, with about half of its sales coming from the hinterland. In FY19 and FY20, we saw contribution of MC in total 2W industry improving, after 11 successive years of fall. If the recovery in the industry is led by rural, we may see this trend continuing.
Multi-year performance depends on scooters, premium MC: We forecast Hero to grow in line or slightly lower than industry over the medium-term. Whether Hero is able to outperform the industry depends on its ability to click in scooters and premium MCs. These are segments where Hero has historically had limited success.
Reverse DCF – Stock pricing an unlikely structural decline: Our reverse DCF analysis of the four 2W OEMs tells us that current stock prices imply a structural fall in Hero’s margin (-300bps), but are building margin expansion for other OEMs. We believe relative performance of 2W OEMs is unlikely to be so divergent. Margins may come off for the whole industry with BS-VI costs. But as customers get used to the new prices, volumes and margins may rebound.
61

joseph.george@iif lcap.com
Hero Motocorp – BUY
2
We expect 2W industry to be flat-to-down over the next six months, with inventory correction related to BS-IV and subdued demand following the sharp BS-VI led price hike. We expect YoY growth starting 2QFY21. Figure 4.1: 2W industry − Reported volumes weak; expect recovery starting 2QFY21
Source: SIAM, IIFL Research
Although Hero has lost share in scooters, its market-share in the motorcycle segment has been largely intact. Figure 4.2: Hero losing market share in scooters, but MC share is intact
Source: SIAM, IIFL Research
In FY19-FY20, motorcycles’ contribution to 2W industry increased, after falling for 11 consecutive years. Figure 4.3: Motorcycles regaining share within the domestic 2W industry
Source: SIAM, IIFL Research
‐30%
‐20%
‐10%
0%
10%
20%
30%
40%
0
1
2
3
4
5
6
7
1QFY18
2QFY18
3QFY18
4QFY18
1QFY19
2QFY19
3QFY19
4QFY19
1QFY20
2QFY20
3QFY20E
4QFY20E
1QFY21E
2QFY21E
3QFY21E
4QFY21E
Domestic 2W industry volumes (mn) ‐ LHS YoY growth (%) ‐ RHS
19.2% 16.7% 16.3% 14.1% 13.1%10.7% 8.0%
51.8% 52.9% 52.4% 51.3% 51.5% 50.7% 50.9%
41.3% 40.2% 39.0% 36.9% 36.5% 35.9% 35.2%
0%
10%
20%
30%
40%
50%
60%
FY14 FY15 FY16 FY17 FY18 FY19 FY20ytd
Scooters Motorcycles OverallHero mkt share
71% 67% 65% 63% 62% 64% 64%
24% 28% 31% 32% 33% 32% 32%
5% 5% 4% 5% 4% 4% 4%
0%
20%
40%
60%
80%
100%
FY14 FY15 FY16 FY17 FY18 FY19 FY20E
Mopeds Scooters Motorcycles
62

Hero Motocorp – BUY
joseph.george@iif lcap.com 3
Our reverse DCF analysis of the four 2W OEMs tell us that current stock prices imply a structural fall in Hero’s margin (-300bps), but are building margin expansion for the other OEMs. Figure 4.4: Hero MotoCorp − Reverse DCF analysis
FY20ii FY21ii FY22ii
EPS (Rs) 155 166 195
P/E (x) 14.9 13.9 11.9
Reverse DCF assumptions (implied by current stock price)
FY14‐18 avg. FY19 FY20ii FY21‐29ii avg.
Volume growth 5% 3% ‐14% 4%
Ebitda margin 15.1% 14.7% 14.0% 12.1%
Terminal Growth 4.0%
WACC (%) 11.6%Source: IIFL Research
Figure 4.5: Hero P/E chart – the stock is currently trading 1 S.D. below the 5‐yr avg.
Source: Bloomberg, IIFL Research; *Note: SD= Standard Deviation
Figure 4.6: Hero MotoCorp – Summary of estimates
Financials (in Rs mn) FY18 FY19 FY20ii FY21ii FY22ii
Domestic volumes 7,382,718 7,612,775 6,524,048 6,848,611 7,601,958
Volume growth (%) 14% 3% ‐14% 5% 11%
Export volumes 204,475 208,056 192,367 212,173 233,390
Volume growth (%) 13% 2% ‐8% 10% 10%
Total Volume 7,587,193 7,820,831 6,716,415 7,060,783 7,835,348
Volume growth (%) 14% 3% ‐14% 5% 11%
ASP growth (%) ‐0.7% 1.3% 4.3% 11.0% 1.3%
Revenue 322,305 336,505 301,304 351,537 395,164
Revenue growth (%) 13% 4% ‐10% 17% 12%
EBITDA 52,802 49,301 42,277 44,505 51,808
EBITDA margin (%) 16.4% 14.7% 14.0% 12.7% 13.1%
PAT 36,974 33,849 30,922 33,211 38,885
PAT growth (%) 9% ‐8% ‐9% 7% 17%
EPS (Rs) 185.1 169.5 154.8 166.3 194.7
Source: Company, IIFL Research
10
12
14
16
18
20
Apr‐14
Oct‐14
Apr‐15
Oct‐15
Apr‐16
Oct‐16
Apr‐17
Oct‐17
Apr‐18
Oct‐18
Apr‐19
Oct‐19
(Hero) 1‐yr fwd P/E Average +1 S.D. ‐1 S.D.
63

joseph.george@iif lcap.com
Hero Motocorp – BUY
4
Company snapshot
PE chart
EV/Ebitda
0%
2%
4%
6%
8%
10%
12%
14%
16%
0
5
10
15
20
25
FY12
FY13
FY14
FY15
FY16
FY17
FY18
FY19
Domestic 2W industry sales trend
Domestic 2W Industry YoY growthmn units
3.0
5.0
7.0
9.0
11.0
13.0
15.0
17.0
Apr‐08 Aug‐10 Dec‐12 Apr‐15 Aug‐17 Dec‐19
12m fwd EV/EBITDA Avg +/‐ 1SD
(x)
3.0
6.0
9.0
12.0
15.0
18.0
21.0
24.0
Apr‐08 Aug‐10 Dec‐12 Apr‐15 Aug‐17 Dec‐19
12m fwd PE Avg +/‐ 1SD
(x)
Domestic Motorcycle
88%
Domestic Scooters
9%
Exports3%
Volume breakup (%) ‐ FY19
Assumptions Y/e 31 Mar FY18A FY19A FY20ii FY21ii FY22ii
Domestic 7,382,718 7,612,775 6,524,048 6,848,611 7,601,958
YoY growth (%) 13.9 3.1 ‐14.3 5.0 11.0
Exports 204,475 208,056 192,367 212,173 233,390
YoY growth (%) 13.4 1.8 ‐7.5 10.3 10.0
Total 7,587,193 7,820,831 6,716,415 7,060,783 7,835,348
YoY growth (%) 13.9 3.1 ‐14.1 5.1 11.0
Source: Company, IIFL Research
Management Name Designation
Pawan Munjal Chairman, MD & CEO
Niranjan Gupta CFO
Background: Hero is the largest 2W company in India. The company currently has ~51% share in the Indian domestic motorcycle market and ~35% share in the domestic 2W market (including scooters). Hero has sold more than 90 million vehicles till date. It manufactures 2Ws at five facilities in India and also has two assembly plants overseas.
64

Hero Motocorp – BUY
joseph.george@iif lcap.com 5
Income statement summary (Rs m)
Y/e 31 Mar, Parent FY18A FY19A FY20ii FY21ii FY22ii
Revenues 322,305 336,505 301,304 351,537 395,164
Ebitda 52,802 49,301 42,277 44,505 51,808
Depreciation and amortisation (5,556) (6,020) (8,534) (7,996) (8,623)
Ebit 47,246 43,281 33,742 36,509 43,185
Non‐operating income 5,196 6,827 7,487 7,772 8,661
Financial expense 0 0 0 0 0
PBT 52,442 50,107 41,230 44,281 51,846
Exceptionals 0 0 0 0 0
Reported PBT 52,442 50,107 41,230 44,281 51,846
Tax expense (15,468) (16,259) (10,307) (11,070) (12,962)
PAT 36,974 33,849 30,922 33,211 38,885
Minorities, Associates etc. 0 0 0 0 0
Attributable PAT 36,974 33,849 30,922 33,211 38,885
Ratio analysis
Y/e 31 Mar, Parent FY18A FY19A FY20ii FY21ii FY22ii
Per share data (Rs)
Pre‐exceptional EPS 185.1 169.5 154.8 166.3 194.7
DPS 95.0 87.0 80.0 85.0 100.0
BVPS 589.3 643.8 684.1 754.1 846.5
Growth ratios (%)
Revenues 13.1 4.4 (10.5) 16.7 12.4
Ebitda 13.9 (6.6) (14.2) 5.3 16.4
EPS 9.5 (8.5) (8.6) 7.4 17.1
Profitability ratios (%)
Ebitda margin 16.4 14.7 14.0 12.7 13.1
Ebit margin 14.7 12.9 11.2 10.4 10.9
Tax rate 29.5 32.4 25.0 25.0 25.0
Net profit margin 11.5 10.1 10.3 9.4 9.8
Return ratios (%)
ROE 33.8 27.5 23.3 23.1 24.3
ROCE 46.0 39.0 29.9 29.7 31.4
Solvency ratios (x)
Net debt‐equity (0.6) (0.4) (0.4) (0.5) (0.7)
Net debt to Ebitda (1.3) (0.9) (1.2) (1.5) (2.1)
Interest coverage 0.0 0.0 0.0 0.0 0.0
Source: Company, IIFL Research
Financial summary
65

joseph.george@iif lcap.com
Hero Motocorp – BUY
6
Balance sheet summary (Rs m)
Y/e 31 Mar, Parent FY18A FY19A FY20ii FY21ii FY22ii
Cash & cash equivalents 66,510 45,376 51,376 68,736 110,887
Inventories 8,236 10,724 9,508 9,673 10,034
Receivables 15,202 28,216 19,812 19,262 21,653
Other current assets 17,556 24,817 22,221 21,980 20,756
Creditors 33,188 33,553 36,908 40,599 44,659
Other current liabilities 11,395 8,923 769 4,841 5,714
Net current assets 62,920 66,657 65,240 74,212 112,957
Fixed assets 46,897 48,382 54,848 56,852 58,229
Intangibles 2,833 3,222 3,222 3,222 3,222
Investments 10,156 15,675 18,675 21,675 0
Other long‐term assets 0 0 0 0 0
Total net assets 122,805 133,936 141,985 155,961 174,408
Borrowings 0 0 0 0 0
Other long‐term liabilities 5,117 5,365 5,365 5,365 5,365
Shareholders equity 117,689 128,571 136,620 150,596 169,043
Total liabilities 122,805 133,936 141,985 155,961 174,408
Cash flow summary (Rs m)
Y/e 31 Mar, Parent FY18A FY19A FY20ii FY21ii FY22ii
Ebit 47,246 43,281 33,742 36,509 43,185
Tax paid (14,943) (20,515) (10,307) (11,070) (12,962)
Depreciation and amortization 5,556 6,020 8,534 7,996 8,623
Net working capital change 1,601 (19,189) 7,417 8,388 3,406
Other operating items 349 193 0 0 0
Operating cash flow before interest
39,809 9,791 39,386 41,823 42,253
Financial expense (63) (86) (280) (280) (280)
Non‐operating income 2,287 3,634 7,767 8,052 8,941
Operating cash flow after interest 42,033 13,338 46,874 49,595 50,914
Capital expenditure (7,992) (9,179) (15,000) (10,000) (10,000)
Long‐term investments (1,635) (5,519) (3,000) (3,000) 21,675
Others 2,789 3,100 0 0 0
Free cash flow 35,195 1,740 28,874 36,595 62,589
Equity raising 0 0 0 0 0
Borrowings 0 0 0 0 0
Dividend (20,431) (22,874) (22,874) (19,235) (20,437)
Net chg in cash and equivalents 14,764 (21,133) 6,000 17,360 42,151
Source: Company, IIFL Research
66

CMP Rs3214
Target 12m Rs3750 (17%)
Market cap (US$ m) 13,090
Enterprise value (US$ m) 10,452
Bloomberg BJAUT IN
Sector Auto
Dec 18 2019 52Wk High/Low (Rs) 3290/2400
Shares o/s (m) 289
Daily volume (US$ m) 20
Dividend yield FY21ii (%) 2.2
Free float (%) 46.5
Shareholding pattern (%)
Promoter 53.5
‐‐‐Pledged (as % of promoter share)
0.0
FII 14.1
DII 9.8
Price performance (%)
1M 3M 1Y
Bajaj Auto 1.8 15.7 13.1
Absolute (US$) 2.9 16.0 14.6
Rel. to Sensex (1.4) 2.1 (1.2)
CAGR (%) 3 yrs 5 yrs
EPS 4.1 6.1
Stock movement
Joseph George [email protected] 91 22 4646 4667 Suraj Chheda [email protected] 91 22 4646 4656
www.iiflcap.com
0
1,000
2,000
3,000
4,000
0
2,000
4,000
6,000
Dec‐17
Feb‐18
Apr‐18
Jun‐18
Aug‐18
Oct‐18
Dec‐18
Feb‐19
Apr‐19
Jun‐19
Aug‐19
Oct‐19
Dec‐19
Vol('000, LHS) Price (Rs., RHS)
Financial summary (Rs m)Y/e 31 Mar, Parent FY18A FY19A FY20ii FY21ii FY22iiRevenues (Rs m) 252,189 302,500 312,450 350,244 385,183 Ebitda margins (%) 19.2 16.5 15.9 15.4 15.7 Pre‐exceptional PAT (Rs m) 41,001 44,358 47,939 51,944 58,607 Reported PAT (Rs m) 40,681 46,752 47,939 51,944 58,607 Pre‐exceptional EPS (Rs) 141.7 153.3 165.7 179.5 202.5 Growth (%) 7.1 8.2 8.1 8.4 12.8 IIFL vs consensus (%) (2.2) (1.2) 1.0 PER (x) 22.7 21.0 19.4 17.9 15.9 ROE (%) 22.7 21.7 20.7 20.0 20.1 Net debt/equity (x) (0.9) (0.9) (0.9) (0.9) (0.9) EV/Ebitda (x) 15.7 14.9 14.4 12.7 10.7 Price/book (x) 4.9 4.3 3.8 3.4 3.0 OCF/Ebitda (x) 0.9 0.5 0.8 0.7 0.7 Source: Company, IIFL Research. Price as at close of business on 18 December 2019.
Bajaj Auto BUY
Partially insulated from BS-VI risks Bajaj’s ‘volumes over margin’ strategy brought in exactly that. Domestic motorcycle (MC) market-share has seen a sharp improvement, but Ebitda margin has come off structurally, from ~20% to 15-16%. Going forward, we expect Bajaj’s domestic sales to grow largely in line with the market. Continued growth in exports would insulate Bajaj from near-term challenges in the domestic market, while Rupee depreciation, if any, would act as an offset against margin risk. We forecast 11% EPS Cagr over the next two years.
Substantial market-share gain, albeit at the cost of margins: Bajaj’s domestic MC market-share improved from 15.6% in FY18 to ~20% in 2HFY19, as price cuts in CT100 and Pulsar helped the company gain share. Sales of CT100 failed to sustain at the highs, but that slack was picked up by the recently launched Pulsar 125. Overall MC market-share is back to the 20% levels, after giving away part of the gains in early FY20. Bajaj’s Ebitda margin has come off from ~20% to 15-16%, due to higher mix of lower margin products. This looks more structural than cyclical.
2W exports on growth path: 2W exports are growing at a decent clip, with strong momentum in Africa. 3W exports, on the other hand, have been weak, given sharp drop in retails in Egypt. The inventory correction of 3Ws in Egypt is largely done; hence, wholesales to Egypt should commence soon. We forecast Bajaj’s overall export volumes to grow at 9% Cagr over the next two years.
Partially insulated from BS-VI risks: With more than 45% of volumes coming from exports, Bajaj’s overall exposure to the BS-VI changeover risk is lower vs. peers. We expect 2W industry margins to come off post the changeover, as we think OEMs are not in a position to make margins on the BS-VI costs. They may at best maintain gross profit per vehicle. Rupee depreciation may aid Bajaj’s export margins, which may partly offset the BS-VI margin impact.
Partnership with global OEMs: Bajaj’s partnership with KTM has given it additional volume/earnings. If Bajaj is able to replicate the success with Husqvarna and Triumph, it may add to growth.
67

joseph.george@iif lcap.com
Bajaj Auto – BUY
2
Bajaj revived its volumes with a price-led strategy in early 2018. Bajaj cut prices of CT100 and Pulsar motorcycles; this helped improve market-share substantially from 15.6% in FY18 to ~20%. Figure 5.1: Bajaj’s price‐led strategy drove market share gain from the FY18 lows
Source: SIAM, IIFL Research
The CT100 drove market-share improvement in the economy segment; however, CT100 sales came off post a 6-month spike. Pulsar volumes and hence the premium segment market-share have sustained especially with the recent launch of the Pulsar 125. Figure 5.2: Price cuts and lower‐priced variants helped Bajaj gain market share
Source: SIAM, IIFL Research
Figure 5.3: Price cut in CT100 (Apr‐18) boosted volumes in the economy segment
Source: SIAM, IIFL Research
16.5%17.7% 18.0%
15.6% 16.3%18.6% 20.3% 20.0% 18.3% 17.9%
20.8%
0%
5%
10%
15%
20%
25%
FY15
FY16
FY17
FY18
1QFY19
2QFY19
3QFY19
4QFY19
1QFY20
2QFY20
3QFY20
Bajaj domestic motorcycle market share (%)
0%
5%
10%
15%
20%
25%
30%
35%
40%
FY18 1QFY19 2QFY19 3QFY19 4QFY19 1QFY20 2QFY20
Motorcycle mkt share
Economy Executive Premium
0
20,000
40,000
60,000
80,000
100,000
Apr‐17
May‐17
Jun‐17
Jul‐17
Aug‐17
Sep‐17
Oct‐17
Nov‐17
Dec‐17
Jan‐18
Feb‐18
Mar‐18
Apr‐18
May‐18
Jun‐18
Jul‐18
Aug‐18
Sep‐18
Oct‐18
Nov‐18
Dec‐18
Jan‐19
Feb‐19
Mar‐19
Apr‐19
May‐19
Jun‐19
Jul‐19
Aug‐19
Sep‐19
Oct‐19
CT100 volumes
Price cut
68

Bajaj Auto – BUY
joseph.george@iif lcap.com 3
Figure 5.4: Pulsar: price cut and launch of lower‐priced variants driving growth
Source: SIAM, IIFL Research
The price-led strategy came at the cost of margins; Ebitda margin is down structurally from ~20% to 15-16%. Figure 5.5: Weaker mix in domestic 2Ws led to structural fall in the margin profile
Source: Company, IIFL Research
Figure 5.6: Bajaj’s volume mix by key segments (FY20YTD)
Source: SIAM, IIFL Research
0
20,000
40,000
60,000
80,000
100,000
120,000
Apr‐17
May‐17
Jun‐17
Jul‐17
Aug‐17
Sep‐17
Oct‐17
Nov‐17
Dec‐17
Jan‐18
Feb‐18
Mar‐18
Apr‐18
May‐18
Jun‐18
Jul‐18
Aug‐18
Sep‐18
Oct‐18
Nov‐18
Dec‐18
Jan‐19
Feb‐19
Mar‐19
Apr‐19
May‐19
Jun‐19
Jul‐19
Aug‐19
Sep‐19
Oct‐19
Pulsar (150cc & above) Pulsar (125cc)
Price cut and lower‐priced 150cc variants launched
20.8% 19.3%21.2% 20.3%
19.2%16.5% 15.9% 15.4% 15.7%
0%
5%
10%
15%
20%
25%
30%
FY14 FY15 FY16 FY17 FY18 FY19 FY20ii FY21ii FY22ii
Ebitda margin (%)
Domestic 2Ws, 47%
Domestic 3Ws, 8%
Export 2Ws, 38%
Export 3Ws, 7%
69

joseph.george@iif lcap.com
Bajaj Auto – BUY
4
Figure 5.7: Export 2W growth stays healthy (Africa), but 3Ws weak (Egypt)
Source: SIAM, IIFL Research
If the Rupee depreciates from current levels, it may help partly offset the margin pressure from BS-VI transition in India. Figure 5.8: Weak INR partly offsetting the margin pressure from domestic 2Ws
Source: Bloomberg, IIFL Research
‐60%
‐40%
‐20%
0%
20%
40%
60%
80%
100%
1QFY17
2QFY17
3QFY17
4QFY17
1QFY18
2QFY18
3QFY18
4QFY18
1QFY19
2QFY19
3QFY19
4QFY19
1QFY20
2QFY20
YoY growth (%) Export 2Ws Export 3Ws
67.0 66.9 67.2 67.4
69.4 68.9 68.6
70.0 70.6 70.9
60
62
64
66
68
70
72
2QFY18
3QFY18
4QFY18
1QFY19
2QFY19
3QFY19
4QFY19
1QFY20
2QFY20
Curren
t
Average USD‐INR realisation(USD‐INR)
70

Bajaj Auto – BUY
joseph.george@iif lcap.com 5
Figure 5.9: Bajaj Auto – Summary of estimates
Financials (in Rs mn) FY18 FY19 FY20ii FY21ii FY22ii
Dom 2W 1,974,577 2,541,320 2,293,892 2,439,146 2,707,453
Volume growth (%) ‐1% 29% ‐10% 6% 11%
Dom 3W 369,637 399,453 391,177 389,959 391,813
Volume growth (%) 46% 8% ‐2% 0% 0%
Export 2W 1,394,757 1,695,553 1,844,928 2,010,972 2,171,849
Volume growth (%) 14% 22% 9% 9% 8%
Export 3W 267,820 383,177 327,428 364,857 408,640
Volume growth (%) 39% 43% ‐15% 11% 12%
Total volumes 4,006,791 5,019,503 4,857,426 5,204,935 5,679,755
Volume growth (%) 9% 25% ‐3% 7% 9%
Revenue 252,189 302,500 312,450 350,244 385,183
Revenue growth (%) 16% 20% 3% 12% 10%
EBITDA 48,374 49,820 49,538 53,772 60,331
EBITDA margin (%) 19.2% 16.5% 15.9% 15.4% 15.7%
PAT 41,001 44,358 47,939 51,944 58,607
EPS (Rs) 141.7 153.3 165.7 179.5 202.5
EPS growth 7% 8% 8% 8% 13%
Source: IIFL Research, Company
71

joseph.george@iif lcap.com
Bajaj Auto – BUY
6
Company snapshot
PE chart
EV/Ebitda
‐2%0%2%4%6%8%10%12%14%16%
0.0
2.0
4.0
6.0
8.0
10.0
12.0
14.0
16.0
FY12
FY13
FY14
FY15
FY16
FY17
FY18
FY19
Domestic MC industry sales trend
Domestic Motorcycle IndustryYoY growth
mn units
1.0
3.0
5.0
7.0
9.0
11.0
13.0
15.0
17.0
May‐08 Sep‐10 Jan‐13 May‐15 Aug‐17 Dec‐19
12m fwd EV/EBITDA Avg +/‐ 1SD
(x)
1.0
4.0
7.0
10.0
13.0
16.0
19.0
22.0
May‐08 Sep‐10 Jan‐13 May‐15 Aug‐17 Dec‐19
12m fwd PE Avg +/‐ 1SD
(x)
2W Dom 41%
3W Dom13%
2W Exp28%
3W Exp18%
Vehicle revenue breakup % (FY19E)
Assumptions Y/e 31 Mar FY18A FY19A FY20ii FY21ii FY22ii
2W ‐ Domestic 1,974,577 2,541,320 2,293,892 2,439,146 2,707,453
%YoY Growth ‐1.0 29.0 ‐10.0 6.0 11.0
2W ‐ Exports 1,394,757 1,695,553 1,844,928 2,010,972 2,171,849
%YoY Growth 14.0 22.0 9.0 9.0 8.0
3W ‐ Domestic 369,637 399,453 391,177 389,959 391,813
%YoY Growth 46.0 8.0 ‐2.0 0.0 0.0
3W ‐ Exports 267,820 383,177 327,428 364,857 408,640
%YoY Growth 39.0 43.0 ‐15.0 11.0 12.0
Total 4,006,791 5,019,503 4,857,426 5,204,935 5,679,755
%YoY Growth 9.0 25.0 ‐3.0 7.0 9.0
Source: Company, IIFL Research
Management Name Designation
Rahul Bajaj Chairman
Rajiv Bajaj Managing Director
Soumen Ray Chief Financial Officer
Background: Bajaj is the second-largest motorcycle manufacturer in India, and a leader in the three-wheeler (3W) industry with total sales (incl. exports) of ~5mn units in FY19. Bajaj mainly addresses the premium motorcycle segment with the “Pulsar” model and the economy segment with the “CT100” and "Platina" models. Bajaj has also developed a four-wheeler (RE60) passenger carrier positioned as a replacement for three-wheelers. It has three plants with total capacity of 6.33mn units as on FY19, two in Maharashtra at Waluj and Chakan and one in Uttaranchal at Pantnagar.
72

Bajaj Auto – BUY
joseph.george@iif lcap.com 7
Income statement summary (Rs m)
Y/e 31 Mar, Parent FY18A FY19A FY20ii FY21ii FY22ii
Revenues 252,189 302,500 312,450 350,244 385,183
Ebitda 48,374 49,820 49,538 53,772 60,331
Depreciation and amortisation (3,148) (2,657) (2,473) (2,641) (2,859)
Ebit 45,226 47,163 47,065 51,131 57,472
Non‐operating income 12,933 16,493 16,028 17,231 19,658
Financial expense (13) (45) (15) (15) (15)
PBT 58,146 63,612 63,078 68,347 77,114
Exceptionals (320) 3,420 0 0 0
Reported PBT 57,826 67,032 63,078 68,347 77,114
Tax expense (17,145) (20,280) (15,139) (16,403) (18,507)
PAT 40,681 46,752 47,939 51,944 58,607
Minorities, Associates etc. 0 0 0 0 0
Attributable PAT 40,681 46,752 47,939 51,944 58,607
Ratio analysis
Y/e 31 Mar, Parent FY18A FY19A FY20ii FY21ii FY22ii
Per share data (Rs)
Pre‐exceptional EPS 141.7 153.3 165.7 179.5 202.5
DPS 60.0 60.0 65.0 70.0 80.0
BVPS 660.2 752.7 846.0 947.1 1065.2
Growth ratios (%)
Revenues 15.9 19.9 3.3 12.1 10.0
Ebitda 9.4 3.0 (0.6) 8.5 12.2
EPS 7.1 8.2 8.1 8.4 12.8
Profitability ratios (%)
Ebitda margin 19.2 16.5 15.9 15.4 15.7
Ebit margin 17.9 15.6 15.1 14.6 14.9
Tax rate 29.6 30.3 24.0 24.0 24.0
Net profit margin 16.1 15.5 15.3 14.8 15.2
Return ratios (%)
ROE 22.7 21.7 20.7 20.0 20.1
ROCE 31.4 30.3 26.5 25.7 25.9
Solvency ratios (x)
Net debt‐equity (0.9) (0.9) (0.9) (0.9) (0.9)
Net debt to Ebitda (3.5) (3.8) (4.4) (4.6) (4.7)
Interest coverage NM NM NM NM NM
Source: Company, IIFL Research
Financial summary
73

joseph.george@iif lcap.com
Bajaj Auto – BUY
8
Balance sheet summary (Rs m)
Y/e 31 Mar, Parent FY18A FY19A FY20ii FY21ii FY22ii
Cash & cash equivalents 171,436 188,595 219,877 250,748 285,925
Inventories 7,426 9,615 9,816 11,147 12,205
Receivables 14,919 25,597 21,401 23,989 26,382
Other current assets 12,839 19,651 19,892 20,811 21,661
Creditors 32,443 37,867 43,547 50,080 57,591
Other current liabilities 10,271 11,466 6,833 7,109 5,038
Net current assets 163,905 194,124 220,605 249,506 283,544
Fixed assets 18,895 17,557 18,084 18,443 18,584
Intangibles 453 562 562 562 562
Investments 12,227 12,227 12,227 12,227 12,227
Other long‐term assets 0 0 0 0 0
Total net assets 195,481 224,471 251,479 280,739 314,918
Borrowings 1,208 1,245 1,245 1,245 1,245
Other long‐term liabilities 3,234 5,427 5,427 5,427 5,427
Shareholders equity 191,039 217,799 244,807 274,067 308,246
Total liabilities 195,481 224,471 251,479 280,739 314,918
Cash flow summary (Rs m)
Y/e 31 Mar, Parent FY18A FY19A FY20ii FY21ii FY22ii
Ebit 45,226 47,163 47,065 51,131 57,472
Tax paid (16,851) (19,643) (15,139) (16,403) (18,507)
Depreciation and amortization 3,148 2,657 2,473 2,641 2,859
Net working capital change 10,451 (7,030) 4,802 1,969 1,140
Other operating items 634 1,749 0 0 0
Operating cash flow before interest
42,608 24,895 39,201 39,338 42,963
Financial expense (4) (35) (15) (15) (15)
Non‐operating income 2,047 1,102 16,028 17,231 19,658
Operating cash flow after interest 44,651 25,962 55,214 56,554 62,606
Capital expenditure (1,835) (1,082) (3,000) (3,000) (3,000)
Long‐term investments 0 0 0 0 0
Others 9,208 13,253 0 0 0
Free cash flow 52,024 38,134 52,214 53,554 59,606
Equity raising 0 0 0 0 0
Borrowings 0 28 0 0 0
Dividend (18,848) (20,733) (20,931) (22,683) (24,428)
Net chg in cash and equivalents 33,175 17,428 31,283 30,870 35,177
Source: Company, IIFL Research
74

CMP Rs21736
Target 12m Rs24000 (10%)
Market cap (US$ m) 8,349
Enterprise value (US$ m) 7,534
Bloomberg EIM IN
Sector Auto
Dec 18 2019 52Wk High/Low (Rs) 24350/15197
Shares o/s (m) 27
Daily volume (US$ m) 47
Dividend yield FY21ii (%) 0.6
Free float (%) 50.7
Shareholding pattern (%)
Promoters 49.3
‐‐‐Pledged (as % of promoter share)
0.0
FIIs 31.9
Domestic MFs 7.2
Price performance (%)
1M 3M 1Y
Eicher Motors 1.2 35.6 (8.9)
Absolute (US$) 2.3 36.0 (9.1)
Rel. to Sensex (2.0) 21.9 (23.3)
CAGR (%) 3 yrs 5 yrs
EPS 18.2 29.1
Stock movement
Joseph George [email protected] 91 22 4646 4667 Suraj Chheda [email protected] 91 22 4646 4656
www.iiflcap.com
0
10,000
20,000
30,000
40,000
0
200
400
600
Dec‐17
Feb‐18
Apr‐18
Jun‐18
Aug‐18
Oct‐18
Dec‐18
Feb‐19
Apr‐19
Jun‐19
Aug‐19
Oct‐19
Dec‐19
Vol('000, LHS) Price (Rs., RHS)
Financial summary (Rs m)Y/e 31 Mar, Consolidated FY18A FY19A FY20ii FY21ii FY22iiRevenues (Rs m) 89,650 97,971 96,464 107,640 119,858 Ebitda margins (%) 31.3 29.6 25.5 24.5 24.9 Pre‐exceptional PAT (Rs m) 21,797 22,203 21,376 22,447 27,401 Reported PAT (Rs m) 19,597 22,027 21,376 22,447 27,401 Pre‐exceptional EPS (Rs) 800.4 814.1 783.3 822.6 1,004.1 Growth (%) 27.0 1.7 (3.8) 5.0 22.1 IIFL vs consensus (%) 0.9 (6.3) (2.4) PER (x) 27.2 26.7 27.7 26.4 21.6 ROE (%) 35.2 27.8 21.9 19.4 20.1 Net debt/equity (x) (0.7) (0.6) (0.7) (0.7) (0.8) EV/Ebitda (x) 22.7 21.8 23.7 21.7 18.9 Price/book (x) 8.4 6.6 5.6 4.7 4.0 OCF/Ebitda (x) 0.9 0.5 0.8 0.8 0.8 Source: Company, IIFL Research. Price as at close of business on 18 December 2019.
Eicher Motors ADD
‘Volumes over margins’ should work We upgrade Eicher to ADD from REDUCE, with a TP of Rs24,000. Our long-standing REDUCE call was based on unsustainability of high growth rate as well as sector-leading margins in motorcycles (Royal Enfield; RE), both of which have since normalised. Eicher’s recent climb-down by cutting prices/offering lower-priced variants of RE will improve affordability and volume growth potential. Although the space has become a tad more competitive vs. virtual monopoly earlier, we believe RE may be able to grow volumes at 8-10% Cagr over the medium-term. Ebitda margin has come down from the peak of 32% to ~25%; this may be the new normal. We also expect the CV cycle to turn positive starting 2QFY21; resultant higher earnings from VECV will add to consolidated EPS growth in FY22ii.
‘Volumes over margins’ strategy to aid medium-term growth: We believe the worst period for RE from a volume growth perspective, may be past us. Recent price cuts (Bullet 350) and launch of lower-priced variants (Classic 350) should increase affordability of its motorcycles. Lower affordability due to sharp price increases (insurance, safety norms, etc) was one of the key reasons for slowdown in sales. Although BS-VI norms may result in further price hikes, the % hikes would be lower than that of low-end 2Ws.
Margin fall from 32% to 25% may be structural: We expect RE’s gross margin, which has been contracting QoQ since 2QFY19, to further come off till 1QFY21. We also expect the full cost of the new plant (capacity utilisation down to 60%) to be reflected in 3QFY20 results. Overall, we expect RE’s Ebitda margin to settle slightly below 25% in FY21ii.
CV turnaround to push up VECV earnings: VECV’s contribution to consolidated EPS has more than halved over FY19-FY20, due to the down-cycle in CVs. We expect the MHCV cycle to turn positive in 2QFY21. This should drive a sharp uptick in VECV’s earnings, resulting in an up-lift to consolidated EPS. We forecast a 22% growth in consolidated EPS in FY22ii, after staying flattish for three years.
75

joseph.george@iif lcap.com
Eicher Motors – ADD
2
In Aug 2019, RE introduced cheaper variants of Bullet 350. The price differential was 7-8%, with very little cut in features/ specifications. There are few aesthetic changes with more colour options. These launches were more of a price-cut and less of a feature-cut; this would impact gross margins starting 3QFY20. In Sep 2019, RE launched cheaper variants of the Classic 350. These were more of feature-cut and less of a price-cut. These would hurt ASP but would not hurt margins significantly. With these launches, RE has increased the affordability of its motorcycles. We believe increased affordability and a revival in the overall industry should drive up RE volumes. Figure 6.1: RE: price cut (Bullet 350) and low‐priced model (Classic 350) details
Model prices (Rs/vehicle) Existing
variant
New low‐priced variant
% difference
Bullet 350 (Kick‐start) 121,380 112,000 ‐8%
Bullet 350 ES (Electric‐start) 135,613 126,692 ‐7%
Classic 350 (Dual‐channel ABS) 153,903
Classic 350 (Single‐channel ABS) 145,975 ‐5%
Source: IIFL Research; *Note: Ex‐showroom Delhi prices (Rs/vehicle)
Figure 6.2: Royal Enfield (RE) volumes seems to have bottomed out; set to improve
Source: SIAM, IIFL Research
RE’s efforts to increase affordability would obviously come at the cost of margins. Figure 6.3: RE’s Ebitda margin has structurally came down from 32% to ~25% levels
Source: Company, IIFL Research
‐30%
‐20%
‐10%
0%
10%
20%
30%
0
50,000
100,000
150,000
200,000
250,000
1QFY18
2QFY18
3QFY18
4QFY18
1QFY19
2QFY19
3QFY19
4QFY19
1QFY20
2QFY20
3QFY20E
4QFY20E
FY21E
RE Total volumes (LHS) %YoY growth (RHS)
40%
42%
44%
46%
48%
50%
20%
22%
24%
26%
28%
30%
32%
34%
1QFY18
2QFY18
3QFY18
4QFY18
1QFY19
2QFY19
3QFY19
4QFY19
1QFY20
2QFY20
3QFY20E
4QFY20E
FY21E
Ebitda margin (LHS) Gross margin (RHS)
76

Eicher Motors – ADD
joseph.george@iif lcap.com 3
We expect the MHCV cycle to turn positive in 2QFY21. This should drive a sharp uptick in VECV’s earnings, resulting in an up-lift to consolidated EPS. Figure 6.4: VECV – Volume and Ebitda margin trend
Source: SIAM, IIFL Research
We expect EPS to be largely flattish over FY19-21ii, with slight volume revival in RE offset by margin pressure (BS-VI). We expect FY22ii to be a strong earnings growth year, with RE volume growth, stable margins and good contribution from VECV (CV cycle recovery). Figure 6.5: Eicher Motors – Summary of estimates
Financials (in Rs mn) FY18 FY19 FY20ii FY21ii FY22ii
Royal Enfield
RE volume 820,493 826,098 742,293 800,377 878,141
RE volume growth 23.1% 0.7% ‐10.1% 7.8% 9.7%
Revenue 89,575 97,945 95,665 106,761 118,891
Revenue growth 27.3% 9.3% ‐2.3% 11.6% 11.4%
EBITDA margin 31.9% 30.1% 25.7% 24.6% 25.0%
Pro‐forma PAT 20,249 20,720 21,024 21,676 25,475
EPS (ex VECV dividend; Rs) 725 736 746 770 910
VECV JV
Volume 65,928 72,968 51,932 53,075 62,057
Volume growth 12.5% 10.7% ‐28.8% 2.2% 16.9%
Revenue 100,494 115,999 88,425 97,510 113,826
Revenue growth 17.5% 15.4% ‐23.8% 10.3% 16.7%
EBITDA margin 9.0% 8.4% 6.4% 7.1% 8.5%
Pro‐forma PAT 4,716 4,750 2,090 2,730 4,769
EPS (54.4% share; Rs) 94 95 42 54 95
Consolidated
Revenue 89,650 97,971 96,464 107,640 119,858
Revenue growth 27.5% 9.3% ‐1.5% 11.6% 11.4%
EBITDA margin 31.3% 29.6% 25.5% 24.5% 24.9%
Pro‐forma PAT 21,797 22,203 21,376 22,447 27,401
EPS (Rs) 800 814 783 823 1,004
EPS growth 27.0% 1.7% ‐3.8% 5.0% 22.1%
Source: Company, IIFL Research
0%
2%
4%
6%
8%
10%
0
10,000
20,000
30,000
40,000
50,000
60,000
70,000
80,000
FY17 FY18 FY19 FY20ii FY21ii FY22ii
VECV volumes ‐ LHS Ebitda margin (%) ‐ RHS
77

joseph.george@iif lcap.com
Eicher Motors – ADD
4
Figure 6.6: SOTP‐based TP of Rs24,000 Particulars Value (Rs mn) Rs/share
Standalone value @ 25x Mar‐22 EPS 22,800
VECV (54.4% share)
Mar‐22 Ebitda 2,632
VECV EV at 10x EV/Ebitda 26,317
Add: VECV Cash 6,101
VECV Equity Value 32,417 1,200
SOTP‐based value 24,000
Source: IIFL Research
78

Eicher Motors – ADD
joseph.george@iif lcap.com 5
Company snapshot
PE chart
EV/Ebitda
0%
20%
40%
60%
80%
0
200,000
400,000
600,000
800,000
1,000,000
CY05
CY06
CY07
CY08
CY09
CY10
CY11
CY12
CY13
CY14
FY16
FY17
FY18
FY19
RE Total volumes (LHS) YoY growth (RHS)
0.0
7.0
14.0
21.0
28.0
Mar‐09 May‐11 Jul‐13 Sep‐15 Oct‐17 Dec‐19
12m fwd EV/EBITDA Avg +/‐ 1SD
(x)
3.0
11.0
19.0
27.0
35.0
Mar‐09 May‐11 Jul‐13 Sep‐15 Oct‐17 Dec‐19
12m fwd PE Avg +/‐ 1SD
(x)
Classic 35065%
Bullet 35021%
Thunderbird 3509%
Others (500cc & above)5%
Model-wise dom vols (%) FY19
Assumptions Y/e 31 Mar FY18A FY19A FY20ii FY21ii FY22ii
2W volumes 820,493 826,098 742,293 800,377 878,141
% Growth 23.1 0.7 (10.1) 7.8 9.7
CV volumes 65,928 72,968 51,932 53,075 62,057
% Growth 12.5 10.7 (28.8) 2.2 16.9
Total volumes 886,421 899,066 794,225 853,452 940,198
% Growth 22.2 1.4 (11.7) 7.5 10.2
Source: Company, IIFL Research
Management Name Designation
Siddhartha Lal Managing Director & CEO
Vinod Dasari CEO ‐ Royal Enfield
Lalit Malik CFO
Background: Eicher Motors is the flagship company of the Eicher Group in India and a leading player in the Indian automobile industry. Eicher manufactures the well-known Royal Enfield (RE) motorcycles in India. The company entered into a 50:50 JV with the Volvo Group to form VE Commercial Vehicles (VECV). Operational since July 2008, VECV comprises of five business verticals – Eicher Trucks and Buses, Volvo Trucks India, Eicher Engineering Components and VE Powertrain. VECV undertakes the complete range of Eicher’s commercial vehicles, components and engineering design businesses as well as the sales and distribution of Volvo trucks.
79

joseph.george@iif lcap.com
Eicher Motors – ADD
6
Income statement summary (Rs m)
Y/e 31 Mar, Consolidated FY18A FY19A FY20ii FY21ii FY22ii
Revenues 89,650 97,971 96,464 107,640 119,858
Ebitda 28,076 29,031 24,598 26,325 29,839
Depreciation and amortisation (2,233) (3,003) (3,673) (4,120) (4,350)
Ebit 25,843 26,028 20,925 22,205 25,489
Non‐operating income 2,801 4,434 5,361 6,246 8,086
Financial expense (53) (73) (168) (168) (168)
PBT 28,591 30,389 26,118 28,282 33,407
Exceptionals (2,201) (175) 0 0 0
Reported PBT 26,390 30,214 26,118 28,282 33,407
Tax expense (9,359) (10,770) (5,881) (7,323) (8,603)
PAT 17,031 19,443 20,236 20,959 24,804
Minorities, Associates etc. 2,566 2,584 1,140 1,488 2,598
Attributable PAT 19,597 22,027 21,376 22,447 27,401
Ratio analysis
Y/e 31 Mar, Consolidated FY18A FY19A FY20ii FY21ii FY22ii
Per share data (Rs)
Pre‐exceptional EPS 800.4 814.1 783.3 822.6 1004.1
DPS 110.0 125.0 120.0 125.0 140.0
BVPS 2581.3 3270.1 3901.7 4580.2 5434.4
Growth ratios (%)
Revenues 27.5 9.3 (1.5) 11.6 11.4
Ebitda 29.1 3.4 (15.3) 7.0 13.3
EPS 27.0 1.7 (3.8) 5.0 22.1
Profitability ratios (%)
Ebitda margin 31.3 29.6 25.5 24.5 24.9
Ebit margin 28.8 26.6 21.7 20.6 21.3
Tax rate 35.5 35.6 22.5 25.9 25.8
Net profit margin 19.0 19.8 21.0 19.5 20.7
Return ratios (%)
ROE 35.2 27.8 21.9 19.4 20.1
ROCE 44.6 36.5 25.7 23.6 23.8
Solvency ratios (x)
Net debt‐equity (0.7) (0.6) (0.7) (0.7) (0.8)
Net debt to Ebitda (1.7) (2.0) (2.9) (3.4) (3.8)
Interest coverage NM NM NM NM NM
Source: Company, IIFL Research
Financial summary
80

Eicher Motors – ADD
joseph.george@iif lcap.com 7
Balance sheet summary (Rs m)
Y/e 31 Mar, Consolidated FY18A FY19A FY20ii FY21ii FY22ii
Cash & cash equivalents 50,285 59,438 72,797 92,343 115,564
Inventories 3,946 6,334 6,532 7,429 8,241
Receivables 680 903 877 1,005 1,144
Other current assets 4,319 4,510 4,405 4,917 5,477
Creditors 11,719 12,341 12,151 13,559 15,097
Other current liabilities 10,274 7,734 8,531 10,057 11,191
Net current assets 37,237 51,110 63,929 82,078 104,138
Fixed assets 16,049 19,677 23,004 21,884 20,535
Intangibles 2,300 3,566 3,566 3,566 3,566
Investments 17,644 19,440 20,580 22,068 24,666
Other long‐term assets 0 0 0 0 0
Total net assets 73,230 93,794 111,079 129,597 152,905
Borrowings 1,508 1,868 1,868 1,868 1,868
Other long‐term liabilities 1,421 2,739 2,739 2,739 2,739
Shareholders equity 70,301 89,187 106,472 124,990 148,298
Total liabilities 73,230 93,794 111,079 129,597 152,905
Cash flow summary (Rs m)
Y/e 31 Mar, Consolidated FY18A FY19A FY20ii FY21ii FY22ii
Ebit 25,843 26,028 20,925 22,205 25,489
Tax paid (8,071) (9,085) (5,881) (7,323) (8,603)
Depreciation and amortization 2,233 3,003 3,673 4,120 4,350
Net working capital change 4,380 (4,557) 541 1,396 1,161
Other operating items 437 340 0 0 0
Operating cash flow before interest
24,823 15,730 19,258 20,398 22,397
Financial expense (34) (50) (168) (168) (168)
Non‐operating income 120 900 5,361 6,246 8,086
Operating cash flow after interest 24,909 16,580 24,450 26,475 30,314
Capital expenditure (7,460) (7,874) (7,000) (3,000) (3,000)
Long‐term investments 834 (23,253) 0 0 0
Others 1,924 26,574 0 0 0
Free cash flow 20,208 12,027 17,450 23,475 27,314
Equity raising 195 361 0 0 0
Borrowings 390 247 0 0 0
Dividend (3,171) (3,482) (4,091) (3,930) (4,093)
Net chg in cash and equivalents 17,621 9,153 13,359 19,546 23,221
Source: Company, IIFL Research
81

India – Auto
This Page is kept blank intentionally
82

CMP Rs523
Target 12m Rs590 (13%)
Market cap (US$ m) 9,146
Enterprise value (US$ m) 7,800
Bloomberg MM IN
Sector Auto
Dec 18 2019 52Wk High/Low (Rs) 814/503
Shares o/s (m) 1243
Daily volume (US$ m) 31
Dividend yield FY21ii (%) 1.6
Free float (%) 75.8
Shareholding pattern (%)
Promoter 24.3
‐‐‐Pledged (as % of promoter share)
3.1
FII 34.2
DII 27.8
Price performance (%)
1M 3M 1Y
M&M (8.9) (0.8) (32.2)
Absolute (US$) (7.9) (0.5) (31.9)
Rel. to Sensex (12.1) (14.5) (46.5)
CAGR (%) 3 yrs 5 yrs
EPS 15.4 7.0
Stock movement
Joseph George [email protected] 91 22 4646 4667 Suraj Chheda [email protected] 91 22 4646 4656
www.iiflcap.com
0
500
1,000
1,500
0
10,000
20,000
30,000
Dec‐17
Feb‐18
Apr‐18
Jun‐18
Aug‐18
Oct‐18
Dec‐18
Feb‐19
Apr‐19
Jun‐19
Aug‐19
Oct‐19
Dec‐19
Vol('000, LHS) Price (Rs., RHS)
Financial summary (Rs m)Y/e 31 Mar, Parent FY18A FY19A FY20ii FY21ii FY22iiRevenues (Rs m) 486,856 536,140 492,037 530,208 583,769 Ebitda margins (%) 12.8 12.4 12.0 11.8 12.0 Pre‐exceptional PAT (Rs m) 39,224 48,258 40,951 41,626 45,602 Reported PAT (Rs m) 43,560 47,960 53,255 41,626 45,602 Pre‐exceptional EPS (Rs) 34.4 42.3 35.3 35.9 39.4 Growth (%) 26.7 23.0 (16.5) 1.6 9.6 IIFL vs consensus (%) (0.9) (2.7) (7.4) PER (x) 15.2 12.3 14.8 14.5 13.3 ROE (%) 13.7 15.0 11.3 10.5 10.7 Net debt/equity (x) (0.1) (0.1) (0.1) (0.1) (0.1) EV/Ebitda (x) 8.9 8.3 9.7 9.2 8.2 Price/book (x) 2.0 1.7 1.6 1.5 1.4 OCF/Ebitda (x) 1.1 0.7 0.9 0.8 0.9 Source: Company, IIFL Research. Price as at close of business on 18 December 2019.
Mahindra & Mahindra ADD
Muted earnings growth We expect M&M’s earnings growth to be muted over the next two years, despite our forecast of revival in the Auto sector. This is primarily due to lack of volume growth in the UV segment for M&M and a relatively muted earnings rebound in tractors (low operating leverage). LCVs may revive next year, but that alone may not be enough. The other issue with M&M is the continued flow of capital into subsidiaries, many of which are loss-making. These losses more than offset the share of profits from higher quality investments, resulting in consolidated PAT being equal to or lower than standalone PAT (incl. MVML).
Continued market-share loss in UVs/PVs disheartening: M&M’s market-share in the UV segment continues to fall. There is a constant flow of new UV models from competition, while M&M’s own new models are not finding enough traction in the market-place. Even if we look at M&M’s overall PV market-share (to adjust for high growth in UV industry, which M&M is not able to match), it has been consistently coming down. Although M&M is able to hold on to its LCV market-share, fall in UV revenue weighs on overall Auto segment performance.
Tractor industry may revive in FY21ii: We expect the tractor industry to decline 8% in FY20ii, after three years of a strong up-cycle, when volumes grew at 17% Cagr. Given the surplus monsoon (high reservoir level) and a potential good Rabi crop, we now expect 5% increase in tractor volumes in FY21ii (vs. 0% growth earlier).
Loss-making subsidiaries restrict consolidated earnings; we increase holding company discount to 50%: M&M’s consolidated PAT is lower than standalone PAT (incl. MVML), despite several profitable subsidiaries, associates and JVs. This implies that share of profits from Tech Mahindra, M&M Financial Services, etc were more than offset by losses in others. We have increased the holding company discount on listed subs to 50% from 25%, to compensate for the fact that we have not assigned any negative value to loss-making subsidiaries.
83

joseph.george@iif lcap.com
Mahindra & Mahindra – ADD
M&M’s market-share in the UV segment has come off substantially over the years. UV seems to the preferred segment for new launches from competition. M&M’s own new models are not finding enough traction in the market-place. Figure 7.1: M&M lost significant market share over the years in its key UV segment
Source: SIAM, IIFL Research
Figure 7.2: We expect the tractor industry to show modest revival over FY20‐22ii
Source: Crisil, IIFL Research
Figure 7.3: M&M’s market share in tractors largely stable at 40‐42% level
Source: Crisil, IIFL Research
55.3%47.7%
41.8%37.4% 37.9%
29.2%25.4% 25.0%
20.4%
9.4%11.6% 10.1% 8.6% 8.5% 7.8% 7.6% 7.5% 7.3%
0%
10%
20%
30%
40%
50%
60%
FY12 FY13 FY14 FY15 FY16 FY17 FY18 FY19 FY20ytd
UVs Total PVs(M&M mkt share)
‐15%
‐10%
‐5%
0%
5%
10%
15%
20%
25%
0
100,000
200,000
300,000
400,000
500,000
600,000
700,000
800,000
900,000
FY12
FY13
FY14
FY15
FY16
FY17
FY18
FY19
FY20ii
FY21ii
FY22ii
Tractor industry volumes (LHS) YoY growth (RHS)
41.8% 40.6% 41.0% 40.3% 41.3% 41.7% 41.8% 40.3% 41.8%
0%
5%
10%
15%
20%
25%
30%
35%
40%
45%
FY12 FY13 FY14 FY15 FY16 FY17 FY18 FY19 FY20ytd
M&M's tractor market share
84

Mahindra & Mahindra – ADD
joseph.george@iif lcap.com
Figure 7.4: M&M’s LCV market share trend
Source: SIAM, IIFL Research
M&M’s consolidated PAT is lower than standalone PAT (incl. MVML), despite several profitable subsidiaries, associates and JVs. This implies that share of profits from Tech Mahindra, M&M Financial Services, etc. are more than offset by losses in others. Figure 7.5: Loss‐making subsidiaries restrict consolidated earnings
Source: Company, IIFL Research; *Note: Pre‐exceptional profit after tax
We have increased the holding company discount on listed subs to 50% from 25%, to compensate for the fact that we have not assigned any negative value to loss-making subsidiaries. Figure 7.6: SoTP‐based TP of Rs590
Mar‐22 EPS (Rs)
P/E
Multiple
(x)
SOTP‐based TP
(Rs)
M&M + MVML EPS, ex dividend income 35.2 12 423
Listed Subsidiaries/JVs at 50% holding co. discount 167
Target Price 590
Source: IIFL Research
29.9%32.2%
29.8% 28.8%
36.4%39.1%
41.8% 42.0%39.9% 38.3% 39.3%
0%
5%
10%
15%
20%
25%
30%
35%
40%
45%
FY10 FY11 FY12 FY13 FY14 FY15 FY16 FY17 FY18 FY19 FY20ytd
M&M's LCV market share
0
10,000
20,000
30,000
40,000
50,000
60,000
FY12 FY13 FY14 FY15 FY16 FY17 FY18 FY19 1HFY20
M&M+MVML ConsolidatedPAT* (Rs mn)
85

joseph.george@iif lcap.com
Mahindra & Mahindra – ADD
Figure 7.7: M&M – Summary of estimates
Financials (in Rs mn) FY18 FY19 FY20 FY21ii FY22ii
M&M Standalone
Auto volumes 548,618 608,617 531,677 535,285 584,821
% growth 8% 11% ‐13% 1% 9%
Tractor volumes 317,858 330,436 302,007 317,107 332,962
% growth 21% 4% ‐9% 5% 5%
Total volumes 866,476 939,053 833,684 852,392 917,784
% growth 13% 8% ‐11% 2% 8%
Revenue 486,856 536,140 492,037 530,208 583,769
% growth 11% 10% ‐8% 8% 10%
EBITDA 62,240 66,396 59,091 62,506 69,840
EBITDA margins 12.8% 12.4% 12.0% 11.8% 12.0%
PAT 39,224 48,258 40,951 41,626 45,602
EPS (Rs) 34.4 42.3 35.3 35.9 39.4
M&M+MVML
Revenue 475,774 528,482 488,035 525,992 579,026
Ebitda 70,434 75,301 66,302 69,581 77,799
EBITDA margin 14.8% 14.2% 13.6% 13.2% 13.4%
PAT 41,896 54,239 44,425 45,022 49,541
EPS (Rs) 36.8 47.6 38.3 38.9 42.8
EPS (ex‐subs dividend) 32.5 39.8 31.2 31.5 35.2
EPS growth 33.3% 22.4% ‐21.6% 1.1% 11.8%
Source: Company, IIFL Research
86

Mahindra & Mahindra – ADD
joseph.george@iif lcap.com
Company snapshot
PE chart
EV/Ebitda
‐10%
0%
10%
20%
30%
40%
50%
60%
0.0
0.2
0.4
0.6
0.8
1.0
FY11
FY12
FY13
FY14
FY15
FY16
FY17
FY18
FY19
Domestic UV volumesDomestic UV Industry YoY growth
mn units
2.0
5.0
8.0
11.0
14.0
17.0
20.0
23.0
Apr‐08 Aug‐10 Dec‐12 Apr‐15 Aug‐17 Dec‐19
12m fwd EV/EBITDA Avg +/‐ 1SD
(x)
2.0
6.0
10.0
14.0
18.0
22.0
26.0
Apr‐08 Aug‐10 Dec‐12 Apr‐15 Aug‐17 Dec‐19
12m fwd PE Avg +/‐ 1SD
(x)
UV35%
CV24%
3Ws2%
Tractors31%
Others, incl.
exports8%
Revenue break-up - FY19
Assumptions Y/e 31 Mar, Parent FY18A FY19A FY20ii FY21ii FY22ii
UVs & Cars 234,744 237,250 202,041 203,717 217,907
Pick‐ups & CVs 231,022 266,052 226,751 225,134 253,245
3W (incl. exports) 57,638 70,472 70,132 70,407 74,039
4W exports 25,214 34,843 32,752 36,028 39,630
Tractors 317,858 330,436 302,007 317,107 332,962
Total 866,476 939,053 833,684 852,392 917,784
Source: Company, IIFL Research
Management Name Designation
Anand Mahindra Executive Chairman
Pawan Goenka Managing Director
V S Parthasarathy Group CFO & Group CIO
Background: M&M is the flagship company of the Mahindra Group, which consists of diverse business interests across the globe and aggregate revenues of around US$ 21.0 billion. M&M’s six key businesses are: Automotive and farm equipment, financial services, steel processing and trading, infrastructure and hospitality, and IT Services. Some of M&M’s key listed subsidiaries/associates are Tech Mahindra, Mahindra & Mahindra Financial Services, Mahindra Holidays & Resorts, Mahindra Lifespace Developers, and Ssangyong Motor Company.
87

joseph.george@iif lcap.com
Mahindra & Mahindra – ADD
Income statement summary (Rs m)
Y/e 31 Mar, Parent FY18A FY19A FY20ii FY21ii FY22ii
Revenues 486,856 536,140 492,037 530,208 583,769
Ebitda 62,240 66,396 59,091 62,506 69,840
Depreciation and amortisation (14,794) (18,604) (22,181) (24,927) (28,077)
Ebit 47,446 47,792 36,911 37,579 41,763
Non‐operating income 10,364 16,890 16,748 16,816 17,730
Financial expense (1,122) (1,134) (1,157) (1,029) (1,029)
PBT 56,688 63,547 52,502 53,366 58,464
Exceptionals 4,336 (297) 12,303 0 0
Reported PBT 61,024 63,250 64,805 53,366 58,464
Tax expense (17,464) (15,290) (11,550) (11,741) (12,862)
PAT 43,560 47,960 53,255 41,626 45,602
Minorities, Associates etc. 0 0 0 0 0
Attributable PAT 43,560 47,960 53,255 41,626 45,602
Ratio analysis
Y/e 31 Mar, Parent FY18A FY19A FY20ii FY21ii FY22ii
Per share data (Rs)
Pre‐exceptional EPS 34.4 42.3 35.3 35.9 39.4
DPS 7.5 8.5 8.5 8.5 9.0
BVPS 266.0 300.2 330.2 355.1 383.3
Growth ratios (%)
Revenues 10.5 10.1 (8.2) 7.8 10.1
Ebitda 37.9 6.7 (11.0) 5.8 11.7
EPS 26.7 23.0 (16.5) 1.6 9.6
Profitability ratios (%)
Ebitda margin 12.8 12.4 12.0 11.8 12.0
Ebit margin 9.7 8.9 7.5 7.1 7.2
Tax rate 28.6 24.2 17.8 22.0 22.0
Net profit margin 8.9 8.9 10.8 7.9 7.8
Return ratios (%)
ROE 13.7 15.0 11.3 10.5 10.7
ROCE 18.3 18.2 13.6 12.7 12.9
Solvency ratios (x)
Net debt‐equity (0.1) (0.1) (0.1) (0.1) (0.1)
Net debt to Ebitda (0.6) (0.6) (0.6) (0.5) (0.5)
Interest coverage 42.3 42.1 31.9 36.5 40.6
Source: Company, IIFL Research
Financial summary
88

Mahindra & Mahindra – ADD
joseph.george@iif lcap.com
Balance sheet summary (Rs m)
Y/e 31 Mar, Parent FY18A FY19A FY20ii FY21ii FY22ii
Cash & cash equivalents 68,312 67,156 60,727 55,468 60,337
Inventories 27,017 38,393 33,305 34,235 37,666
Receivables 31,730 39,463 36,217 39,026 42,969
Other current assets 69,971 66,439 64,309 66,152 68,738
Creditors 86,034 96,782 88,820 95,711 105,379
Other current liabilities 53,139 56,042 44,356 44,112 48,470
Net current assets 57,857 58,627 61,381 55,058 55,861
Fixed assets 75,877 83,215 101,034 116,107 128,030
Intangibles 34,005 41,801 41,801 41,801 41,801
Investments 167,556 190,505 210,505 230,505 250,505
Other long‐term assets 0 0 0 0 0
Total net assets 335,294 374,147 414,721 443,471 476,196
Borrowings 29,581 25,713 25,713 25,713 25,713
Other long‐term liabilities 2,772 6,341 6,341 6,341 6,341
Shareholders equity 302,940 342,092 382,666 411,416 444,142
Total liabilities 335,294 374,147 414,721 443,471 476,196
Cash flow summary (Rs m)
Y/e 31 Mar, Parent FY18A FY19A FY20ii FY21ii FY22ii
Ebit 47,446 47,792 36,911 37,579 41,763
Tax paid (12,887) (14,341) (11,550) (11,741) (12,862)
Depreciation and amortization 14,794 18,604 22,181 24,927 28,077
Net working capital change 17,803 (5,060) (9,184) 1,064 4,066
Other operating items 3,031 2,244 12,303 0 0
Operating cash flow before interest
70,187 49,239 50,660 51,830 61,044
Financial expense (1,695) (1,710) (1,157) (1,029) (1,029)
Non‐operating income 6,586 12,064 16,748 16,816 17,730
Operating cash flow after interest 75,079 59,593 66,251 67,617 77,745
Capital expenditure (26,688) (30,316) (40,000) (40,000) (40,000)
Long‐term investments (19,623) (19,733) (20,000) (20,000) (20,000)
Others (4,759) 3,142 0 0 0
Free cash flow 24,008 12,687 6,251 7,617 17,745
Equity raising 0 0 0 0 0
Borrowings 592 (3,725) 0 0 0
Dividend (9,230) (10,117) (12,681) (12,876) (12,876)
Net chg in cash and equivalents 15,370 (1,156) (6,429) (5,259) 4,869
Source: Company, IIFL Research
89

India – Auto
This Page is kept blank intentionally
90

CMP Rs446
Target 12m Rs380 (‐15%)
Market cap (US$ m) 2,980
Enterprise value (US$ m) 3,171
Bloomberg TVSL IN
Sector Auto
Dec 18 2019 52Wk High/Low (Rs) 586/338
Shares o/s (m) 475
Daily volume (US$ m) 14
Dividend yield FY21ii (%) 0.9
Free float (%) 42.6
Shareholding pattern (%)
Promoter 57.4
‐‐‐Pledged (as % of promoter share)
0.0
FII 13.2
DII 19.0
Price performance (%)
1M 3M 1Y
TVS Motor Company
(1.4) 19.1 (22.4)
Absolute (US$) (0.3) 19.5 (22.9)
Rel. to Sensex (4.5) 5.5 (36.8)
CAGR (%) 3 yrs 5 yrs
EPS 11.1 20.4
Stock movement
Joseph George [email protected] 91 22 4646 4667 Suraj Chheda [email protected] 91 22 4646 4656
www.iiflcap.com
0
200
400
600
800
1,000
0
5,000
10,000
15,000
Dec‐17
Feb‐18
Apr‐18
Jun‐18
Aug‐18
Oct‐18
Dec‐18
Feb‐19
Apr‐19
Jun‐19
Aug‐19
Oct‐19
Dec‐19
Vol('000, LHS) Price (Rs., RHS)
1 1
Financial summary (Rs m)Y/e 31 Mar, Parent FY18A FY19A FY20ii FY21ii FY22iiRevenues (Rs m) 151,754 182,099 175,367 206,070 231,472 Ebitda margins (%) 7.7 7.9 8.4 8.0 8.3 Pre‐exceptional PAT (Rs m) 6,626 6,701 6,510 7,620 9,290 Reported PAT (Rs m) 6,626 6,701 7,271 7,620 9,290 Pre‐exceptional EPS (Rs) 13.9 14.1 13.7 16.0 19.6 Growth (%) 18.7 1.1 (2.9) 17.1 21.9 IIFL vs consensus (%) (9.9) (7.6) (6.0) PER (x) 31.9 31.6 32.5 27.8 22.8 ROE (%) 25.1 21.5 18.0 18.4 19.6 Net debt/equity (x) 0.4 0.4 0.3 0.2 0.1 EV/Ebitda (x) 19.0 15.7 15.2 13.4 11.3 Price/book (x) 7.3 6.3 5.5 4.8 4.2 OCF/Ebitda (x) 1.1 0.8 0.8 0.9 0.9 Source: Company, IIFL Research. Price as at close of business on 18 December 2019.
TVS Motor SELL
Expensive valuations ignore earnings risk TVS has been trading at high valuations over the past 3-4 years, due to expectations of market-share gain and margin improvement. TVS’ market-share improved in initial years, but has started to come off now. Decline in mopeds will add to the pressure. As regards margins, the company never came close to its double-digit margin target (set in FY14 for FY18). Despite benefits from new accounting standards, reported margin was below 8% in FY19. We believe BS-VI poses a bigger risk for TVS vs. peers, due to its low margin and high EPS sensitivity. Despite building some benefit of doubt on cost-cutting initiatives, we find the stock expensive at 28x FY21ii EPS.
Market-share coming off: TVS’ domestic 2W market-share has been coming off in recent quarters, as the benefit of new models is waning. As a result, it has been under-performing peers. Relatively better performance in exports has offset the domestic under-performance to some extent.
We see high risk to earnings post BS-VI: TVS operates at much lower Ebitda margins compared with peers. Post the transition to BS-VI, if industry profitability were to come off due to OEMs’ inability to fully pass on costs, TVS would be the most vulnerable. A 100bps fall in margin would hurt TVS’ EPS by ~20% vs. 8% for Hero and 5% for Bajaj. TVS derives ~20% of its volumes from mopeds; this segment may see pressure on volumes/margins post BS-VI, as the customer here is very price-conscious. Net-net, BS-VI is a far bigger risk event for TVS vs. peers.
Stock expensive, despite benefit of doubt on earnings: Our EPS estimates are 6-10% below Consensus’, despite building some benefit of doubt on margin assumptions (cost cutting). The stock is trading at 28x FY21ii EPS, which is at a premium to peers’ and similar to Maruti’s. The difference between TVS and Maruti is that Maruti is currently operating at 10% margin, which is 5ppt below its recent average, implying high probability of rebound as demand improves. For TVS, 8% is the highest margin that it has managed to clock in the past 15 years and includes some benefits from accounting changes; there is nothing cyclical about this.
91

joseph.george@iif lcap.com
TVS Motor – SELL
2
TVS’ 2W market share has been coming off in recent quarters with higher competition from Bajaj and sharp decline in mopeds. Figure 8.1: TVS’ domestic 2W market share has been coming off in recent quarters
Source: SIAM, IIFL Research
Figure 8.2: TVS’ export volumes continues to grow YoY
Source: SIAM, IIFL Research
Ebitda margin seems to have improved from 6.0% in FY15 to 8.4% in 1HFY20. However, about 70-80bps of this gain has come from accounting changes, which resulted in cost being shifted from above Ebitda to below and other income being shifted from below Ebitda to above. The true picture on margins is conveyed at the PBT level. Figure 8.3: Reported Ebitda margin has benefitted from accounting changes
Source: Company, IIFL Research
13.2% 13.4% 14.2% 14.2% 12.9%15.0%
16.3%15.2% 14.2% 14.3% 14.0%
0%
5%
10%
15%
20%
25%
FY15
FY16
FY17
FY18
1QFY19
2QFY19
3QFY19
4QFY19
1QFY20
2QFY20
3QFY20
Scooters Motorcycles Overall 2Ws(Mkt share)
0%
10%
20%
30%
40%
50%
60%
0
50,000
100,000
150,000
200,000
250,000
4QFY17
1QFY18
2QFY18
3QFY18
4QFY18
1QFY19
2QFY19
3QFY19
4QFY19
1QFY20
2QFY20
3QFY20E
TVS Export volumes (LHS) YoY growth (RHS)
6.1% 6.0%
7.3% 7.1%7.7% 7.9%
8.4%
4.5% 4.5%
5.7% 5.8% 5.8%5.3% 5.0%
0%
2%
4%
6%
8%
10%
FY14 FY15 FY16 FY17 FY18 FY19 1HFY20
Ebitda margin (%) PBT margin (%)
20bps benefit due to accounting change60bps benefit due to
accounting change
92

TVS Motor – SELL
joseph.george@iif lcap.com 3
In 2014, the management guided to a double-digit margin target by FY18, which the company never came close to. If we strip out the benefit of accounting change from FY18 reported Ebitda margin, it would have been close to 7%. Due to high expectations which were never met, consensus EPS has been seeing continuous downgrades – even before the current industry slowdown. Figure 8.4: TVS Motor – Consensus EPS has seen continuous downgrades
Source: Bloomberg, IIFL Research
Figure 8.5: TVS Motor – Summary of estimates
Financials (in Rs mn) FY18 FY19 FY20ii FY21ii FY22ii
Domestic Motorcycles 916,776 1,013,701 853,948 977,042 1,084,516
% growth 18.6% 10.6% ‐15.8% 14.4% 11.0%
Domestic Mopeds 859,518 880,243 676,664 675,108 708,863
% growth ‐3.5% 2.4% ‐23.1% ‐0.2% 5.0%
Domestic Scooters 1,099,133 1,241,327 1,132,347 1,173,803 1,338,136
% growth 33.0% 12.9% ‐8.8% 3.7% 14.0%
2W exports 491,960 622,019 689,624 772,379 849,617
% growth 33.8% 26.4% 10.9% 12.0% 10.0%
Domestic 3Ws 16,429 16,715 13,665 16,804 16,804
% growth 33.8% 1.7% ‐18.2% 23.0% 0.0%
Export 3Ws 82,255 139,719 165,595 190,434 219,000
% growth 44.4% 69.9% 18.5% 15.0% 15.0%
Total volumes 3,466,071 3,913,724 3,531,843 3,805,571 4,216,936
% growth 18.4% 12.9% ‐9.8% 7.8% 10.8%
Revenue 151,754 182,099 175,367 206,070 231,472
% growth 25.1% 20.0% ‐3.7% 17.5% 12.3%
Ebitda 11,750 14,333 14,773 16,486 19,100
Ebitda margin 7.7% 7.9% 8.4% 8.0% 8.3%
Ebit 8,362 10,340 9,902 11,023 13,000
PAT 6,626 6,701 6,510 7,620 9,290
% growth 18.7% 1.1% ‐2.9% 17.1% 21.9%
EPS (Rs) 13.9 14.1 13.7 16.0 19.6
Source: Company, IIFL Research
1416
1820
22
2426
2830
32
Apr‐18
May‐18
Jun‐18
Jul‐18
Aug‐18
Sep‐18
Oct‐18
Nov‐18
Dec‐18
Jan‐19
Feb‐19
Mar‐19
Apr‐19
May‐19
Jun‐19
Jul‐19
Aug‐19
Sep‐19
Oct‐19
Nov‐19
Dec‐19
FY19E EPS FY20E EPS FY21E EPS FY22E EPS
93

joseph.george@iif lcap.com
TVS Motor – SELL
4
Company snapshot
PER
EV/Ebitda
‐10%
0%
10%
20%
30%
0
1,000,000
2,000,000
3,000,000
4,000,000
5,000,000
FY13
FY14
FY15
FY16
FY17
FY18
FY19
TVS volume trend
Volumes Growth
3.0
7.0
11.0
15.0
19.0
23.0
27.0
Apr‐08 Aug‐10 Dec‐12 Apr‐15 Aug‐17 Dec‐19
12m fwd EV/EBITDA Avg +/‐ 1SD
(x)
3.0
11.0
19.0
27.0
35.0
43.0
51.0
Apr‐08 Aug‐10 Dec‐12 Apr‐15 Aug‐17 Dec‐19
12m fwd PE Avg +/‐ 1SD
(x)
Domestic motorcycle
s27%
Dometic mopeds12%
Domestic scooters26%
Domestic 3W1%
Exports 2W16%Exports 3W7%
Spares and others11%
Standalone rev mix (%) - FY19E
Assumptions Y/e 31 Mar FY18A FY19A FY20ii FY21ii FY22ii
Motorcycles 1,355,541 1,559,297 1,472,568 1,669,897 1,846,657
% growth 25.9% 15.0% ‐5.6% 13.4% 10.6%
Mopeds 876,930 896,917 688,900 688,812 723,938
% growth ‐3.7% 2.3% ‐23.2% 0.0% 5.1%
Scooters 1,134,916 1,301,076 1,191,114 1,239,623 1,410,537
% growth 30.4% 14.6% ‐8.5% 4.1% 13.8%
3Ws 98,684 156,434 179,260 207,239 235,804
% growth 42.5% 58.5% 14.6% 15.6% 13.8%
Total 3,466,071 3,913,724 3,531,843 3,805,571 4,216,936
% growth 18.4% 12.9% ‐9.8% 7.8% 10.8%
Source: Company, IIFL Research
Management Name Designation
Venu Srinivasan Chairman & MD
Sudarshan Venu Joint MD
K N Radhakrishnan President & CEO
Background: TVS Motor Company Ltd (TVS Motor), member of the TVS group, is the largest company of the group. TVS Motor Company is the third largest two-wheeler manufacturer in India. TVS Motor currently manufactures a wide range of two-wheelers as well as three-wheelers. The company has four manufacturing plants, three located in India (Hosur, Tamil Nadu and Mysore, Karnataka and Nalagarh, Himachal Pradesh) and one in Indonesia (Karawang).
94

TVS Motor – SELL
joseph.george@iif lcap.com 5
Income statement summary (Rs m)
Y/e 31 Mar, Parent FY18A FY19A FY20ii FY21ii FY22ii
Revenues 151,754 182,099 175,367 206,070 231,472
Ebitda 11,750 14,333 14,773 16,486 19,100
Depreciation and amortisation (3,387) (3,993) (4,872) (5,463) (6,100)
Ebit 8,362 10,340 9,902 11,023 13,000
Non‐operating income 990 75 100 100 100
Financial expense (566) (806) (1,204) (935) (680)
PBT 8,786 9,610 8,798 10,188 12,420
Exceptionals 0 0 760 0 0
Reported PBT 8,786 9,610 9,558 10,188 12,420
Tax expense (2,161) (2,908) (2,287) (2,567) (3,130)
PAT 6,626 6,701 7,271 7,620 9,290
Minorities, Associates etc. 0 0 0 0 0
Attributable PAT 6,626 6,701 7,271 7,620 9,290
Ratio analysis
Y/e 31 Mar, Parent FY18A FY19A FY20ii FY21ii FY22ii
Per share data (Rs)
Pre‐exceptional EPS 13.9 14.1 13.7 16.0 19.6
DPS 3.3 3.5 3.5 4.0 4.5
BVPS 60.6 70.5 81.6 92.8 107.0
Growth ratios (%)
Revenues 25.1 20.0 (3.7) 17.5 12.3
Ebitda 37.1 22.0 3.1 11.6 15.9
EPS 18.7 1.1 (2.9) 17.1 21.9
Profitability ratios (%)
Ebitda margin 7.7 7.9 8.4 8.0 8.3
Ebit margin 5.5 5.7 5.6 5.3 5.6
Tax rate 24.6 30.3 23.9 25.2 25.2
Net profit margin 4.4 3.7 4.1 3.7 4.0
Return ratios (%)
ROE 25.1 21.5 18.0 18.4 19.6
ROCE 23.9 22.7 19.1 19.8 22.2
Solvency ratios (x)
Net debt‐equity 0.4 0.4 0.3 0.2 0.1
Net debt to Ebitda 1.0 0.9 0.9 0.6 0.3
Interest coverage 14.8 12.8 8.2 11.8 19.1
Source: Company, IIFL Research
Financial summary
95

joseph.george@iif lcap.com
TVS Motor – SELL
6
Balance sheet summary (Rs m)
Y/e 31 Mar, Parent FY18A FY19A FY20ii FY21ii FY22ii
Cash & cash equivalents 110 440 1,336 1,531 2,934
Inventories 9,644 11,759 10,983 13,233 14,825
Receivables 9,684 14,141 13,453 15,808 17,757
Other current assets 6,741 5,981 5,981 5,981 5,981
Creditors 24,860 29,239 33,625 38,669 44,469
Other current liabilities 4,525 4,855 (1,746) (293) (1,475)
Net current assets (3,206) (1,773) (126) (1,822) (1,498)
Fixed assets 24,466 27,835 28,963 30,500 31,400
Intangibles 564 530 530 530 530
Investments 20,354 23,007 25,507 28,007 30,507
Other long‐term assets 0 0 0 0 0
Total net assets 42,178 49,600 54,875 57,215 60,939
Borrowings 11,892 14,000 14,000 11,000 8,000
Other long‐term liabilities 1,482 2,126 2,126 2,126 2,126
Shareholders equity 28,804 33,473 38,748 44,088 50,813
Total liabilities 42,178 49,600 54,875 57,215 60,939
Cash flow summary (Rs m)
Y/e 31 Mar, Parent FY18A FY19A FY20ii FY21ii FY22ii
Ebit 8,362 10,340 9,902 11,023 13,000
Tax paid (2,465) (2,300) (2,287) (2,567) (3,130)
Depreciation and amortization 3,387 3,993 4,872 5,463 6,100
Net working capital change 3,668 (1,257) (747) 1,606 793
Other operating items 21 203 760 0 0
Operating cash flow before interest
12,973 10,978 12,500 15,525 16,764
Financial expense (582) (857) (1,204) (935) (680)
Non‐operating income 78 66 100 100 100
Operating cash flow after interest 12,469 10,187 11,396 14,690 16,184
Capital expenditure (7,698) (7,334) (6,000) (7,000) (7,000)
Long‐term investments (3,694) (2,754) (2,500) (2,500) (2,500)
Others (888) (1,437) 0 0 0
Free cash flow 190 (1,339) 2,896 5,190 6,684
Equity raising (3) (4) 0 0 0
Borrowings 1,711 3,668 0 (3,000) (3,000)
Dividend (1,876) (2,000) (2,000) (1,995) (2,280)
Net chg in cash and equivalents 21 326 896 195 1,403
Source: Company, IIFL Research
96

India – Auto
This Page is kept blank intentionally
97

joseph.george@iif lcap.com
India - Auto
Disclosure: Published in 2019, © IIFL Securities Limited (Formerly ‘India Infoline Limited’) 2019 India Infoline Group (hereinafter referred as IIFL) is engaged in diversified financial services business including equity broking, DP services, merchant banking, portfolio management services, distribution of Mutual Fund, insurance products and other investment products and also loans and finance business. India Infoline Ltd (“hereinafter referred as IIL”) is a part of the IIFL and is a member of the National Stock Exchange of India Limited (“NSE”) and the BSE Limited (“BSE”). IIL is also a Depository Participant registered with NSDL & CDSL, a SEBI registered merchant banker and a SEBI registered portfolio manager. IIL is a large broking house catering to retail, HNI and institutional clients. It operates through its branches and authorised persons and sub-brokers spread across the country and the clients are provided online trading through internet and offline trading through branches and Customer Care. a) This research report (“Report”) is for the personal information of the authorized recipient(s) and is not for public distribution and
should not be reproduced or redistributed to any other person or in any form without IIL’s prior permission. The information provided in the Report is from publicly available data, which we believe, are reliable. While reasonable endeavors have been made to present reliable data in the Report so far as it relates to current and historical information, but IIL does not guarantee the accuracy or completeness of the data in the Report. Accordingly, IIL or any of its connected persons including its directors or subsidiaries or associates or employees shall not be in any way responsible for any loss or damage that may arise to any person from any inadvertent error in the information contained, views and opinions expressed in this publication.
b) Past performance should not be taken as an indication or guarantee of future performance, and no representation or warranty, express or implied, is made regarding future performance. Information, opinions and estimates contained in this report reflect a judgment of its original date of publication by IIFL and are subject to change without notice. The price, value of and income from any of the securities or financial instruments mentioned in this report can fall as well as rise. The value of securities and financial instruments is subject to exchange rate fluctuation that may have a positive or adverse effect on the price or income of such securities or financial instruments.
c) The Report also includes analysis and views of our research team. The Report is purely for information purposes and does not construe to be investment recommendation/advice or an offer or solicitation of an offer to buy/sell any securities. The opinions expressed in the Report are our current opinions as of the date of the Report and may be subject to change from time to time without notice. IIL or any persons connected with it do not accept any liability arising from the use of this document.
d) Investors should not solely rely on the information contained in this Report and must make investment decisions based on their own investment objectives, judgment, risk profile and financial position. The recipients of this Report may take professional advice before acting on this information.
e) IIL has other business segments / divisions with independent research teams separated by 'Chinese walls' catering to different sets of customers having varying objectives, risk profiles, investment horizon, etc and therefore, may at times have, different and contrary views on stocks, sectors and markets.
f) This report is not directed or intended for distribution to, or use by, any person or entity who is a citizen or resident of or located in any locality, state, country or other jurisdiction, where such distribution, publication, availability or use would be contrary to local law, regulation or which would subject IIL and its affiliates to any registration or licensing requirement within such jurisdiction. The securities described herein may or may not be eligible for sale in all jurisdictions or to certain category of investors. Persons in whose possession this Report may come are required to inform themselves of and to observe such restrictions.
g) As IIL along with its associates, are engaged in various financial services business and so might have financial, business or other interests in other entities including the subject company(ies) mentioned in this Report. However, IIL encourages independence in preparation of research report and strives to minimize conflict in preparation of research report. IIL and its associates did not receive any compensation or other benefits from the subject company(ies) mentioned in the Report or from a third party in connection with preparation of the Report. Accordingly, IIL and its associates do not have any material conflict of interest at the time of publication of this Report.
h) As IIL and its associates are engaged in various financial services business, it might have:-
(a) received any compensation (except in connection with the preparation of this Report) from the subject company in the past twelve months; (b) managed or co-managed public offering of securities for the subject company in the past twelve months; (c) received any compensation for investment banking or merchant banking or brokerage services from the subject company in the past twelve months; (d) received any compensation for products or services other than investment banking or merchant banking or brokerage services from the subject company in the past twelve months; (e) engaged in market making activity for the subject company.
i) IIL and its associates collectively do not own (in their proprietary position) 1% or more of the equity securities of the subject company mentioned in the report as of the last day of the month preceding the publication of the research report.
j) The Research Analyst engaged in preparation of this Report or his/her relative:-
(a) does not have any financial interests in the subject company (ies) mentioned in this report; (b) does not own 1% or more of the equity securities of the subject company mentioned in the report as of the last day of the month preceding the publication of the research report; (c) does not have any other material conflict of interest at the time of publication of the research report.
k) The Research Analyst engaged in preparation of this Report:-
(a) has not received any compensation from the subject company in the past twelve months; (b) has not managed or co-managed public offering of securities for the subject company in the past twelve months; (c) has not received any compensation for investment banking or merchant banking or brokerage services from the subject company in the past twelve months; (d) has not received any compensation for products or services other than investment banking or merchant banking or brokerage services from the subject company in the past twelve months; (e) has not received any compensation or other benefits from the subject company or third party in connection with the research report; (f) has not served as an officer, director or employee of the subject company; (g) is not engaged in market making activity for the subject company.
l) IIFLCAP accepts responsibility for the contents of this research report, subject to the terms set out below, to the extent that it is delivered to a U.S. person other than a major U.S. institutional investor. The analyst whose name appears in this research report is not registered or qualified as a research analyst with the Financial Industry Regulatory Authority (“FINRA”) and may not be an associated person of IIFLCAP and, therefore, may not be subject to applicable restrictions under FINRA Rules on communications with a subject company, public appearances and trading securities held by a research analyst account.
We submit that no material disciplinary action has been taken on IIL by any regulatory authority impacting Equity Research Analysis.
98

joseph.george@iif lcap.com
India - Auto
A graph of daily closing prices of securities is available at http://www.nseindia.com/ChartApp/install/charts/mainpage.jsp, www.bseindia.com and http://economictimes.indiatimes.com/markets/stocks/stock-quotes. (Choose a company from the list on the browser and select the “three years” period in the price chart).
Name, Qualification and Certification of Research Analyst: Joseph George (Chartered Accountant, Chartered Financial Analyst), Suraj Chheda (PGDM)
IIFL Securities Limited (Formerly ‘India Infoline Limited’), CIN No.: U99999MH1996PLC132983, Corporate Office – IIFL Centre, Kamala City, Senapati Bapat Marg, Lower Parel, Mumbai – 400013 Tel: (91-22) 4249 9000 .Fax: (91-22) 40609049, Regd. Office – IIFL House, Sun Infotech Park, Road No. 16V, Plot No. B-23, MIDC, Thane Industrial Area, Wagle Estate, Thane – 400604 Tel: (91-22) 25806650. Fax: (91-22) 25806654 E-mail: [email protected] Website: www.indiainfoline.com, Refer www.indiainfoline.com for detail of Associates.
Stock Broker SEBI Regn.: INZ000164132, PMS SEBI Regn. No. INP000002213, IA SEBI Regn. No. INA000000623, SEBI RA Regn.:- INH000000248
Key to our recommendation structure
BUY - Stock expected to give a return 10%+ more than average return on a debt instrument over a 1-year horizon.
SELL - Stock expected to give a return 10%+ below the average return on a debt instrument over a 1-year horizon.
Add - Stock expected to give a return 0-10% over the average return on a debt instrument over a 1-year horizon.
Reduce - Stock expected to give a return 0-10% below the average return on a debt instrument over a 1-year horizon.
Distribution of Ratings: Out of 216 stocks rated in the IIFL coverage universe, 114 have BUY ratings, 7 have SELL ratings, 61 have ADD ratings and 32 have REDUCE ratings.
Price Target: Unless otherwise stated in the text of this report, target prices in this report are based on either a discounted cash flow valuation or comparison of valuation ratios with companies seen by the analyst as comparable or a combination of the two methods. The result of this undamental valuation is adjusted to reflect the analyst’s views on the likely course of investor sentiment. Whichever valuation method is used there is a significant risk that the target price will not be achieved within the expected timeframe. Risk factors include unforeseen changes in competitive pressures or in the level of demand for the company’s products. Such demand variations may result from changes in technology, in the overall level of economic activity or, in some cases, in fashion. Valuations may also be affected by changes in taxation, in exchange rates and, in certain industries, in regulations. Investment in overseas markets and instruments such as ADRs can result in increased risk from factors such as exchange rates, exchange controls, taxation, and political and social conditions. This discussion of valuation methods and risk factors is not comprehensive – further information is available upon request.
Date Close price (Rs)
Target price (Rs)
Rating
25 Oct 2019 7391 7700 BUY 22 Aug 2019 6229 6640 BUY 29 Jul 2019 5806 6800 BUY
26 Apr 2019 6903 7500 BUY 28 Jan 2019 6513 7700 BUY 26 Oct 2018 6723 8900 BUY 27 Jul 2018 9397 10840 BUY
30 Apr 2018 8783 10400 BUY 29 Jan 2018 9278 10500 BUY 30 Oct 2017 8114 8500 BUY 28 Jul 2017 7592 7850 BUY 27 Jan 2017 5803 5925 BUY
Date Close price (Rs)
Target price (Rs)
Rating
13 Nov 2019 77 80 ADD 02 Aug 2019 69 73 ADD 27 May 2019 94 100 ADD 14 Nov 2018 119 130 ADD 19 Jul 2018 113 145 ADD
23 May 2018 140 160 ADD 10 Nov 2017 119 90 REDUCE 25 Jul 2017 104 84 REDUCE
29 May 2017 92 75 REDUCE 30 Jan 2017 87 70 REDUCE
02,0004,0006,0008,00010,00012,000
Dec‐16
Feb‐17
Apr‐17
Jun‐17
Aug‐17
Oct‐17
Dec‐17
Feb‐18
Apr‐18
Jun‐18
Aug‐18
Oct‐18
Dec‐18
Feb‐19
Apr‐19
Jun‐19
Aug‐19
Oct‐19
Dec‐19
Price TP/Reco changed date(Rs)
Maruti Suzuki: 3 year price and rating history
0
50
100
150
200
Dec‐16
Feb‐17
Apr‐17
Jun‐17
Aug‐17
Oct‐17
Dec‐17
Feb‐18
Apr‐18
Jun‐18
Aug‐18
Oct‐18
Dec‐18
Feb‐19
Apr‐19
Jun‐19
Aug‐19
Oct‐19
Dec‐19
Price TP/Reco changed date(Rs)
Ashok Leyland: 3 year price and rating history
99

joseph.george@iif lcap.com
India - Auto
Date Close price (Rs)
Target price (Rs)
Rating
29 Oct 2019 127 180 BUY 26 Jul 2019 144 185 BUY
21 May 2019 190 225 BUY 08 Feb 2019 183 215 BUY 01 Nov 2018 179 275 BUY 01 Aug 2018 264 450 BUY 24 May 2018 309 480 BUY 29 Sep 2017 401 500 BUY 10 Aug 2017 416 450 ADD 24 May 2017 451 520 ADD 15 Feb 2017 482 510 ADD
Date Close price (Rs)
Target price (Rs)
Rating
24 Oct 2019 2713 3400 BUY 15 Jul 2019 2569 2750 ADD
31 May 2019 2726 2800 ADD 01 Feb 2019 2614 2900 ADD 17 Dec 2018 3318 3300 ADD 05 Dec 2018 3062 3100 ADD 26 Jul 2018 3112 3550 ADD 26 Jul 2017 3709 4135 BUY
23 Jun 2017 3731 4050 BUY 12 May 2017 3462 3750 BUY 10 Feb 2017 3265 3500 BUY
Date Close price (Rs)
Target price (Rs)
Rating
24 Oct 2019 3163 3360 BUY 15 Jul 2019 2722 3075 BUY
20 May 2019 3040 3200 BUY 31 Jan 2019 2500 3065 BUY 05 Dec 2018 2765 3160 BUY 24 Jul 2018 2684 2900 ADD
22 May 2018 2788 3270 ADD 06 Feb 2018 3241 3560 ADD 23 Oct 2017 3260 3420 ADD 24 Jul 2017 2824 3030 ADD
22 May 2017 2970 3165 ADD 01 Feb 2017 2833 3025 ADD
Date Close price (Rs)
Target price (Rs)
Rating Date Close price (Rs)
Target price (Rs)
Rating
01 Aug 2019 16348 15700 REDUCE 02 Feb 2017 24030 22000 REDUCE 15 Jul 2019 18947 17500 REDUCE
13 May 2019 20354 16700 REDUCE 08 Mar 2019 21500 18400 REDUCE 05 Dec 2018 23385 21600 REDUCE 13 Nov 2018 21934 22200 REDUCE 10 Aug 2018 27439 26000 REDUCE 10 May 2018 30316 26400 REDUCE 17 Jan 2018 27907 24700 REDUCE 15 Nov 2017 30090 25600 REDUCE 10 Aug 2017 31489 24700 REDUCE 08 May 2017 25833 23600 REDUCE
Date Close price (Rs)
Target price (Rs)
Rating
11 Nov 2019 580 675 ADD 03 Oct 2019 557 665 ADD 08 Aug 2019 518 605 ADD 30 May 2019 672 750 ADD 11 Feb 2019 682 805 ADD 08 Aug 2018 927 1035 ADD 30 May 2018 870 980 ADD 12 Feb 2018 750 890 ADD 13 Nov 2017 1393 1600 ADD 20 Jul 2017 1382 1480 ADD
31 May 2017 1362 1475 ADD 13 Feb 2017 1278 1390 ADD
0100200300400500600
Dec‐16
Feb‐17
Apr‐17
Jun‐17
Aug‐17
Oct‐17
Dec‐17
Feb‐18
Apr‐18
Jun‐18
Aug‐18
Oct‐18
Dec‐18
Feb‐19
Apr‐19
Jun‐19
Aug‐19
Oct‐19
Dec‐19
Price TP/Reco changed date(Rs)
Tata Motors: 3 year price and rating history
0
1,000
2,000
3,000
4,000
5,000
Dec‐16
Feb‐17
Apr‐17
Jun‐17
Aug‐17
Oct‐17
Dec‐17
Feb‐18
Apr‐18
Jun‐18
Aug‐18
Oct‐18
Dec‐18
Feb‐19
Apr‐19
Jun‐19
Aug‐19
Oct‐19
Dec‐19
Price TP/Reco changed date(Rs)
Hero Motocorp: 3 year price and rating history
0500
1,0001,5002,0002,5003,0003,5004,000
Dec‐16
Feb‐17
Apr‐17
Jun‐17
Aug‐17
Oct‐17
Dec‐17
Feb‐18
Apr‐18
Jun‐18
Aug‐18
Oct‐18
Dec‐18
Feb‐19
Apr‐19
Jun‐19
Aug‐19
Oct‐19
Dec‐19
Price TP/Reco changed date(Rs)
Bajaj Auto: 3 year price and rating history
05,00010,00015,00020,00025,00030,00035,000
Dec‐16
Feb‐17
Apr‐17
Jun‐17
Aug‐17
Oct‐17
Dec‐17
Feb‐18
Apr‐18
Jun‐18
Aug‐18
Oct‐18
Dec‐18
Feb‐19
Apr‐19
Jun‐19
Aug‐19
Oct‐19
Dec‐19
Price TP/Reco changed date(Rs)
Eicher Motors: 3 year price and rating history
0
500
1,000
1,500
2,000
Dec‐16
Feb‐17
Apr‐17
Jun‐17
Aug‐17
Oct‐17
Dec‐17
Feb‐18
Apr‐18
Jun‐18
Aug‐18
Oct‐18
Dec‐18
Feb‐19
Apr‐19
Jun‐19
Aug‐19
Oct‐19
Dec‐19
Price TP/Reco changed date(Rs)
Mahindra & Mahindra: 3 year price and rating history
100

joseph.george@iif lcap.com
India - Auto
Date Close price (Rs)
Target price (Rs)
Rating
15 Jul 2019 433 335 SELL 02 May 2019 492 380 SELL 05 Dec 2018 555 445 SELL 17 May 2018 611 460 SELL 31 Jan 2018 714 410 SELL 02 Nov 2017 709 400 SELL 14 Aug 2017 537 345 SELL 28 Apr 2017 503 285 SELL 25 Jan 2017 400 260 SELL
0
200
400
600
800
1,000
Dec‐16
Feb‐17
Apr‐17
Jun‐17
Aug‐17
Oct‐17
Dec‐17
Feb‐18
Apr‐18
Jun‐18
Aug‐18
Oct‐18
Dec‐18
Feb‐19
Apr‐19
Jun‐19
Aug‐19
Oct‐19
Dec‐19
Price TP/Reco changed date(Rs)
TVS Motor: 3 year price and rating history
101

www.iiflcap.com
IIFL - IndiaIIFL Securities Limited9th Floor, IIFL Centre, Kamala City, Senapati Bapat Marg, Lower Parel (W),Mumbai - 400013Tel +91-22-4646-4600Fax +91-22-4646-4700
IIFL - USAIIFL Inc.1120 Avenue of the Americas Suite 1505,New York,NY 10036 Tel +1-212-221-6800Fax +1-646-417-5800
IIFL - UKIIFL Wealth (UK) Limited 19 Berkeley Street London - W1J 8ED, United KingdomTel +44 (0) 20 707 87208
CMP Rs6489 Target 12m Rs6300 (‐3%) Market cap (US$ m) 9,337 Enterprise value (US$ m) 9,265 Bloomberg NEST IN Sector FMCG
01 September 2016
52Wk High/Low (Rs) 7390/4981 Shares o/s (m) 96 Daily volume (US$ m) 4 Dividend yield FY16ii (%) 1.5 Free float (%) 37.2
Shareholding pattern (%) Promoter 62.8 FII 14.4 DII 5.7 Others 17.2
Price performance (%) 1M 3M 1Y Nestle India (6.7) 1.5 8.1 Absolute (US$) (6.9) 2.4 7.8 Rel. to Sensex (8.2) (4.9) (2.5) CAGR (%) 3 yrs 5 yrs EPS (5.6) 1.9
Stock movement
Percy Panthaki [email protected] 91 22 4646 4662 Avi Mehta [email protected] 91 22 4646 4650 Sameer Gupta [email protected] 91 22 4646 4672
www.iiflcap.com
0
2,000
4,000
6,000
8,000
0200400600800
1,000
Sep‐14
Nov‐14
Jan‐15
Mar‐15
May‐15
Jul‐1
5Sep‐15
Nov‐15
Jan‐16
Mar‐16
May‐16
Jul‐1
6Sep‐16
Volume (LHS)Price (RHS) (Rs)Shares (000')
Nestle India REDUCE
1
Product launches may not launch growth
Detailed report
Financial summary (Rs m) Y/e 31 Dec, Parent CY14A CY15A CY16ii CY17ii CY18iiRevenues (Rs m) 98,063 81,233 95,413 110,785 126,062 Ebitda margins (%) 21.4 20.3 21.1 21.7 22.0 Pre‐exceptional PAT (Rs m) 11,800 8,988 11,476 13,925 16,293 Reported PAT (Rs m) 11,847 5,633 11,476 13,925 16,293 Pre‐exceptional EPS (Rs) 122.4 93.2 119.0 144.4 169.0 Growth (%) 6.5 (23.8) 27.7 21.3 17.0 IIFL vs consensus (%) (3.3) (4.1) (0.8) PER (x) 53.0 69.6 54.5 44.9 38.4 ROE (%) 45.3 31.8 40.7 49.4 57.8 Net debt/equity (x) (0.2) (0.2) (0.3) (0.5) (0.7) EV/Ebitda (x) 29.6 37.7 30.6 25.4 21.9 Price/book (x) 22.1 22.2 22.2 22.2 22.2 Source: Company, IIFL Research. Price as at close of business on 01 September 2016.
Institutional Equities
Nestlé’s stock price has moved up 30% in the past six months spurred by a flurry of new launches. We believe that the huge benefit of doubt Nestle enjoys is unjustified, given its track record. Moreover, we estimate that these new launches will increase CY20 sales by just 6% and the larger debate should be what the company is doing to strengthen the core, i.e. the remaining 90%+ of its business. We believe that Nestlé’s pricing policy, under-investment in brands, and narrow definition of target market will prevent it from realising its full potential. Maintain REDUCE. Poor track record of launches: At a time when the company is struggling to grow (H1CY16 LFL sales growth approximately flat) it could do well to focus its energies on fixing its core business. Nestlé’s launch track record is poor; we estimate products launched over the past 10 years have increased CY15 sales by ~5%. Our dip-stick survey of 75 respondents in our office revealed that 25 of them had not consumed even one of Nestlé's seven major innovations of the past few years. Factors holding Nestle back: Nestlé is over-earning in India with Ebitda margins higher than those of its parent. India needs to be treated as an “invest to grow” market. Launches should serve the dual objectives of premiumisation and penetration – the latter is missing due to the narrow definition of target audience which excludes 75% of the population. Investment in A&P needs to go up dramatically and price premium to competition needs to reduce. Analysis of new launches: We analyse products launched by Nestle in the past few months and estimate that they will account for 8% of CY20 sales and add 6% to the top line (the difference being cannibalisation). Hot heads would be the biggest contributor and then a long tail of products contributing small amounts. Insta-filter could be successful, but will cannibalise existing products. Nestlé is spreading itself too thin by clubbing so many launches in a short period, which could result in sub-optimal outcomes.
India - Telecom
3Q2016
Shake off the Heebie GBs
The 2016 JIO Olympics begins
Institutional Equities
Scale of operations mn sq ft Ongoing Projects 41 Upcoming Projects 51 Land Bank 390 Source: Company, IIFL Research. Largest market share in Mumbai
Source: Bloomberg, Liases Foras, Company, IIFL Research. Largest player in India by Sales FY16 Sales Value* Rs bn Lodha Developers 65 Godrej Properties 50 DLF 32 Prestige Estates 31 Source: Company, IIFL Research. * Gross Sales reported by Company.
Mohit Agrawal [email protected] 91 22 4646 4675
www.iiflcap.com
Other, 571
LDPL, 65
FY16 Sales value (Rs bn)
Mumbai Rs636 bn
Lodha Developers
1
‘Banking’ on Mumbai Market
Detailed report
Financial summary (Rs m)Y/e 31 Mar, Consolidated FY12A FY13A FY14A FY15A FY16ARevenues (Rs m) 29,626 35,102 47,127 62,699 83,198Ebitda (Rs mn) 7,232 7,373 8,990 14,212 20,112Ebitda margins (%) 24.4 21.0 19.1 22.7 24.2Pre‐exceptional PAT (Rs m) 3,771 3,728 4,206 7,249 6,313Reported PAT (Rs m) 3,819 3,948 4,205 7,249 6,318Pre‐exceptional EPS (Rs) 17.5 17.3 19.5 33.6 29.2Growth (%) 44.4 (1.1) 12.8 72.4 (12.9)ROE (%) 40.8 25.3 19.0 26.0 18.1ROCE (%) 12.8 7.7 6.3 8.3 9.0Net debt/equity (x) 4.5 6.4 5.1 4.9 4.0Source: Company, IIFL Research.
Institutional Equities (Unlisted)
Lodha Developers (LDPL), the largest real estate developer in India by sales value, is primarily focused on residential development. More than 90% of its sales, projects, and land bank are located in the Mumbai Metropolitan region (MMR). LDPL has set an aggressive target of more than doubling turnover over the next five years. Despite the challenging demand environment in the near term, we believe LDPL is well placed given the strong growth drivers in the long term.
Strong project pipeline and land bank to support long-term growth: LDPL has more than 90mn sq. ft. of projects planned. Out of this, an ongoing 41mn sq. ft. are at various stages of completion and LDPL will execute an upcoming 51mn sq. ft. over the next 5-10 years (largely in MMR). Beyond this, it has more than 390mn sq. ft. of high-quality contiguous developable area in the extended suburbs of Mumbai. LDPL’s strong brand, aggressive sales strategy, and robust execution capability should ensure strong cash flow and earnings.
Balance sheet health to improve as execution gathers pace: LDPL’s operations have been cash-neutral-to-positive over the past five years, underpinned by robust growth in customer collections. Despite this, its debt levels have tripled over the last past five years due to aggressive land buying across the premium markets of Mumbai and London. LDPL plans to deleverage by: 1) increasing focus on execution to accelerate collections; 2) monetizing completed or near-complete inventory of Rs60bn; 3) moderating its capex in land; and 4) reducing its borrowing costs. In the near term, however, demonetisation could delay deleveraging until sales momentum recovers.
Brighter days ahead for organized players; Mumbai remains the best bet: Reforms initiated by Government of India (GoI) in the real estate sector will help organized players to gain market share in the medium-to-long term and reduce competition from small unorganized players due to increased cost of compliance and financing. Mumbai, the largest real estate market in India, enjoys the highest pricing premium, given strong demand for housing amid supply constraints. LDPL is well positioned to benefit from the region, given its dominant market share in MMR and its diversified 360 degree offering from affordable to luxury housing.
CMP Rs272 Target 12m Rs350 (29%) Market cap (US$ m) 50,821 Enterprise value (US$ m) 49,466 Bloomberg ITC IN Sector FMCG
09 May 2017
52Wk High/Low (Rs) 293/209 Shares o/s (m) 12147 Daily volume (US$ m) 48 Dividend yield FY17ii (%) 1.7 Free float (%) 100.0
Shareholding pattern (%) Promoter 0.0 FII 20.0 DII 35.7 Others 44.2
Price performance (%) 1M 3M 1YITC (0.4) (2.2) 26.1Absolute (US$) (1.0) 1.9 35.1Rel. to Sensex (1.2) (7.9) 9.6CAGR (%) 3 yrs 5 yrsEPS 8.7 13.8
Stock movement
Percy Panthaki [email protected] 91 22 4646 4662 Avi Mehta [email protected] 91 22 4646 4650 Sameer Gupta [email protected] 91 22 4646 4672
www.iiflcap.com
0
100
200
300
400
0 20,000 40,000 60,000 80,000 100,000
May‐15
Jul‐1
5Sep‐15
Nov‐15
Jan‐16
Mar‐16
May‐16
Jul‐1
6Sep‐16
Nov‐16
Jan‐17
Mar‐17
May‐17
Vol('000, LHS) Price (Rs., RHS)
ITC BUY
1
Growth, re-ignited
Detailed report
Financial summary (Rs bn)Y/e 31 Mar, Consolidated FY15A FY16A FY17ii FY18ii FY19iiRevenues (Rs bn) 384 391 413 463 519 Ebitda margins (%) 37.0 38.5 37.7 38.2 38.6 Pre‐exceptional PAT (Rs bn) 97 99 104 118 134 Reported PAT (Rs bn) 97 99 104 118 134 Pre‐exceptional EPS (Rs) 8.0 8.2 8.6 9.8 11.1 Growth (%) 8.2 2.3 5.2 13.4 13.2 IIFL vs consensus (%) (1.6) (2.1) (1.5) PER (x) 33.9 33.2 31.5 27.8 24.6 ROE (%) 32.8 30.2 29.0 29.5 29.9 Net debt/equity (x) (0.2) (0.2) (0.1) (0.1) 0.0 EV/Ebitda (x) 22.3 21.3 20.6 18.3 16.2 Price/book (x) 10.2 9.6 8.6 7.7 6.9 Source: Company, IIFL Research. Price as at close of business on 09 May 2017.
Institutional Equities
We expect growth to revive for ITC (FY17-19 EPS Cagr of 13% vs. 5% for FY14-17) as tax regime turns more rational, non-tax issues are in the base and consumption revives. India has one of the most favourable industry structures (virtual monopoly, FDI ban), which reduces volatility in earnings delivery. Moreover, ITC’s capital allocation has improved, with FCF conversion of ~80%. In light of these factors ITC’s 35% discount to HUL currently (vs. 12% prior to FY13) is set to contract, driving 29% upside to our price target of Rs.350. A change in incidence or structure of tax under GST regime is the main risk to our BUY rating.
Growth is set to revive: In the past two budgets, average increase in excise duty has been 8% vs. 18% for the four years prior to that, possibly as the government realizes that a higher tax rate does not increase tax collections but encourages illegal trade. Non tax regulations such as pictorial warnings and ban on public smoking are already in place and others such as banning loose cigarettes are hard to implement. Moreover, revival in consumption would benefit ITC just as it would benefit other FMCG companies.
Best industry structure: ITC is a virtual monopoly accounting for 86% of cigarette industry sales and 96% of profits. Moreover, FDI in cigarette manufacture is banned. Due to these factors ITC has high Ebit margins of 66% in the cigarette division vs. global average of 33%. Absence of competition gives ITC pricing power and reduces the risk of market share loss or margin erosion. Moreover, government officials have stated that GST is likely to be tax neutral – thus GST is unlikely to materially alter the industry structure.
Reasonable valuation in the light of improved capital allocation: ITC generates 75-80% of its net profit as FCF, vs. an average of 55% over FY03-15. Moreover, ITC trades at a discount of 35% to HUL (with similar expected growth for FY17-19) vs. an average of 12% prior to FY13 when ITC’s EPS growth faltered due to an adverse tax regime. With growth reviving, we believe that this discount would shrink, resulting in an attractive 29% return to our TP. Our extended DCF (terminal FY39) suggests an even higher upside of 46%.
India - NBFC
4Q2017
Adept swimmers pull ahead
Choppy waters
Institutional Equities
CMP Rs353 Target 12m Rs450 (28%) Market cap (US$ m) 11,350 Enterprise value (US$ m) 11,855 Bloomberg MSS IN Sector Auto
14 November 2017
52Wk High/Low (Rs) 374/185 Shares o/s (m) 2105 Daily volume (US$ m) 14 Dividend yield FY18ii (%) 0.7 Free float (%) 36.9
Shareholding pattern (%) Promoter 63.1 FII 19.7 DII 6.8 Others 10.4
Price performance (%) 1M 3M 1YMotherson (0.8) 9.1 75.5Absolute (US$) (1.5) 7.6 81.5Rel. to Sensex (2.6) 3.3 52.3CAGR (%) 3 yrs 5 yrsEPS 28.0 36.1
Stock movement
Joseph George [email protected] 91 22 4646 4667 Suraj Chheda [email protected] 91 22 4646 4656 www.iiflcap.com
0
100
200
300
400
0
10,000
20,000
30,000
40,000
Nov‐15
Jan‐16
Mar‐16
May‐16
Jul‐1
6Sep‐16
Nov‐16
Jan‐17
Mar‐17
May‐17
Jul‐1
7Sep‐17
Nov‐17
Vol('000, LHS) Price (Rs., RHS)
A behemoth in the making
Motherson Sumi BUY
1
Detailed report
Financial summary (Rs m)Y/e 31 Mar, Consolidated FY16A FY17A FY18ii FY19ii FY20iiRevenues (Rs m) 372,163 424,934 564,744 663,081 768,746Ebitda margins (%) 9.5 10.1 9.7 10.7 11.3Pre‐exceptional PAT (Rs m) 12,276 16,517 19,259 26,920 35,388Reported PAT (Rs m) 12,923 15,543 19,259 26,920 35,388Pre‐exceptional EPS (Rs) 6.2 8.1 9.1 12.8 16.8Growth (%) 22.5 30.6 13.3 39.8 31.5IIFL vs consensus (%) (13.9) (9.6) (3.7)PER (x) 57.0 43.7 38.6 27.6 21.0ROE (%) 31.8 26.1 21.6 25.6 28.0Net debt/equity (x) 1.0 0.7 0.4 0.2 (0.1)EV/Ebitda (x) 29.5 26.0 19.6 15.1 11.8Price/book (x) 15.9 8.7 7.8 6.5 5.4Source: Company, IIFL Research. Price as at close of business on 13 November 2017.
Institutional Equities
Motherson has grown into a USD7.3bn global auto parts major, helped by sound operating and financial principles. We believe a good mix of businesses with steady growth (standalone, SMR) and turnaround potential (SMP, PKC) would drive 28% EPS Cagr over FY17-20. Motherson is a turnaround specialist with a highly credible history of value creation through acquisitions. Motherson’s FY20 revenue target of USD18bn entails acquisitions of USD6.2bn that would result in EPS accretion and offer sizeable upside risk.
A global giant built on sound operating/financial principles:Starting out as a wiring harness (WH) supplier to Maruti in 1986, Motherson has grown to become the WH leader in India, the leader in CV WH globally, the second largest auto mirror maker globally, and a leading global supplier of plastic auto components. Motherson’s growth has been supported by sound operating/financial principles: i) focus on quality, costs, ROCE; ii) increasing content per car to drive growth; iii) backward integration to increase value-addition, cost/competitive advantage; and iv) making acquisitions with customer buy-ins, which significantly protects the downside.
Mix of businesses with steady growth and turnaround potential to drive 28% EPS Cagr: Motherson’s standalone operations (WH) and its subsidiary SMR (mirrors) are well established, in terms of market standing, margins, and return ratios. We forecast mid-to-high-teen earnings growth in standalone (led by volume and value) and SMR (led by market share gain, slight margin expansion). On the other hand, SMP (plastics) and PKC (CV WH) are operating at low margins (sub-2% net margin) and return ratios. We forecast 220bp/400bp Ebitda margin expansion for SMP/PKC by FY20. This would result in multi-fold rise in earnings of these two subsidiaries.
History of value creation through acquisitions offers sizeable upside risk: Motherson’s stock is up ~19x in the past 10 years. We estimate ~40% of these returns have been generated through cheap acquisitions and their subsequent turnaround. Motherson’s FY20 revenue target of USD18bn implies acquisitions of USD6.2bn. Low cost of borrowing (last debt raise was at 1.8%) and potential turnarounds should make these acquisitions highly EPS-accretive.
India - Oil & Gas
4Q2017
Changing landscape of fuel retailing
High octane acceleration
Institutional Equities
India - Strategy
4Q2019
Resetting our Expectations (RoE)
Uphill trek
CMP Rs675
Target 12m Rs800 (18%)
Market cap (US$ m) 4,144
Bloomberg RBK IN
Sector Banking & Fin
18 April 2019
52Wk High/Low (Rs) 692/438 Shares o/s (m) 426 Daily volume (US$ m) 18 Dividend yield FY20ii (%) 0.5 Free float (%) 100.0
Shareholding pattern (%) Promoters 0.0 Pledged (as % of promoter share) 0.0 FII 18.8 DII 21.3
Price performance (%) 1M 3M 1YRBL Bank 6.1 18.6 32.4Absolute (US$) 4.6 21.4 25.5Rel. to Sensex 3.2 11.0 18.6CAGR (%) 3 yrs 5 yrsEPS 31.1 42.9
Stock movement
Return on Assets (%)
Source: Company IIFL Research
Abhishek Murarka [email protected] 91 22 4646 4645
Arash Arethna [email protected] 91 22 4646 4655
www.iiflcap.com
0
200
400
600
800
0
10,000
20,000
30,000
40,000
Mar‐17
May‐17
Jul‐1
7Sep‐17
Nov‐17
Jan‐18
Mar‐18
May‐18
Jul‐1
8Sep‐18
Nov‐18
Jan‐19
Mar‐19
Vol('000, LHS) Price (Rs., RHS)
1.1 1.21.3 1.4
1.5
0.0
0.20.40.6
0.81.01.2
1.41.6
FY18 FY19 FY20ii FY21ii FY22ii
(%)
All set to scale-up
RBL Bank BUY
1
Detailed report
Financial summary (Rs bn)Y/e 31 Mar, Parent FY18A FY19A FY20ii FY21ii FY22iiPre prov. operating inc. (Rs bn) 13.3 19.4 26.0 35.1 47.8Pre‐exceptional PAT (Rs bn) 6.4 8.7 12.3 16.8 23.3Reported PAT (Rs bn) 6.4 8.7 12.3 16.8 23.3Pre‐exceptional EPS (Rs) 15.1 20.3 25.7 35.2 48.7Growth (%) 27.5 34.1 26.5 37.2 38.3IIFL vs consensus (%) (5.8) (1.2) NAPER (x) 44.6 33.3 26.3 19.2 13.9Book value (Rs) 159 177 256 287 330PB (x) 4.2 3.8 2.6 2.4 2.0CAR (%) 15.3 13.5 15.1 12.6 10.7ROA (%) 1.1 1.2 1.3 1.4 1.5ROE (%) 11.5 12.2 12.4 13.0 15.8Source: Company, IIFL Research. Price as at close of business on 18 April 2019.
Institutional Equities
RBL Bank (RBK) is likely to witness a sustained increase in scale and profitability for the next few years and graduate into a large-size private bank. A well-set management team, clearly articulated strategies, focus on sectors with high growth potential, ability to acquire adequate deposits and access to equity capital are key ingredients that will aid such growth. Improving revenue intensity, both fee-based and fund-based, will be RoA drivers over FY19-22ii. We estimate a 30% balance sheet CAGR, 34% EPS CAGR and a ~27bps RoA expansion to ~1.5% over FY19-22ii. We value RBK at 2.8x FY21ii BVPS post-money (implied 22.7x EPS), attributing the high multiple to high growth and improvement in profitability.
Right focus to drive strong balance sheet growth: RBK can deliver 35% Cagr in loans and 32% in deposits over FY19-22ii. Loan growth would be driven by the credit cards, MFI and SME/MSME segments within retail banking. Within wholesale banking, large client acquisitions and deepening relationships will drive growth. Deposits would be driven by branch expansion and focus on improving the productivity of existing branches.
Several levers for RoA improvement: Over FY19-22ii, RoA expansion would be driven by an increase in the mix of credit cards and MFI to ~25% of loans as well as better operating efficiencies and lower credit costs in both businesses. Other segments are likely to see better revenue intensity, led by higher fees and faster re-pricing in yields. We estimate revenues to contribute ~35bps to RoA, with expenses and credit costs partially offsetting this impact. Overall, we estimate ~27bps RoA expansion over FY19-22ii.
Valuations reflecting higher growth, improving profitability:We value RBK at 2.8x FY21ii BVPS (22.7x EPS) or Rs800/share. We have assumed a ~Rs35bn capital infusion in FY20ii in our estimates. The high valuation is based on the high growth potential, given a supportive operating environment, strong execution, outlook of improving profitability and its well-regarded management team. High dependence on credit-cards/MFI and challenges in raising adequate liabilities would be key risks to our call.
India - Life Insurance
1Q2019
From ‘Save’ to ‘Protect’
Moving on in Life
Institutional EquitiesIndia - Steel
3Q2018
Growing volumes amid a conducive cycle
Consolidating & Expanding
Institutional EquitiesIndia - FMCG
3Q2018
Milk the opportunity
The rise and rise of private dairies
Dairy Products
Institutional Equities
India - Pharma
3Q2018
Source of sustainable cash generation
India formulations market
Institutional Equities
MH 06 2018
IND
India - Cement
2Q2018
Price deflation will cause earnings to flatline
Producers bitten by the capacity bug
Institutional Equities
CMP Rs533 Target 12m Rs700 (31%) Market cap (US$ m) 4,996 Enterprise value (US$ m) 5,086 Bloomberg BIOS IN Sector Pharma
17 January 2018
52Wk High/Low (Rs) 564/295 Shares o/s (m) 600 Daily volume (US$ m) 25 Dividend yield FY18ii (%) 0.9 Free float (%) 39.3
Shareholding pattern (%) Promoter 60.7 FII 15.4 DII 3.8 Others 20.1
Price performance (%) 1M 3M 1Y Biocon 2.3 42.2 60.3 Absolute (US$) 2.3 43.7 70.9 Rel. to Sensex (1.6) 35.7 32.9 CAGR (%) 3 yrs 5 yrs EPS 14.1 12.7
Stock movement
Strong earnings visibility from FY20ii
Source: Company IIFL Research
Dr Abhishek Sharma [email protected] 91 22 4646 4668
Rahul Jeewani [email protected] 91 22 4646 4673
www.iiflcap.com
0
200
400
600
0
20,000
40,000
60,000
Jan‐16
Mar‐16
May‐16
Jul‐1
6Sep‐16
Nov‐16
Jan‐17
Mar‐17
May‐17
Jul‐1
7Sep‐17
Nov‐17
Jan‐18
Vol('000, LHS) Price (Rs., RHS)
0%5%10%15%20%25%30%35%40%
0200400600800
1,0001,2001,4001,600
FY17
FY18ii
FY19ii
FY20ii
FY21ii
Revenue (USD mn) (LHS)Ebitda margins (RHS)
The dark horse in biosimilars
Biocon BUY
1
Detailed report
Institutional Equities
Biocon-Mylan has established its credentials as a leading biosimilar player in the global markets, with the partnership having already received approval for Trastuzumab in US. We expect 2018 to be a year of approvals for Biocon-Mylan with 4-5 approvals coming up this year across US and EU. Addition of US/EU revenues from the first wave of biosimilars could potentially help Biocon’s profits to grow ~6x over the next five years. Biocon has also resolved its manufacturing issues, while growth in Syngene will continue to pick up. Maintain BUY with an upgraded TP of Rs700.
Clear runway for bagging regulated market approvals for the first wave of biosimilars; potential to quintuple profits in five years: Biocon has continued to surprise us positively as it worked toward putting together pieces for biosimilar approvals in the US/EU. With Trastuzumab approval being the first in class, Biocon-Mylan has established its credentials as a leading biosimilar player in the global markets. With 4-5 approvals coming up this year, we expect 2018 to be a year of approvals for Biocon-Mylan. These approvals will provide further visibility to earnings and continue to de-risk the business. Addition of US/EU revenues from the first wave of biosimilars would help Biocon’s profits to grow ~6x over the next five years.
Strong execution aided by tailwinds: Biocon overcame compliance challenges of USFDA inspections in April and June 2017 rather quickly. Pegfilgrastim (Neulasta) started as a competitive product. However, competition has whittled down further to only two projects looking at near-term approval. Insulin Glargine (Lantus) is also expected to remain a low-competition product in the foreseeable future, due to requirements of a dedicated manufacturing facility.
Syngene back on track after an incidence of fire: About 20% of Syngene’s business suffered due to a fire at one of its facilities in late FY17. However, the company regained lost ground, reflected in strong growth in recent quarters. Syngene remains an important value driver for Biocon. We believe that foray into large-scale manufacturing, client accretion in biology, and maturing of newly added dedicated centres are long-term growth drivers for Syngene, which would help it register ~20% revenue growth over the next five years. Financial summary (Rs m) Y/e 31 Mar, Consolidated FY16A FY17A FY18ii FY19ii FY20iiRevenues (Rs m) 33,372 38,763 39,049 45,868 74,311Ebitda margins (%) 22.3 24.5 20.0 22.0 37.5Pre‐exceptional PAT (Rs m) 4,021 6,121 3,360 4,340 15,663Reported PAT (Rs m) 5,504 6,121 3,360 4,340 15,663Pre‐exceptional EPS (Rs) 6.7 10.2 5.6 7.2 26.1Growth (%) 0.1 52.2 (45.1) 29.1 260.9IIFL vs consensus (%) (29.4) (41.9) 63.6PER (x) 79.6 52.3 95.2 73.7 20.4ROE (%) 11.0 13.8 6.9 8.7 27.8Net debt/equity (x) 0.0 0.0 0.0 0.1 0.1EV/Ebitda (x) 43.4 34.2 41.8 32.7 11.9Price/book (x) 7.4 6.1 5.9 5.8 4.6Source: Company, IIFL Research. Price as at close of business on 16 January 2018.