Modern Social Science Concepts, Proportionate Reciprocity, Modesty, and Democracy
Upload
independentCategory
view
1download
0
Atherosclerosis 158 (2001) 129–138
Increasing levels of dietary homocystine with carotidendarterectomy produced proportionate increases in plasma
homocysteine and intimal hyperplasia
Fred Southern a,c, John Eidt a,c, John Drouilhet a,c, Perkins Mukunyadzi b,D. Keith Williams d, Carlos Cruz a,c, YunFang Wang c, Lionel A. Poirier d,
Aliza T. Brown a,c, Mohammed M. Moursi a,c,*a Department of Surgery, Di�ision of Vascular Surgery, Central Arkansas Veterans Healthcare System, Little Rock, AR 72205, USA
b Department of Pathology, Central Arkansas Veterans Healthcare System, Little Rock, AR 72205, USAc Department of Surgery, Di�ision of Vascular Surgery, Uni�ersity of Arkansas for Medical Sciences, Slot 520 4301 West Markam St.,
Little Rock, AR 72205, USAd Department of Biometry, Uni�ersity of Arkansas for Medical Sciences, Little Rock, AR 72205, USA
Received 24 April 2000; received in revised form 6 December 2000; accepted 22 December 2000
Abstract
Purpose : The role that homocysteine may play in post-carotid endarterectomy (CEA) restenosis due to intimal hyperplasia isnot well understood. This study was designed to investigate the effects of different levels of dietary homocystine on: (1) plasmahomocysteine; (2) post-CEA intimal hyperplasia; and (3) levels of the methyl donor S-adenosylmethionine (SAM) and itscounterpart S-adenosylhomocysteine (SAH) in the homocysteine pathway. Methods: Male rats were fed specialized diets for 2weeks pre- and post-CEA. Groups included control (0 homocystine added, n=9), 1.5 (1.5 g/kg homocystine added, n=10), 3.0(3.0 g/kg homocystine added, n=9), and 4.5 (4.5 g/kg homocystine added, n=11). The rats underwent a surgical carotidendarterectomy. Endpoints included; plasma homocysteine, intimal hyperplasia, replicative index using with �-SM actin andBrdU, hepatic SAM levels, SAH levels, and the hepatic activities of methylenetetrahydrofolate reductase (MTHFR) andcystathionine �-synthase (CBS). Results: Increasing dietary homocystine produced a proportionate increase in plasma homocys-teine and an increase in intimal hyperplasia. Regression analysis of plasma homocysteine levels and intimal hyperplasia showeda significant correlation (r=0.71, P=0.003). Plasma homocysteine levels above 15 �M were associated with significant increasesin intimal hyperplasia above 6.5% (P=0.04). Elevation of plasma homocysteine levels to moderate levels (5–25 �M) resulted insignificant post-CEA intimal hyperplasia. Cellular analysis of the area of intimal hyperplasia in all diet groups showed comparableamounts of cells positive for �-SM actin. However, with increasing levels of dietary homocystine and plasma homocysteine therewas an increase in replicative index (P�0.001) as determined by BrdU staining. Increasing dietary homocystine increased plasmahomocysteine and was followed by increases in the replicative index thus producing increased intimal hyperplasia and lumenalstenosis. In hepatic measurements the 1.5 and 3.0 g/kg homocystine diets caused: increased liver activity of MTHFR (P=0.03)and decreased hepatic levels of SAM, SAH and SAM/SAH ratios compared to controls. Homocystine treatment did not causesignificant alterations in CBS levels (P=0.992). These studies also showed no correlation of the MTHFR and CBS enzymes withplasma homocysteine levels or intimal hyperplasia. However, hepatic levels of SAM showed significant negative correlations withplasma homocysteine (r= −0.58; P=0.006) and with BrdU percentages of cellular proliferation (r= −0.69; P=0.06).Conclusion: The degree of post-CEA intimal hyperplasia in a rat model is directly related to the plasma level of homocysteine. Thehyperplastic effects of homocysteine may be mediated in part by a physiological insufficiency of methyl donors as shown bydecreases in SAM. Thus, increasing levels of plasma homocysteine enhanced and accelerated the smooth muscle cell response afterCEA which led to increased intimal hyperplasia and lumenal stenosis. © 2001 Elsevier Science Ireland Ltd. All rights reserved.
Keywords: Homocysteine; Intimal hyperplasia; Carotid endarterectomy; Stenosis; Methylenetetrahydrofolate reductase; Cystathionine �-synthase;S-adenosylmethionine
www.elsevier.com/locate/atherosclerosis
* Corresponding author. Tel.: +1-501-2576864; fax: +1-501-2576863.E-mail address: [email protected] (M.M. Moursi).
0021-9150/01/$ - see front matter © 2001 Elsevier Science Ireland Ltd. All rights reserved.PII: S 0 0 2 1 -9150 (01 )00432 -4

F. Southern et al. / Atherosclerosis 158 (2001) 129–138130
1. Introduction
Carotid endarterectomy (CEA) has been found to bean effective treatment for extracranial carotid arteryatherosclerotic disease as well as a reliable preventativetreatment for stroke [1,2]. As with other manipulationsof the arterial tree, endarterectomy can often be com-plicated by restenosis due to intimal hyperplasia withresultant sequelae such as stroke and transient ischemicattacks (TIA). However, not all CEAs are followed byintimal hyperplasia. In a CEA patient population, theoverall restenosis rate is 31%. Regression of the lesionsin 10% still leaves an overall persistent restenosis rate of21%. Of these, TIAs developed in 12% and stroke in 3%[3]. Intimal hyperplasia usually develops within weeksand is complete at 2 years and can lead to lumenaldiameter reduction, restenosis and eventual embolic orthrombotic events to the cerebral circulation.
Elevated homocysteine levels are an independent riskfactor for vascular disease [4–10]. Risk factors associ-ated with increased homocysteine include; age, sex,smoking, blood pressure, and cholesterol [11], and ge-netic inborn errors of homocysteme enzyme metabolism[4,5,9]. The association between plasma homocysteineconcentrations and carotid artery stenosis of �25% isindependent of other known risk factors for carotidartery stenosis. Thus a subset of patients presentingwith carotid disease have an elevated plasma homocys-teine level, we propose that in this subset of patientsaccelerated and significant post-CEA intimal hyper-plasia occurs.
To more closely resemble the clinical situation, a ratmodel [12] that uses diet to increase plasma homocys-teine and an open endarterectomy [13,14] as previouslydescribed by our group was used. In this model, anincrease in plasma homocysteine, produced by supple-menting the diet with homocystine, was found to pro-duce a significant increase in post-CEA intimalhyperplasia in the carotid artery when compared tocontrol diet rats [12]. Homocysteine was implicated asthe factor producing this increase in intimal hyper-plasia. Our previous study involved one level of dietaryhomocysteine supplementation. Though a significantincrease in intimal hyperplasia was observed with thislevel of homocystine elevation, the effects of a lowerlevel of homocystine elevation are unknown. In addi-tion, no evaluation of the mechanism of action wasperformed.
This study expands on the initial observations anddetermines if lower levels of dietary homocystine resultin elevations in plasma homocysteine. The intimal hy-perplasia response to these differing levels of plasmahomocysteine can then be determined. That is, willdifferent levels of plasma homocysteine result in differ-ent degrees of lumenal stenosis due to intimal hyper-plasia? This study will help define the cause and effect
relationship between plasma homocysteine and post-CEA intimal hyperplasia as well as identify thresholdlevels and the dose response curve between homocys-teine and intimal hyperplasia. In addition, the effect ofa more physiological elevation in plasma homocysteinecan be evaluated. Vascular smooth muscle cell prolifer-ation will be determined by labeling cells with 5-bromo-2�-deoxyuridine (BrdU) and �-SM actin.
Previous in vivo findings have shown that homocys-teine increases cell proliferation [5,12] and produces ahypomethylating environment [15]. The cardiovascularsystem requires methylation for processing lipids andhormones. In rats, physiological methyl insufficiencyproduced by dietary deficiencies of methionine andcholine, leads to decreased tissue levels of SAM andincreased levels of SAH as well as to arterial scleroticdamage [16]. Thus, this study examined the hyperplasticeffect of various dosages of dietary homocystine in amethyl deficient diet on the carotid artery followingsurgery, and what changes would occur in themetabolism of increased plasma homocysteine. Alsochecked were the levels of two hepatic enzymes,methylenetetrahydrofolate reductase (MTHFR) andcystathionine �-synthase (CBS), that are responsible formetabolizing homocysteine and are closely linked to thelevels of SAM and SAH to determine if an alteredmethylation capacity accompanies increased plasmahomocysteine.
2. Methods
2.1. Animals
Sprague–Dawley rats (425–450 g) were used andrandomly assigned to diet groups. The homocystine-treated groups of rats were fed a modification of theLombardi-amino acid-defined, choline-deficient, iron-supplemented diets (Dyets, Inc. Bethlem PA), withoutboth folic acid and methionine, and supplemented with1.5 (n=10), 3.0 (n=9), or 4.5 g/kg of DL-homocystine(n=11) (Sigma Chemical Co., St. Louis, MO), for 2weeks prior to CEA operation (treatment groups1.5, 3.0, and 4.5). A control group of rats (n=9) werefed the Lombardi amino acid-defined diet containingcholine, methionine and folic acid. All diets were fed inpelleted form for 2 weeks prior to and 2 weeks afterCEA. Food and water were available ad libitumthroughout the experimental period. Elevation ofplasma homocysteine can be accomplished by addinghomocystine to the diet, and we have demonstrated theability to consistently elevate plasma homocysteine lev-els with the 4.5 g/kg homocystine diet [12]. The ratswere sacrificed 2 weeks after the CEA surgery.
F. Southern et al. / Atherosclerosis 158 (2001) 129–138 131
2.2. Carotid endarterectomy operation
Animals were sedated with isoflurane in a bell jar,weighed, and then anesthetized with a combination ofketamine (80 mg/kg) and rompun (10 mg/kg) intraperi-toneally. After adequate anesthesia was confirmed withlack of response to hind paw stimulation, 4 cc ofnormal saline was injected subcutaneously in the regionof the upper middle back to serve as a fluid bolus (10cc/kg) to compensate for any intra-operative blood loss.The neck area was shaved and then prepped withbetadine. Using sterile technique and a dissecting mi-croscope (×40, SZ40 Olympus, Olympus America Inc.,Melville, NY) a midline cervical incision was made. Thesuperficial muscles were divided and the dissection car-ried down to the level of the left carotid artery. Thecervical nerves in the region of the artery were dissectedfree to preserve pharyngeal and esophageal functions toprevent post-operative respiratory compromise. ForCEA surgery technique, see our previously publishedmethod [12].
At 2 weeks post-surgery, the rats were anesthetizedand both carotid arteries exposed. Twenty-four and 48h prior to sacrifice, the thymidine analogue, BrdU(Sigma, St. Louis, MO), 50 mg/kg BW in 20 cc normalsaline was injected IP. The abdomen was opened in themidline and the distal aorta and inferior vena cavaexposed. Blood was drawn from the inferior vena cavafor plasma homocysteine analyses. A portion of theliver was removed for SAM/SAH and enzyme activityassays. The distal vena cava was transected and thedistal aorta cannulated with a 20-gauge catheter toinfuse normal saline at 100 mmHg until the vena cavaeffluent ran clear. Next, 10% buffered formalin wasinfused at 100 mmHg in an equal volume to completethe perfusion–fixation technique. A 1 cm section of theoperated and nonoperated carotid arteries were dis-sected free and placed in 10% formalin until furtherprocessing for histology.
2.3. Morphometric analysis
The arteries were paraffin blocked, sectioned, andelastin stained with Verhoeff’s and Van Gieson’s stain.At least two sections were taken from the middleone-third of the segments after endarterectomy as iden-tified by the proximal and distal limits of the continu-ous 10–0 nylon suture arteriotomy closure tostandardize the region of sectioning. The elastin stainedslides were photographed using a KODAK DC 120Zoom digital camera (Eastman KODAK Company,Rochester, NY). The images were downloaded into acomputer and the lumenal area of the carotids wereanalyzed using the National Institutes of Health(Bethseda, MD), ImageJ Software program, Version0.99i. This software package allowed us to delineate the
inner area of the intimal hyperplasia and thus obtain anaccurate measure of the cross-sectional area of thevessel lumen. Also, the outer area of intimal hyper-plasia was determined. The difference between the twoareas (outer area of intimal hyperplasia minus theactual lumen) was determined as the absolute area ofintimal hyperplasia. Because the arterial cross sectionhad an individual variation of shape due to processing,the values were expressed as a ratio of the absolute areaof intimal hyperplasia to the outer limit of intimalhyperplasia and then presented as a percent lumenstenosis. This ratio represents the portion of the lumenarea occupied by intimal hyperplasia and allowed forcomparison of the arterial cross sections of varying size[17]. Minimal variability was seen between measure-ments with two observers.
2.4. Plasma homocysteine measurements
All plasma homocysteine laboratory values were de-termined by the Clinical Pathology Department at theCentral Arkansas Veterans HealthCare Facility, LittleRock, AR. The plasma homocysteine level was mea-sured using a thiol-specific fluorogenic labeling reagentand the thiols were separated by a reverse-phase highpressure liquid chromatography method using fluores-cence detection [18].
2.5. Hepatic SAM and SAH
SAM and SAH levels were determined by previouslypublished methods [19,20].
2.6. Immunohistology of BrdU and �-SM actin
To derive the origin of cells involved with the intimalhyperplasia formation and to investigate whether thestate of replication is increased in the homocystine-fedgroups compared to the control group, carotid arterycross sections were studied with double immunohisto-chemical staining for BrdU and �-smooth muscle (�-SM actin). BrdU and �-SM actin staining wasvisualized by immunohistochemical staining [21], usingthe Vectastain Elite ABC kit (Vector Laboratories, Inc.,Burlingame, CA). The slides were deparaffinized,quenched with hydrogen peroxide in methanol, placedin 2 N HCl for 1 h, then placed in 0.2% pepsin in 0.01N HCl for 30 min and finally blocked with 10% goatserum (Vector Laboratories, Inc.). The sections werefirst incubated with a monoclonal mouse BrdU primaryantibody, (1:100, Sigma) for 2 h, then with biotinylatedsecondary goat anti-mouse (1:400, Vector Laboratories,Inc.) for 30 min prior to incubating in the ABC perox-idase reagent. The sections were developed with theperoxidase substrate solution, diaminobenzidine(DAB), for 6 min. The sections were then washed three
F. Southern et al. / Atherosclerosis 158 (2001) 129–138132
times in a PBS buffer and then blocked with 10% goatserum for 20 min. The sections were incubated for 2 hwith mouse �-SM actin primary antibody (1:400,Sigma) then with goat anti-mouse �-SM actin sec-ondary antibody (1:400, Vector Laboratories, Inc.) for30 min. Staining for �-SM actin was completed using aVIP peroxidase substrate kit (Vector Laboratories,Inc.). Light green solution (for 1 min) was used for thecounterstain. Staining at the Brd U-incorporated sites,indicates the cells initiating DNA replication and wasdetected by light microscopy. The BrdU labeling in-dexes (%) in the media and intimal hyperplastic areaswas calculated by dividing the number of labeledsmooth muscle cells by the total number of vascularsmooth muscle cell and multiplying by 100. The meanand standard error of the mean was determined for thecontrol and homocystine diet groups 1.5, 3.0 and 4.5g/kg. The labeling index, as a measure of medial vascu-lar smooth muscle cell proliferation, was compared tothe morphometric measurements for each group de-scribed above, to confirm the association between inti-mal hyperplasia and vascular smooth muscle cellproliferation due to elevated plasma homocysteine. Thetotal number of cells that were stained for BrdU, �-SMactin, and both BrdU and �-SM actin in the area ofintimal hyperplasia were determined. The mean per-centage of the cells stained was determined for eachgroup: BrdU compared with the total number of cells,�-SM actin compared with the total number of cells,and BrdU and �-SM actin positive cells. The BrdU and�-SM actin data for the control vs. the treatmentgroups was compared.
2.7. Enzyme acti�ity assays
CBS: Livers were immediately removed from therats, prior to infusion with saline, and frozen in liquidnitrogen until the assay was performed. CBS activitywas assayed by modification of protocols by Mudd etal. [22] and Kraus [23]. Briefly, liver tissue was homog-enized in 0.05 M KH2PO4 (pH 7.5) and centrifuged at10 000×g at 4°C and the supernatant was collected.The enzyme reaction mixture contained: 0.1 M Tris(pH 8.6), 1 mM pyridoxal phosphate, 0.7 mg cellularprotein extract, 0.5 mg/ml BSA, 0.06 �Ci 14C-Serine, 10mM serine, 15 mM L-homocysteine, and 1 mM cys-tathionine. The reaction mixture was incubated for 3 hat 37°C, during which time the 14C-Serine was con-verted by CBS into 14C-cystathionine. The 14C-cys-tathionine was separated from 14C-serine by ascendingpaper chromatography using 2-propanol/formic acid/water (80:6:20) v/v as the mobile phase. The 14C-cys-tathionine was cut out and counted in scintillationfluid. We defined one unit of enzyme activity as thatwhich formed 1 nmol of cystathionine per hour at37°C. Enzyme specific activity was expressed as units
per mg of cellular protein. Protein was determinedusing the BioRad protein reagent.
MTHFR: The MTHFR activity assay was modifiedfrom the procedure by Mudd et al. [24]. The liver tissuewas homogenized in 0.25 M sucrose, centrifuged at50 000×g for 1 h and the supernatant was collected.The enzyme reaction mixture contained the following:0.18 M KH2P04 (pH 6.3), 3.6 mM menadione bisulfite,1.4 mM EDTA, 7.2 mM ascorbic acid, 178 �M flavinadenine dinucleotide (FAD) and 420 �M of 14C-5-methyltetrahydrofolate. The reaction mixture was incu-bated for 1 h at 37°C, and then terminated by theaddition of 0.6 M sodium acetate pH 4.5. 0.1 Mformaldehyde and 0.4 M dimedone (5,5 Dimethyl-1,3-cyclohexanedione) in 50% ETOH. The samples wereboiled, toluene was added and 2 ml of the upper phasecontaining 14C-formaldehyde was removed for countingin scintillation fluid. The enzyme activity was expressedas nmol/h formed per mg of protein.
2.8. Statistical methods
Means�standard error are reported. One-way anal-ysis of variance (ANOVA) using Fisher’s pairwise com-parisons and regression analysis were used to evaluatethe difference between dietary groups of the samples asindicated in the legends to tables and figures.
3. Results
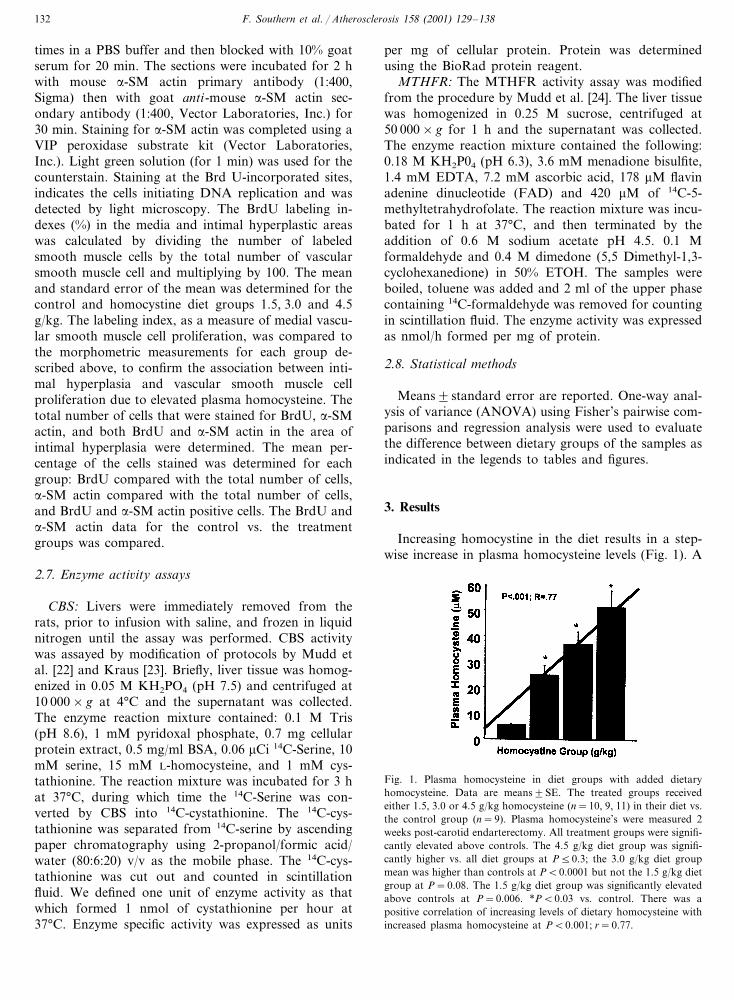
Increasing homocystine in the diet results in a step-wise increase in plasma homocysteine levels (Fig. 1). A
Fig. 1. Plasma homocysteine in diet groups with added dietaryhomocysteine. Data are means�SE. The treated groups receivedeither 1.5, 3.0 or 4.5 g/kg homocysteine (n=10, 9, 11) in their diet vs.the control group (n=9). Plasma homocysteine’s were measured 2weeks post-carotid endarterectomy. All treatment groups were signifi-cantly elevated above controls. The 4.5 g/kg diet group was signifi-cantly higher vs. all diet groups at P�0.3; the 3.0 g/kg diet groupmean was higher than controls at P�0.0001 but not the 1.5 g/kg dietgroup at P=0.08. The 1.5 g/kg diet group was significantly elevatedabove controls at P=0.006. *P�0.03 vs. control. There was apositive correlation of increasing levels of dietary homocysteine withincreased plasma homocysteine at P�0.001; r=0.77.
F. Southern et al. / Atherosclerosis 158 (2001) 129–138 133
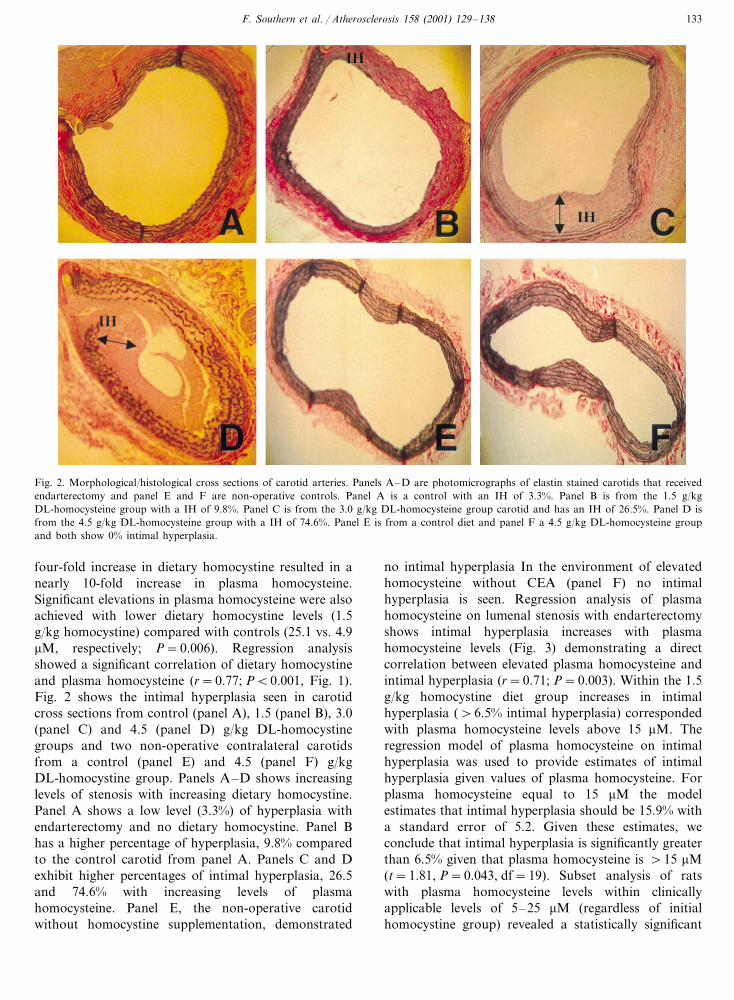
Fig. 2. Morphological/histological cross sections of carotid arteries. Panels A–D are photomicrographs of elastin stained carotids that receivedendarterectomy and panel E and F are non-operative controls. Panel A is a control with an IH of 3.3%. Panel B is from the 1.5 g/kgDL-homocysteine group with a IH of 9.8%. Panel C is from the 3.0 g/kg DL-homocysteine group carotid and has an IH of 26.5%. Panel D isfrom the 4.5 g/kg DL-homocysteine group with a IH of 74.6%. Panel E is from a control diet and panel F a 4.5 g/kg DL-homocysteine groupand both show 0% intimal hyperplasia.
four-fold increase in dietary homocystine resulted in anearly 10-fold increase in plasma homocysteine.Significant elevations in plasma homocysteine were alsoachieved with lower dietary homocystine levels (1.5g/kg homocystine) compared with controls (25.1 vs. 4.9�M, respectively; P=0.006). Regression analysisshowed a significant correlation of dietary homocystineand plasma homocysteine (r=0.77; P�0.001, Fig. 1).Fig. 2 shows the intimal hyperplasia seen in carotidcross sections from control (panel A), 1.5 (panel B), 3.0(panel C) and 4.5 (panel D) g/kg DL-homocystinegroups and two non-operative contralateral carotidsfrom a control (panel E) and 4.5 (panel F) g/kgDL-homocystine group. Panels A–D shows increasinglevels of stenosis with increasing dietary homocystine.Panel A shows a low level (3.3%) of hyperplasia withendarterectomy and no dietary homocystine. Panel Bhas a higher percentage of hyperplasia, 9.8% comparedto the control carotid from panel A. Panels C and Dexhibit higher percentages of intimal hyperplasia, 26.5and 74.6% with increasing levels of plasmahomocysteine. Panel E, the non-operative carotidwithout homocystine supplementation, demonstrated
no intimal hyperplasia In the environment of elevatedhomocysteine without CEA (panel F) no intimalhyperplasia is seen. Regression analysis of plasmahomocysteine on lumenal stenosis with endarterectomyshows intimal hyperplasia increases with plasmahomocysteine levels (Fig. 3) demonstrating a directcorrelation between elevated plasma homocysteine andintimal hyperplasia (r=0.71; P=0.003). Within the 1.5g/kg homocystine diet group increases in intimalhyperplasia (�6.5% intimal hyperplasia) correspondedwith plasma homocysteine levels above 15 �M. Theregression model of plasma homocysteine on intimalhyperplasia was used to provide estimates of intimalhyperplasia given values of plasma homocysteine. Forplasma homocysteine equal to 15 �M the modelestimates that intimal hyperplasia should be 15.9% witha standard error of 5.2. Given these estimates, weconclude that intimal hyperplasia is significantly greaterthan 6.5% given that plasma homocysteine is �15 �M(t=1.81, P=0.043, df=19). Subset analysis of ratswith plasma homocysteine levels within clinicallyapplicable levels of 5–25 �M (regardless of initialhomocystine group) revealed a statistically significant

F. Southern et al. / Atherosclerosis 158 (2001) 129–138134
Fig. 3. Regression analysis of intimal hyperplasia vs. plasma levels ofhomocysteine. Plasma homocysteine concentrations were measured 2weeks after carotid endarterectomy. Degree of intimal hyperplasia ispresented as percent lumenal stenosis. Increasing levels of plasmahomocysteine and intimal hyperplasia are positively correlated atP=0.003 with an r=0.71. T-test statistical data indicates within the1.5 g/kg homocysteine group plasma homocysteine levels at 15 �M orhigher creates significantly higher percentages of lumenal stenosiscompared to controls at P=0.043; t=1.81; df=19.
Fig. 5. Regression analysis for intimal hyperplasia given levels of5–25 �M plasma homocysteine. There is a strong correlative relation-ship between clinically relevant levels of plasma homocysteine andpercentages of intimal hyperplasia at P=0.04; r=0.55.
evidence by the equal level of �-SM actin (percentage oftotal cells) staining among the dietary groups (84.9�2.8, 90.0�26, 89.4�7.8, 94.4�10.0%, for control,1.5, 3.0 and 4.5 g/kg treatment groups, respectivelyP=NS). The increased intimal hyperplasia responseassociated with increased dietary homocystine and in-creased plasma homocysteine levels was also correlatedwith an increased replicative activity within the prolifer-ative cellular response (r=0.80; P=0.0003, Fig. 6).Significantly increasing levels of proliferation were seenwith BrdU staining in �-SM actin positive cells, withincreased dietary and plasma homocysteine levels (P�
elevation in intimal hyperplasia compared to controls(Fig. 4). Regression analyses performed on plasma ho-mocysteine samples 5–25 �M vs. corresponding intimalhypeiplasia results indicate significance at r=0.55, P=0.04 (Fig. 5). Indicating a strong correlative relation-ship between physiological levels of plasma homo-cysteine and intimal hyperplasia.
The intimal hyperplasia response demonstrated aconstant amount of smooth muscle cell involvement as
Fig. 4. Comparison of intimal hyperplasia between controls andhomocysteine treatment groups at plasma levels below 25 �M. In acomparison of plasma homocysteine levels between control rats toplasma homocysteine levels at 15–25 �M [homocystine treated] therewas a significant difference of P=0.05, thus demonstrating a signifi-cant increase in intimal hyperplasia with plasma homocysteines in theclinical range of 15–25 �M.
Fig. 6. Regression analysis of plasma homocysteine vs. BrdU +�-SM actin (% cellular proliferation index in smooth muscle cells).�-SM actin positive cells were visually counted and of those percent-ages of BrdU were calculated. All cells that stained positive for BrdUlabeled nuclei were counted. Plasma homocysteine levels and BrdUpercentages were positively correlated at P=0.0003 with an r=0.80.

F. Southern et al. / Atherosclerosis 158 (2001) 129–138 135
Table 1The effects of a dietary shift from a homocysteine-free to a homocysteine-containing diet on the hepatic levels of SAM, SAH, MTHFR and CBS
SAM (�g/g)Diet SAH (�g/g)Homocysteine content (g/kg) SAM/SAH MTHFR (nmol/h per mg) CBS (U/mg)
25.7�1.1a 8.3�0.61 3.0�0.20 6.0�0.6 275.1�32.82 12.0�1.0b1.5 5.4�0.2b 2.2�0.2b 10.4�1.0b 280.8�27.0
10.7�0.7b 5.8�0.3b 1.8�0.1b3.0 11.8�3.1b3 263.8�82.014.8�1.4b,c 7.2�0.4c 2.0�0.2b4 8.0�3.3c4.5 284.8�95.4
a The results are expressed as the means�SEM.b Significantly different from the corresponding value in animals fed the control diet.c Significantly different from the corresponding value in animals fed diet containing 3.0 g/kg homocysteine.
0.01). In the 3.0 and 4.5 g/kg homocystine group,40–50% of all cells within the intimal hyperplasia areahad replicative activity. The 1.5 g/kg homocystinegroup showed a significant increase in replicative indexfrom control (17.2�2.2 vs. 8.8�1.3%; P=0.0042). Asdietary homocystine increased with each treatmentgroup, plasma homocysteine increased (Fig. 1) in astepwise fashion, associated with an increase in areplicative index (Fig. 6) in smooth muscle cells. Thisincrease in replicative index is manifest as an increase inintimal hyperplasia and lumenal stenosis (Fig. 3). Non-operated carotid arteries showed no lumenal stenosis atany homocystine levels (Fig. 2), nor did they showevidence of increased replication based on BrdU and�-SM actin staining.
Liver extracts from the groups fed homocystine at 1.5and 3.0 g/kg showed a significant increase in MTHFRactivity compared to control liver (P�0.05, Table 1).MTHFR was also negatively correlated with levels ofSAM (r= −0.68; P=0.001). However, MTHFR ac-tivity in the 4.5 g/kg homocystine treatment group liverextracts were not significantly different compared tocontrols. CBS activity was also measured from liverextracts (Table 1). Unlike MTHFR, CBS activity didnot vary significantly among the four dietary groups.Nor was CBS data significantly correlated with otherendpoints of the study. The results of homocystinedietary modification on the hepatic levels of SAM andSAH were also determined (Table 1). Regression analy-sis suggests that increasing levels of homocystine indiets led to a negative correlation in the levels ofhepatic SAM (r= −0.58; P=0.006, Fig. 7), however,not in SAM/SAH ratios (r= −0.33; P=0.20). Com-pared to control values, hepatic SAH levels were lowerin rats fed homocystine at 1.5 and 3.0 g/kg, but not inanimals fed homocystine at 4.5 g/kg in the diet (Table1).
4. Discussion
Carotid endarterectomies are being performed withincreasing frequency. The complicating issue of post-CEA intimal hyperplasia and resultant restenosis con-
tinues to present a problem. A clearer understanding ofthe role homocysteine may have in restenosis rates maybe of clinical benefit This study was designed to investi-gate three areas associated with the relationship be-tween plasma homocysteine and post-CEA intimalhyperplasia. First, to evaluate a rat dietary model inwhich a manipulation in dietary homocystine can pro-duce different plasma homocysteine levels. Second,whether a modest increase in plasma homocysteine canresult in a significant increase in intimal hyperplasia.Third, to explain the increases in plasma homocysteinebased on analysis of the metabolites and the enzymesresponsible for homocysteine metabolism.
Our previously published findings [12] regarding therelationship between plasma homocysteine and intimalhyperplasia involved only one dose of added homocys-teine and demonstrated a significant increase in intimalhyperplasia with a marked elevation of plasma homo-cysteine at 36 �M in the 4.5 g/kg homocysteine dietgroup. Normal human total plasma homocysteine levelsrange from 5 to 15 �M with values of 15–30 �M seenas moderate, 30–100 �M as intermediate and �100�M as severe [25,26]. Hyperhomocysteinemia values of�15 �M seen in patients with atherosclerotic diseaseare associated with atherogenesis and cardiovascularrisk factors, i.e. age, male sex, smoking, blood pressure,sedentary lifestyle, and elevated cholesterol [6]. In this
Fig. 7. Regression analysis of plasma homocysteine vs. hepatic levelsof SAM. Plasma homocysteine and hepatic levels of SAM, an inter-mediate in the homocysteine metabolism pathway were negativelycorrelated indicating that both variables are strongly interrelated witha P=0.006 and an r= −0.58.

F. Southern et al. / Atherosclerosis 158 (2001) 129–138136
study we have shown that an increase in plasma homo-cysteine from increasing dietary homocystine 1.5–4.5g/kg DL-homocystine resulted in a significant stepwiseincrease in plasma homocysteine and covers the rangeof clinically observed homocysteine values (Figs. 4 and5). This dietary rat model could thus be used to evalu-ate the effects of physiological increases in plasmahomocysteine much as seen in the clinical setting. Fur-ther we have observed a positive correlation in thatlower plasma homocysteine levels were also associatedwith increases in intimal hyperplasia. This study showsthat intimal hyperplasia can be increased with only asmall increase in plasma homocysteine levels, levels thatare consistent with clinical findings. In addition thedata from the regression analysis demonstrate that theamount of post-CEA intimal hyperplasia can be di-rectly correlated with the degree of plasma homocys-teine. There appears to be a threshold of dietaryhomocysteine above which increases in intimal hyper-plasia are observed. In the 1.5 g/kg homocysteine groupwe noted that plasma levels above 15 �M were associ-ated with significant increases in intimal hyperplasia.Two rats (plasma homocysteine 11.9 and 14.9 �M;intimal hyperplasia 3.2 and 6.5%, respectively) in the1.5 g/kg homocystine group had low intimal hyper-plasia percentages but also had plasma homocysteinesbelow 15 �M. Their intimal hyperplasia values wereconsistent with the control group that did not receivehomocystine in their diet. T-test statistical analysisshowed plasma homocysteine levels above 15 �M tohave significant percentages of intimal hyperplasiagreater than 6.5. To our knowledge we are the first todemonstrate a positive correlation between plasma ho-mocysteine levels and post-CEA intimal hyperplasia.However, others have shown a correlation with in-creased homocysteine levels and atherosclerotic diseasein the carotid bed. This is relevant in that intimalhyperplasia and atherosclerosis share some of the samepathophysiological steps. Hackam et al. [8] notedgreater increases in carotid plaque growth with plasmahomocysteines �14 �M. The authors suggest that pa-tients with vascular disease and plasma homocysteinelevels as low as 9 �M begin preventative therapy forhomocysteine reduction. Voutilanen et al. [27] demon-strated similar results in that asymptomatic middle agedgroup of men with plasma homocysteines over 11.5 �Mwere associated with a statistically significant increasein intima–media carotid artery wall thickness. Willineket al. [7] also demonstrated that plasma homocysteinelevels were dependently associated with intima–mediawall thickness, demonstrating in healthy subjects withhigh-normal homocysteine levels, that there is an asso-ciation with increased intima–media carotid artery wallthickness. Regression analysis from our study shows astrong correlation between increases in dietary homo-cystine and the resultant plasma homocysteine (r=
0.77; P�0.001). More significantly, there is a strongpositive correlation between elevated plasma homocys-teine and post-CEA lumenal stenosis due to increasedintimal hyperplasia (r=0.71; P=0.003, Fig. 3). In thepresent study, lower levels of plasma homocysteine(range of 5–25 �M) were achieved with lower homo-cystine supplementation. Since the 5–25 �M range iscommonly observed in the patient population and isthought to be clinically relevant we analyzed this rangeseparately and observed a significant elevation in inti-mal hyperplasia (Fig. 4) post-CEA and observed apositive correlation of plasma homocysteine vs. intimalhyperplasia (r=0.55; P=0.04, Fig. 5), plasma homo-cysteine vs. BrdU+�-SM (r=0.73; P=0.02), plasmahomocysteine vs. SAM (r= −0.73; P=0.01) andplasma homocysteine vs. SAH (r= −0.75; P=0.005).
The results from our previous work [12] using only acontrol and a 4.5 g/kg homocystine treatment groupwas similar to our current regression analysis results(Fig. 3). However, the addition of a 1.5 and 3.0 g/kghomocystine diet group allowed for construction of amore accurate dose response curve and demonstrated a15 �M plasma homocysteine cutoff for the developmentof significant levels of post-CEA intimal hyperplasia.The regression analysis in our previous work was per-formed with only two homocystine groups, control (0homocystine) and 4.5 (4.5 g/kg homocystine) and didnot indicate the association between homocysteine andintimal hyperplasia at lower plasma homocysteine lev-els. Our current regression analysis confirms the rela-tionship over a wider range of homocysteine andintimal hyperplasia levels. The lower plasma homocys-teine levels also induced significant changes in intimalhyperplasia, increased cell replication rates and en-zymes in the homocysteine metabolism pathway. Thiswas in addition to the stepwise increases we observed inplasma homocysteine levels, BrdU percentages, percent-ages of intimal hyperplasia with increasing dietary andplasma levels of homocysteine supplementation.
Thus, we have shown increasing levels of plasmahomocysteine produces direct increases in restenosisdue to intimal hyperplasia. Therefore, even a mildlyelevated plasma homocysteine (15 �M) could pre-dis-pose an individual to a greater risk of post-CEA intimalhyperplasia. The evaluation and possible treatment ofpatients with elevated homocysteine levels may lead todecreased restenosis rates.
Our study design also included evaluation of themechanism of action of the plasma homocysteine eleva-tion as well as the increase in intimal hyperplasia. Onepossible mechanism of action is that homocysteine isacting directly to enhance the intimal hyperplasia re-sponse. Homocysteine is a known mitogen for vascularsmooth muscle cells, which play the predominate role inpost-CEA intimal hyperplasia. The normal course ofevents observed in post-CEA intimal hyperplasia may

F. Southern et al. / Atherosclerosis 158 (2001) 129–138 137
be accelerated and enhanced due to the increasedplasma homocysteine. Previous studies have establishedthat hyperhomocystememia is a risk factor foratherosclerosis [4,5]. Harker et al. [28], showed that theinfusion of homocysteine into baboons resulted in my-ointimal cellular proliferation similar to changes foundin human atheromatous lesions. In vitro work hasdemonstrated that vascular smooth muscle cells ex-posed to homocysteine leads to a marked increase invascular smooth muscle cell proliferation. Tsai et al.[29], demonstrated with vascular smooth muscle cellcultures that homocysteine increased [3H] thymidineincorporation in rat vascular smooth muscle cells in adose dependent manner, with as little as 0.1 mM homo-cysteine resulting in a 25% increase in [3H] thymidineincorporation. Homocysteine was demonstrated to be apotent stimulant of DNA synthesis in rat vascularsmooth muscle cells by a four-fold increase in BrdUlabeled nuclei. This confirmed the stimulatory effect ofhomocysteine on DNA synthesis. Homocysteine wasalso found to induce quiescent rat vascular smoothmuscle cells to reenter the cell cycle of mitogenesis. Inaddition, homocysteine significantly increased cell num-bers in a time dependent study. Their report demon-strated that homocysteine increases DNA synthesis invascular smooth muscle cells and induces proliferation.While their study was focused on atherosclerotic le-sions, the authors suggested that homocysteine mayinteract with other growth factors or cytokines forpromotion of vascular smooth muscle cell growth. Inanother study, Tsai et al. [30] later showed that homo-cysteine increased [3H] thymidine incorporation uptakein human aortic smooth muscle cells. Once the artery isendarterectomized, there are mitogenic influences thatnormally interact to produce intimal hyperplasia. In thesetting of increased homocysteine, the baseline intimalhyperplasia response may be synergistically enhancedthus producing an accelerated intimal hyperplasia re-sponse. Dalton et al. [31], showed that incubation ofneural smooth muscle cells with homocysteine resultedin an increase of DNA synthesis that was dose-depen-dent, and increased cell number almost 20-fold. Thus,both the Tsai [30] and Dalton [31] studies demonstratehomocysteine to be a potent stimulant of cell prolifera-tion. The increased mitogenic activity of plasma homo-cysteine in our dietary model is suggested by the BrdUdata. The replicative index, as measured by BrdU, isincreased with increasing levels of plasma homocysteine(P=0.0013) and is also associated with increased levelsof intimal hyperplasia (P=0.01). We postulate that anendarterectomy performed in the millieu of increasedhomocysteine results in increased mitogenic stimulationof smooth muscle cells followed by an exaggeratedintimal hyperplastic response.
Two other aspects of homocysteine metabolism wereexamined for their possible role in the hyperplasia
induced by homocysteine. These consisted of the twoenzymes responsible for the removal of homocysteine,viz. MTHFR and CBS, and the two metabolic interme-diates involved in physiological methylation, viz. SAMand SAH. Genetic defects leading to deficiencies of ordiminished activities of these enzymes lead to hyperho-mocysteinemia and to atherosclerosis [5,9]. In thepresent study, the coordinate control by SAM ofMTHFR and CBS activities, which have been previ-ously proposed [32], was only partly evident. Adminis-tration of homocystine-containing diets did lead to anegative correlation of plasma homocysteine and hep-atic levels of SAM (r= −0.58; P=0.006). Diminishedhepatic levels of SAM and increased activity ofMTHFR (in the 1.5 and 3.0 g/kg homocysteine group,Table 1) showed a inverse correlation of P�0.01;however, not to SAH (P=0.60). The lack of signifi-cance of MTHFR activity in the 4.5 g/kg homocysteinegroup could have been due to a rise in SAM. The lackof significance of MTHFR activity in the 4.5 g/kghomocysteine group may have been due to a slight risein SAM and SAH, though still significantly lower thanthe controls. SAM has a direct effect on levels ofMTHFR activity and therefore, homocysteinemetabolism. The absence of an effect of the homocys-teine-containing diet on CBS activity resembles theeffects seen in an earlier study [33], in which folatedeficient rats led to homocysteinemia and disruptedSAM’s regulation of homocysteine metabolism withoutaffecting levels of CBS. Thus, the homocystine-fed ratsappeared to use homocysteine more extensively for thesynthesis of methionine than for cystathionine, relativeto control rats. The normal functioning of the cardio-vascular system is heavily dependent upon an adequatesupply of SAM, particularly for the methylation ofphospholipids and catecholamines [34–37]. Recent me-dia attention and marketing has promoted the sale ofSAM in prevention of cardiovascular disease.
Our results have shown that the transition from thecontrol to the homocystine-containing diets caused sig-nificant decreases in SAM and these changes correlatedwith the increases in cell replication and with homocys-teine levels in blood. This study suggests that homocys-teine could be a factor in post-CEA intimalhyperplasia. The ease of homocysteine measurementand treatment would make this a potentially importantclinical factor to investigate in patients before undergo-ing CEA. Elevations in plasma homocysteine stronglycorrelated with increases in post-CEA intimalhyperplasia.
Acknowledgements
We wish to thank Kim Henning and Wasson S.Snow, Supervisor of the Veterinary Medical Unit at the

F. Southern et al. / Atherosclerosis 158 (2001) 129–138138
Central Arkansas Veterans HealthCare System, fortheir invaluable assistance for this study, and CarolynK. Wise for determinations of SAM/SAH. We wouldalso like to thank Ethicon, Inc. for supplying the suturerequired for this study. Grant support: the study wasfunded in part by a grant from the American HeartAssociation Arkansas Affiliate and Hornick Grantfrom the University of Arkansas for Medical Sciences.
References
[1] Executive Committee for the Asymptomatic Carotid Atheroscle-rosis Study (ACAS): Endarterectomy for Asymptomatic CarotidArtery Stenosis. J.Am. Med. Assoc. 1995;273(18):1421–1428.
[2] North American Symptomatic Carotid Endarterectomy TrialCollaborators (NASCET): Beneficial effect of carotid endarterec-tomy in sympotmatic patients with high-grade carotid stenosis.N. Engl. J. Med. 1991;325(7):445–453.
[3] Healy DA, Zeirler RE, Nicholls SC, et al. Long-term follow-upand clinical outcome of carotid restenosis. J Vasc Surg1989;10:662–9.
[4] Refsum H, Ueland PM, Nygard O, Vollset SE. Homocysteineand cardiovascular disease. Annu Rev Med 1998;49:31–62.
[5] McCully KS. The Homocysteine Revolution. New Canaan, CT:Keats Publishing, 1997.
[6] Brattstrom L, Wilcken DE. Homocysteine and cardiovasculardisease: cause or effect? Am J Clin Nutr 2000;72:315–23.
[7] Willinek WA, Ludwig M, Lennarz M, et al. High–normal serumhomocysteine concentrations are associated with an increasedrisk of early atherosclerotic carotid artery wall lesions in healthysubjects. J Hypertens 2000;18:425–30.
[8] Hackam DG, Peterson JC, Spence JD. What level of plasmahomocyst(e)ine should be treated? Effects of vitamin therapy onprogression of carotid atherosclerosis in patients with homo-cyst(e)ine levels above and below 14 micromol/l. Am J Hyper-tens 2000;13:105–10.
[9] McQuillan BM, Beilby JP, Nidorf M, et al. Hyperhomocysteine-mia but not the C677T mutation of methylenetetrahydrofolatereductase is an independent risk determinant of carotid wallthickening. The perth carotid ultrasound disease assessmentstudy. Circulation 1999;99:2383–8.
[10] Tsai MY, Arnett DK, Eckfeldt JH, et al. Plasma homocysteineand its association with carotid intimal–medial wall thicknessand prevalent coronary heart disease: NHLBI family heartstudy. Atherosclerosis 2000;151:519–24.
[11] Nygard O, Vollset SE, Refsum H, et al. Total plasma homocys-teine and cardiovascular risk profile. J Am Med Assoc1995;224:1526–33.
[12] Southern FN, Cruz N, Fink LM, et al. Hyperhomocysteinemiaincreases intimal hyperplasia in a rat carotid endarterectomymodel. J Vasc Surg 1998;28:909–18.
[13] Spallone A, Sasaki T, Kassell NF. Time course of thromboticchanges after microsurgical carotid endarterectomy in the rat.Neurosurgery 1985;16:773–9.
[14] Saltzman EW, Kassell NF, Turner DM, Yamashita M, SpalloneA. Microsurgical carotid endarterectomy in rats. Neurosurgery1984;15:683–9.
[15] Chiang PK. Biological effects of inhibitors of S-adenosylhomo-cysteine hydrolase. Pharmacol Ther 1998;77:115–34.
[16] Wilson RB, Kula NS, Newberne PM, et al. Vascular damageand lipid peroxidation in choline-deficient rats. Exp Mol Pathol1973;18:357–68.
[17] Law MM, Gelabert HA, Moore WS, et al. Cigarette smokingincreases the development of intimal hyperplasia after vascularinjury. J Vasc Surg 1996;23:401–9.
[18] Ubbink J, Hayward VW, Bissport S. Rapid high performanceliquid chromatographic assay for total homocysteine levels inhuman serum. J Chromatogr 1991;565:441–6.
[19] Wise CK, Cooney CA, Ali SF, Poirier LA. Measuring S-adeno-sylmethionine in whole blood, red blood cells and cultured cellsusing a fast preparation method and high performance liquidchromatography. J Chromatogr B Biomed Sci Appl1997;696:145–52.
[20] Vanyushin BF, Lopatina NG, Wise CK, et al. Butylated hydrox-ytoluene modulates DNA methylation in rats. Eur J Biochem1998;256:518–27.
[21] Shi Y, O’Brien JE, Fard A, et al. Adventitial myofibroblastscontribute to neointimal formation in injured porcine coronaryarteries. Circulation 1996;94:1655–64.
[22] Mudd SH, Finkelstein JD, Irreverre F, et al. Transsulfuration inmammals. J Biol Chem 1965;240:4382–92.
[23] Kraus JP. Cystathionine �-synthase (Human). In: Methods inEnzymology. Academic Press, 1987:388–94.
[24] Mudd SH, Uhlendorf BW, Freeman JM, et al. Homocystinuriaassociated with decreased methylenetetrahydrofolate reductaseactivity. Biochem Biophys Res Commun 1972;46:905–12.
[25] Kang SS, Wong PW, Malinow MR. Hyperhomocyst(e)inemia asa risk factor for occlusive vascular disease. Ann Rev Nutr1992;12:279–98.
[26] Ueland PM, Refsum H, Stabler SP, et al. Total homocysteine inplasma or serum: methods and clinical applications. Clin Chem1993;39:1764–79.
[27] Voutilainen S, Alfthan G, Nyyssonen K, et al. Associationbetween elevated plasma total homocysteine and increased com-mon carotid artery wall thickness. Ann Med 1998;30:300–6.
[28] Harker LA, Harlan JM, Ross R. Effect of sulfinpyrazone onhomocysteine-induced endothelial injury and arteriosclerosis inbaboons. Circ Res 1983;53:731–9.
[29] Tsai JC, Perrella MA, Yoshizumi M, et al. Promotion of vascu-lar smooth muscle cell growth by homocysteine: a link toatherosclerosis. Proc Natl Acad Sci USA 1994;91:6369–73.
[30] Tsai JC, Wang H, Perrella MA, et al. Inductions of cyclin Agene expression by homocysteine in vascular smooth musclecells. J Clin Invest 1996;97:146–53.
[31] Dalton ML, Gadson PF Jr., Wrenn RW, et al. Homocysteinesignal cascade: production of phospholipids, activation ofprotein kinase C, and the induction of c-fos and c-myb insmooth muscle cells. FASEB J 1997;11:703–11.
[32] Selhub J, Miller JW. The pathogenesis of homocysteinemia:interruption of the coordinate regulation by S-adenosylmethion-ine of the remethylation and transsulfuration of homocysteine.Am J Clin Nutr 1992;55:131–8.
[33] Miller JW, Nadeau MR, Smith J, Smith D, Selhub J. Folate-deficiency-induced homocysteinaemia in rats: disruption of S-adenosylmethionine’s co-ordinate regulation of homocysteinemetabolism. Biochem J 1994;298:415–9.
[34] Schaffer SW. Cardiomyopathy associated with noninsulin-de-pendent diabetes. Mol Cell Biochem 1991;107(1):1–20.
[35] Panagia V, Taira Y, Ganguly PK, Tung S, Dhalla NS. Alter-ations in phospholipid N-methylation of cardiac subcellularmembranes due to experimentally induced diabetes in rats. J ClinInvest 1990;86(3):777–84.
[36] Levin JA, Wilson SE. The effects of 6-hydroxydopamine on thedisposition of norepinephrine in the rabbit aorta. J PharmacolExp Ther 1981;217(1):162–9 April.
[37] Esler MD, Turner AG, Kaye DM, et al. Aging effects on humansympathetic neuronal function. Am J Physiol 1995;268(1 Pt2):R278–85.
.
Copyright © 2022 FDOKUMEN