Supplementary Material to: Tracking Whole-Brain Connectivity Dynamics in the Resting State
Increased Resting-State Gamma-Band Connectivity in First-Episode Schizophrenia
10
Page 1 of 10 Schizophrenia Bulletin doi:10.1093/schbul/sbu121 © The Author 2014. Published by Oxford University Press on behalf of the Maryland Psychiatric Research Center. All rights reserved. For permissions, please email: [email protected] Increased Resting-State Gamma-Band Connectivity in First-Episode Schizophrenia Christina Andreou* ,1 , Guido Nolte 2 , Gregor Leicht 1 , Nenad Polomac 1 , Ileana L. Hanganu-Opatz 3 , Martin Lambert 1 , Andreas K. Engel 2 , and Christoph Mulert 1 1 Department of Psychiatry and Psychotherapy, University Medical Center Hamburg-Eppendorf, Hamburg, Germany; 2 Department of Neurophysiology and Pathophysiology, University Medical Center Hamburg-Eppendorf, Hamburg, Germany; 3 Developmental Neurophysiology, Institute of Neuroanatomy, University Medical Center Hamburg-Eppendorf, Hamburg, Germany *To whom correspondence should be addressed; Department of Psychiatry and Psychotherapy, University Medical Center Hamburg- Eppendorf, Martinistrasse 52, 20246 Hamburg, Germany; tel: 49-40-741059460, fax: 49-40-741059805; e-mail: [email protected] Background: Schizophrenia has long been suggested to represent a disorder with prominent neural dysconnectiv- ity. Gamma-band oscillations are highly relevant in this context, due both to their proposed involvement in neu- ronal synchronization and to their association with neu- rotransmitter systems relevant for schizophrenia. Several task-related studies have confirmed reduced power and synchronization of gamma-band oscillations in schizo- phrenia, but it has been suggested that these findings might not apply to the resting state. The present study aimed to investigate resting-state gamma-band connec- tivity in patients with schizophrenia. Methods: Sixty- four channel resting-state electroencephalography (eyes closed) was recorded in 22 patients with first-episode schizophrenia and 22 healthy controls matched for age and gender. Orthogonalized power envelope correlation was used as a measure of connectivity across 80 cortical regions at 40 Hz. Mean connectivity at each region was compared across groups using the nonparametric random- ization approach. Additionally, the network-based statis- tic was applied to identify affected networks in patients. Results: Patients displayed increased mean functional gamma-band connectivity compared to controls in the left rolandic operculum. Network-based analyses indicated increased connectivity in patients within a strongly later- alized network consisting mainly of left inferior frontal/ orbitofrontal, lateral and medial temporal, and inferior parietal areas. Within this network, gamma-band con- nectivity was higher in patients with low positive and dis- organization symptom levels. Conclusions: The present study provides a link between resting-state gamma-band connectivity and the core symptoms of schizophrenia. The observed findings are different than those reported by task-related studies, suggesting that resting-state stud- ies might reveal new aspects in the pathophysiology of schizophrenia. Key words: psychosis/positive symptoms/disorganization/ EEG/functional connectivity/power envelope correlation Introduction It has been long suggested that the complex clini- cal and cognitive symptoms of schizophrenia are best explained in terms of disturbed coordination of distributed brain networks rather than as hypofunc- tionality of specific brain regions. 1,2 A large body of functional magnetic resonance imaging studies have identified connectivity disturbances in patients with schizophrenia. 3 However, following the seminal propo- sition that communication within neuronal networks is mediated by synchronous neural oscillations, 4–6 there has also been growing interest in the oscillatory mech- anisms underlying these connectivity disturbances as revealed by electroencephalography (EEG) and magne- toencephalography (MEG). Gamma-band oscillations occupy a central place within this framework because they are involved in both local and large-scale neuronal synchronization underlying a broad range of percep- tual and higher-order cognitive functions, 4,5,7 such as those typically impaired in schizophrenia. Moreover, recent evidence links gamma-band oscillations to neu- rotransmitter systems and gene variants associated with schizophrenia: The generation of gamma-band oscillations depends on a closed feedback loop involv- ing parvalbumin-positive GABAergic interneurons and glutamatergic pyramidal cells. 8,9 Several pharma- cological and genetic disease models of schizophrenia interfere with the function of this microcircuit and lead to disruption of gamma-band oscillations, while a significant amount of evidence points to disturbances of elements of the gamma-generator loop in patients with schizophrenia. 7,10 Schizophrenia Bulletin Advance Access published August 28, 2014 by guest on May 13, 2016 http://schizophreniabulletin.oxfordjournals.org/ Downloaded from
-
Upload
uni-hamburg -
Category
Documents
-
view
1 -
download
0
Transcript of Increased Resting-State Gamma-Band Connectivity in First-Episode Schizophrenia

Page 1 of 10
Schizophrenia Bulletin doi:10.1093/schbul/sbu121
© The Author 2014. Published by Oxford University Press on behalf of the Maryland Psychiatric Research Center. All rights reserved. For permissions, please email: [email protected]
Increased Resting-State Gamma-Band Connectivity in First-Episode Schizophrenia
Christina Andreou*,1, Guido Nolte2, Gregor Leicht1, Nenad Polomac1, Ileana L. Hanganu-Opatz3, Martin Lambert1, Andreas K. Engel2, and Christoph Mulert1
1Department of Psychiatry and Psychotherapy, University Medical Center Hamburg-Eppendorf, Hamburg, Germany; 2Department of Neurophysiology and Pathophysiology, University Medical Center Hamburg-Eppendorf, Hamburg, Germany; 3Developmental Neurophysiology, Institute of Neuroanatomy, University Medical Center Hamburg-Eppendorf, Hamburg, Germany
*To whom correspondence should be addressed; Department of Psychiatry and Psychotherapy, University Medical Center Hamburg-Eppendorf, Martinistrasse 52, 20246 Hamburg, Germany; tel: 49-40-741059460, fax: 49-40-741059805; e-mail: [email protected]
Background: Schizophrenia has long been suggested to represent a disorder with prominent neural dysconnectiv-ity. Gamma-band oscillations are highly relevant in this context, due both to their proposed involvement in neu-ronal synchronization and to their association with neu-rotransmitter systems relevant for schizophrenia. Several task-related studies have confirmed reduced power and synchronization of gamma-band oscillations in schizo-phrenia, but it has been suggested that these findings might not apply to the resting state. The present study aimed to investigate resting-state gamma-band connec-tivity in patients with schizophrenia. Methods: Sixty-four channel resting-state electroencephalography (eyes closed) was recorded in 22 patients with first-episode schizophrenia and 22 healthy controls matched for age and gender. Orthogonalized power envelope correlation was used as a measure of connectivity across 80 cortical regions at 40 Hz. Mean connectivity at each region was compared across groups using the nonparametric random-ization approach. Additionally, the network-based statis-tic was applied to identify affected networks in patients. Results: Patients displayed increased mean functional gamma-band connectivity compared to controls in the left rolandic operculum. Network-based analyses indicated increased connectivity in patients within a strongly later-alized network consisting mainly of left inferior frontal/orbitofrontal, lateral and medial temporal, and inferior parietal areas. Within this network, gamma-band con-nectivity was higher in patients with low positive and dis-organization symptom levels. Conclusions: The present study provides a link between resting-state gamma-band connectivity and the core symptoms of schizophrenia. The observed findings are different than those reported by task-related studies, suggesting that resting-state stud-ies might reveal new aspects in the pathophysiology of schizophrenia.
Key words: psychosis/positive symptoms/disorganization/ EEG/functional connectivity/power envelope correlation
Introduction
It has been long suggested that the complex clini-cal and cognitive symptoms of schizophrenia are best explained in terms of disturbed coordination of distributed brain networks rather than as hypofunc-tionality of specific brain regions.1,2 A large body of functional magnetic resonance imaging studies have identified connectivity disturbances in patients with schizophrenia.3 However, following the seminal propo-sition that communication within neuronal networks is mediated by synchronous neural oscillations,4–6 there has also been growing interest in the oscillatory mech-anisms underlying these connectivity disturbances as revealed by electroencephalography (EEG) and magne-toencephalography (MEG). Gamma-band oscillations occupy a central place within this framework because they are involved in both local and large-scale neuronal synchronization underlying a broad range of percep-tual and higher-order cognitive functions,4,5,7 such as those typically impaired in schizophrenia. Moreover, recent evidence links gamma-band oscillations to neu-rotransmitter systems and gene variants associated with schizophrenia: The generation of gamma-band oscillations depends on a closed feedback loop involv-ing parvalbumin-positive GABAergic interneurons and glutamatergic pyramidal cells.8,9 Several pharma-cological and genetic disease models of schizophrenia interfere with the function of this microcircuit and lead to disruption of gamma-band oscillations, while a significant amount of evidence points to disturbances of elements of the gamma-generator loop in patients with schizophrenia.7,10
Schizophrenia Bulletin Advance Access published August 28, 2014 by guest on M
ay 13, 2016http://schizophreniabulletin.oxfordjournals.org/
Dow
nloaded from

Page 2 of 10
C. Andreou et al
Several studies in patients with schizophrenia have con-sistently reported reduced local gamma-band oscillatory power during a variety of perceptual and cognitive tasks, as well as reduced locking of the gamma oscillation phase to stimulus presentation.11–21 More recent MEG studies have extended these findings to the high gamma range (>60 Hz), demonstrating deficits in patients compared to healthy controls during perceptual processing.22–25 Similar deficits have been described in unaffected first-degree rel-atives of patients with schizophrenia,26,27 suggesting that abnormalities of gamma-band oscillations might repre-sent an intermediate phenotype for the illness. Emerging evidence also suggests that not only local gamma-band responses but also the long-range synchronization of gamma-band oscillations are reduced during stimulus processing in patients.16,28–30
However, the pattern of gamma-band oscillation abnormalities in schizophrenia might be less straightfor-ward than the above studies suggest. For one, gamma-band responses often correlate with positive psychotic symptoms in a counter-intuitive direction, with higher (ie, more “normal”) gamma-band activity corresponding to increased symptom load.16,19,31,32 Second, pathophysi-ological models of schizophrenia do not always predict reduced gamma-band activity: A recent computational model demonstrated that disruptions within the local gamma-generator circuit or reduced GABAergic inter-neuron output (which is expected to be the case in schizo-phrenia) led indeed to deficits in gamma-band activity33; however, the prominent glutamate hypothesis of schizo-phrenia postulates impaired N-methyl-d-aspartate (NMDA) glutamatergic receptor signaling, which resulted in increased gamma-band power in the modeled network, consistent with the effects of acute administration of NMDA receptor antagonists on humans and animals.7 Indeed, increased spontaneous gamma-band activity has often been reported in schizophrenia,34–36 although findings are discordant, with other studies showing no change37 or even reduced38 resting-state gamma-band power in patients.
However, power cannot necessarily be used to draw inferences with respect to synchronization because the 2 measures can dissociate from each other.39 As already dis-cussed, gamma oscillations are postulated to play a major role in synchronization between cortical areas. This role is not limited to neural synchrony of local brain networks, but also extends to large-scale interactions.40–43 Therefore, investigations of connectivity, rather than power, in the resting state might contribute to disentangling the dis-crepancies of previous research, providing new insights into the role of gamma-band connectivity in the patho-physiology of the disorder. So far, only 2 studies have assessed gamma-band synchronization in patients with schizophrenia.44,45 Their results were inconsistent, with one study45 reporting reduced global, scalp-level gamma-band coordination in patients with schizophrenia over the
right frontal area, while the other study44 did not find any significant differences in gamma-band coherence between patients and controls. However, the measures used to assess connectivity in the above studies did not address an important problem associated with EEG/MEG data, namely that measures of brain interaction may be dis-torted by signal mixing due to volume conduction and, for EEG, by the use of a common reference,46,47 which limits the interpretability of findings. Therefore, the aim of the present study was to investigate EEG resting-state connectivity in the gamma frequency range in patients with schizophrenia compared to healthy controls, using source-level analysis and an appropriate interaction mea-sure that is robust against spurious interaction patterns resulting from signal mixing. Because of the scarcity of previous studies on the subject, we adopted a strictly bottom-up approach, with no prior hypotheses regarding the direction or the localization of differences. Only first-episode patients were included, in order to minimize the confounding effects of cumulated antipsychotic exposure and illness chronicity.
Methods
The present investigation was part of a larger study inves-tigating resting-state and task-related brain connectivity in schizophrenia by means of EEG, MEG, and simul-taneous electroencephalography/functional magnetic resonance imaging (EEG/fMRI). Participants were 22 patients with first-episode schizophrenia and 22 healthy controls. Patients were recruited through the Psychosis Centre of the Department of Psychiatry of the University Medical Center Hamburg-Eppendorf. First-episode sta-tus was defined as having received the first diagnosis and psychiatric treatment less than a year prior to study par-ticipation, and presence of psychotic symptoms in any form for no more than 5 years. Healthy controls were recruited from the community. Exclusion criteria for all participants were current substance abuse or dependence, and presence of major somatic or neurological disorders. For healthy control subjects, additional exclusion crite-ria were any previous psychiatric disorder or treatment, and a family history of psychotic disorders. The presence of inclusion/exclusion criteria was assessed by means of a semistructured interview. The study was conducted in accordance with the Declaration of Helsinki. All partici-pants were required to sign an informed consent form prior to entering the study.
Diagnosis of schizophrenia in patients was established with the Mini International Neuropsychiatric Interview.48 Severity of clinical symptomatology was assessed with the Positive and Negative Syndrome Scale (PANSS).49 Because participation in the original project included 3 to 5 neurophysiological testing sessions (EEG, MEG and EEG/fMRI), it was not always possible to conduct clinical assessments close to the EEG session. Therefore,
by guest on May 13, 2016
http://schizophreniabulletin.oxfordjournals.org/D
ownloaded from

Page 3 of 10
Gamma-Band Connectivity in Schizophrenia
based on reported trajectories of antipsychotic treatment response,50,51 clinical severity ratings were used for anal-yses only if they were separated from EEG analyses by no more than a week for acutely ill patients, or 2 months for stable patients (ie, those with no change in medica-tion for at least 2 months prior to study participation). Appropriate clinical ratings were available for 19 patients. Thus, although connectivity analyses were conducted on the entire sample of 22 patients, follow-up analyses on associations with symptoms were based on this subsample of 19 patients.
The majority of patients (18/22) received antipsychotic medication at the time of participation in the study (ami-sulpride [n = 1], aripiprazole [n = 3], olanzapine [n = 5], paliperidone [n = 3], quetiapine [n = 2], or risperidone [n = 5]). Moreover, 6 patients were currently in treatment with antidepressants. No subjects were receiving benzo-diazepines or anticholinergic agents. Demographic char-acteristics of the 2 groups, and clinical characteristics of patients, are presented in table 1.
EEG Recording and Connectivity Analyses
Recordings took place in a sound-attenuated and elec-trically shielded room. Continuous EEG activity was recorded while subjects were seated comfortably with their eyes closed. Participants were monitored for elec-troencephalographic signs of drowsiness53 for the whole duration of the recording (5–10 minutes). Recordings were conducted at a sampling rate of 1000 Hz with 64 Ag/AgCl electrodes mounted on an elastic cap (ActiCaps; Brain Products, Munich, Germany), using the Brain Vision Recorder software version 1.10 (Brain Products). Eye movements were recorded with 4 EOG channels. Electrode impedance was always kept below 5 kΩ.
Offline preprocessing was performed with Analyzer 2.0 (Brain Products). A 0.1–70 Hz Butterworth zero-phase bandpass filter (12 dB/octave) was applied. Ocular and prominent muscle artifacts were removed by means of independent component analysis. Subsequently, the recording was divided into 2-second epochs, which were visually inspected for artifacts, recomputed against the average reference, and down-sampled to 256 Hz.
All further analyses were performed in Matlab (Mathworks) using custom-made scripts. Spectral esti-mates were derived in successive temporal windows of 0.125-second duration with 75% overlap, centered around a frequency of 40 Hz (frequency resolution = 8 Hz), such as to correspond to the frequency range most frequently investigated in previous EEG studies (30–50 Hz). Although abnormalities at higher gamma-band fre-quencies (60–90 Hz) have also been reported in schizo-phrenia (see Introduction), all but one of the respective studies have used MEG recordings, which provide a higher signal-to-noise ratio than EEG.54 Therefore, and due to practical considerations regarding possible con-tamination by remaining subtle muscle artifacts, we did not investigate connectivity in these frequencies.
The intracortical sources of brain electrical activity were localized using exact low-resolution electromagnetic tomog-raphy (eLORETA).55 Head surface EEG data were recom-puted into 80 source model time series, corresponding to the centers of all regions of the Automated Anatomic Labeling atlas covering cortical areas and the hippocampi (40 for each hemisphere, see table 2 for coordinates of each point). Thus, connectivity analyses were based on (80 × 79/2=) 3160 pairs of sources distributed throughout the cortex, sufficient for obtaining detailed estimates of connectivity within the constraints posed by the limited spatial resolution of EEG.
As a measure of functional connectivity, we used power envelope correlation between orthogonalized signals,46 a measure that addresses the well-known problem of spu-rious correlation patterns caused by signal mixing, by removing same-phase signal components before calculat-ing power envelopes and their correlation. Measures based on temporal correlations between the amplitude envelopes of neural oscillations have been increasingly used to inves-tigate functional connectivity.56–63 It has been suggested that such connectivity measures are conceptually more similar to those obtained with fMRI than coherence-based methods.56 It has indeed been shown that amplitude enve-lope correlations in various frequency bands (including the gamma band) adequately reflect interactions within and between resting-state networks depicted by fMRI.39,40,56
Details of EEG electrode placement and computation methods can be found in the supplementary methods.
Statistical Analyses
Differences between the 2 groups regarding gamma-band power at the scalp level were assessed with an independent
Table 1. Sociodemographic and Clinical Characteristics of the 2 Participant Groups
Healthy Controls Schizophrenia t/χ2 P
Gender (m/f) N N17/5 19/3 0.611 .43Mean (SD) Mean (SD)
Age 24.35 (5.1) 24.09 (5.1) 0.165 .87Length of illness (years)
— 1.18 (1.3)
Antipsychotic medication dosea
— 188.64 (181.0)
PANSS scores Total — 56.00 (15.6) Positive — 15.28 (7.9) Negative — 14.28 (5.4) Disorganization — 15.17 (4.3) Excitement — 13.89 (4.9) Distress — 17.89 (6.3)
aChlorpromazine equivalent dose.52
by guest on May 13, 2016
http://schizophreniabulletin.oxfordjournals.org/D
ownloaded from

Page 4 of 10
C. Andreou et al
samples t test. At the source level, difference scores were calculated for eLORETA current density power at each one of the 80 cortical points, and the nonparametric ran-domization approach64 was used to estimate critical prob-ability thresholds, corrected for multiple comparisons. The same analysis was applied on the average connectivity val-ues between each cortical point and the rest of the brain.
The above analyses should identify regions of increased or decreased connectivity in patients compared to con-trol subjects, but they do not allow inferences as to what these regions interact with, ie, as to which networks are affected. Therefore, we also used the network-based sta-tistic (NBS) introduced by Zalesky et al,65 which corre-sponds to an application of cluster-based thresholding of statistical parametric maps64,66 to the graph model. NBS analyses were conducted using the open-source toolbox
NBS Connectome v1.2 (http://www.nitrc.org/projects/nbs, last accessed on Aug 8, 2014). Because contrasts were conducted in 2 directions (controls > patients and vice versa), the significance level was set to 0.025.
A detailed account of the procedures described above is provided in the supplementary methods.
Results
The number of artifact-free epochs did not significantly differ between patients and controls (mean 217.3 ± 52.97 vs 212.6 ± 53.47, t = 0.326, P = .75). There were no dif-ferences between patients and controls regarding either scalp- or source-level gamma-band power (both P > .7).
Patients with schizophrenia exhibited significantly increased mean connectivity compared to controls
Table 2. Coordinates of the 80 Cortical Points Used for Connectivity Analyses
Left Hemisphere Right Hemisphere
x y z x y z
Medial orbitofrontal cortex −5 55 −5 5 50 −5Middle orbitofrontal cortex −30 50 −10 30 55 −10Superior frontal gyrus, medial part −5 50 30 10 50 30Superior frontal gyrus, orbital part −20 50 −15 15 50 −15Anterior cingulate cortex −5 35 15 5 35 15Middle frontal gyrus −35 35 35 35 35 35Superior frontal gyrus −20 35 40 20 30 45Gyrus rectus −5 35 −20 5 35 −20Inferior frontal gyrus, orbital part −35 30 −10 40 30 −10Inferior frontal gyrus, pars triangularis −45 30 15 45 30 15Inferior frontal operculum −50 15 20 50 15 20Olfactory gyrus −5 15 −10 5 15 −10Temporal pole, middle temporal gyrus −35 15 −35 45 15 −30Temporal pole, superior temporal gyrus −40 15 −20 45 15 −15Insula −40 10 0 40 10 0Supplementary motor area −5 5 60 10 0 60Precentral gyrus −40 −5 50 40 −10 50Rolandic operculum −50 −10 15 50 −5 15Middle cingulate cortex −5 −15 40 5 −10 40Parahippocampal gyrus −20 −15 −20 20 −15 −20Heschl gyrus −45 −20 10 45 −15 10Hippocampus −25 −20 −10 25 −20 −10Superior temporal gyrus −55 −20 5 55 −20 5Paracentral lobule −5 −25 70 5 −30 70Postcentral gyrus −45 −25 50 40 −25 55Inferior temporal gyrus −50 −30 −25 55 −30 −20Supramarginal gyrus −55 −35 30 55 −30 35Middle temporal gyrus −55 −35 0 55 −35 0Fusiform gyrus −30 −40 −20 35 −40 −20Posterior cingulate cortex −5 −45 25 5 −45 20Inferior parietal lobule −45 −45 45 45 −45 50Precuneus −10 −55 50 10 −55 45Superior parietal lobule −25 −60 60 25 −60 60Angular gyrus −45 −65 40 40 −60 40Lingual gyrus −15 −70 −5 15 −65 −5Calcarine sulcus −10 −80 10 15 −75 10Cuneus −5 −80 25 15 −80 30Inferior occipital gyrus −35 −80 −10 35 −80 −10Middle occipital gyrus −30 −80 15 35 −85 20Superior occipital gyrus −20 −85 30 20 −80 30
by guest on May 13, 2016
http://schizophreniabulletin.oxfordjournals.org/D
ownloaded from

Page 5 of 10
Gamma-Band Connectivity in Schizophrenia
in the left rolandic operculum (mean difference score 0.047 ± 0.019, corrected P = .045). NBS revealed a net-work of increased connectivity in patients compared to controls (threshold t = 2.8, corrected P = 0.025). This network involved 33 regions and was composed of 82 connections, mainly of left lateral parietal and tempo-ral areas (including auditory and language areas) with lateral and orbital frontal areas of the same, but also of the contralateral hemisphere (see figure 1 and table 3). The reverse contrast did not identify any networks with reduced gamma-band connectivity in patients (P > .4). The inclusion of antipsychotic medication dose (in chlor-promazine equivalents) did not substantially alter the results.
Alterations of gamma-band activity have been asso-ciated with positive and disorganization symptoms in previous studies.16,17,19,22,31,32 Therefore, we conducted exploratory analyses to assess the effect of these symp-toms, as follows: We split the patient sample at the median score of the respective PANSS factors67 and used uni-variate ANOVAs to compare mean connectivity within the network revealed as significant in the above analyses among the 2 resulting (high- vs low-symptom) patient subgroups and healthy controls (see figure 2). For disor-ganization symptoms, the overall ANOVA was significant [F(2,38) = 22.26, P < .001]. Post hoc tests with Bonferroni correction indicated that patients with low symptoms (PANSS factor score <15, n = 10) exhibited significantly higher mean connectivity within the network in ques-tion compared to both patients with high symptoms (P < .001) and control subjects (P < .001), who did not differ from each other (P = 1.0). For positive symptoms,
a similar picture emerged [overall ANOVA F(2,38)=7.67, P = .002], with low-symptom patients (PANSS factor score <14, n = 9) displaying significantly higher mean connectivity compared to healthy controls (P = .002), while high-symptom patients fell in the middle between the other 2 groups (P > .09 in the comparison to con-trols, P > .5 in the comparison to low-symptom patients). However, the effect of positive symptoms disappeared when the 2 factors (positive and disorganization symp-tom load) were entered simultaneously as fixed factors in a single univariate ANOVA, whereas the effect of disorganization symptoms remained significant [F(2,36) = 19.49, P < .001]. The observed pattern of results remained essentially unchanged when the above analyses were repeated for the patient group only, including anti-psychotic medication dose (in chlorpromazine equiva-lents) as a covariate.
Discussion
The present study investigated resting-state functional connectivity in the gamma frequency range in a sample of first-episode patients with schizophrenia compared to healthy controls. Connectivity changes were analyzed at the neuronal source level. Our analysis revealed increased connectivity within a network comprising mainly left inferior frontal/orbitofrontal, lateral and medial tem-poral, and inferior parietal areas. Within this network, gamma-band connectivity was higher in patients with low positive and disorganization symptom levels.
The gamma-band connectivity increase in patients observed here contrasts to findings of previous
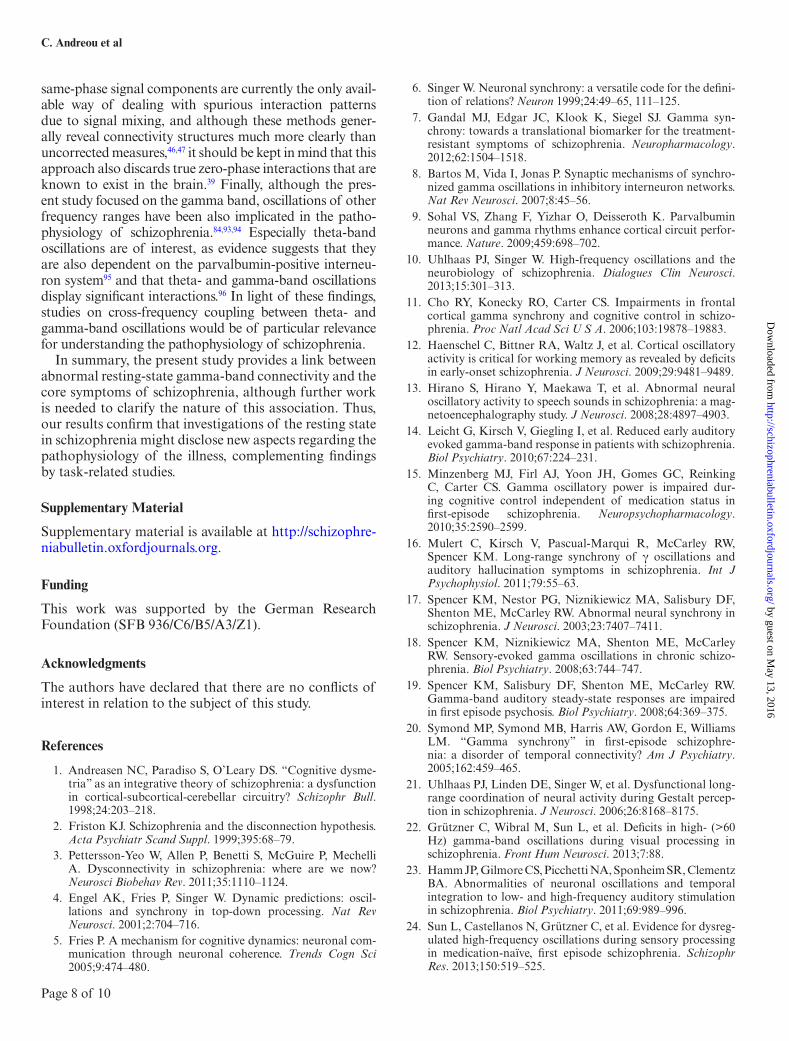
Fig. 1. Network of increased resting-state gamma-band connectivity in patients with schizophrenia compared to healthy controls. The size of each node represents its number of connections within the network (degree). Labels are provided for nodes with at least 8 connections. As seen in table 1, these nodes are responsible for about 50% of interactions within the network. Ang, angular gyrus; FrIT, inferior frontal gyrus, pars triangularis; FrMO = medial orbitofrontal gyrus; FSupO, superior frontal gyrus, orbital part; InfT, inferior temporal gyrus; MidT, middle temporal gyrus; RolOp, rolandic operculum; PreC, precentral gyrus; PostC, postcentral gyrus. Color coding (online version only): inferior frontal and orbitofrontal cortex, orange; medial frontal cortex, light blue; lateral frontal cortex, red; remporal cortex and insula, yellow; parietal cortex, dark blue. The figure was created using BrainNet Viewer (http://www.nitrc.org/projects/bnv/, last accessed on Aug 8, 2014).
by guest on May 13, 2016
http://schizophreniabulletin.oxfordjournals.org/D
ownloaded from

Page 6 of 10
C. Andreou et al
task-related studies,16,28–30 suggesting that the pattern of gamma-band interactions might differ between rest and conditions of cognitive or sensory stimulation. The only other existing study that assessed source-level resting-state gamma-band connectivity in schizophrenia did not find any significant differences between patients and con-trols.44 However, that study did not use signal orthogo-nalization to minimize the effects of volume conduction. Perhaps more importantly, the connectivity measure used was based on phase synchronization, whereas the present study used an amplitude-based measure of connectivity. It has been suggested that the 2 types of measure may reflect different underlying coupling mechanisms and their function,39 which could explain differences between the 2 studies.
The increase of gamma-band connectivity was not unspecific, but rather involved a distinct and strongly lateralized network. The latter comprised areas rel-evant for language and memory functions, which have been reported to be affected in schizophrenia,3,68–70 and
are implicated both in auditory hallucinations71,72 and in disorganization symptoms,73 especially disorganized speech.74,75 Thus, the present results may provide a link between aberrant gamma-band connectivity at rest and core clinical symptoms of schizophrenia.
However, the suggested link of aberrant gamma-band coupling with symptoms is not a straightforward one: Patients with higher disorganization and positive symp-tom scores actually exhibited lower mean connectivity values within the affected network. Interestingly, a simi-lar pattern has been reported in previous task-related studies of gamma-band oscillations: Although both the stimulus-locking of local gamma-band phase19,31,32 and the long-range synchrony of gamma oscillations16 are reduced in patients with schizophrenia, their correlation with positive symptoms is a positive one. In contrast, a study that reported an increased delayed left-hemisphere gamma-band response to speech in patients with schizo-phrenia13 found a negative correlation with hallucination severity. All the above findings indicate that increased psychopathology is associated with more “normal” mea-sures of local phase-coupling and/or interregional syn-chronization in the gamma frequency range. This appears counter intuitive, but a look into the physiological role of gamma oscillations in normal cognition might help elucidate this discrepancy. It has been suggested that gamma-band oscillations mediate the integration of stim-uli according to previous predictions, and possibly also the suppression of inappropriate associations.39,76,77 For example, gamma-band oscillations increase in response to highly predictable words within a sentence;78 they have also been associated with suppression of the formation of inappropriate memories in rats and with the suppression of phantom perceptions such as tinnitus.77 Although the above findings refer to local gamma-band power, recent evidence suggests that they may apply to long-range func-tional connectivity as well (which would be more relevant for the present study). For example, a recent psycholin-guistic study has suggested that gamma-band coherence between frontal and posterior areas might mediate the matching between incoming stimuli and pregenerated semantic expectations.79
Based on the above, the increased gamma-band con-nectivity observed in the present study might represent a successful adaptation of the brain to changes brought about by the pathophysiological process of psychosis, such that it is able to integrate the abnormal experiences caused by incoherent excitation of auditory, language, or memory networks. On the other hand, the opposite is also possible: An early account of psychosis postulated that psychotic symptoms arise in the attempt of the cognitive system to provide an explanatory framework for aber-rant sensory input caused by perceptual abnormalities.80 Based on this premise, increased gamma-band connectiv-ity in low-symptom patients might reflect the formation of aberrant associations among the involved brain areas,
Table 3. Brain Regions Comprising the Network of Increased Gamma Connectivity in Patients Compared to Controls, Sorted According to Their Degree (Number of Connections) Within the Network
Region Hemisphere Degree
Angular gyrus Left 15Rolandic operculum Left 12Medial orbitofrontal cortex Left 11Inferior temporal gyrus Left 9Inferior frontal gyrus, pars triangularis Left 8Superior frontal gyrus, orbital part Left 8Postcentral gyrus Left 8Precentral gyrus Left 8Middle temporal gyrus Left 8Middle cingulate cortex Right 7Supplementary motor area Right 7Paracentral lobule Right 6Middle cingulate cortex Left 5Paracentral lobule Left 5Middle orbitofrontal cortex Left 4Heschl gyrus Left 4Supplementary motor area Left 4Supramarginal gyrus Left 4Superior temporal gyrus Left 4Anterior cingulate cortex Left 3Inferior frontal gyrus, orbital part Left 3Superior frontal gyrus Right 3Gyrus rectus Left 3Anterior cingulate cortex Right 2Superior frontal gyrus Left 2Hippocampus Left 2Parahippocampal gyrus Left 2Inferior parietal lobule Left 2Inferior frontal operculum Left 1Inferior frontal gyrus, orbital part Right 1Medial orbitofrontal cortex Right 1Middle orbitofrontal cortex Right 1Gyrus rectus Right 1
by guest on May 13, 2016
http://schizophreniabulletin.oxfordjournals.org/D
ownloaded from

Page 7 of 10
Gamma-Band Connectivity in Schizophrenia
which however is too severe to be incorporated into such an explanatory network and produce symptoms (see Whitford et al81 for a similar interpretation of diffusion tensor imaging abnormalities in schizophrenia). These 2 explanations lead to opposite hypotheses regarding the changes of gamma-band abnormalities over the course of clinical improvement: If increased gamma-band cou-pling represents a successful compensatory mechanism, it should increase over the course of clinical improvement in acutely ill subjects. However, if it reflects a primary abnor-mality, it should show little change or even decrease paral-lel to symptom decline. Unfortunately, the cross-sectional nature of the present study precludes a definite conclu-sion as to which of the 2 assumptions holds. Longitudinal studies of patients over the course of clinical improve-ment, or studies of individuals at high-risk for psychotic disorders, are warranted to provide an answer to this question. Another interesting question to be addressed in future studies is how abnormal large-scale connectivity in the gamma band relates to task-related local synchroniza-tion deficits observed in patients, and how this association might be influenced by symptom severity.
Of note, increased connectivity in patients was observed in the absence of gamma-band power abnormalities, confirming that the 2 measures can be differentially affected. The finding of normal resting-state gamma-band power in patients is in apparent discordance with several reports of baseline gamma-band power increase in schizophrenia.34–36 However, all of these studies have used prestimulus gamma-band power in the context of sensory stimulation paradigms as a measure of “resting-state” gamma-band activity, and in one case35 the authors argued that the enhanced baseline gamma-band activity
might have been a result of multiple stimulus presenta-tion. On the other hand, 3 studies assessing resting-state gamma-band power in a manner similar to the pres-ent study reported no differences between patients with schizophrenia and control subjects,37,82 or even decreased gamma-band power in patients.38
Certain limitations of the present study need to be addressed. First, most patients were currently receiving antipsychotic medication. Any direct effects of antipsy-chotic medication are rather unlikely in the present study because chlorpromazine equivalent dose had no effect on results. Moreover, preliminary evidence suggests that medication status does not affect neural oscillations in general, nor gamma-band oscillations in particular.83,84 On the other hand, we cannot exclude the possibility that the changes observed (especially in low-symptom patients) were mediated by the effects of antipsychotic treatment. Antipsychotic medication has indeed been reported to affect fMRI connectivity patterns in patients with schizo-phrenia.85 As already mentioned above, longitudinal stud-ies are required to shed light on these questions. Second, although EEG has several advantages when it comes to assessing fast neural network dynamics and the precise coordination of oscillations at different frequencies, it is limited both in its spatial resolution and in its capacity to detect sources of electrical activity at deep locations and in the cerebellum. Thus, the present results do not yield information on possible changes in structures such as the amygdala, thalamus, basal ganglia, and cerebellum, all of which have been implicated in connectivity disturbances in schizophrenia.86–92 A cautionary note is also appropriate with regard to the chosen method of functional connec-tivity calculation: Although methods based on excluding
Fig. 2. Mean gamma-band connectivity across the 33-node network that displayed significant differences between patients and healthy controls (HC). The patient group is split into 2 depending on the severity of positive (left panel) and disorganized (right panel) symptoms. Significant differences are marked with an asterisk.
by guest on May 13, 2016
http://schizophreniabulletin.oxfordjournals.org/D
ownloaded from
Page 8 of 10
C. Andreou et al
same-phase signal components are currently the only avail-able way of dealing with spurious interaction patterns due to signal mixing, and although these methods gener-ally reveal connectivity structures much more clearly than uncorrected measures,46,47 it should be kept in mind that this approach also discards true zero-phase interactions that are known to exist in the brain.39 Finally, although the pres-ent study focused on the gamma band, oscillations of other frequency ranges have been also implicated in the patho-physiology of schizophrenia.84,93,94 Especially theta-band oscillations are of interest, as evidence suggests that they are also dependent on the parvalbumin-positive interneu-ron system95 and that theta- and gamma-band oscillations display significant interactions.96 In light of these findings, studies on cross-frequency coupling between theta- and gamma-band oscillations would be of particular relevance for understanding the pathophysiology of schizophrenia.
In summary, the present study provides a link between abnormal resting-state gamma-band connectivity and the core symptoms of schizophrenia, although further work is needed to clarify the nature of this association. Thus, our results confirm that investigations of the resting state in schizophrenia might disclose new aspects regarding the pathophysiology of the illness, complementing findings by task-related studies.
Supplementary Material
Supplementary material is available at http://schizophre-niabulletin.oxfordjournals.org.
Funding
This work was supported by the German Research Foundation (SFB 936/C6/B5/A3/Z1).
Acknowledgments
The authors have declared that there are no conflicts of interest in relation to the subject of this study.
References
1. Andreasen NC, Paradiso S, O’Leary DS. “Cognitive dysme-tria” as an integrative theory of schizophrenia: a dysfunction in cortical-subcortical-cerebellar circuitry? Schizophr Bull. 1998;24:203–218.
2. Friston KJ. Schizophrenia and the disconnection hypothesis. Acta Psychiatr Scand Suppl. 1999;395:68–79.
3. Pettersson-Yeo W, Allen P, Benetti S, McGuire P, Mechelli A. Dysconnectivity in schizophrenia: where are we now? Neurosci Biobehav Rev. 2011;35:1110–1124.
4. Engel AK, Fries P, Singer W. Dynamic predictions: oscil-lations and synchrony in top-down processing. Nat Rev Neurosci. 2001;2:704–716.
5. Fries P. A mechanism for cognitive dynamics: neuronal com-munication through neuronal coherence. Trends Cogn Sci 2005;9:474–480.
6. Singer W. Neuronal synchrony: a versatile code for the defini-tion of relations? Neuron 1999;24:49–65, 111–125.
7. Gandal MJ, Edgar JC, Klook K, Siegel SJ. Gamma syn-chrony: towards a translational biomarker for the treatment-resistant symptoms of schizophrenia. Neuropharmacology. 2012;62:1504–1518.
8. Bartos M, Vida I, Jonas P. Synaptic mechanisms of synchro-nized gamma oscillations in inhibitory interneuron networks. Nat Rev Neurosci. 2007;8:45–56.
9. Sohal VS, Zhang F, Yizhar O, Deisseroth K. Parvalbumin neurons and gamma rhythms enhance cortical circuit perfor-mance. Nature. 2009;459:698–702.
10. Uhlhaas PJ, Singer W. High-frequency oscillations and the neurobiology of schizophrenia. Dialogues Clin Neurosci. 2013;15:301–313.
11. Cho RY, Konecky RO, Carter CS. Impairments in frontal cortical gamma synchrony and cognitive control in schizo-phrenia. Proc Natl Acad Sci U S A. 2006;103:19878–19883.
12. Haenschel C, Bittner RA, Waltz J, et al. Cortical oscillatory activity is critical for working memory as revealed by deficits in early-onset schizophrenia. J Neurosci. 2009;29:9481–9489.
13. Hirano S, Hirano Y, Maekawa T, et al. Abnormal neural oscillatory activity to speech sounds in schizophrenia: a mag-netoencephalography study. J Neurosci. 2008;28:4897–4903.
14. Leicht G, Kirsch V, Giegling I, et al. Reduced early auditory evoked gamma-band response in patients with schizophrenia. Biol Psychiatry. 2010;67:224–231.
15. Minzenberg MJ, Firl AJ, Yoon JH, Gomes GC, Reinking C, Carter CS. Gamma oscillatory power is impaired dur-ing cognitive control independent of medication status in first-episode schizophrenia. Neuropsychopharmacology. 2010;35:2590–2599.
16. Mulert C, Kirsch V, Pascual-Marqui R, McCarley RW, Spencer KM. Long-range synchrony of γ oscillations and auditory hallucination symptoms in schizophrenia. Int J Psychophysiol. 2011;79:55–63.
17. Spencer KM, Nestor PG, Niznikiewicz MA, Salisbury DF, Shenton ME, McCarley RW. Abnormal neural synchrony in schizophrenia. J Neurosci. 2003;23:7407–7411.
18. Spencer KM, Niznikiewicz MA, Shenton ME, McCarley RW. Sensory-evoked gamma oscillations in chronic schizo-phrenia. Biol Psychiatry. 2008;63:744–747.
19. Spencer KM, Salisbury DF, Shenton ME, McCarley RW. Gamma-band auditory steady-state responses are impaired in first episode psychosis. Biol Psychiatry. 2008;64:369–375.
20. Symond MP, Symond MB, Harris AW, Gordon E, Williams LM. “Gamma synchrony” in first-episode schizophre-nia: a disorder of temporal connectivity? Am J Psychiatry. 2005;162:459–465.
21. Uhlhaas PJ, Linden DE, Singer W, et al. Dysfunctional long-range coordination of neural activity during Gestalt percep-tion in schizophrenia. J Neurosci. 2006;26:8168–8175.
22. Grützner C, Wibral M, Sun L, et al. Deficits in high- (>60 Hz) gamma-band oscillations during visual processing in schizophrenia. Front Hum Neurosci. 2013;7:88.
23. Hamm JP, Gilmore CS, Picchetti NA, Sponheim SR, Clementz BA. Abnormalities of neuronal oscillations and temporal integration to low- and high-frequency auditory stimulation in schizophrenia. Biol Psychiatry. 2011;69:989–996.
24. Sun L, Castellanos N, Grützner C, et al. Evidence for dysreg-ulated high-frequency oscillations during sensory processing in medication-naïve, first episode schizophrenia. Schizophr Res. 2013;150:519–525.
by guest on May 13, 2016
http://schizophreniabulletin.oxfordjournals.org/D
ownloaded from

Page 9 of 10
Gamma-Band Connectivity in Schizophrenia
25. Tsuchimoto R, Kanba S, Hirano S, et al. Reduced high and low frequency gamma synchronization in patients with chronic schizophrenia. Schizophr Res. 2011;133:99–105.
26. Hall MH, Taylor G, Sham P, et al. The early auditory gamma-band response is heritable and a putative endophenotype of schizophrenia. Schizophr Bull. 2011;37:778–787.
27. Leicht G, Karch S, Karamatskos E, et al. Alterations of the early auditory evoked gamma-band response in first-degree relatives of patients with schizophrenia: hints to a new inter-mediate phenotype. J Psychiatr Res. 2011;45:699–705.
28. Ferrarelli F, Massimini M, Peterson MJ, et al. Reduced evoked gamma oscillations in the frontal cortex in schizo-phrenia patients: a TMS/EEG study. Am J Psychiatry. 2008;165:996–1005.
29. Ford JM, Mathalon DH. Corollary discharge dysfunction in schizophrenia: can it explain auditory hallucinations? Int J Psychophysiol. 2005;58:179–189.
30. Ford JM, Roach BJ, Faustman WO, Mathalon DH. Out-of-synch and out-of-sorts: dysfunction of motor-sen-sory communication in schizophrenia. Biol Psychiatry. 2008;63:736–743.
31. Spencer KM, Nestor PG, Perlmutter R, et al. Neural syn-chrony indexes disordered perception and cognition in schiz-ophrenia. Proc Natl Acad Sci U S A. 2004;101:17288–17293.
32. Spencer KM, Niznikiewicz MA, Nestor PG, Shenton ME, McCarley RW. Left auditory cortex gamma synchroniza-tion and auditory hallucination symptoms in schizophrenia. BMC Neurosci. 2009;10:85.
33. Spencer KM. The functional consequences of cortical cir-cuit abnormalities on gamma oscillations in schizophrenia: insights from computational modeling. Front Hum Neurosci. 2009;3:33.
34. Hong LE, Summerfelt A, Mitchell BD, et al. Sensory gating endophenotype based on its neural oscillatory pattern and heritability estimate. Arch Gen Psychiatry. 2008;65:1008–1016.
35. Spencer KM. Baseline gamma power during auditory steady-state stimulation in schizophrenia. Front Hum Neurosci. 2011;5:190.
36. Winterer G, Coppola R, Goldberg TE, et al. Prefrontal broadband noise, working memory, and genetic risk for schiz-ophrenia. Am J Psychiatry. 2004;161:490–500.
37. Venables NC, Bernat EM, Sponheim SR. Genetic and dis-order-specific aspects of resting state EEG abnormalities in schizophrenia. Schizophr Bull. 2009;35:826–839.
38. Rutter L, Carver FW, Holroyd T, et al. Magnetoencephalographic gamma power reduction in patients with schizophrenia during resting condition. Hum Brain Mapp. 2009;30:3254–3264.
39. Engel AK, Gerloff C, Hilgetag CC, Nolte G. Intrinsic cou-pling modes: multiscale interactions in ongoing brain activity. Neuron. 2013;80:867–886.
40. Betti V, Della Penna S, de Pasquale F, et al. Natural scenes viewing alters the dynamics of functional connectivity in the human brain. Neuron. 2013;79:782–797.
41. Betti V, Zappasodi F, Rossini PM, Aglioti SM, Tecchio F. Synchronous with your feelings: sensorimotor {gamma} band and empathy for pain. J Neurosci. 2009;29:12384–12392.
42. Schoffelen JM, Oostenveld R, Fries P. Neuronal coherence as a mechanism of effective corticospinal interaction. Science. 2005;308:111–113.
43. Siegel M, Donner TH, Oostenveld R, Fries P, Engel AK. Neuronal synchronization along the dorsal visual pathway reflects the focus of spatial attention. Neuron. 2008;60:709–719.
44. Rutter L, Nadar SR, Holroyd T, et al. Graph theoretical analysis of resting magnetoencephalographic functional con-nectivity networks. Front Comput Neurosci. 2013;7:93.
45. Kikuchi M, Hashimoto T, Nagasawa T, et al. Frontal areas contribute to reduced global coordination of resting-state gamma activities in drug-naïve patients with schizophrenia. Schizophr Res. 2011;130:187–194.
46. Hipp JF, Hawellek DJ, Corbetta M, Siegel M, Engel AK. Large-scale cortical correlation structure of spontaneous oscillatory activity. Nat Neurosci. 2012;15:884–890.
47. Nolte G, Bai O, Wheaton L, Mari Z, Vorbach S, Hallett M. Identifying true brain interaction from EEG data using the imaginary part of coherency. Clin Neurophysiol. 2004;115:2292–2307.
48. Sheehan DV, Lecrubier Y, Sheehan KH, et al. The Mini-International Neuropsychiatric Interview (M.I.N.I.): the development and validation of a structured diagnostic psy-chiatric interview for DSM-IV and ICD-10. J Clin Psychiatry. 1998;59(suppl 20):22–33;quiz 34–57.
49. Kay SR, Fiszbein A, Opler LA. The positive and negative syndrome scale (PANSS) for schizophrenia. Schizophr Bull. 1987;13:261–276.
50. Case M, Stauffer VL, Ascher-Svanum H, et al. The hetero-geneity of antipsychotic response in the treatment of schizo-phrenia. Psychol Med. 2011;41:1291–1300.
51. Stauffer V, Case M, Kollack-Walker S, et al. Trajectories of response to treatment with atypical antipsychotic medication in patients with schizophrenia pooled from 6 double-blind, randomized clinical trials. Schizophr Res. 2011;130:11–19.
52. Woods SW. Chlorpromazine equivalent doses for the newer atypical antipsychotics. J Clin Psychiatry. 2003;64:663–667.
53. Hegerl U, Stein M, Mulert C, et al. EEG-vigilance differ-ences between patients with borderline personality disorder, patients with obsessive-compulsive disorder and healthy con-trols. Eur Arch Psychiatry Clin Neurosci. 2008;258:137–143.
54. Muthukumaraswamy SD, Singh KD. Visual gamma oscilla-tions: the effects of stimulus type, visual field coverage and stimulus motion on MEG and EEG recordings. Neuroimage. 2013;69:223–230.
55. Pascual-Marqui RD, Lehmann D, Koukkou M, et al. Assessing interactions in the brain with exact low-resolution electromagnetic tomography. Philos Trans A Math Phys Eng Sci. 2011;369:3768–3784.
56. Brookes MJ, Hale JR, Zumer JM, et al. Measuring functional connectivity using MEG: methodology and comparison with fcMRI. Neuroimage. 2011;56:1082–1104.
57. Brookes MJ, O’Neill GC, Hall EL, et al. Measuring tempo-ral, spectral and spatial changes in electrophysiological brain network connectivity. Neuroimage. 2014;91:282–299.
58. Brookes MJ, Woolrich M, Luckhoo H, et al. Investigating the electrophysiological basis of resting state networks using magnetoencephalography. Proc Natl Acad Sci U S A. 2011;108:16783–16788.
59. Cabral J, Luckhoo H, Woolrich M, et al. Exploring mecha-nisms of spontaneous functional connectivity in MEG: how delayed network interactions lead to structured amplitude envelopes of band-pass filtered oscillations. Neuroimage. 2014;90:423–435.
60. de Pasquale F, Della Penna S, Snyder AZ, et al. Temporal dynamics of spontaneous MEG activity in brain networks. Proc Natl Acad Sci U S A. 2010;107:6040–6045.
61. Hall EL, Robson SE, Morris PG, Brookes MJ. The relation-ship between MEG and fMRI. Neuroimage 2013.
by guest on May 13, 2016
http://schizophreniabulletin.oxfordjournals.org/D
ownloaded from

Page 10 of 10
C. Andreou et al
62. Liu Z, Fukunaga M, de Zwart JA, Duyn JH. Large-scale spontaneous fluctuations and correlations in brain electrical activity observed with magnetoencephalography. Neuroimage. 2010;51:102–111.
63. Luckhoo H, Hale JR, Stokes MG, et al. Inferring task-related networks using independent component analysis in magne-toencephalography. Neuroimage. 2012;62:530–541.
64. Nichols TE, Holmes AP. Nonparametric permutation tests for functional neuroimaging: a primer with examples. Hum Brain Mapp. 2002;15:1–25.
65. Zalesky A, Fornito A, Bullmore ET. Network-based statis-tic: identifying differences in brain networks. Neuroimage. 2010;53:1197–1207.
66. Bullmore ET, Suckling J, Overmeyer S, Rabe-Hesketh S, Taylor E, Brammer MJ. Global, voxel, and cluster tests, by theory and permutation, for a difference between two groups of structural MR images of the brain. IEEE Trans Med Imaging. 1999;18:32–42.
67. van der Gaag M, Hoffman T, Remijsen M, et al. The five-factor model of the Positive and Negative Syndrome Scale II: a ten-fold cross-validation of a revised model. Schizophr Res. 2006;85:280–287.
68. Fornito A, Zalesky A, Pantelis C, Bullmore ET. Schizophrenia, neuroimaging and connectomics. Neuroimage. 2012;62:2296–2314.
69. Perlini C, Bellani M, Brambilla P. Structural imag-ing techniques in schizophrenia. Acta Psychiatr Scand. 2012;126:235–242.
70. Shepherd AM, Laurens KR, Matheson SL, Carr VJ, Green MJ. Systematic meta-review and quality assessment of the structural brain alterations in schizophrenia. Neurosci Biobehav Rev. 2012;36:1342–1356.
71. Hugdahl K, Løberg EM, Nygård M. Left temporal lobe struc-tural and functional abnormality underlying auditory hallu-cinations in schizophrenia. Front Neurosci. 2009;3:34–45.
72. Jardri R, Pouchet A, Pins D, Thomas P. Cortical activa-tions during auditory verbal hallucinations in schizophre-nia: a coordinate-based meta-analysis. Am J Psychiatry. 2011;168:73–81.
73. Goghari VM, Sponheim SR, MacDonald AW 3rd. The functional neuroanatomy of symptom dimensions in schizo-phrenia: a qualitative and quantitative review of a persistent question. Neurosci Biobehav Rev. 2010;34:468–486.
74. Sans-Sansa B, McKenna PJ, Canales-Rodríguez EJ, et al. Association of formal thought disorder in schizophrenia with structural brain abnormalities in language-related corti-cal regions. Schizophr Res. 2013;146:308–313.
75. Strik W, Dierks T, Hubl D, Horn H. Hallucinations, thought disorders, and the language domain in schizophrenia. Clin EEG Neurosci. 2008;39:91–94.
76. Arnal LH, Giraud AL. Cortical oscillations and sensory pre-dictions. Trends Cogn Sci. 2012;16:390–398.
77. Sedley W, Cunningham MO. Do cortical gamma oscillations promote or suppress perception? An under-asked question with an over-assumed answer. Front Hum Neurosci. 2013;7:595.
78. Wang L, Zhu Z, Bastiaansen M. Integration or predictabil-ity? A further specification of the functional role of gamma oscillations in language comprehension. Front Psychol. 2012;3:187.
79. Molinaro N, Barraza P, Carreiras M. Long-range neu-ral synchronization supports fast and efficient reading:
EEG correlates of processing expected words in sentences. Neuroimage. 2013;72:120–132.
80. Maher BA. Delusional thinking and perceptual disorder. J Individ Psychol. 1974;30:98–113.
81. Whitford TJ, Kubicki M, Schneiderman JS, et al. Corpus callosum abnormalities and their association with psychotic symptoms in patients with schizophrenia. Biol Psychiatry. 2010;68:70–77.
82. Winterer G, Egan MF, Rädler T, Hyde T, Coppola R, Weinberger DR. An association between reduced interhemi-spheric EEG coherence in the temporal lobe and genetic risk for schizophrenia. Schizophr Res. 2001;49:129–143.
83. Uhlhaas PJ. Dysconnectivity, large-scale networks and neu-ronal dynamics in schizophrenia. Curr Opin Neurobiol. 2013;23:283–290.
84. Uhlhaas PJ, Singer W. Abnormal neural oscillations and syn-chrony in schizophrenia. Nat Rev Neurosci. 2010;11:100–113.
85. Lui S, Li T, Deng W, et al. Short-term effects of antip-sychotic treatment on cerebral function in drug-naive first-episode schizophrenia revealed by “resting state” func-tional magnetic resonance imaging. Arch Gen Psychiatry. 2010;67:783–792.
86. Anticevic A, Tang Y, Cho YT, et al. Amygdala connectivity differs among chronic, early course, and individuals at risk for developing schizophrenia. Schizophr Bull. 2013.
87. Argyelan M, Ikuta T, DeRosse P, et al. Resting-state FMRI connectivity impairment in schizophrenia and bipolar disor-der. Schizophr Bull. 2014;40:100–110.
88. Chen YL, Tu PC, Lee YC, Chen YS, Li CT, Su TP. Resting-state fMRI mapping of cerebellar functional dysconnections involving multiple large-scale networks in patients with schiz-ophrenia. Schizophr Res. 2013;149:26–34.
89. Khadka S, Meda SA, Stevens MC, et al. Is aberrant func-tional connectivity a psychosis endophenotype? A resting state functional magnetic resonance imaging study. Biol Psychiatry. 2013;74:458–466.
90. Klingner CM, Langbein K, Dietzek M, et al. Thalamocortical connectivity during resting state in schizophrenia. Eur Arch Psychiatry Clin Neurosci. 2013.
91. Liu H, Tang Y, Womer F, et al. Differentiating patterns of amygdala-frontal functional connectivity in schizophrenia and bipolar disorder. Schizophr Bull. 2013.
92. Yu Y, Shen H, Zeng LL, Ma Q, Hu D. Convergent and diver-gent functional connectivity patterns in schizophrenia and depression. PLoS One. 2013;8:e68250.
93. Hinkley LB, Vinogradov S, Guggisberg AG, Fisher M, Findlay AM, Nagarajan SS. Clinical symptoms and alpha band resting-state functional connectivity imaging in patients with schizophrenia: implications for novel approaches to treatment. Biol Psychiatry. 2011;70:1134–1142.
94. Kam JW, Bolbecker AR, O’Donnell BF, Hetrick WP, Brenner CA. Resting state EEG power and coherence abnormali-ties in bipolar disorder and schizophrenia. J Psychiatr Res. 2013;47:1893–1901.
95. Wulff P, Ponomarenko AA, Bartos M, et al. Hippocampal theta rhythm and its coupling with gamma oscillations require fast inhibition onto parvalbumin-positive interneu-rons. Proc Natl Acad Sci U S A. 2009;106:3561–3566.
96. Lisman J, Buzsáki G. A neural coding scheme formed by the combined function of gamma and theta oscillations. Schizophr Bull. 2008;34:974–980.
by guest on May 13, 2016
http://schizophreniabulletin.oxfordjournals.org/D
ownloaded from