Machine learning classification of resting state functional connectivity predicts smoking status
10
ORIGINAL RESEARCH ARTICLE published: 16 June 2014 doi: 10.3389/fnhum.2014.00425 Machine learning classification of resting state functional connectivity predicts smoking status Vani Pariyadath*, Elliot A. Stein and Thomas J. Ross Neuroimaging Research Branch, Intramural Research Program, National Institute on Drug Abuse, National Institutes of Health, Baltimore, MD, USA Edited by: Shuhei Yamaguchi, Shimane University, Japan Reviewed by: Vince D. Calhoun, University of New Mexico, USA Keiichi Onoda, Shimane University, Japan *Correspondence: Vani Pariyadath, Neuroimaging Research Branch, Intramural Research Program, National Institute on Drug Abuse, National Institutes of Health, 251 Bayview Blvd., Suite 200, Rm. 07A505.08, Baltimore, MD 21224, USA e-mail: [email protected] Machine learning-based approaches are now able to examine functional magnetic resonance imaging data in a multivariate manner and extract features predictive of group membership. We applied support vector machine (SVM)-based classification to resting state functional connectivity (rsFC) data from nicotine-dependent smokers and healthy controls to identify brain-based features predictive of nicotine dependence. By employing a network-centered approach, we observed that within-network functional connectivity measures offered maximal information for predicting smoking status, as opposed to between-network connectivity, or the representativeness of each individual node with respect to its parent network. Further, our analysis suggests that connectivity measures within the executive control and frontoparietal networks are particularly informative in predicting smoking status. Our findings suggest that machine learning-based approaches to classifying rsFC data offer a valuable alternative technique to understanding large-scale differences in addiction-related neurobiology. Keywords: biomarkers, fMRI, machine learning, nicotine addiction, support vector machines INTRODUCTION Conventional univariate methods of fMRI analysis have been used to identify differences in neural processing between vari- ous diseased populations and healthy controls over a plethora of tasks. However, not all such group differences are guaranteed to be predictive; there may be significant overlap between the two group distributions of the pertinent metric. Further, traditional univariate approaches to fMRI analysis by definition overlook multivariate patterns in the data. Machine learning offers a variety of tools to address the above limitations. Support vector machine (SVM)-based algorithms (Vapnik, 2000), for example, have been used successfully to identify neural patterns of activation (Haxby, 2012) as well as for group-level differences (Craddock et al., 2009). Attempts to apply machine learning-based approaches to clas- sify individuals based on various disease states has gained sig- nificant traction for screening and diagnosis (Vemuri et al., 2008; Stonnington et al., 2010), and monitoring disease trajec- tory (Hobbs et al., 2010). Applications of machine learning to this end include classification of schizophrenia from task activation maps (Demirci et al., 2008), using structural images to classify individuals as addicted or not (Zhang et al., 2005), and using task activation maps to classify schizophrenia, Alzheimer’s, and mild traumatic brain injury (Ford et al., 2003). Depending on the specific method involved, and the neurobiological disease in ques- tion, such attempts have been met with moderate to high success, i.e., ranging from 60 to 100% classification accuracy (Orrù et al., 2012). Addiction in particular stands to benefit from the applica- tion of machine learning-based approaches. Multiple gene × environment interactions go into determining susceptibility to addiction at various stages—initiation of drug use, transition to repeated drug use and then on to compulsive use (Kreek et al., 2005). Aside from this, the drug of abuse itself interacts with neural systems to modulate drug-related circuitry and resulting cognition (Volkow et al., 2009). Not surprisingly, multiple brain networks have been implicated in this complex disease, and, to date, very few neural biomarkers have been identified for predict- ing vulnerability to addiction and treatment outcome (Pariyadath et al., 2013). Importantly, with rare exceptions (Zhang et al., 2005), the search for such biomarkers through neuroimaging has thus far been restricted to univariate approaches. Through a mul- tivariate approach, we can begin to identify complex interactions within and between brain networks, and some day explore par- allel contributions from genetic and environmental sources to neural function. When comparing groups, differences in task performance can sometimes confound the interpretation of differences in neural activation patterns. Of late, resting state functional connectiv- ity (rsFC) analysis has proven immensely valuable for extract- ing differences in neural function in the absence of an explicit task. Functional connectivity analyses indicate that there are sig- nificant differences in neural architecture and functioning in substance dependent individuals (Sutherland et al., 2012). This analysis approach has been combined with machine learning tools to extract a neural metric for maturity (Dosenbach et al., 2010) within a healthy cohort. Of relevance here, SVM-based approaches have been shown to be successful in classifying major depressive disorder (Craddock et al., 2009) and schizophrenia (Shen et al., 2010) from rsFC data. To date, however, rsFC data has not been explored using machine learning in addicted individuals. Frontiers in Human Neuroscience www.frontiersin.org June 2014 | Volume 8 | Article 425 | 1 HUMAN NEUROSCIENCE
-
Upload
independent -
Category
Documents
-
view
3 -
download
0
Transcript of Machine learning classification of resting state functional connectivity predicts smoking status
ORIGINAL RESEARCH ARTICLEpublished: 16 June 2014
doi: 10.3389/fnhum.2014.00425
Machine learning classification of resting state functionalconnectivity predicts smoking statusVani Pariyadath*, Elliot A. Stein and Thomas J. Ross
Neuroimaging Research Branch, Intramural Research Program, National Institute on Drug Abuse, National Institutes of Health, Baltimore, MD, USA
Edited by:
Shuhei Yamaguchi, ShimaneUniversity, Japan
Reviewed by:
Vince D. Calhoun, University of NewMexico, USAKeiichi Onoda, Shimane University,Japan
*Correspondence:
Vani Pariyadath, NeuroimagingResearch Branch, IntramuralResearch Program, National Instituteon Drug Abuse, National Institutesof Health, 251 Bayview Blvd., Suite200, Rm. 07A505.08, Baltimore,MD 21224, USAe-mail: [email protected]
Machine learning-based approaches are now able to examine functional magneticresonance imaging data in a multivariate manner and extract features predictive of groupmembership. We applied support vector machine (SVM)-based classification to restingstate functional connectivity (rsFC) data from nicotine-dependent smokers and healthycontrols to identify brain-based features predictive of nicotine dependence. By employinga network-centered approach, we observed that within-network functional connectivitymeasures offered maximal information for predicting smoking status, as opposed tobetween-network connectivity, or the representativeness of each individual node withrespect to its parent network. Further, our analysis suggests that connectivity measureswithin the executive control and frontoparietal networks are particularly informative inpredicting smoking status. Our findings suggest that machine learning-based approachesto classifying rsFC data offer a valuable alternative technique to understanding large-scaledifferences in addiction-related neurobiology.
Keywords: biomarkers, fMRI, machine learning, nicotine addiction, support vector machines
INTRODUCTIONConventional univariate methods of fMRI analysis have beenused to identify differences in neural processing between vari-ous diseased populations and healthy controls over a plethora oftasks. However, not all such group differences are guaranteed tobe predictive; there may be significant overlap between the twogroup distributions of the pertinent metric. Further, traditionalunivariate approaches to fMRI analysis by definition overlookmultivariate patterns in the data. Machine learning offers a varietyof tools to address the above limitations. Support vector machine(SVM)-based algorithms (Vapnik, 2000), for example, have beenused successfully to identify neural patterns of activation (Haxby,2012) as well as for group-level differences (Craddock et al.,2009).
Attempts to apply machine learning-based approaches to clas-sify individuals based on various disease states has gained sig-nificant traction for screening and diagnosis (Vemuri et al.,2008; Stonnington et al., 2010), and monitoring disease trajec-tory (Hobbs et al., 2010). Applications of machine learning to thisend include classification of schizophrenia from task activationmaps (Demirci et al., 2008), using structural images to classifyindividuals as addicted or not (Zhang et al., 2005), and usingtask activation maps to classify schizophrenia, Alzheimer’s, andmild traumatic brain injury (Ford et al., 2003). Depending on thespecific method involved, and the neurobiological disease in ques-tion, such attempts have been met with moderate to high success,i.e., ranging from 60 to 100% classification accuracy (Orrù et al.,2012).
Addiction in particular stands to benefit from the applica-tion of machine learning-based approaches. Multiple gene ×environment interactions go into determining susceptibility to
addiction at various stages—initiation of drug use, transition torepeated drug use and then on to compulsive use (Kreek et al.,2005). Aside from this, the drug of abuse itself interacts withneural systems to modulate drug-related circuitry and resultingcognition (Volkow et al., 2009). Not surprisingly, multiple brainnetworks have been implicated in this complex disease, and, todate, very few neural biomarkers have been identified for predict-ing vulnerability to addiction and treatment outcome (Pariyadathet al., 2013). Importantly, with rare exceptions (Zhang et al.,2005), the search for such biomarkers through neuroimaging hasthus far been restricted to univariate approaches. Through a mul-tivariate approach, we can begin to identify complex interactionswithin and between brain networks, and some day explore par-allel contributions from genetic and environmental sources toneural function.
When comparing groups, differences in task performance cansometimes confound the interpretation of differences in neuralactivation patterns. Of late, resting state functional connectiv-ity (rsFC) analysis has proven immensely valuable for extract-ing differences in neural function in the absence of an explicittask. Functional connectivity analyses indicate that there are sig-nificant differences in neural architecture and functioning insubstance dependent individuals (Sutherland et al., 2012). Thisanalysis approach has been combined with machine learningtools to extract a neural metric for maturity (Dosenbach et al.,2010) within a healthy cohort. Of relevance here, SVM-basedapproaches have been shown to be successful in classifying majordepressive disorder (Craddock et al., 2009) and schizophrenia(Shen et al., 2010) from rsFC data. To date, however, rsFCdata has not been explored using machine learning in addictedindividuals.
Frontiers in Human Neuroscience www.frontiersin.org June 2014 | Volume 8 | Article 425 | 1
HUMAN NEUROSCIENCE

Pariyadath et al. SVM classification predicts smoking status
In this study, we sought to identify neural features that mayexplain addiction in a multivariate fashion—those that speak toaddiction when examined in tandem as opposed to in isolation—and that are predictive of the addicted state. To this end, weapplied a linear SVM-based method to rsFC data from nicotine-dependent individuals and controls. Linear SVM algorithms havebeen shown to be an effective approach for large-dimensionalproblems, especially those where the number of features exceedsthe number of samples (Hsu et al., 2003). We employed anetwork-centered approach, capitalizing on a previous attemptat reducing neural activity to resting state networks (Smithet al., 2009). Recent research suggests that cognition, and psy-chopathologies thereof, may be better understood as involvingdistributed brain areas that function as part of large-scale net-works, as opposed to a single, focal brain region (Bressler andMenon, 2010). Other complex diseases, such as Alzheimer’s,major depression, schizophrenia, and autism have benefited fromparcellating the brain in terms of large-scale functional networks(Bressler and Menon, 2010). Further, this approach permit-ted us to explore differences in functional connectivity withoutconstraint only to regions that have previously been identifiedthrough univariate approaches to be relevant to addiction. Wecompare three different network-centered measures to assessthe—(1) the extent to which each node within a network is rep-resentative of the parent network, (2) functional connectivitybetween different nodes within a network, and (3) functionalconnectivity between different networks.
MATERIALS AND METHODSPARTICIPANTSParticipants included 21 smokers (9 female) and 21 non-smoking controls (11 female), whose details are shown inTable 1. All smokers scored at least 6 on the Fagerstrom Testfor Nicotine Dependence (FTND). Individuals with a history ofpre-morbid neurological disease, major medical, or axis I psy-chiatric diagnosis other than substance use disorder, assessed bythe computer-administered Structured Clinical Interview (SCID)for the Diagnostic and Statistical Manual of Mental Disorders IV
Table 1 | Demographic characteristics of study population.
Smokers Controls P-value
Number 21 21
Age (mean ± SD) 38.19 ± 9.79 39.90 ± 10.82 0.60a
Gender
Male 12 10 0.38b
Female 9 11
Race/Ethnicity
White 11 7 0.33b
Black 8 12
Hispanic 1 1
Unknown 1 1
FTND 6.86 ± 1.04 –
aP-values were obtained by a two-sample two-tailed t-test.bP-values were obtained by a two-tailed chi-squared test.
(DSM-IV) screening version and clinician interview, or who hadcurrent substance dependence other than nicotine or cannabis,based on DSM IV criteria, were excluded from the study. Smokerswere allowed to smoke ad libitum prior to the scan session.Participants gave written informed consent to this study approvedby the Institutional Review Board at the National Institute onDrug Abuse-Intramural Research Program.
fMRI ACQUISITION AND PRE-PROCESSINGDuring resting state scans, participants were instructed to rest andkeep their eyes open but not to think about anything in particular.Functional MRI data were collected on a 3-T Siemens Allegra MRscanner (Siemens, Erlangen, Germany) equipped with a quadra-ture volume head coil. Thirty-nine slices were acquired positionedat 30◦ to the AC-PC line and were prescribed to cover the wholebrain. The data were acquired using a single-shot gradient-echoecho-planar imaging (EPI) sequence with repetition time (TR)of 2 s, echo time (TE) of 27 ms, flip angle (FA) of 78◦, fieldof view (FOV) of 220 × 220 mm, and an in-plane resolutionof 3.44 × 3.44 mm with thickness 3.5 mm. For registration pur-pose, high-resolution anatomical images were acquired using a3D magnetization prepared rapid gradient-echo (MPRAGE) T1-weighted sequence with TR of 2.5 s, TE of 4.38 ms, FA of 7◦, anda voxel size of 1 × 1 × 1 mm.
Data processing and analyses were conducted in AFNI (Cox,1996). Preprocessing included slice-timing and motion correc-tion. Data were inspected for motion using censor.py (http://brainimaging.waisman.wisc.edu/∼perlman/code/censor.py), em-ploying a censoring threshold of 0.3 mm for translation and0.3◦ for rotation between consecutive TRs. Data were thenspatially normalized to the standard Talairach space. Spatialsmoothing to a 6 mm FWHM Gaussian kernel was performedto increase spatial signal to noise ratio. Global fluctuations,originating presumably from such systemic effects as respirationand cardiac-induced pulsations, were accounted for individuallyby orthogonalizing the time-courses with respect to the first threeprincipal components from the white matter voxel time courseensemble and the first three principal components from the timecourse ensemble of the cerebrospinal fluid (CSF) voxels (Behzadiet al., 2007). In addition to these physiological regressors, par-ticipants’ time courses were also orthogonalized with respect tothe six motion parameters. Time courses were band-pass filtered(0.01–0.15 Hz) to retain only the low frequency componentsin the signal. Although it is common to use a more narrowfrequency band (e.g., cutoff frequency = 0.08 Hz), many studiesdo employ a higher cutoff frequency, such as 0.15 Hz, and in somersFC analysis methods, a broader frequency band might evenbe preferable (Wu et al., 2008; Braun et al., 2012). We thereforechose to employ a broad frequency range for our network-basedanalysis. To address any concerns that findings here may bedriven by physiological noise (stemming from the use of thisfrequency range), we tested the classifier after band-pass filteringthe signal with a lower cutoff frequency (0.1 Hz). We did notobserve any significant difference in classifier performance.
Recently, there has been some concern regarding motion-related artifacts in rsFC computation, specifically manifesting asdecreases in estimated long-distance connectivity as a result of
Frontiers in Human Neuroscience www.frontiersin.org June 2014 | Volume 8 | Article 425 | 2
Pariyadath et al. SVM classification predicts smoking status
increased head motion (Power et al., 2012). To ensure that ourresults were not artifacts induced by head motion, we were carefulto remove volumes with head motion above a stringent thresh-old during the pre-processing stage (0.3 mm for translation and0.3◦ for rotation between consecutive TRs), and time courses wereorthogonalized with respect to the participant’s motion parame-ters. Additionally, we computed the root mean squared (RMS)head position change or for smokers and controls, and also thefinal number of volumes that were included in the computationof correlation coefficients.
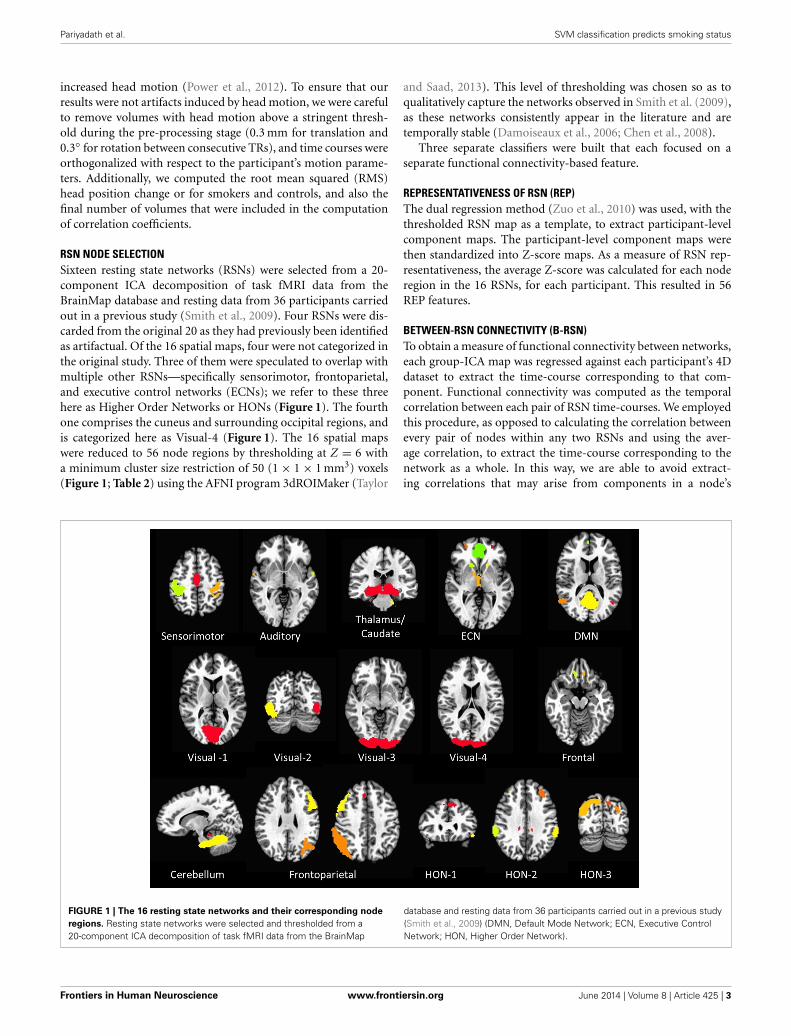
RSN NODE SELECTIONSixteen resting state networks (RSNs) were selected from a 20-component ICA decomposition of task fMRI data from theBrainMap database and resting data from 36 participants carriedout in a previous study (Smith et al., 2009). Four RSNs were dis-carded from the original 20 as they had previously been identifiedas artifactual. Of the 16 spatial maps, four were not categorized inthe original study. Three of them were speculated to overlap withmultiple other RSNs—specifically sensorimotor, frontoparietal,and executive control networks (ECNs); we refer to these threehere as Higher Order Networks or HONs (Figure 1). The fourthone comprises the cuneus and surrounding occipital regions, andis categorized here as Visual-4 (Figure 1). The 16 spatial mapswere reduced to 56 node regions by thresholding at Z = 6 witha minimum cluster size restriction of 50 (1 × 1 × 1 mm3) voxels(Figure 1; Table 2) using the AFNI program 3dROIMaker (Taylor
and Saad, 2013). This level of thresholding was chosen so as toqualitatively capture the networks observed in Smith et al. (2009),as these networks consistently appear in the literature and aretemporally stable (Damoiseaux et al., 2006; Chen et al., 2008).
Three separate classifiers were built that each focused on aseparate functional connectivity-based feature.
REPRESENTATIVENESS OF RSN (REP)The dual regression method (Zuo et al., 2010) was used, with thethresholded RSN map as a template, to extract participant-levelcomponent maps. The participant-level component maps werethen standardized into Z-score maps. As a measure of RSN rep-resentativeness, the average Z-score was calculated for each noderegion in the 16 RSNs, for each participant. This resulted in 56REP features.
BETWEEN-RSN CONNECTIVITY (B-RSN)To obtain a measure of functional connectivity between networks,each group-ICA map was regressed against each participant’s 4Ddataset to extract the time-course corresponding to that com-ponent. Functional connectivity was computed as the temporalcorrelation between each pair of RSN time-courses. We employedthis procedure, as opposed to calculating the correlation betweenevery pair of nodes within any two RSNs and using the aver-age correlation, to extract the time-course corresponding to thenetwork as a whole. In this way, we are able to avoid extract-ing correlations that may arise from components in a node’s
FIGURE 1 | The 16 resting state networks and their corresponding node
regions. Resting state networks were selected and thresholded from a20-component ICA decomposition of task fMRI data from the BrainMap
database and resting data from 36 participants carried out in a previous study(Smith et al., 2009) (DMN, Default Mode Network; ECN, Executive ControlNetwork; HON, Higher Order Network).
Frontiers in Human Neuroscience www.frontiersin.org June 2014 | Volume 8 | Article 425 | 3

Pariyadath et al. SVM classification predicts smoking status
Table 2 | The 16 RSNs and their corresponding node regions.
Node # RSN X Y Z Volume
(# of voxels)
SENSORIMOTOR
1 Right postcentral gyrus 41 −27 44.0 73122 Bilateral paracentral gyrus 1.5 −13.9 43.5 40163 Left postcentral gyrus −38.6 −28.2 44.3 3752AUDITORY
4 Left superior temporal gyrus −56.3 −2.3 −0.3 1445 Right superior temporal gyrus 59.7 −3.4 −0.2 1206 Left superior temporal gyrus −60.8 −23.2 10.6 72THALAMUS/CAUDATE
7 Thalamus/Caudate 3.4 −24.9 −8.4 29,5528 Left culmen −15.7 −26.3 −29.3 208EXECUTIVE CONTROL NETWORK
9 Right anterior cingulate 1.7 33.3 13.3 1892010 Left superior frontal gyrus −26.4 44 19.2 596011 Right middle frontal gyrus 30.1 45.6 18.6 469612 Right caudate 15.4 16.3 0.8 72813 Left caudate −14.6 16 0.9 38414 Bilateral thalamus 3.9 −11.4 4.3 1888DEFAULT MODE NETWORK
15 Bilateral posterior cingulate 1.2 −57 21.6 2537616 Left middle temporal gyrus −44.2 −64.7 24.6 343217 Right superior temporal gyrus 51.4 −59.1 19.7 247218 Bilateral anterior cingulate 2 50.7 −0.9 1984VISUAL-1
19 Bilateral lingual gyrus 2.1 −74.5 4.1 45072VISUAL-2
20 Right inferior occipital gyrus 42.4 −70.5 −3.1 10,78521 Left inferior occipital gyrus −39.2 −76.3 −2.5 5685VISUAL-3
22 Bilateral lingual gyrus 2.4 −88.8 −7.8 25,952VISUAL-4
23 Bilateral cuneus 4.5 −88.3 22.4 12,208FRONTAL
24 Left medial frontal gyrus −10.9 26.3 −12.0 33725 Right medial frontal gyrus 20.3 32.1 −13.5 51926 Left middle frontal gyrus −24.9 34.7 −14.1 73CEREBELLUM
27 Bilateral cerebellartonsil/Culmen
2.4 −45.5 −28.2 34,938
28 Right culmen 10.5 −36.1 −16.1 160FRONTOPARIETAL (L)
29 Left angular gyrus −39.7 −57.7 37.1 17,12830 Left middle frontal gyrus −42.3 25.7 22.0 13,34831 Left middle temporal gyrus −58.2 −49.8 −9.5 57732 Left cingulate gyrus −4 22.8 37.3 152FRONTOPARIETAL (R)
33 Right supramarginal gyrus 51.8 −51.2 34.4 18,75834 Right middle frontal gyrus 46.1 23.8 27.6 10,30935 Right middle temporal gyrus 67 −40.8 −3.7 36536 Right medial frontal gyrus 6.6 29.9 36.2 264HIGHER ORDER NETWORK-1
37 Bilateral medial frontal gyrus −2.2 38.6 34.5 955638 Left inferior frontal gyrus −45.9 24.9 −9.1 266
(Continued)
Table 2 | Continued
Node # RSN X Y Z Volume
(# of voxels)
HIGHER ORDER NETWORK-2
39 Left precuneus 0.4 −56.5 48.1 19,10440 Right inferior parietal lobule 60.3 −34.5 26.0 448041 Left inferior parietal lobule −57.8 −37.2 27.1 331242 Left middle frontal gyrus −30.2 35.8 29.5 146443 Right middle temporal gyrus 58.2 −58.4 1.4 54244 Right middle frontal gyrus 32.8 42.4 25.0 44845 Left inferior temporal gyrus −53.2 −66 −0.4 16346 Left middle occipital gyrus −38.2 −82.7 20.8 8847 Left cingulate gyrus −10.8 −32.5 31.9 8848 Right middle temporal gyrus 48.9 −72.7 14.4 72HIGHER ORDER NETWORK-3
49 Right precuneus 32.6 −70.2 33.3 833650 Left superior occipital gyrus −29.8 −78.9 26.3 273651 Right posterior cingulate 15.4 −55.9 7.7 204852 Right middle frontal gyrus 28.8 8.3 47.5 36853 Left precuneus −9.2 −72.6 39.3 20854 Left lingual gyrus −10.7 −58 5.1 12055 Right culmen 25.3 −38.3 −16.1 8056 Left posterior cingulate −15.9 −62.5 11.3 72
time-course that do not correspond to its parent network. Thisprocedure resulted in 120 B-RSN features.
WITHIN-RSN CONNECTIVITY (W-RSN)To compute functional connectivity within an RSN, referencetime courses from each of the node regions within a networkwere generated by averaging the time courses of all voxels withinthe region. Subsequently, correlation coefficients were computedbetween each pair of node time-courses within each RSN. As wewanted to analyze node pair connectivity merely in the contextof a given RSN, only pairs of nodes within the same network wereanalyzed. Two RSNs contained only a single node each (Visual-1 and Visual-3), and were therefore excluded from this classifier.This resulted in 119 correlation W-RSN features.
SUPPORT VECTOR MACHINE (SVM) CLASSIFIERSVM training and testing were carried out using the Scikit-learnpackage in Python (Pedregosa et al., 2011), which is an implemen-tation of the LIBSVM package (Chang and Lin, 2011). A linearSVM was employed in all models (with soft margin parameterC = 1). Classification performance was tested using leave-one-out cross-validation (LOOCV). On each run, training data wasfirst scaled, and the corresponding scaling transformation wasrepeated on the test dataset. Feature selection was carried outprior to classifier-training through recursive feature elimination(Guyon et al., 2002) with either 0, 50, or 90% feature elimination;this provided a comparison of performance with no, medium,and high degree of feature elimination. Features deemed criti-cal by this method were carried forward to the classifier-trainingstage (Figure 2). Without feature elimination, even with supe-rior classification performance, it would be impossible to makeany meaningful inferences about the underlying neurobiology
Frontiers in Human Neuroscience www.frontiersin.org June 2014 | Volume 8 | Article 425 | 4

Pariyadath et al. SVM classification predicts smoking status
FIGURE 2 | Classification algorithm for predicting smoking status using SVM-Adaboost.
owing to the large number of features involved. Narrowing theset of features to 10% of the original set permits a more detailedunderstanding of the key circuits involved.
AdaBoostThe linear SVM classifier was supplemented by a boostingalgorithm—AdaBoost (Freund and Schapire, 1995). This algo-rithm involves an iterative process of training the SVM classifieron a weighted set of samples, where the weights are determinedby the accuracy of the classifier for those samples on the previousiteration. The final classification is obtained through a linear com-bination of individual classifiers, where the classification of eachSVM classifier is weighted by its performance accuracy. In thismanner, AdaBoost builds a non-linear classifier ensemble from aweighted combination of multiple linear SVM classifiers.
CLASSIFICATION PERFORMANCETo ascertain the performance of a classifier, we calculated accuracyand precision, defined as below:
Accuracy = (number of true positives
+ number of true negatives)/(number of all samples)
Precision = (number of true positives)/
(number of true positive + number of true negatives)
To test whether classification performance was significantly abovechance, we randomly classified each participant as a smoker ornon-smoker, and trained and tested each classifier on this dataset.This process was executed 1000 times to obtain random distri-butions of accuracy and precision. Z-tests were then performed
between the actual accuracy/precision values and the gener-ated random distributions to determine statistical significance.Additionally, we tested whether actual accuracy and precisionscores were 2 standard deviations above the mean of the generatedrandom distribution.
To identify features maximally contributing to improvedclassification performance with the within-RSN classifier, weextracted features that were utilized in the classifier following 90%feature elimination on 15 or more runs of LOOCV. Each featurehad a chance of 1/119 of appearing in the critical 12 on each run.Features that showed up in 15 or more runs of LOOCV weretherefore appearing far more frequently than would be predictedby chance (p < 0.000007).
RESULTSSmokers and controls did not differ statistically in age, gender, orethnicity (Table 1), reducing the probability that the classifier’sperformance was biased by demographic features irrelevant tonicotine addiction. After applying the SVM-AdaBoost algorithmto 21 smokers and 21 controls, accuracy and precision were calcu-lated for the REP, between-RSN, and within-RSN classifiers withand without feature elimination.
Based on the above metrics, we concluded that the within-RSN and REP classifiers can reliably be used to classify smokersfrom non-smokers (Table 3). On the other hand, the between-RSN classifier’s performance was not consistently above chance.This suggests that there is limited predictive information for nico-tine addiction in the functional connectivity between RSNs, atleast based on the current method of defining network nodes.
As can be observed from Table 3, classification performancesignificantly improved with feature elimination for the within-RSN classifier. To identify the features maximally contributing to
Frontiers in Human Neuroscience www.frontiersin.org June 2014 | Volume 8 | Article 425 | 5

Pariyadath et al. SVM classification predicts smoking status
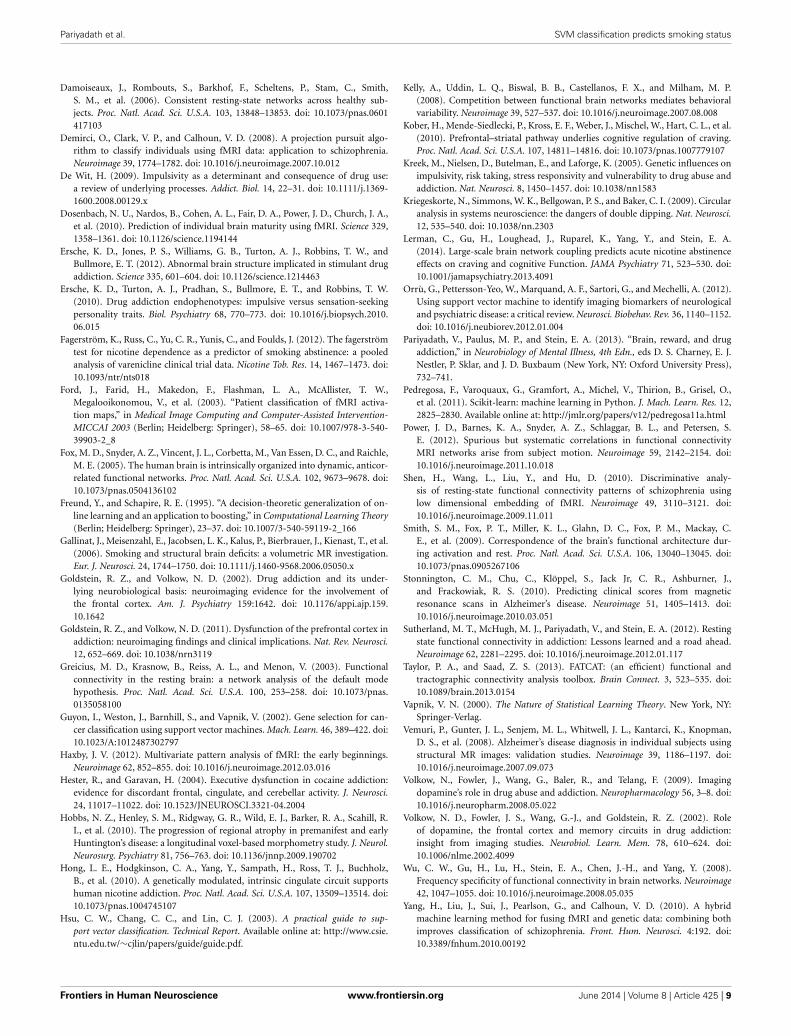
this improved classification performance, we extracted the fea-tures that were utilized in the classifier following 90% featureelimination on 15 or more runs of LOOCV (Figure 3). Thisprocess revealed that connectivity within HON-3 (6 circuits),HON-2 (4 circuits), executive control (2 circuits), and frontopari-etal (1 circuit) networks specifically were predictive of smoking
status. These circuits involved parts of the middle and supe-rior frontal gyri, posterior cingulate cortex, precuneus, middletemporal gyri, and inferior parietal gyri.
To confirm that our results were not artifacts induced by headmotion, we computed the RMS displacement change for smok-ers and controls and verified that the two groups did not differ
Table 3 | Performance (accuracy and precision) of the three SVM-AdaBoost Classifiers.
No feature elimination 50% feature elimination 90% feature elimination
Between-RSN NF† = 120 60 12
Accuracy Precision Accuracy Precision Accuracy Precision
52.4%* 52.6%* 47.6% 47.6% 40.5% 38.9%
Within-RSN 119 60 12
61.9%* 61.9%* 71.4%*‡ 71.4%*‡ 78.6%*‡ 83.3%*‡
REP 56 28 6
76.2%*‡ 73.9%*‡ 73.8%*‡ 70.8%*‡ 61.9%* 60.8%*
Best performance for a classifier is highlighted in gray.†NF, number of features.*indicates classification performance was significantly above chance (p < 0.0001).‡indicates classification performance was over 2 standard deviations above chance.
FIGURE 3 | Features maximally contributing to SVM classification
performance. Features that were utilized in the within-RSN classifierfollowing 90% feature elimination on 15 or more runs of LOOCV wereidentified, and these consisted of circuits within the (A) ECN, (B) FP, (C)
HON-2, and (D) HON-3. Red and blue lines indicate circuits in which
connectivity was greater and lower, respectively, in smokers relative tocontrols. Thick lines indicate circuits that were individually statisticallydifferent between smokers and controls, as inferred from t-tests. Inset brainsindicate the orientation of the larger configuration (ECN, Executive ControlNetwork; FP, Frontoparietal Network; HON, Higher Order Network).
Frontiers in Human Neuroscience www.frontiersin.org June 2014 | Volume 8 | Article 425 | 6

Pariyadath et al. SVM classification predicts smoking status
statistically on this measure for translational [t(40) = −0.58;p = 0.564] or rotational [t(40) = 0.86; p = 0.394] head motion.Further, the two groups did not differ statistically in the finalnumber of volumes that were included in the computation of cor-relation co-efficients [t(40) = −1.97; p = 0.056. Meansmokers =173.67 ± 9.67; Meannon-smokers = 178.19 ± 3.43].
DISCUSSIONWe employed a machine learning-based approach to identifyfunctional connectivity measures that are predictive of nicotinedependence. A comparison of three network-centered functionalconnectivity measures revealed that the functional connectivitybetween nodes within resting state networks is most informativein predicting nicotine dependence. Classification based on func-tional connectivity between these networks, on the other hand,resulted in performance accuracy not consistently above chancelevels. It should be noted, however, that classification perfor-mance of the within-network classifier improved when many fea-tures were eliminated; this suggests that specific within-networkcircuits, or a combination thereof, warrant further investiga-tion in the context of nicotine addiction. We are not imply-ing that within-network connectivity in general would be moreinformative about the disease.
The REP assessments were comparably successful in predict-ing smoking status vis-à-vis the within-RSN classifier. However,a similar examination of the critical nodes is difficult as classi-fication performance did not improve with feature elimination,suggesting that all 56 nodes (Figure 1; Table 2) need to be con-sidered when predicting smoking status. As the REP measureindicates the extent to which a specific node behaves like thenetwork in general, strong classification performance here mightreflect differences in within-network connectivity in smokers.
On further examination of the within-network connectivityclassifier, we found that HON RSNs, including the frontopari-etal and ECNs, were critical to the classification process. Withinthese networks, functional connectivity of the middle/inferiorfrontal gyrus, posterior cingulate cortex, and precuneus wereespecially informative regarding nicotine dependence, i.e., wereutilized in the classification processes following 90% feature elim-ination on 15 or more runs of LOOCV. That predictive featureswere observed in frontal regions is not surprising. Multiple linesof research suggest impairments in this area as being criticalto addiction (Goldstein and Volkow, 2002; Volkow et al., 2002;Hester and Garavan, 2004; Kober et al., 2010). The differencesobserved here may reflect impairments in frontal disinhibition, adeficit thought to be critical to the disease (Goldstein and Volkow,2011).
Network-centered approaches have identified several largescale networks whose functional connectivity patterns at reststrongly correspond with network activity during various cogni-tive processes (Smith et al., 2009). Of these, two sets of networkshave been implicated in task performance—task-positive net-works which are engaged during task performance, such as theECN, and the task-negative “default mode network” (DMN).The DMN decreases in activity during task performance relativeto its baseline at rest (Greicius et al., 2003). These task-positiveand task-negative networks exhibit an anti-correlated relationship
(Fox et al., 2005). Importantly, the degree to which activitybetween these networks is anti-correlated predicts variability inperformance on cognitive tasks (Kelly et al., 2008), suggestingthat the integrity of this between-network coordination is criti-cal to efficient cognitive function. Our data suggests a breakdownof normal connectivity patterns within the ECN and DMN RSNs.This difference in functional connectivity could have two impor-tant implications: (1) it could influence the manner in which eachnetwork responds to a cognitive task or pharmacological manip-ulation (e.g., Cole et al., 2010), and consequently the observedinteraction between the two networks; (2) similarly the within-network connectivity differences could affect ECN-DMN home-ostasis under high-craving states. In support of such a possibility,DMN-ECN connectivity is weakened during smoking abstinence(Lerman et al., 2014). In other words, although the differencesobserved here are within a network, under various manipulations,they could manifest as between-network effects. (It is tempting toinfer that the PCC-related circuits that showed up frequently ascritical features speak to a DMN involvement along exactly theselines. However, in our hands, the DMN RSN itself does not appearto be a key player in the classification process, and the PCC-related circuits observed here were located in other higher orderRSNs.) Here, the data were from smokers who were allowed tosmoke ad libitum and were thus unlikely to be experiencing with-drawal. To address whether the connectivity disruptions reflectfrontal disinhibition problems or DMN-ECN antagonism differ-ences, classification performance needs to be compared betweenabstinent and sated smokers. Frontal disinhibition problems areseen to predate addiction (De Wit, 2009; Ersche et al., 2010, 2012),and are exacerbated by chronic drug use (Volkow et al., 2009),but are unlikely to be affected by acute effects of nicotine (Bekkeret al., 2005). Thus, middle/inferior frontal circuits should stillprovide important information for classification in both satedand abstinent states. On the other hand, DMN-ECN dynamicsshould be markedly different in the two states, and thus func-tional connectivity within the ECN in one state should not beparticularly informative to the other.
It is important to note that some of the features critical to theclassification performance may be changes induced by chronicnicotine consumption, while others are likely pre-existent. Partsof the middle frontal gyrus, for example, have been shown todecrease in gray matter volume as a function of lifetime exposureto cigarette smoke (Brody et al., 2004; and is suggested in Gallinatet al., 2006). Importantly, classification performance in this studywas guided by a combination of different neural features, and notdriven by any one feature in particular. In support of this asser-tion, within-network classification dropped in performance whenthe number of features was limited to 1 (accuracy = 57.14%,precision = 56.0%). Nicotine addiction is likely an interactionof pre-existing vulnerabilities and nicotine-induced impairments;while machine learning allows us to uncover such interactions,future work will need to disentangle individual contributionsfrom both these sources.
Classification performance here was not as high as has some-times been reported from rsFC data (see Dosenbach et al., 2010,for example, in which the authors achieved classification accu-racy over 90% when classifying individuals as either children or
Frontiers in Human Neuroscience www.frontiersin.org June 2014 | Volume 8 | Article 425 | 7

Pariyadath et al. SVM classification predicts smoking status
adults); there may be a couple of reasons for this. Firstly, greatcare was taken here to eliminate head motion-induced artifactsthat have previously been shown to influence functional connec-tivity estimates (Power et al., 2012). Efforts included removal oftime points where head motion was above a stringent thresh-old, inclusion of head motion parameters as nuisance regressors,and a comparison of head motion data between the two groups.By diminishing head motion-related confounds, we have likelyreduced any artificial enhancement of classification performancefrom irrelevant motion artifacts. Secondly, we followed an agnos-tic approach of including networks/nodes that are involved in awide range of cognitive processing, and not merely those shownto be distinguishing features within the same sample set. In thisway, we have avoided any inadvertent enhancement of classifica-tion performance through “double dipping” (Kriegeskorte et al.,2009). Finally, the sample sizes used here, although standard formachine-learning approaches to fMRI data (Zhang et al., 2005;Yang et al., 2010), may have been less sufficient for probing neu-ral differences more subtle than those seen in schizophrenia orParkinson’s disease.
To obtain a more complete picture of disruptions in func-tional connectivity as a consequence of nicotine addiction, itwould be illuminating to examine such data on a continuum ofaddiction severity. Although we analyzed the data here as binaryclasses of “high severity of nicotine addiction” and “no nicotineaddiction,” additional insight could be gleaned by using sup-port vector regression, for example, to extract features predictiveof the FTND (Fagerström et al., 2012). Such a regression-basedapproach would allow for a more nuanced understanding of indi-vidual differences in the severity of addiction, especially whenpartnered with different treatment strategies. However, as this isa relatively crude measure of disease severity, it is likely that amuch larger sample size and variance in FTND would be nec-essary for such a regression approach. Similarly, support vectorregression with a focus on lifetime smoking exposure could pro-vide valuable insights into the consequences of chronic nicotineconsumption.
One potential concern regarding our findings is that, cur-rently, there is limited data supporting the value of within-RSNcentered analysis in nicotine addiction research. As already men-tioned, a previous publication from our lab (Sutherland et al.,2012) approached the consequences of nicotine-related changesin within- (and between-) DMN and ECN connectivity. Prior tothis, Cole et al. (2010) examined the effects of nicotine replace-ment therapy within- (and between-) DMN and ECN connec-tivity. However, although studies like these that focus on RSNsas defined in Smith et al. (2009) are not common, it is notunusual for addiction studies to focus on within-network con-nectivity in pre-specified networks. For example, many rsFCstudies in addiction have limited their analyses to frontal andmesocorticolimbic circuits (see Sutherland et al., 2012, for areview).
Machine learning based approaches offer both basic and clini-cal applications for addiction research: the capability to identifyneural features critical to predicting addiction, and the poten-tial for using such a classifier in clinical settings to predicttreatment outcome or future substance dependence. For the
latter, classification performance need approach 95–100% accu-racy (Orrù et al., 2012). Although, for screening future substancedependence, high sensitivity (the true positive rate) is likelymore important, even at the expense of specificity (true nega-tive rate), than overall accuracy. In any case, a potential limitationto this study is that rsFC by itself may not be powerful enoughto predict smoking status with close to perfect performance.Perhaps by including task-based data, or features involving othermodalities—e.g., genetics—we may obtain superior predictivecapabilities. It has been shown that by combining fMRI andgenetics information, classification of schizophrenics from con-trols can be significantly enhanced (Yang et al., 2010). Similarly,by including genetic information that has previously been shownto differentiate smokers from non-smokers (Kreek et al., 2005;Hong et al., 2010), perhaps the predictive power of such classifierscan be augmented to the extent required for clinical applica-tions. Nevertheless, our data suggests that there is tremendouspotential in combining rsFC data with machine learning-basedtechniques for advancing our understanding of network-levelpredictive differences critical to addiction.
ACKNOWLEDGMENTSWe thank Steve Smith of the FMRIB Analysis Group at theUniversity of Oxford for the use of the resting state networkmaps originally published in Smith et al. (2009). This work wassupported by the National Institute on Drug Abuse, IntramuralResearch Program, NIH/DHHS.
REFERENCESBehzadi, Y., Restom, K., Liau, J., and Liu, T. T. (2007). A component based
noise correction method (CompCor) for BOLD and perfusion based fMRI.Neuroimage 37, 90–101. doi: 10.1016/j.neuroimage.2007.04.042
Bekker, E., Böcker, K., Van Hunsel, F., Van Den Berg, M., and Kenemans, J. (2005).Acute effects of nicotine on attention and response inhibition. Pharmacol.Biochem. Behav. 82, 539–548. doi: 10.1016/j.pbb.2005.10.009
Braun, U., Plichta, M. M., Esslinger, C., Sauer, C., Haddad, L., Grimm, O., et al.(2012). Test–retest reliability of resting-state connectivity network characteris-tics using fMRI and graph theoretical measures. Neuroimage 59, 1404–1412. doi:10.1016/j.neuroimage.2011.08.044
Bressler, S. L., and Menon, V. (2010). Large-scale brain networks in cogni-tion: emerging methods and principles. Trends Cogn. Sci. 14, 277–290. doi:10.1016/j.tics.2010.04.004
Brody, A. L., Mandelkern, M. A., Jarvik, M. E., Lee, G. S., Smith, E. C., Huang, J.C., et al. (2004). Differences between smokers and nonsmokers in regional graymatter volumes and densities. Biol. Psychiatry 55, 77–84. doi: 10.1016/S0006-3223(03)00610-3
Chang, C.-C., and Lin, C.-J. (2011). LIBSVM: a library for support vectormachines. ACM Trans. Intell. Syst. Technol. 2:27. doi: 10.1145/1961189.1961199
Chen, S., Ross, T. J., Zhan, W., Myers, C. S., Chuang, K.-S., Heishman, S.J., et al. (2008). Group independent component analysis reveals consistentresting-state networks across multiple sessions. Brain Res. 1239, 141–151. doi:10.1016/j.brainres.2008.08.028
Cole, D. M., Beckmann, C. F., Long, C. J., Matthews, P. M., Durcan, M. J., andBeaver, J. D. (2010). Nicotine replacement in abstinent smokers improves cogni-tive withdrawal symptoms with modulation of resting brain network dynamics.Neuroimage 52, 590–599. doi: 10.1016/j.neuroimage.2010.04.251
Cox, R. W. (1996). AFNI: software for analysis and visualization of functionalmagnetic resonance neuroimages. Comput. Biomed. Res. 29, 162–173. doi:10.1006/cbmr.1996.0014
Craddock, R. C., Holtzheimer, P. E., Hu, X. P., and Mayberg, H. S. (2009). Diseasestate prediction from resting state functional connectivity. Magn. Reson. Med.62, 1619–1628. doi: 10.1002/mrm.22159
Frontiers in Human Neuroscience www.frontiersin.org June 2014 | Volume 8 | Article 425 | 8
Pariyadath et al. SVM classification predicts smoking status
Damoiseaux, J., Rombouts, S., Barkhof, F., Scheltens, P., Stam, C., Smith,S. M., et al. (2006). Consistent resting-state networks across healthy sub-jects. Proc. Natl. Acad. Sci. U.S.A. 103, 13848–13853. doi: 10.1073/pnas.0601417103
Demirci, O., Clark, V. P., and Calhoun, V. D. (2008). A projection pursuit algo-rithm to classify individuals using fMRI data: application to schizophrenia.Neuroimage 39, 1774–1782. doi: 10.1016/j.neuroimage.2007.10.012
De Wit, H. (2009). Impulsivity as a determinant and consequence of drug use:a review of underlying processes. Addict. Biol. 14, 22–31. doi: 10.1111/j.1369-1600.2008.00129.x
Dosenbach, N. U., Nardos, B., Cohen, A. L., Fair, D. A., Power, J. D., Church, J. A.,et al. (2010). Prediction of individual brain maturity using fMRI. Science 329,1358–1361. doi: 10.1126/science.1194144
Ersche, K. D., Jones, P. S., Williams, G. B., Turton, A. J., Robbins, T. W., andBullmore, E. T. (2012). Abnormal brain structure implicated in stimulant drugaddiction. Science 335, 601–604. doi: 10.1126/science.1214463
Ersche, K. D., Turton, A. J., Pradhan, S., Bullmore, E. T., and Robbins, T. W.(2010). Drug addiction endophenotypes: impulsive versus sensation-seekingpersonality traits. Biol. Psychiatry 68, 770–773. doi: 10.1016/j.biopsych.2010.06.015
Fagerström, K., Russ, C., Yu, C. R., Yunis, C., and Foulds, J. (2012). The fagerströmtest for nicotine dependence as a predictor of smoking abstinence: a pooledanalysis of varenicline clinical trial data. Nicotine Tob. Res. 14, 1467–1473. doi:10.1093/ntr/nts018
Ford, J., Farid, H., Makedon, F., Flashman, L. A., McAllister, T. W.,Megalooikonomou, V., et al. (2003). “Patient classification of fMRI activa-tion maps,” in Medical Image Computing and Computer-Assisted Intervention-MICCAI 2003 (Berlin; Heidelberg: Springer), 58–65. doi: 10.1007/978-3-540-39903-2_8
Fox, M. D., Snyder, A. Z., Vincent, J. L., Corbetta, M., Van Essen, D. C., and Raichle,M. E. (2005). The human brain is intrinsically organized into dynamic, anticor-related functional networks. Proc. Natl. Acad. Sci. U.S.A. 102, 9673–9678. doi:10.1073/pnas.0504136102
Freund, Y., and Schapire, R. E. (1995). “A decision-theoretic generalization of on-line learning and an application to boosting,” in Computational Learning Theory(Berlin; Heidelberg: Springer), 23–37. doi: 10.1007/3-540-59119-2_166
Gallinat, J., Meisenzahl, E., Jacobsen, L. K., Kalus, P., Bierbrauer, J., Kienast, T., et al.(2006). Smoking and structural brain deficits: a volumetric MR investigation.Eur. J. Neurosci. 24, 1744–1750. doi: 10.1111/j.1460-9568.2006.05050.x
Goldstein, R. Z., and Volkow, N. D. (2002). Drug addiction and its under-lying neurobiological basis: neuroimaging evidence for the involvement ofthe frontal cortex. Am. J. Psychiatry 159:1642. doi: 10.1176/appi.ajp.159.10.1642
Goldstein, R. Z., and Volkow, N. D. (2011). Dysfunction of the prefrontal cortex inaddiction: neuroimaging findings and clinical implications. Nat. Rev. Neurosci.12, 652–669. doi: 10.1038/nrn3119
Greicius, M. D., Krasnow, B., Reiss, A. L., and Menon, V. (2003). Functionalconnectivity in the resting brain: a network analysis of the default modehypothesis. Proc. Natl. Acad. Sci. U.S.A. 100, 253–258. doi: 10.1073/pnas.0135058100
Guyon, I., Weston, J., Barnhill, S., and Vapnik, V. (2002). Gene selection for can-cer classification using support vector machines. Mach. Learn. 46, 389–422. doi:10.1023/A:1012487302797
Haxby, J. V. (2012). Multivariate pattern analysis of fMRI: the early beginnings.Neuroimage 62, 852–855. doi: 10.1016/j.neuroimage.2012.03.016
Hester, R., and Garavan, H. (2004). Executive dysfunction in cocaine addiction:evidence for discordant frontal, cingulate, and cerebellar activity. J. Neurosci.24, 11017–11022. doi: 10.1523/JNEUROSCI.3321-04.2004
Hobbs, N. Z., Henley, S. M., Ridgway, G. R., Wild, E. J., Barker, R. A., Scahill, R.I., et al. (2010). The progression of regional atrophy in premanifest and earlyHuntington’s disease: a longitudinal voxel-based morphometry study. J. Neurol.Neurosurg. Psychiatry 81, 756–763. doi: 10.1136/jnnp.2009.190702
Hong, L. E., Hodgkinson, C. A., Yang, Y., Sampath, H., Ross, T. J., Buchholz,B., et al. (2010). A genetically modulated, intrinsic cingulate circuit supportshuman nicotine addiction. Proc. Natl. Acad. Sci. U.S.A. 107, 13509–13514. doi:10.1073/pnas.1004745107
Hsu, C. W., Chang, C. C., and Lin, C. J. (2003). A practical guide to sup-port vector classification. Technical Report. Available online at: http://www.csie.ntu.edu.tw/∼cjlin/papers/guide/guide.pdf.
Kelly, A., Uddin, L. Q., Biswal, B. B., Castellanos, F. X., and Milham, M. P.(2008). Competition between functional brain networks mediates behavioralvariability. Neuroimage 39, 527–537. doi: 10.1016/j.neuroimage.2007.08.008
Kober, H., Mende-Siedlecki, P., Kross, E. F., Weber, J., Mischel, W., Hart, C. L., et al.(2010). Prefrontal–striatal pathway underlies cognitive regulation of craving.Proc. Natl. Acad. Sci. U.S.A. 107, 14811–14816. doi: 10.1073/pnas.1007779107
Kreek, M., Nielsen, D., Butelman, E., and Laforge, K. (2005). Genetic influences onimpulsivity, risk taking, stress responsivity and vulnerability to drug abuse andaddiction. Nat. Neurosci. 8, 1450–1457. doi: 10.1038/nn1583
Kriegeskorte, N., Simmons, W. K., Bellgowan, P. S., and Baker, C. I. (2009). Circularanalysis in systems neuroscience: the dangers of double dipping. Nat. Neurosci.12, 535–540. doi: 10.1038/nn.2303
Lerman, C., Gu, H., Loughead, J., Ruparel, K., Yang, Y., and Stein, E. A.(2014). Large-scale brain network coupling predicts acute nicotine abstinenceeffects on craving and cognitive Function. JAMA Psychiatry 71, 523–530. doi:10.1001/jamapsychiatry.2013.4091
Orrù, G., Pettersson-Yeo, W., Marquand, A. F., Sartori, G., and Mechelli, A. (2012).Using support vector machine to identify imaging biomarkers of neurologicaland psychiatric disease: a critical review. Neurosci. Biobehav. Rev. 36, 1140–1152.doi: 10.1016/j.neubiorev.2012.01.004
Pariyadath, V., Paulus, M. P., and Stein, E. A. (2013). “Brain, reward, and drugaddiction,” in Neurobiology of Mental Illness, 4th Edn., eds D. S. Charney, E. J.Nestler, P. Sklar, and J. D. Buxbaum (New York, NY: Oxford University Press),732–741.
Pedregosa, F., Varoquaux, G., Gramfort, A., Michel, V., Thirion, B., Grisel, O.,et al. (2011). Scikit-learn: machine learning in Python. J. Mach. Learn. Res. 12,2825–2830. Available online at: http://jmlr.org/papers/v12/pedregosa11a.html
Power, J. D., Barnes, K. A., Snyder, A. Z., Schlaggar, B. L., and Petersen, S.E. (2012). Spurious but systematic correlations in functional connectivityMRI networks arise from subject motion. Neuroimage 59, 2142–2154. doi:10.1016/j.neuroimage.2011.10.018
Shen, H., Wang, L., Liu, Y., and Hu, D. (2010). Discriminative analy-sis of resting-state functional connectivity patterns of schizophrenia usinglow dimensional embedding of fMRI. Neuroimage 49, 3110–3121. doi:10.1016/j.neuroimage.2009.11.011
Smith, S. M., Fox, P. T., Miller, K. L., Glahn, D. C., Fox, P. M., Mackay, C.E., et al. (2009). Correspondence of the brain’s functional architecture dur-ing activation and rest. Proc. Natl. Acad. Sci. U.S.A. 106, 13040–13045. doi:10.1073/pnas.0905267106
Stonnington, C. M., Chu, C., Klöppel, S., Jack Jr, C. R., Ashburner, J.,and Frackowiak, R. S. (2010). Predicting clinical scores from magneticresonance scans in Alzheimer’s disease. Neuroimage 51, 1405–1413. doi:10.1016/j.neuroimage.2010.03.051
Sutherland, M. T., McHugh, M. J., Pariyadath, V., and Stein, E. A. (2012). Restingstate functional connectivity in addiction: Lessons learned and a road ahead.Neuroimage 62, 2281–2295. doi: 10.1016/j.neuroimage.2012.01.117
Taylor, P. A., and Saad, Z. S. (2013). FATCAT: (an efficient) functional andtractographic connectivity analysis toolbox. Brain Connect. 3, 523–535. doi:10.1089/brain.2013.0154
Vapnik, V. N. (2000). The Nature of Statistical Learning Theory. New York, NY:Springer-Verlag.
Vemuri, P., Gunter, J. L., Senjem, M. L., Whitwell, J. L., Kantarci, K., Knopman,D. S., et al. (2008). Alzheimer’s disease diagnosis in individual subjects usingstructural MR images: validation studies. Neuroimage 39, 1186–1197. doi:10.1016/j.neuroimage.2007.09.073
Volkow, N., Fowler, J., Wang, G., Baler, R., and Telang, F. (2009). Imagingdopamine’s role in drug abuse and addiction. Neuropharmacology 56, 3–8. doi:10.1016/j.neuropharm.2008.05.022
Volkow, N. D., Fowler, J. S., Wang, G.-J., and Goldstein, R. Z. (2002). Roleof dopamine, the frontal cortex and memory circuits in drug addiction:insight from imaging studies. Neurobiol. Learn. Mem. 78, 610–624. doi:10.1006/nlme.2002.4099
Wu, C. W., Gu, H., Lu, H., Stein, E. A., Chen, J.-H., and Yang, Y. (2008).Frequency specificity of functional connectivity in brain networks. Neuroimage42, 1047–1055. doi: 10.1016/j.neuroimage.2008.05.035
Yang, H., Liu, J., Sui, J., Pearlson, G., and Calhoun, V. D. (2010). A hybridmachine learning method for fusing fMRI and genetic data: combining bothimproves classification of schizophrenia. Front. Hum. Neurosci. 4:192. doi:10.3389/fnhum.2010.00192
Frontiers in Human Neuroscience www.frontiersin.org June 2014 | Volume 8 | Article 425 | 9

Pariyadath et al. SVM classification predicts smoking status
Zhang, L., Samaras, D., Tomasi, D., Volkow, N., and Goldstein, R. (2005). “Machinelearning for clinical diagnosis from functional magnetic resonance imaging,” inIEEE Computer Society Conference on Computer Vision and Pattern Recognition.CVPR 2005 (San Diego, CA). 1211–1217.
Zuo, X.-N., Kelly, C., Adelstein, J. S., Klein, D. F., Castellanos, F. X., and Milham,M. P. (2010). Reliable intrinsic connectivity networks: test–retest evaluationusing ICA and dual regression approach. Neuroimage 49, 2163–2177. doi:10.1016/j.neuroimage.2009.10.080
Conflict of Interest Statement: The authors declare that the research was con-ducted in the absence of any commercial or financial relationships that could beconstrued as a potential conflict of interest.
Received: 13 February 2014; accepted: 28 May 2014; published online: June 2014.Citation: Pariyadath V, Stein EA and Ross TJ (2014) Machine learning classificationof resting state functional connectivity predicts smoking status. Front. Hum. Neurosci.8:425. doi: 10.3389/fnhum.2014.00425This article was submitted to the journal Frontiers in Human Neuroscience.Copyright © 2014 Pariyadath, Stein and Ross. This is an open-access arti-cle distributed under the terms of the Creative Commons Attribution License(CC BY). The use, distribution or reproduction in other forums is permitted, pro-vided the original author(s) or licensor are credited and that the original publi-cation in this journal is cited, in accordance with accepted academic practice. Nouse, distribution or reproduction is permitted which does not comply with theseterms.
Frontiers in Human Neuroscience www.frontiersin.org June 2014 | Volume 8 | Article 425 | 10
166666