Inclusions Size-based Fatigue Life Prediction Model of NiTi ...
12
Inclusions Size-based Fatigue Life Prediction Model of NiTi Alloy for Biomedical Applications Marco Fabrizio Urbano 1 • Andrea Cadelli 1 • Frank Sczerzenie 2 • Pietro Luccarelli 3 • Stefano Beretta 3 • Alberto Coda 1 Introduction Since 1979 with the studies of Melton and Mercier [1], significant efforts have been devoted to the study of the fatigue behavior on NiTi shape memory alloys (SMA) for biomedical applications (typically known as Nitinol). The reader can refer to the review by Adler et al. in 2007 [2] and the more recent paper by Pelton et al. [3] to have an overview on fatigue studies of superelastic Nitinol and the difficulties related to this peculiar material. The type of annealing, the nickel/titanium balance, and the relative amount of martensite and austenite are just some of many parameters potentially affecting fatigue behavior of Nitinol that have been considered to date. In Reinoehl et al. [4], the rotary beam fatigue testing (RBT) of 267-lm diameter wires obtained from different suppliers is characterized by different maximum inclusion dimensions, but no conclusive statements are provided. In Sawaguchi [5] inclusions, scratches and surface defects are documented as nucleation sites of fatigue cracks and in Wong [6] inclusions are recognized as key contributors to failure for as-drawn or electro-polished Nitinol wires. More recently, significant progresses were done to systematically study and clarify the effects of inclusions on the fatigue performance of NiTi SMA [7–10]. Nevertheless, the lim- ited knowledge about the effect of inclusions is still re- flected in the regulations pertinent to the characterization of inclusions in Nitinol. The inclusion rating is covered only in standard specification ASTM F2063-12 [11] that re- quires the evaluation of microcleanliness in wrought Nickel-Titanium SMA for Medical Devices and Surgical Implants. In this procedure, microcleanliness is evaluated in mill products with section sizes between 5.5 and 94.0 mm in diameter. These dimensions exclude most of finished components for biomedical applications. Thus, the & Alberto Coda [email protected] 1 SAES Getters S.p.A., Lainate, Italy 2 SAES Smart Materials, New Hartford, NY, USA 3 Mechanical Engineering, Politecnico of Milano, Milan, MI, Italy
-
Upload
khangminh22 -
Category
Documents
-
view
4 -
download
0
Transcript of Inclusions Size-based Fatigue Life Prediction Model of NiTi ...

Inclusions Size-based Fatigue Life Prediction Model of NiTi Alloyfor Biomedical Applications
Marco Fabrizio Urbano1 • Andrea Cadelli1 • Frank Sczerzenie2 •
Pietro Luccarelli3 • Stefano Beretta3 • Alberto Coda1
Introduction
Since 1979 with the studies of Melton and Mercier [1],
significant efforts have been devoted to the study of thefatigue behavior on NiTi shape memory alloys (SMA) for
biomedical applications (typically known as Nitinol). The
reader can refer to the review by Adler et al. in 2007 [2]and the more recent paper by Pelton et al. [3] to have an
overview on fatigue studies of superelastic Nitinol and the
difficulties related to this peculiar material. The type ofannealing, the nickel/titanium balance, and the relative
amount of martensite and austenite are just some of many
parameters potentially affecting fatigue behavior of Nitinolthat have been considered to date.
In Reinoehl et al. [4], the rotary beam fatigue testing
(RBT) of 267-lm diameter wires obtained from differentsuppliers is characterized by different maximum inclusion
dimensions, but no conclusive statements are provided. In
Sawaguchi [5] inclusions, scratches and surface defects aredocumented as nucleation sites of fatigue cracks and in
Wong [6] inclusions are recognized as key contributors tofailure for as-drawn or electro-polished Nitinol wires. More
recently, significant progresses were done to systematically
study and clarify the effects of inclusions on the fatigueperformance of NiTi SMA [7–10]. Nevertheless, the lim-
ited knowledge about the effect of inclusions is still re-
flected in the regulations pertinent to the characterization ofinclusions in Nitinol. The inclusion rating is covered only
in standard specification ASTM F2063-12 [11] that re-
quires the evaluation of microcleanliness in wroughtNickel-Titanium SMA for Medical Devices and Surgical
Implants. In this procedure, microcleanliness is evaluated
in mill products with section sizes between 5.5 and94.0 mm in diameter. These dimensions exclude most of
finished components for biomedical applications. Thus, the
& Alberto [email protected]
1 SAES Getters S.p.A., Lainate, Italy
2 SAES Smart Materials, New Hartford, NY, USA
3 Mechanical Engineering, Politecnico of Milano, Milan, MI,Italy

referenced as P1, P2, P3, P4, and P5. The processes differ in the raw materials and melting practice, through varied combinations of vacuum induction melting (VIM) and vacuum arc re-melting (VAR), and in the hot processing steps. Cold drawing, interpass annealing, surface polishing, and final straight annealing have been carried out according to a standard recipe. The final surface finish is an amber oxide for all the wires. This surface finish was selected because it is a standard for commercial wires.
Every material was characterized at ingot level in terms of gas impurities (C, O) by a LECO analyzer (ASTM F2063 [11]). Differential scanning calorimetric (DSC) analysis was performed on final annealed wires according to ASTM F2004 [14], as well as bend and free recovery (BFR) and tensile test were performed according to ASTM F2082 [15] and F2516 [16], respectively. Results summa-
rized in Table 1 are the average of three repetitions from each sample. For this experimental campaign, wires having very similar thermo-mechanical properties were selected, in order to minimize the impact of further differences on fatigue.
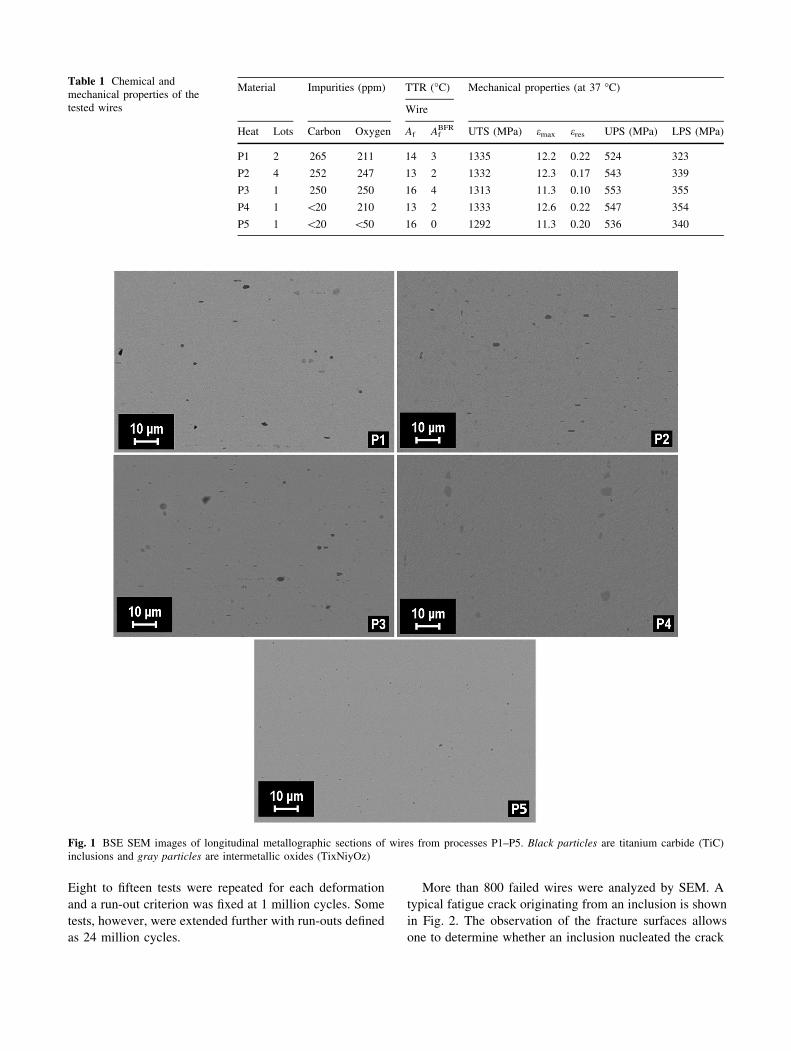
Metallographic longitudinal centerline samples of wires from the five different processes were prepared by standard practice and analyzed by SEM. In Fig. 1a–e, back-scattered secondary electron (BSE) SEM images of the five materials are reported. The pictures show that the main differences between the materials are due to a different nature and dimensional distribution of the inclusions. The preliminary inclusions analysis was conducted according to the internal procedure described by Sczerzenie et al. [17]. In particular, the samples were taken from head, center, and tail of full size production spools. The analysis was carried out by scanning the length of each sample in three regions of the cross-section: the centerline, the mid-radius, and the near edge lines. Nine fields of view and over one hundred par-ticles per sample were analyzed. Table 2 summarizes the results in terms of maximum area fraction and inclusion size both for carbides and oxides as recommended by ASTM F2063.
Material P1 shows a mix of carbides and oxides, P2 and P3 only carbides, while P4 and P5 exhibit mainly oxides. Although all wires have the same surface finish and un-dergo the same cold drawing and annealing process, it is not possible to completely exclude other microstructural differences, such as grain size.
Fatigue Testing
Almost 1500 samples were fatigue tested in zero-mean strain conditions (R = -1) by means of RBT at different alternating strain amplitudes. A rotating beam Blockwise Fatigue Tester FTX was used. All tests were performed at 1000 rpm in a temperature-controlled water bath at 37 "C.
inclusion assessment is performed at an intermediate manufacturing process step.
Quite recently, a standard practice for the statistical analysis of nonmetallic inclusions in steels was introduced [12]. The aim of the practice is to estimate the expected largest inclusion in a determined volume of material. The need for a thorough method for the analysis of inclusions followed the studies reported in [13], focused in particular on ball bearing steels that demonstrate the negative effect of inclusions on the fatigue behavior of hard steels and the need to adopt the so called extreme value inclusion rating.
In this work, we present the results of a research pro-gram aimed at verifying whether these findings are appli-cable to Nitinol.
Several lots of superelastic wires manufactured by dif-ferent melting techniques and hot processing steps were selected. Although presenting almost identical surface finishes and thermo-mechanical properties, the process differences are hypothesized to influence the inclusion nature, size, and distribution (verified a posteriori). Wires are Rotary beam tested (RBT) at several strain levels and fracture sections observed by field emission scanning electron microscopy (FESEM), measuring the dimensions of the inclusions present at the fracture nucleation sites. The negative effect of inclusions on fatigue, independent of process, is demonstrated. The entire set of fatigue data collected for each process is analyzed through an inter-pretative model, namely a bilinear uniform scatter band model. This analysis allows appreciating quantitatively how different processes can influence the fatigue behav-iors, in particular, in the low-strain/long-life region. Similarly, the statistical distribution of the recorded in-clusion sizes for each process is considered. The popula-tions are found to follow the Gumbel distribution and to be different, thus confirming the initial assumption. Moreover, the size of extreme inclusions in each material is correlated to its fatigue limits calculated from the experimental tests.
Finally, considering the inclusions as ‘small cracks,’ a simple relationship between fatigue limit strain range and inclusion size based on DKth data from the literature can be proposed. The relationship between da/dN-DK is then integrated for estimating the fatigue life. The model is compared with wire fatigue data demonstrating a very good agreement.
Experimental
Materials
The 300-lm superelastic wires used in this study come from eight Ni-44.0Ti wt% ingots and several lots manufactured by means of five different processes,
Eight to fifteen tests were repeated for each deformation
and a run-out criterion was fixed at 1 million cycles. Some
tests, however, were extended further with run-outs definedas 24 million cycles.
More than 800 failed wires were analyzed by SEM. A typical fatigue crack originating from an inclusion is shown in Fig. 2. The observation of the fracture surfaces allows one to determine whether an inclusion nucleated the crack
Table 1 Chemical andmechanical properties of thetested wires
Material Impurities (ppm) TTR ("C) Mechanical properties (at 37 "C)
Wire
Heat Lots Carbon Oxygen Af AfBFR UTS (MPa) emax eres UPS (MPa) LPS (MPa)
P1 2 265 211 14 3 1335 12.2 0.22 524 323
P2 4 252 247 13 2 1332 12.3 0.17 543 339
P3 1 250 250 16 4 1313 11.3 0.10 553 355
P4 1 \20 210 13 2 1333 12.6 0.22 547 354
P5 1 \20 \50 16 0 1292 11.3 0.20 536 340
Fig. 1 BSE SEM images of longitudinal metallographic sections of wires from processes P1–P5. Black particles are titanium carbide (TiC)inclusions and gray particles are intermetallic oxides (TixNiyOz)

and, when present, the dimensions of the inclusion at the
nucleation site. From SEM analysis, all the fractures nu-cleate from an inclusion. In particular, in materials where
carbides are the primary inclusions, more than 80 % of
fractures showed a carbide at the crack tip. In materialswhere oxides are the dominant inclusions, 100 % of frac-
tures nucleate from these inclusions that, in general, are
larger than carbides. The nature of inclusions (carbide oroxide) was also identified and recorded by morphology and
chemical composition by using EDX microprobe. Thedistance of the particle from the surface and its shape were
also measured in order to properly compensate the particle
area as recommended by Murakami [13]. Measurements ofinclusions size were expressed in terms of Murakami’s
Harea parameter.
Although RBT is an excellent tool for rapidly assessingfatigue performance, the trends presented and discussed in
this work may not necessarily be correlated to those that
could be observed in finished devices that utilize Nitinol.The effect of inclusions is clearly demonstrated, but readers
should assess fatigue testing on their own devices using the
relevant deformation mode and frequency.
Data Analysis
The typical results of rotary beam fatigue tests can be plotted as De–N diagrams, similar to the S–N diagrams usually adopted in load-controlled fatigue. Considering that the experimental plan was aimed at determining the fatigue limit in the long-life region, a statistical analysis to de-scribe both fatigue regions (namely ‘finite life’ and ‘fatigue limit’) was adopted.
In particular, a bilinear uniform scatter band (firstly proposed by Haibach [18]) was chosen, as is common in establishing design curves for components subjected to fatigue (see, for example, Eurocode 3 curves for welded joints). The simple assumption behind the method is that, in a logS–logN diagram, a fatigue response can be de-scribed by means of a statistical model with constant dis-persion along the logS direction. This method can be applied only to those sets of data which the logS–logN diagram shows a fitting attitude for a two slopes curve, namely the dataset should contain data also for the fatigue limit region.
The same concept was adopted for the analysis of the present De–N data. Consequently, the following hypotheses (that are consistent with the ASTM E739 recommendations [19]) were included in the statistical model (see Fig. 3):• Fatigue life, that is the dependent variable in the fatigue
experiments, is assumed to be log-normally distributed;
• The dependence of fatigue life on De is modeled as
llogN ¼ logND þ k1 $ logDe% logDeDð Þ for e [ eD
llogN ¼ logND þ k2 $ logDe% logDeDð Þ for e\ eD
ð1Þ
where {ND, DeD} identifies the ‘knee’ in the fatigue
response;
Table 2 Inclusion analysis performed on metallographic longitudinalcross-section of the five examined NiTi wires according to ASTMF2063
Material Max areafraction (%)
Max inclusionsize (lm)
Carbides Oxides Carbides Oxides
P1 0.73 0.15 6.33 7.18
P2 0.47 \0.01 7.07 \0.10
P3 0.73 0.04 14.06 3.83
P4 0.02 0.91 2.65 34.31
P5 0.02 0.28 3.14 10.61
Fig. 2 A typical fracturesurface with details of initialpropagation region where it canbe seen TixNiyOz particle atfracture origin

• In order to model the uniform scatter in the logDedirection, the standard deviation of logN is described as
follows:
rlogN ¼ rlog e $ k1 for e[ eDrlogN ¼ rlog e $ k2 for e\eD
ð2Þ
The analysis of the fatigue data for the different mate-
rials was conducted with the maximum-likelihood (ML)
method [20], maximizing the log-likelihood of the data fora given sample:
l ¼Xn
i¼1
log f yið Þð Þ þXu
j¼1
logð1% Fðy0jÞÞ; ð3Þ
where
• f(y) and F(y), respectively, indicate the probability
density and the distribution function of the fatigue life
y, which are assumed to be a log-normal distributionwhose parameters are described by Eqs. (1, 2);
• yi (i = 1,…,n) and yj (j = 1,…,u) indicate a complete
test (failure) and a suspended test (run-out),respectively.
Goodness of fit tests proved the adoption of the bilinear
model and LR tests for significance of parameters [20] supported the analyses.
The results of such analysis for the five materials are shown in Fig. 4, where it can be seen that the analysis with the bilinear uniform scatter band is able to provide a complete picture of the fatigue behavior of the wires. The fatigue properties that have been considered to be relevant are the strain corresponding to 50 % failure probability at 106 cycles, eav, and its lower bound (calculated as the 5 %percentile), einf.
A comparison of the model parameters for the five processes is shown in Table 3. It can be seen that the wires
with the lowest fatigue limit are the P4’s, while the best fatigue limit corresponds to P3 and P5 wires.
Experimental Evidence of Inclusion Effect
Several inclusion observations at the origin of fracture sur-face are available for all the samples. To give a qualitative example, the dimension of the inclusions (expressed in termsof the parameter Harea) is reported on the fatigue response for material P1 in Fig. 5. It can be seen that at strain levels near the fatigue limit (e.g., strain levels ±0.008 and ±0.009), the fatigue life is inversely correlated to defect dimension. Alternatively, most of the data points lying on the 5 % line present the largest inclusions. This fact clearly illustrates the detrimental effect of inclusion size on the fatigue limit of NiTi wires, the main topic of the present research.
In the next section, this effect will also be quantified.
Estimation of Extreme Inclusions
The effect of a prospective population of inclusions/defects in a material subjected to a given stress level is shown in Fig. 6. In particular, the material will fail only if themaximum inclusion is above the Drlim-Harea relation-ship. Because of this, fatigue limits are not correlated to the average inclusion content but to the size of the extreme, or maximum, inclusions. A number of successful applications support these concepts (see references [21–23]) that have then been condensed into simple recommendations for the extreme value inclusion rating [ASTM E2283-08] [12].
The estimation of maximum defects is conducted with the statistics of extremes: in the most simple version, it is based on the block maxima sampling, where only the maximum defects detected on a given area (or volume) are recorded and then analyzed with type-I Extreme Value (also called Largest Extreme Value, or Gumbel) Distribu-tion [24]. This sampling strategy can be applied very simply to the inclusion detected at the origin of fatigue failures, since the wires in the central part of the specimen (where they are bent with a constant radius of curvature) are subjected to a constant stress/strain and we expect that failures have occurred at the maximum inclusion present in the most stressed volume.
According to extreme value statistics, the cumulative probability of the particles diameter for each wire batch should follow the Gumbel distribution function [25]:FðxÞ ¼ exp % exp % x% k
d
! "# $; ð4Þ
where k and d are the location (63.2 percentile) and the
scale parameters, respectively.
Fig. 3 Concept of the ‘‘uniform scatter band’’ applied to wirerotating bending fatigue data

The distribution parameters k and d have been estimatedas [25]:
d̂ ¼ffiffiffi6
p
ps k̂ ¼ !xþ0:5772d; ð5Þ
where !x is the sample mean of defects dimension and s is
the standard deviation of the sampled data.Using Eq. (4), data can be plotted on a Gumbel prob-
ability plot, where the defect inclusions are plotted against
Fig. 4 Interpolation of RBT fatigue data on Nitinol wires: a P1 data; b P2 data; c P3 data; d P4 data; e P5 data

of the distribution of extreme inclusions for the five dif-ferent families are reported in Table 4.
In particular, the maximum defect with a return period T (the maximum defect which is expected to be exceeded once every T observations) can be calculated as follows:
dmax Tð Þ ¼ k̂þ d̂ % log % log 1% 1=Tð Þð Þð Þ ð6Þ
The different datasets were analyzed according to this
procedure, and the prospective size of maximum defectsfor T = 1000 and T = 10,000 (obtaining the defects that
are exceeded once every 1000 and 10,000 specimens) was
calculated. In this way, we are estimating extreme defectsthat should be correlated to the lower bound of fatigue
limit.
Empirical Correlation Between Fatigue Limitand Extreme Inclusions
The fatigue strength of a component containing defects or
inhomogeneities subjected to axial or bending forces can
be predicted on the basis of the models of Murakami andEndo [26]. They showed that at the fatigue limit, small,
nonpropagating cracks are always present at a defect tip.
Because of this, the inhomogeneities can be treated ascracks and accordingly the fatigue limit (Drlim) has to be
calculated as the cyclic threshold stress at which the cracks
emanating from the defects do not propagate.This type of analysis suggests the need to calculate the
stress intensity factor (SIF or K) for a crack with an ir-
regular shape. Murakami suggested that the maximumstress intensity for a crack with an irregular shape could be
calculated easily with the simple equation:
K ¼ 0:65rffiffiffiffiffiffiffiffiffiffiffiffiffiffiffip
ffiffiffiffiffiffiffiffiffiarea
pq; ð7Þ
where Harea is the square root of the defect area projected
on a plane perpendicular to the applied stress. Because of
this model, in the following description, the inclusions sized will be expressed in terms of Harea. The prediction of
fatigue limit would therefore be possible considering at the
fatigue limit DK = DKth and then
Drlim ¼ DKth
0:65ffiffiffiffiffiffipd
p ð8Þ
Table 3 Best-fit parameters ofthe bilinear uniform scatter bandmodels and fatigue limitexpressed in term of strainamplitude at 106 cycles
Material k1 k2 DeD (%) ND Deav (% at 106 cycles) Deinf (% at 106 cycles)
P1 -3.46 -24.64 0.90 11,900 0.75 0.66
P2 -3.60 -57.89 0.84 17,900 0.78 0.70
P3 -3.78 -42.18 0.91 15,600 0.82 0.76
P4 -3.46 -36.08 0.70 26,000 0.63 0.55
P5 -3.60 -45.32 0.90 14,900 0.82 0.75
Fig. 5 Empirical correlation between test results and inclusiondimension of the first lot of the P1 wires: inclusion size in micron(expressed in terms of Harea) is reported on the plot aside the relativee–N value for most fatigue data
Fig. 6 Schematic of the Kitagawa diagram: for tests at a given stress (or strain) level only the maximum inclusion which is present in the material will lead to failure
the reduced variate -ln(-ln(Fi)), where Fi are the em-
pirical cumulative probabilities for the different data points [ASTM E2283-08]. Such a plot is shown in Fig. 7 for extreme inclusions in the wires of the five different mate-
rials. The best-fit distribution, whose parameters have been calculated with the moment’s method described by Beretta et al. [25], is plotted on the same graph together with 95 %confidence bands. It can be clearly seen that the Gumbel distribution describes quite well the data. The parameters

trend to a constant value -DKth, IC. A conservative ap-
proach, proposed by Robertson et al. [27], is to estimate theDKth for small cracks in terms of a lower bound of the da/
dN curves obtained on standard CT specimens. According
to this approach, the fatigue limit for small cracks is
Drlim ¼ DKth;IC;lowerbound
0:65ffiffiffiffiffiffipd
p ð9Þ
A better alternative is to model the DKth-d (where d is
the defect/crack dimension) relationship, otherwise called
Kitagawa–Takahashi diagram, by experimental tests [26]or theoretical models (see [21] for a review). In both ap-
proaches, the result will be a relationship of the type:
Fig. 7 a Gumbel probabilityplot for the inclusions at fractureorigin. b Magnification of theoverlapping region (Color figureonline)
Table 4 Fitted parameters of the Gumbel distribution for the fivematerials and expected particle size for a return period T = 103
Material k (lm) d (lm) dmax (lm)
P1 2.73 0.68 7.27
P2 2.61 0.58 6.60
P3 1.83 0.48 5.14
P4 4.57 1.43 14.46
P5 2.51 0.54 6.92
However, the application of Eq. (8) is not straightfor-ward since the fatigue threshold is a function of crack or defect size [26] and only in the case of along crack does it

Drlim ¼ C1ffiffiffiffiffiffiffiffiffiarea
p 1=n; ð10Þ
where n [ 2 (this condition is necessary for describing the tendency Drlim ? Drwo, see Fig. 6). According to Mu-
rakami and Endo [21], the parameter C1 depends on the metal matrix hardness HV (or, in other words, to the tensile properties of the material) and n = 6 for d \ 1000 lm, while for Robertson n = 2 and C1 = DKth, lower bound.
Considering that the strain amplitudes corresponding to fatigue lives greater than 105 are in the region of nominally elastic response for NiTi SMA (Delim a Drlim), it is as-sumed that in the region of fatigue limit, a relationship of the type:
Delim ¼ C2ffiffiffiffiffiffiffiffiffiarea
p 1=nð11Þ
should be valid. In the following, the existence of such a relationship will be shown. The parameter C2 should be a function of the tensile properties; the different wire classes have very similar static properties, so it appears correct to apply Eq. (11) to the experimental evidence.
The inclusion dimensional distribution can be related to the fatigue performances of different materials by plotting the expected maximum diameter (T = 1000) against the fatigue limit (as in Fig. 8). According to this figure, sam-
ples obtained from materials characterized by different inclusion’s distributions behave differently in fatigue test-ing, extreme inclusion dimensions and fatigue limit are anti-correlated (thus confirming Eq. 11). This result sup-ports the concepts of extreme value inclusion rating for the quality control of NiTi-based shape memory materials.
Material P5 appears as outlier, or it seems not to follow perfectly the expected trend. This behavior can suggest that maximum inclusions size might reasonably not be the only factor affecting fatigue. Since P5 has the smallest area fraction of inclusions, the data imply that the total number of inclusions (and consequently the probability of having a critical inclusion at the highest strain location) could be an additional contributing factor, albeit small compared to the maximum size which seems to dominate.
Model for the Effect of Inclusions on Fatigueof NiTi Wires
In this section we propose a fatigue prediction model ex-ploiting the theory presented in ‘‘Empirical Correlation Between Fatigue Limit and Extreme Inclusions’’ Section. The model assumes the fatigue failure occurs when a crack, propagating from a starting defect, such as an inclusion, reaches a critical value that we arbitrarily set to half wire diameter.
In order to evaluate the crack propagation, we chose theNASGRO propagation equation taking into account the El-
Haddad correction for small crack.
Fatigue Strength Model
Another alternative is the El-Haddad model [28] whichdescribes the peculiar shape of the Kitagawa–Takahashi
diagram assuming that an inherent fictitious defect size d0should be added to the real defect/crack. This inherentfictitious defect size (also called the El-Haddad parameter)
is the defect size that would exist at the cyclic stress Drwo(fatigue limit of the material) if the threshold was DKth, IC:
d0 ¼1
pDKth;IC
0:65Drwo
! "ð12Þ
This formula, firstly adopted by Beretta et al. [29], isdifferent from the original El-Haddad’s model [28], since it
refers to Eq. (7) for calculating the stress intensity factor
(SIF), so that the El-Haddad parameter is expressed interms of Harea. According to El-Haddad [28], the pa-
rameter d0 should then be added to the defect size in order
to calculate the fatigue limit in the presence of a givendefect d with Eq. (8) obtaining:
Drlim ¼ Drwo
ffiffiffiffiffiffiffiffiffiffiffiffiffid0
d þ d0
rð13Þ
Accordingly, the threshold depends on defect size as
DKth ¼ DKth;IC
ffiffiffiffiffiffiffiffiffiffiffiffiffid
d þ d0
rð14Þ
The advantage of the El-Haddad model is that it allows
one to easily describe the smooth transition of DKth toward
DKth, IC (or alternatively Drlim ? Drwo for d ? 0).
Fig. 8 Empirical correlation between dmax (estimated with extremevalue distribution) and einf for the Nitinol wires

On the other hand, this model requires some tests with
small defects for determining the parameters of Eq. (14).The functional relationship Drlim-d remains Eq. (10), but
here n is variable within 2 B n\? for 0 B d\?.
Threshold and Crack Growth Data for NiTi
Robertson & Ritchie [30] obtained crack growth data forNiTi with tests carried out at 37 "C at different load ratios
(R = 0.1, R = 0.5, and R = 0.7) on CT specimens, ob-taining threshold values reported in Fig. 9a. Considering
that the effect of the crack-closure for linear elastic fracture
mechanics (LEFM) tests can be described by Schijve’sequation [31]:
DKeff
DK¼ U ¼ 0:55þ 0:33Rþ 0:12R2; ð15Þ
where R is the stress ratio, it is the possible to estimate
DKth, eff and then DKth can be calculated at the different
stress ratios as
DKth ¼DKth;eff
U
As seen in Fig. 9a, the approximation is acceptable and the estimated DKth at R = -1 is 4.0 MPaHm. Correspondingthe concepts of Robertson & Ritchie [30], the lower bound for fatigue propagation of small cracks can be estimated tobe DKth, lower bound, R=-1 = 2.2 MPaHm.
A similar analysis has been carried out for estimating the crack growth curve at R = -1. In particular, the Robertson’s data at R = 0.1 have been interpolated with the expression for (equivalent to the NASGRO propagation equation [32]):da
dN¼ CDKn 1% DKth;IC
DK
! "p
ð16Þ
Then, the equation parameters were adjusted according
to Eq. (15), obtaining the estimated growth curve shown inFig. 9b.
Fatigue Strength Model Versus Experimental Tests
Considering the data concerning the defects of the P4
material tested at 37 "C, the maximum strain level at whichthere are run-outs is 0.7 % and it is related to the presence
of the smallest inclusions. Assuming that the Young’s
modulus for all the wire batches is E = 68,000 MPa, it canbe estimated that Drwo = 952 MPa. This estimate was
confirmed by a series of cyclic strain-control experiments
at Re = -1, that clearly showed that the limit for a cyclicelastic response corresponds to De = 1.4 %. So, it is then
possible to simply calculate d0 with Eq. (12) and then the
relationship between fatigue limit and inclusion size(Eq. 13).
A series of extra experiments were then carried out on
P4 wires for confirming this prediction by applying thefollowing procedure:
i) Wires were tested at the strain level of 0.55 % andthe inclusions at fracture origin of broken wires were
measured under SEM;
ii) The run-out wires were then re-tested at higher strainamplitudes (0.60 and 0.65 %) in order to break them
and their fracture services were examined under
SEM in order to detect the inclusion at fractureorigin.
In this way, it was possible to clearly determine the relationship between defect size and fatigue limit (ex-pressed in terms of Drw) and compare these precise data with the prediction by the El-Haddad model, as shown in Fig. 10a. It can be clearly seen how the model nicely predicts the fatigue strength for P4 wires, which have the lowest fatigue strength.
The model is compared with all the wire fatigue failed at strain levels close to the fatigue limit (failures with e B eD)
a
b
Fig. 9 Estimation of crack growth data at R = -1: a threshold databy Robertson and Ritchie [12] and estimation of dependence of DKthwith R; b data by Robertson at R = 0.1 and estimated growth curve atR = -1 with NASGRO equation

DK ¼ F ! DS !ffiffiffiffiffiffipa
p; ð17Þ
where a is the crack depth and F has been taken from
Carpinteri et al. [33] (the difference between Eqs. (7) and(17) for a semi-circular cracks is a few percents when the
crack depth is less than 5 % of wire diameter).
The fatigue life of the wires was estimated with a simplecrack propagation model, with these inputs:
i) The propagation crack growth rate (Eq. 16) esti-mated at R = -1 has been modified by expressing
d0 in terms of crack depth;
ii) For the initial defects: initial defect di was calcu-lated from the LEVD distribution as the defect size
with T = 1000;
iii) The final crack size at failure was assumed to be50 % of the wire diameter;
The predicted S–N diagram for the P2 wires is shown in Fig. 11. It can be seen that predictions are very close to experimental data. Similar good predictions were also ob-tained for the other wires.
Conclusions
In this work, results and analysis of RBT fatigue testing on300-lm diameter superelastic NiTi wires obtained from five different processes are presented and discussed. Re-sults of the research can be summarized as follows:
• Cycles to failure of about 1500 samples from five
materials were recorded for several deformation levels
and a descriptive model of e–N behavior was utilized tocompare the materials. A consistent bilinear description
of the fatigue diagrams both in the finite life and fatigue
limit region was given.
Fig. 10 The estimated Kitagawa diagram at R = -1 for NiTi wires compared with experimental data: a comparison with P4 data at the fatigue limit (run-out wires have been re-tested at higher strain amplitudes); b comparison with broken wires of the other batches (Color figure online)
in Fig. 10b, where it is possible to also see that the model conservatively predicts the lower bound of the failures for the other wire batches. In the same graph, it can be seen that the lower bound limit for fatigue failure by Robertson & Ritchie is very conservative with respect to actual fail-ures in the fatigue limit region.
Life Prediction
The relationship da/dN-DK can be also integrated in order to estimate fatigue life. As for the SIF, it is reasonable to assume that the cracks propagate with a nearly semi-cir-cular shape, and therefore the SIF solution at the crack tip, for crack propagation in the wires subjected to rotating bending, was expressed as follows:
Fig. 11 Conservative life prediction for P2 wires considering theinitial defect with return period T = 1000
• Fracture surfaces of failed wires were inspected by
FESEM and inclusions at the crack nucleation site
measured, classified, and analyzed with the concepts of‘statistics of extremes.’ These extreme inclusions were
successfully correlated to the lower bound of strains at
fatigue limit. Wires characterized by LEVD distribu-tions predicting smaller inclusions provide better
fatigue performance.
• Apparently, not the same correlation between maximuminclusions size and fatigue life can be found by analyzing
the longitudinal metallographic samples as prescribed by
ASTM F2063. The empirical correlation between lowerbound of fatigue limit and extreme inclusions was
confirmed by a fatigue strength prediction based on the
El-Haddad model, which is a conservative estimate offatigue strength for the different wire batches.
• Finally, a fatigue life prediction model was proposed.
The relationship between da/dN-DK has been inte-grated for estimating the fatigue life. Results show a
good agreement between the experimental data and the
predicted fatigue lives.
Additional research is in progress to extend the statistical
data presented in this work and further investigate fatigue
behavior in Nitinol. Moreover, since the extreme inclusionswere shown to be strongly correlated with fatigue perfor-
mance, actions have been undertaken for the application ofextreme value inclusion rating to NiTi SMA wires.
References
1. Melton N, Mercier O (1979) Fatigue of NiTi thermoelasticmartensites. Acta Metall 27:137–144
2. Adler PH, Allen J, Lessar J, Francis R (2007) Martensite trans-formations and fatigue behavior of nitinol. J ASTM Int 4:3–16
3. Pelton AR (2011) Nitinol fatigue: a review of microstructures andmechanisms. JMEPEG 20:613–617
4. Reinoehl M, Bradley D, Bouthot R, Proft J (2000) The influenceof melt practice on final fatigue properties of superelastic NiTiwires. In SMST-2000: Proceedings of the International Confer-ence on Shape Memory and Superelastic Technologies,pp 397–403
5. Sawaguchi T, Kaustrater G, Yawny A, Wagner M, Eggler G(2003) Crack initiation and propagation in 50.9 at. pct Ni-Tipseudoelastic shape memory wires in bending-rotation fatigue.Metall Mater Trans A 34A:2847–2860
6. Wong S, Lin ZC, Tahran A, Boylan J, Pike K, Kramer-Brown P(2009) An investigation of factors impacting nitinol wire fatiguelife. J ASTM Int 6:99–107
7. Schaffer JE, Plumley DL (2009) Fatigue performance of nitinolround wire with varying cold work reductions. J Mater EngPerform 18:563–569
8. Rahim M et al (2013) Impurity levels and fatigue lives of pseu-doelastic NiTi shapememory alloys. ActaMater 61(10):3667–3686
9. Steegmuller R et al (2014) Analysis of new nitinol ingot qualities.J Mater Eng Perform 23:2450–2456
10. Launey M et al (2014) Influence of microstructural purity on thebending fatigue behavior of VAR-melted superelastic nitinol.J Mech Behav Biomed Mater 34:181–186
11. Standard specification for wrought nickel-titanium shape memoryalloys for medical devices and surgical implants, ASTM F2063-12, 2012
12. Standard practice for extreme value analysis of nonmetallic in-clusions in steel and other microstructural features, ASTME2283-08, 2014
13. Murakami Y (2002) Metal fatigue: effect of small defects andnonmetallic inclusions. Elsevier, Oxford
14. Standard test method for transformation temperature of nickel-titanium alloys by thermal analysis, ASTM F2004-05, 2010
15. Standard test method for determination of transformation tem-perature of nickel-titanium shape memory alloys by bend and freerecovery, ASTM 2082-03, 2003
16. Standard test method for tension testing of nickel-titanium su-perelastic materials, ASTM F2516-14, 2014
17. Sczerzenie F, Vergani G, Belden C (2012) The measurement oftotal inclusion content in nickel-titanium alloys. J Mater EngPerform 21:2578–2586
18. Spindel JE, Haibach E (1979) The method of maximum likeli-hood applied to the statistical analysis of fatigue data. Int J Fa-tigue 1:81–88
19. Standard practice for statistical Analysis of linear or linearizedstress-life (S-N) and strain-life (e-N) fatigue data, ASTM E739-10, 2010
20. Nelson W (1982) Applied life data analysis. Wiley, New York21. Murakami Y, Endo M (1994) Effect of defects, inclusions, and
inhomogeneities on fatigue strength. Int J Fatigue 16:163–18222. Murakami Y, Toryiama T, Coudert EM (1994) Instructions for a
new method of inclusion rating and correlation with the fatiguelimit. J Test Eval 22:318–326
23. Murakami Y, Beretta S (1999) Small defects and inhomo-geneities in fatigue strength: experiments, models and statisticalimplications. Extremes 2:123–147
24. Coles S (2001) An introduction to statistical modeling of extremevalues. Springer, London
25. Beretta S, Murakami Y (1998) Statistical analysis of defect forfatigue strength prediction and quality control of materials. Fa-tigue Fract Eng Mater Struct 21:1049–1065
26. Murakami Y, Endo M (1986) Effect of hardness and crack ge-ometries onDKth of small cracks emanating from small defects, In:The Behavior of Short Fatigue Cracks, EGF Pub. 1, pp 275–293
27. Robertson SW, Ritchie RO (2007) A fracture-mechanics-basedapproach to fracture control in biomedical devices manufacturedfrom superelastic nitinol tube. J Biomed Mater Res—Part B 84:26–33
28. El-Haddad MH, Smith KN, Topper TH (1979) Fatigue crackpropagation of short cracks. J Eng Mater Tech 101:42–46
29. Beretta S, Ghidini A, Lombardo F (2005) Fracture mechanics andscale effects in the fatigue of railway axles. Eng Fract Mech72:195–208
30. Robertson SW, Stanliewicz J, Gong XY, Ritchie RO (2006) InMertmann M (ed) SMST 2003: Proceedings of the InternationalConference on shape memory and superelastic technologies,Baden-Baden, Germany, ASM Intl., Materials Park, OH, 2006,pp 79–88
31. Schijve J (2001) Fatigue of structures and materials. KluwerAcademic Publishers, Dordrecht
32. Fatigue crack growth computer program NASGRO version 3.0—Reference Manual. Rapp. Tech. JSC-22267, NASA, 2001
33. Carpinteri A (1994) Propagation of surface cracks under cyclicloading. Handbook of fatigue crack propagation in metallicstructures. Elsevier, Amsterdam, pp 653–705