Multivariate Regression Analysis of the NiTi Alloys' Surface ...
19
Citation: Kovaˇ c, N.; Ivoševi´ c, Š.; Vastag, G.; Majeriˇ c, P.; Rudolf, R. Multivariate Regression Analysis of the NiTi Alloys’ Surface Corrosion Depending on the Measured Oxygen Value: Tests in Three Different Marine Environments. Crystals 2022, 12, 183. https://doi.org/10.3390/cryst 12020183 Academic Editors: Hongbin Bei, Sergio Brutti and Bolv Xiao Received: 14 December 2021 Accepted: 23 January 2022 Published: 26 January 2022 Publisher’s Note: MDPI stays neutral with regard to jurisdictional claims in published maps and institutional affil- iations. Copyright: © 2022 by the authors. Licensee MDPI, Basel, Switzerland. This article is an open access article distributed under the terms and conditions of the Creative Commons Attribution (CC BY) license (https:// creativecommons.org/licenses/by/ 4.0/). crystals Article Multivariate Regression Analysis of the NiTi Alloys’ Surface Corrosion Depending on the Measured Oxygen Value: Tests in Three Different Marine Environments Nataša Kovaˇ c 1, * , Špiro Ivoševi´ c 2 , Gyöngyi Vastag 3 , Peter Majeriˇ c 4 and Rebeka Rudolf 4 1 Faculty of Applied Sciences, University of Donja Gorica, Oktoih 1, 81000 Podgorica, Montenegro 2 Faculty of Maritime Studies Kotor, University of Montenegro, Put I Bokeljske Brigade 44, 85330 Kotor, Montenegro; [email protected] 3 Faculty of Sciences, University of Novi Sad, Trg Dositeja Obradovi´ ca 3, 21000 Novi Sad, Serbia; [email protected] 4 Faculty of Mechanical Engineering, University of Maribor, Smetanova Ulica 17, 2000 Maribor, Slovenia; [email protected] (P.M.); [email protected] (R.R.) * Correspondence: [email protected] Abstract: Actual corrosion experiments are based mainly on methodologies that measure the cor- rosion rate of alloys as a function of the parameters that characterise different external influences and the specific environment in which the alloys are placed. Corrosive processes are viewed as complex stochastic processes described by linear and nonlinear probabilistic models. In contrast to these common ways of analysing corrosive processes, this paper investigates the corrosion process in terms of chemical changes in the alloys’ surface compositions. For this purpose, two NiTi Shape Memory Alloys obtained by different technological production processes were tested, followed by an analysis of the empirical data obtained in a real experiment that included monitoring the corrosion behaviour. Both the analysed alloys were exposed to three different types of marine environment: air, tide, and sea. Data were collected continuously after 6, 12 and 18 months of samples’ exposure to the marine environmental influences. A total of six empirical databases were formed, one for each of the observed NiTi alloys in each of the three observed environments. The empirical databases systematised the data related to the measurements of the surface chemical composition obtained using Energy Dispersive X-ray (EDX) and Focused Ion Beam (FIB) analyses. Statistical analysis was performed to determine the correlation between the corrosion depth and the percentage of oxygen in the sample surfaces as well as to determine the similarities and differences in the corrosive behaviour of the two observed alloys in different marine environments. Keywords: NiTi alloy; corrosion; EDX analysis; oxygen; multivariate linear regression; statistical analysis 1. Introduction Over recent years, the use of smart materials, such as shape-memory materials, has attracted special attention from researchers. In that sense, numerous studies have been performed in laboratories and real conditions to facilitate the application of smart alloys in the maritime industry as well. Since being discovered in 1932 [1], various families of alloys based on Cu, Al, Ni, Ti, and Fe have been used in different industries, such as medicine, transport, robotics, aviation, traffic, etc. [2–4]. Among the many different alloy families, NiTi alloys are the most attractive. William Buehler and Frederick Wang [5] recognised and described the shape memory effect on a nickel-titanium alloy (a NiTi alloy called nitinol) in 1962 [2,6]. Although the cost of NiTi alloys is high and they have very low fabrication, the main advantages of these alloys are in their application at temperatures from -100 ◦ C to 100 ◦ C, hysteresis up to 30 ◦ C, and maximum recovery strain up to 8% [7]. In order to reach the better thermo-mechanical characteristics of the NiTi alloy, different production Crystals 2022, 12, 183. https://doi.org/10.3390/cryst12020183 https://www.mdpi.com/journal/crystals
-
Upload
khangminh22 -
Category
Documents
-
view
4 -
download
0
Transcript of Multivariate Regression Analysis of the NiTi Alloys' Surface ...
�����������������
Citation: Kovac, N.; Ivoševic, Š.;
Vastag, G.; Majeric, P.; Rudolf, R.
Multivariate Regression Analysis of
the NiTi Alloys’ Surface Corrosion
Depending on the Measured Oxygen
Value: Tests in Three Different Marine
Environments. Crystals 2022, 12, 183.
https://doi.org/10.3390/cryst
12020183
Academic Editors: Hongbin Bei,
Sergio Brutti and Bolv Xiao
Received: 14 December 2021
Accepted: 23 January 2022
Published: 26 January 2022
Publisher’s Note: MDPI stays neutral
with regard to jurisdictional claims in
published maps and institutional affil-
iations.
Copyright: © 2022 by the authors.
Licensee MDPI, Basel, Switzerland.
This article is an open access article
distributed under the terms and
conditions of the Creative Commons
Attribution (CC BY) license (https://
creativecommons.org/licenses/by/
4.0/).
crystals
Article
Multivariate Regression Analysis of the NiTi Alloys’ SurfaceCorrosion Depending on the Measured Oxygen Value: Tests inThree Different Marine EnvironmentsNataša Kovac 1,* , Špiro Ivoševic 2 , Gyöngyi Vastag 3, Peter Majeric 4 and Rebeka Rudolf 4
1 Faculty of Applied Sciences, University of Donja Gorica, Oktoih 1, 81000 Podgorica, Montenegro2 Faculty of Maritime Studies Kotor, University of Montenegro, Put I Bokeljske Brigade 44,
85330 Kotor, Montenegro; [email protected] Faculty of Sciences, University of Novi Sad, Trg Dositeja Obradovica 3, 21000 Novi Sad, Serbia;
[email protected] Faculty of Mechanical Engineering, University of Maribor, Smetanova Ulica 17, 2000 Maribor, Slovenia;
[email protected] (P.M.); [email protected] (R.R.)* Correspondence: [email protected]
Abstract: Actual corrosion experiments are based mainly on methodologies that measure the cor-rosion rate of alloys as a function of the parameters that characterise different external influencesand the specific environment in which the alloys are placed. Corrosive processes are viewed ascomplex stochastic processes described by linear and nonlinear probabilistic models. In contrast tothese common ways of analysing corrosive processes, this paper investigates the corrosion processin terms of chemical changes in the alloys’ surface compositions. For this purpose, two NiTi ShapeMemory Alloys obtained by different technological production processes were tested, followed by ananalysis of the empirical data obtained in a real experiment that included monitoring the corrosionbehaviour. Both the analysed alloys were exposed to three different types of marine environment: air,tide, and sea. Data were collected continuously after 6, 12 and 18 months of samples’ exposure tothe marine environmental influences. A total of six empirical databases were formed, one for eachof the observed NiTi alloys in each of the three observed environments. The empirical databasessystematised the data related to the measurements of the surface chemical composition obtainedusing Energy Dispersive X-ray (EDX) and Focused Ion Beam (FIB) analyses. Statistical analysis wasperformed to determine the correlation between the corrosion depth and the percentage of oxygen inthe sample surfaces as well as to determine the similarities and differences in the corrosive behaviourof the two observed alloys in different marine environments.
Keywords: NiTi alloy; corrosion; EDX analysis; oxygen; multivariate linear regression; statistical analysis
1. Introduction
Over recent years, the use of smart materials, such as shape-memory materials, hasattracted special attention from researchers. In that sense, numerous studies have beenperformed in laboratories and real conditions to facilitate the application of smart alloys inthe maritime industry as well.
Since being discovered in 1932 [1], various families of alloys based on Cu, Al, Ni,Ti, and Fe have been used in different industries, such as medicine, transport, robotics,aviation, traffic, etc. [2–4]. Among the many different alloy families, NiTi alloys are themost attractive. William Buehler and Frederick Wang [5] recognised and described theshape memory effect on a nickel-titanium alloy (a NiTi alloy called nitinol) in 1962 [2,6].
Although the cost of NiTi alloys is high and they have very low fabrication, themain advantages of these alloys are in their application at temperatures from −100 ◦C to100 ◦C, hysteresis up to 30 ◦C, and maximum recovery strain up to 8% [7]. In order toreach the better thermo-mechanical characteristics of the NiTi alloy, different production
Crystals 2022, 12, 183. https://doi.org/10.3390/cryst12020183 https://www.mdpi.com/journal/crystals

Crystals 2022, 12, 183 2 of 19
processes can be used such as: casting processes, vacuum induction melting, vacuum arcremelting, electron beam melting, plasma arc melting, and electron beam melting as themost commonly used processes [8].
During the corrosion process, metals are transformed into compounds that are mostoften found in nature. This process takes place as the result of the oxidation of metalsand is reversed from the process of obtaining metals. During corrosion processes, thechemical composition of the material changes and the metal is decomposed completely orincompletely, or a layer of corrosion products is formed on its surface.
Due to the negative influence of the external, complex environmental factors in whichmetallic materials are usually used, there is a physical change in the metal that is normallydetected as a decrease in the thickness and weight of the metal. External factors affectchanges in the chemical structure of metals, which result in the occurrence of oxidation anda decrease in the percentage of less precious metals. By extending the time of exposureto negative environmental influences, corrosion processes intensify and changes in thephysical form and chemical composition of the material become even more pronounced,manifesting as a reduction in volume and damage that destroys the material in depth.
Corrosion processes depend directly on the environment and operating conditions inwhich they are located and perform their functions. The more corrosive the environmentand the more dynamic the processes, the faster the corrosion process will take place.In coastal and marine conditions, on the surface of the sea where the wet-dry cycles ofseawater and atmosphere alternate, the effects of waves contribute to the acceleration ofcorrosive processes. Different chemical, physical, and biological parameters can acceleratethe corrosion process in seawater and a coastal environment. Furthermore, humidity andair temperatures, wind and sea temperature, salinity, conductivity, and pressure are themost dominant influences that determine the course of corrosion processes [4].
Corrosion is an electrochemical process that occurs on metallic materials in differentenvironments. As a consequence of the corrosion process, different types of corrosion canoccur such as general, inter-granular, pitting, galvanic, crevice, stress, cavitation corrosion,etc. [5,9]. Each of these forms of the corrosion process takes place by the spatial separation ofthe anode and cathode sites, the presence of oxidants (dissolved oxygen and negative ions),and the salt concentration. In that sense, degradation on the surface of materials caused byelectrochemical corrosion results primarily in the separation of anode oxidation processesof metals from cathode sites (the reduction of dissolved oxygen or other corrosive agents).
Due to the increase in the time of exposure to the environment, the corrosion rate fora longer period of time usually also increases and the weight of the metal decreases. Inprevious research, corrosion processes have been viewed mainly as linear models but also asnonlinear models, in which corrosive processes depend on various factors, in which the timeof exposure to the environment prevails. A linear model was developed in Guedas, Soares,and Garbatov [10], while non-linear models are presented in Yamamoto and Ikegami [11],Paik et al. [12–14], Melchers [15,16], and in the studies of other researchers. As corrosiveprocesses are very complex and are affected by many different factors and parameters ofthe environment in which the metal structures are located, some more modern corrosivemodels consider salinity, pH, temperature and seawater flow, dissolved oxygen content,sulphur pollution, and fouling as model parameters [15,17].
In that sense, this research relies on an experiment in the real conditions of the marineenvironment. The paper analyses the influences of different types of marine environment(the atmosphere, tide, and sea) and the time of exposure on the changes in the chemicalcomposition of two different NiTi alloy surfaces. In relation to the type of environment,the research investigates the dependence of the corrosion depth (expressed in nm of alloywear) on the change in the percentage of oxygen in the alloy during 6, 12, and 18 monthsof exposure.
Crystals 2022, 12, 183 3 of 19
2. Materials and Methods2.1. Materials
The production of NiTi alloys was based on the use of classical vacuum and continuouscasting processes. The nickel (99.99 wt.%) and titanium (99.99 wt.%) were delivered byZlatarna Celje d.o.o., Celje, Slovenia. Two different NiTi alloys were prepared in thisresearch. NiTi (marked as NiTi1) as a cast alloy, was produced by classical casting atT = 1500 ◦C and p = 10−3 mbar, resulting in the formation of an ingot with a diameter of42.3 mm. Another comparable NiTi alloy (marked as NiTi2) was produced by a combinationof vacuum remelting at T = 1500 ◦C and p = 10−3 mbar and the continuous casting method–as described in previous reports [18,19], resulting in the formation of a rod. In total,nine NiTi1 disk samples with a thickness of 3.4 mm (Figure 1a), and nine NiTi2 rod-shaped samples with a diameter of 11.9 mm and a length of 50 mm (Figure 1b) werecut by electro-erosion. Each type of sample had a special shape (hole, notch) and in thisway, it was possible to perform tests due to the attachment of the carrying rope. Thesamples were then mounted in a hot-mounting mass and ground with abrasive paperin grades of 180–4000 on the grinding/polishing machine BUEHLER Automet 250 andEcoMet 250 (Leinfelden-Echterdingen, Germany). A napless cloth and 1µm polishingsuspension were used for polishing the samples. After polishing, the samples were cleanedby ultrasound. This was followed by chemical etching of the polished surface with asolution composed of 3 mL HF, 6 mL HNO3, and 100 mL H2 for NiTi1 105 s, and NiTi2 120 s.The revealed chemically-etched microstructures were observed with a Nikon EPIPHOT300 light microscope (Nikon, Japan) and the characteristic microstructures are shown inFigure 1c,d. Both microstructures are typically dendritic, with primary and secondarydendritic areas. The difference in microstructure is that it is more oriented in the rod samplesmade by continuous solidification, in accordance with the technology of continuous casting,where the formation of the microstructure is most influenced by the cooling rate and otherconditions of solidification.
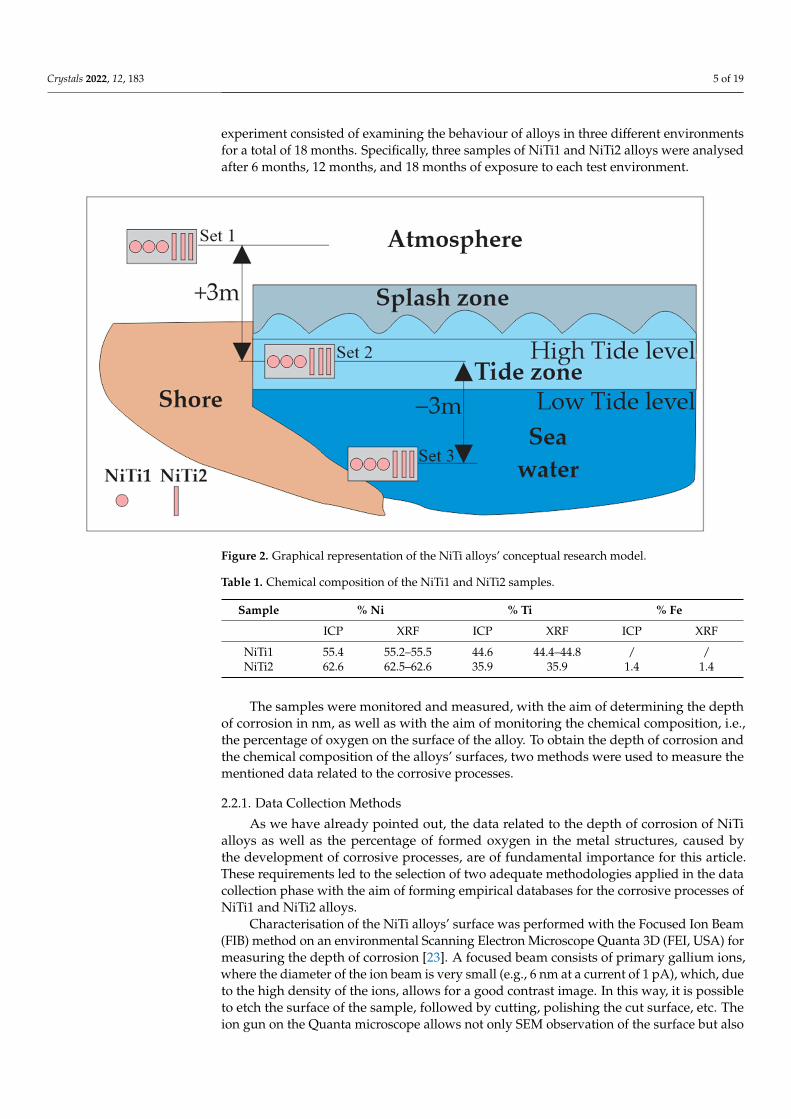
Three samples of each NiTi alloy were located in the atmosphere (close to the coastand three metres above the tide line), three samples were located in the tidal zone, andthe remaining three samples were placed in the sea (at a depth of three metres). This wayof arranging the samples guaranteed that the alloy pieces stayed alone in one zone andthe corrosion of NiTi alloy in the tidal zone and full immersion zone occurred separately.The tidal zone is a splash zone as well and in that zone, samples were exposed to theatmosphere, sea, and waves due to daily changes. More precisely, two sets of samples wereexposed to a fixed environment (only the atmosphere or only seawater) and the third setof samples was exposed to a dynamic, changeable environment (the periodic influence ofthe atmosphere and seawater). In the tidal/splash zone, the difference between tide andebb is above 300 mm per day and the samples were 120 mm long. These dimensions of thesamples were used to ensure that the conditions in which the samples were situated wouldchange twice during each day (the influence of tide and ebb) and to ensure a constantinfluence of the waves. A conceptual research model that follows the research methodologyfrom this paper is presented in Figure 2. In our previous article [20], a similar methodologywas used in the case of a CuAlNi alloy. While conducting the experiment between August2019 and March 2020, the parameters of the seawater salinity were measured under the“Coastal Sea Ecosystem Monitoring Program of Montenegro”, at the Institute of Biology,University of Montenegro. Different values of seawater salinity were measured on thesea’s surface in the tidal zone and at a depth of 3 m where the samples were located. Onthe sea’s surface during 2019, the minimum value of salinity was measured at 14.0 (‰)(December), the maximum value was 39.00 (‰) (September), while the average value was30.33 (‰). In the sea at a depth of 3 m, the minimum value of salinity was measured at27.6 (‰) (December), the maximum value was 39.40 (‰) (August), while the average valuewas 36.68 (‰).
Crystals 2022, 12, 183 4 of 19
Crystals 2022, 12, 183 3 of 19
wear) on the change in the percentage of oxygen in the alloy during 6, 12, and 18 months
of exposure.
2. Materials and Methods
2.1. Materials
The production of NiTi alloys was based on the use of classical vacuum and contin‐
uous casting processes. The nickel (99.99 wt.%) and titanium (99.99 wt.%) were delivered
by Zlatarna Celje d.o.o., Celje, Slovenia. Two different NiTi alloys were prepared in this
research. NiTi (marked as NiTi1) as a cast alloy, was produced by classical casting at T =
1500 °C and p = 10−3 mbar, resulting in the formation of an ingot with a diameter of 42.3
mm. Another comparable NiTi alloy (marked as NiTi2) was produced by a combination
of vacuum remelting at T = 1500 °C and p = 10−3 mbar and the continuous casting method–
as described in previous reports [18,19], resulting in the formation of a rod. In total, nine
NiTi1 disk samples with a thickness of 3.4 mm (Figure 1a), and nine NiTi2 rod‐shaped
samples with a diameter of 11.9 mm and a length of 50 mm (Figure 1b) were cut by electro‐
erosion. Each type of sample had a special shape (hole, notch) and in this way, it was
possible to perform tests due to the attachment of the carrying rope. The samples were
then mounted in a hot‐mounting mass and ground with abrasive paper in grades of 180–
4000 on the grinding/polishing machine BUEHLER Automet 250 and EcoMet 250 (Lein‐
felden‐Echterdingen, Germany). A napless cloth and 1μm polishing suspension were
used for polishing the samples. After polishing, the samples were cleaned by ultrasound.
This was followed by chemical etching of the polished surface with a solution composed
of 3 mL HF, 6 mL HNO3, and 100 mL H2 for NiTi1 105 s, and NiTi2 120 s. The revealed
chemically‐etched microstructures were observed with a Nikon EPIPHOT 300 light mi‐
croscope (Nikon, Japan) and the characteristic microstructures are shown in Figure 1c,d.
Both microstructures are typically dendritic, with primary and secondary dendritic areas.
The difference in microstructure is that it is more oriented in the rod samples made by
continuous solidification, in accordance with the technology of continuous casting, where
the formation of the microstructure is most influenced by the cooling rate and other con‐
ditions of solidification.
(a) (b)
Crystals 2022, 12, 183 4 of 19
(c) (d)
Figure 1. A sample of the NiTi1 alloy disk (a), NiTi2 rod alloy (b), the optical microstructure of the
NiTi1 alloy (c), and NiTi2 alloy (d).
Three samples of each NiTi alloy were located in the atmosphere (close to the coast
and three metres above the tide line), three samples were located in the tidal zone, and
the remaining three samples were placed in the sea (at a depth of three metres). This way
of arranging the samples guaranteed that the alloy pieces stayed alone in one zone and
the corrosion of NiTi alloy in the tidal zone and full immersion zone occurred separately.
The tidal zone is a splash zone as well and in that zone, samples were exposed to the
atmosphere, sea, and waves due to daily changes. More precisely, two sets of samples
were exposed to a fixed environment (only the atmosphere or only seawater) and the third
set of samples was exposed to a dynamic, changeable environment (the periodic influence
of the atmosphere and seawater). In the tidal/splash zone, the difference between tide and
ebb is above 300 mm per day and the samples were 120 mm long. These dimensions of
the samples were used to ensure that the conditions in which the samples were situated
would change twice during each day (the influence of tide and ebb) and to ensure a con‐
stant influence of the waves. A conceptual research model that follows the research meth‐
odology from this paper is presented in Figure 2. In our previous article [20], a similar
methodology was used in the case of a CuAlNi alloy. While conducting the experiment
between August 2019 and March 2020, the parameters of the seawater salinity were meas‐
ured under the “Coastal Sea Ecosystem Monitoring Program of Montenegro”, at the In‐
stitute of Biology, University of Montenegro. Different values of seawater salinity were
measured on the sea’s surface in the tidal zone and at a depth of 3 m where the samples
were located. On the sea’s surface during 2019, the minimum value of salinity was meas‐
ured at 14.0 (‰) (December), the maximum value was 39.00 (‰) (September), while the
average value was 30.33 (‰). In the sea at a depth of 3 m, the minimum value of salinity
was measured at 27.6 (‰) (December), the maximum value was 39.40 (‰) (August), while
the average value was 36.68 (‰).
Figure 1. A sample of the NiTi1 alloy disk (a), NiTi2 rod alloy (b), the optical microstructure of theNiTi1 alloy (c), and NiTi2 alloy (d).
Metallographic observations and microstructure observations of all NiTi1 [21] andNiTi2 samples were conducted in order to monitor the occurrence of the corrosion processand prepare the samples for testing [22]
To determine the changes in the chemical composition of the surfaces that had beenexposed to different environments, before the start of the experiment, preliminary analyseswere performed using Inductively Coupled Plasma (ICP) and X-ray Fluorescence (XRF).The measured elements (such as chemical composition) are shown in Table 1 [22].
2.2. Methods
Because different environments have different effects on the corrosion process, thisexperiment is based on the study of three different environmental influences on the consid-ered NiTi alloys. The two considered environments are static and represent the atmosphereand the sea. The third marine environment, the tide, is dynamic because it is characterisedby changes in the sea’s surface, where wet and dry sea cycles alternate during the day. The
Crystals 2022, 12, 183 5 of 19
experiment consisted of examining the behaviour of alloys in three different environmentsfor a total of 18 months. Specifically, three samples of NiTi1 and NiTi2 alloys were analysedafter 6 months, 12 months, and 18 months of exposure to each test environment.
Crystals 2022, 12, 183 5 of 19
Figure 2. Graphical representation of the NiTi alloys’ conceptual research model.
Metallographic observations and microstructure observations of all NiTi1 [21] and
NiTi2 samples were conducted in order to monitor the occurrence of the corrosion process
and prepare the samples for testing [22]
To determine the changes in the chemical composition of the surfaces that had been
exposed to different environments, before the start of the experiment, preliminary anal‐
yses were performed using Inductively Coupled Plasma (ICP) and X‐ray Fluorescence
(XRF). The measured elements (such as chemical composition) are shown in Table 1 [22].
Table 1. Chemical composition of the NiTi1 and NiTi2 samples.
Sample % Ni % Ti % Fe
ICP XRF ICP XRF ICP XRF
NiTi1 55.4 55.2–55.5 44.6 44.4–44.8 / /
NiTi2 62.6 62.5–62.6 35.9 35.9 1.4 1.4
2.2. Methods
Because different environments have different effects on the corrosion process, this
experiment is based on the study of three different environmental influences on the con‐
sidered NiTi alloys. The two considered environments are static and represent the atmos‐
phere and the sea. The third marine environment, the tide, is dynamic because it is char‐
acterised by changes in the sea’s surface, where wet and dry sea cycles alternate during
the day. The experiment consisted of examining the behaviour of alloys in three different
environments for a total of 18 months. Specifically, three samples of NiTi1 and NiTi2 al‐
loys were analysed after 6 months, 12 months, and 18 months of exposure to each test
environment.
The samples were monitored and measured, with the aim of determining the depth
of corrosion in nm, as well as with the aim of monitoring the chemical composition, i.e.,
the percentage of oxygen on the surface of the alloy. To obtain the depth of corrosion and
the chemical composition of the alloys’ surfaces, two methods were used to measure the
mentioned data related to the corrosive processes.
2.2.1. Data Collection Methods
As we have already pointed out, the data related to the depth of corrosion of NiTi
alloys as well as the percentage of formed oxygen in the metal structures, caused by the
Figure 2. Graphical representation of the NiTi alloys’ conceptual research model.
Table 1. Chemical composition of the NiTi1 and NiTi2 samples.
Sample % Ni % Ti % Fe
ICP XRF ICP XRF ICP XRF
NiTi1 55.4 55.2–55.5 44.6 44.4–44.8 / /NiTi2 62.6 62.5–62.6 35.9 35.9 1.4 1.4
The samples were monitored and measured, with the aim of determining the depthof corrosion in nm, as well as with the aim of monitoring the chemical composition, i.e.,the percentage of oxygen on the surface of the alloy. To obtain the depth of corrosion andthe chemical composition of the alloys’ surfaces, two methods were used to measure thementioned data related to the corrosive processes.
2.2.1. Data Collection Methods
As we have already pointed out, the data related to the depth of corrosion of NiTialloys as well as the percentage of formed oxygen in the metal structures, caused bythe development of corrosive processes, are of fundamental importance for this article.These requirements led to the selection of two adequate methodologies applied in the datacollection phase with the aim of forming empirical databases for the corrosive processes ofNiTi1 and NiTi2 alloys.
Characterisation of the NiTi alloys’ surface was performed with the Focused Ion Beam(FIB) method on an environmental Scanning Electron Microscope Quanta 3D (FEI, USA) formeasuring the depth of corrosion [23]. A focused beam consists of primary gallium ions,where the diameter of the ion beam is very small (e.g., 6 nm at a current of 1 pA), which, dueto the high density of the ions, allows for a good contrast image. In this way, it is possibleto etch the surface of the sample, followed by cutting, polishing the cut surface, etc. Theion gun on the Quanta microscope allows not only SEM observation of the surface but also
Crystals 2022, 12, 183 6 of 19
the surface treatment and analysis of the microstructure below the surface. Based on that,the FIB method was used to determine the depth of corrosion (in nm) on the surface, andto scan the area below the surface of the NiTi1 and NiTi2 alloys after 6, 12 and 18 monthsof exposure to each of the three observed seawater environments.
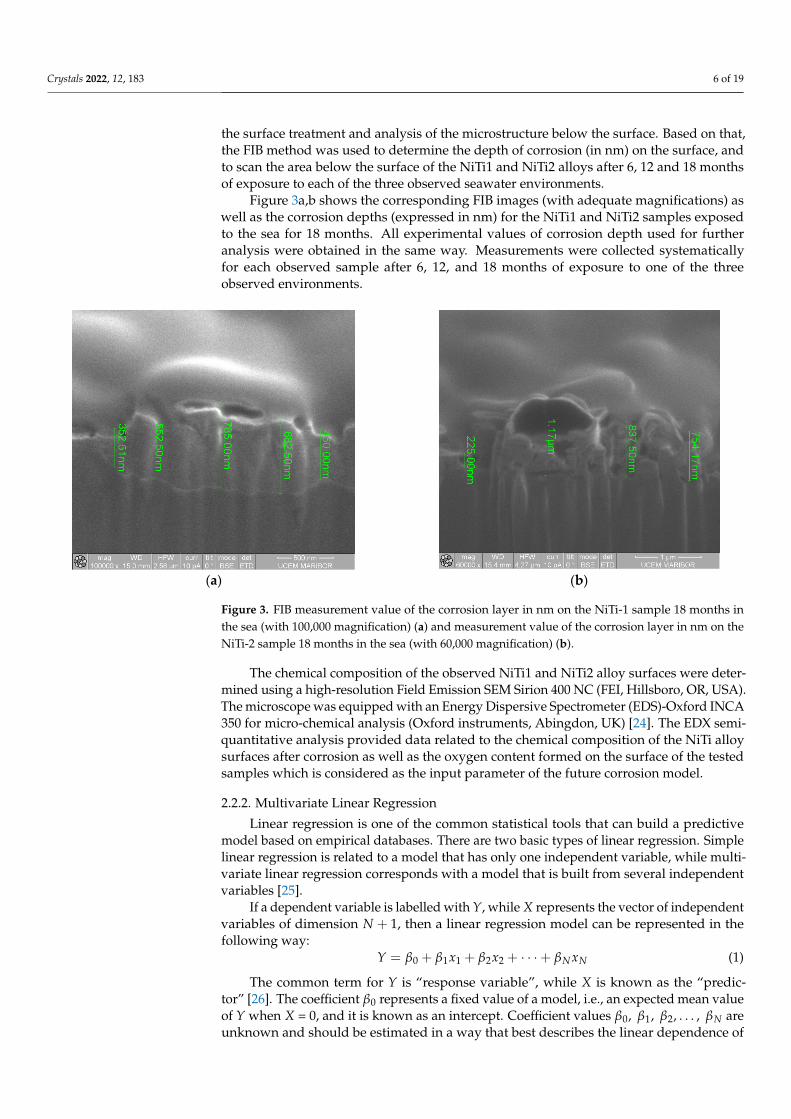
Figure 3a,b shows the corresponding FIB images (with adequate magnifications) aswell as the corrosion depths (expressed in nm) for the NiTi1 and NiTi2 samples exposedto the sea for 18 months. All experimental values of corrosion depth used for furtheranalysis were obtained in the same way. Measurements were collected systematicallyfor each observed sample after 6, 12, and 18 months of exposure to one of the threeobserved environments.
Crystals 2022, 12, 183 6 of 19
development of corrosive processes, are of fundamental importance for this article. These
requirements led to the selection of two adequate methodologies applied in the data col‐
lection phase with the aim of forming empirical databases for the corrosive processes of
NiTi1 and NiTi2 alloys.
Characterisation of the NiTi alloys’ surface was performed with the Focused Ion
Beam (FIB) method on an environmental Scanning Electron Microscope Quanta 3D (FEI,
USA) for measuring the depth of corrosion [23]. A focused beam consists of primary gal‐
lium ions, where the diameter of the ion beam is very small (e.g., 6 nm at a current of 1
pA), which, due to the high density of the ions, allows for a good contrast image. In this
way, it is possible to etch the surface of the sample, followed by cutting, polishing the cut
surface, etc. The ion gun on the Quanta microscope allows not only SEM observation of
the surface but also the surface treatment and analysis of the microstructure below the
surface. Based on that, the FIB method was used to determine the depth of corrosion (in
nm) on the surface, and to scan the area below the surface of the NiTi1 and NiTi2 alloys
after 6, 12 and 18 months of exposure to each of the three observed seawater environ‐
ments.
Figure 3a,b shows the corresponding FIB images (with adequate magnifications) as
well as the corrosion depths (expressed in nm) for the NiTi1 and NiTi2 samples exposed
to the sea for 18 months. All experimental values of corrosion depth used for further anal‐
ysis were obtained in the same way. Measurements were collected systematically for each
observed sample after 6, 12, and 18 months of exposure to one of the three observed envi‐
ronments.
(a) (b)
Figure 3. FIB measurement value of the corrosion layer in nm on the NiTi‐1 sample 18 months in
the sea (with 100,000 magnification) (a) and measurement value of the corrosion layer in nm on the
NiTi‐2 sample 18 months in the sea (with 60,000 magnification) (b).
The chemical composition of the observed NiTi1 and NiTi2 alloy surfaces were de‐
termined using a high‐resolution Field Emission SEM Sirion 400 NC (FEI, Hillsboro, OR,
USA). The microscope was equipped with an Energy Dispersive Spectrometer (EDS)‐Ox‐
ford INCA 350 for micro‐chemical analysis (Oxford instruments, Abingdon, UK) [24]. The
EDX semi‐quantitative analysis provided data related to the chemical composition of the
NiTi alloy surfaces after corrosion as well as the oxygen content formed on the surface of
the tested samples which is considered as the input parameter of the future corrosion
model.
2.2.2. Multivariate Linear Regression
Figure 3. FIB measurement value of the corrosion layer in nm on the NiTi-1 sample 18 months inthe sea (with 100,000 magnification) (a) and measurement value of the corrosion layer in nm on theNiTi-2 sample 18 months in the sea (with 60,000 magnification) (b).
The chemical composition of the observed NiTi1 and NiTi2 alloy surfaces were deter-mined using a high-resolution Field Emission SEM Sirion 400 NC (FEI, Hillsboro, OR, USA).The microscope was equipped with an Energy Dispersive Spectrometer (EDS)-Oxford INCA350 for micro-chemical analysis (Oxford instruments, Abingdon, UK) [24]. The EDX semi-quantitative analysis provided data related to the chemical composition of the NiTi alloysurfaces after corrosion as well as the oxygen content formed on the surface of the testedsamples which is considered as the input parameter of the future corrosion model.
2.2.2. Multivariate Linear Regression
Linear regression is one of the common statistical tools that can build a predictivemodel based on empirical databases. There are two basic types of linear regression. Simplelinear regression is related to a model that has only one independent variable, while multi-variate linear regression corresponds with a model that is built from several independentvariables [25].
If a dependent variable is labelled with Y, while X represents the vector of independentvariables of dimension N + 1, then a linear regression model can be represented in thefollowing way:
Y = β0 + β1x1 + β2x2 + · · ·+ βN xN (1)
The common term for Y is “response variable”, while X is known as the “predic-tor” [26]. The coefficient β0 represents a fixed value of a model, i.e., an expected mean valueof Y when X = 0, and it is known as an intercept. Coefficient values β0, β1, β2, . . . , βN areunknown and should be estimated in a way that best describes the linear dependence of
Crystals 2022, 12, 183 7 of 19
Y on X. Once the model’s parameters are determined, the model can be used further topredict the value of Y for a given value of the vector X.
Preliminary research has shown that simple linear regression does not provide ade-quate precision if used as a tool to predict the corrosion depth of NiTi alloys. Given thecomplexity of the corrosive processes, especially when samples are exposed to the marineenvironment, it becomes clear that it is necessary to observe several factors that affect thedevelopment of corrosion on the surface of alloys simultaneously. Therefore, the researchpresented in this paper is based on the application of multivariate linear regression tocharacterise the depth of corrosive damage to the observed samples of NiTi1 and NiTi2alloys. The depth of corrosion is observed as a function of the exposure time of the ob-served marine environment influence and the measured amount of formed oxygen onmetal structures caused by the development of corrosive processes. More precisely, in thestatistical analysis, the data detected by EDX measurements of the chemical structure forNiTi1 and NiTi2 alloys were paired with the data of their FIB measurements related to thecorrosion depth development on the samples’ surfaces. This methodological approachallowed the corrosion depth to be considered as a dependent variable in the regressionanalysis, while the predictor variables were the exposure time of the seawater environmentinfluence and the amount of oxygen formed on the samples’ surfaces.
3. Results
Statistical analysis was performed with the aim of establishing the dependence be-tween the corrosion depth of the NiTi1 and NiTi2 alloys and the observed percentage ofoxygen formed on the surfaces of the metal samples. Multivariate linear regression wasused as a tool to build a statistical model that will predict the corrosion depth of the NiTi1and NiTi2 alloys (measured in nm) accurately in three types of the marine environment as afunction of the environmental exposure time and oxygen percentage formed on the surfacesof the samples. Oxygen amounts expressed as a percentage, together with the exposuretime expressed in months were considered explanatory variables in each of the six formedregression models, while the corrosion depth played the role of the response variable.
The basic descriptive statistics, i.e., Mean, Standard Deviation (StD), minimum (Min),first quartile (Q1), median, third quartile (Q3), and maximum (Max), related to the formedempirical database for the NiTi1 samples are shown in Table 2. Table 2 shows the numberof measured points on the samples (n), the basic statistical values related to the percentageof oxygen, and the corresponding corrosion depth (expressed in nm) statistical valuesobserved on the NiTi1 alloy for each considered environment. Table 3 has an identicalstructure but shows the descriptive statistics of the formed empirical databases for NiTi2alloy corrosive processes.
Table 2. The descriptive statistics of input data related to the NiTi1 alloy.
Environment Variable n Mean StD Min Q1 Median Q3 Max
airoxygen 31 11.41 10.15 0.00 2.02 8.28 19.34 30.00
corr. depth 31 43.36 8.84 30.00 37.50 40.00 50.00 58.33
tideoxygen 41 29.90 8.68 9.14 24.77 28.57 35.61 48.41
corr. depth 41 38.78 10.86 22.50 30.00 37.50 45.83 66.67
sea oxygen 49 26.67 13.16 0.00 15.04 29.82 37.63 52.48corr. depth 49 281.3 158.5 41.7 168.8 308.3 414.6 575.0
The Mean values of the measured oxygen concentration for the NiTi1 alloy show thatthe lowest percentage of developed oxygen was in the case of air environments, whileapproximately the same percentage of oxygen was present on the alloy surface in both thetidal and sea environments. The scattering of the percentage of oxygen was approximatelythe same in the air and sea environments while slightly less in the tidal environment. Thedeveloped corrosive processes had similar values in the air and tidal environments, while
Crystals 2022, 12, 183 8 of 19
in the marine environment there was a significantly higher value of the measured depthof corrosion. The scatter values of corrosion depth were similar for air and tide, but thevalues for the sea environment were significantly higher.
Table 3. The descriptive statistics of input data related to the NiTi2 alloy.
Environment Variable n Mean StD Min Q1 Median Q3 Max
airoxygen 84 19.73 7.812 4.110 15.60 20.63 23.80 38.97
corr. depth 84 54.89 15.44 29.17 45.21 55.00 62.50 95.83
tideoxygen 71 41.05 26.80 5.00 16.92 38.26 56.80 141.67
corr. depth 71 156.5 147.1 37.5 47.5 72.5 258.3 708.3
sea oxygen 64 57.52 41.28 0.00 30.86 42.09 72.08 171.7corr. depth 64 286.2 202.7 70.8 139.4 215.8 376.0 858.3
From Table 3, in the case of the NiTi2 alloy, it can be seen that the average values of thepercentage of oxygen were the lowest for the air and that they showed growth when thetidal and sea environments were observed. The increasing trend of the measured corrosiondepth average value was the same; it was the smallest for the air and then increased inthe tidal and sea environments, but the average depth of corrosion was three times higherin the tidal environment, and five times higher in the marine environment. The valuesof the Standard Deviation followed these growth trends from the air environment andtidal environment to the highest values for the sea environment, both from the point ofview of the observed oxygen values and the observed corrosion depth values. The largestscatter values were observed for the depth of corrosion in the tidal environment and thesea environment.
When comparing the mean oxygen percentage of the two alloys, it was noticed thatthe measured values for the NiTi2 alloy were higher in all three environments than themeasured values of oxygen for the NiTi1 alloy. Compared to the detected mean corrosiondepth, NiTi1 and NiTi2 alloys showed similar properties in the air and sea environmentsbut differed significantly in the tidal environment. The average value of the corrosiondepth was four times higher for the NiTi2 alloy compared to the NiTi1 alloy for the tidalenvironment. The variations in the values of the average percentage of oxygen, as wellas the average measured depth of corrosion in the air environment, were similar forboth alloys, but differences were observed for the tidal environment as well as the seaenvironment. In both environments and for both measured Mean values of the observedvalues, the NiTi2 alloy showed significantly higher scatter values.
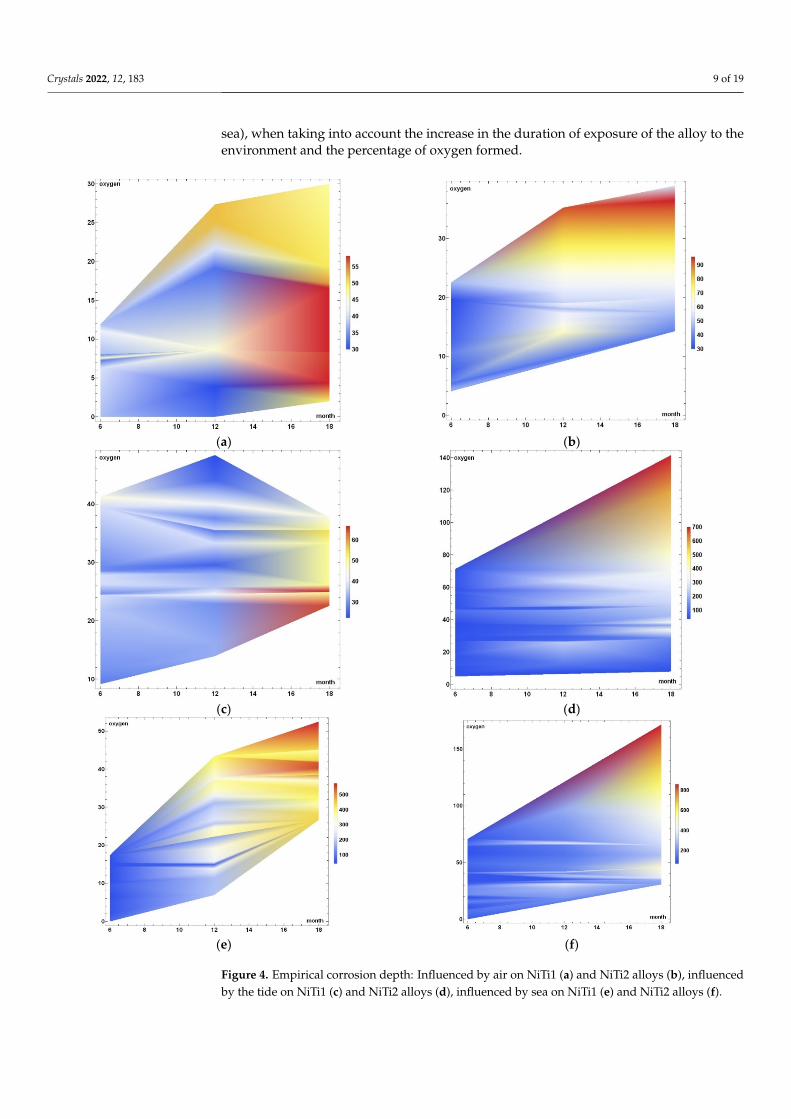
Figure 4 shows the dependence of the corrosion depth of the NiTi1 and NiTi2 alloys onoxygen percentage and the time of exposure to the environment influence graphically. Moreprecisely, Figure 4 visualises the empirical databases formed for the alloys NiTi1 and NiTi2.The data, as well as the belonging graphical representations, are grouped with respect tothe three types of marine environment. The corrosion depth values are shown on a colourscale, whereby the lowest values are blue, while the highest values are shown in red. In allimages, the corrosion rate is shown as a function of two independent variables (oxygenpercentage and exposure time expressed in months) that are the basis for the followingregression models.
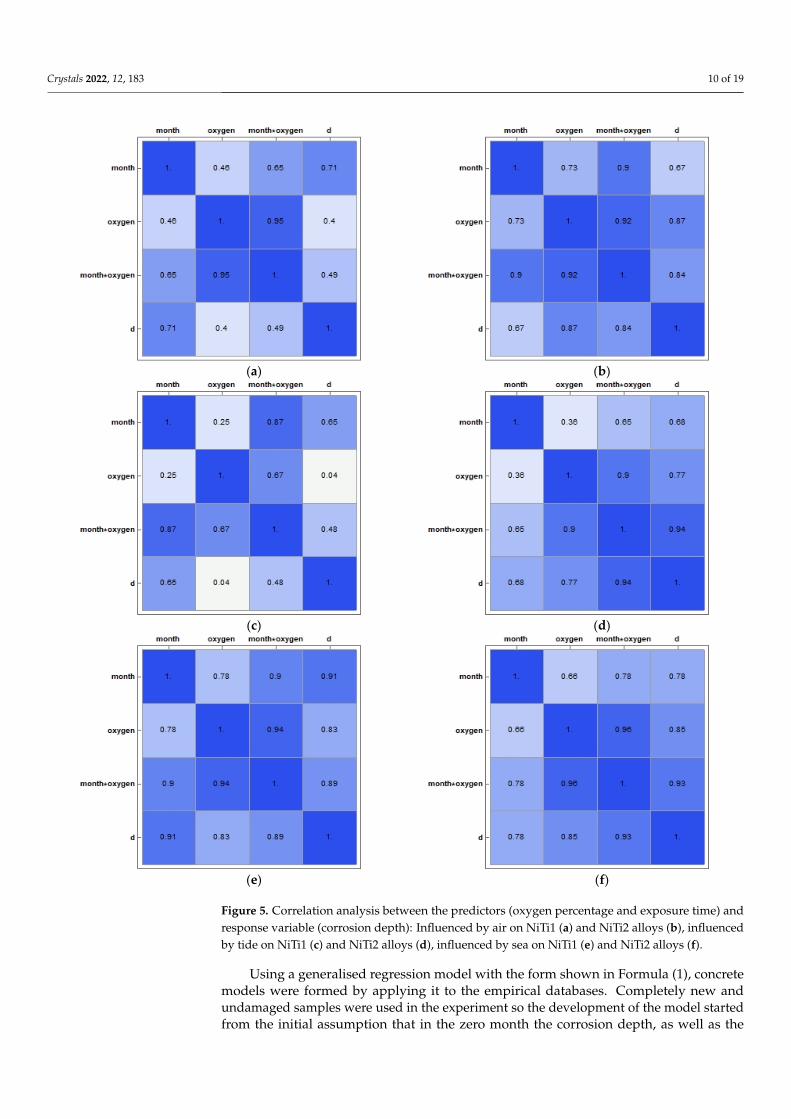
Figure 5 shows the results of a correlation analysis between the corrosion depth and in-dependent variables. The correlation analysis is presented in the form of a correlation matrixfor both observed alloys in each of the three seawater environments. Pearson’s correlationcoefficient [27] is used in this paper as one of the most common correlation coefficients.
According to Figure 5a–f, in the three types of the environment examined and forboth alloys, only positive correlation effects occurred. In the correlation matrices shownin Figure 5, the degrees of correlation are further highlighted by the intensity of the bluecolour assigned to each cell of the matrix. As expected, both alloys showed tendencies toincrease the depth of corrosion in all observed types of the marine environment (air, tide,
Crystals 2022, 12, 183 9 of 19
sea), when taking into account the increase in the duration of exposure of the alloy to theenvironment and the percentage of oxygen formed.
Crystals 2022, 12, 183 9 of 19
and NiTi2. The data, as well as the belonging graphical representations, are grouped with
respect to the three types of marine environment. The corrosion depth values are shown
on a colour scale, whereby the lowest values are blue, while the highest values are shown
in red. In all images, the corrosion rate is shown as a function of two independent varia‐
bles (oxygen percentage and exposure time expressed in months) that are the basis for the
following regression models.
(a) (b)
(c) (d)
(e) (f)
Figure 4. Empirical corrosion depth: Influenced by air on NiTi1 (a) and NiTi2 alloys (b), influencedby the tide on NiTi1 (c) and NiTi2 alloys (d), influenced by sea on NiTi1 (e) and NiTi2 alloys (f).
Crystals 2022, 12, 183 10 of 19
Crystals 2022, 12, 183 10 of 19
Figure 4. Empirical corrosion depth: Influenced by air on NiTi1 (a) and NiTi2 alloys (b), influenced
by the tide on NiTi1 (c) and NiTi2 alloys (d), influenced by sea on NiTi1 (e) and NiTi2 alloys (f).
Figure 5 shows the results of a correlation analysis between the corrosion depth and
independent variables. The correlation analysis is presented in the form of a correlation
matrix for both observed alloys in each of the three seawater environments. Pearson’s
correlation coefficient [27] is used in this paper as one of the most common correlation
coefficients.
(a) (b)
(c) (d)
(e) (f)
Figure 5. Correlation analysis between the predictors (oxygen percentage and exposure time) andresponse variable (corrosion depth): Influenced by air on NiTi1 (a) and NiTi2 alloys (b), influencedby tide on NiTi1 (c) and NiTi2 alloys (d), influenced by sea on NiTi1 (e) and NiTi2 alloys (f).
Using a generalised regression model with the form shown in Formula (1), concretemodels were formed by applying it to the empirical databases. Completely new andundamaged samples were used in the experiment so the development of the model startedfrom the initial assumption that in the zero month the corrosion depth, as well as the
Crystals 2022, 12, 183 11 of 19
percentage of oxygen, was equal to zero for each sample subjected to the experiment.Therefore, the value of the intercept parameter β0 in the regression model was also set tozero. In the modelling process, the corrosion depth was observed as a dependent quantity.The notations dA
(1), dT(1), and dS
(1), were introduced in order to differentiate the regressionmodels associated with each observed alloy and the seawater environment for the NiTi1alloy. The same notation was used for the NiTi2 alloy, and the obtained regression modelswere noted as notations dA
(2), dT(2), and dS
(2). The independent variables were denotedas x1, x2, and x3, respectively, in each regression model formed. These three variables areexplanatory variables which, in the presented regression models, are respectively associatedwith the time elapsed since the beginning of the experiment, the percentage of oxygenin the alloy, and the simultaneous interaction of oxygen and elapsed time (obtained bymultiplying these two values). The coefficients of the explanatory variables in the regressionmodels are denoted by β1, β2, and β3, respectively. The results of regression analysis forthe NiTi1 alloy are shown in Table 4, while the results of the regression analysis obtainedfor the NiTi2 alloy are presented in Table 5.
Table 4. The regression parameters of the three formed models for NiTi1 corrosion depth in the air,tides, and sea.
Environment Coefficient Estimate Std. Error T-Statistics p-Value
airβ1 3.43 0.23 14.9993 6.534 × 10⁻¹⁵
β2 2.28 0.45 5.05198 0.0000240593β3 −0.158 0.030 −5.31239 0.0000118121
tideβ1 4.01 0.44 9.11348 4.2203 × 10⁻¹¹
β2 0.71 0.12 5.99005 5.87456 × 10⁻⁷
β3 −0.081 0.016 −5.14946 8.31654 × 10⁻⁶
seaβ1 12.1 2.5 4.81956 0.0000160634β2 −0.2 1.7 −0.126129 0.900179β3 0.347 0.095 3.64388 0.000680433
Table 5. The regression parameters of the three formed models for NiTi2 corrosion depth in the air,tides, and sea.
Environment Coefficient Estimate Std. Error T-Statistics p-Value
airβ1 1.9 0.3 6.15705 2.7005 × 10⁻⁸
β2 2.57 0.21 12.129 6.71858 × 10⁻²⁰
β3 −0.072 0.013 −5.36675 7.45103 × 10⁻⁷
tideβ1 2.26 0.82 2.74865 0.00765672β2 −1.32 0.37 −3.52885 0.000753474β3 0.326 0.025 13.2707 1.51324 × 10⁻²⁰
seaβ1 11.3 1.7 6.7345 6.61253 × 10⁻⁹
β2 −0.47 0.64 −0.736475 0.464264β3 0.210 0.035 6.05822 9.32832 × 10⁻⁸
The significance level in this regression analysis was set to 95%, or, more precisely, avalue of 0.05 was taken as the α parameter. Comparing the α parameters and the corre-sponding p-values in Tables 4 and 5, it can be concluded that all three observed independentmodel variables are significant for the air and tidal environments for both observed NiTialloys. The values of the coefficients of the independent variables are shown in the thirdcolumn of Tables 4 and 5.
For both NiTi alloys in the sea environment, it is notable that oxygen does not havea statistically significant effect on the corrosive processes. This indicates the need forfurther study of the corrosive regression model associated with NiTi alloys in a marineenvironment. It is evident that complex corrosive processes in seawater are influenced by
Crystals 2022, 12, 183 12 of 19
many additional factors and it is necessary to perform additional analyses to determinewhich environmental parameters need to be included in regression models.
The resulting linear regression models describing the depth of corrosion for the NiTi1alloy with the coefficients listed in Table 4 are shown in Formulas (2)–(4). Regressionmodels for the corrosion depth of the NiTi1 alloy in air, tide, and sea environments, arepresented respectively.
dA(1) = 3.43x1 + 2.28x2 − 0.158x3 (2)
dT(1) = 4.01x1 + 0.71x2 − 0.081x3 (3)
dS(1) = 12.1x1 − 0.2x2 + 0.347x3 (4)
The regression models for the corrosion depth of the NiTi2 alloy influenced by air, tide,and sea environments are presented in Formulas (5)–(7). These models were obtained byapplying the coefficient values from Table 5 in the general regression model shown in (1).
dA(2) = 1.9x1 + 2.57x2 − 0.072x3 (5)
dT(2) = 2.26x1 − 1.32x2 + 0.326x3 (6)
dS(2) = 11.3x1 − 0.47x2 + 0.210x3 (7)
The coefficient of determination, i.e., R2, was used to estimate the goodness of fit forthe six regression models represented by expressions (2)–(7). The corresponding valuesof R2 for the three formed regression models (dA
(1), dT(1), and dS
(1)) equal 0.9595, 0.9619and 0.9626, respectively. The calculated coefficients of determination for the NiTi2 alloyand corresponding linear regression models in the three observed seawater environments(dA
(2), dT(2), and dS
(2)) are 0.9782, 0.9544 and 0.9556, respectively.As a statistical tool for hypothesis testing, analysis of variance (ANOVA) was used to
check if there was a significant linear relationship [28] between the corrosion depth and thechosen explanatory variables. The obtained linear regression models (2)–(7) were verifiedby an ANOVA test with a 95% confidence level. The ANOVA results for regression models(2)–(4) are summarised in Table 6. The results of hypothesis testing by ANOVA in the caseof the NiTi2 alloy are shown in Table 7. Tables 6 and 7 show the Degrees of Freedom (DF),Adjusted Sums of Squares (AdjSS), and Adjusted Mean Square (AdjMS) for the regressionmodel, error, and the total.
Table 6. The regression analysis of variance for the NiTi1 alloy samples for the three observed typesof marine environment.
Environment Source DF AdjSS AdjMS F-Value p-Value
airRegression 3 58,169.5 19,389.8 221.06 0.000
Error 28 2456.0 87.7Total 31 60,625.5
tideRegression 3 63,852.8 21,284.3 319.80 0.000
Error 38 2529.1 66.6Total 41 66,381.9
seaRegression 3 4,891,817 1,630,606 394.81 0.000
Error 46 189,984 4130Total 49 5,081,800
To determine whether models that do not contain explanatory variables describeempirical data better than the formed regression models [29], a statistical test known asthe F-test was used. From Tables 6 and 7 it is evident that, for both observed NiTi alloysand each observed seawater environment, the formed linear regression models describethe behaviour of the alloys well from the point of view of corrosion depth. More precisely,the models represented by Formulas (2)–(7) can be used to predict future corrosion depth
Crystals 2022, 12, 183 13 of 19
values of NiTi1 and NiTi2 alloys as well as to estimate the corrosion depth of these alloysbased on the known values of the explanatory variables. This conclusion is in full agreementwith the conclusion obtained when observing the previously calculated values of R2.
Table 7. The regression analysis of variance for the NiTi2 alloy samples for the three observed typesof marine environment.
Environment Source DF AdjSS AdjMS F-Value p-Value
airRegression 3 266,918 88,972.8 1209.61 0.000
Error 81 5958 73.6Total 84 272,876
tideRegression 3 3,106,113 1,035,371 474.31 0.000
Error 68 148,438 2183Total 71 3,254,551
seaRegression 3 7,485,870 2,495,290 437.95 0.000
Error 61 347,553 5698Total 64 7,833,424
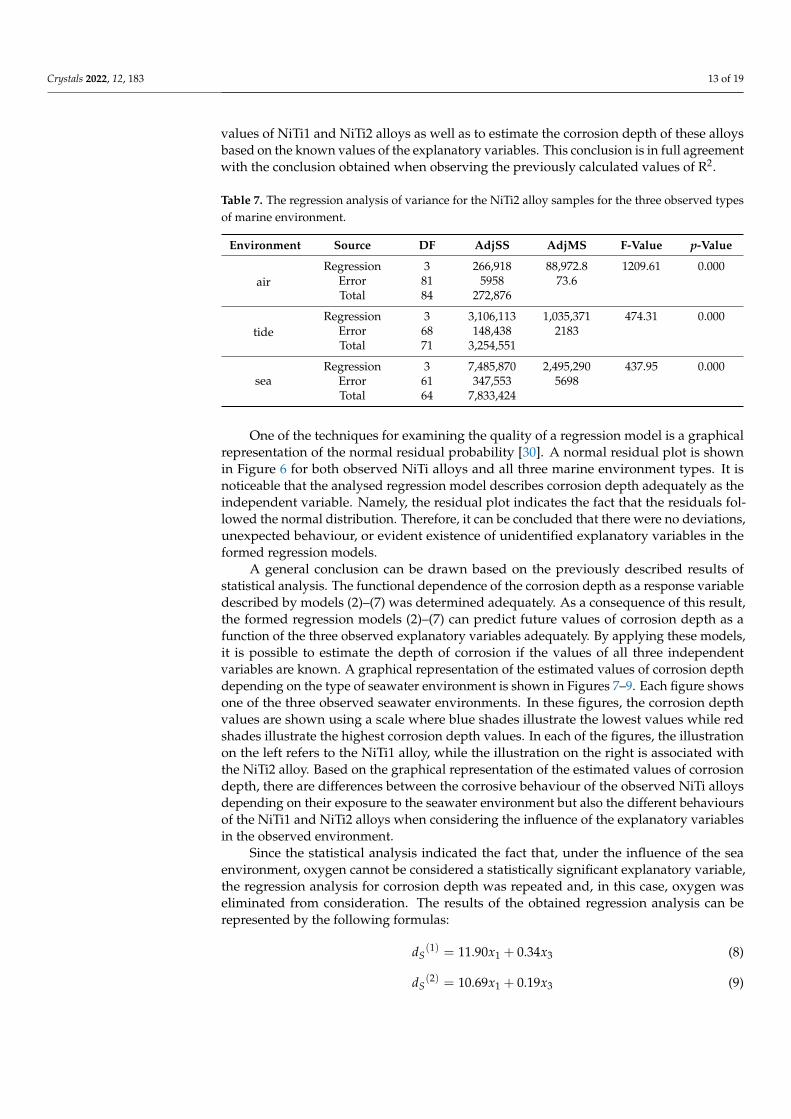
One of the techniques for examining the quality of a regression model is a graphicalrepresentation of the normal residual probability [30]. A normal residual plot is shownin Figure 6 for both observed NiTi alloys and all three marine environment types. It isnoticeable that the analysed regression model describes corrosion depth adequately as theindependent variable. Namely, the residual plot indicates the fact that the residuals fol-lowed the normal distribution. Therefore, it can be concluded that there were no deviations,unexpected behaviour, or evident existence of unidentified explanatory variables in theformed regression models.
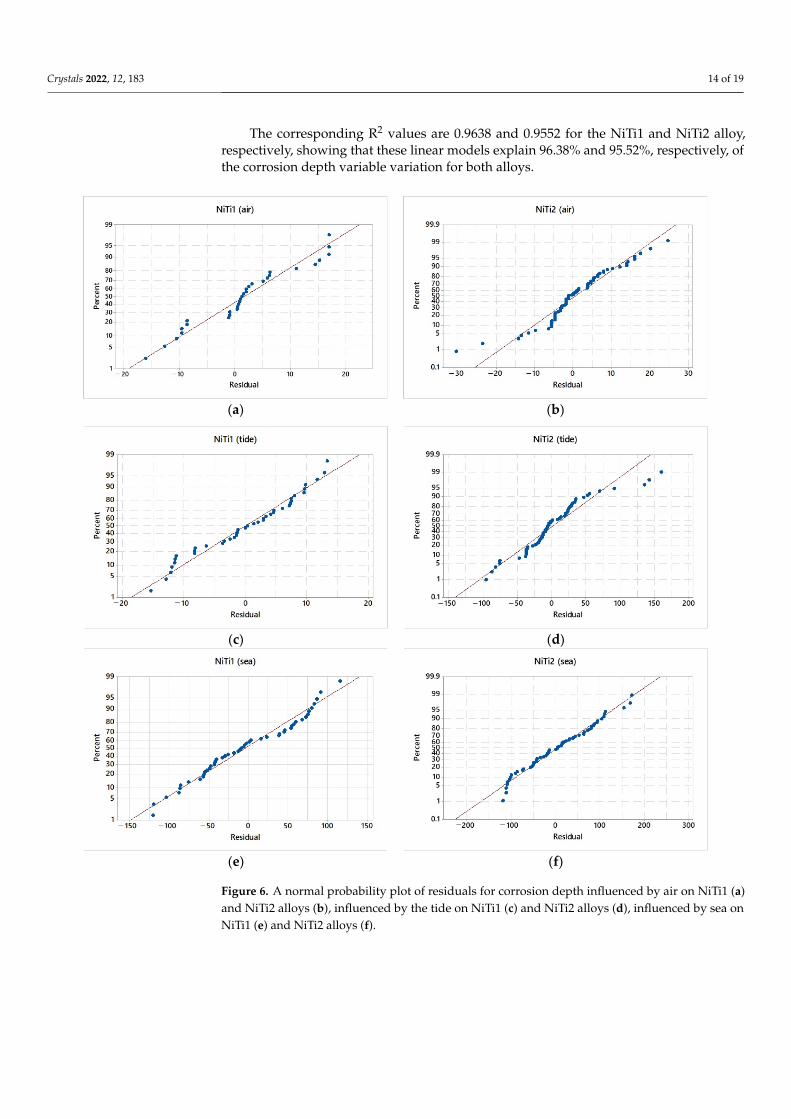
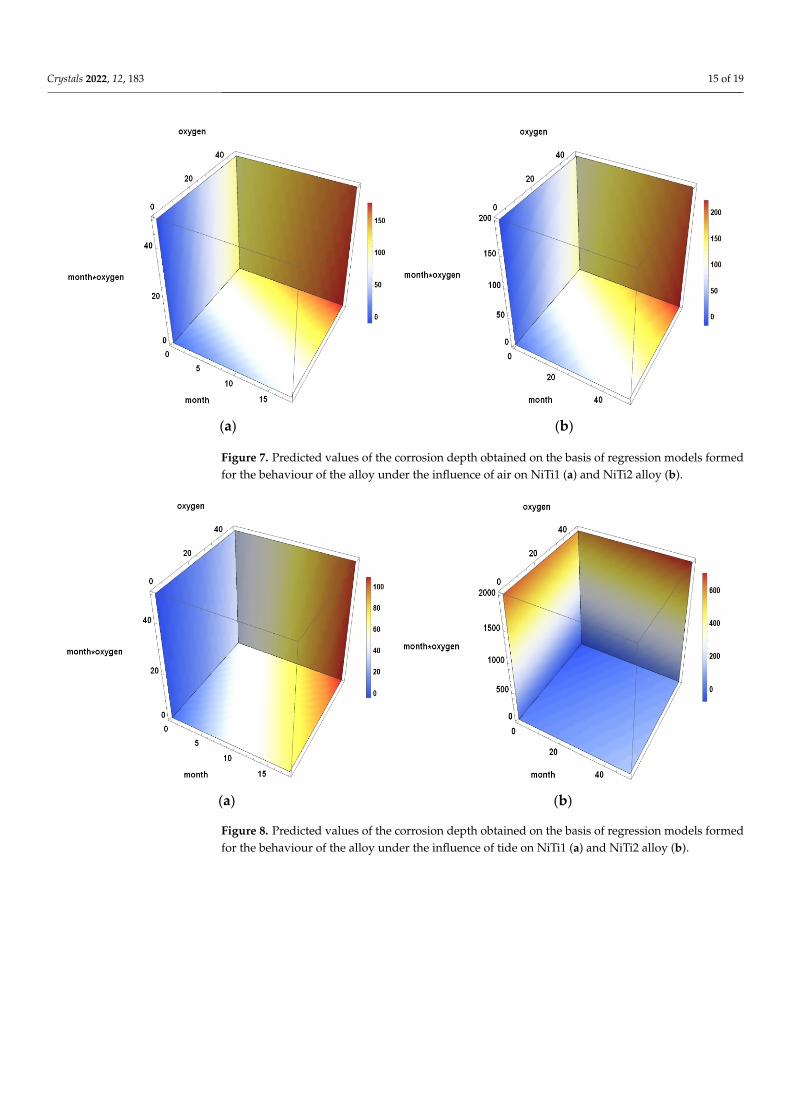
A general conclusion can be drawn based on the previously described results ofstatistical analysis. The functional dependence of the corrosion depth as a response variabledescribed by models (2)–(7) was determined adequately. As a consequence of this result,the formed regression models (2)–(7) can predict future values of corrosion depth as afunction of the three observed explanatory variables adequately. By applying these models,it is possible to estimate the depth of corrosion if the values of all three independentvariables are known. A graphical representation of the estimated values of corrosion depthdepending on the type of seawater environment is shown in Figures 7–9. Each figure showsone of the three observed seawater environments. In these figures, the corrosion depthvalues are shown using a scale where blue shades illustrate the lowest values while redshades illustrate the highest corrosion depth values. In each of the figures, the illustrationon the left refers to the NiTi1 alloy, while the illustration on the right is associated withthe NiTi2 alloy. Based on the graphical representation of the estimated values of corrosiondepth, there are differences between the corrosive behaviour of the observed NiTi alloysdepending on their exposure to the seawater environment but also the different behavioursof the NiTi1 and NiTi2 alloys when considering the influence of the explanatory variablesin the observed environment.
Since the statistical analysis indicated the fact that, under the influence of the seaenvironment, oxygen cannot be considered a statistically significant explanatory variable,the regression analysis for corrosion depth was repeated and, in this case, oxygen waseliminated from consideration. The results of the obtained regression analysis can berepresented by the following formulas:
dS(1) = 11.90x1 + 0.34x3 (8)
dS(2) = 10.69x1 + 0.19x3 (9)
Crystals 2022, 12, 183 14 of 19
The corresponding R2 values are 0.9638 and 0.9552 for the NiTi1 and NiTi2 alloy,respectively, showing that these linear models explain 96.38% and 95.52%, respectively, ofthe corrosion depth variable variation for both alloys.
Crystals 2022, 12, 183 13 of 19
air
Regression 3 58,169.5 19,389.8 221.06 0.000
Error 28 2456.0 87.7
Total 31 60,625.5
tide
Regression 3 63,852.8 21,284.3 319.80 0.000
Error 38 2529.1 66.6
Total 41 66,381.9
sea
Regression 3 4,891,817 1,630,606 394.81 0.000
Error 46 189,984 4130
Total 49 5,081,800
Table 7. The regression analysis of variance for the NiTi2 alloy samples for the three observed types
of marine environment.
Environment Source DF AdjSS AdjMS F‐Value p‐Value
air
Regression 3 266,918 88,972.8 1209.61 0.000
Error 81 5958 73.6
Total 84 272,876
tide
Regression 3 3,106,113 1,035,371 474.31 0.000
Error 68 148,438 2183
Total 71 3,254,551
sea
Regression 3 7,485,870 2,495,290 437.95 0.000
Error 61 347,553 5698
Total 64 7,833,424
To determine whether models that do not contain explanatory variables describe em‐
pirical data better than the formed regression models [29], a statistical test known as the
F‐test was used. From Tables 6 and 7 it is evident that, for both observed NiTi alloys and
each observed seawater environment, the formed linear regression models describe the
behaviour of the alloys well from the point of view of corrosion depth. More precisely, the
models represented by Formulas (2)–(7) can be used to predict future corrosion depth
values of NiTi1 and NiTi2 alloys as well as to estimate the corrosion depth of these alloys
based on the known values of the explanatory variables. This conclusion is in full agree‐
ment with the conclusion obtained when observing the previously calculated values of R2.
(a) (b)
Crystals 2022, 12, 183 14 of 19
(c) (d)
(e) (f)
Figure 6. A normal probability plot of residuals for corrosion depth influenced by air on NiTi1 (a)
and NiTi2 alloys (b), influenced by the tide on NiTi1 (c) and NiTi2 alloys (d), influenced by sea on
NiTi1 (e) and NiTi2 alloys (f).
A general conclusion can be drawn based on the previously described results of sta‐
tistical analysis. The functional dependence of the corrosion depth as a response variable
described by models (2)–(7) was determined adequately. As a consequence of this result,
the formed regression models (2)–(7) can predict future values of corrosion depth as a
function of the three observed explanatory variables adequately. By applying these mod‐
els, it is possible to estimate the depth of corrosion if the values of all three independent
variables are known. A graphical representation of the estimated values of corrosion
depth depending on the type of seawater environment is shown in Figures 7–9. Each fig‐
ure shows one of the three observed seawater environments. In these figures, the corro‐
sion depth values are shown using a scale where blue shades illustrate the lowest values
while red shades illustrate the highest corrosion depth values. In each of the figures, the
illustration on the left refers to the NiTi1 alloy, while the illustration on the right is asso‐
ciated with the NiTi2 alloy. Based on the graphical representation of the estimated values
of corrosion depth, there are differences between the corrosive behaviour of the observed
NiTi alloys depending on their exposure to the seawater environment but also the differ‐
ent behaviours of the NiTi1 and NiTi2 alloys when considering the influence of the ex‐
planatory variables in the observed environment.
Figure 6. A normal probability plot of residuals for corrosion depth influenced by air on NiTi1 (a)and NiTi2 alloys (b), influenced by the tide on NiTi1 (c) and NiTi2 alloys (d), influenced by sea onNiTi1 (e) and NiTi2 alloys (f).
Crystals 2022, 12, 183 15 of 19
Crystals 2022, 12, 183 15 of 19
(a) (b)
Figure 7. Predicted values of the corrosion depth obtained on the basis of regression models formed
for the behaviour of the alloy under the influence of air on NiTi1 (a) and NiTi2 alloy (b).
(a) (b)
Figure 8. Predicted values of the corrosion depth obtained on the basis of regression models formed
for the behaviour of the alloy under the influence of tide on NiTi1 (a) and NiTi2 alloy (b).
Figure 7. Predicted values of the corrosion depth obtained on the basis of regression models formedfor the behaviour of the alloy under the influence of air on NiTi1 (a) and NiTi2 alloy (b).
Crystals 2022, 12, 183 15 of 19
(a) (b)
Figure 7. Predicted values of the corrosion depth obtained on the basis of regression models formed
for the behaviour of the alloy under the influence of air on NiTi1 (a) and NiTi2 alloy (b).
(a) (b)
Figure 8. Predicted values of the corrosion depth obtained on the basis of regression models formed
for the behaviour of the alloy under the influence of tide on NiTi1 (a) and NiTi2 alloy (b). Figure 8. Predicted values of the corrosion depth obtained on the basis of regression models formedfor the behaviour of the alloy under the influence of tide on NiTi1 (a) and NiTi2 alloy (b).
Crystals 2022, 12, 183 16 of 19Crystals 2022, 12, 183 16 of 19
(a) (b)
Figure 9. Predicted values of the corrosion depth obtained on the basis of regression models formed
for the behaviour of the alloy under the influence of sea on NiTi1 (a) and NiTi2 alloy (b).
Since the statistical analysis indicated the fact that, under the influence of the sea
environment, oxygen cannot be considered a statistically significant explanatory variable,
the regression analysis for corrosion depth was repeated and, in this case, oxygen was
eliminated from consideration. The results of the obtained regression analysis can be rep‐
resented by the following formulas:
𝑑 11.90𝑥 0.34𝑥 (8)
𝑑 10.69𝑥 0.19𝑥 (9)
The corresponding R2 values are 0.9638 and 0.9552 for the NiTi1 and NiTi2 alloy,
respectively, showing that these linear models explain 96.38% and 95.52%, respectively,
of the corrosion depth variable variation for both alloys.
4. Discussion
The definition of the marine environment represents the interconnected body of salt‐
water and the coastal area. In this environment, the movement of seawater due to the
gravitational force of the moon as tides, the action of winds as waves, and the changes in
air pressure and temperature differences that cause sea currents, etc., are crucial. Thus,
corrosion tests were performed in a real environment where the samples were affected by
influences arising from the marine environment and not from simulations in the labora‐
tory where it is not possible to create conditions that could ensure validity. The research
in this paper is based on the examination of the corrosive behaviour of two different NiTi
alloys (different technological production processes were applied) whose selected sam‐
ples were subjected to the influence of three different seawater environments. Samples
that were not treated with corrosive protective coatings and which initially did not have
corrosive damage were exposed to the air, tide, and sea for 6, 12, and 18 months. After‐
wards, the testing samples were subjected to SEM/FIB and EDX analysis which provided
data on the resulting corrosion depth (expressed in nm) and the percentage of oxygen that
developed on the surface of the samples. In a continuation of the research, statistical anal‐
ysis based on multivariate linear regression was applied in order to examine the func‐
tional dependence of the corrosion depth of the observed samples’ surfaces on the deter‐
mined percentage of oxygen, exposure time of the sample, and the simultaneous influence
of these two variables. More precisely, the depth of corrosion was taken as the response
Figure 9. Predicted values of the corrosion depth obtained on the basis of regression models formedfor the behaviour of the alloy under the influence of sea on NiTi1 (a) and NiTi2 alloy (b).
4. Discussion
The definition of the marine environment represents the interconnected body ofsaltwater and the coastal area. In this environment, the movement of seawater due to thegravitational force of the moon as tides, the action of winds as waves, and the changes inair pressure and temperature differences that cause sea currents, etc., are crucial. Thus,corrosion tests were performed in a real environment where the samples were affected byinfluences arising from the marine environment and not from simulations in the laboratorywhere it is not possible to create conditions that could ensure validity. The research in thispaper is based on the examination of the corrosive behaviour of two different NiTi alloys(different technological production processes were applied) whose selected samples weresubjected to the influence of three different seawater environments. Samples that werenot treated with corrosive protective coatings and which initially did not have corrosivedamage were exposed to the air, tide, and sea for 6, 12, and 18 months. Afterwards, thetesting samples were subjected to SEM/FIB and EDX analysis which provided data on theresulting corrosion depth (expressed in nm) and the percentage of oxygen that developedon the surface of the samples. In a continuation of the research, statistical analysis based onmultivariate linear regression was applied in order to examine the functional dependenceof the corrosion depth of the observed samples’ surfaces on the determined percentageof oxygen, exposure time of the sample, and the simultaneous influence of these twovariables. More precisely, the depth of corrosion was taken as the response variable, whilethe percentage of oxygen, the time of exposure to the environment (expressed in months),and the joint impact of these two variables were considered as explanatory variables.Regression analysis confirmed the assumption that the corrosion depth of both NiTi alloyscan be represented adequately by the formed linear model and that the selected modelparameters were statistically significant. Corrosion depth regression models of both NiTialloys in all three seawater environments can be used to predict and estimate the futurevalues of corrosion depth.
In the case of the NiTi1 alloy, the lowest percentage of oxygen was determined underthe influence of air, slightly higher under the influence of the sea, and the highest wasunder the influence of the tide environment; however, the values in the tide and seaenvironments were approximately the same. In the case of the NiTi2 alloy, the percentage ofoxygen increased progressively when the influence of air, tide, and sea was observed. Thepercentage of oxygen in all environments was higher on the NiTi2 alloy’s surface comparedto NiTi1.
Crystals 2022, 12, 183 17 of 19
From the point of view of corrosion depth, the NiTi1 alloy surface behaved similarlyin both air and tide environments, but in a sea environment, the corrosion depth was6.49 times greater than that caused by air and 7.25 times greater than the depth of corrosioncaused by the tide. In the case of the NiTi2 alloy’s surface, the depth of corrosion followedthe trend of increasing the percentage of oxygen and was the lowest for air, then for the tide,and the highest for the sea. However, the values of corrosion depth were three times higherin the tide environment and five times higher in the sea environment compared to the airenvironment. Both alloys behaved similarly from the point of view of corrosion depth inboth air and sea environments, while they had significantly different behaviours in tideenvironments which are considered the most complex due to their constant dynamics andchanges in wet and dry periods. The average corrosion depth value was four times higherfor the NiTi2 alloy compared to the NiTi1 alloy’s surface for the tidal environment. Theresulting difference in the corrosion behaviour of the two NiTi alloys can be attributedto their different microstructures resulting from different production processes. Similarconclusions were reached by other authors in comparative studies [31,32] when theydetermined the functional properties of NiTi alloys depending on the production technique.
In this paper, we intended to monitor the corrosion behaviour of NiTi alloy in themarine environment over a long time period to get a more realistic picture of the impact ofdifferent marine environments on the degradation of the tested NiTi alloy. We were mostlyinterested in the differences in the chemical composition of the corrosion products whichwere precipitated on the surfaces. In this study, we wanted to determine separately in threeplaces, the influence of all conditions of the marine environment on the corrosion process,and thus, on the resistance of a NiTi alloy. Monitoring the corrosion potential always givesvery important information about corrosion processes. Therefore, the samples’ connections(resulting in the galvanic cells) will be used in our future studies. Extending the defineddatabases with additional measurements after the prolonged influence of the seawaterenvironment as well as adding new explanatory variables to the regression models (such asthe microstructure and phase composition of NiTi alloy) represent the future directions ofthis research. In order to avoid possible problems caused by highly collinearly dependentmodel variables, an additional application of principal component analysis, or partial leastsquares regression, is planned.
5. Conclusions
Within the performed research on two types of NiTi alloys, we came to the followingfindings:
1. Oxygen showed a statistically significant impact on the development of corrosionprocesses in the air and tide environments on both NiTi alloys’ surfaces which wasnot noticeable in the case in the sea environment.
2. Statistical analysis showed that the independent influence of oxygen percentage asa parameter of the regression model does not affect the development of NiTi alloycorrosion processes statistically significantly.
3. The joint influence of oxygen percentage and environmental exposure time is a sta-tistically unavoidable factor for the regression analysis of corrosion depth for bothNiTi alloys.
4. The formation of corrosion depth on the NiTi alloys’ surfaces being dependent on theinfluence of the sea, points to complex processes occurring in the marine environment.
5. This study discovered the need to consider more complex models with additionalenvironmental parameters as explanatory variables as well as the joint impact of thesesingle variables on corrosion depth.
Crystals 2022, 12, 183 18 of 19
Author Contributions: Conceptualisation, N.K. and Š.I.; methodology, N.K. Š.I. and R.R.; software,N.K.; validation, G.V. and R.R.; formal analysis, P.M. and N.K.; investigation, N.K., Š.I., R.R. andP.M.; resources, Š.I. and R.R.; data curation, P.M.; writing—original draft preparation, N.K. and Š.I.;writing—review and editing, R.R.; visualisation, N.K.; supervision, Š.I. and R.R.; project administra-tion, Š.I.; and funding acquisition, Š.I. and R.R. All authors have read and agreed to the publishedversion of the manuscript.
Funding: This research was funded by the Bilateral projects Slovenia—Montenegro (BI-ME/18-20-024) and Serbia—Montenegro (01-3440/2018) and Eureka program PROCHA-SMA E!13080 fundedby Ministry of Science of the Republic of Montenegro.
Institutional Review Board Statement: Not applicable.
Informed Consent Statement: Not applicable.
Data Availability Statement: Not applicable.
Acknowledgments: This paper is the result of an initial phase of the research on different influencesof the sea and atmosphere on the production and application of smart materials of Shape MemoryAlloys in the Maritime industry. Project PROCHA-SMA E!13080 is a part of the EUREKA projectwhich is realised jointly by the Faculty of Dental Medicine in Belgrade, Zlatarna Celje AD Beograd,and the Faculty of Maritime Studies Kotor, the University of Montenegro.
Conflicts of Interest: The authors declare no conflict of interest.
References1. Ölander, A. An electrochemical investigation of solid cadmium-gold alloys. J. Am. Chem. Soc. 1932, 54, 3819–3833. [CrossRef]2. Jani, J.M.; Leary, M.; Subic, A.; Gibson, M.A. A review of shape memory alloy research, applications and opportunities. Mater.
Des. 2014, 56, 1078–1113. [CrossRef]3. Huang, W. Shape Memory Alloys and Their Application to Actuators for Deployable Structures; University of Cambridge Department
of Engineering: Cambridge, UK, 1998.4. Ivoševic, Š.; Rudolf, R.; Kovac, D. The overview of the varied influences of the seawater and atmosphere to corrosive processes.
In Proceedings of the 1st International Conference of Maritime Science & Technology, NAŠE MORE, Dubrovnik, Croatia, 17October 2019; pp. 17–18.
5. Buehler, W.J.; Wang, F.E. A summary of recent research on the nitinol alloys and their potential application in ocean engineering.Ocean Eng. 1968, 1, 105–120. [CrossRef]
6. Kauffman, G.B.; Mayo, I. The Story of Nitinol: The Serendipitous Discovery of the Memory Metal and Its Applications. Chem.Educ. 1997, 2, 1–21. [CrossRef]
7. San Juan, J. Applications of Shape Memory Alloys to the Transport Industry. In Proceedings of the International Congress onInnovative Solutions for the Advancement of the Transport Industry, San Sebastian, Spain, 4–6 October 2006.
8. Sharma, N.; Jangra, K.K.; Raj, T. Fabrication of NiTi alloy: A review. Proc. Inst. Mech. Eng. Part L J. Mater. Des. Appl. 2015, 232,250–269. [CrossRef]
9. Merola, C.; Cheng, H.-W.; Schwenzfeier, K.; Kristiansen, K.; Chen, Y.-J.; Dobbs, H.A.; Israelachvili, J.N.; Valtiner, M. In situ nano-to microscopic imaging and growth mechanism of electrochemical dissolution (e.g., corrosion) of a confined metal surface. Proc.Natl. Acad. Sci. USA 2017, 114, 9541–9546. [CrossRef] [PubMed]
10. Soares, C.; Garbatov, Y. Reliability of maintained, corrosion protected plates subjected to non-linear corrosion and compressiveloads. Mar. Struct. 1999, 12, 425–445. [CrossRef]
11. Yamamoto, N.; Ikegami, K. A Study on the Degradation of Coating and Corrosion of Ship’s Hull Based on the ProbabilisticApproach. J. Offshore Mech. Arct. Eng. 1998, 120, 121–128. [CrossRef]
12. Paik, J.K.; Kim, S.K.; Lee, S.K. Probabilistic corrosion rate estimation model for longitudinal strength members of bulk carriers.Ocean Eng. 1998, 25, 837–860. [CrossRef]
13. Paik, J.K. A time-dependent corrosion wastage model for bulk carrier structures. Int. J. Marit. Eng. R. Just Naval. Arch. 2003, 145,61–87.
14. Paik, J.K. Corrosion Analysis of Seawater Ballast Tank Structures. Int. J. Marit. Eng. 2004, 146, 15. [CrossRef]15. Melchers, R. Corrosion uncertainty modelling for steel structures. J. Constr. Steel Res. 1999, 52, 3–19. [CrossRef]16. Melchers, R.E. Probabilistic Model for Marine Corrosion of Steel for Structural Reliability Assessment. J. Struct. Eng. 2003, 129,
1484–1493. [CrossRef]17. Melchers, R.E. Factors Influencing the Immersion Corrosion of Steels in Marine Water. In Proceedings of the 14th International
Corrosion Congress, Cape Town, South Africa, 26 September–1 October 1999.18. Lojen, G.; Stambolic, A.; Šetina Batic, B.; Rudolf, R. Experimental Continuous Casting of Nitinol. Metals 2020, 10, 505. [CrossRef]19. Stambolic, A.; Anžel, I.; Lojen, G.; Kocijan, A.; Jenko, M.; Rudolf, R. Continuous vertical casting of a NiTi alloy. Mater. Tehnol.
2016, 50, 981–988. [CrossRef]

Crystals 2022, 12, 183 19 of 19
20. Kovac, N.; Ivoševic, Š.; Vastag, G.; Vukelic, G.; Rudolf, R. Statistical Approach to the Analysis of the Corrosive Behaviour of NiTiAlloys under the Influence of Different Seawater Environments. Appl. Sci. 2021, 11, 8825. [CrossRef]
21. Kovac, N.; Ivoševic, Š.; Gagic, R. Estimation of the NiTi alloy corrosion rate dependence on the percentage of oxygen in threedifferent seawater environments. ICONST EST’21 2021, 1, 323–334.
22. Ivoševic, Š.; Majeric, P.; Vukicevic, M.; Rudolf, R. A Study of the Possible Use of Materials with Shape Memory Effect inShipbuilding. J. Marit. Transp. Sci. 2020, 3, 265–277. [CrossRef]
23. Ivoševic, Š.; Kovac, N.; Vastag, G.; Majeric, P.; Rudolf, R. A Probabilistic Method for Estimating the Influence of Corrosion on theCuAlNi Shape Memory Alloy in Different Marine Environments. Crystals 2021, 11, 274. [CrossRef]
24. Ivoševic, Š.; Vastag, G.; Majeric, P.; Kovac, D.; Rudolf, R. Analysis of the Corrosion Resistance of Different Metal Materials Exposedto Varied Conditions of the Environment in the Bay of Kotor. In The Montenegrin Adriatic Coast. The Handbook of EnvironmentalChemistry; Joksimovic, D., Ðurovic, M., Zonn, I.S., Kostianoy, A.G., Semenov, A.V., Eds.; Springer: Cham, Switzerland, 2020;Volume 110.
25. Heckler, C.E. Applied Multivariate Statistical Analysis. Technometrics 2005, 47, 517. [CrossRef]26. Willard, C.A. Statistical Methods: An Introduction to Basic Statistical Concepts and Analysis; Routledge: London, UK, 2020. [CrossRef]27. Lee Rodgers, J.; Nicewander, W.A. Thirteen ways to look at the correlation coefficient. Am. Stat. 1988, 42, 59–66. [CrossRef]28. Miller, R.G., Jr. Beyond ANOVA: Basics of Applied Statistics; CRC Press: Boca Raton, FL, USA, 1997.29. Bingham, N.H.; Fry, J.M. Regression: Linear Models in Statistics; Springer Science & Business Media: Berlin/Heidelberg, Germany,
2010.30. Anscombe, F.J. Graphs in statistical analysis. Am. Stat. 1973, 27, 17–21.31. Stambolic, A.; Jenko, M.; Kocijan, A.; Žužek, B.; Drobne, D.; Rudolf, R. Determination of mechanical and functional properties by
continuous vertical cast NiTi rod = Dolocitev mehanskih in funkcionalnih lastnosti vertikalno kontinuirno lite NiTi palice. Mater.Tehnol. 2018, 52, 521–527. Available online: http://mit.imt.si/Revija/izvodi/mit185/stambolic.pdf (accessed on 12 December2021). [CrossRef]
32. Rudolf, R.; Stambolic, A.; Kocijan, A. Atomic layer deposition of a TiO2TiO2 layer on Nitinol and its corrosion resistance in asimulated body fluid. Metals 2021, 11, 659. Available online: https://www.mdpi.com/2075-4701/11/4/659 (accessed on 12December 2021). [CrossRef]