Workforce Changes and Employment - | NITI Aayog
20
-
Upload
khangminh22 -
Category
Documents
-
view
1 -
download
0
Transcript of Workforce Changes and Employment - | NITI Aayog


NITI Aayog Discussion Paper 1/2022
Workforce Changes and Employment
Some Findings from PLFS Data Series
Ramesh Chand
and
Jaspal Singh
NITI Aayog Government of India
New Delhi
March 2022


1
Workforce Changes and Employment
Some Findings from PLFS Data Series
Ramesh Chand and Jaspal Singh
Member, NITI Aayog, and Consultant, NITI Aayog, respectively
Employment has remained one of the top challenges of Indian policymakers, and over
the years, this has only become more complex. One, there is considerable improvement in
literacy, schooling, and attainment of higher education and skills and vocational education in
the country. The educated and trained manpower looks not for jobs alone but for decent jobs
with better work environments, regular employment and better remuneration. However, job
creation for this kind of employment has not kept pace with the increase in the number of job
seekers. Two, the aspirations of the labour class have been rising with the overall development
of the country. Three, the growth of industry and services sector has been very uneven across
different regions and states. This has resulted in a mismatch in employment opportunities and
the supply of labour at local levels. Fourth, there is a strong divergence between structural
changes in the composition of output and employment. The industry and services sectors,
which constitutes more than 80 per cent of the gross value added in the country, provides
employment to 54.4 per cent of the workforce, and, agriculture, which accounted for 18.29 per
cent of GVA in 2019–20, retains 45.6 per cent workforce. This divergence in sectoral share in
income and employment is manifested in the rising gap in per worker income in the agriculture
and non-agriculture sectors. Lastly, due to job security, assured salary and other pay and
prestige associated with it, preference towards government jobs has increased tremendously.
India has experienced more or less consistent and steady changes in the structure of the
output of the economy, especially after the economic reforms of 1990–91. The growth rate of
the economy, measured by the gross value added, at constant prices, accelerated from 4.27 per
cent twenty years before the economic reforms to 6.34 per cent twenty years after the reforms.
The growth rate in GVA showed further acceleration to reach 6.58 per cent during 2010–11 to
2019–20 at 2011–12 prices. This growth trajectory was accompanied by a steady decline in the
share of agriculture and a steady increase in the share of non-agriculture sectors in total
economy. The change in sectoral shares accelerated over time. However, the trend in
employment did not reveal a consistent and clear pattern. This is partly due to demographic
changes and increased enrolment for post-matric education. Many other factors like
technological changes, sectoral composition of output, shift of female workforce from
household activities to outside activities and also vice versa, skill creation, mechanisation,
labour laws and regulations have also produced changes in the workforce and employment.
These complexities have led to a wide variation in the conclusions drawn by experts and
various studies on employment. The problem is further accentuated by a long gap in data on
various aspects of employment.
2
Two major sources of data on the workforce and employment have been the (i)
decennial population census and (ii) nationwide quinquennial surveys on employment and
unemployment by the erstwhile NSSO under the Ministry of Statistics and Programme
Implementation (MoSPI), Government of India. The Census data is available after an interval
of ten years and the last available data refers to the year 2011. Similarly, the quinquennium
NSSO data on employment and unemployment is available up to the year 2011–12 only. The
nationwide Employment and Unemployment (E&U) surveys have been replaced by the
Periodic Labour Force Survey (PLFS) conducted by the National Statistical Office (NSO) of
MoSPI, which started in the year 2017–18. The PLFS data is available for both rural and urban
and the total population on an annual basis. The quarterly data, on the other hand, is available
only for urban households.
According to NSO, the PLFS data measure the dynamics in labour force participation,
workers to population ratio and the employment status along with related, important parameters
for both rural and urban areas, in the usual status and current weekly status (CWS) annually.
Besides, PLFS also brings out the employment aspects for a short time interval of three months
for urban areas only in CWS (MoSPI 2021).
The PLFS surveys are based on a different sampling framework and uses a different
analytical approach vis à vis the NSSO surveys on employment (Kannan and Khan 2022).
Because of this, the time series data on E&U, available from the NSSO surveys, is not
comparable with the PLFS data.
Annual data sets from the PLFS are now available for three consecutive years—2017–
18, 2018–19 and 2019–20. The quarterly data is available up to April–June 2021, but refers
only to urban households. Although three years’ data are very short to draw generalisations
about an underlying trend, it is very rich nonetheless and can be safely used to reveal the effect
of various policies and developments, followed during the current regime at the Centre, and to
understand and shape the employment scenario in the country. This paper analyses the country-
level scenario of changes in employment and workforce using the annual PLFS data for the
years 2017–18, 2018–19 and 2019–20.
Many studies and media articles have expressed serious concern about the deterioration
in the employment scene in the country in recent years (Anand Thampi 2021; Mehrotra and
Jajati 2021, Mehrotra and Tuhinsubhra Giri 2021). This paper examines the veracity of
assertions such as (i) decline in worker-to-population ratio in recent years, (ii) increase in
unemployment, (iii) withdrawal of women from workforce and (iv) deterioration in the overall
employment scenario in the country, among others.
Growth Rate in Economic Activities during PLFS Period
The progress and performance of economic activities in various sectors are major
determinants of the workforce and employment. Therefore, it is pertinent to view the changes
in employment over the three PLFS annual surveys in the light of the economy’s growth. In

3
doing so, the reference period for the growth rate in the economy should correspond to the
period of PLFS surveys, which is from July to June, and different than the Financial Year,
which is from April to March. In order to bring the PLFS estimate and the annual growth rate
of the economy to the same reference periods, the growth rates were recalculated for the Gross
Value Added output for the period July to June. The relevant growth rates are presented in
Table 1.
Table 1: Annual rate of change in gross value added in agriculture and non-agriculture
sectors, and the total economy during PLFS years 2017–18 to 2019–20 at 2011–12 prices
PLFS Year Agriculture Non-agriculture Total economy
2017-18 6.39 6.85 6.78
2018-19 2.16 5.92 5.35
2019-20 4.35 -4.10 -2.85
Q1 2019-20 3.54 -26.45 -22.37
Source: Press Releases of MOSPI, and National Accounts Statistics.
The PLFS year 2019–20 includes the first quarter of FY 2020–21, April to June 2020,
when the first wave of the Covid-19 pandemic hit the country and caused serious disruption in
economic activities. The GVA of the non-agriculture sector in this quarter shrunk by 26.45 per
cent, leading to a 22.37 per cent squeeze in the total economy when compared to the same
quarter in the previous year. However, the agriculture GVA followed normal growth despite
Covid-19 because production and marketing activities for the agriculture sector were exempted
from pandemic-related restrictions. This quarter also witnessed a large-scale reverse movement
of labour from its locations of work to native places and from urban to rural areas. In the entire
PLFS year 2019–20, the GVA in total economy declined by 2.85 per cent, while the agriculture
and allied sector showed two times the growth rate experienced in the previous pre-Covid year.
This affected the employment level and the distribution of workers between the agriculture and
non-agriculture sectors and rural and urban households.
Labour-Force-Participation Rate
Labour force includes persons who were either working (or employed) or those
available for work (or unemployed). Some persons in the labour force are abstained from work
for various reasons. Subtracting that number from the labour force gives the number of actual
workers. These workers are further categorised as persons who are engaged in any activity as
self-employed or regular wage/salaried and casual labour. The difference between the labour
force and the workforce gives the number of unemployed persons.
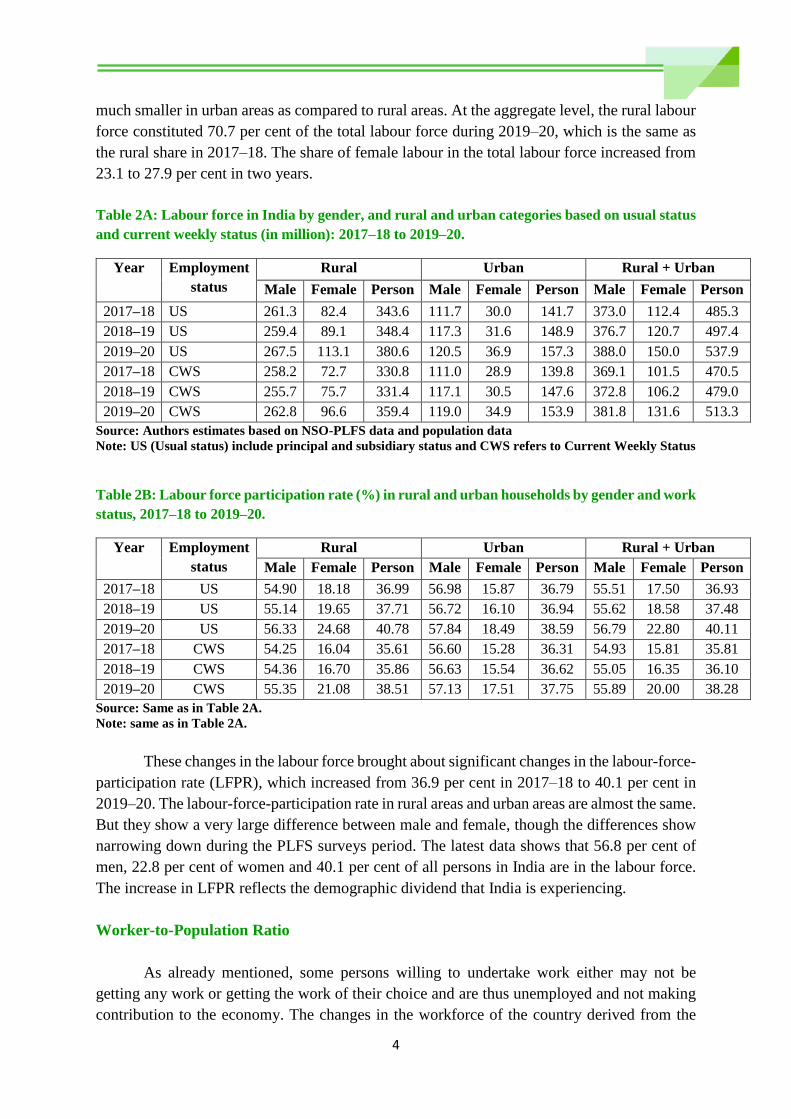
The changes in labour force among rural, urban and all households since 2017–18 are
presented in Table 2 A&B. The size of the labour force in the country has increased from 485.3
million in the year 2017–18 to 497.4 million in the year 2018–19. The next year, the labour
force increased by 8 per cent and reached 537.9 million. This increase was witnessed across
male and female populations as well as rural and urban households. The increase has been
4
much smaller in urban areas as compared to rural areas. At the aggregate level, the rural labour
force constituted 70.7 per cent of the total labour force during 2019–20, which is the same as
the rural share in 2017–18. The share of female labour in the total labour force increased from
23.1 to 27.9 per cent in two years.
Table 2A: Labour force in India by gender, and rural and urban categories based on usual status
and current weekly status (in million): 2017–18 to 2019–20.
Year Employment
status
Rural Urban Rural + Urban
Male Female Person Male Female Person Male Female Person
2017–18 US 261.3 82.4 343.6 111.7 30.0 141.7 373.0 112.4 485.3
2018–19 US 259.4 89.1 348.4 117.3 31.6 148.9 376.7 120.7 497.4
2019–20 US 267.5 113.1 380.6 120.5 36.9 157.3 388.0 150.0 537.9
2017–18 CWS 258.2 72.7 330.8 111.0 28.9 139.8 369.1 101.5 470.5
2018–19 CWS 255.7 75.7 331.4 117.1 30.5 147.6 372.8 106.2 479.0
2019–20 CWS 262.8 96.6 359.4 119.0 34.9 153.9 381.8 131.6 513.3
Source: Authors estimates based on NSO-PLFS data and population data
Note: US (Usual status) include principal and subsidiary status and CWS refers to Current Weekly Status
Table 2B: Labour force participation rate (%) in rural and urban households by gender and work
status, 2017–18 to 2019–20.
Year Employment
status
Rural Urban Rural + Urban
Male Female Person Male Female Person Male Female Person
2017–18 US 54.90 18.18 36.99 56.98 15.87 36.79 55.51 17.50 36.93
2018–19 US 55.14 19.65 37.71 56.72 16.10 36.94 55.62 18.58 37.48
2019–20 US 56.33 24.68 40.78 57.84 18.49 38.59 56.79 22.80 40.11
2017–18 CWS 54.25 16.04 35.61 56.60 15.28 36.31 54.93 15.81 35.81
2018–19 CWS 54.36 16.70 35.86 56.63 15.54 36.62 55.05 16.35 36.10
2019–20 CWS 55.35 21.08 38.51 57.13 17.51 37.75 55.89 20.00 38.28
Source: Same as in Table 2A.
Note: same as in Table 2A.
These changes in the labour force brought about significant changes in the labour-force-
participation rate (LFPR), which increased from 36.9 per cent in 2017–18 to 40.1 per cent in
2019–20. The labour-force-participation rate in rural areas and urban areas are almost the same.
But they show a very large difference between male and female, though the differences show
narrowing down during the PLFS surveys period. The latest data shows that 56.8 per cent of
men, 22.8 per cent of women and 40.1 per cent of all persons in India are in the labour force.
The increase in LFPR reflects the demographic dividend that India is experiencing.
Worker-to-Population Ratio
As already mentioned, some persons willing to undertake work either may not be
getting any work or getting the work of their choice and are thus unemployed and not making
contribution to the economy. The changes in the workforce of the country derived from the

5
PLFS data are presented in Table 3 A&B. The number of workers increased by 12.3 per cent
in two years (2017–18 and 2019–20). The increase was 2.7 per cent during 2018–19 and 9.4
per cent in 2019–20. Just like the labour force, the increase in workforce was witnessed across
the board. Of the total increase of 56 million workers, about 72% got work in rural areas. In
other words, only 28% of new jobs were generated in urban areas. Another important change
noticed from the PLFS data is that the increase in female workers was two times the increase
in number of male workers. Between 2017–18 and 2019–20, 37.7 million women joined the
workforce as against 18.3 million men.
Table 3A: Number of male and female workers in rural and urban India (in million): 2017–18 to
2019–20.
Year Status Rural Urban Rural + Urban
Male Female Person Male Female Person Male Female Person
2017–18 US 246.0 79.2 325.3 103.8 26.8 130.6 349.9 106.0 455.8
2018–19 US 244.9 86.0 330.8 109.0 28.5 137.5 353.9 114.4 468.3
2019–20 US 255.4 110.2 365.5 112.8 33.6 146.4 368.2 143.7 511.9
2017–18 CWS 235.4 67.1 302.4 101.2 25.2 126.3 336.6 92.3 428.8
2018–19 CWS 233.2 70.2 303.4 106.8 26.8 133.5 340.0 94.3 436.8
2019–20 CWS 239.8 91.3 331.1 106.4 30.6 137.0 346.3 121.9 468.1
Source: Same as in Table 2A.
Note: same as in Table 2A.
Table 3B: Workers to population ratio (%), according to gender and rural-urban categories,
2017–18 to 2019–20.
Year Status Rural Urban Rural + Urban
Male Female Person Male Female Person Male Female Person
2017–18 US 51.70 17.49 35.02 52.96 14.16 33.91 52.07 16.51 34.69
2018–19 US 52.06 18.96 35.80 52.70 14.51 34.11 52.25 17.61 35.29
2019–20 US 53.78 24.03 39.16 54.15 16.85 35.91 53.89 21.85 38.17
2017–18 CWS 49.47 14.81 32.56 51.60 13.32 32.80 50.09 14.37 32.63
2018–19 CWS 49.58 15.47 32.83 51.61 13.65 33.12 50.20 14.52 32.92
2019–20 CWS 50.50 19.92 35.48 51.08 15.34 33.60 50.68 18.53 34.91
Source: Same as in Table 2A.
Note: same as in Table 2A.
The estimates of worker-to-population ratio (WPR) are presented in Part B of Table 3.
This indicates a very big increase in WPR. The WPR in rural areas increased from 35.0 per
cent to 39.2 per cent and in urban areas from 33.92 per cent to 35.9 per cent. Among all
categories, the largest increase in WPR is observed among women in rural areas. Of a female
population of 1000, in 2017–18, 165 were in workforce. This ratio increased to 218 in 2018–
19. Despite this progress, the worker to population ratio of women in the country remained less
than half the WPR for men.
Some experts prefer the use of current weekly status of workers as an indicator of
employment. Table 3 includes the estimates of workforce (per cent as well as absolute number)
based on CWS. This shows that 8 million new jobs were created during 2018–19 and 31.3

6
million during 2019–20. The WPR based on CWS shows an increase from 32.63 per cent in
2017–18 to 34.91 per cent during 2019–20. The direction and pattern of change in employment
based on CWS data was similar to Usual status employment, though the increase in former is
smaller compared to the latter.
The PLFS data clearly indicate that work opportunities in the country during 2017–18
to 2019–20 have seen a significant rise. The increase is greater for women and in rural areas.
Unemployment
The results of unemployment in the country for 2017–18, 2018–19 and 2019–20 for
usual status and current weekly status are presented in Table 4 A&B. During 2017–18, 29.1
million persons in the labour force of the country remained without jobs for a major part of the
year, i.e., based on usual status. Their number declined to 26.0 million in 2019–20, despite a
huge increase of 52.6 million new entrants into the labour force. The number of unemployed
persons based on usual status declined from 18 million to 15 million in the rural areas and from
11.1 million to 10.9 million in the urban areas.
The rate of unemployment, in usual status, shows a significant decline. The
unemployment rate dropped from 6.07 per cent during 2017–18 to 5.84 per cent during 2018–
19. This was followed by a further decline to the level of 4.84 per cent in the year 2019–20.
The unemployment rate in rural areas was much lower than urban areas. Similarly, the
unemployment rate among rural females was lower than rural males while the opposite holds
true in urban areas.
The extent and incidence of unemployment based on current weekly status of
employment is more severe and shows an increase in the number of unemployed persons in
two years by 3.4 million. The unemployment rate based on current weekly status is around 8.8
per cent, and does not show any change during the last three years. CWS unemployment was
found to be much lower in rural areas than in urban areas. Also, it showed a decline in rural
households and a rise in urban households.
Table 4A: Number of unemployed persons by gender and rural urban categories based on Usual
status and CWS (in Million): 2017–18 to 2018–19.
Year Status Rural Urban Rural + Urban
Male Female Person Male Female Person Male Female Person
2017–18 US 15.2 3.1 18.3 7.9 3.2 11.1 23.1 6.4 29.4
2018–19 US 14.5 3.1 17.6 8.3 3.1 11.4 22.8 6.3 29.1
2019–20 US 12.1 3.0 15.1 7.7 3.3 10.9 19.8 6.2 26.0
2017–18 CWS 22.7 5.6 28.3 9.8 3.7 13.5 32.5 9.2 41.8
2018–19 CWS 22.5 5.6 28.0 10.4 3.7 14.1 32.8 11.9 42.2
2019–20 CWS 23.0 5.3 28.3 12.6 4.3 16.9 35.6 9.7 45.2
Source: Same as in Table 2A.
Note: same as in Table 2A.

7
Table 4B: Unemployment rate (%) by gender and rural urban categories based on Usual status
and CWS: 2017–18 to 2018–19.
Year Status Rural Urban Rural + Urban
Male Female Person Male Female Person Male Female Person
2017–18 US 5.83 3.80 5.33 7.06 10.78 7.83 6.20 5.66 6.07
2018–19 US 5.59 3.51 5.06 7.09 9.88 7.66 6.06 5.22 5.84
2019–20 US 4.53 2.63 3.97 6.38 8.87 6.94 5.11 4.17 4.84
2017–18 CWS 8.81 7.67 8.57 8.83 12.83 9.67 8.81 9.11 8.88
2018–19 CWS 8.79 7.37 8.45 8.86 12.16 9.56 8.81 11.19 8.81
2019–20 CWS 8.76 5.50 7.87 10.59 12.39 10.99 9.32 7.35 8.80
Source: Same as in Table 2A.
Note: same as in Table 2A.
Sectoral Distribution of Workers
The distribution of the workforce among the three broad sectors—agriculture and allied
sector, industry sector and service sector—has been presented in Table 5 A&B, based on usual
status. The general expectation about the workforce distribution is that it will move from
agriculture to industry and services sector as labour productivity is much higher in the latter
two categories compared to agriculture. This was revealed by the data from the previous two
Censuses as well as the NSSO surveys after 2004–05. Consistent with this past trend, PLFS
data also shows a decline in the absolute number and share of workers employed in agriculture
between 2018–19 and 2017–18. However, this process was reversed the next year, which
witnessed not only a big increase in employment in the agriculture sector but also an increase
in the share of agriculture in the total workforce. Consequently, the share of industry and
services in total employment followed a decline.
However, the total number of jobs created in industry and services continued to show an
increase, even during 2019–20, which includes three months (a quarter) having effect of Covid-
19 on economic activities. The PLFS estimates indicate that industry added 4.8 million new
jobs during 2018–19 and 3.4 million during 2019–20. Similarly, the services sector provided
additional employment to 10.1 million persons during 2018–19 and 6 million during 2019–20.
It is reasonable to observe that job creation during 2019–20 could go much higher if the Covid-
19 effect on economic activity in the last quarter was not there.
The reversal of the declining trend in the share of agriculture in the workforce during
2019–20 can be attributed to two factors. One, year 2019–20 includes the April to June quarter
of year 2020 that overlapped with the break of the Covid-19 pandemic. The last quarter of
PLFS 2019–20 (which is the first quarter of FY 2020–21) shows a decent growth rate (3.45%)
of the agriculture sector in contrast to the 26 per cent decline in the output of the non-agriculture
sector. Two, the agriculture sector experienced much better growth in labour-intensive
horticulture and livestock subsectors.

8
Table 5A: Number of workers employed in agriculture, industry and services during PLFS years,
million.
Year Sex Rural Urban Rural + Urban
Agri. Industry Service Agri. Industry Service Agri. Industry Service
2017–18 Male 135.2 56.8 54.0 5.6 37.4 60.9 140.8 94.2 114.9
2018–19 Male 130.3 57.8 56.9 5.4 38.5 65.2 135.6 96.3 121.9
2019–20 Male 141.5 58.7 55.2 5.6 38.6 68.6 147.1 97.2 123.7
2017–18 Female 58.0 10.8 10.4 2.4 8.1 16.3 60.4 18.9 26.7
2018–19 Female 61.1 13.2 11.7 2.2 8.3 17.9 63.3 21.4 29.6
2019–20 Female 83.4 14.4 12.3 2.8 9.4 21.4 86.1 23.9 33.7
2017–18 Person 193.2 67.7 64.4 8.0 45.4 77.2 201.2 113.0 141.5
2018–19 Person 191.3 70.9 68.5 7.6 46.8 83.1 199.0 117.8 151.6
2019–20 Person 224.8 73.1 67.5 8.4 48.0 90.0 233.2 121.2 157.5
Source: Same as in Table 2A.
Note: same as in Table 2A.
Table 5B: Per cent distribution of workers over sectors and gender and industry type, 2017–18 to
2019–20.
Year Sex Rural Urban Rural + Urban
Agri. Industry Service Agri. Industry Service Agri. Industry Service
2017–18 Male 55.0 23.1 22.0 5.4 36.0 58.6 40.2 26.9 32.8
2018–19 Male 53.2 23.6 23.2 4.9 35.3 59.8 38.3 27.2 34.5
2019–20 Male 55.4 23.0 21.6 5.0 34.2 60.8 40.0 26.4 33.6
2017–18 Female 73.2 13.7 13.1 9.1 30.1 60.8 57.0 17.8 25.2
2018–19 Female 71.1 15.3 13.6 7.8 29.2 63.0 55.3 18.7 25.9
2019–20 Female 75.7 13.1 11.2 8.2 28.0 63.8 59.9 16.6 23.5
2017–18 Person 59.4 20.8 19.8 6.1 34.8 59.1 44.1 24.8 31.0
2018–19 Person 57.8 21.4 20.7 5.5 34.1 60.4 42.5 25.2 32.4
2019–20 Person 61.5 20.0 18.5 5.7 32.8 61.5 45.6 23.7 30.8
Source: Same as in Table 2A.
Note: same as in Table 2A.
Looking at the gender aspect, 86.1 million women worked in the agriculture sector,
33.7 million in the service sector, and 23.9 million in the industry sector, which includes
construction. These numbers show that 60 per cent of all women workers in the country were
employed in agriculture, 17 per cent in industry, and 23 per cent in the service sector during
2019–20. In the case of male workers, 40 per cent were employed in agriculture, 27 per cent in
industry and one third in the service sector. It is interesting to note that 60 per cent employment
in the industry sector and 43 per cent in the service sector originated in the rural areas. Overall,
71 per cent of the workforce belongs to rural households and 29 per cent to urban households.
As already mentioned, the year 2019–20 witnessed an increase in the share of
agriculture and allied sectors in providing employment in the country. In the same year share
of women in workforce employed in agriculture increased along with the increase in share of

9
women engaged in agriculture in total women workers. The table also shows that 75.7% of the
total rural women workers were absorbed by agriculture sector.
The agriculture and allied sectors provided employment to 40 per cent male workers,
60 per cent female workers and 45.6 per cent to all workers during 2019–20. The industry
sector absorbed 26 per cent of male workers and 16.6 per cent of female workers. The service
sector provided employment to 33.6 per cent male and 23.5 per cent female workers.
The changes in employment in different activities, which are clubbed under the industry
group, can be seen in Table 6. Of the 8.12 million additional jobs created in industry between
2017–18 and 2019–20, 78 per cent were in the construction sector. The employment data for
the manufacturing sector show an increase of 1.78 million jobs in the said period. Further, the
employment of male workers in manufacturing shows a small decline, whereas that of women
revealed an increase from 13.21 million to 15.62 million.
Table 6: Estimates of workforce in different categories of Industry, Million
Year Sex
Mining
and
quarrying
Manuf-
acturing
Electricity,
gas, steam
and air
conditioning
supply
Water supply;
sewerage, waste
mgt. and
remediation
activities
Constru-
ction
Total
Industry
2017–18 Male 1.71 42.09 1.50 1.01 47.86 94.19
2018–19 Male 1.73 41.83 1.31 1.03 50.36 96.26
2019–20 Male 1.33 41.42 1.58 1.18 51.73 97.24
2017–18 Female 0.18 13.21 0.06 0.13 5.33 18.91
2018–19 Female 0.23 14.66 0.09 0.17 6.29 21.44
2019–20 Female 0.07 15.62 0.07 0.29 7.82 23.87
2017–18 Person 1.87 55.29 1.55 1.14 53.19 113.04
2018–19 Person 1.97 56.52 1.40 1.22 56.66 117.78
2019–20 Person 1.43 57.07 1.64 1.48 59.53 121.16
Source: Same as in Table 2A.
Note: same as in Table 2A.
Occupation Status
Workers are classified under three categories of occupational status: self-employed,
working as casual labour, and working on regular wage/salary. The distribution of total workers
over these three categories is presented in Table 7. The number of self-employed persons was
much higher in agriculture as compared to non-agricultural enterprises. Of the 274.1 million
self-employed persons in the year 2019–20, 74.25 per cent were engaged in agriculture and
25.75 per cent in non-agriculture sectors. The number of self-employed persons showed a big
increase in both agriculture and non-agriculture sectors between 2017–18 and 2019–20.

10
Table 7: Distribution of workers among various occupation types, in million
Year Sector Self employed Regular wage/salary Casual labour
2017–18 Non-Agriculture 90.7 101.7 62.3
Agriculture 147.4 2.5 51.4
Total 238.1 104.1 113.8
2018–19 Non-Agriculture 96.4 108.9 64.1
Agriculture 147.6 2.4 49.1
Total 243.9 111.4 113.2
2019–20
Non-Agriculture 100.8 113.3 64.9
Agriculture 173.3 4.1 56.0
Total 274.1 117.3 120.9
Source: Same as in Table 2A.
Note: same as in Table 2A.
The composition of workers across the three categories has remained fairly stable,
except a small change. One fourth of the total workers were employed as casual labour while
52.2 per cent were self-employed in the year 2017–18. In 2019–20, the proportion of casual
labour declined to 23.6 per cent and the proportion of self-employed people increased to 53.50
per cent. Around 23 per cent of the total workers were engaged in regular wage or salaried
employment.
Agriculture Workforce: Gender and Youth
There are some popular perceptions about the agriculture workforce that need empirical
verification. It is often said that agriculture has more women than men, as the latter is migrating
away from rural areas in search of better livelihoods. The other popular perception is that the
youth are not staying in agriculture anymore and this can affect agriculture production
adversely and add uncertainty to the future of food production. It is also asserted that agriculture
is facing de-peasantisation as tiny holdings are not generating enough income and forcing many
farmers to join the rank of agricultural labourers.
The exact status of the agriculture workforce by gender and age group has been
presented in Table 8A and their distribution in these groups is presented in Table 8B. The PLFS
data shows that the participation of women in agriculture is rising. Female workers constituted
30 per cent of the agriculture workforce in 2017–18 and 37 per cent in year 2019–20. However,
men continue to dominate the agriculture workforce with a 63 per cent share.

11
Table 8A: Number of agriculture workers by gender and age group, million
Sex Year All age groups Youth (15-29 year age)
Agricultural worker All
Worker
Agricultural worker All
Worker Cultivator Labour Total Cultivator Labour Total
Male 2017–18 108.4 30.7 140.8 349.9 21.7 7.4 29.4 89.84
2018–19 104.6 29.3 135.5 353.9 20.4 7.1 27.9 90.16
2019–20 112.6 31.8 147.1 368.2 23.0 7.3 31.1 94.50
Female 2017–18 39.0 20.7 60.4 106.0 7.6 3.8 11.5 23.51
2018–19 42.8 19.7 63.3 114.4 7.4 3.4 11.0 23.42
2019–20 60.6 24.1 86.2 143.7 11.6 4.0 15.9 30.72
Person 2017–18 147.3 51.4 201.2 455.8 29.2 11.1 40.9 113.39
2018–19 147.5 49.1 199.0 468.3 27.8 10.5 38.8 113.61
2019–20 173.2 56.0 233.3 511.9 34.6 11.3 47.0 125.24
Source: Same as in Table 2A.
Note: same as in Table 2A.
Table 8B: Per cent distribution of agricultural worker among cultivators and labour categories
by gender and age group (youth) 2017–18 to 2019–20.
Sex Year India All age group Youth (15-29 year age)
Agricultural worker WPR Agricultural worker WPR
Cultivator Labour Agri.
Worker
% to
Total
worker
Cultivator Labour Agri.
Worker
% to
Total
worker
Male 2017–18 76.96 21.83 40.24 52.07 73.63 25.01 32.73 48.32
2018–19 77.18 21.60 38.28 52.25 73.17 25.47 30.89 48.59
2019–20 76.55 21.63 39.95 53.89 73.97 23.33 32.9 50.94
Female 2017–18 64.52 34.21 56.99 16.51 65.75 33.00 48.87 13.46
2018–19 67.66 31.20 55.29 17.61 67.3 30.99 46.82 13.32
2019–20 70.34 28.00 59.95 21.85 72.63 25.31 51.86 17.55
Person 2017–18 73.23 25.55 44.13 34.69 71.42 27.24 36.08 31.44
2018–19 74.15 24.66 42.49 35.29 71.52 27.03 34.17 31.43
2019–20 74.25 23.99 45.57 38.17 73.51 24.00 37.55 34.73
Source: Same as in Table 2A.
Note: same as in Table 2A.
The confusion about the dominance of women in the agri-workforce has arisen due to
mistaking it with source-wise employment of women workers. Of 100 women who are in the
workforce, 60 are employed in agriculture and allied activities. Similarly, of 100 women
working in agriculture, 70 per cent are self-employed, i.e., they belong to the cultivator’s
household. As WPR of women is less than half of that of men, the total female labour engaged
in agriculture turns out to be much smaller than the male labour engaged in agriculture.
Estimates derived from PLFS 2019–20 show that 86.2 million agriculture workers were

12
females and 147.1 million were males. Therefore, policies for agricultural development need
to focus on both, males as well as females.
The PLFS data shows that three fourth of agriculture workers are self-employed as
cultivators and this share remains more or less stable. The number of cultivators in India has
increased from 147 million in 2017–18 to 173 million in 2019–20 while the number of
agricultural labours showed an increase of only 4.6 million in two years. These changes do not
support the assertion of de-peasantisation in the country.
Age-wise estimates of the workforce reveal a big increase in the number of youth (aged
15–29 years) working in agriculture in the year 2019–20. Youth constituted one fifth of the
agriculture workforce and 28 per cent of non-agriculture workers. Another way to look at the
proclivity of youth to stay in agriculture is by comparing its distribution in the two broad
occupation groups. Annual PLFS data show that based on usual status, around 37 per cent of
young workers were employed in agriculture activities while 63 per cent in non-agricultural
activities. The distribution of elderly workforce between agriculture and non-agriculture is 52
per cent and 48 percent respectively (ref year 2019-20). These results show that the youth have
a greater preference to work in non-agricultural occupations as compared to an older age group.
However, three years’ data present a mixed picture of change in this preference for agriculture
vis à vis non agriculture. These facts, though pertain to a very short period, do not support the
argument that youths are not staying in agriculture.
Summary and Conclusions
India has experienced a serious mismatch between structural changes in output and
employment as growth rate in the output of the non-agriculture sector did not generate
commensurate employment. Further, improvement in literacy, schooling, and attainment of
higher education and skills and vocational education have led to a much faster increase in the
number of persons seeking decent jobs with better work environments, regular employment
and greater remuneration. Job creation for this kind of employment has not kept pace with the
increase in the number of job seekers. Lastly, because of job security, assured salary and other
pay and prestige associated with it, preference towards government jobs has increased
tremendously. All these factors have a significant bearing on the labour market, labour force,
workforce, unemployment, nature of employment and distribution of workers over various
activities, and necessitate appropriate policy response for employment generation. However,
uninterrupted data flow on various aspects of employment has been a big gap for evidence-
based policymaking on employment in the country.
The Periodic Labour Force Survey was started in 2017–18 to fill this gap and provide
a rich source of data for examining labour and employment issues and for designing appropriate
policies to address them. This paper uses PLFS data sets for three consecutive years, i.e., 2017–
18, 2018–19 and 2019–20, to analyze changes in employment and workforce and to ascertain
the veracity of various assertions such as a decline in worker-to-population ratio, increase in

13
unemployment, withdrawal of women from workforce and deterioration in the overall
employment scenario in the country, etc.
The labour force in the country has increased by 10.8 per cent in two years after 2017–
18, which has raised the LFPR from 36.9 per cent to 40.1 per cent. The increase was much
higher for female labour and this raised their share in the total labour force in the country from
23.1 to 27.9 per cent between 2017–18 and 2019–20. The latest PLFS data shows that 56.8 per
cent of men, 22.8 per cent women and 40.1% of all persons in India are in the labour force.
The number of workers (workforce) showed a 20 per cent higher increase as compared
to the increase in labour force between 2017–18 and 2019–20. Employment based on usual
status increased by 2.7 per cent during 2018–19 and 9.4 per cent in 2019–20. Between 2017–
18 and 2019–20, 37.7 million women and 18.3 million men joined the workforce. As a result
of these changes, the WPR in rural areas increased from 35.0 per cent to 39.2 per cent and in
urban areas from 33.9 per cent to 35.9 per cent. The WPR of women increased from 16.5 per
cent to 21.8 per cent. Despite this progress, the workers’ participation rate of women in the
country remained 40 per cent of WPR for men.
The direction and pattern of change in employment based on CWS data were similar to
Usual status employment but the increase was smaller. The PLFS data clearly indicates that
work opportunities in the country during 2017–18 and 2019–20 have seen a significant
increase.
The rate of unemployment shows a big decline based on usual status of employment
and ruled at 4.84 per cent in year 2019–20. The extent and incidence of unemployment based
on current weekly status are higher and show an increase in the number of unemployed persons
in two years by 3.4 million. The unemployment rate based on current weekly status remained
around 8.8 per cent during the three years from 2017-18 to 2019-20.
The number of jobs created in industry and services continued to increase, even during
2019–20, which includes April–June 2020 when India faced the first wave of Covid-19.
Industry added 3.4 million jobs and the services sector added 6 million jobs during 2019–20.
The agriculture and allied sector provided employment to 40 per cent male workers, 60 per
cent female workers and 45.6 per cent to all during 2019–20. The industry sector absorbs 26
per cent of male workers and 16.6 per cent of total female in workforce. The service sector
provided employment to 33.6 per cent male and 23.5 per cent of female workers. Sixty per cent
of all women workers in the country are employed in agriculture, 17 per cent in industry and
23 per cent in the service sector. In the case of male workers, 40 per cent are employed in
agriculture, 27 per cent in industry and one third in the services sector.
The participation of women in agriculture is rising but men continue to dominate the
agriculture workforce with a 63 per cent share. The PLFS data shows an increase in the number
of cultivators in India, thus refuting the assertion of de-peasantisation of the country. The age-
wise estimates of the workforce reveal a sizeable increase in the number of youth (aged 15–29

14
years) working in agriculture in the year 2019–20. The analysis reveals that youth have a higher
preference to work in non-agricultural occupations as compared to an older age group, but three
years’ data do not support the argument that youths are not staying in agriculture.
Acknowledgements
The authors thank Ms. Indrani Dasgupta for her help in language editing of the paper.
Disclaimer
Views expressed in the paper are personal.

15
References
Anand, Ishan & Anjana, Thampi (2021). Growing Distress and a Falling Unemployment Rate,
What is going on in the labour market? The India Forum, 12 OCT 2021, Issue: October
1, 2021.
GOI (2021). Annual Report, Periodic Labour Force Survey (PLFS), July 2019 - June 2020.
National Statistical Office, Ministry of Statistics and Programme Implementation, July.
Kannan, K. P., & Mohd, Imran Khan (2022). Loss of Job, Work and Income in the Time of
Covid-19: An Analysis of PLFS Data, Economic & Political Weekly, 57 (2): 37-41.
Mehrotra, Santosh & Jajati, JK (2021) Stalled Structural Change Brings an Employment Crisis
in India, The Indian Journal of Labour Economics, 64: 281–308.
Mehrotra, Santosh & Tuhinsubhra, Giri (2022). Claims vs Reality: India's Bleak Job Picture
Poor Pandemic Management has added 10 Million Youth to the Ranks of the
Unemployed in the Country, Deccan Herald, FEB 13 2022.

NITI Aayog
Designed by
Communication Cell, NITI Aayog