Biomedical NiTi and β-Ti Alloys - MDPI
16
Metals 2022, 12, 406. https://doi.org/10.3390/met12030406 www.mdpi.com/journal/metals Article Biomedical NiTi and β‐Ti Alloys: From Composition, Microstructure and Thermo‐Mechanics to Application Adelaide Nespoli 1 , Francesca Passaretti 1 , László Szentmiklósi 2 , Boglárka Maróti 2 , Ernesto Placidi 3 , Michele Cassetta 4 , Rickey Y. Yada 5 , David H. Farrar 6 and Kun V. Tian 5,6,7, * 1 Consiglio Nazionale delle Ricerche‐Istituto di Chimica della Materia Condensata e di Tecnologie per l’Energia (CNR‐ICMATE), Via G. Previati 1/e, 23900 Lecco, Italy; [email protected] (A.N.); [email protected] (F.P.) 2 Nuclear Analysis and Radiography Department, Centre for Energy Research, 29‐33 Konkoly‐Thege Miklós Street, 1121 Budapest, Hungary; szentmiklosi.laszlo@ek‐cer.hu (L.S.); maroti.boglarka@ek‐cer.hu (B.M.) 3 Department of Physics, Sapienza University of Rome, Piazzale Aldo Moro 5, 00185 Rome, Italy; [email protected] 4 Department of Dental and Maxillo‐Facial Sciences, Sapienza University of Rome, Piazzale Aldo Moro 5, 00185 Rome, Italy; [email protected] 5 Faculty of Land and Food Systems, The University of British Columbia, Vancouver, BC V6T 1Z4, Canada; [email protected] 6 Department of Chemistry, McMaster University, Hamilton, ON L8S 4L8, Canada; [email protected] 7 Department of Chemical science and Pharmaceutical Technologies, Sapienza University of Rome, Piazzale Aldo Moro 5, 00185 Rome, Italy * Correspondence: [email protected] or [email protected] Abstract: A comprehensive, bottoms‐up characterization of two of the most widely used biomedical Ti‐containing alloys, NiTi and β‐Ti, was carried out applying a novel combination of neutron diffraction, neutron prompt‐gamma activation, surface morphology, thermal analysis and mechanical tests, to relate composition, microstructure and physical‐chemical‐mechanical properties to unknown processing history. The commercial specimens studied are rectangular (0.43 × 0.64 mm~0.017 × 0.025 inch) wires, in both pre‐formed U‐shape and straight extended form. Practical performance was quantitatively linked to the influence of alloying elements, microstructure and thermo‐mechanical processing. Results demonstrated that the microstructure and phase composition of β‐Ti strongly depended on the composition, phase‐stabilizing elements in particular, in that the 10.2 wt.% Mo content in Azdent resulted in 41.2% α phase, while Ormco with 11.6 wt.% Mo contained only β phase. Although the existence of α phase is probable in the meta‐stable alloy, the α phase has never been quantified before. Further, the phase transformation behavior of NiTi directly arose from the microstructure, whilst being highly influenced by thermo‐ mechanical history. A strong correlation (r = 0.878) was established between phase transformation temperature and the force levels observed in bending test at body temperature, reconfirming that structure determines performance, while also being highly influenced by thermo‐mechanical history. The novel methodology described is evidenced as generating a predictive profile of the eventual biomechanical properties and practical performance of the commercial materials. Overall, the work encompasses a reproducible and comprehensive approach expected to aid in future optimization and rational design of devices of metallic origin. Keywords: titanium alloy; shape‐memory alloy; microstructure; structure‐property relationship; phase transformation; composition; phase‐stabilizing element Citation: Nespoli, A.; Passaretti, F.; Szentmiklósi, L.; Maróti, B.; Placidi, E.; Cassetta, M.; Yada, R.Y.; Farrar, D.H.; Tian, K.V. Biomedical NiTi and β‐Ti Alloys: From Composition, Microstructure and Thermo‐Mechanics to Application. Metals 2022, 12, 406. https://doi.org/ 10.3390/met12030406 Academic Editors: Antonio Riveiro and Manuel Aureliano Received: 29 December 2021 Accepted: 23 February 2022 Published: 25 February 2022 Publisher’s Note: MDPI stays neutral with regard to jurisdictional claims in published maps and institutional affiliations. Copyright: © 2022 by the authors. Licensee MDPI, Basel, Switzerland. This article is an open access article distributed under the terms and conditions of the Creative Commons Attribution (CC BY) license (https://creativecommons.org/license s/by/4.0/).
-
Upload
khangminh22 -
Category
Documents
-
view
8 -
download
0
Transcript of Biomedical NiTi and β-Ti Alloys - MDPI

Metals 2022, 12, 406. https://doi.org/10.3390/met12030406 www.mdpi.com/journal/metals
Article
Biomedical NiTi and β‐Ti Alloys: From Composition,
Microstructure and Thermo‐Mechanics to Application
Adelaide Nespoli 1, Francesca Passaretti 1, László Szentmiklósi 2, Boglárka Maróti 2, Ernesto Placidi 3,
Michele Cassetta 4, Rickey Y. Yada 5, David H. Farrar 6 and Kun V. Tian 5,6,7,*
1 Consiglio Nazionale delle Ricerche‐Istituto di Chimica della Materia Condensata e di Tecnologie per
l’Energia (CNR‐ICMATE), Via G. Previati 1/e, 23900 Lecco, Italy; [email protected] (A.N.);
[email protected] (F.P.) 2 Nuclear Analysis and Radiography Department, Centre for Energy Research, 29‐33 Konkoly‐Thege Miklós
Street, 1121 Budapest, Hungary; szentmiklosi.laszlo@ek‐cer.hu (L.S.);
maroti.boglarka@ek‐cer.hu (B.M.) 3 Department of Physics, Sapienza University of Rome, Piazzale Aldo Moro 5, 00185 Rome, Italy;
[email protected] 4 Department of Dental and Maxillo‐Facial Sciences, Sapienza University of Rome, Piazzale Aldo Moro 5,
00185 Rome, Italy; [email protected] 5 Faculty of Land and Food Systems, The University of British Columbia, Vancouver, BC V6T 1Z4, Canada;
[email protected] 6 Department of Chemistry, McMaster University, Hamilton, ON L8S 4L8, Canada; [email protected] 7 Department of Chemical science and Pharmaceutical Technologies, Sapienza University of Rome,
Piazzale Aldo Moro 5, 00185 Rome, Italy
* Correspondence: [email protected] or [email protected]
Abstract: A comprehensive, bottoms‐up characterization of two of the most widely used biomedical
Ti‐containing alloys, NiTi and β‐Ti, was carried out applying a novel combination of neutron
diffraction, neutron prompt‐gamma activation, surface morphology, thermal analysis and
mechanical tests, to relate composition, microstructure and physical‐chemical‐mechanical
properties to unknown processing history. The commercial specimens studied are rectangular (0.43
× 0.64 mm~0.017 × 0.025 inch) wires, in both pre‐formed U‐shape and straight extended form.
Practical performance was quantitatively linked to the influence of alloying elements,
microstructure and thermo‐mechanical processing. Results demonstrated that the microstructure
and phase composition of β‐Ti strongly depended on the composition, phase‐stabilizing elements
in particular, in that the 10.2 wt.% Mo content in Azdent resulted in 41.2% α phase, while Ormco
with 11.6 wt.% Mo contained only β phase. Although the existence of α phase is probable in the
meta‐stable alloy, the α phase has never been quantified before. Further, the phase transformation
behavior of NiTi directly arose from the microstructure, whilst being highly influenced by thermo‐
mechanical history. A strong correlation (r = 0.878) was established between phase transformation
temperature and the force levels observed in bending test at body temperature, reconfirming that
structure determines performance, while also being highly influenced by thermo‐mechanical
history. The novel methodology described is evidenced as generating a predictive profile of the
eventual biomechanical properties and practical performance of the commercial materials. Overall,
the work encompasses a reproducible and comprehensive approach expected to aid in future
optimization and rational design of devices of metallic origin.
Keywords: titanium alloy; shape‐memory alloy; microstructure; structure‐property relationship;
phase transformation; composition; phase‐stabilizing element
Citation: Nespoli, A.; Passaretti, F.;
Szentmiklósi, L.; Maróti, B.; Placidi,
E.; Cassetta, M.; Yada, R.Y.; Farrar,
D.H.; Tian, K.V. Biomedical NiTi
and β‐Ti Alloys: From Composition,
Microstructure and
Thermo‐Mechanics to Application.
Metals 2022, 12, 406. https://doi.org/
10.3390/met12030406
Academic Editors: Antonio Riveiro
and Manuel Aureliano
Received: 29 December 2021
Accepted: 23 February 2022
Published: 25 February 2022
Publisher’s Note: MDPI stays
neutral with regard to jurisdictional
claims in published maps and
institutional affiliations.
Copyright: © 2022 by the authors.
Licensee MDPI, Basel, Switzerland.
This article is an open access article
distributed under the terms and
conditions of the Creative Commons
Attribution (CC BY) license
(https://creativecommons.org/license
s/by/4.0/).

Metals 2022, 12, 406 2 of 16
1. Introduction
Ti and Ti‐containing alloys have an extreme strength‐to‐weight ratio, high corrosion
resistance, biocompatibility and inherent ability to osseointegrate, making them ideal for
biomedical applications. Yet it was not until the discovery of NiTi shape‐memory alloy
(trade name Nitinol) in 1961 and subsequent establishment of practical efforts to
commercialize the alloy, did Ti alloys become widely used in industrial, commercial and
medical products. The first medical application of NiTi alloy was orthodontic archwires
in the early 1970s [1]. NiTi is composed of near equiatomic ratios of Ni and Ti, where the
high temperature stable parent phase B2‐Austenite may transform to the low temperature
stable phase B19‐Martensite through a thermoelastic martensitic transition (TMT) [2–6].
For medical applications NiTi is often used as in the austenite state, taking advantage of
its pseudoelasticity, a reversible elastic response to applied stress through twinning
(Figure 1a), with elastic strain of up to 10% [7,8]. The temperature at which the TMT occurs
depends primarily on the chemical composition. It is reported that a 0.1% increase in
nickel can lower the phase transformation temperature by more than 10 °C in Ni rich NiTi
alloy [9,10]. The ability to adjust the transformation temperature through composition
control is very useful, especially for biomedical device design. However, the composition
tolerance for obtaining specific transformation temperature is very strict, on the order of
0.1 to 0.01%; which is very difficult to achieve with metallurgy alone [11]. Fortunately, the
precipitation process can also help adjust composition for tailoring transformation
temperature [11,12]. Through controlled heat treatments, the precipitation of non‐
equiatomic phases can be utilized to gradually change the matrix composition in order to
achieve desired transformation temperatures for specific applications, even from identical
starting compositions. Annealing treatment is also routinely used during production to
adjust the phase transformation temperatures and mechanical responses at differing
temperatures. As an example, Figure 1b,c respectively report the effect of the annealing
temperature on the phase transformation temperatures and on the mechanical response
of a body temperature NiTi wire [13].
Figure 1. (a) Schematic representation of the flag‐shaped pseudoelastic response, where the green
line is the unloading path exploited in biomedical applications. (b) Effect of annealing temperature
on the phase transformation temperatures of a body‐temperature NiTi wire determined with
differential scanning calorimetry (at 10 °C/min in the range −90–120 °C). (c) Effect of annealing
temperature on the strain‐recovery response of a body‐temperature NiTi wire (under a constant
load of 150 MPa, at 5 °C/min in the range −120–150 °C). Each heat treatment was done for 30 min
and followed by a water quench [13].
With the high Ni content in NiTi alloys raising concerns about potential Ni allergies,
in 1980 Burstone and Goldberg developed Ni‐free β‐Ti orthodontic wires by combining
molybdenum (Mo) with pure Ti. With the original composition Ti‐11.5Mo‐6Zr‐4.5Sn (Beta
III) (commercial name TMA), or simply Ti‐Mo alloy, they are near‐beta Ti alloys. They
delivered dampened biomechanical forces compared to the stainless‐steel SS and cobalt‐
chromium‐nickel Co‐Cr‐Ni wires [14,15] and had an excellent balance of properties
including high spring back, low stiffness (~½ that of SS) and high formability and are
amenable to direct welding. In the last 30 years, this alloy family expanded drastically

Metals 2022, 12, 406 3 of 16
with some well‐known β‐Ti alloys, for instance, Ti–15Mo, Ti–Nb–Ta, Ti–24Nb–4Zr–8Sn,
Ti–35Nb–2Ta–3Zr, Ti–35Nb–5Ta–7Zr, Ti–30Nb–4Sn and so on. Thanks to the improved
biocompatibility and decreased elastic moduli compared to other types of Ti alloys, there
remain great potential and interest in design and processing of new β‐Ti employing the
newly developed powder metallurgy, additive manufacturing and FAST‐forge [16].
Despite the extensive biomedical material literature emerging from standard testing,
there is pronounced variation in the reported data [17–21]. Even under the assumption
that composition is near identical for products of the same dimension, significant variation
still exists in elementary properties, such as Young’s modulus of elasticity E, even when
determined by tests with high accuracy and precision, suggesting that processing is the
dominant influencing factor [22]. These comprise a diminutive fraction of fundamental
property determinations. This is exasperated by the lack of information on the products
both at the nanoscopic level as well as in processing, due to commercial secrecy, yet more
so by the difficulty in linking incipient atomistic properties to material performance. The
latter are themselves exasperated by technical difficulty of assessing the sub‐nanometer
level details. Particularly limiting is the destructive nature of many common techniques
including X‐ray and electron‐based determinations as well as mechanical tests involving
fracture or failure [23]. Further, such conventional methods are unable to resolve nano‐
scale details, resulting in alloying and processing histories not being fully accessible.
Neutron scattering provides a solution, as a non‐destructive means of acquiring a
significant range of structural information (~0.01 nm to 1 cm), with even greater temporal
resolution (~10−18 to 1 s) [23]. In contrast to the superficial acquisition achieved with other
light and particle probes, such measurements provide details of the microstructure and
elemental composition of the bulk materials, non‐destructively penetrating through 1–2
cm of material, which is crucial because for metals, surface characteristics differ from those
of the bulk [24].
It is thus the objective of the current study to derive the structure‐property‐
performance correlation of contemporary commercial biomedical wires through
comprehensive characterization of the physical‐chemical‐mechanical properties across a
wide size scaling (Figure 2), retrospectively, and also to relate to thermo‐mechanical
history. The work focuses on two of the most widely used biomedical Ti‐containing alloys,
NiTi and β‐Ti, applying novel neutron scattering, complemented by conventional
microscopy and thermal and mechanical analyses.
Figure 2. Schematic of structure‐property‐performance correlation, accessible through a
combination of conventional and novel techniques encompassing nano‐ through meso‐ to macro‐
length scales of each parameter studied for general materials science and engineering.
2. Materials and Methods
2.1. Materials
Commercial rectangular wires with cross‐sections of 0.43 × 0.64 mm2 (~0.017 × 0.025
inch2) in preformed U‐shape and straight form were used. The following products were

Metals 2022, 12, 406 4 of 16
chosen for each of the two alloy types: NiTi alloy, Vis Plus (Dentalline Gmbh & Co. KG.
Pforzheim, Germany) and Azdent (Baistra Industrial Corp., Zhengzhou, China); β‐Ti
alloy, Ormco Corp. (Glendora, CA, USA) and Azdent (Baistra Industrial Corp.,
Zhengzhou, China). Producers from three main continents, Asian, Europe and North
America, were selected, representing the global market. Only the straight sections of the
U‐shaped wires were measured. Six specimens from each batch, individually numbered
and marked, were tested for reproducibility and statistical certainty.
2.2. Physical Property Determination
2.2.1. Size Conformability
Wire cross‐section dimensions, including width (the larger of the cross‐sectional di‐
mensions) and height, were determined with a digital micrometer gauge (Fowler 0–25
mm Digit Counter Outside Micrometer 52‐224‐009‐0, Fowler High Precision Inc., Newton,
MA, USA) reading to 1 μm, with measurements taken at three equally spaced points along
the span length. The mean value and standard deviation of each specimen were deter‐
mined and more importantly used in subsequent mechanical property determinations in‐
stead of the nominal dimensions.
2.2.2. Surface Morphology Determination with Scanning Electron Microscopy (SEM)
Simultaneous surface morphology and elemental measurements were made using a
LEO1430 SEM instrument (LEO Electron Microscopy Ltd., Cambridge, UK) with a tung‐
sten filament, equipped with Energy Dispersive Microanalysis EDX (IncaCrystal 300, Ox‐
ford Instruments, Abingdon, UK), operated at 20 kV acceleration voltage and 15 mm
working distance. An acquisition time of 120 s was applied, with a dead‐time of 20%. The
specimens were degreased with an acetone‐bath ultrasonic cleaner before each measure‐
ment. Analyses were performed at three equally spaced points along the span length.
2.2.3. Surface Characteristics and Roughness Determination with Atomic Force
Microscope
A ~5 mm‐long segment was cut from each specimen and cleaned with ethyl alcohol
and dried with nitrogen before observation with a commercial AFM (Veeco Multiprobe
Nanoscope IIIa, Veeco, Santa Barbara, CA, USA) operating in contact mode at room tem‐
perature. The silicon nitride tip with ~7–10 nm tip curvature radius was used at a constant
force of ~0.5 N∙m−1. AFM images were analyzed using the Gwyddion 2.34 Data Processing
Software [25]. The surface roughness was determined with AFM topographies, averaging
three images of 20 × 20 μm acquired for each specimen. Surface roughness values Ra
(arithmetical mean deviation of the assessed profile) and RMS (root mean squared) deter‐
mined by the topographies are reported.
2.2.4. Microstructure Examination with Light Microscope
One specimen of each of the four products was randomly chosen for microstructure
examination. Each specimen was embedded in epoxy resin before being mechanically pol‐
ished with polishing papers up to 2500 grit, followed by surface refining with micrometric
diamond powder size from 6 μm down to 1 μm. Micrographs were first taken with a Leitz‐
ARISTOMET light microscope at 1000× magnification, before and after metallographic
etching: NiTi was chemically etched with 3% HF + 12% HNO3 + 85% H2O and β‐Ti was
etched with Kroll, respectively, for 20 s (two separate steps of 10 s each).
2.2.5. Crystal Structure and Phase Composition Determination with Neutron Diffraction
The same batch of each product was measured with the INES diffractometer (SI) at
the ISIS pulsed neutron and muon source at Rutherford Appleton Laboratory (ISIS, RAL,
Harwell, UK) [26]. Each product batch, consisting of 10 specimens, was put into a poly‐
ethylene bag then inserted into an aluminum pocket attached to a metallic rod and loaded

Metals 2022, 12, 406 5 of 16
into the sample tank for measurement times of 73,435 s (~20.4 h); 51,722 s (~14.4 h); 23,855
s (~6.6 h); and 22,350 s (~6.2 h), respectively.
2.2.6. NiTi Phase Transition Temperature Determination
A Differential Scanning Calorimeter DSC (Q100 TA Instruments, New Castle, DE,
USA) equipped with nitrogen cooling system was used in the range from −80 °C to 80 °C
with a heating/cooling rate of 10 °C∙•min−1. Segments of total mass ~0.0100 g were cut and
cleaned with acetone and paper dried prior to each measurement. The procedure was re‐
peated for all six specimens of each product. From the DSC curves obtained, the austenite‐
finish temperature Af was determined in correspondence of the endothermic peak as the
point of intersection between the tangent drawn at the inflection point from the high tem‐
perature side of the valley and the asymptotic line to the adjacent baseline curve.
Two specimens of each product were also chosen to go through solubilization treat‐
ment: they were placed inside sealed quartz tubes and heat‐treated at 750 °C for 10 min
before water cooling at room temperature. Same DSC measurement was done except that
the applied temperature range was from −100 °C to 100 °C.
2.3. Chemical Composition Determination
The chemical composition of each product was determined with EDX (see details in
Section 2.2.2) as well as by Prompt Gamma Activation Analysis (PGAA) at the Budapest
Neutron Centre (BNC), Budapest, Hungary (SI). Ten 5–10 mm‐long sections were cut from
each batch of products before being heat sealed in Teflon bags and loaded into one slot of
the automatic sample changer at the NIPS‐NORMA station at BNC, HU [27,28]. The irra‐
diation and the data collection were carried out using the Budapest NIPS Data Acquisition
software. The acquisition time was equally set to 40,000 s live time (~11.1 h). The spectrum
evaluation was performed using the ‘HYPERMET PC’ software [29], while the concentra‐
tions were calculated with Excel‐utility ProSpeRo [30].
2.4. Mechanical Property Determination
2.4.1. Hardness Determination with Vickers Test
The following procedure was applied: a ~20 mm‐long section was cut and fixed with
wax onto a SS block with the width‐side up. The surface was then polished with P2500
Grit sandpaper under running water and dried with paper towels before centrally aligned
placement onto the sample stage of a hardness tester (Leitz, Leitz GmbH & Co. KG, Ober‐
kochen, Germany). A 200 p (0.2 kg‐force = 1.96 N) diamond indenter was then released
for ~15 s. This was repeated to make ten sufficiently spaced‐out indentations in total. The
mean HV value and standard deviation were calculated and reported.
2.4.2. Three‐Point Bending Test
A dynamic mechanical analyzer (Q800 TA Instruments, New Castle, DE, USA)
equipped with a liquid nitrogen cooling system was used with a crosshead rate of 1.0
mm∙•min−1. An in‐house designed‐and‐made apparatus composed of two 0.1 mm‐radius
SS fulcrums placed 10 mm apart with a centrally placed 0.1 mm‐radius SS indenter above
them was firmly installed onto the testing stage of the DMA through a film tension clamp
(Figure S1). The instrument was then calibrated for clamp plus apparatus weight, dis‐
placement, compliance and force, respectively. The test procedure followed that outlined
in ISO 15841:2014 [31], specifically, ~30 mm‐long specimen was on the apparatus with no
preloading. β‐Ti were deflected at room temperature of ~25 °C with open chamber for the
determination of offset bending force FS(0,1), and force‐deflection rate FΔ from the force‐
deflection diagram by calculating the slope of the line parallel to the linear portion of the
curve at 0.1 mm deflection (Figure S2a).
Metals 2022, 12, 406 6 of 16
NiTi were deflected at ~37 °C (Ttest = body temperature) at the first mechanical cycle
with a closed chamber to 2 mm for the determination of the bending forces during un‐
loading. Although 2 mm is lower than the 3.1 mm recommended by the standards [31],
this is the largest deflection achievable without the specimen ‘jumping’ off the test appa‐
ratus and not returning to the original position. Following ISO, the following were taken
to represent four peculiar steps of the reverse transformation: the elastic recovery of mar‐
tensite (F1 at 2 mm), the start of martensite‐to‐austenite transition (F2 at 1.5 mm), the end
of the martensite‐to‐austenite transition (F3 at 0.5 mm) and the start of the elastic recovery
(F4 at 0.3 mm) (Figure S2b).
Furthermore, flexural modulus of elasticity E was calculated using the following
Equation (1):
𝑬∆𝑷∆𝒚
𝑳𝟑
𝟒𝒃𝒅𝟑𝟏 𝟐.𝟖𝟓
𝒅𝑳
𝟐 𝟎.𝟖𝟒𝒅𝑳
𝟑 (1)
where L is the support span, b and d the specimen width and height, P/y the gradient of the (steepest) linear portion of the load‐deflection curve and 1 2.85 0.84
the shear correction [32].
2.5. Statistical Analyses
Unpaired two‐tailed Student’s t‐test [33] was applied to analyze the statistical differ‐
ence between the means of the two products of each alloy type with a 95% confidence
interval, α = 0.05. One‐way ANOVA was carried out to analyze statistical variation
amongst the two alloy types, and statistically significant findings (p < 0.05) were high‐
lighted by the Tukey (honestly significant difference, HSD) post‐hoc test. A Pearson cor‐
relation test was carried out where requisite using the relevant functions in Microsoft Ex‐
cel, at α = 0.10.
3. Results
3.1. Physical Properties
3.1.1. Size Conformability
The majority of the wires have on average larger dimensions in height and smaller
dimensions in width with respect to standard sizes (Table 1), with NiTi wires showing an
average deviation of 1.95% in height (~8.4 μm). Although the width mean is the same as
0.64, the value spread is high as evidenced by the higher standard deviation (SD). β‐Ti
wires showed the least accuracy in both height (2.1% Dev~9.0 μm) and width (2.9%
Dev~18.6 μm) (Table 1). Following the specification [34] that the equivalent diameter Deq
for non‐round wire should be taken as 1.13√A (A is cross‐sectional area), Deq of all the
samples are within the tolerance of ±0.025 mm (D*).
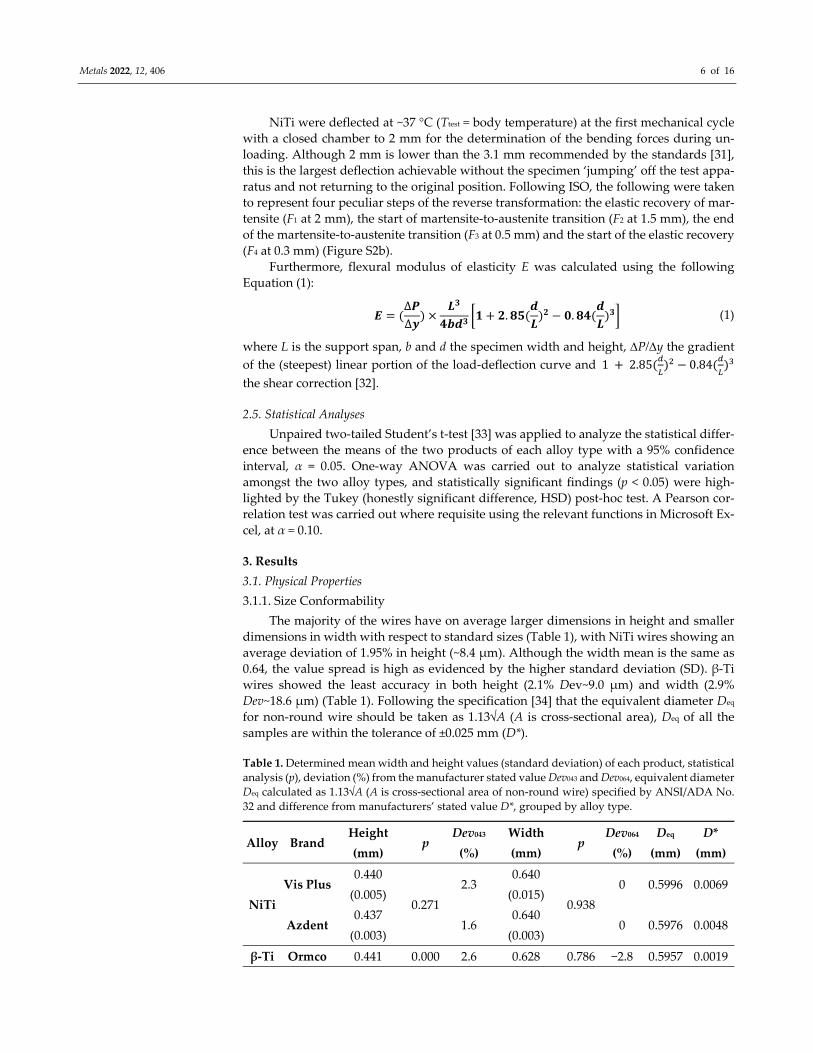
Table 1. Determined mean width and height values (standard deviation) of each product, statistical
analysis (p), deviation (%) from the manufacturer stated value Dev043 and Dev064, equivalent diameter
Deq calculated as 1.13√A (A is cross‐sectional area of non‐round wire) specified by ANSI/ADA No.
32 and difference from manufacturers’ stated value D*, grouped by alloy type.
Alloy Brand Height
(mm) p
Dev043
(%)
Width
(mm) p
Dev064
(%)
Deq
(mm)
D*
(mm)
NiTi
Vis Plus 0.440
(0.005) 0.271
2.3 0.640
(0.015) 0.938
0 0.5996 0.0069
Azdent 0.437
(0.003) 1.6
0.640
(0.003) 0 0.5976 0.0048
β‐Ti Ormco 0.441 0.000 2.6 0.628 0.786 −2.8 0.5957 0.0019

Metals 2022, 12, 406 7 of 16
(0.003) (0.002)
Azdent 0.423
(0.008) −1.6
0.627
(0.007) −3.0 0.5819 −0.0109
ANOVA analysis showed a significant variation within groups and Tukey analysis
(Table S1). The measured actual dimension of each product, height and width, as well as
measurement errors, instead of the nominal dimension, was used in the calculation of
Equation (1) in order to achieve high precision, as to permit distinctions between the val‐
ues for the wires of different thermo‐mechanical history [22].
3.1.2. Surface Morphology Determined with SEM
Both NiTi surfaces are rough with many defects, while Vis Plus showed deep hori‐
zontal striations filled with large pitting (Figure 3a). Sporadic pitting is also evident on
Azdent (Figure 3b). β‐Ti_Ormco surface showed horizontal striations with deep grooves
(Figure 3c) and although Azdent surface did not show striations it had many wide and
deep pitting and dimples (Figure 3d).
Although surface morphology provides visual evidence of superficial defects and ir‐
regularities, the 2D nature of SEM interferes with quantitative characterization of the ex‐
tent of irregularity and unevenness. Quantitative determination of the roughness was,
therefore, conducted with AFM.
Figure 3. Representative SEM micrographs at 2000× magnification of (a) NiTi_Vis Plus, (b)
NiTi_Azdent, (c) β‐Ti_Ormco and (d) β‐Ti_Azdent. The scale bar is 20 μm.
3.1.3. Surface Characteristics and Roughness Determined with AFM
Representative 2D and 3D views of the surfaces are presented for visualization, with
lateral resolution of ~7 nm and vertical resolution of ~0.1 nm (Figure 4). All surfaces con‐
tain parallel striations along the wire axis. The parallel striations appear deeper in
NiTi_Vis Plus, as evidenced by its larger vertical range extent (Δ ~1.3 μm vs. 0.69 μm for
Azdent) over an identical surface domain of 400 μm2 (Figure 4a,b).

Metals 2022, 12, 406 8 of 16
Figure 4. Representative 2D and 3D AFM topographies of (a,b) NiTi_Vis Plus, (c,d) NiTi_Azdent,
(e,f) β‐Ti_Ormco.
Azdent surfaces also possess shallow scratch lines, in all directions, some crossing
the striations (Figure 4c,d). Pronounced grooving and pitting are evident on the β‐
Ti_Ormco surfaces (Figure 4e,f), in line with the SEM determinations. Its vertical range
extent ~1.1 μm stands in between the two NiTi products. It was not possible to measure
β‐Ti_Azdent due to its peak‐to‐peak height exceeding the 5 μm vertical scanning limit.
Amongst the two NiTi, although Vis Plus’ determined surface roughness values are
higher (Table 2), the difference between the means is not statistically significant at α = 0.05.
Table 2. AFM determined surface roughness parameters (Standard Deviation), Vickers hardness
values HV0.2 (Standard Deviation), converted HV values in the SI unit of GPa and statistical results.
Alloy Brands RMS
(nm) p
Ra
(nm) p HV0.2
HV
(GPa) p
Vis Plus 350
(25) 0.12
290
(20) 0.11
371.31
(12.98)
3.64
(0.13) <0.001
NiTi Azdent 270
(40)
225
(30)
397.62
(11.85)
3.90
(0.12)
Ormco 320
(10) ―
270
(10) ―
353.91
(8.89)
3.47
(0.09) 0.905
β‐Ti Azdent ― 354.52
(14.47)
3.48
(0.14)

Metals 2022, 12, 406 9 of 16
3.1.4. Light Microscopy Observations
Both of the two polished NiTi surfaces have coarse precipitates unevenly distributed
(highlighted with blue dashed circles in Figure 5a), indicating that they have been through
a thermal treatment, probably ~500 °C, in “shape setting” into the U shape. The polished
β‐Ti_Ormco surface presented reliefs (Figure 5b). After etching, both NiTi showed mar‐
tensite lamellae with the needle‐like morphology (black dashed circles), amongst the
smooth austenite (Figure 5c); β‐Ti_Azdent showed small grains near wire border, whose
composition needs further analysis (Figure 5d).
Figure 5. Representative light micrographs at 1000× magnification of (a) polished NiTi_Azdent with
precipitates (blue dashed circles) and (b) polished β‐Ti_Ormco with parallel reliefs (orange dashed
line), (c) etched NiTi_Vis Plus with martensite lamellae regions (dashed black circles) and (d) small
grains are visible near etched β‐Ti_Azdent wire border, whose composition needs further analysis.
The scale bar is 20 μm.
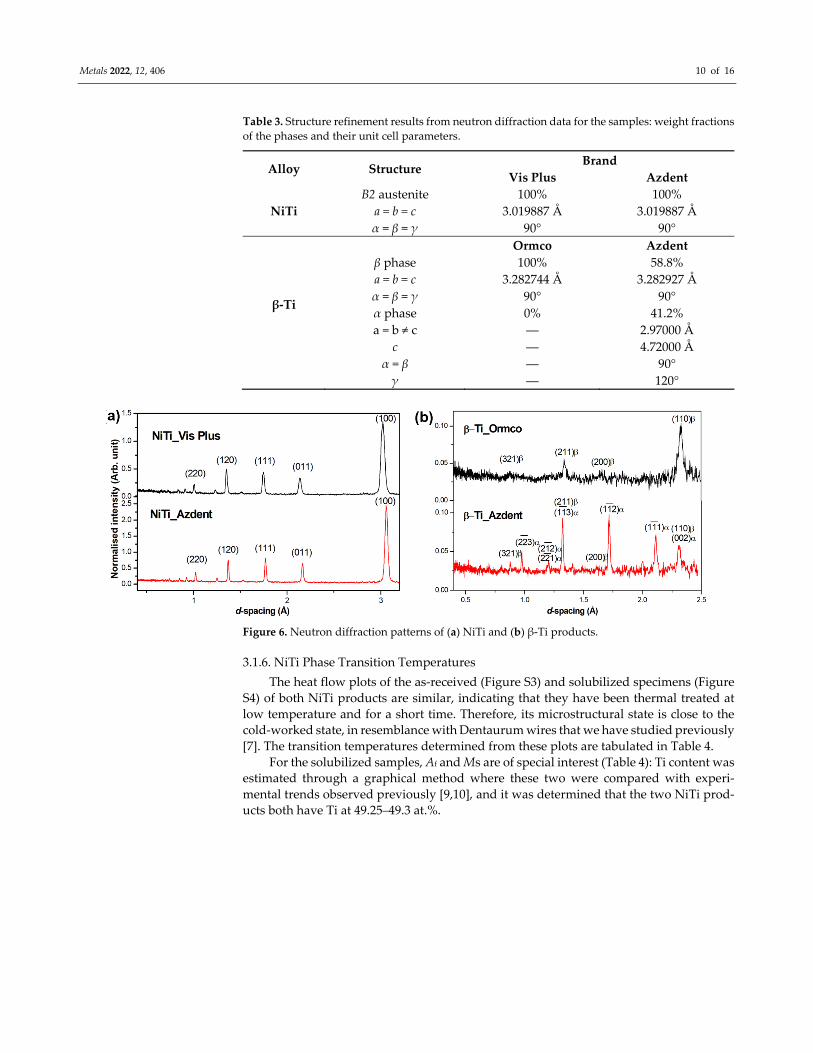
3.1.5. Crystal Structure and Phase Composition Determined with Neutron Diffraction
Neutron diffraction data were analyzed with GSAS (General Structure Analysis Sys‐
tem) software [35] for the refinement of structural models to powder diffraction data with
the EXPGUI interface [36], using the Rietveld method to determine phase weight fraction
(Figure 6). Both NiTi products are fully austenite at room temperature (Table 3). β‐
Ti_Ormco contains only body‐centered cubic β phase, while β‐Ti_Azdent unexpectedly
contains ~41.2 wt.% of close‐packed hexagonal α phase besides the expected β phase. This
is a direct result of the significantly lower fraction of the β‐stabilizing element Mo. The
peak broadening present at nearly all peaks in the diffraction spectra is a manifestation of
preferred orientation, which is almost always present in metal wires due to the manufac‐
turing process [17].
Metals 2022, 12, 406 10 of 16
Table 3. Structure refinement results from neutron diffraction data for the samples: weight fractions
of the phases and their unit cell parameters.
Alloy Structure Brand
Vis Plus Azdent
NiTi
B2 austenite 100% 100%
a = b = c 3.019887 Å 3.019887 Å
α = β = γ 90° 90°
β‐Ti
Ormco Azdent
β phase 100% 58.8%
a = b = c 3.282744 Å 3.282927 Å
α = β = γ 90° 90°
α phase 0% 41.2%
a = b ≠ c ― 2.97000 Å
c ― 4.72000 Å
α = β ― 90°
γ ― 120°
Figure 6. Neutron diffraction patterns of (a) NiTi and (b) β‐Ti products.
3.1.6. NiTi Phase Transition Temperatures
The heat flow plots of the as‐received (Figure S3) and solubilized specimens (Figure
S4) of both NiTi products are similar, indicating that they have been thermal treated at
low temperature and for a short time. Therefore, its microstructural state is close to the
cold‐worked state, in resemblance with Dentaurum wires that we have studied previously
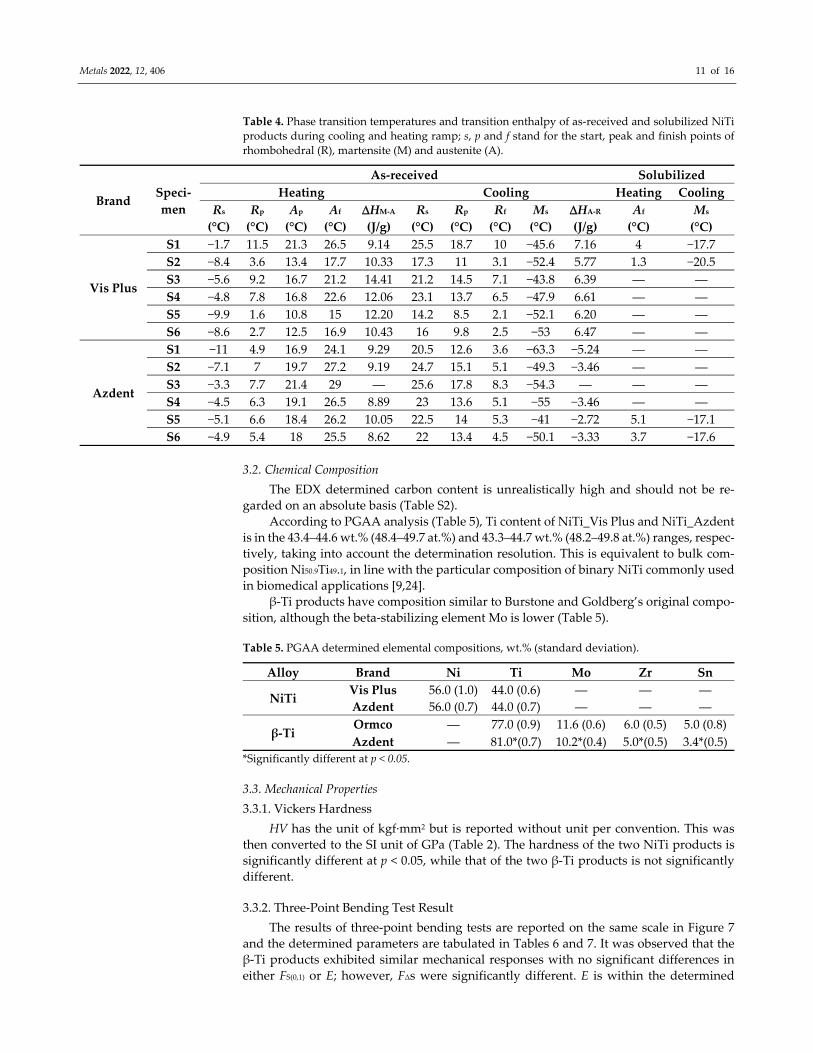
[7]. The transition temperatures determined from these plots are tabulated in Table 4.
For the solubilized samples, Af and Ms are of special interest (Table 4): Ti content was
estimated through a graphical method where these two were compared with experi‐
mental trends observed previously [9,10], and it was determined that the two NiTi prod‐
ucts both have Ti at 49.25–49.3 at.%.
Metals 2022, 12, 406 11 of 16
Table 4. Phase transition temperatures and transition enthalpy of as‐received and solubilized NiTi
products during cooling and heating ramp; s, p and f stand for the start, peak and finish points of
rhombohedral (R), martensite (M) and austenite (A).
Brand Speci‐
men
As‐received Solubilized
Heating Cooling Heating Cooling
Rs
(°C)
Rp
(°C)
Ap
(°C)
Af
(°C)
HM‐A
(J/g)
Rs
(°C)
Rp
(°C)
Rf
(°C)
Ms
(°C)
HA‐R
(J/g)
Af
(°C)
Ms
(°C)
Vis Plus
S1 −1.7 11.5 21.3 26.5 9.14 25.5 18.7 10 −45.6 7.16 4 −17.7
S2 −8.4 3.6 13.4 17.7 10.33 17.3 11 3.1 −52.4 5.77 1.3 −20.5
S3 −5.6 9.2 16.7 21.2 14.41 21.2 14.5 7.1 −43.8 6.39 ― ―
S4 −4.8 7.8 16.8 22.6 12.06 23.1 13.7 6.5 −47.9 6.61 ― ―
S5 −9.9 1.6 10.8 15 12.20 14.2 8.5 2.1 −52.1 6.20 ― ―
S6 −8.6 2.7 12.5 16.9 10.43 16 9.8 2.5 −53 6.47 ― ―
Azdent
S1 −11 4.9 16.9 24.1 9.29 20.5 12.6 3.6 −63.3 −5.24 ― ―
S2 −7.1 7 19.7 27.2 9.19 24.7 15.1 5.1 −49.3 −3.46 ― ―
S3 −3.3 7.7 21.4 29 ― 25.6 17.8 8.3 −54.3 ― ― ―
S4 −4.5 6.3 19.1 26.5 8.89 23 13.6 5.1 −55 −3.46 ― ―
S5 −5.1 6.6 18.4 26.2 10.05 22.5 14 5.3 −41 −2.72 5.1 −17.1
S6 −4.9 5.4 18 25.5 8.62 22 13.4 4.5 −50.1 −3.33 3.7 −17.6
3.2. Chemical Composition
The EDX determined carbon content is unrealistically high and should not be re‐
garded on an absolute basis (Table S2).
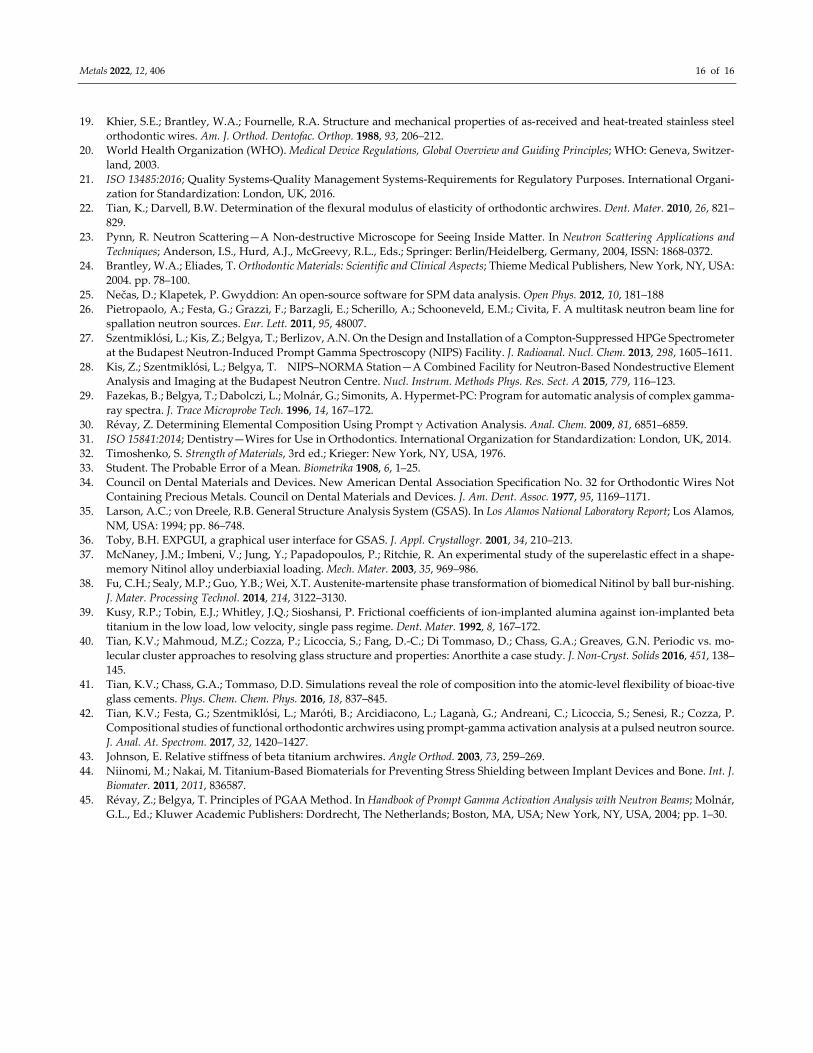
According to PGAA analysis (Table 5), Ti content of NiTi_Vis Plus and NiTi_Azdent
is in the 43.4–44.6 wt.% (48.4–49.7 at.%) and 43.3–44.7 wt.% (48.2–49.8 at.%) ranges, respec‐
tively, taking into account the determination resolution. This is equivalent to bulk com‐
position Ni50.9Ti49.1, in line with the particular composition of binary NiTi commonly used
in biomedical applications [9,24].
β‐Ti products have composition similar to Burstone and Goldberg’s original compo‐
sition, although the beta‐stabilizing element Mo is lower (Table 5).
Table 5. PGAA determined elemental compositions, wt.% (standard deviation).
Alloy Brand Ni Ti Mo Zr Sn
NiTi Vis Plus 56.0 (1.0) 44.0 (0.6) ― ― ―
Azdent 56.0 (0.7) 44.0 (0.7) ― ― ―
β‐Ti Ormco ― 77.0 (0.9) 11.6 (0.6) 6.0 (0.5) 5.0 (0.8)
Azdent ― 81.0*(0.7) 10.2*(0.4) 5.0*(0.5) 3.4*(0.5)
*Significantly different at p < 0.05.
3.3. Mechanical Properties
3.3.1. Vickers Hardness
HV has the unit of kgf∙mm2 but is reported without unit per convention. This was
then converted to the SI unit of GPa (Table 2). The hardness of the two NiTi products is
significantly different at p < 0.05, while that of the two β‐Ti products is not significantly
different.
3.3.2. Three‐Point Bending Test Result
The results of three‐point bending tests are reported on the same scale in Figure 7
and the determined parameters are tabulated in Tables 6 and 7. It was observed that the
β‐Ti products exhibited similar mechanical responses with no significant differences in
either FS(0,1) or E; however, FΔs were significantly different. E is within the determined

Metals 2022, 12, 406 12 of 16
range for unaged alloy. Thus, it could be inferred that both products are unaged. NiTi
products exerted very similar unloading forces and E.
Table 6. Determined three‐point bending test parameters of β‐Ti products: offset bending force
FS(0,1), force‐deflection rate FΔ, flexural modulus of elasticity E (standard deviation), and statistical
analysis result p values.
FS(0,1)
(N) p
FΔ
(N/mm) p
E
(GPa) p
Ormco 10.22
(0.35) 0.170
15.12
(0.29) 0.0007
70.54
(2.35) 0.613
Azdent 9.94
(0.32)
13.64
(0.69)
72.35
(8.20)
Table 7. Determined three‐point bending test parameters of NiTi products: unloading forces (F1, F2,
F3, F4), flexural modulus of elasticity E (standard deviation) and statistical analysis result p values.
Bending Forces during Unloading (N) E
(GPa) p
F1 p F2 p F3 p F4 p
Vis Plus 5.17
(0.43) 0.075
4.04
(0.42) 0.208
3.45
(0.40) 0.418
3.46
(0.30) 0.861
62.23
(4.66) 0.99
Azdent 5.52
(0.08)
4.28
(0.13)
3.60
(0.14)
3.43
(0.21)
62.25
(2.73)
Figure 7. Three‐point bending force‐deflection plots of all specimens of each product. Specimen
numbers are represented as S1–S6.
3.4. Pearson Correlation
The correlation between NiTi mechanical parameters and phase transition tempera‐
ture was noted and hence Pearson correlation test was carried out for quantification. Cor‐
relation test between Δ = Ttest‐Af and the recorded mechanical parameters (Table 7) for each
NiTi_Vis Plus specimen have found that Δ is positively correlated with the mechanical

Metals 2022, 12, 406 13 of 16
parameters at varying degrees from moderate to strong, especially that Δ is strongly cor‐
related with F4 (0.3 mm) with r(4) = 0.88, p = 0.02. However, for NiTi_Azdent Δ is only
moderately positively correlated with F4, but this was not significant at α = 0.10 (Table S3).
4. Discussion
With respect to the surface microstructure, the appearance of randomly distributed
martensite lamellae at room temperature on the etched surfaces (Figure 5c) may suggest
stress‐induced martensite, possibly associated with the non‐uniform mechanical polish‐
ing process [37,38], although the trace amount was not detected by neutron diffraction.
The existence of martensite at room temperature is also supported by DSC analysis
which registered Af as being close to room temperature. This discrepancy will be further
investigated in the following work. Regardless, DSC and 3‐point bending measurements
elucidated that at service temperature (37 °C), both products maintained the full austenite
structure, indicating that when under stress they will exhibit pseudoelastic behavior [39].
Furthermore, the forces exerted by the products are constant and moderate biomechanical
forces that do not cause damage to the surrounding tissues.
The observed coarse precipitates unevenly distributed on NiTi surfaces (Figure 5a)
indicated that they have been through a thermal treatment, probably ~500 °C, in “shape
setting” into the U shape. This kind of defect in general increases the developed force and
reduces the mechanical hysteresis [7], as was observed from our mechanical test results
(Figure 7 and Table 7). Contemporarily, they changed the amount of the released and ab‐
sorbed latent heat during phase transition. In fact, broad peaks (Figure S3) and low en‐
thalpy (Table 5) are all evidence of the existence of defects.
EDX determined composition for the NiTi alloys was deemed unreliable, firstly due
to the unrealistically high carbon content; secondly, EDX only determines superficial com‐
position due to the short penetration depth of electrons as well as the marked discrepancy
between EDX‐determined surface and bulk compositions [18,40,41]. Thus PGAA, one of
the most accurate and efficient non‐destructive techniques [42], was applied taking ad‐
vantage of the deeper penetration depth. The determined precise bulk composition is in
line with the particular composition of binary NiTi commonly used in biomedical appli‐
cations [9,24].
However, this range is wider than the strict composition tolerance for controlling
transition temperatures, at a precision up to a tenth of at. %, only achievable with precise
alloying during fabrication. For our retrospective investigation, blindly due to commercial
secrecy, solubilization treatment was carried out in order to analyze the microstructure
before the thermal treatment used by the manufacturers to shape the wires, equivalent to
eliminating the thermo‐mechanical history. Under this condition, the only factor influenc‐
ing NiTi alloy’s thermal transition behavior is the chemical composition. Subsequent
graphical comparison with published experimental trends [9,10] led to the conclusion that
both are of the same composition with Ti 49.25–49.3 at. %, within the PGAA determined
composition range, presenting an improved resolution; albeit the latter being non‐destruc‐
tive.
EDX and PGAA‐determined compositions of the β‐Ti products are close both are
similar to Burstone and Goldberg’s original composition. The isomorphous beta‐stabiliz‐
ing Mo content is in the metastable range, which indicates the probability of the existence
of the α‐phase in the quenched sample. Azdent’s significantly lower Mo content by 1.3
wt.% (p < 0.05, Table 5) compared to Ormco may explain the existence of the α‐phase in
Azdent and its absence in Ormco (Table 3). Zr is normally added for increasing strength
and hardness. Ormco’s significantly higher Zr content (p < 0.05, Table 5) contributed to its
higher strength.
An important outcome may be outlined from the mechanical responses of NiTi which
are strictly correlated with the thermal analysis results. It was noted that Af of
NiTi_Azdent are more consistent than NiTi_Vis Plus (Table 4). NiTi_Vis Plus specimens
can be divided into two groups: S1, S3, S4 (Group 1) with Δ = Ttest‐Af between 10 and 15

Metals 2022, 12, 406 14 of 16
°C; S2, S5, S6 (group 2) with Δ close to 20 °C. Accordingly, we could also distinguish these
two groups in 3‐point bending test results in that the three specimens within each group
exhibited similar behaviors: group 2 continuously exerted higher forces both during load‐
ing/unloading and higher force‐deflection rate compared to Group 1 (Figure 7). The fun‐
damental aspect of this difference in the flag‐shaped pseudoelastic curve is influenced by
Δ: the higher the Δ value the higher the force‐deflection rate and E value, and the higher
stresses at which the plateau appears, and vice versa, in line with Clausius–Clapeyron
law. Further Pearson correlation test found significant positive correlation between Δ and
these mechanical parameters at r = 0.88. However, the correlation between thermal and
mechanical responses, to the authors’ knowledge, has never been quantified before.
The inconsistent thermal behavior found in NiTi_Vis Plus was also mirrored in the
high variation in their mechanical responses, manifested in high standard deviations in
the tabulated 3‐point bending parameters (Table 7). This inconsistency may be attributed
to the variation in the annealing routes used to shape the wires. On the contrary,
NiTi_Azdent exhibited more consistent thermo‐mechanical behavior.
Neutron diffraction and subsequent Rietveld refinement determined that β‐
Ti_Ormco contained only β‐phase and Azdent contained ~41.2% stiffer hexagonal α‐
phase, in line with the latter’s higher E, within the 1.67% to 4.27% spread determined for
this alloy group [43], and in the unaged form. Hence, Ormco would fit better with the
design idea of newer biomedical implants aimed at reducing stress shielding behavior
[44,45]. Although the existence of α phase is possible in the meta‐stable alloy, the α phase
has never been quantified before.
The force‐deflection rate is an important determinant of the biologic response [14].
There is a growing realization that light continuous forces are preferable. The higher force‐
deflection rate exhibited by β‐Ti_Ormco indicates higher forces exerted at the same de‐
flection as Azdent, and thus higher resistance to deformation. This is expected from the
higher fraction of the high strength β phase in Ormco.
5. Conclusions
Through the comprehensive characterization of commercial NiTi and β‐Ti alloy
products, we demonstrated that the elemental composition intrinsically determines the
material’s thermal and mechanical properties and thus predictable practical performance.
Especially, for β‐Ti the content of phase‐stabilizing element Mo determined the stability
of the main β phase, and the lower Mo content in Azdent has led to 41.2 wt.% α phase.
Although the existence of α phase is possible in the meta‐stable alloy, the α phase has
never been quantified before. A strong correlation (r = 0.88) was established and quanti‐
fied between NiTi thermal transformation temperature and load‐bearing capacities. The
quantified crystal structure and phase composition helped reveal the material processing
methods applied by the manufacturers, retrospectively.
The novel combination of neutron scattering technique (diffraction and PGAA),
SEM‐EDX, AFM, DSC and mechanical tests has been shown to be a reproducible tech‐
nique. The methodology developed and insight acquired herein are expected to help
equip practitioners with an understanding of structure‐property relationships towards
optimizing material selection and aid in future design and optimization of metallic med‐
ical devices.
Supplementary Materials: The following supporting information can be downloaded at:
www.mdpi.com/article/10.3390/met12030406/s1. Figure S1: Photographs of the in‐house‐made,
three‐point bending test apparatus (front view) and (side view), which is composed of two 0.1 mm‐
radius stainless‐steel fulcrums placed 10 mm apart with a centrally placed 0.1 mm‐radius stainless
steel indenter above them. The apparatus is mounted on a DSC (Q100 TA Instruments, New Castle,
DE, USA). Figure S2: Representation of the force‐deflection plots of the 3‐point bending test on (a)
β‐Ti and (b) NiTi wires. The forces considered are marked. Figure S3: DSC heat flow plot of all six
as‐received specimens of (a) NiTi_Vis Plus and of (b) NiTi_Azdent. Specimen numbers are repre‐
sented as S1‐S6. Figure S4: Heat flow plots of solubilized (a,b) NiTi_Vis Plus and (c,d) NiTi_Azdent

Metals 2022, 12, 406 15 of 16
specimens. Table S1: Tukey post‐hoc test: pairwise comparison of the dimension and surface hard‐
ness HV0.2 amongst the samples. Table S2: Semi‐quantitative elemental composition as Wt% deter‐
mined by EDX. Table S3: Pearson correlation test results on pairs of Δ = Ttest‐Af and bending forces
F1‐F4 as well as force‐deflection rate for NiTi products, with calculated coefficient r and p values.
Author Contributions: Conceptualization of work: K.V.T.; Conducting of Experiments: A.N., E.P.,
L.S., K.V.T.; Data analyses: A.N., E.P., L.S., B.M., K.V.T.; Data dissemination and graphics: A.N.,
E.P., K.V.T.; Writing of manuscript: A.N., F.P., M.C., R.Y.Y., D.H.F., K.V.T.; Project support: F.P.,
R.Y.Y., D.H.F. All authors have read and agreed to the published version of the manuscript.
Funding: The Natural Sciences and Engineering Research Council (NSERC), Canada (RGPIN 04598,
RYY) provided funding.
Data Availability Statement: Not applicable.
Acknowledgments: The authors thank Giordano Carcano, Antonella Scherillo (RAL, STFC, UK)
and Giulia Festa (Centro Fermi‐Museo storico della Fisica e Centro Studi e Ricerche Enrico Fermi,
IT) for technical assistance. Carla Andreani, Roberto Senesi and Paola Cozza (University of Rome
Tor Vergata) are acknowledged for helpful discussions. All authors thank Gregory A. Chass (Queen
Mary University of London) for help with planning and interpretation of the work. KVT thanks the
Department of Chemistry (McMaster University) and the Faculty of Land and Food Systems (Uni‐
versity of British Columbia) for support. EP thanks Fabrizio Arciprete (University of Rome Tor
Vergata, IT) for provision of AFM facility. The CNR‐STFC Agreement (2014–2020) on scientific re‐
search collaboration at the ISIS spallation neutron source within the PANAREA project also pro‐
vided support for neutron beam time.
Conflicts of Interest: The authors declare no conflict of interest.
References
1. Meyers, M.A.; Chen, P.‐Y.; Lopez, M.I.; Seki, Y.; Lin, A.Y. Biological materials: A materials science approach. J. Mech. Behav.
Biomed. Mater. 2011, 4, 626–657.
2. Wever, D.; Veldhuizen, A.; De Vries, J.; Busscher, H.; Uges, D.; Van Horn, J. Electrochemical and surface characterization of a
nickel–titanium alloy. Biomaterials 1998, 19, 761–769.
3. Trépanier, C.; Tabrizian, M.; Yahia, L.; Bilodeau, L.; Piron, D.L. Effect of modification of oxide layer on NiTi stent corrosion
resistance. J. Biomed. Mater. Res. 1998, 43, 433–440.
4. Sevcikova, J.; Goldbergova, M.P. Biocompatibility of NiTi alloys in the cell behavior. Biometals 2017, 30,163–169.
5. Nespoli, A.; Dallolio, V.; Stortiero, F.; Besseghini, S.; Passaretti, F.; Villa, E. Design and thermo‐mechanical analysis of a new
NiTi shape memory alloy fixing clip. Mater. Sci. Eng. C 2014, 37, 171–176.
6. Ryhänen, J.; Kallioinen, M.; Tuukkanen, J.; Junila, J.; Niemelä, E.; Sandvik, P.; Serlo, W. In vivo biocompatibility evaluation of
nickel‐titanium shape memory metal alloy: Muscle and perineural tissue responses and encapsule membrane thickness. J. Bio‐
med. Mater. Res. 1998, 41, 481–488.
7. Otsuka, K.; Wayman, C.M. Shape Memory Materials; Cambridge University Press: Cambridge, MA, USA, 1998.
8. Sherif, M.M.; E Ozbulut, O. Tensile and superelastic fatigue characterization of NiTi shape memory cables. Smart Mater. Struct.
2018, 27, 015007.
9. Nespoli, A.; Villa, E.; Bergo, L.; Rizzacasa, A.; Passaretti, F. DSC and three‐point bending test for the study of the thermo‐
mechanical history of NiTi and NiTi‐based orthodontic archwires. J. Therm. Anal. 2015, 120, 1129–1138.
10. Frenzel, J.; George, E.; Dlouhy, A.; Somsen, C.; Wagner, M.; Eggeler, G. Influence of Ni on martensitic phas’e transformations
in NiTi shape memory alloys. Acta Mater. 2010, 58, 3444–3458.
11. Melton, K.N. Ni‐Ti Based Shape Memory Alloys. In Engineering Aspects of Shape Memory Alloys; Duerig, T.W., Melton, K.N.,
Stöckel, D., Wayman, C.W., Eds.; Butterworth‐Heinemann Ltd.: Oxford, UK: 1990; pp. 21–35.
12. Nishida, M.; Wayman, C.M.; Honma, T. Precipitation processes in near‐equiatomic TiNi shape memory alloys. Met. Mater. Trans.
A 1986, 17, 1505–1515.
13. Nespoli, A. ICMATE. unpublished study.
14. Goldberg, A.J.; Burstone, C.J. An evaluation of beta titanium alloys for use in orthodontic appliances. J. Dent. Res. 1979, 58, 593–
600.
15. Burstone, C.J.; Goldberg, A. Beta titanium: A new orthodontic alloy. Am. J. Orthod. 1980, 77, 121–132.
16. Chen, L.‐Y.; Cui, Y.‐W.; Zhang, L.‐C. Recent Development in Beta Titanium Alloys for Biomedical Applications. Metals 2020, 10,
1139.
17. Tian, K.V.; Festa, G.; Basoli, F.; Laganà, G.; Scherillo, A.; Andreani, C.; Bollero, P.; Licoccia, S.; Senesi, R.; Cozza, P. Orthodontic
archwire composition and phase analyses by neutron spectroscopy. Dent. Mater. J. 2017, 36, 282–288.
18. Tian, K.V.; Passaretti, F.; Nespoli, A.; Placidi, E.; Condò, R.; Andreani, C.; Licoccia, S.; Chass, G.A.; Senesi, R.; Cozza, P. Com‐
position―Nanostructure Steered Performance Predictions in Steel Wires. Nanomaterials 2019, 9, 1119.
Metals 2022, 12, 406 16 of 16
19. Khier, S.E.; Brantley, W.A.; Fournelle, R.A. Structure and mechanical properties of as‐received and heat‐treated stainless steel
orthodontic wires. Am. J. Orthod. Dentofac. Orthop. 1988, 93, 206–212.
20. World Health Organization (WHO). Medical Device Regulations, Global Overview and Guiding Principles; WHO: Geneva, Switzer‐
land, 2003.
21. ISO 13485:2016; Quality Systems‐Quality Management Systems‐Requirements for Regulatory Purposes. International Organi‐
zation for Standardization: London, UK, 2016.
22. Tian, K.; Darvell, B.W. Determination of the flexural modulus of elasticity of orthodontic archwires. Dent. Mater. 2010, 26, 821–
829.
23. Pynn, R. Neutron Scattering—A Non‐destructive Microscope for Seeing Inside Matter. In Neutron Scattering Applications and
Techniques; Anderson, I.S., Hurd, A.J., McGreevy, R.L., Eds.; Springer: Berlin/Heidelberg, Germany, 2004, ISSN: 1868‐0372.
24. Brantley, W.A.; Eliades, T. Orthodontic Materials: Scientific and Clinical Aspects; Thieme Medical Publishers, New York, NY, USA:
2004. pp. 78–100.
25. Nečas, D.; Klapetek, P. Gwyddion: An open‐source software for SPM data analysis. Open Phys. 2012, 10, 181–188
26. Pietropaolo, A.; Festa, G.; Grazzi, F.; Barzagli, E.; Scherillo, A.; Schooneveld, E.M.; Civita, F. A multitask neutron beam line for
spallation neutron sources. Eur. Lett. 2011, 95, 48007.
27. Szentmiklósi, L.; Kis, Z.; Belgya, T.; Berlizov, A.N. On the Design and Installation of a Compton‐Suppressed HPGe Spectrometer
at the Budapest Neutron‐Induced Prompt Gamma Spectroscopy (NIPS) Facility. J. Radioanal. Nucl. Chem. 2013, 298, 1605–1611.
28. Kis, Z.; Szentmiklósi, L.; Belgya, T. NIPS–NORMA Station—A Combined Facility for Neutron‐Based Nondestructive Element
Analysis and Imaging at the Budapest Neutron Centre. Nucl. Instrum. Methods Phys. Res. Sect. A 2015, 779, 116–123.
29. Fazekas, B.; Belgya, T.; Dabolczi, L.; Molnár, G.; Simonits, A. Hypermet‐PC: Program for automatic analysis of complex gamma‐
ray spectra. J. Trace Microprobe Tech. 1996, 14, 167–172.
30. Révay, Z. Determining Elemental Composition Using Prompt γ Activation Analysis. Anal. Chem. 2009, 81, 6851–6859.
31. ISO 15841:2014; Dentistry—Wires for Use in Orthodontics. International Organization for Standardization: London, UK, 2014.
32. Timoshenko, S. Strength of Materials, 3rd ed.; Krieger: New York, NY, USA, 1976.
33. Student. The Probable Error of a Mean. Biometrika 1908, 6, 1–25.
34. Council on Dental Materials and Devices. New American Dental Association Specification No. 32 for Orthodontic Wires Not
Containing Precious Metals. Council on Dental Materials and Devices. J. Am. Dent. Assoc. 1977, 95, 1169–1171.
35. Larson, A.C.; von Dreele, R.B. General Structure Analysis System (GSAS). In Los Alamos National Laboratory Report; Los Alamos,
NM, USA: 1994; pp. 86–748.
36. Toby, B.H. EXPGUI, a graphical user interface for GSAS. J. Appl. Crystallogr. 2001, 34, 210–213.
37. McNaney, J.M.; Imbeni, V.; Jung, Y.; Papadopoulos, P.; Ritchie, R. An experimental study of the superelastic effect in a shape‐
memory Nitinol alloy underbiaxial loading. Mech. Mater. 2003, 35, 969–986.
38. Fu, C.H.; Sealy, M.P.; Guo, Y.B.; Wei, X.T. Austenite‐martensite phase transformation of biomedical Nitinol by ball bur‐nishing.
J. Mater. Processing Technol. 2014, 214, 3122–3130.
39. Kusy, R.P.; Tobin, E.J.; Whitley, J.Q.; Sioshansi, P. Frictional coefficients of ion‐implanted alumina against ion‐implanted beta
titanium in the low load, low velocity, single pass regime. Dent. Mater. 1992, 8, 167–172.
40. Tian, K.V.; Mahmoud, M.Z.; Cozza, P.; Licoccia, S.; Fang, D.‐C.; Di Tommaso, D.; Chass, G.A.; Greaves, G.N. Periodic vs. mo‐
lecular cluster approaches to resolving glass structure and properties: Anorthite a case study. J. Non‐Cryst. Solids 2016, 451, 138–
145.
41. Tian, K.V.; Chass, G.A.; Tommaso, D.D. Simulations reveal the role of composition into the atomic‐level flexibility of bioac‐tive
glass cements. Phys. Chem. Chem. Phys. 2016, 18, 837–845.
42. Tian, K.V.; Festa, G.; Szentmiklósi, L.; Maróti, B.; Arcidiacono, L.; Laganà, G.; Andreani, C.; Licoccia, S.; Senesi, R.; Cozza, P.
Compositional studies of functional orthodontic archwires using prompt‐gamma activation analysis at a pulsed neutron source.
J. Anal. At. Spectrom. 2017, 32, 1420–1427.
43. Johnson, E. Relative stiffness of beta titanium archwires. Angle Orthod. 2003, 73, 259–269.
44. Niinomi, M.; Nakai, M. Titanium‐Based Biomaterials for Preventing Stress Shielding between Implant Devices and Bone. Int. J.
Biomater. 2011, 2011, 836587.
45. Révay, Z.; Belgya, T. Principles of PGAA Method. In Handbook of Prompt Gamma Activation Analysis with Neutron Beams; Molnár,
G.L., Ed.; Kluwer Academic Publishers: Dordrecht, The Netherlands; Boston, MA, USA; New York, NY, USA, 2004; pp. 1–30.