In vivo thermal ablation monitoring by echo decorrelation imaging
8
In vivo thermal ablation monitoring by echo decorrelation imaging Swetha Subramanian, Steven M. Rudich, Amel Alqadah, Chandra Priya Karunakaran, and T. Douglas Mast Citation: AIP Conference Proceedings 1481, 374 (2012); doi: 10.1063/1.4757364 View online: http://dx.doi.org/10.1063/1.4757364 View Table of Contents: http://scitation.aip.org/content/aip/proceeding/aipcp/1481?ver=pdfcov Published by the AIP Publishing This article is copyrighted as indicated in the abstract. Reuse of AIP content is subject to the terms at: http://scitation.aip.org/termsconditions. Downloaded to IP: 129.137.232.81 On: Thu, 07 Nov 2013 16:07:17
-
Upload
siucarbondale -
Category
Documents
-
view
6 -
download
0
Transcript of In vivo thermal ablation monitoring by echo decorrelation imaging
In vivo thermal ablation monitoring by echo decorrelation imagingSwetha Subramanian, Steven M. Rudich, Amel Alqadah, Chandra Priya Karunakaran, and T. Douglas Mast Citation: AIP Conference Proceedings 1481, 374 (2012); doi: 10.1063/1.4757364 View online: http://dx.doi.org/10.1063/1.4757364 View Table of Contents: http://scitation.aip.org/content/aip/proceeding/aipcp/1481?ver=pdfcov Published by the AIP Publishing
This article is copyrighted as indicated in the abstract. Reuse of AIP content is subject to the terms at: http://scitation.aip.org/termsconditions. Downloaded to IP:
129.137.232.81 On: Thu, 07 Nov 2013 16:07:17

In Vivo Thermal Ablation Monitoring by Echo Decorrelation Imaging
Swetha Subramanian,a Steven M. Rudich,b Amel Alqadah,a Chandra Priya Karunakaran,a and T. Douglas Masta
Departments of aBiomedical Engineering and bSurgery, University of Cincinnati, Cincinnati, Ohio
Abstract. In the studies reported here, the ability of echo decorrelation imaging to predict thermal ablation in vivo is tested. Radiofrequency ablation (RFA) was performed on a normal swine liver (N=5) and ultrasound ablation using image-ablate arrays was performed on a rabbit implanted with VX2 tumors (N=3). Echo decorrelation imaging was able to predict ablation and overtreatment with high accuracy for both RFA and ultrasound ablation. The effect of tissue motion was studied by comparing the mean cumulative decorrelation with and without treatment. The mean cumulative decorrelation with treatment was found to be significantly greater than the mean cumulative decorrelation without treatment (p=0.0347 for RFA, p=0.024 for ultrasound ablation). The accuracy of ablation predictions was tested using receiver operating characteristic curves and the area under the ROC curve (AUROC) was significant for ablation and overtreatment for RFA (N=5). However, the AUROC was significant for only detecting ablation for the ultrasound ablation experiments (N=2). Keywords: Echo decorrelation imaging; therapy monitoring; bulk ultrasound ablation; radiofrequency ablation PACS: 43.80.Vj, 43.80.Sh
INTRODUCTION
Thermal ablation is a common treatment method for unresectable tumors.1,2 Thermal ablation techniques, such as radiofrequency ablation (RFA), high intensity focused ultrasound (HIFU), microwave and laser ablation, are increasingly important for liver cancer treatment.1,3,4 Currently, RFA is finding clinical applications in the treatment of tumors in the liver, kidneys and lungs.1,2,5,6 Ultrasound ablation procedures such as HIFU and bulk ablation have shown potential for clinical applications.7,8 Treatment monitoring and guidance for thermal ablation is usually done using ultrasound imaging.9 However, ultrasound imaging alone offers limited insight into the degree of ablation.
Echo decorrelation imaging is an ultrasound imaging method that detects rapid changes in ultrasound signals during ablation, producing an echo decorrelation map.10
This decorrelation map, when superimposed on the corresponding ultrasound B-scan image, can be used to estimate thermal damage in the tissue spatially. Echo decorrelation imaging has been shown to predict ablation with high accuracy for in vitro bovine liver.10 Here, we test the ability of echo decorrelation imaging to predict the in vivo effects of RFA in normal swine liver and bulk ultrasound ablation in rabbit liver with VX2 tumor.
11th International Symposium on Therapeutic UltrasoundAIP Conf. Proc. 1481, 374-380 (2012); doi: 10.1063/1.4757364
© 2012 American Institute of Physics 978-0-7354-1093-0/$30.00
374 This article is copyrighted as indicated in the abstract. Reuse of AIP content is subject to the terms at: http://scitation.aip.org/termsconditions. Downloaded to IP:
129.137.232.81 On: Thu, 07 Nov 2013 16:07:17

MATERIALS AND METHODS
In-vivo Radiofrequency Ablation
RFA was performed within a normal swine liver in vivo for N=5 treatments. The swine was anesthetized and opened by laparotomy. A 2.0 cm RFA needle (LaVeen, Boston Scientific) was inserted into the liver parenchyma.
FIGURE 1. (A) Setup for in vivo radiofrequency ablation of swine liver. (B) Representative sections
of RFA-treated tissue and corresponding echo decorrelation maps overlaid on B-scan images. B-scan imaging was performed by the Iris ultrasound imaging and ablation
system11 (Ardent Sound) using a 7 MHz, 192 element linear ultrasound array, positioned with its image plane including the RFA probe. The ultrasound array position was marked on the liver using an electrocautery device. In each treatment, the RFA probe was driven by an RF generator (RF 2000B, Radio Therapeutics, Mountain View, California) with an initial power setting of 20-60 W and a duration of 3-6 min.
For each RFA treatment, beamformed A-lines were acquired by the Iris system using a 14-bit, PC-based A/D converter (Compuscope CS 14200, Gage Applied) at a sampling rate of 33.3 MHz. In each acquisition, 384 A-lines were recorded, comprising two adjacent B-scan frame pairs separated by 20 ms. In each trial, images of untreated liver tissue were acquired for 15-26 s before power was applied to the RFA probe. The recorded signals were processed in MATLAB (The Mathworks) to form B-scan and echo decorrelation images.10 Since the echo decorrelation fluctuates randomly in time, a running-average filter was employed to provide a better estimate of local tissue changes.10 To form cumulative echo decorrelation images for comparison with tissue histology, the temporal maximum of the running-average echo decorrelation was recorded at each pixel location.
After all treatments were performed, the liver was excised and the animal was sacrificed. To maintain tissue shape for accurate registration with B-scan and echo decorrelation images, the excised liver lobes were frozen in a −80 °C freezer and then sliced parallel to the image plane. Tissue sections were scanned on a flatbed scanner (CanoScan 8800F, Canon) at 800 dpi. For direct comparison with echo decorrelation
375 This article is copyrighted as indicated in the abstract. Reuse of AIP content is subject to the terms at: http://scitation.aip.org/termsconditions. Downloaded to IP:
129.137.232.81 On: Thu, 07 Nov 2013 16:07:17

images in each case, scanned tissue sections were oriented and registered to ultrasound images using tissue boundaries and visible probe tracks as reference. To test the ability of echo decorrelation imaging to predict ablation, regions of overtreatment and ablation were segmented based on gross tissue discoloration (ImageJ, National Institute of Health). Representative B-scan images with superimposed echo decorrelation maps and the corresponding tissue sections are shown in Fig. 1B.
FIGURE 2. (A) Setup for in vivo ultrasound ablation of rabbit liver with VX2 tumor using an image-
ablate ultrasound array probe. (B) Sections of ultrasound-ablated tissue and corresponding echo decorrelation maps overlaid on B-scan images.
In-vivo Ultrasound Ablation
Ultrasound ablation was performed using a miniaturized image-ablate array probe on a rabbit with implanted VX2 tumors for N=3 treatments, within a series of experiments described previously.12 The animal was anesthetized and opened via laparotomy. The image-ablate array was inserted into a balloon through which cooling water was circulated. The probe assembly was placed on the liver lobe surface proximal to the VX2 tumor and fixed by a 3D positioning arm, as shown in Fig. 2A. Acoustic coupling was implemented between the probe and liver surface using phosphate buffered saline and confirmed using B-scan imaging from the image-ablate array. Continuous-wave, 4.8 MHz ultrasound was fired from the entire 32-element array in an unfocused beam with spatial-average, temporal-average intensity 38.5 W/cm2. Treatment cycles, consisting of 8.5 s continuous-wave sonication followed by 1.5 s of imaging by the same array, were repeated for exposure durations of 0.5-2.0 min.
Echo signal acquisition was performed in a manner similar to the RFA procedure described above. To assess the effect of disturbances such as tissue motion on echo decorrelation imaging, radiofrequency echo data was acquired during 2-min sham treatments before each ablation exposure. After the treatments were completed, the animal was sacrificed. The liver was then excised, sectioned along the image plane at
376 This article is copyrighted as indicated in the abstract. Reuse of AIP content is subject to the terms at: http://scitation.aip.org/termsconditions. Downloaded to IP:
129.137.232.81 On: Thu, 07 Nov 2013 16:07:17
the array location, and stained with triphenyl tetrazolium chloride (TTC) vital stain. Tissue sections were then scanned and registered as described above for the RFA treatment. Ablation and overtreatment were segmented based on local TTC uptake.
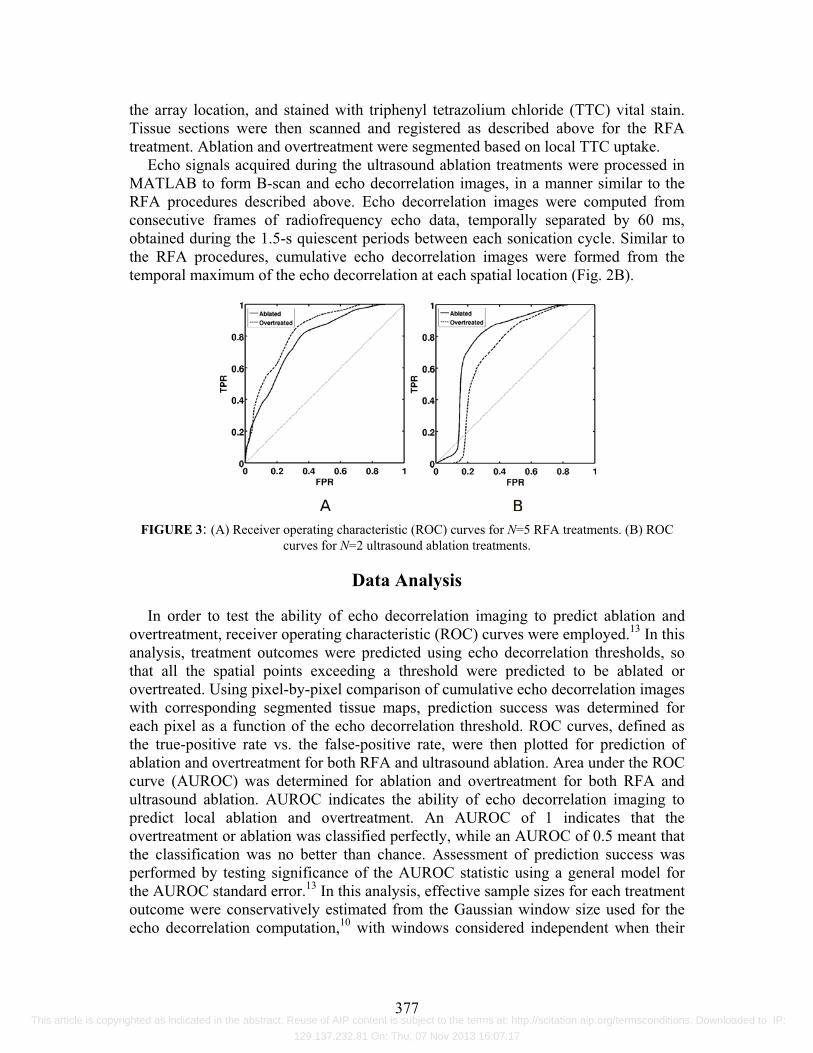
Echo signals acquired during the ultrasound ablation treatments were processed in MATLAB to form B-scan and echo decorrelation images, in a manner similar to the RFA procedures described above. Echo decorrelation images were computed from consecutive frames of radiofrequency echo data, temporally separated by 60 ms, obtained during the 1.5-s quiescent periods between each sonication cycle. Similar to the RFA procedures, cumulative echo decorrelation images were formed from the temporal maximum of the echo decorrelation at each spatial location (Fig. 2B).
FIGURE 3: (A) Receiver operating characteristic (ROC) curves for N=5 RFA treatments. (B) ROC
curves for N=2 ultrasound ablation treatments.
Data Analysis
In order to test the ability of echo decorrelation imaging to predict ablation and overtreatment, receiver operating characteristic (ROC) curves were employed.13 In this analysis, treatment outcomes were predicted using echo decorrelation thresholds, so that all the spatial points exceeding a threshold were predicted to be ablated or overtreated. Using pixel-by-pixel comparison of cumulative echo decorrelation images with corresponding segmented tissue maps, prediction success was determined for each pixel as a function of the echo decorrelation threshold. ROC curves, defined as the true-positive rate vs. the false-positive rate, were then plotted for prediction of ablation and overtreatment for both RFA and ultrasound ablation. Area under the ROC curve (AUROC) was determined for ablation and overtreatment for both RFA and ultrasound ablation. AUROC indicates the ability of echo decorrelation imaging to predict local ablation and overtreatment. An AUROC of 1 indicates that the overtreatment or ablation was classified perfectly, while an AUROC of 0.5 meant that the classification was no better than chance. Assessment of prediction success was performed by testing significance of the AUROC statistic using a general model for the AUROC standard error.13 In this analysis, effective sample sizes for each treatment outcome were conservatively estimated from the Gaussian window size used for the echo decorrelation computation,10 with windows considered independent when their
377 This article is copyrighted as indicated in the abstract. Reuse of AIP content is subject to the terms at: http://scitation.aip.org/termsconditions. Downloaded to IP:
129.137.232.81 On: Thu, 07 Nov 2013 16:07:17

spatial cross-correlation coefficient was less than 0.5. To test whether observed echo decorrelation was due to thermal ablation alone, a
paired t-test was used to compare the mean (spatially averaged) cumulative decorrelation, with and without treatment. For the case of RFA, where echo data was acquired for a minimum of 15 s before each treatment, the mean cumulative echo decorrelation was computed for the 15 s intervals immediately before and after application of power. For the case of ultrasound ablation, the sham treatments of 2-min duration were used for comparison. A paired t-test was also performed to test the significance of difference in the mean cumulative decorrelation within the untreated, ablated, and overtreated regions in the case of RFA.�
To analyze the effect of out-of-plane motion observed in the RFA experiments, a 5 mm block was selected from the untreated area as the region of interest (ROI). The Pearson correlation coefficient was used to determine the similarity between B-scan frames separated by 1 s within the ROI. Motion-compensated echo decorrelation images were formed by computing the echo decorrelation using only the frames for which the correlation coefficient was greater than 0.9. A paired t-test was used to determine the effect of this compensation on spatially averaged, cumulative decorrelation within each segmented region.
FIGURE 4. Comparisons of spatially averaged, cumulative echo decorrelation (mean and standard
deviation) for in vivo ablation experiments. (A) Echo decorrelation after 2-min sham treatment vs. 0.5-2.0 min ultrasound ablation treatments in rabbit liver with VX2 tumor (N=3). (B) Echo decorrelation for
15 s sham treatment vs. 15 s RFA treatment in swine liver (N=5). (C) Echo decorrelation within untreated, ablated, and overtreated regions of swine liver parenchyma after RFA (N=5).
RESULTS
Computed ROC curves for prediction of both ablation and overtreatment are shown for both the RFA and ultrasound ablation experiments in Fig. 3. These ROC curves were computed using all N=5 RFA exposures and all ultrasound ablation exposures with available tissue histology (N=2). AUROC for RFA exposures was 0.78 for prediction of ablation (p=8.1·10−8) and 0.83 for prediction of overtreatment (p=8.5·10−6). AUROC for ultrasound exposures was 0.78 for prediction of ablation (p=0.014) and 0.70 for prediction of overtreatment (p=0.082). Although these AUROC statistics show comparable prediction quality for both sets of experiments, statistical significance for the ultrasound exposures is lower because of the smaller effective sample size, with a conservative estimate of 14 independent predictions of
378 This article is copyrighted as indicated in the abstract. Reuse of AIP content is subject to the terms at: http://scitation.aip.org/termsconditions. Downloaded to IP:
129.137.232.81 On: Thu, 07 Nov 2013 16:07:17
treatment outcome, compared to 101 independent predictions for RFA exposures. Means and standard deviations of the spatially averaged, cumulative echo
decorrelation for ultrasound ablation (Fig. 4A) were 0.0348�0.0203 for 2-min sham treatments and 0.0969�0.0112 after ablation, a significant increase (paired t-test, p=0.0347, N=3). For RFA exposures (Fig. 4B), means and standard deviations of the spatially averaged, cumulative decorrelation were 0.0119�0.0075 after 15 s without treatment and 0.0220�0.0134 after 15 s RFA, also significant (p=0.0204, N=5).
Means and standard deviations for the average cumulative echo decorrelation in untreated, ablated, and overtreated areas of RFA-treated swine liver (Fig. 4C) were 0.0455�0.0253, 0.0831�0.0374, and 0.1345�0.0765 respectively. The average decorrelation within ablated tissue was significantly greater than in untreated tissue (paired t-test, p=0.0024, N=3). The average decorrelation in overtreated tissue was significantly greater than in either ablated (p=0.0494) or untreated (p=0.0140) tissue.
Motion compensation significantly reduced the spatially averaged, cumulative echo decorrelation in untreated regions of RFA-treated swine liver (p=0.0231). However, echo decorrelation was not significantly reduced by motion compensation within the combined ablated and overtreated regions (p=0.24). Thus, echo decorrelation caused by tissue ablation exceeded that caused by out-of-plane tissue motion.
DISCUSSION
The results shown indicate the feasibility of echo decorrelation imaging as a thermal ablation monitoring tool. Significant differences were found between mean cumulative decorrelation with and without treatment, as well as between regions of different treatment outcomes, despite the presence of significant out-of-plane tissue motion. This is possible because frame pairs used to map echo decorrelation were separated by 20-60 ms, a time scale over which ablation-induced echo decorrelation substantially exceeded any artifactual decorrelation caused by tissue motion alone.
B-scan ultrasound images produced using the 32 element image-ablate array were of low resolution compared to those produced using the 192 element L7 diagnostic array. Still, good correspondence was observed between echo decorrelation maps and gross tissue histology. High AUROC values indicate the ability of echo decorrelation imaging to accurately predict ablation and overtreatment, despite complications of tissue motion and limitations of image resolution. Together, these results show that echo decorrelation imaging can map in vivo ablation effects with high accuracy.
ACKNOWLEDGMENTS
This research was supported by NIH grants R43-CA124283 and R21-EB008483.
REFERENCES
1. S. Y. Chiou et al., J Ultrasound Med 26, 487-499 (2007). 2. R. Tateishi et al., Cancer 103, 1201-1209 (2005). 3. H. Rhim and G. D. Dodd, J Clin Ultrasound 27, 221-229 (1999).
379 This article is copyrighted as indicated in the abstract. Reuse of AIP content is subject to the terms at: http://scitation.aip.org/termsconditions. Downloaded to IP:
129.137.232.81 On: Thu, 07 Nov 2013 16:07:17
4. S. Rossi et al., Int J Clin Oncol 7, 225-235 (2002). 5. D. E. Dupuy and S. N. Goldberg SN, J Vasc Interv Radiol 12, 1135-1148 (2001). 6. B. J. Fahey Phys Med Biol 51, 3785-3808 (2006). 7. T. D. Mast et al. J Acoust Soc Am 118, 2715-2724 (2005). 8. F. J. Fry, Eur Urol 23, 2-7 (1993). 9. C. Erce and R. W. Parks RW Br J Surg 90, 272-289 (2003). 10. T. D. Mast et al. J Ultrasound Med 27, 1685-1697 (2008). 11. P. G.. Barthe et al., “Ultrasound therapy system and ablation results utilizing miniature
imaging/therapy arrays.” in 2004 IEEE Ultrasonics Symposium, IEEE Xplore, New York NY, 2004, pp. 1792–1795.
12. T. D. Mast et al., “In-vivo treatment of VX2 tumor by miniaturized image-ablate ultrasound arrays” in 2009 IEEE International Ultrasonics Symposium, edited by M. P. Yuhas, IEEE Xplore, New York NY, 2009, pp. 61–64.
13. W. J. Krzanowski and D. J. Hand, ROC Curves for Continuous Data, Boca Raton FL: CRC Press, 2009.
380 This article is copyrighted as indicated in the abstract. Reuse of AIP content is subject to the terms at: http://scitation.aip.org/termsconditions. Downloaded to IP:
129.137.232.81 On: Thu, 07 Nov 2013 16:07:17