In vivo quantitative NMR imaging of fruit tissues during growth using Spoiled Gradient Echo sequence
10
In vivo quantitative NMR imaging of fruit tissues during growth using Spoiled Gradient Echo sequence S. Kenouche a, b, ⁎, M. Perrier c , N. Bertin d , J. Larionova c , A. Ayadi a , M. Zanca a, e , J. Long c , N. Bezzi b , P.C. Stein a, f , Y. Guari c , M. Cieslak g , C. Godin g , C. Goze-Bac a a Laboratoire Charles Coulomb (L2C) BioNanoNMRI UMR 5221 CNRS, Université Montpellier 2, France b Laboratoire de Technologie des Matériaux et de Génie des Procédés (LTMGP), Faculté des Sciences exactes, Université A. MIRA de Béjaïa, 06000 Béjaïa, Algérie c Institut Charles Gerhardt Montpellier, UMR 5253 CNRS UM2, Chimie Moléculaire et Organisation du Solide, Université Montpellier 2, France d INRA UR 1115 Plantes et Systèmes Horticoles, Domaine Saint-Paul, site Agroparc, 84914 Avignon, 8400 France e Medecine Nucléaire et IRM fonctionnelle, CHU de Montpellier, 34000 France f FKF-SDU, campusvej 55, DK5230 Odense, Danmark g CIRAD/INRIA/INRA, Virtual Plants Team, UMR AGAP, Avenue Agropolis, TA 108/02, 34398 Montpellier Cedex 5, France abstract article info Article history: Received 16 July 2013 Revised 28 May 2014 Accepted 8 August 2014 Keywords: Quantitative NMR imaging Intrinsic parameters Compartmental modeling Contrast agents Cherry tomato Nondestructive studies of physiological processes in agronomic products require increasingly higher spatial and temporal resolutions. Nuclear Magnetic Resonance (NMR) imaging is a non-invasive technique providing physiological and morphological information on biological tissues. The aim of this study was to design a robust and accurate quantitative measurement method based on NMR imaging combined with contrast agent (CA) for mapping and quantifying water transport in growing cherry tomato fruits. A multiple flip-angle Spoiled Gradient Echo (SGE) imaging sequence was used to evaluate the intrinsic parameters maps M 0 and T 1 of the fruit tissues. Water transport and paths flow were monitored using Gd 3+ /[Fe(CN) 6 ] 3− /D − mannitol nanoparticles as a tracer. This dynamic study was carried out using a compartmental modeling. The CA was preferentially accumulated in the surrounding tissues of columella and in the seed envelopes. The total quantities and the average volume flow of water estimated are: 198 mg, 1.76 mm 3 /h for the columella and 326 mg, 2.91 mm 3 /h for the seed envelopes. We demonstrate in this paper that the NMR imaging technique coupled with efficient and biocompatible CA in physiological medium has the potential to become a major tool in plant physiology research. © 2014 Elsevier Inc. All rights reserved. 1. Introduction In plants, the transport and accumulation of water and dry matter in different organs and tissues are major determinants of their growth and final composition [1]. The fluxes of water and carbon exhibit large fluctuations at a short time scale during the diurnal cycle and at a long time scale during the production cycles, depending on plant environment [2]. Current methods to assess these fluxes are either destructive or limited to some organs (e.g. sap flow meters). The fruits are composed of different tissues with a heterogeneous structure and composition. The measurement and mapping of water and other constituents transport are not straightforward, although quite important for understanding fruit growth and final quality in response to internal or external stimuli. The development of methods with high temporal and spatial resolutions which would allow the online in vivo monitoring of this information at the tissue or even cell scales is thus a real challenge for the study of these physiological processes and their localization in the fruit. NMR imaging is a non-invasive and non- destructive tool which can provide access to several types of information such as: tissue architecture, spatial and temporal variability of major components like water and sugar and internal flows in fruit during growth. These types of information are more difficult to quantify by conventional destructive methods. Moreover, beyond the simple visualization of morphological structures, quantitative measurements can be obtained from the NMR images using tissue segmentation and direct evaluation of the signal intensity in the corresponding voxels. During the last two decades this imaging technique has benefited [3,4] from significant theoretical, methodological and instrumental developments. The proton is still the most investigated nucleus because of its abundance and sensitivity in living tissues. For dynamic studies, fast NMR imaging sequences are a prerequisite for the acquisition of time resolved series of data sets. High temporal resolution gives access to a wide diversity of physiological information. However, it must not sacrifice the Magnetic Resonance Imaging 32 (2014) 1418–1427 ⁎ Corresponding author at: Place Eugène Bataillon 34095 Montpellier Cedex 5, France. Tel.: +33 6 52 50 44 68. E-mail address: [email protected] (S. Kenouche). http://dx.doi.org/10.1016/j.mri.2014.08.005 0730-725X/© 2014 Elsevier Inc. All rights reserved. Contents lists available at ScienceDirect Magnetic Resonance Imaging journal homepage: www.mrijournal.com
Transcript of In vivo quantitative NMR imaging of fruit tissues during growth using Spoiled Gradient Echo sequence

Magnetic Resonance Imaging 32 (2014) 1418–1427
Contents lists available at ScienceDirect
Magnetic Resonance Imaging
j ourna l homepage: www.mr i journa l .com
In vivo quantitative NMR imaging of fruit tissues during growth using
Spoiled Gradient Echo sequenceS. Kenouche a,b,⁎, M. Perrier c, N. Bertin d, J. Larionova c, A. Ayadi a, M. Zanca a,e, J. Long c, N. Bezzi b,P.C. Stein a,f, Y. Guari c, M. Cieslak g, C. Godin g, C. Goze-Bac a
a Laboratoire Charles Coulomb (L2C) BioNanoNMRI UMR 5221 CNRS, Université Montpellier 2, Franceb Laboratoire de Technologie des Matériaux et de Génie des Procédés (LTMGP), Faculté des Sciences exactes, Université A. MIRA de Béjaïa, 06000 Béjaïa, Algériec Institut Charles Gerhardt Montpellier, UMR 5253 CNRS UM2, Chimie Moléculaire et Organisation du Solide, Université Montpellier 2, Franced INRA UR 1115 Plantes et Systèmes Horticoles, Domaine Saint-Paul, site Agroparc, 84914 Avignon, 8400 Francee Medecine Nucléaire et IRM fonctionnelle, CHU de Montpellier, 34000 Francef FKF-SDU, campusvej 55, DK5230 Odense, Danmarkg CIRAD/INRIA/INRA, Virtual Plants Team, UMR AGAP, Avenue Agropolis, TA 108/02, 34398 Montpellier Cedex 5, France
⁎ Corresponding author at: Place Eugène Bataillon 3409Tel.: +33 6 52 50 44 68.
E-mail address: [email protected] (S.
http://dx.doi.org/10.1016/j.mri.2014.08.0050730-725X/© 2014 Elsevier Inc. All rights reserved.
a b s t r a c t
a r t i c l e i n f oArticle history:Received 16 July 2013Revised 28 May 2014Accepted 8 August 2014
Keywords:Quantitative NMR imagingIntrinsic parametersCompartmental modelingContrast agentsCherry tomato
Nondestructive studies of physiological processes in agronomic products require increasingly higherspatial and temporal resolutions. Nuclear Magnetic Resonance (NMR) imaging is a non-invasive techniqueproviding physiological and morphological information on biological tissues. The aim of this study was todesign a robust and accurate quantitative measurement method based on NMR imaging combined withcontrast agent (CA) for mapping and quantifying water transport in growing cherry tomato fruits. Amultiple flip-angle Spoiled Gradient Echo (SGE) imaging sequence was used to evaluate the intrinsicparameters maps M0 and T1 of the fruit tissues. Water transport and paths flow were monitored usingGd3+/[Fe(CN)6]
3−/D − mannitol nanoparticles as a tracer. This dynamic study was carried out using acompartmental modeling. The CA was preferentially accumulated in the surrounding tissues of columellaand in the seed envelopes. The total quantities and the average volume flow of water estimated are:198 mg, 1.76 mm3/h for the columella and 326 mg, 2.91 mm3/h for the seed envelopes.We demonstrate inthis paper that the NMR imaging technique coupled with efficient and biocompatible CA in physiologicalmedium has the potential to become a major tool in plant physiology research.
5Montpellier Cedex 5, France.
Kenouche).
© 2014 Elsevier Inc. All rights reserved.
1. Introduction
In plants, the transport and accumulation of water and drymatterin different organs and tissues are major determinants of theirgrowth and final composition [1]. The fluxes of water and carbonexhibit large fluctuations at a short time scale during the diurnalcycle and at a long time scale during the production cycles,depending on plant environment [2]. Current methods to assessthese fluxes are either destructive or limited to some organs (e.g. sapflow meters). The fruits are composed of different tissues with aheterogeneous structure and composition. The measurement andmapping of water and other constituents transport are notstraightforward, although quite important for understanding fruitgrowth and final quality in response to internal or external stimuli.The development of methods with high temporal and spatialresolutions which would allow the online in vivo monitoring of
this information at the tissue or even cell scales is thus a realchallenge for the study of these physiological processes and theirlocalization in the fruit. NMR imaging is a non-invasive and non-destructive tool which can provide access to several types ofinformation such as: tissue architecture, spatial and temporalvariability of major components like water and sugar and internalflows in fruit during growth. These types of information are moredifficult to quantify by conventional destructive methods. Moreover,beyond the simple visualization of morphological structures,quantitative measurements can be obtained from the NMR imagesusing tissue segmentation and direct evaluation of the signalintensity in the corresponding voxels. During the last two decadesthis imaging technique has benefited [3,4] from significant theoretical,methodological and instrumental developments. The proton is still themost investigated nucleus because of its abundance and sensitivity inliving tissues.
For dynamic studies, fast NMR imaging sequences are aprerequisite for the acquisition of time resolved series of datasets. High temporal resolution gives access to a wide diversity ofphysiological information. However, it must not sacrifice the
1419S. Kenouche et al. / Magnetic Resonance Imaging 32 (2014) 1418–1427
signal-to-noise ratio (SNR) quality and the spatial resolution. TheT1, T2 and M0 contrasts exist naturally in soft tissues; they takeorigin from the molecular motions, which are quantified via thespectral density function [5]. These contrasts can be artificiallyaltered by the contrast agent (CA). These paramagnetic substancesdecrease the T1 and T2 of water protons in their surroundings [6].The CA efficiency is quantified through its longitudinal (r1) andtransversal (r2) relaxivities.
For in vivo studies, there exist a number of physiological constraintsaffecting the biodistribution of these agents such as the size, the shape,their hydrophilic and hydrophobic character and especially thechemical nature of coating-ligands [7]. The grafting of biocompatiblefunctional molecules will enable one to combine their intrinsicproperties to those of the nanoparticles. In this study, the ultrasmallnanoparticles of Gd3+/[Fe(CN)6]3− stabilized by D-mannitol have beenused as T1-relaxing CA. They present an interest for in vivoplant tissuesinvestigations because: (1) they provide an r1 value four times higherover commercial CA (such as ProHance®); (2) they are water soluble,not aggregated; (3) they provide a stable aqueous physiologicalcolloidal solution; (4) they present an ultrasmall size of 3.4 nm thatpermits their circulation in the plant. Fast and accurate T1 and M0
mapping approach to study plant tissueswas implemented on a voxel-by-voxel basis using multiple flip-angle Spoiled Gradient Echo (SGE)acquisition. The T1 values for each voxel are calculated from the ratio ofsignal intensities, based on the assumption of a simple exponentialrecovery. The accuracy of the variable flip-angle technique is evaluatedin phantom before being applied in vivo. The choice of flip angles cansignificantly affect the precision of the derived T1 values. Indeed, wedeveloped analgorithm in order tofind the optimal combination offlipangles to achieve optimal T1 mapping accuracy. To correct forinhomogeneous B1 excitation, a B1 map was determined using theDouble Angle Method [8]. An efficient error mapping procedure toassess the uncertainties associated with each voxel of the quantitativeimages is presented. An accurate and robust segmentation procedure,based on the calculation of the maximum of the derivative afterGaussian smoothingofNMR images,was developed inorder to localizethe tissues where a signal enhancement was detected. Based on thissegmentation, the physiological features of the immature-green cherrytomatowere investigated from the kinetic studyof theCAused as tracerof water transport in the fruit during growth. This kinetic study wascarried out using compartmental modeling. Several research works onmolecular transport have been carried out at the stem and root plantslevels [9,10]. To our knowledge, fewpublications have been devotedto investigate the water transport and distribution within the fruit[11–13]. The purpose of the present study was the implementationof a methodology for quantitative measurements using NMRimaging combined with efficient and biocompatible CA dedicatedto study the physiological changes related to water movementwithin the fruit.
2. Materials and methods
2.1. CA
In this section we briefly present the synthesis and characteriza-tions of Gd3+/[Fe(CN)6]3−/D − mannitol nanoparticles used as CA.The auto-assembling reaction between Gd(NO3)3 and K3[Fe(CN)6] inwater in the presence of D-mannitol (see Fig. 1S, ElectronicSupporting Information (ESI)) yields to aqueous solution ofnanoparticles Gd3+/[Fe(CN)6]3−/D − mannitol. Infrared spectrawere recorded as KBr disks on a Perkin-Elmer 1600 spectrometerwith a 4 cm−1 resolution. Elemental analyses were performed by theService Central d’Analyses (CNRS, Vernaison, France). The sampleswere heated at 3000 C∘ under He. Oxygen was transformed in COand detected by using an IR detector. Metals were determined with a
high resolution ICP-MS using a ThermoFisher element. TransmissionElectronMicroscopy (TEM) observationswere carried out at 100 kV(JEOL 1200 EXII). Samples for TEM measurements were depositedfrom solutions on copper grids. The nanoparticles' size distributionhistogram was determined using enlarged TEM micrographs takenat magnification of 100 K on a statistical sample of 300 nanopar-ticles. The T1 and T2 relaxation times of hydrogen protons in aqueoussolutions at various concentrations of nanoparticles were per-formed on a Tecmag Apollo spectrometer operating at 200 MHz. T1values were obtained from inversion recovery sequence (180∘ −τ − 90∘) with the following parameters: TR = 8 s, 4 averages and90∘ pulse delay = 132 μs. For each concentration of the CA, theinversion times (τ) were chosen such that the instantaneousmagnetization recovers its equilibrium value. The Carr–PurcellMeiboom Gill pulse sequence (90∘–(180∘)n −) was applied toachieve the T2 measurement. The sequence parameters were asfollows: 90∘ − 180∘ pulse spacing was 3.2 ms, TR = 5 s, 8 averagesand 90∘ pulse delay = 132 μs. For each concentration of CA, thenumber of echoes (n) is selected to allow a complete decay of thetransverse magnetization. The r1 and r2 relaxivities were thencalculated from the slope of a linear regression of R1,2 = T1,2
−1 versusCA concentration (C): R1,2 = R1,2
0 + r1,2 × C. The R1,20 values are the
relaxation rates without CA.
2.2. B1 inhomogeneities correction
For in vivo NMR imaging at high field (≥3 T) it is essential toconsider the homogeneity of the B1 field, especially for T1quantification. This inhomogeneity may arise from different sources,like amplifier non-linearity in the low output region, intrinsicallylow SNR, and tissue dielectric effects. B1 inhomogeneity leads tosignificant spatial variations in the image contrast and intensity,making quantitative image interpretation and segmentation difficultto achieve. In this paper, the correction for the B1 inhomogeneitieswas carried out by division of pixels of tomato images by thecorresponding pixels of the water phantom image. We evaluated theB1 inhomogeneities using the Double Angle Method [8]. Suchmethods allow calculation of a flip-angle map, which is an indirectmeasure of the B1 field. Two images were acquired: I1 withprescribed angle α = 30∘ and I2 with prescribed angle α2 = 2α(see Fig. 2S, ESI). All other sequence parameters are kept constant:TR = 10 s and TE = 6 ms. Flip angles map was calculated accordingto the formula: α = arccos(I2/2I1).
2.3. θ1 and θ2 optimization
The simulation was implemented using an in-house developedprogram written using MATLAB (The MathWorks, Natick, MA)software. This algorithm was developed in order to find the optimalcombination of flip angles that minimize the error in T1. The error inT1 being estimated from the residue between the T1 measured byNMR relaxometry using an inversion-recovery pulse sequence (thereference T1 values) and T1 values computed frommultiple flip-angleacquisitions using SGE sequence from the phantom. Simulation wasperformed using five test tubes filled with aqueous solutions atvarious CA concentrations (10−3, 2.5 × 10⁻⁴, 10−4, 8.5 × 10⁻⁵ and10−5 (mol/L)), producing wide range of T1 values from 240 to1300 ms. Phantomdatawere acquiredwith the following parameters:α1 = 12∘, α2 = 56∘, TE = 6 ms, 64 averages and TR = 110 ms result-ing in a total acquisition time of 30 min.The simulation was conductedfor two ranges of flip angles from 6∘ to 21∘ and from 36° to 60°.Optimum flip angles were calculated to be 8° and 60° (see Figs. 3S and4S, ESI).
1420 S. Kenouche et al. / Magnetic Resonance Imaging 32 (2014) 1418–1427
2.4. Set-up monitoring contrast agent uptake
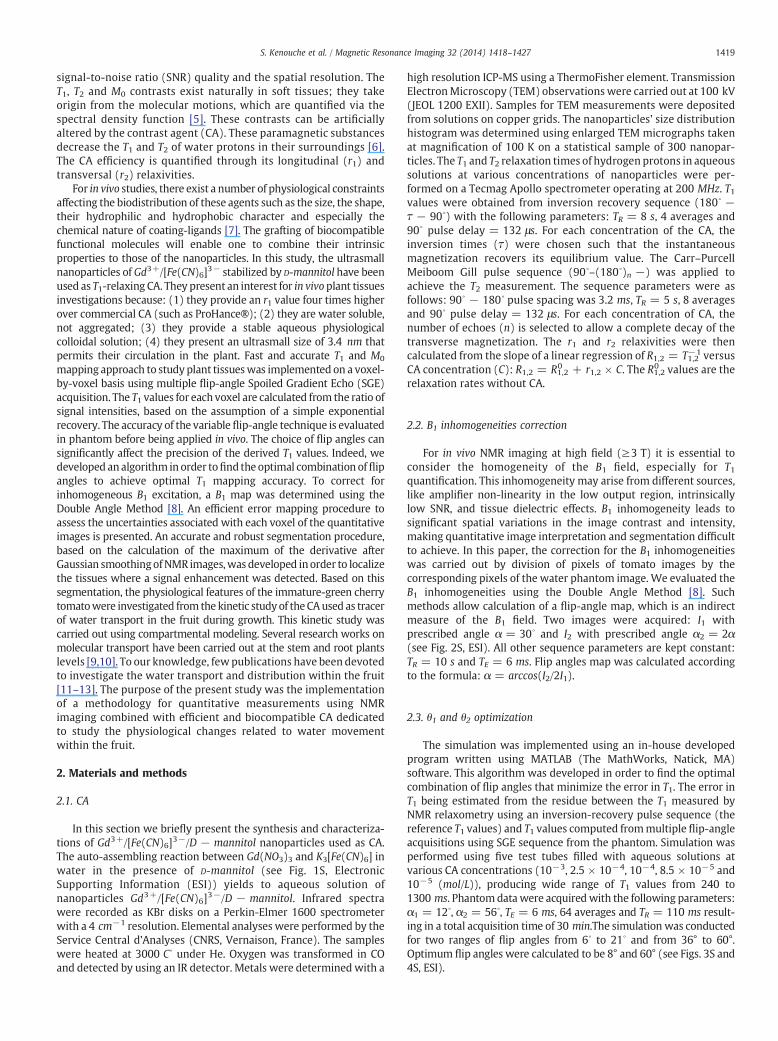
In this experiment, the dynamic transport of water in imma-ture-green tomato was investigated using Gd3+/[Fe(CN)6]3−/D −mannitol as a tracer. Cherry tomato (Solanum lycopersicum) grownunder glasshouses at INRA (Institut National de la rechercheAgronomique, Avignon France) was used in this study. Rapidlygrowing fruits, about 15 days old (from anthesis), were removedfrom the plant and placed under sterile conditions in glass tubesfilled with a nutrient solution (4.4 gL−1 of Murashige and Skoogmedium (MS 5519, Sigma-Aldrich, Saint Louis, MO) and 60 gL−1 ofsucrose), in which the fruit pedicel was immersed [14]. The CA wasadded at a concentration of 10 mmol/L in the nutrient solution inorder to be taken up by the fruit. The fruit pedicel was kept in thenutrition medium throughout the experiments. The total height ofthe fruit and pedicel was about 4.4 cm (3 cm for the pedicel and1.4 cm for the fruit). A bird-cage radio frequency (RF) coil with3 cm inner diameter, wrapped around the tube containing the fruit,transmits the excitation pulses and receives the NMR signal. Sinc-function pulse (2 ms) was applied for selective excitation. Thewhole setup (Fig. 1) was loaded in a 4.7 T magnet of an NMRspectrometer operating at a proton frequency of 200 MHz and theninvestigated for five days duration using a SGE pulse sequence. Thetemperature conditions in the magnet were 21 ± 1 °C during theday and 19 ±1 °C during the night. Using the implemented SGEsequence, five transversal slices were acquired at different fruitoffsets. After frequency–distance conversion the offsets were: 1.1,4.3, 7.5, 10.7 and 13.9 mm with respect to lowest part of the fruit.Slices were acquired in a sequential mode, in ascending order. Foreach offset we performed a T1-weighted image followed by anotherM0-weighted one. We recorded sixty images for each slice (thirtyT1-weighted and thirtyM0-weighted), which means a total of threehundred (5 slices × 2 weightings × 30 acquisitions for eachweighting) images obtained during five days of acquisition. The
ig. 1. Schematic illustration of the NMR imaging setup. The RF coil assembly was disposed around the fruit. Tx and Rx symbolize the RF transmission and reception of the NMRignal, respectively.
Fssequence parameters were as follows: TE = 6 ms, optimized flipangles (θ1 = 8 ∘ and θ2 = 60 ∘) , spat ia l reso lut ion =100 μm × 100 μm, slice thickness = 750 μm, field of view (FOV)= 252 mm2, slice gap = 3.2 mm, matrix size = 2562 (5122 afterzero filling) and TR = 110 ms resulting in a total acquisition timeof 24 min.
The kinetic study was conducted on the segmented tissues. Thechanges in tracer concentration in the columella are described bytransports between compartments which represent separateregions. The rate of transfer from one compartment to another isproportional to the concentration in the compartment of origin andto a rate constant (k1, km1, k12, k23 and k34 (h−1)). k1 was assigned tothe precipitation of nanoparticles in the pot. As illustrated in Fig. 2,each compartment is associated with a slice. The first compartmentis the nutrientmedium (the pot) fromwhich the tracer progresses tothe following compartments. m(t) represents the CA concentrationin the pot. To be rigorous the meaning of the concentration and thekinetic rates must be understood as ‘equivalent concentration’ and‘equivalent rates’ respectively.
2.5. T1 and M0 mapping
The quantitative analysis presented in this section was achievedby applying a series of processing steps using MATLAB software. Atthe beginning, the raw data acquired from the MRI scanner (Apollo,Tecmag) were processed through the following mathematicaloperations: baseline correction, apodization, zero filling and 2DFourier transform, respectively. All these operations aim to improvethe image quality in order to perform post-treatment under betterconditions. All raw data have undergone the same mathematicalprocessing. Once the images are constructed, T1 maps werecalculated using Eq. (2) from two NMR images acquired from theoptimized flip angles θ1 = 8∘ for M0-weighted (S1) and θ2 = 60∘ forT1-weighted (S2). Subsequently, T1 maps were converted into CA

1421S. Kenouche et al. / Magnetic Resonance Imaging 32 (2014) 1418–1427
concentration maps using Eq. (5) on a voxel-by-voxel basis.According to the theoretical equation for SGE signal intensity, thesignal ratio corresponding to θ1 and θ2 flip angles is given by:
S2S1
¼ 1−e −TR=T1ð Þcos θ11−e −TR=T1ð Þcos θ2
� sin θ2sin θ1
ð1Þ
The T1 maps have been computed on a voxel-by-voxel basis:
T1 ¼ −TR
logS1 sin θ2−S2 sin θ1
S1 cos θ1 sin θ2−S2 cos θ2 sin θ1
� � ð2Þ
Eq. (2) has been solved considering the following constraint:
0bS1 sin θ2−S2 sin θ1
S1 cos θ1 sinθ2−S2 cos θ2 sin θ1b1 ð3Þ
This constraint ensures reliable and reasonable measurement ofT1 by excluding the outliers, such as the negative and complexvalues. Once the T1 has been calculated, the proton density mapswere obtained from the theoretical equation for SGE signal intensity:
M0 ¼ S2 �1−e −TR=T1ð Þcos θ21−e −TR=T1ð Þ� �
sin θ2ð4Þ
M0 maps were calculated according to S2 images since the SNRratio is better compared to S1 images. Finally, we derived ananalytical formula to transform longitudinal relaxation time T1change to CA concentration change using varied T1,0 and the linearrelationship between R1 = 1/T1 and CA concentration, according to:
C tð Þ ¼ 1r1
Xni¼1
1Ti1 tð Þ−
1Ti1;0 tð Þ
!ð5Þ
Where T1,0 is the relaxation time without CA.
2.6. Errors computing
The accuracy and precision of calculation methods depend on themagnitude of systematic and random errors. Various error sources inNMR imaging experiments lead to deterioration of the image qualityand can actually distort all calculations and thus the interpretation ofresults. The noise may be generated within the receiver coil andother electronics [15].
It is clear that the voxels exhibiting the lowest signal intensity(tissues with low proton density and/or long T1) will be most
Fig. 2. Kinetic study in the columella using a compartmental modeling.
affected. Consequently, it is necessary to use a robust method(without approximations) to quantify and minimize these errors asfar as possible. The assessment of the uncertainty committed in eachpixel on the parametric images was conducted by computing thetotal differential of T1 and M0. The relative error on T1 maps can bewritten as:
ΔT1
T1¼ Ψ1j jΔS1
S1þ Ψ2j jΔS2
S2ð6Þ
We search:
Ψ1 ¼ ∂T1
∂S1S1T1
; Ψ2 ¼ ∂T1
∂S2S2T1
ð7Þ
The same calculation method is applied to estimate the relativeerror for M0 maps, according to:
ΔM0
M0¼ ∂M0
∂S2S2M0
��������ΔS2S2
þ ∂M0
∂T1
T1
M0
��������ΔT1
T1ð8Þ
The noise variances (ΔS1 and ΔS2) were evaluated from themaximum of the probability density function (PDF) of backgroundpixel intensities (magnitude images), which are described by Rayleighdistribution [16]. All the pixels with a relative error exceeding 15% inthe computed imageswere eliminated and hencewere not included inextracting the physiological and morphological information.
2.7. Phantom imaging
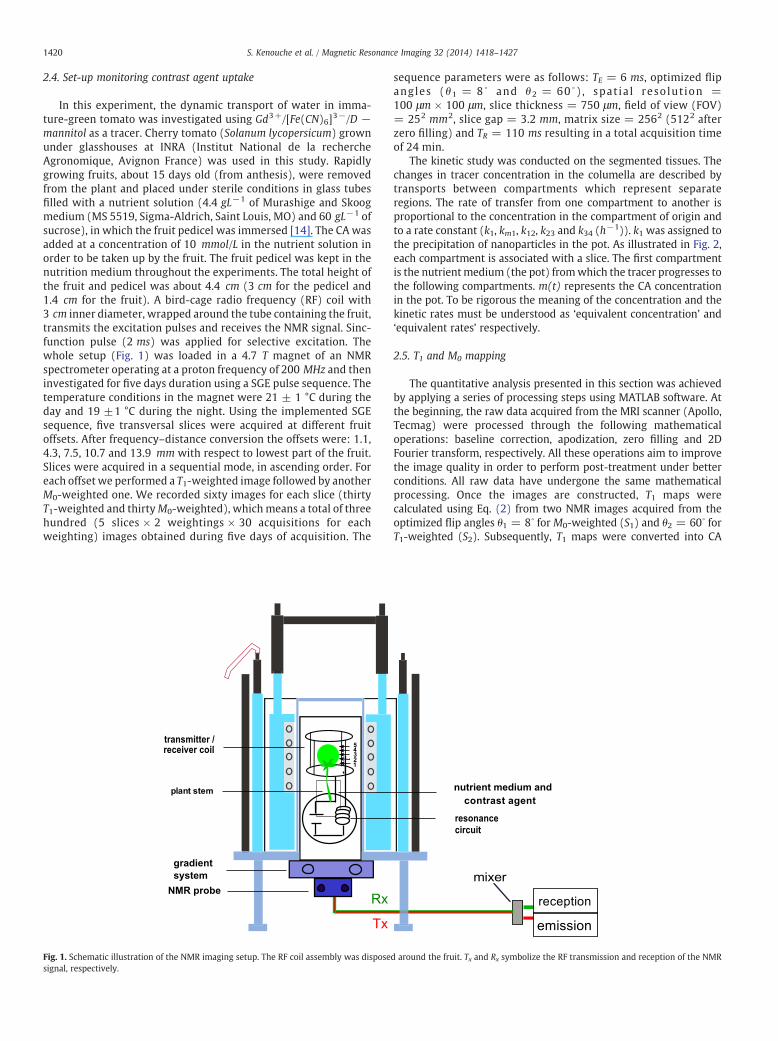
Before proceeding with the fruit imaging study, the Eq. (2) wastested on a phantom in order to test its reliability. The phantom (Fig. 3)used is the same as that presented in Section 2.3. The CA concentrationincreases in ascending order from tube 1 to tube 5. The experimentalparameters for these experiments were: FOV = 25 mm, slicethickness = 750 μm, optimized flip angles = 8° and 60°, TE = 6 ms,TR = 110 ms and 64 averages resulting in a total acquisition time of30 min. The basic idea for this analysiswas to compare the T1measuredby NMR relaxometry using an inversion-recovery pulse sequence (thereference T1 values) and T1 values computed from multiple flip-angleacquisitions using SGE imaging sequence.
3. Results and discussion
3.1. CA characterization
The Gd/Fe ratio obtained from elemental analysis is equal toc.a. 1.04, similar to the value of 1 expected for the bulkanalogous Gd(H2O)4[Fe(CN)6]. InfraRed spectroscopy (shift ofthe cyanide stretching vibrations toward higher frequencies incomparison with the hexacyanoferrate precursor) as well as X-Ray diffraction (orthorhombic system with a Cmcm space group,Fig. 5S, ESI) confirms the formation of the cyano-bridgednetwork. Transmission Electronic Microscopy measurements(Fig. 6S, ESI) show that the nanoparticles are spherical in shapewith no sign of aggregation. The T1 and T2 relaxation timemeasurements performed for aqueous solutions of the nano-particles at various concentrations give the longitudinal andtransverse relaxivities equal to 11.4 ± 0.1 and 12.6 ± 0.1mM−1s−1, respectively. The r2/r1 ratio equal to 1.10. Thesevalues are four times larger than the ones obtained forcommercial ProHance® (3.00 ± 0.01 and 3.41 ± 0.01 mM−
1s−1 for r1 and r2 at 4.7 T, respectively). These measurementsconfirm that the nanoparticles may be used as efficient T1-relaxing CA.
(a) (b)
Fig. 3. Normalized SGE images for the phantom. The images were acquired from 8° (a) and 60° (b) flip angles. Each number appearing on the image is associated to aconcentration of CA.
1422 S. Kenouche et al. / Magnetic Resonance Imaging 32 (2014) 1418–1427
3.2. Method validation
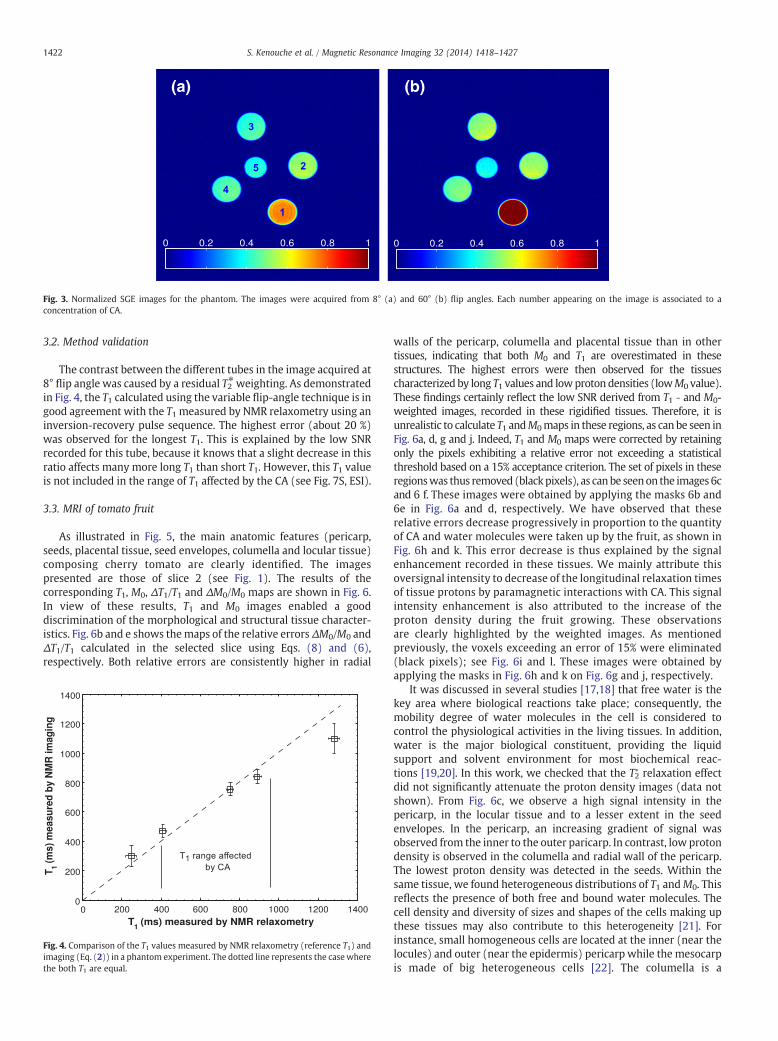
The contrast between the different tubes in the image acquired at8° flip angle was caused by a residual T2⁎weighting. As demonstratedin Fig. 4, the T1 calculated using the variable flip-angle technique is ingood agreement with the T1 measured by NMR relaxometry using aninversion-recovery pulse sequence. The highest error (about 20 %)was observed for the longest T1. This is explained by the low SNRrecorded for this tube, because it knows that a slight decrease in thisratio affects many more long T1 than short T1. However, this T1 valueis not included in the range of T1 affected by the CA (see Fig. 7S, ESI).
3.3. MRI of tomato fruit
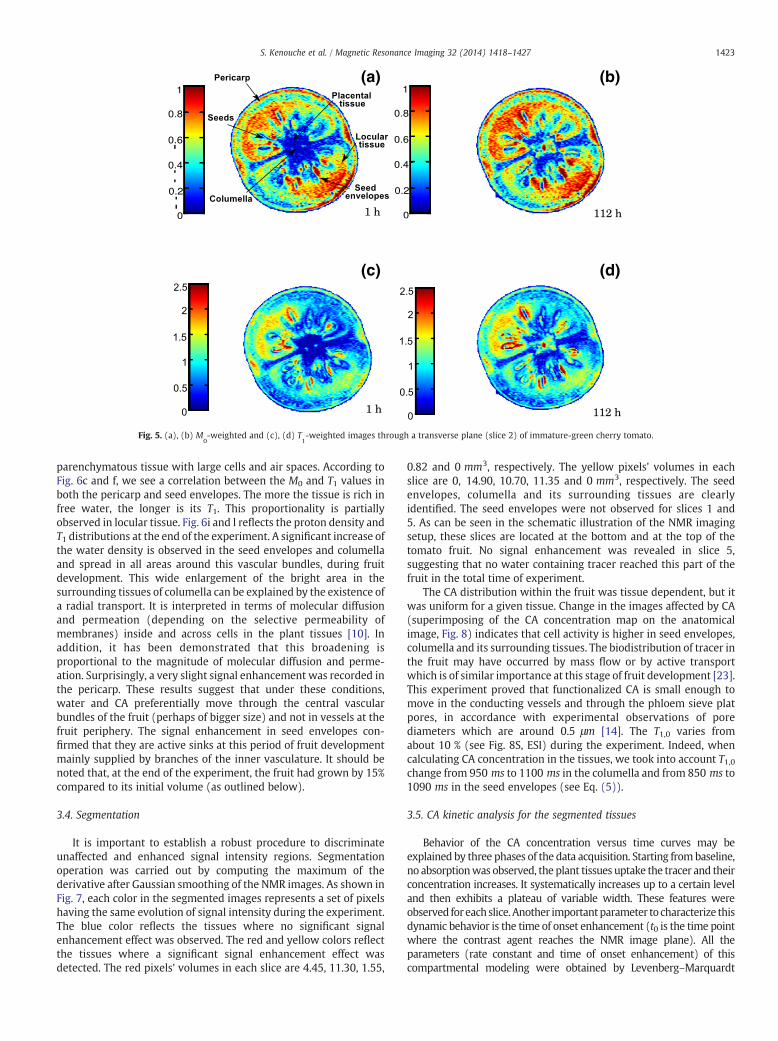
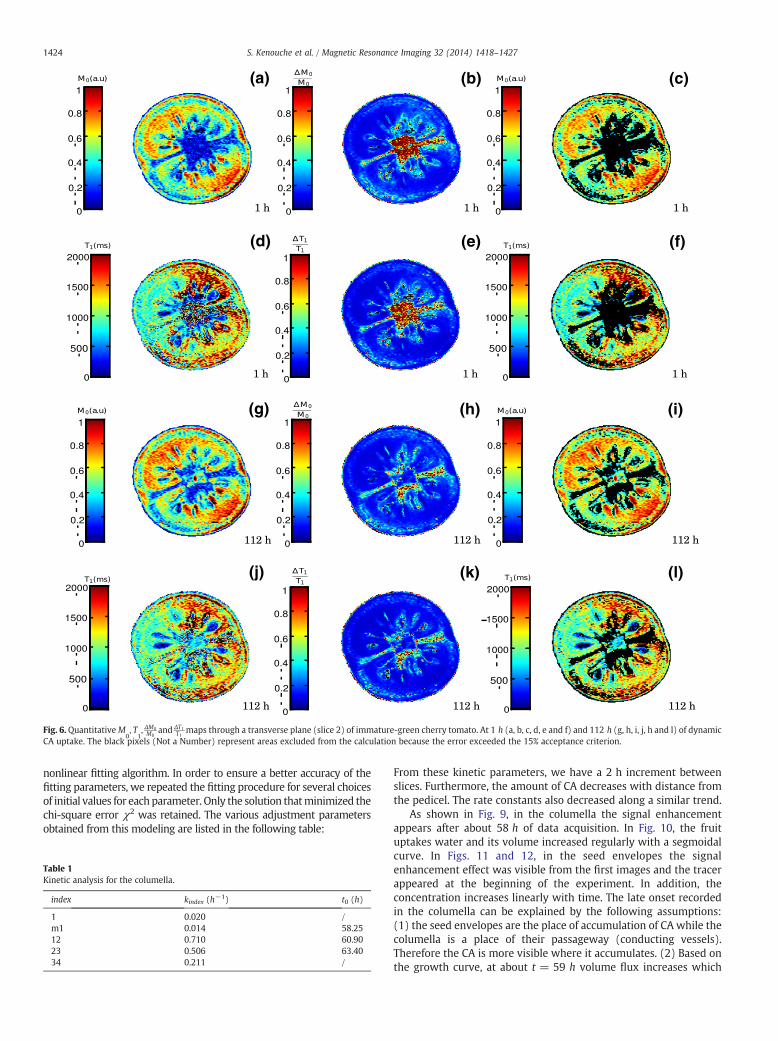
As illustrated in Fig. 5, the main anatomic features (pericarp,seeds, placental tissue, seed envelopes, columella and locular tissue)composing cherry tomato are clearly identified. The imagespresented are those of slice 2 (see Fig. 1). The results of thecorresponding T1, M0, ΔT1/T1 and ΔM0/M0 maps are shown in Fig. 6.In view of these results, T1 and M0 images enabled a gooddiscrimination of the morphological and structural tissue character-istics. Fig. 6b and e shows themaps of the relative errorsΔM0/M0 andΔT1/T1 calculated in the selected slice using Eqs. (8) and (6),respectively. Both relative errors are consistently higher in radial
ig. 4. Comparison of the T1 values measured by NMR relaxometry (reference T1) andaging (Eq. (2)) in a phantom experiment. The dotted line represents the casewheree both T1 are equal.
Fimth
walls of the pericarp, columella and placental tissue than in othertissues, indicating that both M0 and T1 are overestimated in thesestructures. The highest errors were then observed for the tissuescharacterized by long T1 values and lowproton densities (lowM0 value).These findings certainly reflect the low SNR derived from T1 ‐ and M0-weighted images, recorded in these rigidified tissues. Therefore, it isunrealistic to calculate T1 andM0maps in these regions, as can be seen inFig. 6a, d, g and j. Indeed, T1 and M0 maps were corrected by retainingonly the pixels exhibiting a relative error not exceeding a statisticalthreshold based on a 15% acceptance criterion. The set of pixels in theseregionswas thus removed (blackpixels), as canbe seenon the images 6cand 6 f. These images were obtained by applying the masks 6b and6e in Fig. 6a and d, respectively. We have observed that theserelative errors decrease progressively in proportion to the quantityof CA and water molecules were taken up by the fruit, as shown inFig. 6h and k. This error decrease is thus explained by the signalenhancement recorded in these tissues. We mainly attribute thisoversignal intensity to decrease of the longitudinal relaxation timesof tissue protons by paramagnetic interactions with CA. This signalintensity enhancement is also attributed to the increase of theproton density during the fruit growing. These observationsare clearly highlighted by the weighted images. As mentionedpreviously, the voxels exceeding an error of 15% were eliminated(black pixels); see Fig. 6i and l. These images were obtained byapplying the masks in Fig. 6h and k on Fig. 6g and j, respectively.
It was discussed in several studies [17,18] that free water is thekey area where biological reactions take place; consequently, themobility degree of water molecules in the cell is considered tocontrol the physiological activities in the living tissues. In addition,water is the major biological constituent, providing the liquidsupport and solvent environment for most biochemical reac-tions [19,20]. In this work, we checked that the T2
∗ relaxation effectdid not significantly attenuate the proton density images (data notshown). From Fig. 6c, we observe a high signal intensity in thepericarp, in the locular tissue and to a lesser extent in the seedenvelopes. In the pericarp, an increasing gradient of signal wasobserved from the inner to the outer paricarp. In contrast, low protondensity is observed in the columella and radial wall of the pericarp.The lowest proton density was detected in the seeds. Within thesame tissue, we found heterogeneous distributions of T1 andM0. Thisreflects the presence of both free and bound water molecules. Thecell density and diversity of sizes and shapes of the cells making upthese tissues may also contribute to this heterogeneity [21]. Forinstance, small homogeneous cells are located at the inner (near thelocules) and outer (near the epidermis) pericarp while the mesocarpis made of big heterogeneous cells [22]. The columella is a
(a) (b)
(c) (d)
Fig. 5. (a), (b) M0-weighted and (c), (d) T
1-weighted images through a transverse plane (slice 2) of immature-green cherry tomato.
1423S. Kenouche et al. / Magnetic Resonance Imaging 32 (2014) 1418–1427
parenchymatous tissue with large cells and air spaces. According toFig. 6c and f, we see a correlation between the M0 and T1 values inboth the pericarp and seed envelopes. The more the tissue is rich infree water, the longer is its T1. This proportionality is partiallyobserved in locular tissue. Fig. 6i and l reflects the proton density andT1 distributions at the end of the experiment. A significant increase ofthe water density is observed in the seed envelopes and columellaand spread in all areas around this vascular bundles, during fruitdevelopment. This wide enlargement of the bright area in thesurrounding tissues of columella can be explained by the existence ofa radial transport. It is interpreted in terms of molecular diffusionand permeation (depending on the selective permeability ofmembranes) inside and across cells in the plant tissues [10]. Inaddition, it has been demonstrated that this broadening isproportional to the magnitude of molecular diffusion and perme-ation. Surprisingly, a very slight signal enhancement was recorded inthe pericarp. These results suggest that under these conditions,water and CA preferentially move through the central vascularbundles of the fruit (perhaps of bigger size) and not in vessels at thefruit periphery. The signal enhancement in seed envelopes con-firmed that they are active sinks at this period of fruit developmentmainly supplied by branches of the inner vasculature. It should benoted that, at the end of the experiment, the fruit had grown by 15%compared to its initial volume (as outlined below).
3.4. Segmentation
It is important to establish a robust procedure to discriminateunaffected and enhanced signal intensity regions. Segmentationoperation was carried out by computing the maximum of thederivative after Gaussian smoothing of the NMR images. As shown inFig. 7, each color in the segmented images represents a set of pixelshaving the same evolution of signal intensity during the experiment.The blue color reflects the tissues where no significant signalenhancement effect was observed. The red and yellow colors reflectthe tissues where a significant signal enhancement effect wasdetected. The red pixels' volumes in each slice are 4.45, 11.30, 1.55,
0.82 and 0 mm3, respectively. The yellow pixels' volumes in eachslice are 0, 14.90, 10.70, 11.35 and 0 mm3, respectively. The seedenvelopes, columella and its surrounding tissues are clearlyidentified. The seed envelopes were not observed for slices 1 and5. As can be seen in the schematic illustration of the NMR imagingsetup, these slices are located at the bottom and at the top of thetomato fruit. No signal enhancement was revealed in slice 5,suggesting that no water containing tracer reached this part of thefruit in the total time of experiment.
The CA distribution within the fruit was tissue dependent, but itwas uniform for a given tissue. Change in the images affected by CA(superimposing of the CA concentration map on the anatomicalimage, Fig. 8) indicates that cell activity is higher in seed envelopes,columella and its surrounding tissues. The biodistribution of tracer inthe fruit may have occurred by mass flow or by active transportwhich is of similar importance at this stage of fruit development [23].This experiment proved that functionalized CA is small enough tomove in the conducting vessels and through the phloem sieve platpores, in accordance with experimental observations of porediameters which are around 0.5 μm [14]. The T1,0 varies fromabout 10 % (see Fig. 8S, ESI) during the experiment. Indeed, whencalculating CA concentration in the tissues, we took into account T1,0change from 950 ms to 1100 ms in the columella and from 850 ms to1090 ms in the seed envelopes (see Eq. (5)).
3.5. CA kinetic analysis for the segmented tissues
Behavior of the CA concentration versus time curves may beexplained by three phases of the data acquisition. Starting frombaseline,no absorptionwas observed, the plant tissues uptake the tracer and theirconcentration increases. It systematically increases up to a certain leveland then exhibits a plateau of variable width. These features wereobserved foreachslice.Another importantparameter tocharacterize thisdynamic behavior is the time of onset enhancement (t0 is the time pointwhere the contrast agent reaches the NMR image plane). All theparameters (rate constant and time of onset enhancement) of thiscompartmental modeling were obtained by Levenberg–Marquardt
(a) (b) (c)
(d) (e) (f)
(g) (h) (i)
(j) (k) (l)
Fig. 6. QuantitativeM0, T
1,ΔM0M0
andΔT1T1
maps through a transverse plane (slice 2) of immature-green cherry tomato. At 1 h (a, b, c, d, e and f) and 112 h (g, h, i, j, h and l) of dynamicCA uptake. The black pixels (Not a Number) represent areas excluded from the calculation because the error exceeded the 15% acceptance criterion.
1424 S. Kenouche et al. / Magnetic Resonance Imaging 32 (2014) 1418–1427
nonlinear fitting algorithm. In order to ensure a better accuracy of thefitting parameters, we repeated the fitting procedure for several choicesof initial values for each parameter. Only the solution thatminimized thechi-square error χ2 was retained. The various adjustment parametersobtained from this modeling are listed in the following table:
able 1inetic analysis for the columella.
index kindex (h−1) t0 (h)
1 0.020 /m1 0.014 58.2512 0.710 60.9023 0.506 63.40
TK
34 0.211 /
From these kinetic parameters, we have a 2 h increment betweenslices. Furthermore, the amount of CA decreases with distance fromthe pedicel. The rate constants also decreased along a similar trend.
As shown in Fig. 9, in the columella the signal enhancementappears after about 58 h of data acquisition. In Fig. 10, the fruituptakes water and its volume increased regularly with a segmoidalcurve. In Figs. 11 and 12, in the seed envelopes the signalenhancement effect was visible from the first images and the tracerappeared at the beginning of the experiment. In addition, theconcentration increases linearly with time. The late onset recordedin the columella can be explained by the following assumptions:(1) the seed envelopes are the place of accumulation of CA while thecolumella is a place of their passageway (conducting vessels).Therefore the CA is more visible where it accumulates. (2) Based onthe growth curve, at about t = 59 h volume flux increases which

Fig. 7. Image segmentation. The red pixels represent the columella and its surrounding tissues. Yellow pixels reflect the seed envelopes and blue pixels are those of other tissues.
1425S. Kenouche et al. / Magnetic Resonance Imaging 32 (2014) 1418–1427
could result to a large amount of CA in the columella and possibly asaturation effect in the seed envelopes. (3) A significant presence ofair bubbles in the columella had been reported [24]. These airbubbles creating large local field anisotropies affecting the NMRsignal, no signal enhancement was observed during the first hours.However, the signal enhancement appears when the flow ismaximum (this flow corresponds to inflection point of the growthcurve). These hypotheses need to be confirmed by further experi-ments. As stated above in the seed envelopes T1 changes are notfollowing water uptake. Our findings indicate that the observed T1decrease in this tissue is not related to a physiological effect (changesin the structural aspects of tissues) but it could be caused by thepresence of the CA. We have confirmed this result through the studyon a control tomato. For this fruit without CA, we found a positivecorrelation (see Fig. 8S, ESI) between changes in T1 and M0. The T1variation was discontinuous, from progressive and regular at thebeginning (related to the increasing load of free water), to constantfor some time after (probably this is due to the binding of free waterto organic molecules). T1 changes are also related to the transpira-tion cycles (active and slow transpiration) of the fruit [25]. Thispositive correlation is a typical characteristic of a purely physiolog-ical effect [6].
The total amount of water accumulated in the fruit over theexperiment was evaluated from all slices by an extrapolation to aspherical volume. From this computation a quantity of 310 mg was
Fig. 8. CA concentration map overlaid over a grayscale anatomical image.Fig. 9. The dynamic CA concentration for the columella (×: slice 1,○: slice 2,□: slice 3)with corresponding compartmental models (solid lines).
found which represents the net influx (import of water minus loss ofwater by transpiration). In a second time and in order to quantify thetotal quantity of tracer uptake by the fruit throughout the experiment,we built a model based on trapezoidal volumes. This model wasconstructed as follows: knowing the total amounts of CA in the slices 1,2, 3 and 4, the intermediate quantities (between slices) have beenassessed by considering a trapezoidal volume. The bases of thetrapezoids are the surfaces of each segmented tissues and the heightis equal to the slice thickness. The same computational procedure wasused to evaluate the total volume in the seed envelopes and in thecolumella. On the basis of this approach, the total quantities of CAobtained both in the columella and in the seed envelopes were 18.65and 30.58 μg, respectively. These amounts correspond to the volumes59.86 mm3 for the columella and 98.72 mm3 for the seed envelopes.At the end of the experiment, the CA quantity contained in 15 g ofwater corresponds to 1.4 mg. Thus, from the estimated total amountof the tracer in the fruit, we can predict the totalwater quantity uptakeusing this proportionality relationship. The total quantities and the

Fig. 10. Growth curve. The total volume was determined from all slices by an extrapolation to a spherical volume.
1426 S. Kenouche et al. / Magnetic Resonance Imaging 32 (2014) 1418–1427
average volume flow of water estimated are 198 mg, 1.76 mm3/hfor the columella and 326 mg, 2.91 mm3/h for the seed envelopes.The total amount ofwater uptake by the fruitwas 524 mg during thewhole experiment. The fruit transpiration was estimated based onfruit conductance measured on detached fruits from the samecultivar grownunder similar conditions (data not shown).We couldestimate a loss of water of about 100 to 150 mg over 5 daysdepending on air humidity. So the uptake of water, which is the sumof net accumulation and transpiration, is in good agreement withthe amount estimated from the growing curve, confirming thatGd3+/[Fe(CN)6]3−/D ‐ mannitol can be efficiently used to track waterwithin the fruit.
4. Conclusion
In this paper, the total amount of water uptake has beeninvestigated by analyzing the progress of tracer in cherry tomatoesusing quantitative NMR imaging measurements. The resultsreported in this work emphasize that SGE sequence combinedwith efficient and biocompatible CA offers the possibility to
ig. 11. T1 changes in the seed envelopes (○: slice 2, □: slice 3, △: slice 4, +: controlmato). Inset: corresponding M0.
Fig. 12. The dynamic CA concentration for the seed envelopes (○: slice 2,□: slice 3,△slice 4) with corresponding linear regressions (solid lines).
Fto
quantitatively assess and monitor dynamic processes in fruits. Wechose to reach an artificial positive contrast (T1 effect) instead ofnegative contrast (T2 effect) for image acquisition. The negativecontrast can be easily mistaken with the hyposignal caused bylocal field inhomogeneities, magnetic susceptibility artifacts andinherent noise of the NMR imaging experiments. Water transportand content are major factors controlling the plant morphology anddevelopment. It has been shown that the knowledge of T1 and M0
distributions is useful for the characterization of the physical stateof the water in biological tissues than a simple visual interpretationof weighted images. This water mobility is directly related tophysiological activity and its understanding is of fundamentalrelevance in the plant physiology studies. The current in vivo resultsclearly demonstrate that CA distribution within the fruit is tissuedependent and almost homogeneous for a given tissue. Indeed, thistracer was preferentially accumulated in seed envelopes and tissuessurrounding the columella. From this finding and at this stage offruit development, we have emphasized that these tissues are activesinks in growing fruits. The knowledge of the vascular network
:
1427S. Kenouche et al. / Magnetic Resonance Imaging 32 (2014) 1418–1427
distribution is paramount to understand the transport pathwaysin the fruit. These investigations open new perspectives to use thistype of CA in agricultural systems for more systematic studies.Work is in progress in order to study the process of biodistributionof the CA coated with glucose or fructose. These sugars are themajor elements responsible for tissue growth. Moreover, per-forming 3D acquisitions instead of 2D acquisitions reduces theimperfection effects of pulse selection and allows a betterassessment of fruit growth.
Appendix A
The equivalent rates ki (h−1) are assumed to be linearly related tothe difference of equivalent concentration of CA between twocompartments. Differential equations that describe the kineticbehavior of CA in the tissues are given by:
dm tð Þdt
¼ − k1 þ km1ð Þ �m tð Þdc1 tð Þdt
¼ km1 �m tð Þ−k12 � c1 tð Þdc2 tð Þdt
¼ k12 � c1 tð Þ−k23 � c2 tð Þdc3 tð Þdt
¼ k23 � c2 tð Þ−k34 � c3 tð Þdc4 tð Þdt
¼ k34 � c3 tð Þ
8>>>>>>>>>>>>><>>>>>>>>>>>>>:
ðA1Þ
Where m(t), c1(t), c2(t), c3(t) and c4(t) are defined as a kind ofequivalent concentrations of CA at time t for each compartment. Theinitial equivalent concentration of the CA in each slice is null ci(0) = 0,we get the following formulas to estimate the kinetic parameters:
c1 tð Þ ¼ km1 �Z t
0m uð Þe−k12 t−uð Þdu
c2 tð Þ ¼ k12 �Z t
0c1 vð Þe−k23 t−vð Þdv
c3 tð Þ ¼ k23 �Z t
0c2 wð Þe−k34 t−wð Þdw
8>>>>>><>>>>>>:
ðA2Þ
These integrals have been numerically solved. The onset times(t0) were obtained according to the following formula:
ci tð Þ ¼ ci t−t0ð Þ0
�⇒ t≥t0⇒ tbt0
ðA3Þ
Appendix B. Supplementary data
Supplementary data to this article can be found online at http://dx.doi.org/10.1016/j.mri.2014.08.005.
References
[1] Guichard S, Gary C, Leonardi C, Bertin N. Analysis of growth and water relation oftomato fruits in relation to air vapor pressure deficit and plant fruit load. J PlantGrowth Regul 2005;24:1–13.
[2] Van As H, Scheenen T, Vergeldt FJ. MRI of intact plants. Photosynth Res 2009;102:213–22.
[3] Chudek JA, Hunter G. Magnetic resonance imaging of plants. Prog Nucl MagnReson Spectrosc 1997;31:43–62.
[4] Borisjuk L, Rolletschek H, Neuberger T. Surveying the plant’s world by magneticresonance imaging. Plant J 2012;70:129–46.
[5] Xia Y. Contrast in NMR imaging and microscopy. Concepts Magn Reson 1996;8:205–25.
[6] Callaghan PT. Principles of nuclear magnetic resonance microscopy. Oxford:Oxford University Press; 1993.
[7] Bin na BH, In Chan S, Hyeon T. Inorganic nanoparticles for MRI contrast agents.Adv Mater 2009;21:2133–48.
[8] Cunningham C, Pauly J, Nayak K. Saturated double-angle method for rapid B-1mapping. Magn Reson Med 2006;55:1326–33.
[9] Scheenen TWH, Vergeldt AM, Heemskerk AM, Van As H. Intact plant magneticresonance imaging to study dynamic in long-distance sap flow conductingsurface area. Am Soc Plant Biologists 2007;144:1157–65.
[10] Gussoni M, Greco F, Vezzoli A, Osuga T, Zetta L. Magnetic resonance imaging ofmolecular transport in living morning glory stems. Magn Reson Imaging 2001;19:1311–22.
[11] Kuchenbrod E, Kahler E, Thurmer F, Deichmann R, Zimmermann U, Haase A.Functional magnetic resonance imaging in intact plants—quantitative observa-tion of flow in plant vessels. Magn Reson Imaging 1998;3:331–8.
[12] Rokitta M, Zimmermann U, Haase A. Fast NMR flow measurements in plantsusing FLASH imaging. J Magn Reson 1999;137:29–32.
[13] Van As H. Intact plant MRI for the study of cell water relations, membranepermeability, cell-to-cell and long distance water transport. J Exp Bot 2007;58:743–56.
[14] Bussières P, Bertin N, Morris CE, Vigne C, Orlondo P, Glaux C, et al. Highexternal sucrose concentration inhibits the expansion of detached tomatofruits grown in a novel semi-open device. In Vitro Cell Dev Biol Plant 2011;47:743–51.
[15] Hoult DI, Richards RE. The signal-to-noise ratio of the nuclear magneticresonance experiment. J Magn Reson 1976;24:71–85.
[16] Bonny JM, Renou JP, Zanca M. Optimal measurement of magnitude and phasefrom MR data. J Magn Reson 1996;113:136–44.
[17] Zlatev Z, Lidon FC. An overview on drought induced changes in plant growth,water relations and photosynthesis. Emir J Food Agric 2012;24:57–72.
[18] Maurel C, Chrispeels MJ. Aquaporins. A molecular entry into plant waterrelations. Am Soc Plant Physiol 2001;125:135–8.
[19] Ortega JKE. Plant cell growth in tissue. Am Soc Plant Physiol 2010;145:1244–53.
[20] Kenouche S, Larionova J, Bezzi N, Guari Y, Bertin N, Zanca M, et al. NMRinvestigation of functionalized magnetic nanoparticles Fe-3O-4 as T1–T2contrast agents. Powder Technol 2014;255:60–5.
[21] Kuchenbrod E, Haase A, Benkert R, Schneider H, Zimmermann U. Quantifi-cation NMR microscopy on intact plants. Magn Reson Imaging 1995;13:447–55.
[22] Wang F, Sanz A, Brenner ML, Smith A. Sucrose synthase, starch accumulation,and tomato fruit sink strength. Plant Physiol 1993;101:321–7.
[23] Liu G, Wang X, Yang Q, Wei M. Advances in studies on chemical constituentsand pharmacological actions of Cordyceps sinensis. Food Sci Technol 2007;32:202–9.
[24] Musse M, Quellec S, Devaux MF, Cambert M, Lahaye M, Mariette F. Aninvestigation of the structural aspects of the tomato fruit by means ofquantitative nuclear magnetic resonance imaging. Magn Reson Imaging 2009;27:709–19.
[25] Johnson GA, Brown J, Kramer PJ. Magnetic resonance microscopy of changes inwater content in stems of transpiring plants. Proc Natl Acad Sci U S A 1987;84:2752–5.