In-vitromodellering van de linkerhelft van het hart In-Vitro ...
312
In-vitromodellering van de linkerhelft van het hart In-Vitro Modelling of the Left Heart Benjamin Van Der Smissen Promotoren: prof. dr. ir. P. Segers, prof. dr. ir. P. Van Ransbeeck Proefschrift ingediend tot het behalen van de graad van Doctor in de industriële wetenschappen: industrieel ontwerpen Vakgroep Elektronica en Informatiesystemen Voorzitter: prof. dr. ir. R. Van de Walle Faculteit Ingenieurswetenschappen en Architectuur Academiejaar 2015 - 2016
-
Upload
khangminh22 -
Category
Documents
-
view
3 -
download
0
Transcript of In-vitromodellering van de linkerhelft van het hart In-Vitro ...

In-vitromodellering van de linkerhelft van het hart
In-Vitro Modelling of the Left Heart
Benjamin Van Der Smissen
Promotoren: prof. dr. ir. P. Segers, prof. dr. ir. P. Van RansbeeckProefschrift ingediend tot het behalen van de graad van Doctor in de industriële wetenschappen: industrieel ontwerpen
Vakgroep Elektronica en InformatiesystemenVoorzitter: prof. dr. ir. R. Van de WalleFaculteit Ingenieurswetenschappen en ArchitectuurAcademiejaar 2015 - 2016

ISBN 978-90-8578-913-0NUR 964Wettelijk depot: D/2016/10.500/45

3
Supervisors:
Prof. dr. ir. Patrick Segers Faculty of Engineering and Architecture, UGent
Prof. dr. ir. Peter Van Ransbeeck Faculty of Science and Technology, HoGent
Research lab:
Institute Biomedical Technology (IBiTech)
Biofluid, Tissue and Solid Mechanics for Medical Applications (bioMMeda)
Ghent University
De Pintelaan 185 - Blok B
B-9000 Gent
BELGIUM
Members of the exam committee:
Chairman:
Prof. dr. ir. Rik Van de Walle Faculty of Engineering and Architecture, UGent
Secretary:
Prof. dr. ir. Tom Claessens Faculty of Engineering and Architecture, UGent
Reading committee:
Prof. dr. ir. Marcel Rutten Dept. of Biomedical Engineering, TU Eindhoven
Prof. dr. ir. Pieter Vandervoort Faculty of Medicine and Life Sciences, UHasselt
Dr. ir. Peter Verschueren Materialise, Leuven
Prof. dr. ing. Jelle Saldien Faculty of Engineering and Architecture, UGent
Other members:
Prof. dr. ir. Pascal Verdonck Faculty of Engineering and Architecture, UGent
Prof. dr. ir. Marc Vanhaelst Faculty of Engineering and Architecture, UGent
This research was funded by the University College Ghent.

4

5
Dankwoord Dit proefschrift was niet mogelijk geweest zonder de inbreng van velen. Mijn
dank gaat dan ook uit naar al degenen die zowel van dichtbij als van op afstand
een bijdrage leverden aan het tot stand komen van dit werk.
Op de eerste plaats wil ik mijn promotor prof. Patrick Segers
bedanken voor zijn gedreven, bemoedigende en leerrijke begeleiding
doorheen de verschillende fasen van dit project. Bedankt voor alle kansen die
ik kreeg, de vrijheid om dit project een eigen invulling te geven, de aanbreng
van nieuwe ideeën en waardevolle suggesties, de motiverende en
constructieve feedback en, niet in het minst, het nauwgezet nalezen van alle
teksten. Uw deur stond steeds voor me open (letterlijk) en als ik langs kwam,
nam u steeds ruim de tijd. Ik heb bijzonder veel van u geleerd en vind het een
eer om met u te mogen samenwerken.
Ook mijn promotor van de Hogeschool Gent, Peter Van Ransbeeck:
enorm bedankt voor uw steun en om steeds in mij te (blijven) geloven. Naast
uw promotorschap bent u er ook steeds als een vriend geweest waar ik steeds
op kon rekenen, in het bijzonder ook tijdens de finale fase van dit proefschrift.
Ik herinner me nog het eerste telefoongesprek waarin u me warm maakte om
op de Hogeschool te komen werken en een doctoraat te beginnen. We hebben
doorheen de jaren een heel kostbare samenwerking én vriendschap
opgebouwd en ik hoop van ganser harte dat we dit nog vele jaren kunnen
verderzetten.
Ook prof. Pascal Verdonck wil ik hartelijk danken om mij de gelegenheid te geven om te doctoreren en om me steeds weer uit te dagen om
grenzen te verleggen. Ook wil ik u specifiek danken voor het aanbrengen van
dit intrigerende en relevante onderwerp van het modelleren van de
mitralisklep en voor de wijze raad op het juiste moment.
Prof. Marc Vanhaelst en Marc Wouters wil ik bijzonder bedanken om
me zowel de tijd en ruimte te geven, als ook de steun om te doctoreren en de
opleiding te volgen tot burgerlijk ingenieur biomedische
ingenieurstechnieken. Daniel Vanhercke, hartelijk dank voor uw diepe en
praktische kennis over de mitralisklep waardoor ik concreet aan de slag kon
gaan. Ook dank aan prof. Damien Coisne voor het duiden op de juiste
draairichting van de torsiemodellen in een vroege fase van dit project . Ook
prof. Guido Van Nooten en prof. Filip De Somer wil ik bedanken voor het
bijwonen van experimenten en om te wijzen op de relevantie van
mitralisklepmodellering. Prof. Joris De Grieck en Dr. Frank Dewaele, bedankt
voor uw verfrissende ideeën rond (composiet)materialen. Prof. Tom
Claessens, dank u wel voor uw nuchtere en doordachte opmerkingen. Mathias

6
Vermeulen, bedankt voor het meebouwen aan modellen en het mee begeleiden
van thesisstudenten. Ook dank aan Jurgen Deviche voor de tips & tricks bij
het verwerken van siliconen en het aansluiten van specifieke druksensoren.
Ten slotte, gaat mijn dank ook in het bijzonder uit naar David Mester
(voormalig CEO van ViVitro, Victoria, British Colombia) voor zijn concreet
advies over de noden in de markt van linkerharthelftmodellen.
Mijn thesisstudenten (Ben, Ruben, Jo, Mathias, Ludo, Arend, Johny,
Isabelle, Alexander, Lieselot, Nicolas, Joren en Laurens) wil ik bedanken voor
de fijne samenwerking en hun bijdrage aan mijn project. Verder dank ik mijn
collega’s van BioMMeda, IBiTech (Abigaïl, Bram, Benedict, Charlotte,
David, Denis, Dieter, Dries, Francesco, Frederic, Gianluca, Guillermo, Guy,
Hicham, Iris, Jan, Joris, Koen, Liesbeth, Lieve & Seba, Luis, Matthieu,
Michele, Mirco, Nic, Peter, Rado, Sander, Saskia, Sofie, Sunny, Thomas,
Tomas en Wouter) voor de aangename sfeer en voor de leuke gesprekken.
Mijn dank gaat ook uit naar mijn collega’s van de vroegere INWE vakgroep
mechanica (Annemieke, Antoine, Armand, Cédric, Charles, Christian, Kim,
Frederic, Frank, Jan, Guy, Ingrid, Luc, Ludwig en Marc) als ook naar mijn
huidige collega’s van de FNT vakgroep mechatronica (Caroline, Frank, Hilde,
Hubert, Johan, Koen, Luc, Marianne, Mathias, Mandy, Mauricette, Marieke,
Michel, Patrick, Patrick, Peter, Philippe, Piet, Stefan, Ruddy, Tom, Wim,
Veerle, Yvan, Yves en Yves) voor hun steun, interesse en betrokkenheid. Een
speciaal woord van dank ook aan Muriel Vervaeke en Veerle Delrue,
decanaatsmedewerkers FEA, voor het supersonisch in orde brengen van mijn
dossier.
Aan al onze vrienden en familie, geloof me, er is een (sociaal) leven
na het finaliseren van dit doctoraat! Peter, Gina, Monique, Nelly, Albert, Dina,
Gudrun, Matthieu, Dries, Marieke, Paul, Iris, Tim, An, Tim, Gerlinde, Chris,
David, jullie horen tot de club van de allergrootste supporters voor het
afwerken van dit doctoraat . Ook speciale dank aan de vele babysitters-
vrienden tijdens de eindspurt: Evi, Stefan, Cindy, Stefan, Naomi, Bart, Sara,
Eefje, Yves, Manu, Nele, Dirk en Els. Ook mijn (schoon)broers en
(schoon)zussen wil ik danken voor hun betrokkenheid. Mijn grootste dank
gaat uit naar mijn hemelse Vader, die me leidt en keer op keer moed en de
nodige kracht geeft.
Mama, bedankt voor uw bemoedigende teksten en de hulp en zorg
voor onze kids. Moma en bopa, bedankt dat onze kapoenen ook bij jullie
mochten komen spelen en logeren. Jullie zijn schatten! Bedankt voor jullie
gebed, steun en voorbeeld!

7
Hoeveel werk en tijd ik ook gestoken heb in het maken van harten
binnen dit doctoraat, het resultaat blijft nog steeds een sterke vereenvoudiging
van de werkelijkheid. Wat blijft het een hemelsbreed verschil met de vier
‘echte’ hartjes die ik mocht helpen realiseren tijdens dit doctoraatstraject.
Ruben, Bram, Anna en Baby, jullie zijn het mooiste geschenk dat ik ooit
mocht ontvangen en ik ben zo dankbaar voor jullie!
Saartje, ik herinner me de woorden van het liedje van onze
openingsdans 10 jaar geleden (Everything About You, Darlene Zschech).
Hoewel de woorden van het liedje dezelfde zijn gebleven, heeft de betekenis
een diepere dementie – oeps, dat is voor nu nog niet, ik bedoelde dimensie
- gekregen. Op dat moment zongen we van wat we droomden, maar nu kunnen
we ook zien wat al uitgekomen is. Want schat, jij realiseert het bijna
onmogelijke in deze uitdagende en intense periode van ons leven (You'd catch
a falling star if I asked you), jij geeft al wat je bent, elke dag, en maakt het
leven mooi, elke dag. Ik hou gewoon helemaal van wie je bent. Jij was en bent
voor mij onmisbaar, niet in het minst bij het realiseren van deze hartmodellen
en het schrijven van dit proefschrift, of bij het zorgen voor onze vier ‘echte’
hartjes .
Saartje, Ruben, Bram, Anna en Baby, ik kijk uit om meer van onze
tijd en harten met elkaar te delen, en dat zal nu makkelijker zijn na deze laatste
zin van dit proefschrift .
Benjamin Van Der Smissen, April 2016

8

9
“Above all else, guard your heart,
for everything you do flows from it.”
King Solomon, ca. 900 B.C.

10

11
Samenvatting
INLEIDING
Hart- en vaatziekten vormen wereldwijd een van de belangrijkste
doodsoorzaken. In het bestuderen van dit probleem wordt door onderzoekers
zeer veel belang gehecht aan de rol van de linkerhartcirculatie (grote
bloedsomloop). In dat onderzoek vormt experimentele simulatie een
onmisbaar instrument, naast computermodellering en dierexperimenteel
onderzoek. Zo blijft experimentele simulatie onder andere een onmisbare tool
om cardiovasculaire procedures en medische hulpmiddelen uit te testen en te
verbeteren. Voordat dergelijke cardiovasculaire toepassingen in klinische
omgeving gebruikt kunnen worden, moeten deze voldoen aan extreme eisen,
vastgelegd in strenge certificaten die door regelgevende instanties zoals de
FDA en ISO worden uitgereikt. Dergelijke certificaten kunnen pas verkregen
worden als cardiovasculaire procedures voldoen aan strikte protocollen. Deze
protocollen omvatten richtlijnen voor prestatiekenmerken, maar benadrukken
ook het belang van bench tests, virtuele tests, in-vivo tests en klinische studies.
In dit verband stelt de FDA dat klinisch relevante benchtop modellen, en bij
voorkeur de best mogelijke, dringend nodig zijn om vooruitgang te boeken bij
het in-vitrotesten.
In de afgelopen 55 jaar werd er veel aandacht besteed aan het
ontwikkelen en verfijnen van in-vitro benchtop modellen van de
linkerharthelft en de bijhorende experimentele opstellingen. In deze evolutie,
werden in-vitromodellen steeds uitgedaagd om de complexe anatomische en
fysiologische kenmerken van de menselijke linkerharthelft alsmaar
nauwkeuriger na te bootsen. Ook zijn deze modellen in recente jaren door de
opkomst van nieuwe technologieën (zoals medische beeldvorming, 3D-
printtechnologie, software-gebaseerde regulering van actuator systemen) sterk
verbeterd. Echter, nog steeds ontbreken er een aantal opmerkelijke,
elementaire anatomische kenmerken en fysiologische mechanismen in de
huidige in-vitrosimulatoren van de linkerharthelft.
In deze context formuleren we binnen dit proefschrift drie
doelstellingen. Als eerste doel willen we de uitdagingen binnen de huidige in-
vitrobenaderingen identificeren, om van daaruit praktische richtlijnen te
formuleren hoe in-vitromodellen moeten worden geoptimaliseerd om tot meer
anatomische en fysiologische getrouwheid te komen. Het tweede doel van dit
onderzoek is om effectief meer natuurgetrouwe modellen van het
linkerventrikel (LV) en de mitralisklep te ontwerpen en te ontwikkelen. Het
derde doel is dan om deze nieuw ontwikkelde componenten te integreren tot

12
een meer accuraat en meer natuurgetrouw in-vitromodel van de
linkerharthelft.
Dit proefschrift heeft de volgende opbouw. Deel I start met een
overzicht van de belangrijkste anatomische en fysiologische aspecten van de
linkerharthelft. Daarna volgt een gedetailleerde bespreking van de bestaande
in-vitromodellen van de linkerharthelft. Vervolgens volgt een kritische
evaluatie van deze huidige modellen. Op basis daarvan worden praktische
richtlijnen voor de optimalisatie van deze modellen geformuleerd.
Daaropvolgend wordt een ontwerpmethodologie beschreven en toegepast
waarbij nieuwe ideeën worden gegenereerd, geselecteerd en verder
ontwikkeld om te komen tot innovatieve concepten die aan de specifieke
praktische richtlijnen voor meer optimale in-vitromodellen voldoen. In de
volgende drie delen worden deze concepten in meer detail besproken. Deel II
beschrijft drie nieuw ontwikkelde in-vitromodellen van het linkerventrikel
terwijl Deel III twee nieuwe in-vitroklepmodellen beschrijft, nl. van de
mitralisklep (en bijhorende structuren) en van de veneuze klep als
nevenproject. In Deel IV, worden deze gemodelleerde, individuele
componenten geïntegreerd in twee omvattende linkerharthelftmodellen. Van
deze modellen werd zowel een monolithische versie (in één stuk) als een
modulaire, bilithische versie (in twee stukken) ontwikkeld. Deze laatste maakt
de (her)plaatsing van diverse LV modellen in experimentele opstellingen
mogelijk. Deel V geeft ten slotte een overzicht van de belangrijkste
bevindingen van dit proefschrift, samen met de methodologische beperkingen,
innovaties, en perspectieven voor verder onderzoek. Een algemeen overzicht
van doctoraat wordt gegeven in Figuur 121 en Tabel 8. Hieronder wordt de
inhoud van elk hoofdstuk kort samengevat.
DEEL I. DE LINKERHARTHELFT: VAN ANATOMIE TOT MODEL
HOOFDSTUK 1. DE STRUCTUUR EN FUNCTIE VAN HET
LINKERVENTRIKEL
Hoofdstuk 1 behandelt de anatomie en fysiologie van de linkerharthelft. Ten
eerste beschrijft dit hoofdstuk de bloedsomloop, de hartcyclus, de algemene
fysiologie en de determinanten van de diastolische functie van de
linkerharthelft. Ten tweede concentreert dit hoofdstuk zich op de macro- en
microscopische structuur van de hartwand. Bijzondere aandacht gaat hierbij
uit naar de manier waarop de unieke, uniaxiale cellulaire beweging van

13
cardiomyocyten wordt overgebracht naar de driedimensionale
wandvervormingspatronen van het LV die op macroscopisch niveau
waargenomen worden tijdens systole en diastole. Tot slot focust dit hoofdstuk
op de functie en de structuur van de cardiovasculaire kleppen, met een meer
diepgaande bespreking van het kleppenvlak en de mitralisklep, omdat deze
een centrale rol vervullen in dit proefschrift.
HOOFDSTUK 2. IN-VITROMODELLEREN VAN DE
LINKERHARTHELFT: STATE-OF-THE-ART
Hoofdstuk 2 beschrijft de ontwikkelingsgeschiedenis van cardiovasculaire
simulatoren over de afgelopen 55 jaar. Dit overzicht illustreert enerzijds de
grote vooruitgang en anderzijds de brede waaier van methoden die gebruikt
werden om in-vitrohartmodellen te ontwerpen en te ontwikkelen. In deze
review, worden een dertigtal in-vitrosystemen besproken die een belangrijke
rol speelden in de geschiedenis van cardiovasculaire modellen. Drie
belangrijke evoluties kunnen hierbij onderscheiden worden. Ten eerste is er
een geleidelijke progressie in het nabootsen van de complexe anatomie van de
linkerharthelft. Ten tweede is er duidelijke vooruitgang in het simuleren van
fysiologische events in de linkerharthelft. Ten derde is er een significante
evolutie in het afstemmen van deze in-vitromodellen om (klinische) validatie
en onderzoekstechnieken mogelijk te maken. Tot slot benadrukt deze review
de veelzijdige toepassingen waarvoor cardiovasculaire simulators tot op
vandaag gebruikt worden en beklemtoont het de complexiteit van het moderne
in-vitromodelleren.
HOOFDSTUK 3. KRITISCHE EVALUATIE EN PRAKTISCHE
RICHTLIJNEN VOOR HET OPTIMALISEREN VAN
LINKERHARTHELFTMODELLEN
De reviewinformatie van Hoofdstuk 2 is een waardevolle inspiratiebron om
ontwerpcriteria te definiëren om de optimalisatie van cardiovasculaire
simulatoren te bevorderen. Hoofdstuk 3 evalueert kritisch de tekortkomingen
van de huidige in-vitrobenaderingen. Tegelijkertijd formuleert dit hoofdstuk
praktische richtlijnen die de leidraad vormen voor de optimalisatie van in-
vitromodellen van de linkerharthelft in dit proefschrift. Deze praktische
richtlijnen (practical guidelines, PG) concentreren zich rond drie thema's.

14
Ten eerste blijkt er dringend nood aan het ontwikkelen van meer
natuurgetrouwe linkerventrikel (LV) modellen. Bijna alle huidige
cardiovasculaire simulatoren bootsen momenteel de wand van de
linkerventrikelwand na door een dunwandig membraan, wat niet overeenstemt
met de fysische realiteit. Ontwerpen van meer anatomisch en fysiologisch
accurate LV modellen zouden zich minstens op vijf doelen moeten richten, nl.
op het realiseren van een dikwandige benadering van de LV wand (PG1), op
het includeren van de anisotrope eigenschappen van de natuurlijke LV wand
(PG2), op het modelleren van de LV wandcontractie door het integreren van
actieve contractiele elementen in de LV wand (PG3), op het simuleren van de
verschillende globale vormveranderingen van de LV wand, zoals de
longitudinale, circumferentiële en radiale vervorming (PG4a-c), en, op het
realiseren van de torsiebeweging van het LV (PG5).
Ten tweede blijkt er uit Hoofdstuk 2 een belangrijke behoefte aan het
ontwikkelen van een natuurgetrouwe mitralisklep. Tot op vandaag blijken er
nauwelijks in-vitromodellen van de mitralisklep te bestaan, aangezien
cardiovasculaire simulatoren voornamelijk mechanische, bioprosthetische of
post-mortem mitraliskleppen in hun modellen integreren. Een in-vitro
ontwerp van de mitralisklep is echter zeer interessant omdat het zich kan
richten op het modelleren van de meer gedetailleerdere anatomische
kenmerken van de mitralisklep en het bijhorende mitralisklepapparaat (PG6a-
e), zoals de flexibele en zadelvormige annulus, de twee klepbladen (anterior
en posterior), de chordae tendinae en de papillaire spieren (zowel
anterolateraal als posteromediaal).
Ten slotte blijkt uit Hoofdstuk 2 dat huidige cardiovasculaire
simulatoren twee belangrijke beperkingen vertonen met betrekking tot de
integratie van de mitralisklep in het kleppenvlak van linkerharthelftmodellen.
Wanneer men zo’n mechanische, bioprosthetisch of post-mortem mitralisklep
integreert in een linkerharthelftmodel, valt op dat het kleppenvlak steeds
gemodelleerd wordt met een rigide benadering, terwijl een meer anatomische
natuurgetrouwe versie best een flexibel kleppenvlak zou implementeren
(PG7). Zo’n flexibel kleppenvlak garandeert immers de ophanging van een
flexibele mitralisring, terwijl ook de LV contractiefunctie intact blijft.
Daarnaast zorgen de huidige starre benaderingen van het kleppenvlak er ook
voor dat huidige modellen van de linkerharthelft niet in staat zijn om de
apicale-basale bewegingen van het natuurlijke kleppenvlak te simuleren. Het
verdient dus aanbeveling dat toekomstige in-vitromodellen zich richten op
nieuwe, innovatieve ventrikelcontractiemechanismen die deze flexibele,
neerwaartse bewegingen van het kleppenoppervlak kunnen toelaten (PG8).

15
HOOFDSTUK 4. DE ONTWERPMETHODOLOGIE
Hoofdstuk 4 bespreekt de algemene ontwerpstrategie van dit proefschrift die
gebruikt werd om ideeën op een gestructureerde manier te genereren en om
deze ideeën op een zo effectief mogelijke manier te realiseren. De toegepaste
ontwerpmethodologie bestaat uit twee opeenvolgende divergentie-
convergentiefasen. De eerste divergentie-convergentiefase start met een brede
en diepgaande verkenning van de literatuur die vervolgens wordt geanalyseerd
om de noden en praktische richtlijnen scherp te stellen. De toepassing van
deze eerste divergentie-convergentiefase omvat het literatuuronderzoek over
de anatomie en fysiologie van de linkerharthelft (Hoofdstuk 1) en de huidige
state-of-the-art van linkerharthelftsimulatoren (Hoofdstuk 2). Op basis van
deze verkenning van de literatuur, worden dan de onderzoeksnoden en
bijhorende praktische richtlijnen gedefinieerd om cardiovasculaire
simulatoren te optimaliseren (Hoofdstuk 3). De tweede divergentie-
convergentiefase omvat het proces waarbij eerst meerdere nieuwe ideeën
worden gegenereerd om aan de vooropgestelde noden en praktische richtlijnen
tegemoet te komen, en waarbij vervolgens de beste conceptideeën
geselecteerd en verder ontwikkeld worden in een iteratief proces. Hoofdstuk
4 geeft meer details over deze ontwerpprocessen die de basis vormen van de
gerealiseerde in-vitro modellen die voorgesteld worden in Hoofdstukken 5 tot
en met 12. Dit hoofdstuk illustreert dat elk in-vitro model van dit proefschrift
niet enkel gebaseerd is op afgelijnde ontwerpcriteria maar ook het resultaat is
van een breed scala aan gegenereerde ideeën en uitgevoerde hands-on
experimenten.
DEEL II. IN-VITROMODELLEN VAN DE LINKER VENTRICULAIRE SPIER
HOOFDSTUK 5. EEN DIKWANDIG MODEL VAN DE LINKER
VENTRICULAIRE SPIER
Hoofdstuk 5 beschrijft het ontwerp en de ontwikkeling van een eerste
innovatief LV model (LV1). Dit model werd uitgerust met een dikwandige
modellering van de LV spier om zo een meer realistische weergave van het
LV te benaderen. Huidige dunwandige, passieve experimentele
ventrikelmodellen bestaan uit een silicone membraan in een gesloten kamer,
dat passief wordt samengeperst door een extern gekoppelde zuigerpomp.
Hoewel deze modellen over het algemeen een goede pompfunctie vertonen,
blijven de vervormingen van het membraan onvoorspelbaar en kunnen deze
dus niet gelden als een goede nabootsing van de natuurlijke wandvervorming

16
van het LV. In dit hoofdstuk ontwierpen we daarom een experimenteel
hydraulisch LV model waarbij de vervormingen van de linkerventrikelwand
wel gecontroleerd kunnen worden. De praktische realisatie van dit model
bestond uit een gecombineerde toepassing van rapid prototyping technieken.
Ook testten we de werking van dit model om de wandvervorming en
pompfunctie te valideren. Onze experimenten tonen aan dat dit model zowel
circumferentiële als longitudinale vervorming realiseert, en dat dit model vrij
fysiologische, realistische waarden van druk en debiet kan genereren. Dit
model realiseert dus twee van de vijf gespecifieerde praktische richtlijnen voor
nieuwe in-vitroventrikelmodellen: het implementeert een dikwandige
benadering van de linker ventriculaire spier (PG1) en het modelleert twee
wandvervormingspatronen, namelijk, longitudinale en circumferentiële
vervorming (PG4a-b).
HOOFDSTUK 6. EEN MODEL VAN DE ACTIEVE
WANDCONTRACTIE EN TORSIEBEWEGING VAN HET
LINKERVENTRIKEL
Hoofdstuk 6 beschrijft het ontwerp en de ontwikkeling van een tweede
innovatief LV model (LV2). Dit model integreert contractiele elementen in de
ventrikelwand om zo zowel het effect van spiercontractie als van meer
natuurgetrouwe wandvervormingspatronen na te bootsen, in termen van
longitudinale, circumferentiële en radiale vervorming, maar ook in termen van
torsie. Om deze verschillende wandvervormingspatronen in onze actuator te
reproduceren, ontwierpen we een nieuw soort artificieel LV "spierweefsel",
dat bestaat uit meerdere actieve contraherende cellen. De contractie van zo’n
cel baseert zich op een mechanisme waarbij perslucht, in zo’n cel, in één
richting contractie veroorzaakt en loodrecht op deze richting expansie
veroorzaakt. Door middel van een uitgekiende organisatie en geometrie van
deze contractiele cellen binnen één kunstmatige LV spier, de toegepaste druk
in de cellen, en de heersende LV belastingcondities (voor- en nabelasting) is
het mogelijk om de globale wandvervorming van het LV te bepalen. Een
experimentele versie van dit principe werd gebouwd op basis van een
eenvoudige plastic zak. Deze werd vervolgens gekoppeld aan een hydraulisch
circulatiemodel van het vaatstelsel (inclusief compliantie en weerstand). De
wandvervormingspatronen van dit model werden visueel gevalideerd en de
pompprestatie werd geëvalueerd in termen van LV volume, druk en hartritme.
Onze experimentele resultaten demonstreerden dat de globale beweging van
dit LV de beweging van een natuurlijk LV relatief goed benaderde. Ook
toonden ze een nauwe samenhang aan tussen dit experimentele model en een
natuurlijk LV in termen van eind-systolisch volume en druk, eind-diastolisch
17
volume en druk, slagvolume, ejectiefractie en druk-volume relatie. Deze
veelbelovende resultaten suggereren dat dit model een grote vooruitgang
betekent tegenover de huidig gebruikte actuator mechanismen. Verdere
optimalisaties van dit model dragen het potentieel om meer fysiologische
intracavitaire bloedstromingspatronen te genereren. Dit model komt tegemoet
aan alle vijf praktische richtlijnen om meer natuurgetrouwe LV modellen te
ontwikkelen: het implementeert een dikwandige benadering van de linker
ventriculaire spier (PG1), het includeert anisotrope wandeigenschappen door
middel van de toepassing van opblaasbare cellen (PG2), het integreert actieve
contractiele wandelementen (PG3), het modelleert drie
wandvervormingspatronen, zowel longitudinale, circumferentiële als radiale
vervorming (PG4a-c) en het slaagt er ook in om torsie te genereren (PG5).
Bovendien laat het nieuw ontwikkelde, innovatieve actuatormechanisme van
het LV de neerwaartse beweging toe van het kleppenoppervlak (PG8).
HOOFDSTUK 7. MODELLEREN VAN DE TORSIEBEWEGING VAN
HET LINKERVENTRIKEL DOOR MIDDEL VAN DE INTEGRATIE VAN
ANISOTROPE MATERIAALEIGENSCHAPPEN
Hoofdstuk 7 beschrijft het ontwerp en de ontwikkeling van een derde LV
model (LV3), welke geïnspireerd werd door de draaibeweging van het
kunstmatige spiermodel LV2 uit Hoofdstuk 6. Dit LV3-model omvat geen
dikwandige modellering van de LV spier, maar voegt in plaats daarvan vezels
toe aan de huidig courant gebruikte, dunwandige LV modellen om op die
manier de natuurlijke torsiebewegingen te simuleren. Het doel van dit model
is om een breder fysiologisch bereik van torsieparameters te verkrijgen dan
wat gerealiseerd werd door het LV2 model uit Hoofdstuk 6, dat een maximale
torsiewaarde van ongeveer 13º bereikte. Daarnaast wenst dit model ook de
circumferentiële en de longitudinale wandvervormingen van het natuurlijke
LV na te bootsen. Het vervormingsconcept van dit model is gebaseerd op het
uitrekken van een anisotroop membraan waarbij vezels ingebed werden in een
flexibele matrix. Door deze inbedding wordt een composietstructuur
gevormd. Om dit werkingsprincipe te bewijzen en om nieuwe inzichten te
verkrijgen in de relatie tussen torsiegedrag en vezeloriëntatie, werden drie
verschillende anisotrope LV modellen met verschillende
vezeloriëntatiehoeken (20°, 35° en 45°) gebouwd. Deze experimentele
modellen werden in de bestaande cardiovasculaire ViVitro-simulator
gemonteerd en getest, waar ook de torsiehoeken tijdens de hartcyclus
geregistreerd konden worden. Deze experimenten tonen aan dat elk van deze
drie modellen een homogene wandvervorming produceert met duidelijke
torsie-, circumferentiële en ook longitudinale bewegingen. Bovendien tonen

18
de experimenten aan dat de mate van torsie merkelijk gerelateerd is aan de
vezeloriëntatie van het LV model. Hierbij leiden de hogere
vezeloriëntatiehoeken tot hogere torsiehoeken. De fysiologische torsiehoek
van ongeveer 17° wordt gegenereerd door het model met een
vezeloriëntatiehoek van 20°. Dit model voldoet aan drie beschreven
praktische richtlijnen voor meer natuurgetrouwe LV in-vitromodellen: het
includeert anisotrope wandeigenschappen (PG2), het modelleert twee globale
wandvervormingspatronen, nl. longitudinale en circumferentiële vervorming
(PG4a-b), alsook torsie (PG5). Een belangrijke beperking van dit model is
echter dat het gebaseerd is op een vereenvoudigde geometrie van het LV en
niet op de natuurlijke vorm van het LV. Daarom werd een meer
natuurgetrouwe geometrie op dit LV3-model toegepast in een latere fase van
dit proefschrift. Dit aangepaste LV3-model zal geïntegreerd worden in het
uiteindelijke linkerharthelftmodel LH2 (Hoofdstuk 11).
DEEL III. IN-VITROMODELLEN VAN DE MITRALISKLEP (EN DE VENEUZE
KLEP)
HOOFDSTUK 8. EEN MODEL VAN DE MITRALISKLEP OP BASIS
VAN EEN VEZELHOUDEND COMPOSIETMATERIAAL
Hoofdstuk 3 identificeerde een sterke nood aan het ontwikkelen van meer
natuurgetrouwe in-vitromodellen van de mitralisklep, welke ook de complexe
anatomische eigenschappen van het mitralisklepapparaat zouden kunnen
modelleren. In dit hoofdstuk, stellen we een nieuwe methode voor het
modelleren van de mitralisklep voor. Deze maakt gebruik van een
vezelhoudend composietmateriaal (met dezelfde materiaalsamenstelling als
het LV3-model uit Hoofdstuk 7) om een mitralisklep te realiseren met een nog
steeds vereenvoudigde, maar meer natuurgetrouwe geometrie. De
vooropgestelde methode maakt het mogelijk om de belangrijkste anatomische
structuren van het mitralisklepapparaat, zoals de flexibele en zadelvormige
annulus, de voorste en achterste klepbladen, de chordae tendineae en de
anterolaterale en posteriomediale papillaire spieren (PG6a-e) na te bootsen. In
het kader van deze studie realiseerden we twee werkende prototypes. Het
eerste mitralisklepmodel (MV1) toonde vooreerst de werkzaamheid van het
productieproces aan, terwijl het tweede mitralisklepmodel (MV2) een verdere
geoptimaliseerde versie is van het eerste model met het oog op een meer
natuurgetrouwe benadering van de geometrie en van de vezels in de tip van
het klepblad. Het interessante van de in dit hoofdstuk ontwikkelde methode is

19
dat deze het mogelijk maakt om de nieuw ontwikkelde mitralisklepmodellen
te integreren in de integratieve linkerharthelftmodellen, zoals beschreven
wordt in Hoofdstuk 10. Deze integratie maakt het mogelijk om ook de
prestaties van deze klepmodellen experimenteel te evalueren binnen de
context van deze linkerharthelftmodellen. Hoofdstuk 8 geeft alvast een
beknopte samenvatting weer van de resultaten over de functionaliteit van de
ontwikkelde klepmodellen. Onze testen tonen hierbij aan dat het MV2-model
relatief goed voldoet aan de doelstelling om fysiologische waarden van
mitralisklepprestaties te genereren, in termen van ‘effective orifice area’ en
transmitrale drukgradiënten. Ook het MV1-model blijkt interessant omdat het
een vernauwde mitralisklep blijkt na te bootsen, met hoge transmitrale
drukgradiënten, lage ‘effective orifice area’s’ en terugstroom (regurgitatie).
Kortom, de nieuw ontwikkelde prototypes van de mitralisklep tonen aan dat
deze nieuwe methode gebruikt kan worden om zowel normale als
pathologische mitraliskleppen in-vitro te modelleren.
HOOFDSTUK 9. INNOVATIEF ONTWERP VAN EEN PIV-COMPATIBEL MODEL VAN DE VENEUZE KLEP
Er blijkt bij het in-vitromodelleren van cardiovasculaire kleppen een
groeiende belangstelling voor het gebruik van Particle Image Velocimetry
(PIV), om zo computermodellen experimenteel te valideren en
stromingspatronen langsheen de kleppen te simuleren. In het licht van deze
recente evoluties zouden nieuwe ontwerpen van cardiovasculaire simulatoren
dus idealerwijs PIV-compatibel moeten zijn en voldoen aan de strenge
vereisten om PIV-metingen mogelijk te maken. Dit betekent dat
cardiovasculaire modellen volledig transparant moeten zijn, terwijl ze toch
hun functionaliteit blijven behouden (zie PG9). In dit proefschrift hebben we
deze praktische richtlijn niet gerealiseerd in de context van in-
vitromodellering van de linkerharthelft, maar we ontwikkelden wel een PIV-
compatibel prototype van de veneuze klep (VV) in het kader van het
optimaliseren van in-vitromodellen voor hemodialyse gerelateerd onderzoek.
Toekomstig onderzoek moet evalueren in hoeverre deze concepten bruikbaar
zijn om een geheel, volledig transparant, PIV-compatibel linkerharthelft te
bouwen. Hoofdstuk 9 beschrijft het innovatieve ontwerp van een PIV-
compatibele veneuze klepmodel die zijn functionaliteit behoudt bij minimale
drukverschillen en die tevens in staat is om waardevolle PIV-data te
genereren. Ons ontwerp is gebaseerd op de transparante en buigzame
kenmerken van polymeerfilm. Op basis hiervan werd een operationele klep
gerealiseerd die gevoelig is voor vloeistofbewegingen en die zijn
functionaliteit behoudt, zelfs bij lage drukverschillen. Dit prototype voldoet

20
dus aan de vooropgestelde praktische richtlijn om een PIV-compatibele
veneuze klep te ontwerpen (PG9). Bovendien tonen de preliminaire resultaten
aan dat de PIV-metingen niet enkel de stromingspatronen rond de klep, maar
ook in de klep zelf, in kaart kunnen brengen. Dit opent de intrigerende
mogelijkheid dat men op basis van dit soort in-vitromodellen experimentele
studies kan opzetten om intravalvulaire vloeistofpatronen verder te
onderzoeken.
DEEL IV. MODELLEN VAN DE LINKERHARTHELFT: EEN INTEGRATIEVE
BENADERING
HOOFDSTUK 10. MODELLEREN VAN DE LINKERHARTHELFT: EEN MONOLITHISCHE BENADERING
Hoofdstuk 10 gaat dieper in op het ontwerp en de ontwikkeling van een
innovatief monolithisch (in één stuk) linkerharthelftmodel (LH1). Dit model
incorporeert het huidig courant gebruikt dunwandige LV model samen met
het flexibele, van vezelhoudend composietmateriaal gemaakte
mitralisklepmodel MV2 (Hoofdstuk 8). Dit hoofdstuk beschrijft ook het
ontwerp en de ontwikkeling van specifiek op maat vervaardigde ophangings-
en aansluitingssystemen. Deze maken de integratie van dit
linkerharthelftmodel in een bestaand pompsysteem van een hartsimulator
mogelijk, nl. de cardiovasculaire ViVitro simulator. Hierdoor kan het model
van de linkerharthelft experimenteel getest worden. Dit hoofdstuk rapporteert
tenslotte preliminaire maar veelbelovende resultaten van hydrodynamische en
echocardiografische metingen van het model van de linkerharthelft. Deze
resultaten suggereren dat deze nieuwe benadering van modellering op
meerdere manieren een relatief goede benadering geeft van de fysische,
anatomische realiteit. Ten eerste is de geometrie van dit in-vitromodel
gebaseerd op medische beelden van een echt hart. Dit model omvat niet alleen
het linkerventrikel, linkeratrium en de aortaboog, maar ook meer
gedetailleerde kenmerken, zoals het hartoortje van het linkeratrium en de
ingangen van de vier longaders. Ten tweede integreert dit model het eerder
beschreven mitralisklepapparaat MV2 (Hoofdstuk 8), welke nog meer
anatomisch gebaseerde structuren (PG6a-e) aan het linkerharthelftmodel
toevoegt. Ten derde is dit linkerharthelftmodel gemaakt van silicone en
vezelhoudende materialen. Hierdoor kunnen zowel de mechanische als de
ultrasone eigenschappen van het biologische zachte hartweefsel worden
nagebootst. Ten vierde was het door het innovatieve productieproces mogelijk

21
om dit complexe model in één stuk te realiseren, wat een meer natuurgetrouwe
en compacte versie van het linkerharthelftmodel oplevert. Ten vijfde zorgt het
op maat ontwikkelde ophangingssysteem voor functionele compatibiliteit met
een standaard cardiovasculaire simulator, terwijl er toch geen afbreuk gedaan
wordt aan het flexibele karakter en de complexe anatomische-gebaseerde
vorm van het kleppenvlak (PG7). Ten slotte tonen de preliminaire
experimenten aan dat dit linkerharthelftmodel in staat is om relatief
fysiologisch normale waarden te genereren, maar ook dat de structuren van dit
hart zichtbaar gemaakt kunnen worden door ultrageluid. Ook tonen de
resultaten dat het model fysiologisch-gerelateerde intraventriculaire
stromingspatronen genereert die via kleuren Doppler kunnen worden
waargenomen. Samengevat betekenen deze verschillende sterke punten van
onze integrale, monolithische benadering een belangrijke stap voorwaarts in
het ontwikkelingsproces van in-vitromodellen van de linkerharthelft. Toch
blijken er nog steeds een aantal essentiële aanbevelingen voor in-
vitromodeloptimalisatie te ontbreken. Het model implementeert immers niet
de anisotrope eigenschappen van de natuurlijke ventrikelwand (PG2) en laat
het daarom niet toe om de ventriculaire wandvervormingspatronen zoals
longitudinale, circumferentiële en radiale vervorming (PG4a-c) of de
draaiende torsiebeweging (PG5) te integreren of te controleren.
HOOFDSTUK 11. MODELLEREN VAN DE LINKERHARTHELFT: EEN BILITHISCHE BENADERING EN STUDIE VAN HET EFFECT
VAN TORSIE OP INTRACARDIALE DIASTOLISCHE
DRUKPARAMETERS
Hoofdstuk 11 beschrijft de ontwikkeling van het innovatief
linkerharthelftmodel LH2, dat de unieke kinematische mogelijkheden van het
anisotrope model LV3 (Hoofdstuk 7) combineert met het anatomiegetrouwe
mitralisklepmodel MV2 (Hoofdstuk 8), en het ophangingssysteem van
Hoofdstuk 10, dat de verbinding toelaat tussen het linkerharthelftmodel en het
pompsysteem van de standaard cardiovasculaire ViVitro-simulator. Dit LH2-
model is gebaseerd op het monolithische linkerharthelftmodel LH1 maar werd
aangepast naar een modulair, bilithisch linkerharthelftmodel met een aparte,
demonteerbare ventriculaire component. Hierdoor waren we in staat om een
innovatieve, experimentele opstelling te bouwen waarbij we vijf
ventrikelmodellen met verschillende wandvervormingspatronen met elkaar
kunnen vergelijken op vlak van intracardiale drukparameters. In deze set-up
worden twee modellen met hoofdzakelijk longitudinale en circumferentiële
vervorming, samen met twee modellen met verschillende torsiegraden,
vergeleken met een generiek model met algemene deformatiepatronen.

22
Hiertoe werden vijf verschillende ventrikelmodellen gebouwd op basis van
verschillende anisotrope eigenschappen en achtereenvolgens gemonteerd en
getest in ons bilithisch LH2-model. De experimentele metingen rapporteren
hoe de verschillende globale wandvervormingspatronen en torsie invloed
uitoefenen op de transmitrale (TMPDe) en intraventriculaire drukverschillen
tijdens de vroeg-diastolische fase (IVPDe). Opmerkelijk is dat deze resultaten
substantiële effecten van de torsiemodellen suggereren: bij toenemende torsie
observeren we lagere TMPDe waarden en hogere IVPDe waarden. Deze
substantiële effecten kunnen gedeeltelijk worden toegewezen aan de
longitudinale vervormings-component, maar de resultaten suggereren tevens
dat de torsiebeweging een aanvullend effect heeft bovenop de longitudinale
contractiecomponent. Dit integratief model LH2 voldoet aan het grootste
aantal praktische richtlijnen zoals voorgeschreven in Hoofdstuk 3. Het kan
veelzijdig wandvervormingspatronen genereren door middel van anisotrope
wandeigenschappen (PG2) en genereert zowel longitudinale als
circumferentiële vervorming (PG4a-b) maar ook torsie (PG5). Verder bevat
het LH2-model ook de geïntegreerde mitralisklep model met alle
basiseigenschappen van het mitralisklepapparaat MV2 (PG6a-e). Ten slotte
wordt ook in dit model de mitralisklepinrichting geïntegreerd in een flexibel
kleppenvlak (PG7).
DEEL V. CONCLUSIES EN PERSPECTIEVEN VOOR DE TOEKOMST
HOOFDSTUK 12. CONCLUSIES EN RICHTLIJNEN VOOR
TOEKOMSTIG ONDERZOEK
Hoofdstuk 12 biedt een overzicht van de belangrijkste bevindingen en
conclusies van dit proefschrift en geeft een gedetailleerd overzicht (zie Tabel
8) in welke mate de ontwikkelde modellen voldoen aan de praktische
richtlijnen opgesteld in Hoofdstuk 3. In dit proefschrift, realiseerden we
werkende in-vitroprototypes van drie meer natuurgetrouwe LV-modellen, een
gedetailleerd model van het mitralisklepapparaat, en een PIV-compatibel
model van een veneuze klep. Bovendien slaagden we erin om deze
afzonderlijke componenten in twee integratieve linkerharthelftmodellen te
integreren, terwijl tegelijkertijd ook een flexibele kleppenvlak behouden kon
worden. We vervaardigden zowel een monolithische versie van dit
integratieve hartmodel, als een bilithische versie met een aparte,
demonteerbare ventriculaire component.

23
Globaal genomen kan men deze set van modellen als een belangrijke
stap voorwaarts beschouwen in het vervaardigen van meer realistische in-
vitromodellen van de linkerharthelft. Ook zijn deze modellen veelbelovend
omdat ze belangrijke instrumenten kunnen worden in in-vitro experimentele
studies om de kennis over klepgerelateerde of wandvervormingsgerelateerde
fysiologische gebeurtenissen te vergroten. Uiteindelijk zouden
geoptimaliseerde versies van deze modellen ook gebruikt kunnen worden voor
cardiovasculaire toepassingen in klinische context. Om dit ultieme doel te
realiseren, zou toekomstig onderzoek zich moeten richten op drie belangrijke
thema's van methodologische beperkingen bij de huidige modellen. Ten eerste
zouden optimalisaties van de in dit proefschrift ontwikkelde modellen gericht
moeten zijn op het modelleren van een aantal belangrijke fysiologische
gebeurtenissen, waaraan niet (voldoende) tegemoetgekomen wordt in de
huidige, voorgestelde modellen. Ten tweede zouden optimalisaties van deze
modellen kunnen streven naar nog nauwkeurigere geometrische benaderingen
van het natuurlijke hart. Ten derde erkennen we dat dit proefschrift in de eerste
plaats gericht is op het aantonen van de ‘proof-of-concept’ van de ontwikkelde
modellen en dat het belangrijk is om de voorgestelde modellen door meer
uitgebreide experimenten en metingen verder te evalueren en te valideren. Ten
slotte bespreken we in dit hoofdstuk drie belangrijke uitdagingen (nl. om in te
zetten op ‘actieve wand’, ‘integratie’ en ‘transparantie’) die - volgens ons -
het in-vitromodelleren van de linkerharthelft naar de volgende fase van
innovatie kunnen brengen. Hiervoor formuleren we tevens vier suggesties
voor nieuwe ontwerpen (linkerventrikelmodellen LV4 en LV5 alsook
volledige hartmodellen FH1 en FH2) die we ontwikkelden tijdens het denk-
en ontwerpproces van dit doctoraatstraject. We geloven dat de realisatie van
de voorgestelde modellen kunnen helpen om de drie geïdentificeerde
uitdagingen in toekomstig in-vitromodelleringsonderzoek aan te gaan.

24

25
Summary
INTRODUCTION
Cardiovascular diseases are one of the leading causes of death worldwide. To
address this global problem, the left heart circulation is extensively studied.
Despite recent advances in computational modelling and the availability of
animal models, experimental simulation of the left heart circulation remains
an indispensable tool for continually advancing cardiovascular procedures and
medical devices. Before such cardiovascular appliances can be implemented
in clinical settings, they need to meet extreme requirements to attain the
stringent certificates provided by regulatory agencies such as the FDA and
ISO. Attaining such certificates include compliance with strict protocols for
performance characteristics, bench testing, virtual testing, in-vivo tests, and
clinical studies. In this respect, the FDA postulated in 2011 that clinically
relevant benchtop models, preferably the best possible, are urgently needed to
advance in-vitro testing.
In-vitro benchtop models and mock circuits simulating the left heart
(circulation) have been developed and refined over the past 55 years. In this
process, benchtop models have been continuously challenged to more
accurately mimic the complex anatomical and physiological features of the
human left heart. Even though advances in engineering methods (such as
medical imaging, 3D print technology, and software-based regulation of
actuator systems) have significantly improved the design of these models,
there remain a number of elementary anatomical features and physiological
events that are not included in current in-vitro simulators.
The first research objective of this dissertation is to identify challenges within
current in-vitro approaches and to formulate practical guidelines towards in-
vitro model optimization in terms of anatomical and physiological likeness.
The second research objective is to design and develop more realistic models
of the left ventricle and the mitral valve. The third research objective is to
integrate these novel components to attain a more nature-like model of the left
heart.
The structure of the dissertation is as follows: Part I presents a
background overview of the anatomy and physiology of the left heart, the
state-of-the-art of left heart in-vitro modelling, and a critical discussion of the
challenges in optimizing current models. Based on this critical evaluation,
practical guidelines for a new generation of models are formulated.
Subsequently, the design methodology of this dissertation is described by
which new ideas are generated, selected and further developed into innovative

26
design concepts that meet the specified practical guidelines towards attaining
more optimal in-vitro models. The resulting final concepts are described in
more detail in the next three Parts. More particularly, Part II describes three
newly-developed in-vitro models of the left ventricle (LV) whereas Part III
presents novel concepts for the in-vitro modelling of the mitral valve
apparatus and of the venous valve as a side project. In Part IV, the modelled
individual components are integrated into two entire left heart models: a
monolithic version and a modular, bilithic version which allows the
(re)placement of various LV models in experimental set-ups. Part V (Chapter
12) concludes this dissertation by listing the key findings, methodological
considerations, innovations, and future perspectives. A global overview of this
dissertation is shown in Figure 121 and Table 8. Below, the content of each
chapter is summarized.
PART I. THE LEFT HEART: FROM NATURE TO MODEL
CHAPTER 1. THE LEFT HEART STRUCTURE AND FUNCTION
Chapter 1 discusses the anatomy and physiology of the left heart. Firstly, it
describes the circulatory system, the cardiac cycle, the general physiology and
determinants of diastolic function in the left heart. Secondly, this chapter
concentrates on the macro- as well as microscopic structure of the cardiac
wall, with a specific focus on how the unique uniaxial cellular motion of
cardiomyocytes is transferred to the three-dimensional wall deformation
patterns that can be observed at the macroscopic level of the left ventricle
during systole and diastole. Finally, this chapter directs attention to the
function and structure of the cardiovascular valves, providing a more in-depth
discussion of the valve plane and the mitral valve apparatus, which play a
central role in this dissertation.
CHAPTER 2. IN-VITRO MODELLING OF THE LEFT HEART: STATE-OF-THE-ART
Chapter 2 describes the history of cardiovascular simulator development,
which took place over the past 55 years. This history illustrates the major
progression and the wide range of approaches that has been taken to design
and develop in-vitro cardiovascular systems. This review presents more
details on about thirty in-vitro approaches that played a significant role in
cardiovascular modelling history. Three key areas of development can be

27
distinguished. First, there is a gradual progression in mimicking the complex
anatomy of the left heart. Second, there is a noted progress in the duplication
of physiological events. Third, there is a significant evolution in the adaptation
of these in-vitro models to (clinical) validation and examination techniques. This review also underscores the versatile applications for which
cardiovascular simulators are used and highlights the complexity of in-vitro
modelling today.
CHAPTER 3. CRITICAL EVALUATION AND PRACTICAL
GUIDELINES FOR OPTIMIZING CURRENT MODELS
The state-of-the-art information in Chapter 2 serves as a valuable source of
inspiration to define design criteria to advance cardiovascular simulator optimization. Chapter 3 critically evaluates the shortcomings of the current in-
vitro-approaches. Concomitantly, this chapter formulates practical guidelines
to form the basis for the in-vitro left heart model optimization in this PhD
project. These practical guidelines (PG) are centered around three themes. First, designs of more anatomically and physiologically accurate LV models
should be directed towards realizing a thick-walled approach of the left
ventricular wall (PG1), towards including the anisotropic properties of the natural wall (PG2), towards modelling the LV wall contraction by means of
active contractile elements (PG3), towards mimicking multiple global
ventricular wall patterns such as longitudinal, circumferential, as well as radial
deformation (PG4), and importantly, towards including torsional motion (PG5). Second, as current cardiovascular simulators relied upon mechanical,
bioprosthetic or even post-mortem mitral valves to include in their models,
there is a strong need for developing more natural and anatomically correct in-vitro mitral valve models. These designs should include more detailed
anatomical features of the mitral valve apparatus (PG6), such as the flexible
and saddle-like annulus, anterior and posterior leaflets, the chordae tendineae, and the anterolateral papillary and posteromedial papillary muscles. Finally,
in the context of integrating left ventricular and mitral valve models in entire
left heart models, current models show two major limitations at the level of
the valve plane. This valve plane is typically modelled by a rigid approach, whereas a more natural and anatomically correct valve plane would be
obtained by implementing a flexible valve plane (PG7). This should allow the
suspension of a flexible mitral valve plane, while keeping the actuation functionality. Also, due to this rigid valve plane approach, current left heart
models are not able to include the apical-basal movement of the natural valve
plane. Therefore, new designs should search for opportunities to allow the motion of the valve plane by inventing novel ways of ventricle actuation
mechanisms (PG8).
28
CHAPTER 4. DESIGN METHODOLOGY
Chapter 4 discusses the overall design strategy that was used in this
dissertation to produce original ideas in a structured way and to realize these
ideas in an effective manner. The applied design methodology consists of two
paired convergence-divergence phases. The first divergence-convergence
phase starts with a broad and in-depth exploration of the literature which is
subsequently analyzed to define the needs and accommodating practical
guidelines. The implementation of this first phase includes literature reviews
about the anatomy and physiology of the left heart (Chapter 1), the current
state-of-the-art cardiovascular simulators (Chapter 2) and the distillation of
the needs and definition of practical guidelines for optimization (Chapter 3).
The second divergence-convergence phase includes the process whereby first,
several new ideas are generated that meet the established practice guidelines,
and then, the further development via iterative processes of the best concept
ideas into the actual in-vitro models. Chapter 4 provides more details on these
design processes that form the basis of the realized in-vitro models that are
Presented in Chapters 5 to 12. This chapter illustrates that each in vitro model
of this PhD project is not only based on delineated practical guidelines, but is
also the result of a wide range of generated ideas and concepts and the
effectuation of numerous hands-on experiments.
PART II. IN-VITRO MODELLING OF THE LEFT VENTRICULAR MUSCLE
CHAPTER 5. MODELLING THE LEFT VENTRICULAR MUSCLE BY
A THICK WALL
Chapter 5 describes the design and development of a first novel LV model
(LV1) equipped with a thick wall. This is a more realistic representation of the
natural LV wall in comparison with the generally-used thin-walled passive
experimental models, consisting of a silicone membrane in a closed box,
which is squeezed passively by an externally connected piston pump.
Although the pump function of these models has already been well
established, the membrane deformation remains unpredictable and hence
natural wall deformation cannot be simulated. Therefore, this study describes
the design of an experimental hydraulic left ventricular model in which left
ventricular wall deformation can be controlled. This model was built by a
combination of rapid prototyping techniques and tested to demonstrate its wall
deformation and pump function. Experiments in this study show that
circumferential and longitudinal deformation can be attained and that this

29
model can generate fairly physiological values of pressure and flow. This
model meets two specified practical guidelines: it models the ventricular wall
by a thick-wall approach (PG1) and mimics two global wall deformation
patterns, i.e., longitudinal and circumferential deformation (PG4a-b).
CHAPTER 6. MODELLING THE ACTIVE WALL CONTRACTION
AND TORSIONAL MOTION OF THE LEFT VENTRICLE
Chapter 6 describes the design and development of a second novel LV model
(LV2) which integrates active contractile elements into the left ventricular
wall in order to mimic the effect of muscle contraction as well as more nature-
like left ventricular wall deformation patterns, in terms of circumferential,
radial and longitudinal deformation, as well as torsion. In order to reproduce
these basic wall deformation patterns in our actuator device, we designed a
novel kind of artificial LV “muscle” composed of multiple actively
contracting cells. Its contraction is based on a mechanism by which
pressurized air, inside such a cell, causes contraction in one direction and
expansion perpendicular to this direction. The organization and geometry of
the contractile cells within one artificial LV muscle, the applied pressure in
the cells, and the governing LV loading conditions (preload and afterload)
together determine the global deformation of the LV wall. Starting from a
simple plastic bag, an experimental model based on the above-mentioned
principle was built and connected to a lumped hydraulic model of the vascular
system (including compliance and resistance).The wall deformation pattern of
this device was validated visually and its pump performance was studied in
terms of LV volume and pressure and heart rate. Our experimental results
revealed a global LV motion resembling a real LV, and a close correlation
between our model and a real LV in terms of end-systolic volume and
pressure, end-diastolic volume and pressure, stroke volume, ejection fraction
and pressure-volume relationship. Our model appears promising and it can be
considered as a step forward when compared to currently applied actuator
mechanisms, as optimizations of this model will likely result in more
physiological intra-cavity blood flow patterns. This model meets all five
practical guidelines specified to attain more naturally correct LV models: it
models the ventricular wall by a thick-wall approach (PG1), includes
anisotropic wall properties by means of the inflatable cells (PG2), integrates
active contractile wall elements (PG3), and mimics the global wall
deformation patterns, such as longitudinal, circumferential as well as radial
deformation (PG4a-c), and includes torsion (PG5). Moreover, due to its novel
ventricle actuation mechanism, it also allows the downwards motion of the
valve plane (PG8).
30
CHAPTER 7. MODELLING THE TORSIONAL MOTION OF THE
LEFT VENTRICLE BY INTEGRATION OF ANISOTROPIC MATERIAL
PROPERTIES
Chapter 7 describes the design and development of a third novel LV model
(LV3) which is inspired by the twisting motion of the artificial muscle model
LV2 (Chapter 6). This model does not include a thick-wall approach but
adds fibers to the currently commonly used thin-walled LV models in order
to mimic natural torsional motion. The aim of this model is to attain torsion
parameters within a wider physiological range than the Chapter 6 model
which is limited to a maximal value of about 13º, while also mimicking the
circumferential as well as longitudinal deformation components of the
natural LV. The deformation concept is based on the stretching of an
anisotropic membrane, which is realized by embedding fibers into a flexible
matrix, forming a composite structure. For the proof of concept and to obtain
more insights of the torsional behavior in function of the fiber orientation,
three different anisotropic left ventricular models are developed with
different fiber orientation angles (20º, 35º, and 45º). These models are
mounted into a cardiovascular simulator and torsional angles are captured
during the heart cycle. Our experiments show that each model displays
homogenous wall deformation with torsional, circumferential, as well as
longitudinal wall motion. Moreover, the experiments show that the degree of
torsion clearly relates to fiber orientation angle, with higher fiber orientation
angles resulting in higher torsional angles. The physiological torsional angle
of about 17º is generated by the model with a fiber orientation angle of 20º.
This model meets three specified practical guidelines: it includes anisotropic
wall properties (PG2), mimics two global wall deformation patterns, i.e.,
longitudinal and circumferential deformation (PG4a-b), and includes torsion
(PG5). One important limitation of this model is that it is based on a
simplified geometry and not on the natural shape of the LV. A modified
version, applying a more natural geometry, of this third left ventricular
model will be integrated into the left heart model LH2 (Chapter 11).

31
PART III. IN-VITRO MODELLING OF THE MITRAL (AND VENOUS)
VALVE
CHAPTER 8. MODELLING THE MITRAL VALVE USING A FIBER-BASED COMPOSITE MATERIAL
Chapter 3 identified a strong need for developing more natural and
anatomically correct in-vitro mitral valve models that incorporate detailed
features of the mitral valve apparatus (PG6). In this chapter, a novel approach
of modelling mitral valves is proposed that (1) makes use of a fiber-based
composite material with a similar material composition as the LV3 model
(Chapter 7), and (2) provides a valve with a (simplified) natural mitral valve
geometry. This approach enables us to include core anatomical structures of
the mitral valve such as the flexible and saddle-like annulus, the anterior and
posterior leaflets, the chordae tendineae as well as the anterolateral papillary
and posteromedial papillary muscles (PG6). Within the context of this study,
two working prototypes were realized. The first one (MV1) demonstrated the
proof of concept of the production process, whereas the second one (MV2) is
a further optimized version of the valve model in terms of geometry and leaflet
tip fiber. Interestingly, our methodology allows for the integration of these
mitral valve models into the integrative left heart models as described in
Chapter 10, allowing experimental tests of their performance within this left
heart model. This chapter already briefly summarizes these experimental
results to provide a first evaluation of the valves’ functionality. Our tests
showed that while MV2 meets our goal to generate more physiology-like
values of mitral valve performance providing reasonable performance in terms
of effective orifice area (EOA) and transmitral pressure gradients, MV1 is also
interesting as it reflects a model of a stenosed mitral valve, exhibiting high
transmitral pressure differences in early diastole, low EOA, and regurgitation.
Overall, these mitral valve prototypes demonstrate that this new approach can
be used to model normal as well as pathological mitral valves.
CHAPTER 9. INNOVATIVE DESIGN OF A PIV COMPATIBLE
VENOUS VALVE MODEL
There is a growing interest in in-vitro cardiovascular valve modelling to
enable experimental validation of computer models by using Particle Image
Velocimetry (PIV) for simulation of flow fields. Hence, ideally, new designs
of cardiovascular models should meet the stringent requirements to allow PIV
measurements, i.e., to be fully transparent while keeping their functionality

32
(see PG9). In this PhD work, this practical guideline was not realized in the
context of in-vitro left heart modelling, but a PIV compatible prototype of the
venous valve (VV) was developed for optimizing in-vitro modelling research
in the context of hemodialysis-related research. Chapter 9 describes the
innovative design of a PIV compatible venous valve model which has the
ability to function at minimal pressure differences and which is able to
generate valuable PIV data. Our design uses the transparent and pliable
features of polymer film which resulted in an operational valve that is sensitive
for fluid motion and able to function at low pressure differences. As such, this
model meets the proposed practical guideline towards designing a PIV
compatible venous valve model (PG9). Moreover, our preliminary results
show that PIV measurements are not only available for flow patterns adjoining
the valve but also within the valve itself. This opens the intriguing possibility
for experimental assessments and examinations of intra-valvular flow
patterns, making this valve design a promising tool for use in experimental
validation studies of computational models of valve configurations. Future
research should evaluate to what extent these concepts are applicable towards
building an entire, fully transparent, PIV compatible left heart.
PART IV. MODELLING THE LEFT HEART: AN INTEGRATIVE APPROACH
CHAPTER 10. MODELLING THE LEFT HEART BY A MONOLITHIC
APPROACH
Chapter 10 elaborates on the design and development of an innovative
monolithic left heart model (LH1) that incorporates a currently commonly
used thin-walled LV model together with the flexible fiber-based mitral valve
model MV2 (Chapter 8). This chapter also describes the design and
development of tailored suspension and connection systems that enable the
integration and experimental testing of the left heart model into an existing
pulse duplicator system, i.e., the ViVitro mock circulatory loop. Finally,
preliminary but promising results of the left heart model based upon
hydrodynamic and echocardiographic measurements are reported. Results
suggest that this novel approach of left heart modelling more closely
approximates real anatomic features in multiple ways. First, the geometry of
the in-vitro left heart model is based on medical images from a real heart, and
includes the left ventricle, left atrium and the aortic arch, but also more
detailed features, such as the auricle and the entrances of the four pulmonary
veins. Second, the previously described mitral valve apparatus MV2 (Chapter
8) has been integrated into the model, which adds even more anatomical-like

33
structures (PG6a-e). Third, the left heart model is made of silicon and fiber
materials to mimic the mechanical as well as the ultrasonic characteristics of
the biological soft tissue of the heart. Fourth, the innovative production
process enabled the realization of this complex model in one single piece, resulting in a more anatomical-like and compact left heart model. Fifth, the
newly developed suspension system ensures compatibility with a standard
(Type I) cardiovascular simulator, while preserving its flexible appearances and complex anatomical-like shape of the valve plane region (PG7). Finally,
the preliminary benchtop experiments show that the model is able to generate
normal values of left heart performance, the structures are visible using ultrasound, and the model generates physiologically relevant intraventricular
flow patterns that can be observed via color Doppler. These multiple strengths
of our integrative monolithic approach can be considered a significant step
forward in in-vitro modelling of the left heart. Nevertheless, some essential recommendations for in-vitro model optimization are still lacking: the model
does not implement the anisotropic properties of the natural ventricular wall
(PG2); hence control of ventricular wall deformation patterns, such as longitudinal, circumferential, and radial deformation (PG4) or including the
twisting motion (PG5) is not possible.
CHAPTER 11. MODELLING THE LEFT HEART BY A BILITHIC
APPROACH: FEASIBILITY STUDY OF THE EFFECT OF TORSION
ON INTRACARDIAC DIASTOLIC PRESSURE PARAMETERS
Chapter 11 describes the development of an innovative left heart model, which combines the unique kinematic abilities of the anisotropic model LV3
(Chapter 7), with the anatomical-like mitral valve model MV2 (Chapter 8),
and the suspension system of Chapter 10, allowing the connection to a broadly
used standard cardiovascular simulator. Moreover, by modifying the monolithic to a modular bilithic left heart model with a separate and
demountable ventricular component, it was possible to build an innovative,
experimental set-up enabling an experimental feasibility study relating five different wall deformation patterns to diastolic parameters. Two models with
predominantly longitudinal or circumferential deformation, and two models
with different degrees of torsion, were compared to a general model without a global deformation pattern. To this end, five different ventricular models
were built based upon different anisotropic properties, and mounted
successively into our bilithic model. Initial experimental measurements report
how global wall deformations and torsion affect the transmitral (TMPDe) and intraventricular pressure differences during early diastole (IVPDe). Notably,
these results show lower TMPDe and higher IVPDe values in models with
increasing torsional angles. These high effects may be partly allocated to its longitudinal component, but results suggest that the torsional motion has an

34
additional effect on top of the longitudinal deformation component. This
integrative model complies with the greatest number of practical guidelines.
It is able to generate versatile wall deformation patterns by the anisotropic
wall properties (PG2) in terms of torsional motion (PG5) as well as longitudinal and circumferential deformations (PG4a-b). Also, the integrated
mitral valve model includes all basic features of the mitral valve apparatus
MV2 (PG6a-e). Finally, the mitral valve apparatus is integrated into a flexible
valve plane (PG7).
PART V. CONCLUSIONS
CHAPTER 12. CONCLUSIONS AND FUTURE DIRECTIONS
Chapter 12 reviews the key findings and most important conclusions of this PhD project, giving a detailed overview (see Figure 121 and Table 8) to what
extent the developed models meet the practical guidelines of Chapter 3.
Working prototypes of three more realistic LV models, a detailed mitral valve apparatus model, and a PIV compatible venous valve model were realized in
this dissertation project. Moreover, these individual components were
successfully integrated into two integrative left heart models, while
incorporating a flexible valve plane, producing a monolithic version as well as a bilithic version with a separate and demountable ventricular component.
Overall, this set of models can be considered a major step forward towards
attaining more realistic in-vitro modelling of the left heart. Also, these models bear promise to become important tools in expanding knowledge of valve or
wall deformation-related physiological events in in-vitro experimental
studies. Eventually, optimized versions of these models may be used to test
cardiovascular applications in clinical settings. To realize this ultimate goal, three important themes of methodological limitations should be addressed by
future research. First, optimized in-vitro models should account for important
physiological events which are not (sufficiently) met in the proposed models. Second, optimized in-vitro models should aim to attain even more accurate
geometrical approximations of the natural heart. Third, it is acknowledged that
this dissertation primarily demonstrates the proof of concepts which need deeper evaluation and validation by more extensive experiments and
measurements. Finally, three challenges are highlighted to bring left heart
benchtop models to a next level of innovation. This chapter concludes by
formulating four suggestions (left ventricle models LV4 and LV5, and full heart models FH1 and FH2) – developed during the thinking and design
process for this PhD work – that we believe may help to accomplish this three-
fold ambition, i.e., ‘to go for an active wall, to go for an integrative approach
and to go for a transparent model’ in future in-vitro modelling research.

CONTENTS
35
Contents
Dankwoord ........................................................................................................................ 3
Samenvatting ................................................................................................................... 11
Inleiding ...................................................................................................................... 11
Deel I. De linkerharthelft: Van anatomie tot model ........................................................ 12
Deel II. In-vitromodellen van de linker ventriculaire spier ............................................. 15
Deel III. In-vitromodellen van de mitralisklep (en de veneuze klep) ................................ 18
Deel IV. Modellen van de linkerharthelft: Een integratieve benadering .......................... 20
Deel V. Conclusies en perspectieven voor de toekomst ................................................... 22
Summary ......................................................................................................................... 25
Introduction ................................................................................................................. 25
Part I. The left heart: From nature to model .................................................................. 26
Part II. In-vitro modelling of the left ventricular muscle................................................. 28
Part III. In-vitro modelling of the mitral (and venous) valve ........................................... 31
Part IV. Modelling the left heart: An integrative approach............................................. 32
Part V. Conclusions ...................................................................................................... 34
Contents........................................................................................................................... 35
Abbreviations .................................................................................................................. 41
Introduction..................................................................................................................... 43
Context ............................................................................................................................ 43
Research goals ................................................................................................................. 44
Structure of the PhD thesis .............................................................................................. 45

CONTENTS
36
Part I. The left heart: From nature to model .................................................................. 47
Chapter 1 The left heart structure and function ...................................................... 49
1.1 Introduction .................................................................................................. 49
1.2 The left heart ................................................................................................. 50 1.2.1 The circulatory system.............................................................................. 50 1.2.2 The cardiac cycle...................................................................................... 52 1.2.3 Diastolic function ..................................................................................... 55
1.3 The cardiac wall............................................................................................ 60 1.3.1 Macrostructure of the cardiac wall ............................................................ 61 1.3.2 Microstructure of the myocardium ............................................................ 61 1.3.3 From uniaxial cellular motion to 3D wall deformation ............................... 65
1.4 Cardiovascular valves ................................................................................... 71 1.4.1 The valve plane ........................................................................................ 72 1.4.2 The mitral valve ....................................................................................... 72
Chapter 2 In-vitro modelling of the left heart: State-of-the-art .............................. 81
2.1 Introduction .................................................................................................. 81
2.2 Three major developments during history ....................................................... 82 2.2.1 Mimicking the complex anatomy .............................................................. 82 2.2.2 Duplicating physiological events............................................................... 83 2.2.3 Compatibility to measurement techniques ................................................. 84
2.3 Pulse duplicator systems before the 1960s ...................................................... 85 2.3.1 Oxygenated animal hearts ......................................................................... 85 2.3.2 Postmortem human hearts actuated by a piston pump ................................ 86
2.4 Pulse duplicator systems after the 1960s ........................................................ 87 2.4.1 Department of Thoracic Surgery, Uppsala, Sweden (1962) ........................ 87 2.4.2 Engineering Science Group, Oxford (1972) ............................................... 88 2.4.3 Mechanical Engineering Group, Berkeley, California (1977) ..................... 90 2.4.4 Cardiothoracic Surgery Unit, New York (1978) ......................................... 91 2.4.5 ViVitro Labs Inc., Victoria (1979 – present) .............................................. 92 2.4.6 Cardiovascular Fluid Mechanics Lab, Atlanta (1984 - present) ................... 96 2.4.7 Cardiovascular Engineering Group, Aachen (1981 and 1988) .................... 98 2.4.8 Department of Mechanical Engineering, British Colombia (1985) ............ 101 2.4.9 Dynatek Laboratories Inc., Galena, Missouri (1990 – present) ................. 102 2.4.10 University of Sheffield, UK (1991) .................................................... 104 2.4.11 IBiTech-BioMMeda Group of Ghent, Belgium (1992 – present) ......... 106 2.4.12 Cardiovascular Biomechanics Group of Marseille (2000 - present)...... 109 2.4.13 Department of Mechanical Engineering, Blacksburg (2004) ................ 111 2.4.14 Kheradvar Research Group, Pasadena (2006 - present) ....................... 112 2.4.15 Department of Mechanical Engineering, Bari, Italy (2006) ................. 115 2.4.16 Vascular Simulations, Stony Brook, New York (2013 - present) ......... 116 2.4.17 Materialise NV, Leuven (2013 – present) ........................................... 117
2.5 Conclusion .................................................................................................. 119

CONTENTS
37
Chapter 3 Critical evaluation and practical guidelines for optimizing current
models ................................................................................................... 121
3.1 Introduction ................................................................................................ 121
3.2 Limitations and practical guidelines related to left ventricular muscle ................
modelling .................................................................................................... 122 3.2.1 A more realistic thick-wall ...................................................................... 122 3.2.2 Anisotropic wall properties ..................................................................... 123 3.2.3 Modelling active contractile wall elements .............................................. 123 3.2.4 Modelling multiple global wall deformation patterns ............................... 123 3.2.5 Including the twisting motion ................................................................. 124
3.3 Limitations and practical guidelines related to the mitral valve ..................... 125 3.3.1 More anatomic features of the mitral valve .............................................. 125
3.4 Limitations and practical guidelines related to valve plane optimization ....... 126 3.4.1 A flexible mitral valve annulus and valve plane ....................................... 126 3.4.2 Including the apical-basal movement of the valve plane ........................... 127
3.5 Conclusion .................................................................................................. 128
Chapter 4 Design methodology.............................................................................. 133
4.1 Introduction ................................................................................................ 134
4.2 Global design strategy and application ........................................................ 136 4.2.1 Key-Diamond I: Discover and Define ..................................................... 138 4.2.2 Key-Diamond II: Develop and Deliver .................................................... 138
4.3 Conclusion .................................................................................................. 153
Part II. In-vitro modelling of the left ventricular muscle .............................................. 155
Chapter 5 Modelling the left ventricular muscle by a thick wall .......................... 157
5.1 Introduction ................................................................................................ 157
5.2 Physiological background ........................................................................... 158
5.3 Contraction principle .................................................................................. 160
5.4 Design and composition of the model ........................................................... 162 5.4.1 Thick wall .............................................................................................. 162 5.4.2 Valve plane ............................................................................................ 166
5.5 Rapid prototyping materials and methods .................................................... 168
5.6 Experiments and preliminary results ............................................................ 170
5.7 Conclusion .................................................................................................. 174

CONTENTS
38
Chapter 6 Modelling the active wall contraction and torsional motion of the left
ventricle ................................................................................................ 175
6.1 Introduction ................................................................................................ 176
6.2 Physiological background ........................................................................... 176
6.3 Contraction mechanism ............................................................................... 177
6.4 Realization of the artificial LV muscle .......................................................... 180
6.5 Preliminary functional tests ......................................................................... 180
6.6 Conclusion .................................................................................................. 181
Chapter 7 Modelling the torsional motion of the left ventricle by integration of
anisotropic material properties........................................................... 183
7.1 Introduction ................................................................................................ 183
7.2 Background ................................................................................................. 184
7.3 Deformation mechanism .............................................................................. 186
7.4 Design and composition of the model ........................................................... 186
7.5 Materials and methods ................................................................................ 189
7.6 Preliminary experiments and results ............................................................ 190
7.7 Discussion .................................................................................................. 190
7.8 Limitations .................................................................................................. 192
7.9 Conclusion .................................................................................................. 193
Part III. In-vitro modelling of the mitral (and venous) valve ........................................ 197
Chapter 8 Modelling the mitral valve using a fiber-based composite material ..... 199
8.1 Introduction ................................................................................................ 199
8.2 Model design ............................................................................................... 200
8.3 Model composition ...................................................................................... 201
8.4 Materials and methods ................................................................................ 202
8.5 Experiments and results ............................................................................... 204
8.6 Discussion and conclusion ........................................................................... 206
8.7 Limitations and future directions ................................................................. 207

CONTENTS
39
Chapter 9 Innovative design of a PIV compatible venous valve model ............ 209
9.1 Introduction ................................................................................................ 209
9.2 Materials and methods ................................................................................ 210
9.2.1 Practical guidelines for building the venous valve model .............................. 210
9.2.2 Experimental setup ...................................................................................... 212
9.3 Results ........................................................................................................ 212
9.4 Discussion and conclusion ........................................................................... 215
9.5 Limitations and future research ................................................................... 215
Part IV. Modelling the left heart: an integrative approach........................................... 217
Chapter 10 Modelling the left heart by a monolithic approach ......................... 219
10.1 Introduction, design and composition ........................................................... 219
10.2 Realization of the monolithic left heart model ............................................... 222 10.2.1 Preparation of the CAD heart model .................................................. 223 10.2.2 Production of a sacrificial core by rotational molding ......................... 224 10.2.3 Creation of the left heart model and integration of the MV model ....... 227 10.2.4 Model realizations ............................................................................. 228
10.3 Connection with the ViVitro simulator ......................................................... 230 10.3.1 Configuration of the original ViVitro suspension system .................... 231 10.3.2 Design and realization of a new suspension system ............................. 232 10.3.3 Connection to the ViVitro mock circulatory loop ................................ 238
10.4 Experimental test setup ................................................................................ 238
10.5 Preliminary results ...................................................................................... 239
10.6 Discussion and conclusion ........................................................................... 241
10.7 Limitations and further directions ................................................................ 242
Chapter 11 Modelling the left heart by a bilithic approach: Feasibility study of the
effect of torsion on intracardiac diastolic pressure parameters ....... 247
11.1 Introduction ................................................................................................ 247
11.2 Left heart model design ............................................................................... 249
11.3 Left ventricular model design ....................................................................... 250
11.4 Experimental protocol ................................................................................. 254
11.5 Preliminary results ...................................................................................... 258 11.5.1 Transmitral pressure differences during early diastole ......................... 258 11.5.2 Intraventricular pressure differences during early diastole ................... 258
11.6 Discussion of results .................................................................................... 261
11.7 Conclusions ................................................................................................ 263
11.8 Limitations and further directions ................................................................ 264

CONTENTS
40
Part V. Conclusions and future directions .................................................................... 267
Chapter 12 Conclusions and future perspectives ............................................... 269
12.1 General discussion ...................................................................................... 269 12.1.1 Key findings ..................................................................................... 270 12.1.2 Methodological considerations ........................................................... 272 12.1.3 Innovations ....................................................................................... 277
12.2 Future directions ......................................................................................... 279 12.2.1 To go for an active wall ..................................................................... 280 12.2.2 To go for an integrative approach ....................................................... 282 12.2.3 To go for a transparent model ............................................................ 282
References ..................................................................................................................... 285
List of figures ................................................................................................................. 301
List of tables .................................................................................................................. 311

ABBREVIATIONS
41
Abbreviations
ESP End-systolic pressure
ESPVR End-systolic pressure-volume relation
ESV End-systolic volume
FDA Food and Drug Administration
FEM Finite element method
FH1 Full heart model 1
FH2 Full heart model 2
FIH First in humans
HVMB Helical ventricular myocardial band
IDE Investigational Device Exemptions
ISO International Organisation for Standardization
IVPDe Intraventricular pressure difference during early diastole
LA Left atrium
LAP Left atrial pressure
LDA Laser Doppler anemometry
LH1 Left heart model 1
LH2 Left heart model 2
LV Left ventricle
LV1 Left ventricular model 1
LV2 Left ventricular model 2
LV3 Left ventricular model 3
LV4 Left ventricular model 4
LV5 Left ventricular model 4
LVP Left ventricular pressure

ABBREVIATIONS
42
MRI Magnetic resonance imaging
MV Mitral valve
MV1 Mitral valve model 1
MV2 Mitral valve model 2
MVPHT Mitral valve pressure half time
P Phosphate
PG Practical guideline
PIV Particle image velocimetry
PML Posterior mitral leaflets
PMMA Polymethyl methacrylate
PMPM Posteromedial papillary muscles
PV Pulmonary valve
PVA Polyvinyl alcohol
PV-loop Pressure-volume loop
RA Right atrium
RPT Rapid prototyping techniques
RV Right ventricle
SLA Stereolithography apparatus
SLS Selective laser sintering
THV Transcatheter heart valves
TMPDe Transmitral pressure differences during early diastole
TV Tricuspid valve
US Ultrasound
VIA Viscoelastic impedance adapter
VV Venous valve

INTRODUCTION
43
Introduction CONTEXT
Cardiovascular disease is one of the leading causes of death worldwide [1].
To tackle this worldwide problem, substantial research effort is devoted to
continually advance cardiovascular procedures and medical devices. These
cardiovascular devices need to meet extreme functional and quality
requirements and are subjected to a set of extended tests before such
appliances can be implemented in clinical settings. These requirements are
defined by regulatory agencies, such as the Food and Drug Administration
(FDA) and International Organization for Standardization (ISO), in
certificates that are needed before these medical devices can be launched on
the market. Attaining such certificates includes compliance with strict
protocols for performance characteristics, bench testing, virtual testing, in-
vivo tests, and clinical studies. The FDA mentions in a guideline draft
document [Draft Guidance for Industry and Food and Drug Administration
Staff, Investigational Device Exemptions (IDE) for Early Feasibility Medical
Device Clinical Studies, Including Certain First in Human (FIH) Studies,
November 10, 2011][2] that clinically relevant benchtop models, preferably
the best as possible, are urgently needed for in-vitro testing.
Although the pump function of current in-vitro modelling approaches
for the human (left) heart has already been well established, literature shows
that there remain a number of elementary anatomical features and
physiological events that are not included in current in-vitro modelling. For
instance, current cardiovascular simulators do not account for the natural left
ventricular twisting motion and active muscle contraction, nor do these
models include the basic structure of the biological mitral valve apparatus. In
the context of mimicking the anatomical and physiological conditions of the
human heart as accurately as possible, it is clear that there is an urgent need
for novel concepts which include these key features and are capable of
modelling their interrelationships.

INTRODUCTION
44
RESEARCH GOALS
Throughout this dissertation, multiple innovative methods for more advanced
modelling of the left heart’s anatomical features and physiological events will
be developed and subsequently assembled in order to mimic their joint
interaction. This work was guided by three major research goals:
Goal 1: Defining practical guidelines for more realistic in-vitro left heart
modelling in terms of anatomical and physiological likeness
Goal 2: Designing more realistic models of the left ventricle and the mitral
valve apparatus
Goal 3: Integrating these novel components to attain a more nature-like
model of the left heart

INTRODUCTION
45
STRUCTURE OF THE PHD THESIS
This dissertation is divided into five major parts.
Part I gives a background overview and state-of-the-art of current in-
vitro modelling approaches. Chapter 1 reviews the left heart anatomy and
physiology. Subsequently, Chapter 2 gives a literature overview of previous
in-vitro modelling approaches and identifies major challenges in attaining a
more nature-like left heart anatomy and physiology. In Chapter 3, these
challenges are summarized and practical guidelines are formulated towards
the design and development of more nature-like in-vitro left heart models.
Chapter 4 describes the design methodology applied in this dissertation by
which new ideas were generated, selected and further developed into the new
functional prototypes that are presented in Parts II to V.
In Part II, three novel in-vitro left ventricular models are introduced.
The first LV model (LV1) is equipped with a thick wall, which is a more
realistic representation of the LV wall in comparison with the generally used
thin walled membranes (Chapter 5). The second LV model (LV2) includes
active contractile elements which enables mimicking natural torsional motion
of the wall (Chapter 6). A second technique to generate this twisting motion
is by implementing anisotropic wall properties, as demonstrated by the third
LV model (LV3; Chapter 7).
Part III presents two concepts of in-vitro valve modelling. The first
concept is a basic mitral valve model (MV1 and MV2) which includes all
elementary parts of the mitral valve apparatus (Chapter 8). The second
concept, an add-on to the left heart work, is a PIV compatible venous valve
model (VV) for the validation of Computational Fluid Dynamics (CFD)
models (Chapter 9).
Whereas parts II and III focus on the modelling of individual
cardiovascular components, part IV integrates these different components into
a total left heart model. This integrative approach is applied for two model
versions. Chapter 10 deals with the monolithic version (LH1) and focuses on
the design, realization and connection to the pump system, whereas Chapter
11 describes the bilithic version (LH2) and applies this model to relate
different LV deformation patters to diastolic parameters.
Finally, part V summarizes the most important conclusions of this
dissertation with regard to the research goals and outlines future perspectives
and directions for further research.

46

47
PART I. THE LEFT
HEART: FROM NATURE
TO MODEL
Part I
The left heart:
From nature to model

48

49
Chapter 1 The left heart structure and function
The left heart structure and function
Before addressing the research and new concepts of this PhD dissertation
(part II-IV), it is important to provide a general background overview. In this
chapter, key elements of the anatomy and physiology of the left heart will be
discussed.
1.1 INTRODUCTION
The heart is probably the most vital organ of the human body and is a hollow,
four-chambered muscular organ. Its function is to rhythmically pump blood
throughout the body’s blood vessels in order to supply organs and tissues with
oxygen- and nutrient-rich blood, while carrying away carbon dioxide and
waste products from the organs to the lungs. To transport blood throughout
the whole body, the heart muscle has a double pump function: the left side
pumps the oxygenated blood throughout the body whereas the right half of the
heart pushes the oxygen-depleted blood from the heart through the lungs. The
left and right heart pumps work as two independent systems that are
anatomically separated from each other by a thick muscular wall (the septum).
Each of these pumps consists of two chambers, the atrium and the ventricle.
In the atrium, the blood that has returned to the heart is collected and pushed
towards the lower positioned ventricle. The ventricle is the discharging

1. THE LEFT HEART STRUCTURE AND FUNCTION
50
chamber that pumps the blood from the heart. At the bottom of the heart, the
ventricles join in the form of a point, which is called the apex. Since the aim
of this dissertation is to design a true to nature phantom of the left heart, our
discussion in this physiology review is focused on the left side function of the
heart.
1.2 THE LEFT HEART
1.2.1 The circulatory system
As a pulsatile pump, the heart shows two distinct phases: systole (contraction)
and diastole (relaxation). During systole, the heart pumps blood into the
arteries, whereas during the diastole the ventricles are filled with blood.
During this process, the performance of the left ventricle depends on the
ability to cyclically change phase. In diastole, the left ventricle functions as an
elastic chamber to allow the ventricle’s filling at low atrial pressure [3]. In
systole, the left ventricle operates as a contracting and stiffening chamber to
eject blood at arterial pressure. In this manner, the ventricle alternates its
function between diastolic filling and systolic ejection. We consider diastole
to begin with the closing of the aortic valve. This phase successively includes
the pressure drop of the left ventricle, rapid filling, diastasis (a phase that is
only clearly discernable when there is a low heart rate) and atrial contraction
[4]. Subsequently, the ventricular contraction begins, initiating systole.
The composition of the heart is illustrated in Figure 1, while Figure 2
shows the circulation of the blood through the four heart chambers. The
oxygen-depleted blood coming from the organs flows through the venae cavae
and through the right atrium (RA) into the right ventricle (RV). The RV then
pumps this oxygen-depleted blood via the pulmonary artery into the lungs.
Here, the blood takes up fresh oxygen. This oxygen-rich blood flows from the
lungs through the four pulmonary veins (i.e., left and right superior, and left
and right inferior pulmonary veins) via the left atrium (LA) into the left
ventricle (LV). The LV, which is the most powerful chamber, then pumps the
oxygenated blood via the aorta to the entire body, except for the lungs. Thanks
to the four heart valves, the blood flow can only take place in one direction
through the heart, passing successively through the tricuspid valve (TV), the
pulmonary valve (PV), the mitral valve (MV), and the aortic valve (AV).
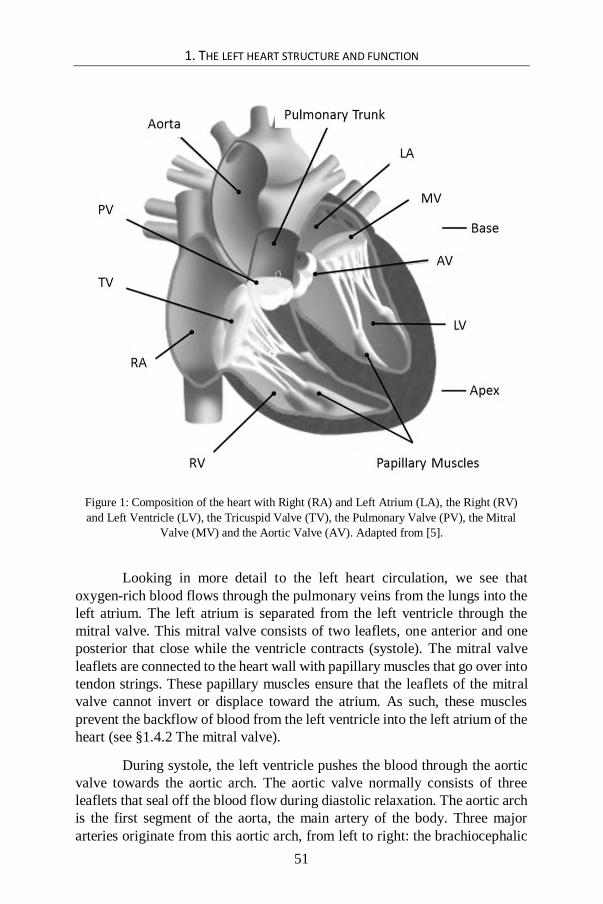
1. THE LEFT HEART STRUCTURE AND FUNCTION
51
Figure 1: Composition of the heart with Right (RA) and Left Atrium (LA), the Right (RV)
and Left Ventricle (LV), the Tricuspid Valve (TV), the Pulmonary Valve (PV), the Mitral
Valve (MV) and the Aortic Valve (AV). Adapted from [5].
Looking in more detail to the left heart circulation, we see that
oxygen-rich blood flows through the pulmonary veins from the lungs into the
left atrium. The left atrium is separated from the left ventricle through the
mitral valve. This mitral valve consists of two leaflets, one anterior and one
posterior that close while the ventricle contracts (systole). The mitral valve
leaflets are connected to the heart wall with papillary muscles that go over into
tendon strings. These papillary muscles ensure that the leaflets of the mitral
valve cannot invert or displace toward the atrium. As such, these muscles
prevent the backflow of blood from the left ventricle into the left atrium of the
heart (see §1.4.2 The mitral valve).
During systole, the left ventricle pushes the blood through the aortic
valve towards the aortic arch. The aortic valve normally consists of three
leaflets that seal off the blood flow during diastolic relaxation. The aortic arch
is the first segment of the aorta, the main artery of the body. Three major
arteries originate from this aortic arch, from left to right: the brachiocephalic

1. THE LEFT HEART STRUCTURE AND FUNCTION
52
artery (supplying blood to the brain and head), the left common carotid artery,
and the left subclavian artery. Once the blood passes the arteries and arterioles,
it leaves the arterial system at the level of the capillaries. Flowing through the
venules and veins, the blood enters the venous system. In contrast to the
arteries that contain no valves, some veins contain valves, the so called venous
valves. These prevent the backflow of venous blood and are key features for
propelling the blood towards the venae cavae and the right heart. After that,
the right heart pumps the blood into the lungs back into the left heart.
Figure 2: The blood flow through the four heart chambers. Adapted from [6].
1.2.2 The cardiac cycle
The cardiac cycle in the left ventricle can be described as a function of
pressure and volume, also known as the Pressure-Volume loop (PV-loop) and
shown in Figure 3. Starting the loop at the end of diastole with a filled LV,
ventricular systole begins with the isovolumic contraction and the closing of
the mitral valve, which is indicated as point A of the PV-loop. Then, during
this isovolumic contraction, the ventricular pressure rises very quickly to point
B of the loop. At this time point, the aortic valve opens and the ejection phase
of the systole starts. The left ventricle volume swiftly decreases until the left
ventricular pressure drops below the aortic pressure, which is shown as point
C. At this time point, the left ventricle has reached its minimal or end-systolic

1. THE LEFT HEART STRUCTURE AND FUNCTION
53
volume (ESV), causing the aortic valve to close. At this point, the isovolumic
relaxation begins. Due to a constant volume, the ventricular pressure speedily
decreases to the point where the pressure in the left ventricle is lower than that
in the LA (point D in Figure 3). At this point, the mitral valve opens, the
ventricle starts filling and quickly reaches its maximum or end-diastolic
volume (EDV), to point A, which corresponds with the starting point of where
the next cardiac cycle begins.
Figure 3: Ventricular pressure-volume relation during a cardiac cycle with ESPVR: end-
systolic pressure-volume relation and EDPVR: end-diastolic pressure-volume relation.
On the one hand, the filling phase proceeds according to the End-
Diastolic Pressure-Volume Relation (EDPVR) which is also known as the
passive filling curve of the left ventricle. The slope of the EDPVR is the
equivalent of passive ventricular stiffness (or the reverse of ventricular
compliance). On the other hand, the maximum pressure which the left
ventricle can supply at a given volume is defined by the End-Systolic
Pressure-Volume Relation (ESPVR) which is a measure of the inotropic state

1. THE LEFT HEART STRUCTURE AND FUNCTION
54
(contractility) of the ventricle. On the basis of this pressure-volume relation,
the cardiac cycle is divided in the two phases of systole (A-B-C) and diastole
(C-D-A).
Figure 4 illustrates the pressures, flow rates, and volumes in the
cardiovascular system during one cardiac cycle. In addition, the above
described points A, B, C, and D are displayed as a function of time.
Figure 4: Changes in pressure, flow, and volume in the left heart during a cardiac cycle. The
points A, B, C and D indicate the start of the following stages: A, isovolumic contraction; B,
ejection; C: isovolumic relaxation; and D, filling. Adapted from [7].
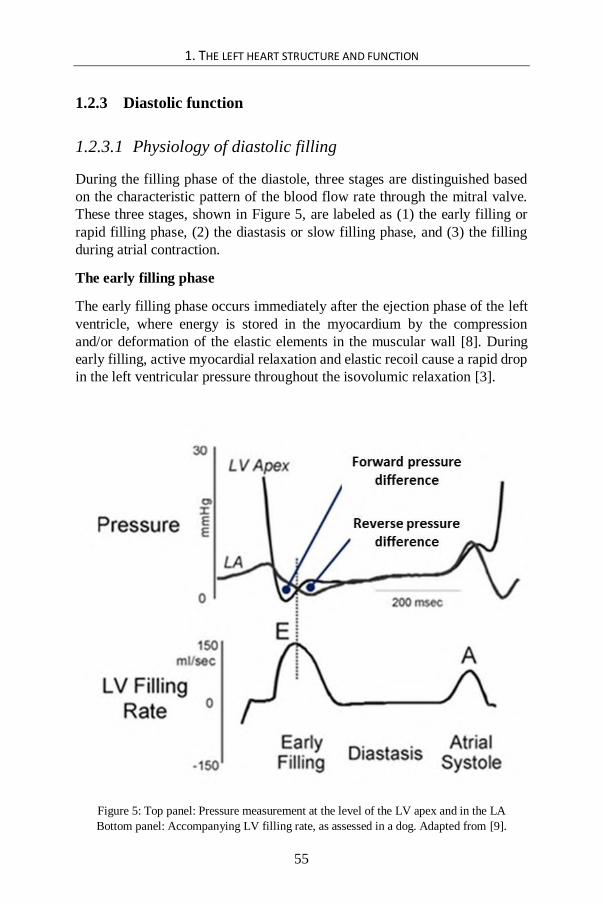
1. THE LEFT HEART STRUCTURE AND FUNCTION
55
1.2.3 Diastolic function
1.2.3.1 Physiology of diastolic filling
During the filling phase of the diastole, three stages are distinguished based
on the characteristic pattern of the blood flow rate through the mitral valve.
These three stages, shown in Figure 5, are labeled as (1) the early filling or
rapid filling phase, (2) the diastasis or slow filling phase, and (3) the filling
during atrial contraction.
The early filling phase
The early filling phase occurs immediately after the ejection phase of the left
ventricle, where energy is stored in the myocardium by the compression
and/or deformation of the elastic elements in the muscular wall [8]. During
early filling, active myocardial relaxation and elastic recoil cause a rapid drop
in the left ventricular pressure throughout the isovolumic relaxation [3].
Figure 5: Top panel: Pressure measurement at the level of the LV apex and in the LA
Bottom panel: Accompanying LV filling rate, as assessed in a dog. Adapted from [9].

1. THE LEFT HEART STRUCTURE AND FUNCTION
56
This decrease in pressure in the left ventricle causes a pressure
difference during early diastole [10] (Figure 5) which begins from the LA and
then spreads towards the LV apex [11]. This pressure difference accelerates
the blood coming from the LA and causes a rapid inflow which is carried on
towards the left ventricular apex and then again upwards, opening the mitral
valve. This diastolic pressure difference draws the blood into the left ventricle
and hence can be regarded as a measure of left ventricular relaxation [3].
The LV pressure drop is so fast that - during the first 40ms after the
opening of the mitral valve - the pressure continues to drop in spite of the rapid
increase of the LV volume [9, 12]. This phenomenon, i.e., the continuing
decline in the LV pressure despite the rapid filling during early diastole, was
already observed by Katz in 1930 [13]. He inferred from this phenomenon that
a ventricle during relaxation has not only the ability to lead blood into the
chamber, but is also effectively pursuing an active suction on the blood. This
is why this stage is also called the ‘active filling’ or ‘active suction’ phase.
The transmitral flow rate of this early diastole filling is determined by
the cross-sectional area of the valve orifice and by the pressure difference
between the LA and the LV apex (shown as the "forward pressure difference"
on Figure 5): the lower the early diastolic pressure is in the LV, the greater the
pressure difference is for the filling. In this way, the LV has the ability to fill
itself without really depending on an increase in the LA pressure. Following
the start of the filling of the LV, the pressure difference between the LA and
the LV apex drops and briefly reverses its direction (shown as the “reverse
pressure difference" on Figure 5).
These findings were also confirmed by Courtois et al. [11] in dogs.
The pressure difference between LA and LV apex (defined as pLA – papex) here
is measured in two portions by measuring an additional pressure between the
LA and the LV apex, namely at the base level. The total pressure difference is
thus composed of the transmitral pressure difference (Equation 1) and the
intraventricular pressure difference (Equation 2). During early diastole
(subscript ‘e’), they observed that the LV pressure rise (or decrease of the
pressure difference) first occurs at the level of the apex, and only later at the
level of the base. From this observation, they concluded that the filling action
near the apex is finished earlier than the filling action near the base. This
makes that the blood at the level of the apex is slowing down sooner than the
blood at the height of the base, causing the blood to first accumulate near the
apex.
TMPDe = pLA – pbase Equation 1
IVPDe = pbase – papex Equation 2

1. THE LEFT HEART STRUCTURE AND FUNCTION
57
Figure 6: Left: Simultaneous intraventricular pressure measurement 2 and 5 cm away from the
apex towards the base, respectively. Right: simultaneously measured transmitral pressures, in
the middle of the atrium and the center of the ventricle, respectively. Adapted from [11].
From the TMPDe measurements they observed that the beginning, the
maximum and the end of the E-wave occur simultaneously with the three
intersections of the atrial (Left Atrial Pressure, LAP) and LV pressure (Left
Ventricular Pressure, LVP), respectively. On the basis of these findings, they
made the association between the forward transmitral pressure difference and
the acceleration of the blood flow, while the opposite transmitral pressure
difference is related to the delay of blood flow, such as illustrated in Figure 6
(right panel). From this study, we can deduce that pressure differences play an
important role in the acceleration/deceleration of the blood flow.
The brief reversal of the transmitral pressure difference (from
“forward pressure difference” to “reverse pressure difference” on Figure 5)
has first been observed by Ling et al. in 1979 and is considered to be
physiologically normal [10]. Due to this reversed pressure difference, the
blood inflow is slowing down, causing the mitral valve to close and the rapid
filling to end. The time which is needed for this blood inflow is strongly
determined by the functional stiffness of the LV wall. This time indication

1. THE LEFT HEART STRUCTURE AND FUNCTION
58
hence is used as a non-invasive measurement of the stiffness of the LV
diastolic function [14-16].
Diastasis or slow filling phase
Diastasis is the time interval between the early filling phase and the atrial
contraction phase. Throughout this phase, the pressures in the LA and the LV
attain an equilibrium so that there is almost no transmitral blood flow. During
diastasis, the mitral valve remains predominantly closed.
Filling during atrial contraction
Whereas the LV produces an under-pressure during early diastole by active
relaxation and recoiling, the LA generates an over-pressure during late
diastole by means of contracting. This atrial contraction causes a second
positive pressure difference between the LA and the LV apex, which - on its
turn - pushes the blood towards the LV [3, 11]. After this atrial contraction,
the LA relaxes, the atrial pressure drops below the LV pressure and the mitral
valve begins to close. The subsequent onset of the LV systole generates a
sudden increase in pressure in the LV, so that the mitral valve closes
completely. This point in time denotes the end of the diastole.
1.2.3.2 Determinants of diastolic function
The three major determinants of diastolic function are preload, isovolumic
relaxation, and passive ventricular properties [17].
Preload
The blood flow from the LA to the LV strongly depends on the pressure
difference across the mitral valve (and on the resistance the mitral valve is
exerting to the blood flow). Therefore, the pressure in the LA (the filling
pressure or “preload”) plays an important role in diastolic function. This LA
pressure varies according to the functions the LA is fulfilling throughout one
heart cycle. During ventricular systole, the LA operates as a reservoir, while
during diastase, the LA functions as a conduit. Finally, during diastole, the LA
works as a pump. The resistance of a healthy mitral valve is minimal because
the valve leaflets offer very little resistance to the flow and open wide. This
resistance is largely determined by the geometry of the valve relative to the
geometry of the LA and LV [18].

1. THE LEFT HEART STRUCTURE AND FUNCTION
59
Isovolumic relaxation
The rate of pressure decline in the LV is also determined by the rate of
relaxation of the muscle fibers (this is termed lusitropy). At the molecular
level, the cyclic phase changes between contraction and relaxation are the
result of interactions between myofilaments. Relaxation is the process of the
myocardium returning to its strainless/strain-free and slackened state. This
relaxation is directly dependent on calcium transport and is regulated largely
by the sarcoplasmic reticulum of the cardiomyocytes, which are responsible
for rapidly re-sequestering calcium following contraction. This myocardial
relaxation results in an exponential pressure drop from the end- systolic
pressure to the minimum LV pressure. Elastic recoil is regarded to promote
this myocardial relaxation [19-21].
Under normal conditions, ventricular relaxation starts already in the
second half of the systole, and is completed at the minimal LV pressure during
the early filling. Relaxation depends on load: an increased load slows the
myocardial relaxation [22]. In addition, relaxation is also conditional upon
heart rate, body temperature, and neuro-hormonal stimulation [23]. The onset,
velocity and intensity of this myocardial relaxation are important determinants
of diastolic filling.
Passive Ventricular Properties
Finally, an optimal diastolic filling is importantly determined by the passive
characteristics of the chambers. These passive structural features comprise
elasticity (change of the muscle cell length at a given change in strain) and
compliance (change in volume at a given change in pressure) [23]. These
passive characteristics are quantified and graphically illustrated by the passive
pressure-volume relation (EDPVR such as illustrated in Figure 3) and are
particularly important immediately after the early filling phase. At this point
in the cardiac cycle, it is assumed that the pressure within the LV is the result
of the balance between the pressure forces within the LV cavity on the one
hand, and the resistive forces due to the elasticity of the myocardium on the
other hand [7].
During systole, potential energy is stored within the myocardium in
the form of elastic energy (analogous to compressing a coil spring) which is
returned during the early diastolic filling phase (analogous to releasing a coil
spring). This energy storage and release assists adequate ventricular filling,
even at low filling pressures [24]. This phenomenon is also known in the
literature as 'elastic recoil’ [19-21].

1. THE LEFT HEART STRUCTURE AND FUNCTION
60
Figure 7: The cardiac wall comprises 1) the endocardium, 2) the myocardium, 3) the
epicardium, and 4) the pericardium. Adapted from [25, 26].
Figure 8: Macrostructure of the cardiac wall. Adapted from [27].
1.3 THE CARDIAC WALL
The pumping function of the heart is realized by the rhythmic contraction and
relaxation of cardiac muscle cells (cardiomyocytes) under the stimulation of
electrical currents. These cardiomyocytes, embedded in an extracellular
matrix (ECM), compose the myocardium of the cardiac wall.
1. THE LEFT HEART STRUCTURE AND FUNCTION
61
1.3.1 Macrostructure of the cardiac wall
As described above, the pressure development and ejection of blood are the
results of the tension generated by the heart muscle tissue. This dynamic
tension is realized by the rhythmic contraction and relaxation of the
myocardium. The cardiac wall consists of four functional layers: the
endocardium, the myocardium, the epicardium, and the pericardium (Figure
7). The endocardium is the inner layer of the heart that covers the inner
surfaces of the ventricles, atria, and cardiac valves, and is composed of
endothelial cells. The epicardium and pericardium are the two outer layers of
the heart, forming together a fibrous protective sac. The epicardium (or
visceral pericardium) is the elastic layer covering the outer surface of the heart
whereas the pericardium (or parietal pericardium), mainly consisting of
connective tissue, is the outer layer that holds the heart firmly in place. A thin
film of lubricating fluid separates the epicardium from the pericardium and
allows the heart to move easily in the fibrous sac. The fibrous pericardium not
only holds the heart in place, it also protects the heart and anchors it to the
surrounding structures.
The myocardium is the actual muscle tissue, lying between the
endocardium and epicardium (Figure 8). This layer is composed of muscle
fibers, collagen fibers, and elastin fibers. The muscular component is
important for the active properties of the heart, whereas the collagen and
elastin components are essential for the passive elastic properties of the heart.
The muscle layer of the heart is thickest in the left ventricle (10 mm during
diastole), while it is only 3 to 4 mm thick (during diastole) for the right
ventricle. This difference is related to the fact that the pressure development
in the left ventricle is much larger (120 mmHg) than in the right ventricle (20
mmHg) due to the much higher hydraulic resistance of the systemic
circulation in comparison with the pulmonary circulation.
1.3.2 Microstructure of the myocardium
1.3.2.1 Microscopic structure of cardiomyocytes
Cardiomyocytes are specialized cardiac muscle cells with an elongated,
branched, and cylindrical shape, a diameter of about 12-20 μm and a length of
about 50-100 μm [28]. These specialized cells are joined end-to-end by
intercalated disks, which contain gap junctions. These junctions support the

1. THE LEFT HEART STRUCTURE AND FUNCTION
62
electrical continuity between cells, so that nervous pulses can easily spread to
all the cardiac muscle cells.
Cardiomyocytes show striations similar to those on skeletal muscle
cells, but unlike multinucleated skeletal cells, they have only one, unique
nucleus (see Figure 9). Their contraction proceeds in a synchronized,
rhythmic, powerful and autonomous manner.
Examining the microscopic structure of a cardiomyocyte, one can
distinguish the nucleus in the center of the cell from the striation. This
striation, comprising darker A-bands and lighter I-bands, is mainly formed by
alternating segments of the protein filaments myosin and actin. Myosin
filaments are thicker than actin filaments, and this causes the darker
appearance of A-bands (largely composed by myosin) and the lighter
appearing I-bands (mainly containing actin) (Figure 10). Just like skeletal
muscle, the cardiac muscle cell is made up of myofibrils (Figure 10),
comprising myofilaments. These myofilaments comprise a series of structured
contractile elements, the sarcomeres. The sarcomere is the fundamental
contractile unit of striated cardiac muscle and is defined as the area of the
myofilament between two Z-lines that bisect the I bands. In the human heart,
the length of one sarcomere varies between 1.6 to 2.2 μm (in resting state).
The molecular structure of the sarcomere can be further
investigated with an electron microscope. Just as in skeletal muscle, the
primary structural proteins of cardiac muscle are actin and myosin. The
thinner actin filaments can be easily distinguished with the electron
microscope from the thicker myosin filaments. In one sarcomere, zones with
myosin correspond to the A-band. I-bands, on the other hand, comprise the
thin filaments that run from the Z-lines towards the center of the sarcomere
(M-line). These zones are mainly made of actin and the troponin-tropomyosin
complex.
The biochemical and physical interactions between the thinner
actin and thicker myosin filaments cause a shortening of the length of the
sarcomere, so that active tension development and shortening of the
cardiomyocytes can occur. This proceeds according to “the sliding filaments
principle” [29]. This principle is the "engine" of the contraction of the heart
muscle cell, and will be further explained in detail in the next section. To
understand its working mechanism, we first need to consider the chemical
structure of these filaments.

1. THE LEFT HEART STRUCTURE AND FUNCTION
63
Figure 9: Microscopic structure of cardiomyocytes: mononuclear, striated muscle cells.
Adapted from [26].
Figure 10: Myofibrils of the cardiomyocyte. Adapted from [30].

1. THE LEFT HEART STRUCTURE AND FUNCTION
64
Figure 11: Myosin filaments are composed of myosin proteins; each protein has two heads
that are connected via the neck to the tail portion. Actin filaments comprise three different
types of protein: actin, tropomyosin, and troponin. Adapted from [31].
Myosin filaments (see Figure 11) are composed out of more than
300 myosin proteins, each having a molecular weight of about 470.000
Daltons. Each myosin protein contains two heads that are connected via the
neck to the tail portion. Actin filaments, on the other hand, consist of three
different types of proteins: actin, tropomyosin and troponin. Actin consists of
globular proteins, labeled G-actin, which are spirally wound to form
filamentous fibers, labeled as F-actin. These fibers are surrounded by
tropomyosin. On tropomyosin, the troponin units are located. In addition, the
cardiac muscle cell also comprises other structures, such as mitochondria (for
the energy supply), and blind-ending pouches, T-tubules (for the calcium
supply). The latter are part of the cell membrane.
1.3.2.2 Contraction and relaxation of cardiomyocytes
To perform their pumping function, the cardiomyocytes must be able to
shorten but also to lengthen their fibers. The shortening of the myofilaments
corresponds to the development of active tension (contraction principle)
whereas the lengthening of the fibers corresponds to the relaxation of the
cardiomyocytes (relaxation principle).
Active tension development – contraction principle
When an action potential arrives at the cardiomyocyte, the polarity of the cell
membrane changes. Hence, also the polarities of the T-tubules change,
causing the T-tubule to release calcium ions. These Ca2+ ions bind with the
troponin units (Troponin C). As a result, the troponin units drop down between
the filamentous fibers of the F-actin, which releases the G-actin units of the
actin filaments. Then, the G-actin makes direct contact with the myosin heads
(Figure 12 step 1). ATP (adenosine triphosphate) provides the energy for

1. THE LEFT HEART STRUCTURE AND FUNCTION
65
cross-bridge cycling and is during the process converted to ADP (adenosine
diphosphate) and P (phosphate).
This released energy is used for the conformational change of the
myosin protein, more particularly for bending the neck portion of the myosin
molecule (Figure 12, step 2 and 3). This bending process generates power
which is then transferred, due to the very close contact between the myosin
heads and the actin filaments. In this manner, the myosin filaments move
(slide) relative to the actin filaments, causing the sarcomere of the
cardiomyocyte to shorten, i.e., to contract. The point in time when myosin and
actin interconnect, is also known as the formation of ‘cross-bridges’.
Relaxation principle
During the relaxation of the heart muscle cell, the actin-myosin bond is broken
down (Figure 12, step 4) and the calcium-ions are pumped back into the T-
tubules, waiting for the next action potential to arrive. This cross-bridge
cycling occurs in all involved cardiomyocytes and repeats itself as long as
power is required. This phenomenon is hence also referred to as ‘cross-bridge
cycling’ or ‘sliding filament theory’. The whole process by which
depolarization at the cell surface initiates interaction between actin and
myosin so that cardiomyocytes can produce tension and shorten, is also
referred to as excitation-contraction coupling.
1.3.3 From uniaxial cellular motion to 3D wall deformation
1.3.3.1 Myocardial macrostructure
The myocardium comprises a heterogeneous complex network of myocardial
fibers that are chemically, mechanically, and electrically connected to one
another. One of the most intriguing issues in cardiac physiology is to
understand how the above described uni-axial force generation at the
microscopic level of the cardiomyocytes is transferred to the three-
dimensional wall deformation at the macroscopic level of the ventricles during
systole and diastole. Notwithstanding more than five decades of research, the
relationship between cardiomyocyte mechanics and ventricular mechanics
still remains a much debated subject. Below, we give a brief overview of four
different prominent visions (Figure 13) on the three-dimensional nature of
myocardial macrostructure in relation to the myocardial microstructure and
fiber organization. A more in-depth state-of-the-art of different concepts and
their link to 3D wall motion has been described by Buckberg et al. [32].

1. THE LEFT HEART STRUCTURE AND FUNCTION
66
Figure 12: The organization of actin and myosin filaments is represented by formation of
cross-bridges in a myocyte. Adapted from [26, 33].
The first view, expressed by Robb at al. [34], is built on the
presumption that the heart contains a slanted clockwise as well as a slanted
counterclockwise muscle architecture that sandwiches a circular transverse layer of muscle at the top level of the LV. The second model, presented by
Rushmer et al. [35], describes the LV muscle as consisting of three
distinguishable layers of fibers. Their conceptual model shows how the spiral
muscle layer at the surface and the deep layer are sandwiching the middle layer and this with a transverse fiber orientation. According to Streeter et al.
[36], the third conceptual model, the myocardial wall is an interweaving,
continuous network in which the myocyte alignment varies across the wall according to a 60-degree helix, hence forming a doughnut-like (toroidal
surfaces) structure. The fourth view was proposed by Torrent-Guasp et al. [37-
40] and is based on the so-called Helical Ventricular Myocardial Band
(HVMB) which is a continuous muscle band for both the RV and LV. This

1. THE LEFT HEART STRUCTURE AND FUNCTION
67
band can be unfolded by punctilious dissection and consists of two loops, four
segments and a central fold which twists the band by 180°. As shown in Figure
14 in more detail, the band starts from the pulmonary artery root and runs via
the right and left segments of the basal loop to the oblique fold (at the center) and continues via the descending and ascending segments of the apical loop
up to the aortic root. Hereby, the rising segment corresponds to the free wall
of the right ventricle, while the left segment represents the free wall of the left
ventricle.
Although the concept of Torrent-Guasp’s model of the incessant
helical band of myocardial fibers has been subjected to doubt [41], the
existence of this helical band and its function during the heart cycle has recently been demonstrated by cine-MRI diffusion tensor imaging [42].
Moreover, this theory gives more insights in the mechanisms behind the
overall force transmission pathways in the myocardial wall than the others
[32].
1.3.3.2 LV wall deformation patterns
As a result of the above described fiber architecture and of the timing and
sequence of electrical excitation, the LV deforms as follows. During the LV contraction, (a) the diameter of the LV decreases while (b) the ventricular base
is moved in an apical direction (c) in a rotating manner [43]. These global LV
wall deformation patterns can be basically described in terms of (a) circumferential, (b) radial and (c) longitudinal deformation, as well as (d)
torsion (Figure 15). Due to these patterns and the accompanying “wringing”
effect, there is a simultaneous reduction of the cross- sectional area of the ventricular cavity and pressure is efficiently exerted on the blood enclosed
within the chamber, thereby directing it upwards to the aortic outflow tract.
During the LV relaxation, these actions are supposed to allow the filling of the
ventricle.
The downward motion of the valve plane during the systolic phase fulfills a double pump function. First, it results in a diminished enclosed
volume of the LV chamber and second, it enlarges the volume of the atrium
[28].
Left ventricular torsion is calculated as the difference between rotation at the apical (rotationapical) and basal level (rotationbasal) and its typical
variation during one heart cycle is depicted in Figure 16. LV torsion values of
healthy subjects are reported in various studies, and some values are listed in
Table 1. According to the Torrent-Guasp’s model, it has been suggested that the opposing systolic twisting between base and apex is due to the specific
double-helix architecture of the muscle fibers and that the zone where no
rotation is observed (neutral plane) corresponds with the junction of the
double-helix (see Figure 13 4a) [44].

1. THE LEFT HEART STRUCTURE AND FUNCTION
68
Figure 13: Four concepts of myocardial fiber orientation are given: (1) by Robb et al. [34]
with a superficial (1a) and deep bulbospiral (1b), by Rushmer et al. [35] with spiral muscles
including opposite fiber orientation, (3) by to Streeter et al. [36] with helical fibers which
forming doughnut-like surfaces and (4) by Torrent-Guasp et al. [37-40] including a
continuous ventricular myocardial band, with (4a) a schematic version of the double-helix,
(4c) the unwrapped version of (4b). Ao, Aorta and Pa, Pulmonary artery. Adapted from [32].

1. THE LEFT HEART STRUCTURE AND FUNCTION
69
Figure 14: A step-by-step procedure to unscroll a heart by dissection according to the Torrent-
Guasp’s myocardial band model. Starting from the intact heart (1), the Right Segment (RS) is
first unwrapped (2), then the Left Segment (LS) (3) and subsequently, the Ascending Segment
(AS). At the end, by unfolding the Descending Segment (DS) (4), the complete helical
structure is outspreaded and forms a continuous myocardial band. Note the twisting nature of
the oblique fold at the center of the junction of the basal as apical loops. Adapted from [32].

1. THE LEFT HEART STRUCTURE AND FUNCTION
70
Figure 15: Global wall deformation patterns during systole and diastole. Adapted from
[45-47].
Table 1: Values of LV torsion in healthy humans [44, 48-50].
LV torsion (°) Age (years)
(SD) (SD)
Maharaj et al. 127 8.87 ± 2.21 39.7 ± 12.1
Carreras et al. 18 10.48 ± 1.63 30.7 ± 7.5
Helle-Valle et al. 29 16.4 ± 5.5 33 ± 6
Kocabay et al. 194 20.0 ± 7.3 44 ± 16
nResearchers

1. THE LEFT HEART STRUCTURE AND FUNCTION
71
Figure 16: The LV torsion during one heart beat in a normal healthy subject is illustrated.
LVtorsion (orange curve) is defined as rotationapex (yellow curve) minus rotationbase (black
curve). During the isovolumic contraction phase (1), the apex generates a small clockwise
twist and the base a small counterclockwise twist. During ejection phase (2), the twisting
directions alter and the LV torsion values are significantly higher. During the isovolumic
relaxation phase (3) and the early diastolic filling phase (4), the twisting direction is changed
again and torsional recoil takes place. Adapted from [43].
1.4 CARDIOVASCULAR VALVES
The heart is equipped with four valves (see Figure 1) that ensure the right
direction of the blood flow. Two of these valves, the right and left
atrioventricular valves, are located in the valve plane which is between the
atria and the ventricles. These valves allow the blood to flow from the atria
into the ventricles when the atrial pressure is higher than the ventricular
pressure (ventricular filling). Another function of these valves is to prevent
the backflow to the atrium during ventricular contraction, when the pressure
of the ventricle is much higher than the pressure in the atrium. The right
atrioventricular valve is also called the tricuspid valve (as it consists of three
semi-lunar cusps or leaflets) and the left atrioventricular valve is also called
the bicuspid valve (as it consists of two semi-lunar cusps or leaflets) or the
mitral valve. These two valves are both supported by fibrous tissue cords, the
chordae tendineae, which connect each of the leaflets to papillary muscles

1. THE LEFT HEART STRUCTURE AND FUNCTION
72
projecting from the ventricular wall. During diastole, the papillary muscles
relax and provide little tension on the chordae tendineae, fostering ventricular
filing. During systole, the papillary muscles contract along with the ventricle.
This creates tension on the chordae tendineae, helping to hold the leaflets of
the atrioventricular valves in place and prohibiting the prolapse of the valve
leaflets toward the atrium. The third valve, the aortic valve, is located between
the left ventricle and the aorta whereas the fourth valve, the pulmonary valve,
is located between the right ventricle and the pulmonary artery. These two
latter valves are known as the semilunar valves of the heart. Both the aortic
and the pulmonary valve have three cusps or leaflets which are not attached
to any other structure. Both the aortic valve and pulmonary valve operate in a
similar way. Both valves open in ventricular systole, when the pressure in the
LV or RV rises above the pressure in the aorta or pulmonary artery,
respectively. When the ventricle relaxes, blood flows back into the ventricle
from the aorta or pulmonary artery and this flow of blood fills the pocket-like
valves. This blood flow presses against the leaflets which close to seal the
valves. In addition to the four heart valves, there are also valves located in the
veins, the so-called venous valves. These promote the blood flow back to the
heart. In this dissertation, we have primarily focused on the mimicking of the
mitral valve. Hence, here we focus more in-depth on mitral valve anatomy.
1.4.1 The valve plane
The four cardiac valves are attached to their valve rings or annuli and are
located at the base of the heart. These fibrous rings join to form the fibrous
frame or the valve plane of the heart (see Figure 17) [51]. The aortic valve
forms the center of the cardiac valve plane, and its fibrous extensions are in
contact with each of the other three valves, anchoring and supporting them.
The cardiac valve plane not only contains the four valve annuli but also the
membranous septum and four fibrous trigones of the respective valves [51].
1.4.2 The mitral valve
The mitral valve is located between the left atrium and the LV, in the left
atrioventricular groove [52]. The mitral valve apparatus is a very complex
three-dimensional assembly of separate anatomic components and comprises
the mitral valve annulus, the leaflets and commissures, the chordae tendineae,
the papillary muscles, and the left ventricle [53]. This system allows the
unidirectional flow of oxygenated blood from the left atrium into the relaxed
LV during diastole. Accurate mitral valve function is a complex process that
requires the proper interaction of all components, as well as adequate left atrial
and left ventricular function [51]. A coordinated interaction of these anatomic
components closes the valve against ventricular pressure during systolic

1. THE LEFT HEART STRUCTURE AND FUNCTION
73
contraction, and widely opens the valve during diastolic relaxation. In what
follows, we describe the multiple anatomic components in more detail. The
functional opening or orifice of the mitral valve is defined by its narrowest
diastolic cross-sectional area, called the effective orifice area (EOA). Three-
dimensional imaging of the atrial (surgical view) and ventricular
(interventional cardiologist fluoroscopic view) surfaces of the mitral valve is
now possible with echocardiography [51]. Typical normal values of EOA are
about 3 cm² [54]. Another parameter to assess mitral valve performance in this
dissertation is the transmitral pressure difference during early diastole
(TMPDe). Normal values for this parameter are a few mmHg for normal, and
10-30 mmHg for severe mitral stenosis [55].
Figure 17: This diagram shows the fibrous cardiac skeleton or valve plane with the four annuli
of the cardiac valves. The aortic annulus at the center is the keystone and its fibrous
extensions support the other three annuli. Adapted from [51].

1. THE LEFT HEART STRUCTURE AND FUNCTION
74
1.4.2.1 The mitral annulus
The mitral annulus is a fibromuscular structure located in the left
atrioventricular groove ring which is firmly anchored along the circumference
of the anterior leaflet by the tough fibrous skeleton of the heart [56] (see Figure
17). It operates as a suspension and hinge point for the mitral valve leaflets
[52]. The mitral annulus is subjectively separated into anterior and posterior
segments based on the attachments of the anterior and posterior mitral leaflets
[52]. The anterior portion of the mitral annulus is intertwined with the fibrous
skeleton of the heart, identified by the right and left fibrous trigones and the
aortic mitral curtain [52]. The normal mitral annulus is kidney bean formed
and has a three-dimensional saddle shape. The overall circumference of the
annulus may decrease by as much as 20% during systole, aiding leaflet
coaptation [57].
1.4.2.2 Mitral leaflets and commissures
Unlike the other cardiac valves, the mitral valve comprises only two leaflets,
an anterior and posterior leaflet with similar surface areas but distinctly
different shapes [58]. The anterior leaflet is longer than the posterior leaflet
but with a shorter base, attaching to one-third of the annular circumference
between the right and left fibrous trigones (see Figure 17) [52]. The posterior
leaflet is wider based and extends along the remaining two-thirds of the
annulus with a height which is half the height of the anterior leaflet [56].
Despite their differences in shape, the overall surface areas of the two
leaflets are similar. The different positioning of the two leaflets guarantees
that - during systole - the closure line of the mitral valve will be situated in the
posterior one-third of the valve orifice, which prevents motion of the anterior
leaflet tip into the outflow track during systole [59]. Both leaflets present two
zone regions from their base to the free boundary: the clear zone (smooth and
semitransparent) and the rough zone (thicker and bumpy due to the attachment
of numerous chordae tendineae) [52]. The major chordae supporting a leaflet
are inserted into its free edge and rough zone (see Figure 19). During systole,
the coaptation regions of the respective leaflets merge to form an overall seal
from a few millimeters to a centimeter, ensuring mitral valve closure (see
Figure 18 and Figure 20) [52]. Collagen fibers are of key importance for the
strength of the leaflets and are generally oriented in parallel with respect to
the annulus and become radial close to commissures [60] (see Figure 21).

1. THE LEFT HEART STRUCTURE AND FUNCTION
75
Figure 18: As shown in the drawing (left) and the real heart (right), the mitral valve (MV)
apparatus is composed of five elementary components, the mitral annulus, mitral leaflets,
chordae tendineae, papillary muscles, and the left ventricle (LV). During systole, the mitral
apparatus brings the two leaflets together and establishes the coaptation zone (CZ). Adapted
from [51, 61].
Figure 19: Both mitral valve leaflets have a clear zone (CZ) and a rough zone (RZ) and are
separated by a closing edge (dotted line). Note the fanlike array of the commissural chordae
tendineae (*). Adapted from [51].

1. THE LEFT HEART STRUCTURE AND FUNCTION
76
Figure 20: Schematic diagram of the section across the dotted lines clarifies the association
between the annulus, the closing edge (CE), the free edge and the left ventricle (LV) and
atrium (LA). Also the clear zone (CZ) and the rough zone (RZ) are shown. Modified from
[51].
Figure 21: Fiber orientation of the mitral valve. Adapted from [60].

1. THE LEFT HEART STRUCTURE AND FUNCTION
77
Figure 22: This picture shows an isolated and unfolded mitral valve including the anterolateral
(ALPM) and posteromedial papillary muscles (PMPM) with the chordae tendineae and
leaflets. Note the commissures (C) of the posterior (P) and anterior leaflets (A). Adapted from
[51].
The commissures are splits in the leaflet structure that signify the sites
of the leaflet parting (see Figure 22). Beneath the two mitral commissures lie
the two underlying papillary muscles, which protrude from the left ventricular
free wall (see Figure 18 and Figure 22) [51]. Commissural chords begin from
each papillary muscle and extend in a fanlike array to interleave into the free
edge of both anterior and posterior leaflets [56] (see Figure 19). In contrast to
inherited clefts, a true commissure is always connected with an underlying
papillary muscle and a dominant array of chordae tendineae [56].
The leaflets of the mitral valve can be divided into individual borders
or scallops based upon the location of the clefts in the posterior leaflet. The
central scallop of the posterior leaflet is defined as P2, and the neighboring
lateral and medial scallops are defined as P1 and P3, respectively (see Figure
23) [52]. Natural clefts are not typically observed in the anterior leaflet, in this
case, the segments are defined according to the opposite segments of the
posterior leaflet as A1, A2, and A3 [62].

1. THE LEFT HEART STRUCTURE AND FUNCTION
78
Figure 23: Anatomical section shows the valve plane with the cardiac valves in systole and a
detailed composition of mitral valve. The anterior (A) and posterior leaflets (P) are both
subdivided into three segments (1 -3) and separated from one another by the anterior (AC)
and the posterior commissures (PC). Adapted from [51, 61].
1.4.2.3 Chordae tendineae
The main function of the chordae tendineae, forming a suspension system, is
to prevent a displacement of the leaflets above the annular plane, hence
avoiding the leaflets to prolapse during systole, as well as to allow a full
opening of the leaflets during diastole [51]. Chordae tendineae are categorized
according to their connection between the free margin and the base of the
leaflets [63]. As such, primary, or marginal, chordae attach along the margin
of the leaflets and are crucial to avoid leaflet prolapse and to bring the rough
zone of the anterior leaflet into line with the posterior leaflet during systole.
Typically, primary chordae implant every 3 to 5 mm along the border of both
leaflets [52]. Secondary, or body chordae, connect to the ventricular side of
the corpse of the leaflets and establish ventricular annular continuity as well
as control of leaflet tension during systole [52]. Tertiary, or basal chordae,
attach to the foot of the leaflet hinge and serve as additional connection to the
ventricle [64]. Since the chords are responsible for these different functions,
rupture of a chord may thus have very different consequences depending upon
the type of chord which is involved.

1. THE LEFT HEART STRUCTURE AND FUNCTION
79
1.4.2.4 Papillary muscles and the left ventricle
Via the chordae tendineae, the entire mitral apparatus is supported by the
papillary muscles, which are part of the LV muscle. The papillary muscles
differ in the number of heads and precise position in the ventricle, but are
generally categorized into two main groups comprising the anterolateral
(ALPM) and posteromedial papillary muscles (PMPM) (see Figure 22). Each
papillary muscle is identified according to its association with the valve
commissures and is equipped with a fan chord to its related commissure as
well as to both anterior and posterior leaflets [52]. The anterolateral papillary
muscle is generally single whereas the posteromedial papillary muscle
normally has multiple heads [65].

80

81
Chapter 2 In-vitro modelling of the left heart: State-of-
the-art
In-vitro modelling of the left heart: State-of-the-art
This chapter overviews current in-vitro left heart approaches and identifies the
major challenges in approximating normal left heart anatomy and physiology,
as described in Chapter 1. In Chapter 3, these challenges are summarized and
practical guidelines are formulated towards in-vitro model optimization.
2.1 INTRODUCTION
In-vitro simulation of the human cardiovascular system for hydrodynamic
testing of cardiac devices began about 55 years ago, when left heart in-vitro
models were first used for testing valve prostheses [66]. Since then, bench
models are continuously challenged in order to more accurately mimic the
complex anatomical and physiological conditions.
In this chapter, we first start with a general description of the history
of heart model development highlighting the major developments during the
past decades. Subsequently, we examine this history in more detail by
providing a state-of-the-art overview of left heart simulators and distinguish
model before and after the 1960s.

2. IN-VITRO MODELLING OF THE LEFT HEART: STATE-OF-THE-ART
82
There are plenty in-vitro approaches currently available. For our state-
of-the-art overview, we aimed to (1) highlight the evolution of continuous
improvement during the history of in-vitro modelling, and (2) to illustrate the
variety between the different approaches. As a result, only a selected set of
models are included. Although it is our intention to give a review as
completely as possible, the probability remains that some groups with mock
loop systems were not included in this review chapter.
In this overview, the heart models are chronologically ordered and
grouped according to the research institute of origin. The first cardiovascular
simulators which are being described in this chapter are based on beating
animal hearts. Then, the postmortem human hearts are explained which are
actuated by a piston pump. After that, a wide range of in-vitro heart models
are illustrated which are exclusively made of non-biological materials like
rigid and flexible polymers. By this, we illuminate a number of model
evolutions concerning geometrical complexity to obtain anatomical likeness,
actuation and regulation to mimic physiological events and modifications to
enable different validation techniques. Finally, recent innovations are
discussed such as multi-material 3D printing to attain anatomical accurate
geometries derived from medical images.
This review aims to primarily present and describe the models, only
briefly discussing their possibilities and limitations. Chapter 3 will critically
evaluate the limitations of these models as a whole, in order to optimize design
criteria for a new generation of in-vitro model testing.
2.2 THREE MAJOR DEVELOPMENTS DURING HISTORY
In the history of left heart duplicator systems, we can roughly distinguish three
key areas of development. The first area of progression is the mimicking of
the complex anatomy. The second field of development is the duplication of
physiological events. The third significant area of evolution is the adaptation
of these in-vitro models to (clinical) validation techniques. These three fields
of cardiovascular simulator development have greatly fostered research in
cardiovascular mechanics and the testing of medical devices.
2.2.1 Mimicking the complex anatomy
The first attempts in cardiovascular simulation were performed in 1895. The
pioneering efforts of Langendorff [67] used isolated animal hearts which were
artificially kept beating with an oxygenated solution. These models have
proven to be great research tools advancing our knowledge of physiology and
anatomy. Yet, these models are still animal models having only a limited

2. IN-VITRO MODELLING OF THE LEFT HEART: STATE-OF-THE-ART
83
period of beating time and cardiac parameters which are difficult to control.
Interestingly, several research groups have recently picked up this old
technique, such as the isolated four-chamber working swine heart model of
Chinchoy et al. (2000) [68], the PhysioHeart of de Weger et al. (2010) [69],
the passive-heart platform of Leopaldi et al. (2014) [70].
From the mid-1950s on, cardiovascular simulation was achieved
using postmortem human hearts which were actuated by hydraulic pumps [71-
73]. This procedure allowed more cardiac parameter control and had the
advantage of more anatomical-like modelling because of the use of a real
human heart. Although the beating time could be prolonged, the preservation
time of the postmortem tissue still signified a major issue. Nevertheless, this
work proved to be very significant in advancing our knowledge on the
cardiovascular system and even today, in specific cases, isolated biological
tissues are still used as research tool [5, 74].
Then, since the early 1960s, simulation of the cardiovascular system
was generally modelled by mechanical in-vitro pulse duplicators composed of
non-biological materials. There are two main reasons for this alternative
approach. First, the cardiovascular parameters can be more straightforwardly
regulated and second, mechanical models are not (or less) subjected to
functional decay and tissue decomposition. However, in contrast to biological
models, anatomical likeness relapsed because of the model’s relative simple
geometrical shapes. For example, the left ventricular geometry has been
replicated by a cylinder [75-78], a balloon [66], a truncated cone [79] and a
truncated ellipsoid [5, 80-85]. From the 2000s on, more realistic
approximations of the natural left heart geometry were obtained by applying
3D reconstructions of the anatomical structures using medical images [86-92]
in combination with more advanced manufacturing techniques, such as 5-axis
milling [88] and 3D printing [92-94].
Today, research is going even further than only the accurate modelling
of the anatomical shape. Recent research explores possibilities to build heart
phantoms using multi-material 3D printing to model the different anatomical
structures, such as the fabrication of calcified heart valves [92-94].
2.2.2 Duplicating physiological events
In addition to attaining anatomical likeness, the mimicking of physiological
events is equally crucial in the context of cardiovascular modelling.
Physiological pressure and flow conditions can be obtained by a left heart
model which is connected to a vascular model which can be a windkessel
model configuration or a (branching) tube-like system. The heart model is
equipped with an actuator to realize ventricular contraction. In some models,

2. IN-VITRO MODELLING OF THE LEFT HEART: STATE-OF-THE-ART
84
ventricular contraction is combined with atrial contraction [88, 95-97]. The
actuator systems are equipped with a control unit to induce the generation of
prescribed volume and/or pressure waveforms. There are two main actuation
approaches which can be distinguished, namely hydraulic and pneumatic
systems.
The first hydraulic system was developed in the 1950s and comprises
a mechanical actuator which consists of an one-arm rolling pump mechanism
acting during systole, and this in combination with a flexible bladder
functioning during diastole [66]. This way of activation comprises a more
natural way of ventricular suction; yet, the cardiac parameters are relatively
cumbersome to control. A more recent and commonly used hydraulic
approach is a piston pump which can be either driven by a crankshaft [98, 99]
or a ball screw servo motor, powered by either an analogue [5, 77, 79, 87, 98-
102] or a digital amplifier [103].
Then, according to the pneumatic actuation approach, one can
distinguish two types. The first type is based on two reservoirs containing
pressurized air and a vacuum which are controlled using valves to cause a
sequential contraction [84, 85, 95, 96]. The second type makes use of an
electric motor which drives a pneumatic cylinder to induce a proper actuation
[97].
Next to the type of actuator and its control unit, the vascular model is
a third important component when modelling replicating physiological events.
The windkessel effect of the arteries is generally generated using closed, partly
filled reservoirs including fluid and air. A more recent and more nature-like
approach of vascular simulation is the use of an anatomical-like vasculature
geometry which is made of an elastic material [91]. In this design, custom
elastic properties of the vascular wall can be obtained by locally varying the
wall thickness, although it is extremely hard to mimic the elastic properties of
young, healthy arteries.
2.2.3 Compatibility to measurement techniques
In addition to anatomical and physiological likeness, the setup of
cardiovascular simulators is also determined by the specifications required by
the signal acquisition, such as measurement of pressure and flow waves, wall
deformation patterns, intraventricular flow patterns, etcetera. The model setup
involves specific adaptations to enable compatibility with the preferred
measurement techniques.
Generally, cardiac simulation systems comprise the ability to connect
pressure transducers and flow probes which involves only limited adaptations.

2. IN-VITRO MODELLING OF THE LEFT HEART: STATE-OF-THE-ART
85
However, more specific modifications are needed for validation techniques
such as visual examination using cameras, Ultrasound (US) imaging, Laser
Doppler Anemometry (LDA), Particle Image Velocimetry (PIV), and
Magnetic Resonance Imaging (MRI).
Visual validation techniques require the use of optical cameras in
combination with clear viewing ports and a clear fluidum [72]. Then, in order
to obtain US imaging compatibility, the left heart model materials need to
approach tissue-equivalent properties to obtain proper ultrasound transmission
[95, 96, 101]. Next, LDA compatibility requires a transparent or semi-
transparent fluid to allow measurement of a laser beam Doppler shift [79].
Subsequently, concerning PIV measurements, beside optical clearness of the
in-vitro model, there is also a need for refractive index match between the
fluid media and the solid materials [79, 104, 105]. And finally, regarding MRI
compatibility, only non-ferromagnetic materials are allowed in the close
proximity of the MRI scanner which often results in a setup length of several
meters, bridging the heart model with the actuator and software [92].
In summary, during the past 55 years, cardiovascular duplicators have
continuously been improved by a more accurate mimicking of the human
anatomy, especially in recent years, by the entrance of medical imaging and
3D print technologies. Other crucial developments have been the
implementation of more physiological-like events by using more sophisticated
actuator systems and software-based regulation. Moreover, significant strides
forward have been made in the area of validation, as models have been made
compatible to a wide range of validation techniques, including clinical
examination techniques. In the following sections, we cover in more detail the
in-vitro simulators that played a significant role in this intriguing part of
cardiovascular modelling history.
2.3 PULSE DUPLICATOR SYSTEMS BEFORE THE 1960S
2.3.1 Oxygenated animal hearts
As early as the 1890s, animal models have been used for the study of cardiac
physiology. Langendorff introduced an ex-vivo approach to isolate a
mammalian heart and allowing it to continue beating for several hours after
its removal from the animal [67]. By this ex-vivo approach, he showed the
feasibility of restoring physiologic cardiac function on isolated hearts through
suitable myocardial perfusion. The biological heart was connected to a
benchtop vascular model to replicate the cardiovascular system. In the last
decades, many research groups practiced this beating heart approach and
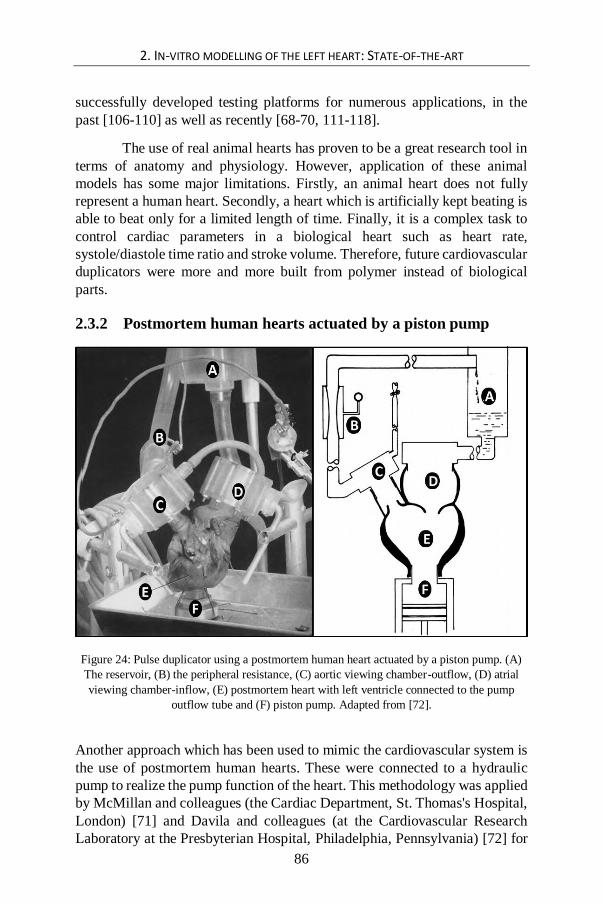
2. IN-VITRO MODELLING OF THE LEFT HEART: STATE-OF-THE-ART
86
successfully developed testing platforms for numerous applications, in the
past [106-110] as well as recently [68-70, 111-118].
The use of real animal hearts has proven to be a great research tool in
terms of anatomy and physiology. However, application of these animal
models has some major limitations. Firstly, an animal heart does not fully
represent a human heart. Secondly, a heart which is artificially kept beating is
able to beat only for a limited length of time. Finally, it is a complex task to
control cardiac parameters in a biological heart such as heart rate,
systole/diastole time ratio and stroke volume. Therefore, future cardiovascular
duplicators were more and more built from polymer instead of biological
parts.
2.3.2 Postmortem human hearts actuated by a piston pump
Figure 24: Pulse duplicator using a postmortem human heart actuated by a piston pump. (A)
The reservoir, (B) the peripheral resistance, (C) aortic viewing chamber-outflow, (D) atrial
viewing chamber-inflow, (E) postmortem heart with left ventricle connected to the pump
outflow tube and (F) piston pump. Adapted from [72].
Another approach which has been used to mimic the cardiovascular system is
the use of postmortem human hearts. These were connected to a hydraulic
pump to realize the pump function of the heart. This methodology was applied
by McMillan and colleagues (the Cardiac Department, St. Thomas's Hospital,
London) [71] and Davila and colleagues (at the Cardiovascular Research
Laboratory at the Presbyterian Hospital, Philadelphia, Pennsylvania) [72] for

2. IN-VITRO MODELLING OF THE LEFT HEART: STATE-OF-THE-ART
87
cinematographic assessment of cardiac valve movements. Figure 24 illustrates
the construction of the pulse duplicator of Davila and colleagues. Duran and
colleagues (Nuffield Department of Surgery, Oxford) also applied this
approach and presented their pulse duplicator in the literature as a simple,
versatile, and inexpensive system [73].
In the context of human cardiovascular modelling, this approach has
the advantage of using human hearts instead of animal hearts but still suffers
from other major limitations. Although the lifetime of this kind of heart model
is prolonged compared to the artificially beating animal hearts, postmortem
tissues do have only a limited preservation time. In most of the future
approaches, biological parts were therefore replaced by polymer materials
such as PMMA (polymethyl methacrylate) and silicones.
2.4 PULSE DUPLICATOR SYSTEMS AFTER THE 1960S
2.4.1 Department of Thoracic Surgery, Uppsala, Sweden (1962)
In 1962, Björk and colleagues [66] invented – to our knowledge - the first
mechanical in-vitro pulse duplicator exclusively made from non-biological
materials. As shown in the figure below (Figure 25), the system consists of
the following components: left atrium (A), mitral valve (B), left ventricle (C),
aortic valve (F), compliant aorta (G), and peripheral resistance (H). The
pulsatile flow is generated by a roller pump together with an elastic container.
During systole, the roller pump forces the liquid from the (E) elastic container
into the (D) rigid container (Figure 25 bottom right). During diastole, the roller
pump is inactive and the fluid is extracted from the rigid container back into
the flexible container (Figure 25 top right). A unique feature of this model is
the controllable diastolic suction, obtained by varying the difference in height
between (D) and (E). Similar to the system of Davila and colleagues [72], this
system is also capable of controlling systolic/diastolic ratio, stroke volume and
cardiac rate. Cardiac rate is adjusted by regulating the power delivery of the
electric motor which actuates the pump. The motor rotates a one-arm rolling
pump mechanism to generate the shape of an average ventricular pressure
pulse. In this way, this pulse duplicator is able to generate the physiological
dynamics of the left ventricle, aorta and left atrium.
This system has been used by Björk and colleagues for the evaluation
of cardiac prosthetic valves, specifically the ball type aortic and mitral valves
[66].

2. IN-VITRO MODELLING OF THE LEFT HEART: STATE-OF-THE-ART
88
Figure 25: Pulse duplicator system of the Department of Thoracic Surgery at Sweden (1962).
Left panel: The pulse duplicator with (A) left atrium, (B) mitral valve (C) left ventricle, (D)
rigid container, (E) elastic container, (F) aortic valve, (G) aorta, and (H) peripheral resistance.
Right panel: The pulse duplicator at the time of end systole (top) and end diastole (bottom).
Adapted from [66].
This apparatus used only mechanical components and has therefore a
much longer life time and is also much simpler, smaller and less expensive
than biological models used at that time [66].
Compared to more recent systems using piston pump driven heart
models (see further), this model actually comprises a more natural way of
ventricular relaxation. Thanks to the extraction of the fluid from the rigid to
the flexible container during diastole, negative ventricular pressures are
limited. By this innovative approach, this model is able to simulate the
diastolic phase more physiologically, since only minimal diastolic ventricular
suction is present in the human heart. According to the authors, the major
limitation of this system is the inability to simulate the annular motion [66].
2.4.2 Engineering Science Group, Oxford (1972)
Bellhouse and colleagues [80] developed an in-vitro model of the left heart,
including a more extended set of components to simulate the cardiovascular
system. According to Figure 26, the test fluid enters the left heart via the
pulmonary veins (A) and then goes into the left atrium (B). The fluid then
travels through the mitral valve (C) into the left ventricle model (D). An

2. IN-VITRO MODELLING OF THE LEFT HEART: STATE-OF-THE-ART
89
external pressure source (E) forces the ventricle to contract, and by this
contraction, the fluid is pumped through the aortic valve (F), into the aorta
(G), and finally, back to the pulmonary veins (A). Yet, the description of the
pulse duplicator gives insufficient detail about the type of pump mechanism.
The authors used this model to study the fluid mechanics of a model
mitral valve and left ventricle. Their findings suggest that the mitral valve
tends to close during diastasis, particularly if the flow is very low [80]. In this
early experimental study, they noticed the existence of three-dimensional flow
patterns and showed the existence of a vortex ring in a flexible left ventricular
model which aids in the valve closure during diastole [81].
Figure 26: Cardiovascular simulator of the Engineering Science Group at Oxford (1972),
including pulmonary veins (A), the left atrium (B), the mitral valve (C), the left ventricle
model (D), the external pressure source (E), the aortic valve (F) and the aorta (G). Adapted
from [80].

2. IN-VITRO MODELLING OF THE LEFT HEART: STATE-OF-THE-ART
90
2.4.3 Mechanical Engineering Group, Berkeley, California (1977)
In 1977, Lee developed a heart model to study the fluid mechanics and motion
of the ventricular wall and mitral valve [84]. In addition to the basic
components of a compliance-resistance mock circulatory network as depicted
in the previous model, the simulator was equipped with a high speed
cinematographic camera to visualize ventricular wall motion, mitral valve
motion and intra ventricular flow using the hydrogen-bubble technique
(Figure 27). All components of the left heart model are made of transparent
materials to allow clear visualization of the flow. As such, the flexible
ventricle model is made of transparent rubber which is surrounded by a rigid
box made of PMMA.
Besides the development of the pulse duplicator, Lee also designed an
aortic model based on the design of Bellhouse & Bellhouse [81] as well as a
mitral valve model. The mitral valve (Figure 27 bottom left) components are
also made of a rigid PMMA, such as the two leaflets and the ring on which
two parallel supporting triangular walls are mounted. The valve leaflets are
hinged by thin flexible plastic sheets which allow the leaflets to smoothly open
and close.
Figure 27: Schematic diagram of the left heart model and circulatory network of the
Mechanical Engineering Group at Berkeley, California. Adapted from [85].

2. IN-VITRO MODELLING OF THE LEFT HEART: STATE-OF-THE-ART
91
Figure 28: Flow patterns inside ventricle model to explore the nature of pulsatile flow (A)
during diastolic filling and (B) just after mitral valve closure. The experiment was performed
at a heart rate of 20 beats/min and a stroke volume 80 ml. Adapted from [85].
Another interesting feature of this left heart model is the actuation of
both the ventricle as well as the atrial model, by a sequential contraction using
compressed air in combination with a vacuum. Moreover, pneumatic heart
model parameters are being electronically controlled such as heart rate,
systole/diastole time ratio and stroke volume.
As shown in Figure 28, Lee and Talbot used this model to study the
fluid mechanics of heart valve closure [85].
2.4.4 Cardiothoracic Surgery Unit, New York (1978)
In 1978, Gabbay and colleagues developed a cardiovascular simulator made
of rigid PMMA tubes and two reservoirs [75]. As shown in Figure 29, the left
heart model is simulated by the following components: the left reservoir
representing the left atrium (1), the mitral valve (2), the left ventricle which is
modelled as a stiff walled cylindrical chamber (3), and driven by a piston
pump (4). Downstream the aortic valve (5), the mock loop includes two
resistances (6, 8) and a compliance (7), which is connected to the second
reservoir, in which the fluid is collected (9). Finally, the mock loop is closed
by connecting the two reservoirs. Flow measurements are realized
downstream the left ventricle (10) and at the aortic valve position (11).
Pressure was measured in the atrium and ventricle using tip catheter
transducers.
This heart simulator was used for the in-vitro hydrodynamic
comparison of mitral valve prostheses [75] as well as for bio prostheses [76].
A major limitation of this left heart model is the simplified simulation of the
left ventricle by a stiff walled cylindrical chamber.

2. IN-VITRO MODELLING OF THE LEFT HEART: STATE-OF-THE-ART
92
Figure 29. Pulse duplicator system of the Cardiothoracic Surgery Unit, New York [75].
2.4.5 ViVitro Labs Inc., Victoria (1979 – present)
In 1979, Scotten and Walker (Victoria, CA) presented the construction and
performance of their cardiovascular simulator for the assessment of mitral
valve prostheses [82]. In the mid-1970s, this research initiated the foundation
of the company ViVitro Systems and the commercialization of the Pulse
Duplicator in 1984. Today, ViVitro Labs is a global provider of prosthetic
heart valve test equipment, laboratory testing, consulting, and engineering
services. The ViVitro pulse duplicator is developed according to ISO 5840
(Cardiovascular implants - Cardiac valve prostheses) and FDA requirements.
The simulation fluid of the first ViVitro simulator is pumped (Figure
32) from a left atrial reservoir (1) through the mitral valve (2) into the left
ventricle (3), and subsequently, through the aortic valve (4), the aorta (5), a
compliance (6) and a resistant (7), and finally flows back into the left atrial
reservoir. Although there are similarities with the heart simulator of Gabbay
and colleagues [75], Scotten and Walker came up with two significant
innovations. First, the left ventricle model (8) is shaped as a truncated ellipsoid
which is more similar to the natural ventricle than the stiff walled cylindrical
chamber of Gabbay et al. [75]. Second, the pump is more sophisticated and
can generate more physiologically relevant flows.

2. IN-VITRO MODELLING OF THE LEFT HEART: STATE-OF-THE-ART
93
Figure 30: The Superpump system SPS 3891 of ViVitro Lab Inc. This pump was
commercially available from the 1984 (top), for a period of almost 30 years (middle: latest
version of the analog pump), until the electronic pump (bottom) came in place.
Figure 30 shows the three versions of the ViVitro Superpump that
have become available throughout the past three decades. The first two super
pump systems (10) (Figure 30 top and middle) consist of a piston-in-cylinder
pump head driven by a low inertia DC electric motor. The rotary motion of
the DC motor is converted to a linear piston displacement using a ball-screw
mechanism. The motor is driven by a power amplifier which is controlled by
a wave form generator (9). Complex waveforms can be loaded to the wave
form generator to realize the desired oscillatory physiological flows. The
frequency of playback for each waveform can be set to values between 30 -

2. IN-VITRO MODELLING OF THE LEFT HEART: STATE-OF-THE-ART
94
200/minute. Moreover, not only the peripheral compliance (6), but also the
aortic compliance (5) is replicated in this model. Pressure can be measured at
mitral (11) and aortic position (12), as well as inside the left atrium, the left
ventricle and the aorta. Upstream the mitral (13) and aortic (14) valves, flow
is measured using electromagnetic sensors. Three pressure and two flow
signals can be simultaneously processed and visualized by the ViVitro
software.
The more recent ViVitro systems (such as the left heart system used
for this doctoral dissertation which was purchased in 2009; Figure 31 left
panel), are equipped with a wave form generator (Type VG2001) which can
generate form frequencies of 1 - 500/minute. Another new feature is the
ViVitro software ViViTest which is developed to monitor, acquire and
analyze the data of the pulse duplicator system. This software is particularly
designed for heart valve characterization. An additional new feature is the
Viscoelastic Impedance Adapter (VIA) which can produce more realistic
waveforms by replicating the viscoelastic properties of the ventricle in terms
of resistance and compliance. The VIA is located between the piston pump
and left heart model.
The latest version of the ViVitro heart model is also equipped with a
digital motor (Figure 30 bottom and Figure 31 right panel) instead of an
analogue motor to provide more control with precision accuracy by a high
torque to inertia ratio. Another new feature is the integrated design of
ventricle, two heart valves and the piston pump, called the ViVitro Pump Head
(Figure 33).
Figure 31: The ViVitro Left Heart Simulator: version ‘Model SD 2001-1’ of 2009 (left panel)
and version ‘AR Series’ of 2014 (right panel). Adapted from [103, 119].

2. IN-VITRO MODELLING OF THE LEFT HEART: STATE-OF-THE-ART
95
Figure 32: The Heart Simulator according to ViVitro Labs Inc., Victoria (1992) [100]. The
model is composed of a left atrial reservoir (1), mitral valve (2), left ventricle (3), aortic valve
(4), the aorta (5), peripheral compliance (6), resistant (7), ventricle membrane model (8),
wave form generator (9) and super pump system (10). Pressure sensors can be placed at mitral
(11), aortic (12), left atrial, left ventricular, and aortic position. Electromagnetic flow sensors
are positioned upstream the mitral (13) and aortic (14) valves.
Figure 33: The ViVitro electronic Superpump AR Series can be provided with a pump head
including a ventricle membrane and two heart valves to simulate physiological flows.

2. IN-VITRO MODELLING OF THE LEFT HEART: STATE-OF-THE-ART
96
This ViVitro left heart model was first used for an in-vitro study of a
mitral valve prostheses [82, 83] and is currently mostly used for hydrodynamic
testing of heart valves, such as mechanical heart valves [104, 105, 120]. At
this moment, this commercial system is the most applied and cited pump for
simulating cardiac flows [103].
2.4.6 Cardiovascular Fluid Mechanics Lab, Georgia Institute of
Technology, Atlanta (1984 - present)
In 1984, Yoganathan developed an aortic valve test equipment at the Georgia
Institute of Technology (Figure 34 left panel) for the in-vitro hydrodynamic
characterization of heart valves, such as bileaflet, tilting disc and porcine
aortic valve substitutes [121]. Then, in the late 1990s, Hashim and colleagues
developed a left heart model with a modular mitral valve mounting device, in
which biological valves can be mounted. This left heart model was used for
the assessment of three-dimensional forces applied by the papillary muscle on
the left ventricular wall [74, 122]. In 2008, Padala and colleagues called this
apparatus the “Georgia Tech Left Heart Simulator” [123].
After that, Rausch and colleagues majorly improved this simulator in
the late 2000s by replacing the rigid ventricle by a flexible bag model to
simulate wall motion. They also changed the compressible bladder type pump
into a piston pump driving system to obtain more physiological and versatile
transmitral pressures and flow curves [5]. Figure 35 illustrates both
configurations of the Georgia Tech Left Heart Simulator: the left panel before
and after right panel after the revision of Rausch and colleagues.
Figure 34: Left panel shows the aortic valve test apparatus developed by Yoganathan in 1984
[121]. Right panel illustrates the left heart model build by Hashim and colleagues in 1997
[74], also called the “Georgia Tech Left Heart Simulator” [123].
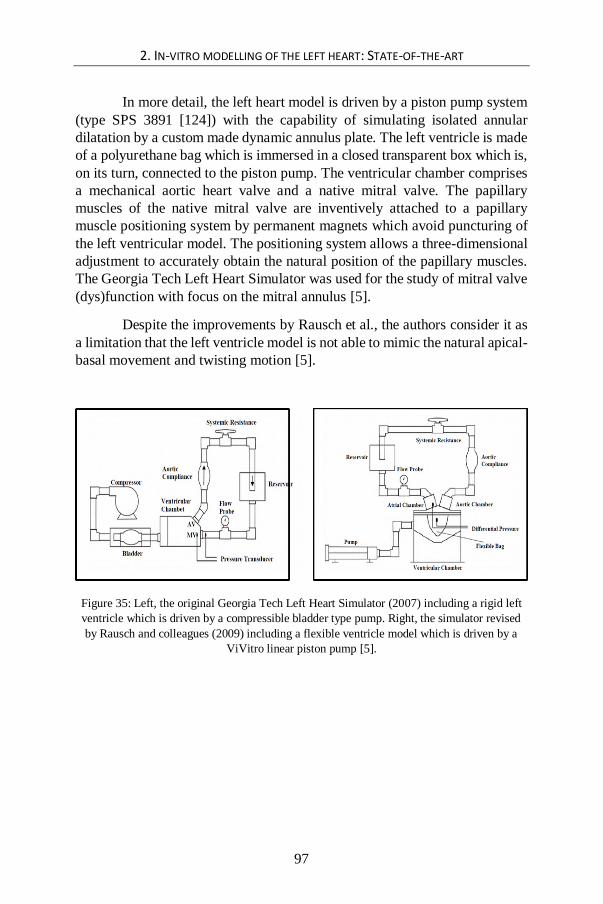
2. IN-VITRO MODELLING OF THE LEFT HEART: STATE-OF-THE-ART
97
In more detail, the left heart model is driven by a piston pump system
(type SPS 3891 [124]) with the capability of simulating isolated annular
dilatation by a custom made dynamic annulus plate. The left ventricle is made
of a polyurethane bag which is immersed in a closed transparent box which is,
on its turn, connected to the piston pump. The ventricular chamber comprises
a mechanical aortic heart valve and a native mitral valve. The papillary
muscles of the native mitral valve are inventively attached to a papillary
muscle positioning system by permanent magnets which avoid puncturing of
the left ventricular model. The positioning system allows a three-dimensional
adjustment to accurately obtain the natural position of the papillary muscles.
The Georgia Tech Left Heart Simulator was used for the study of mitral valve
(dys)function with focus on the mitral annulus [5].
Despite the improvements by Rausch et al., the authors consider it as
a limitation that the left ventricle model is not able to mimic the natural apical-
basal movement and twisting motion [5].
Figure 35: Left, the original Georgia Tech Left Heart Simulator (2007) including a rigid left
ventricle which is driven by a compressible bladder type pump. Right, the simulator revised
by Rausch and colleagues (2009) including a flexible ventricle model which is driven by a
ViVitro linear piston pump [5].

2. IN-VITRO MODELLING OF THE LEFT HEART: STATE-OF-THE-ART
98
Figure 36: The latest version of the Georgia Tech Left Heart Simulator (2013). Adapted from
[125].
2.4.7 Cardiovascular Engineering Group, Aachen (1981 and
1988)
In the early-1980s, Reul and colleagues [86] developed a cardiovascular
simulator to study the fluid mechanics of natural and bioprosthetic heart
valves. The mock loop is similar to the latter described system, as it also
includes an elastic ventricular model as well as a volume controlled actuation
by a piston pump. Later, in the late-1980s, Knott and colleagues [87] rebuilt
the system and added some extra features, such as an air compartment between
the ventricular sac and the ventricular rigid box. These two cardiovascular
simulators contain the following similar components (Figure 37 A and B). An
atrial reservoir (1) is connected to an atrial chamber (3) which includes an
atrial elastic sac (2). The atrial chamber is separated from the ventricular
chamber (6) by a flow meter (4) and a mitral valve (5). Both models include
an elastic ventricular model (7) which is positioned in a rigid transparent box
(6) and a fluid which fills the space in between. However, only in Knott’s
model, this space is partly filled with fluid (6b) and air (6a). Downstream the
aortic valve (8), in both models, there is an elastic aorta (9) placed in a rigid
chamber (10) with on top of it, a pressure regulation (11), a flow meter (12),

2. IN-VITRO MODELLING OF THE LEFT HEART: STATE-OF-THE-ART
99
a resistance (13) and a compliance (14). The peripheral resistance (15) is
adjustable by a valve mechanism (16). The actuation system (17) is volume
controlled by an electromagnetic valve (17c) and consists of two hydraulic
pistons, one for low (17a) and one for high pressures (17b). Pressure is
measured at the left atrium (2), the left ventricular apex (7) and the aorta (9),
using tip catheter transducers. According to Knott’s model, transmitral (4) and
aortic (12) flows are measured using two electromagnetic flow sensors. In
Reul’s model, only aortic flow is measured using a hot wire anemometer.
Figure 37 C shows a photo of the model of Knott and colleagues.
Unique features of these two simulators are first, the left atrium and
aorta which are made of a flexible silicone material, and second, the
implementation of an aortic and ventricular compliance.
The cardiovascular simulator of Reul and colleagues was used to
study the fluid mechanics of a natural mitral valve [102], for the comparative
in-vitro evaluation of porcine and pericardial bioprostheses [126], and for the
in-vitro comparison of bileaflet aortic heart valves [127]. Furthermore, this
heart model was used by Hasenkam and colleagues for velocity visualizations
of aortic valves [128]. Even though most of the in-vitro dynamic studies of
flow through prosthetic heart valve were limited to two dimensions, they were
able to visualize three-dimensional velocity fields downstream the mechanical
aortic valves, using suspended particles in an aqueous glycerol solution. The
system of Knott and colleagues was applied for in-vitro comparisons of series
aortic heart valve prostheses [87] and for assessing velocity and shear-stress
distribution of mechanical heart valves [129].

2. IN-VITRO MODELLING OF THE LEFT HEART: STATE-OF-THE-ART
100
Figure 37: Schematic overview is shown of the cardiovascular simulator of Reul and
colleagues (A) and of Knott and colleagues (B). Panel (C) shows a photograph of Knott’s
model. Adapted from [86, 87].

2. IN-VITRO MODELLING OF THE LEFT HEART: STATE-OF-THE-ART
101
2.4.8 Department of Mechanical Engineering, British Colombia
(1985)
In 1985, Akutsu designed a cardiovascular simulator to asess hydrodynamic
performance of both aortic and mitral valves [79]. As illustrated in Figure 38,
this heart model consists of a valve support block which holds the atrium,
aorta, cardiac valves and ventricle model and is mounted on a PMMA box
which is connected to a piston pump. This system is actuated by a stepping
motor and controlled by a microprocessor.
Figure 38: The cardiovascular simulator according to Akutsu (1985) with a conically shaped
transparent ventricle [79].
This cardiovascular simulator was used for the assesment of
hydrodynamic performance of mechanical [79, 130-142] and biological
prosthetic heart valves [142] in relation to valve orientation [131] and design
[131, 132]. Flow fields were analyzed using LDA (Laser Doppler
Anemometer) [79, 130, 134, 141, 142] and PIV (Particle Image Velocimetry)
[131-140] inside the simulated ventricle [131, 132] and through the model
aorta [139, 140].

2. IN-VITRO MODELLING OF THE LEFT HEART: STATE-OF-THE-ART
102
Although this basic design follows the model developed by Scotten et
al. and Reul et al., this left heart model has some unique features. First, the
ventricle model is made of a transparent polyurethane sheet material which
allows flow measurement and visualisation by optical methods, such as LDA
and PIV. Akutsu approached the anatomical shape of the natural ventricle by
a truncated cone and the natural flexible character using a flexible material.
Another unique feature is the Ventricle Support (Figure 38) which artificially
connects the ventricle model apex to the PMMA Box. Although this support
rod is responsible for a smooth wall deformation during the pump cycle, it has
the disadvantage that natural apex movements of the ventricle are restricted
which in turn artificially affects velocity patterns inside the ventricle model
[79].
2.4.9 Dynatek Laboratories Inc., Galena, Missouri (1990 –
present)
Dynatek Laboratories Inc. is a research company located in Galena, Missouri,
launched in the early 1990s. Since then, the company develops medical device
testing equipment, such as for heart valve and stent testing. They also
developed a series of left heart models, such as the MP1 Anthropomorphic
cardiac ultrasound phantom, the MP3 Pulse Duplicator and most recently the
MP4 – Robotic Cardiovascular Pulse Duplicator. We suppose that there has
been also a MP2 system, however, no information could be retrieved on this
system.
The MP1 system was the first ultrasound compatible pulse duplicator.
Previous cardiac simulators were not apt for ultrasound imaging for multiple
reasons: setup components sensitive to reverberations and ultrasound
reflections, test fluid which did not contain ultrasound contrast agent, and/or
the fluid reservoirs lacking viewing windows. In contrast, the MP1 phantom
is the first left heart simulator which is made suitable for ultrasound studies,
as illustrated in Figure 39. First, the container contains three membrane-
covered viewing ports (32, 34 and 36) which allow ultrasonic examination.
These chambers are oriented according to the three conventional cardiac
ultrasound views, i.e., the long axis (LA), short axis (SA) and apical (AP)
views. Second, the phantom contains a blood-mimicking fluid (28) for the
circulatory system as well as a tissue-mimicking medium (46) to ultrasonically
simulate the human tissue. An ultrasound transducer (44) is shown as well as
the three examination windows (32, 34 and 36). Apart from ultrasound related
features, the MP1 is also equipped with a compressible tubing (26) to fine-
tune the pump flow output. The pulsatile flow in this pulse duplicator is

2. IN-VITRO MODELLING OF THE LEFT HEART: STATE-OF-THE-ART
103
realized by a piston pump (24) which pushes the fluid through a compressible
tubing (26) into the viewing chamber (30). The piston pump is driven by an
adjustable DC motor (48) via a variable stroke drive (50).
The MP1 was used by Barbara and colleagues to study the data
comparability with the system developed by the University of Sheffield in the
context of in-vitro evaluation of prosthetic heart valves [143]. Although the
same prosthetic heart valve and settings (HR, SV, systole/diastole time ratio
and afterload) were used, the authors observed high discrepancies in
experimental valve performance data (such as the closing and leakage volume)
between these two pulse duplicator systems. Barbara et al. stressed the need
for standardization in in-vitro evaluation of heart valves.
The later developed MP3 pulse duplicator is also an ultrasound
compatible system but with special attention for transparency of the setup to
provide full visibility of the device during experiments. This system is coupled
with a programmable pumping system and was used for durability testing of
stent barbs [144].
The newest system which Dynatek developed (2004) is called the
MP4 Robotic Cardiovascular Pulse Duplicator and is illustrated in Figure 41
[145]. This model includes an updated version of data acquisition, a computer
controlled rolling piston to actuate the ventricle, and a silicone mock aorta
which is fabricated from MRI data.
Figure 39: The Dynatek MP1 Pulse Duplicator (1990). The simulated circulatory loop 12
includes the following successively components: a reservoir 22, a variable compliance
chamber (A), mitral valve port 18 including the mechanical prosthetic mitral valve 14, a
flexible left ventricular sac 10, aortic valve port 20 including the mechanical prosthetic aortic
valve 16, flow meter 74, variable compliance chamber (A) and a variable resistance manifold
(B). Adapted from [101].

2. IN-VITRO MODELLING OF THE LEFT HEART: STATE-OF-THE-ART
104
Figure 40: The Dynatek MP3 Pulse Duplicator: the circulatory system is given (left) together
with a close-up of the left heart model (right). The ventricle model is not shown on the
pictures. Adapted from [144].
Figure 41: The Dynatek MP4 Robotic Cardiovascular Pulse Duplicator [145].
2.4.10 University of Sheffield, UK (1991)
The Sheffield heart simulator was first reported on in 1991. Unique feature of
this simulator are its straightforward control of the piston pump using a
microcomputer and the flow straighteners at mitral and aortic valve sites. The
system is equipped with valve mounting blocks to enable valve tests in either
mitral position or in aortic position. Pressures have been measured at both the
ventricle and aorta site, while flow has been measured directly by
electromagnetic flow meters at both mitral and aortic valve sites. Pressure and
flow data can be loaded to the computer and processed automatically.

2. IN-VITRO MODELLING OF THE LEFT HEART: STATE-OF-THE-ART
105
The simulator has been used for the validation of the Gorlin orifice
formula, more specifically for the assessment of the heart valve effective
orifice area (EOA) [78], and for a comparative study of steady and pulsatile
flow within the context of in-vitro validation of heart valves [146].
Figure 42: Schematic drawing of the Sheffield pulse duplicator (1991) consisting of the
following components [78]: fluid container (R), electromagnetic flow meter (EMF) and flow
straighteners at both mitral and aortic valve sites (S), left atrium (At) and a mitral valve plane
(Mv), mitral chamber (M), left ventricle (V), mitral (MV) and aortic valve (AV), aorta (A), a
model of the systemic circulation (SA). Systemic arterial compliance is realized by a volume
of trapped air and the peripheral resistance is controlled by a flow control valve (FCV).
Figure 43: Photograph of the pulsatile flow simulator of Sheffield (1991) [78].

2. IN-VITRO MODELLING OF THE LEFT HEART: STATE-OF-THE-ART
106
2.4.11 IBiTech-BioMMeda Group of Ghent, Belgium (1992 –
present)
From the early 1990s onwards, multiple cardiovascular simulators
have also been developed and tested at the IBiTech-BioMMeda group of
Ghent University. First, Verdonck and colleagues developed a revolutionary,
computer controlled cardiovascular simulator in the early 1990s [95, 96]
which was extended in the late 1990s by Segers and colleagues with a full
arterial system [147]. In the mid-2000s, Claessens and colleagues developed
a thick-walled left ventricular model [98].
The original model was a computer controlled cardiovascular
simulator which was developed in collaboration with the Norwegian
Technical University of Trondheim [95, 96] to study the influence of the
several determinants of the left heart performance on transmitral flow. This
left heart simulator was one of the first in-vitro models which allowed an
echographic study of transvalvular mitral and aortic flow [96]. Also, the
natural geometric representation together with the separate activation of the
atrium and ventricle made this left heart simulator state-of-the-art for that
time. Up to date, a modified version of this simulator is still currently and
routinely used as a simulation platform for cardiovascular research in the
IBiTech-BioMMeda Group.
Originally, the simulator was a pressure controlled system (Figure 44
left and top panel). In a later stage, the simulator was redesigned to a volume
controlled system using a hydraulic piston pump system (Figure 44 right
panel). The hydraulic part of the simulator consists of a PMMA reservoir
holding a Latex model of the left heart and is connected to models of the
pulmonary veins, the left atrium, the left ventricle and the aortic arch. Parts
are modularly designed in order to easily mount mitral and aortic valves. The
electronic part allows control and monitoring of the cardiac cycle in terms of
heart rhythm, atrial as well as ventricular pressures and flows. In addition, the
model also allows for differentiation of several left heart performance
determinants on transmitral flow, such as preload, compliance of the left
atrium and ventricle, peripheral resistance (afterload) and heart rate.
Ultrasound evaluation has been made possible from both atrial and ventricular
windows.
This heart simulator has been used for a very wide range of
applications, such as (among others) testing heart valves [148-150], in-vitro
simulation of the arterial system [151], and more recently, assessment of
blood-wall interaction [98], testing assist devices [152, 153], and evaluation
of aortic valve matrices for tissue engineering [154].

2. IN-VITRO MODELLING OF THE LEFT HEART: STATE-OF-THE-ART
107
Figure 44: The cardiovascular left heart simulator of Verdonck and colleagues. The left panel
shows a photograph and the top panel shows a technical drawing of the original pneumatically
driven model (1992) and the right panel illustrates the revised hydraulically actuated model
(2006). The system is equipped with (1) reservoir, (2) tube, (3) two pulmonary veins, (4) left
atrium, (5) mitral valve, (6) left ventricle, (7) aortic valve, (8) aorta, (9) resistance, (10)
volume measurement reservoirs and (11) ultrasound probes. Adapted from [95] and [154].
In 1997, Segers extended the left heart model of Verdonck and
colleagues to a cardiovascular simulator by adding a model of the arterial
system [99]. The arterial tree model was made of latex rubber and included
the aorta, the upper and lower limb arteries, the carotid arteries and the major
branches to the abdominal organs. Accurate simulation of physiological and
pathological conditions was realized by a representative anatomical geometry
(matching the arterial tree of a male subject of 1.75 m and 75 kg) and by
terminating the arteries with adjustable resistances and compliance chambers.
This model was, among other applications, used for the non-invasive
assessment of arterial compliance [99], for studying the role of tapering in
aortic wave reflection [155], the impact of an abdominal aortic aneurysm on
aortic pressure and flow [156], and for the validation of a mathematical 1D
arterial network model [157].

2. IN-VITRO MODELLING OF THE LEFT HEART: STATE-OF-THE-ART
108
Figure 45: The extended version by Segers and colleagues (1997) comprises the left heart
model of Verdonck and colleagues (at the outer left side) which is connected to an extensive
model of the arteries (middle and right panel). The left heart model comprises 1) lung
reservoir, 2) pulmonary veins, 3) left atrium, 4) left ventricle and a partial aorta. The arterial
tree model includes 5) the larger part of the aorta, 6) aorto-iliac bifurcation, 7) peripheral
model, 8) veins, 9) venous return conduit, 10) electromagnetic flow meter, 11) venous
overflow, 12) buffering reservoir and 13) pump. Adapted from [99, 155].
In 2004, Claessens and colleagues [98, 158] developed a LV model
[96] by implementing a thick-walled left ventricular model to reveal more
fundamental insights in left ventricular isovolumic relaxation and early filling
dynamics. They developed a unique left ventricular phantom mimicking the
mechanical and acoustic myocardial tissue properties of the human heart.
Variation in phantom compliance was obtained by using a Polyvinylalcohol
(PVA) solution which allows systematical wall stiffening with the number of
freeze-thaw cycles during preparation. Suitable acoustic properties were
realized by adding graphite powder to the PVA solution to enable appropriate
backscatter of the ultrasonic waves. Unfortunately, the systolic phase was not
modelled in this study; therefore, we categorized this model not as a
cardiovascular simulator but as a side project to the work of Verdonck et al.
and Segers et al.
The model was used to individually adjust clinically obvious
parameters concerning depressed diastolic function such as end-systolic
pressure, active relaxation rate, passive myocardial properties, and preload
[98].

2. IN-VITRO MODELLING OF THE LEFT HEART: STATE-OF-THE-ART
109
Figure 46: Overview of the experimental setup of Claessens and colleagues: (1) Left
ventricular phantom (close up right), (2) Doppler transducer, (3) mitral valve, (4) pressure
transducer, (5) proportional valve, (6) valve, (7) PMMA chamber, (8) preload reservoir and
(9) device to measure ventricular volume. Adapted from [98].
2.4.12 Cardiovascular Biomechanics Group of Marseille (2000 -
present)
In Marseille, France, the research group of prof. Régis Rieu has had an interest
in developing cardiovascular models for several decades.
In 2000, Mouret and colleagues developed the “Dual Activation
Simulator (DAS)” (Figure 47) including an independent hydraulic activation
of the left atrium and left ventricle [88]. Because the left atrium and left
ventricle model shapes are based on medical data, this model represents an
anatomical shape of the human left heart. In order to build the cardiac
chambers, first an aluminum core was manufactured using a 5-axis milling
machine. Subsequently, this core was coated by successive layers of silicon
(see Figure 48).
In 2010, Tanné and colleagues developed a cardiovascular simulator
with a more detailed anatomical-shaped left atrial and a left ventricular model
[89] (see Figure 48 and Figure 49 left). This cardiovascular simulator was
made by transparent materials and also equipped with a PIV system.
This pulse duplicator was used to measure and describe the complex
3D flow dynamics inside a realistic left atrium geometry [89], and more
recently, to study local transvalvular pressure gradients in bileaflet mechanical
heart valves [159] (see Figure 49 right). This cardiovascular simulator is also
employed for valve testing services by the company Protomed Labs which is
also located in Marseille.

2. IN-VITRO MODELLING OF THE LEFT HEART: STATE-OF-THE-ART
110
Figure 47:The Dual Activation Simulator (DAS) setup (left panel) and the left heart model
(right panel) of Mouret and colleagues (2000) [88].
Figure 48: Workflow to obtain an anatomical-shaped left atrial and a left ventricular model:
first, medical images are segmented (A), then a virtual solid model is created (B), next an
aluminum core is milled (C) and finally a silicone model is produced (D). Adapted from [89].

2. IN-VITRO MODELLING OF THE LEFT HEART: STATE-OF-THE-ART
111
Figure 49: Two versions of the cardiovascular simulator of Marseille are shown. Left panel
illustrates the PIV compatible version (2010) and right panel demonstrates the ultrasound
compatible version (2013). The following components are indicated: echocardiographic probe
(EP), left ventricle (LV), mitral valve (MI) and left atrium (LA). Adapted from [89] (left) and
[159] (right).
2.4.13 Department of Mechanical Engineering, Virginia Tech,
Blacksburg (2004)
In 2004, Pierrakos and colleagues of Virginia Tech, developed a
cardiovascular simulator for the analysis of the hemodynamic characteristics
of blood flow through heart valves, but also of intraventricular blood flow (see
Figure 50). The system is equipped with a piston pump with an adjustable
travel in order to generate physiological pressure and flow waveforms. The
ventricular model is made of transparent silicone in order to allow PIV
examination.
A unique feature to highlight is the presence of a flexible valve plane
which is an innovative way of ventricle model suspension, allowing clear flow
assessment of the valve inflow and outflow regions.
To date, this left ventricular model has been used to analyze intra
ventricular vortex dynamics through porcine and mechanical heart valve
prostheses [160] and to study the effect of vortex formation on ventricular
filling and mitral valve performance [161].

2. IN-VITRO MODELLING OF THE LEFT HEART: STATE-OF-THE-ART
112
Figure 50: The Virginia Tech heart simulator (2004), a schematic setup overview (left panel)
[160] and a photo (right panel) of the left heart model are shown [162].
2.4.14 Kheradvar Research Group, California Institute of
Technology, Pasadena (2006 - present)
Also in the United States, in 2006, Kheradvar et al. developed a cardiovascular
simulator which is called the ‘Caltech's left heart pulsed flow simulator
system’ [90]. This system comprises a left ventricle and valve plane which are
made of transparent flexible silicone to allow flow measurements by optical
techniques, such as a custom-designed high-resolution high-speed PIV
equipment.
The Caltech's left heart pulsed flow simulator system (Figure 51 A) is
connected to a ViVitro hydraulic pump system (Superpump system, VSI,
SPS3891, ViVitro systems Inc., Victoria, BC, Canada) and controlled by a
VSI Wave Generator VG2001 (ViVitro Systems Incorporated, Victoria, BC,
Canada) to generate pulsatile flow in the circulatory system. The ventricular
model (Figure 51 B-D) comprises a geometry which is based on a 3D
reconstruction of a normal adult heart using cardiac MRI in systolic state and
is realized via dip-molding of a transparent, flexible silicone material. The left
ventricular model is suspended in a cubic container made from PMMA to
which the hydraulic pump system is connected (Figure 51 A) and connected
to the circulatory system via inlet and outlet tubes (Figure 51 B). Prosthetic as
well as bioprosthetic heart valves can be mounted in both mitral and aortic
positions.
Just like in the model of Pierrakos et al. [160, 161], this model is
equipped with a special valve plane feature. While all other left heart models
are equipped with a rigid valve housing block which suspends the left ventricle
model in a fixed way, these models include a flexible valve plane which holds
the left ventricle model by the in- and outlet tubes at the aortic and mitral sites

2. IN-VITRO MODELLING OF THE LEFT HEART: STATE-OF-THE-ART
113
(Figure 51 B). This innovative way of ventricle model suspension allows
movement of the valve plane as well as a clear flow assessment of the valve
inflow and outflow regions. In comparison with the left heart model of
Pierrakos et al, this model has a smaller travel between the two valves, which
seems more anatomically and physiologically correct (Figure 51).
There are, however, some limitations to this experimental setup [163].
In their validation study, Falahatpisheh and Kheradvar note that “the silicone
LV model cannot generate the twisting motion similar to the left ventricle,
which may affect the flow-field”. This limitation applies to all (as far as we
know) current in-vitro left hart models since there are no left heart models
which include this twisting motion to date.
The Caltech's left heart pulsed flow simulator system is primarily
designed and used for in-vitro study of intraventricular flow fields and this in
relation to mitral valve dynamics [90]. As such, Kheradvar and colleagues
examined the effect of varying the profile height of mitral bioprostheses on
flow [90]. Also, they validated the so-called ‘Echocardiographic Particle
Image Velocimetry’ which is a technique being applied, for example, to
quantify blood vorticity patterns in the left ventricle [164]. Another study with
this in-vitro setup considered the fluid dynamics downstream of a novel mitral
bioprosthesis [165] (Figure 52). The authors determined the effect of mitral
saddle annulus and leaflet length on peak leaflet stress and transmitral flow
pattern by using a new design of a bileaflet bioprosthetic valve. It was found
that the movements of the mitral saddle annulus, together with the leaflet
length, are critical factors which decrease stress distribution at the leaflet tips.
Recently, Kheradvar and colleagues also developed a bileaflet mitral
bioprosthesis which imitates the mitral valve’s saddle annulus motion (Figure
52) [165]. The bioprosthesis comprises a saddle-shaped Nitinol core on which
the leaflets were sutured. The leaflets were made of bovine pericardial tissue
with a thickness of 0.5 mm. In the mitral valve prosthesis, they did not include
the natural supporting structures such as the chordae tendineae and papillary
muscles which avoid the valve leaflets being prolapsed toward the atrium.
Instead, they realized the supporting function of the mitral valve prosthesis by
suturing the leaflet to each other by means of two supporting prongs which
extend from the annulus along with the valve leaflets, in this way improving
the robustness of the prosthesis.

2. IN-VITRO MODELLING OF THE LEFT HEART: STATE-OF-THE-ART
114
Figure 51: The Caltech's left heart pulsed flow simulator system (2006): A) Composition of
the in-vitro setup, B) left ventricular model suspended in a transparent box full of water, C)
close up of the ventricular model, the aortic and mitral valves and the inflow and outflow
tract. Intraventricular flow patterns which are visualized by fluorescent microparticles which
are illuminated by a laser sheet. D) Intraventricular streamlines of a transmitral jet which are
obtained by PIV. Figures A, B and C are adapted from [163] and D from [166].
Figure 52. Design of a bi-leaflet mitral bioprosthesis (top panel) composed of a saddle shaped
annulus made of Nitinol and two leaflets made of pericardial tissue (bottom panel). Adapted
from [165].

2. IN-VITRO MODELLING OF THE LEFT HEART: STATE-OF-THE-ART
115
2.4.15 Department of Mechanical Engineering, Bari, Italy (2006)
In Italy, Rasponi and colleagues developed a left ventricular model with
special attention to mimic natural wall deformation [167]. Generally, left
ventricular models are made of a flexible sac with a truncated ellipsoid shaped
geometry and suspended in a rigid transparent outer box which is connected
to a piston pump. When water is extracted from the outer closed box, the
flexible sac expands to its end diastolic state and contracts to its end systolic
state when the water is pumped back. Although it is well demonstrated that
these models provide adequate pump function, none of these models
particularly mimic the physiological wall deformation patterns for it is
difficult to predict the wall deformation patterns of the model.
Rasponi and colleagues are the first to pay attention to modelling
morphological variations which may be expected to influence the
hemodynamics. They designed a novel heart simulator with a ventricular
model which deformed in a more physiological mode, by using a composite
structure composed of a silicone sac reinforced by circumferential bands. As
a result of this material composition, the ventricular deformation was forced
in a longitudinal direction, which is illustrated in Figure 53.
The ventricular sac was designed using structural FEM analyses and
was prototyped for experimental validation of mitral valve surgical
corrections [167].
Figure 53: The left ventricular model of Rasponi and colleagues (2006). This figure illustrates
the fair agreement between numerical model (left panel) and the ventricle prototype (right
panel) at the end diastolic phase. A prominent longitudinal deformation is realized using
reinforcement of the silicone wall by circumferential bands. Adapted from [167].
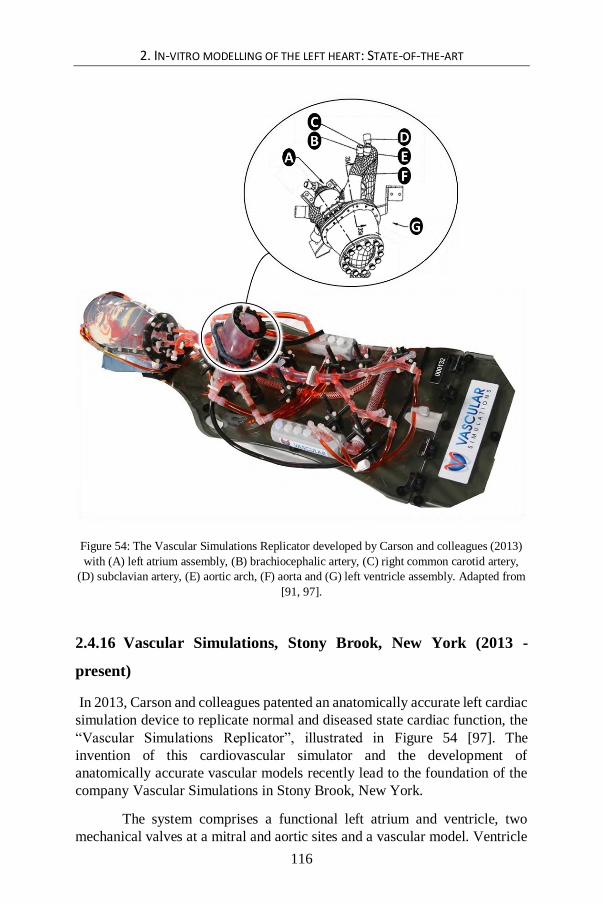
2. IN-VITRO MODELLING OF THE LEFT HEART: STATE-OF-THE-ART
116
Figure 54: The Vascular Simulations Replicator developed by Carson and colleagues (2013)
with (A) left atrium assembly, (B) brachiocephalic artery, (C) right common carotid artery,
(D) subclavian artery, (E) aortic arch, (F) aorta and (G) left ventricle assembly. Adapted from
[91, 97].
2.4.16 Vascular Simulations, Stony Brook, New York (2013 -
present)
In 2013, Carson and colleagues patented an anatomically accurate left cardiac
simulation device to replicate normal and diseased state cardiac function, the
“Vascular Simulations Replicator”, illustrated in Figure 54 [97]. The
invention of this cardiovascular simulator and the development of
anatomically accurate vascular models recently lead to the foundation of the
company Vascular Simulations in Stony Brook, New York.
The system comprises a functional left atrium and ventricle, two
mechanical valves at a mitral and aortic sites and a vascular model. Ventricle

2. IN-VITRO MODELLING OF THE LEFT HEART: STATE-OF-THE-ART
117
and atrium contractions are realized by a pneumatic actuator module, powered
by an electric motor. This actuation system allows accurate simulation of a
wide range of heart states, going from normal to severely pathological heart
conditions.
Unique for this system is that it duplicates the cardiac cycle and blood
flow in a patient specific vasculature including the great vessels arising from
the aortic arch and the cerebrovasculature, as shown in Figure 54. Another
exclusive feature is the silicone aorta with a built-in compliance which allows
replication of the natural pressure waveforms in the aorta.
The system is developed for cardiovascular training and testing
medical devices, for example for interventionists who can train their
procedures with the identical anatomy and pathology that they will ultimately
treat in clinical practice.
2.4.17 Materialise NV, Leuven (2013 – present)
The current digital revolution brings forth a wide range of new applications
which also foster the creation of benchtop models. As such, the ability of 3D
reconstruction of anatomical structures from medical images, the fast
development of 3D printing techniques and anatomically-like 3D printing
materials are leading to more advanced and anatomically accurate
cardiovascular benchtop models.
Recently, Materialise NV, Leuven, one of the leading companies in
this field, started a 3D printing service for patient-specific cardiovascular
anatomical models, the so-called HeartPrint®. These models can be used to
assist in the pre-operative planning, in planning complex interventional
procedures, and as functional benchtop models for testing medical devices.
Figure 55 illustrates two recent realizations. The first realization is a
transparent rigid heart model which is an anatomically realistic and accurate
representation of a human heart. The second example is realized by multi-
material 3D printing (using the Objet Connex 3D printer, Stratasys Ltd.,
Minnesota), which is a calcified model of the aortic valve. This valve model
is composed of both the tissue, which is a flexible material, as well as the
calcification, which is a rigid material. In order to 3D print patient-specific
highly flexible and tear-resistant cardiovascular models [93], Materialise
developed the HeartPrint® Flex process.
In 2012, Little and colleagues developed a patient-specific
cardiovascular simulator at the Methodist Hospital in Houston, Texas in

2. IN-VITRO MODELLING OF THE LEFT HEART: STATE-OF-THE-ART
118
collaboration with Materialise, the so-called the ‘Heart Beat Simulator™’
[92]. This pulse duplicator is equipped with a functional calcified model of
Materialise and is made cardiac MRI-compatible using a long drive shaft and
a flow loop which does not contain any ferrous metals, as illustrated in Figure
56. To date, the Heart Beat Simulator has been used to get more insight in risk
factors of deployed Transcatheter Heart Valves (THVs) [94].
Figure 55: The left panel illustrates a transparent rigid anatomically realistic and accurate
representation of a human heart. The right panel illustrates a printed calcified aortic valve.
Adapted from [168].
Figure 56: The left panel illustrates a functional multi-material 3D printed calcified aortic
valve which was built in the Heart Beat Simulator. The right panel shows the MRI compatible
set up including the software and actuator, the MRI-compatible dive shaft and the MRI-
compatible flow loop. Adapted from [92].

2. IN-VITRO MODELLING OF THE LEFT HEART: STATE-OF-THE-ART
119
2.5 CONCLUSION
This chapter describes the history of cardiovascular simulator development
which took place over the past 55 years. This history illustrates the major
strides forward and the wide range of approaches that has been taken to make
in-vitro cardiovascular systems. Also, in briefly reviewing their versatile
applications, it can be concluded that such in-vitro cardiovascular models have
become an indispensable tool to enhance cardiovascular insights, to advance
procedures and to develop medical devices, not only in the past and the
present, but that it will only become even more important in the (near) future.
Finally, our review also highlights the complexity of in-vitro cardiovascular
modelling. As a consequence, this state-of-the-art information is a valuable
source of inspiration to define design criteria for new cardiovascular
simulators. In the following chapter, we discuss the limitations of the current
models in order to optimize design criteria for a new generation of models.

120

121
Chapter 3 Critical evaluation and practical guidelines for optimizing current models
Critical evaluation and practical guidelines for
optimizing current models
This chapter formulates practical guidelines to accommodate for the
challenges in present in-vitro left heart modelling, as described in the state-of-
the-art overview of Chapter 2.
3.1 INTRODUCTION
In Chapter 2, we presented a state-of-the-art overview to demonstrate the wide
range of in-vitro approaches and models that were developed during the past
55 years of cardiovascular simulator history. In this chapter, we critically
evaluate the current approaches and their accompanying concepts in light of
what (we believe) the field needs to further optimize such in-vitro models. We
summarized these possibilities and general shortcomings of the current state-
of-the-art of in-vitro cardiovascular modelling in Table 3. We tried to
summarize the limitations across the different models in one overview table.
In the discussion of this chapter, we will hence also describe these limitations
across the different models, instead of separately for each of the discussed
models. This wide range of limitations clearly reflects the complexity of in-
vitro cardiovascular modelling. However, this list of limitations also provides

3. CRITICAL EVALUATION AND PRACTICAL GUIDELINES FOR OPTIMIZING CURRENT MODELS
122
us with valuable information and design challenges to define clear practical
guidelines to advance cardiovascular simulator optimization.
In this chapter, the critical evaluation and definition of practical
guidelines are first described for left ventricular muscle modelling, then for
mitral valve apparatus modelling, finally for valve plane optimization in the
context of integrating ventricular and mitral valve models into a left heart
model. We will close this chapter with a schematic summary of the various
practical guidelines (PG1 – PG8 Table 2). These guidelines will form the well-
informed basis for the in-vitro left heart model optimization steering this
dissertation project.
3.2 LIMITATIONS AND PRACTICAL GUIDELINES RELATED TO LEFT
VENTRICULAR MUSCLE MODELLING
In this section, we describe five major limitations of the current left ventricular
models and translate these limitations into corresponding guidelines that
should be targeted in order to attain more realistic ventricular models. Such
models should be primarily designed to accomplish a more realistic anatomy
(limitations 1 to 3) of the complex left ventricular wall anatomy. This left
ventricular wall is in reality thick-walled, (1) and is physiologically
characterized by anisotropic wall properties (2) and a composition of
contractile elements (3). Moreover, such models should be assigned to achieve
a more accurate mimicking of the physiological events of the natural left
ventricle (limitations 4 and 5). These include – among others – the complex
wall deformation patterns in terms of longitudinal, circumferential and radial
deformation (4), and the twisting motion (5).
3.2.1 A more realistic thick-wall
The first major limitation of the current collection of cardiovascular simulators
is that almost all in-vitro cardiovascular simulators have modelled the natural
thick left ventricular muscular wall by a thin-walled membrane. The left
ventricular wall, however, is more anatomically correctly modelled by a thick-
walled approach. One exception to the common use of thin-walled membranes
is the phantom designed by Claessens et al. [98], who designed a thick-wall
made from a Polyvinylalcohol solution. Unfortunately, the systolic phase was
not modelled in this study, therefore, we categorized this model not as a
cardiovascular simulator but as a side project to the work of Verdonck et al.
and Segers et al. (see § 2.4.11). Hence, we identify the implementation of a

3. CRITICAL EVALUATION AND PRACTICAL GUIDELINES FOR OPTIMIZING CURRENT MODELS
123
thick wall as a first practical guideline (PG1) that should be taken into
account when searching to optimize in-vitro models of the left ventricle.
3.2.2 Anisotropic wall properties
The second limitation of current left ventricular models relates to the use of
isotropic wall materials (e.g. silicone). The natural cardiac wall, however,
consists of interweaving bundles of cardiac muscle fibers leading to
anisotropic wall properties. To our knowledge, only one study has used
anisotropic material, i.e., the study of Rasponi et al. [167]. This model was
unique in modelling anisotropy by integrating fibers into the thin-walled
silicone left ventricular model, yet performed less at optimizing anisotropy
towards the modelling of the natural global wall deformation patterns.
Therefore, the second guideline (PG2) for optimizing cardiovascular
simulators to attain more anatomically correct left ventricle models is to try
including the anisotropic wall properties of the natural ventricular wall.
These anisotropic wall properties are also directly related to the wall
deformation patterns, and are hence also closely intertwined with the
following limitations.
3.2.3 Modelling active contractile wall elements
As a third limitation, the present left heart simulators are all confined to
modelling the muscular contraction by a passive membrane. These passive
movements stand far away from the natural active movements of the human
ventricular wall. Hence, the natural muscular contraction and relaxation of the
ventricle are important active phenomena which remain un-modelled in
current left heart models. Therefore, our third practical guideline (PG3),
needed to mimic natural wall contraction, is to invent left ventricular models
which include an active contractile wall containing contractile elements.
3.2.4 Modelling multiple global wall deformation patterns
Closely related to the use of passive thin-walled membranes made of isotropic
material, is that no simulator to date has been able to simultaneously model
the global wall deformation patterns in terms of longitudinal, circumferential,
and radial deformation. Hence, we identify this issue as a fourth major
limitation. As can be inferred from Table 3, longitudinal or circumferential
deformation is not entirely absent in most models, yet these processes remain
rather limited because they occur mainly uncontrollable. More particularly,
though the general thin-walled membrane models include a circumferential as
well as longitudinal deformation, the wall deformation remains uncontrolled,
as also mentioned in the first limitation. For the thin-walled left ventricular
3. CRITICAL EVALUATION AND PRACTICAL GUIDELINES FOR OPTIMIZING CURRENT MODELS
124
models, differences in wall thickness are negligibly small. Therefore, radial
deformation can be considered absent in these models. This issue of
physiological likeness in terms of morphological variations of the left
ventricular wall has only received little attention in the history of
cardiovascular simulator development. This is surprising given that wall
movements are found to be sensitively related to the hemodynamics of
ventricular filling [167]. Therefore, our fourth practical guideline (PG4) for
optimization left heart models is the mimicking of global ventricular wall
deformation patterns including longitudinal, circumferential as well as
radial deformation. To date, we identified only one study which gave
attention to the controllable modelling of one of these three wall deformation
patterns. Rasponi et al. [167] were able to model the longitudinal component,
in a controlled manner, by integrating circumferential reinforcements.
However, to the best of the author’s knowledge, no report so far reported
modelling the circumferential or radial components in a controlled manner,
nor the combination of all three global wall deformation patterns together.
3.2.5 Including the twisting motion
Finally, the twisting motion is a fourth deformation pattern of the natural left
heart that – to our knowledge – has not been implemented in current
cardiovascular simulators. In contrast to the previous aspect, many authors
have commented and cited this limitation. Rausch, for example, did mention
this limitation in his doctoral dissertation (2009) as following: “even though
the Flexible Bag Model has been shown to model wall motion, its “left
ventricle” does not undergo the typical … twisting motion that has been
visualized in-vivo” ([5] page 90). Also, Claessens et al. mentioned this
limitation for their thick-walled left ventricular model: “we did not account
for the myocardial preferential fiber direction which makes a real ventricle
heterogeneous and transversely isotropic. Therefore, an untwisting motion
during diastole could not be simulated.” ([98] page 336). Also more recently,
Falahatpisheh et al. noted this limitation about the Caltech’s Left Heart Pulsed
Flow Simulator in a study to assess cardiac fluid dynamics in-vitro by high-
speed particle image velocimetry. These authors noted that “the silicone LV
model cannot generate the twisting motion similar to the left ventricle, which
may affect the flow-field” ([163] page 6). The identification of this need by
several research groups highlights that there remains a great challenge for new
left heart models to simulate the natural torsional motion. Hence, we identify
the inability to simulate the twisting motion which is present in the natural left
heart (and involves a complex wall deformation pattern) as a fifth and final
major limitation. Correspondingly, our fifth practical guideline (PG5) for
optimizing future left heart models is to take on the challenge to include the
twisting motion.

3. CRITICAL EVALUATION AND PRACTICAL GUIDELINES FOR OPTIMIZING CURRENT MODELS
125
3.3 LIMITATIONS AND PRACTICAL GUIDELINES RELATED TO THE
MITRAL VALVE
In this section, we discuss the limitations concerning mitral valve models and
formulate corresponding guidelines for the optimization of these models. The
biggest limitation in this regard relates to the absence of modelling the most
relevant anatomical features of the mitral valve, such as the two main leaflets,
a saddle-like annulus, the chordae tendineae and the two main papillary
muscles. Hence, this is translated in one important practical guideline.
3.3.1 More anatomic features of the mitral valve
As described in the previous chapter, one critical application of left heart
simulators today is to test new prosthetic heart valves. In case of aortic valve
testing, the setup is generally equipped with a mechanical prosthetic heart
valve at the mitral site [66, 75, 78, 79, 82, 84, 87-89, 91, 92, 95, 99, 100, 103,
124, 145, 160, 165]. This approach benefits the setup durability, which is of
crucial importance in durability-heart valve testing settings that have no
special attention for the mitral valve apparatus. However, such mechanical
prosthetic heart valves are in general not great representatives of anatomically
correct mitral valve models.
In recent years, we identify a slow but steady growing interest in
modelling more natural and anatomically correct in-vitro mitral valve models
as an alternative for using mechanical prostheses. The study of interactions of
flow and movements with a more natural valve plane is important as it may
foster advanced insights in the working of a natural left heart. For example, in
2006, Kheradvar et al. developed a more natural accurate mitral valve
prosthesis by modelling the saddle-like annulus and the flexible leaflets.
However, when looking into more details to this model - in the context of
more natural in-vitro mitral valve modelling - this model still lacks elementary
features of the natural valve, such as the chordae tendineae and the papillary
muscles, and as such, the dearth of these elements can be considered essential
when pondering about natural mitral valve functioning. Knowing that the
papillary muscles are mostly expressed by rough anatomical left ventricular
wall structure, it may be expected that the papillary muscle movements will
sensibly influence the hemodynamics of ventricle filling. Therefore, we
identify it as necessary to account for these anatomical features to attain a
more accurate modelling of the mitral valve.
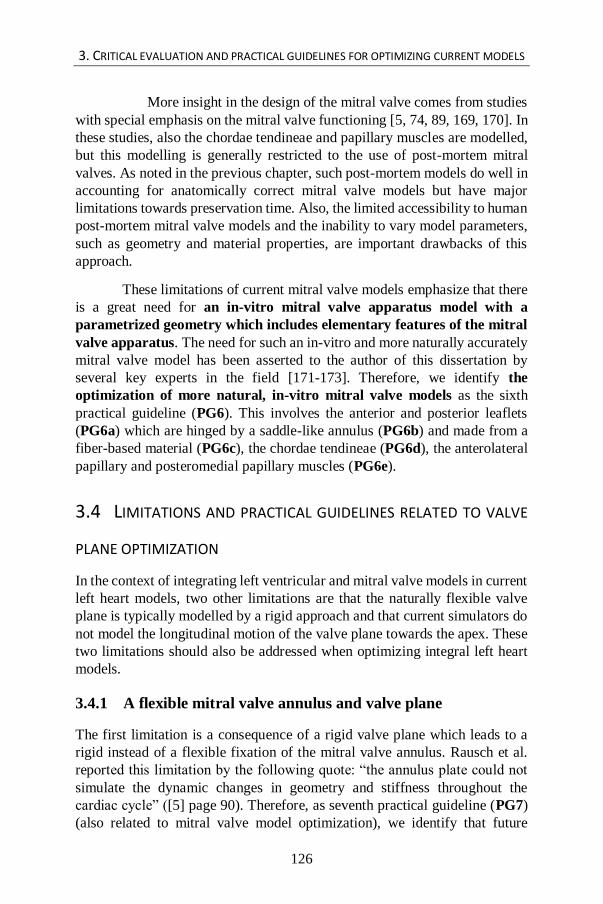
3. CRITICAL EVALUATION AND PRACTICAL GUIDELINES FOR OPTIMIZING CURRENT MODELS
126
More insight in the design of the mitral valve comes from studies
with special emphasis on the mitral valve functioning [5, 74, 89, 169, 170]. In
these studies, also the chordae tendineae and papillary muscles are modelled,
but this modelling is generally restricted to the use of post-mortem mitral
valves. As noted in the previous chapter, such post-mortem models do well in
accounting for anatomically correct mitral valve models but have major
limitations towards preservation time. Also, the limited accessibility to human
post-mortem mitral valve models and the inability to vary model parameters,
such as geometry and material properties, are important drawbacks of this
approach.
These limitations of current mitral valve models emphasize that there
is a great need for an in-vitro mitral valve apparatus model with a
parametrized geometry which includes elementary features of the mitral
valve apparatus. The need for such an in-vitro and more naturally accurately
mitral valve model has been asserted to the author of this dissertation by
several key experts in the field [171-173]. Therefore, we identify the
optimization of more natural, in-vitro mitral valve models as the sixth
practical guideline (PG6). This involves the anterior and posterior leaflets
(PG6a) which are hinged by a saddle-like annulus (PG6b) and made from a
fiber-based material (PG6c), the chordae tendineae (PG6d), the anterolateral
papillary and posteromedial papillary muscles (PG6e).
3.4 LIMITATIONS AND PRACTICAL GUIDELINES RELATED TO VALVE
PLANE OPTIMIZATION
In the context of integrating left ventricular and mitral valve models in current
left heart models, two other limitations are that the naturally flexible valve
plane is typically modelled by a rigid approach and that current simulators do
not model the longitudinal motion of the valve plane towards the apex. These
two limitations should also be addressed when optimizing integral left heart
models.
3.4.1 A flexible mitral valve annulus and valve plane
The first limitation is a consequence of a rigid valve plane which leads to a
rigid instead of a flexible fixation of the mitral valve annulus. Rausch et al.
reported this limitation by the following quote: “the annulus plate could not
simulate the dynamic changes in geometry and stiffness throughout the
cardiac cycle” ([5] page 90). Therefore, as seventh practical guideline (PG7)
(also related to mitral valve model optimization), we identify that future

3. CRITICAL EVALUATION AND PRACTICAL GUIDELINES FOR OPTIMIZING CURRENT MODELS
127
models should take into account a flexible instead of a rigid valve plane
which allows the suspension of a flexible mitral annulus, while keeping
the actuation functionality. Such a more flexible suspension could be
realized in two ways. The first way is to implement a flexible valve plane,
instead of the rigid valve plane of the current left heart models, while keeping
the actuation functionality intact. This method was applied by Kheradvar et
al. [165, 166]. Although this approach allowed the integration of a flexible
mitral annulus, the authors made use of mechanical prosthetic heart valves
which involves a rigid annulus. The second way would be to invent an
alternative actuation principle which allows the integration of a flexible valve
plane. We will take up both challenges in the current dissertation.
3.4.2 Including the apical-basal movement of the valve plane
A second limitation related to the current state-of-the-art left heart models, is
the hindered longitudinal motion of the valve plane towards the apex. For
example, Rausch et al. mention that “… even though the Flexible Bag Model
has been shown to model wall motion, its ‘left ventricle’ does not undergo the
typical apical-basal movement … that has been visualized in-vivo” ([5] page
90). This typical apical-basal movement refers to the valve plane movement
in the direction of the apex during systole. Also Claessens et al. observed a
similar limitation in their model: “due to technical reasons, the phantom is
required to be attached at its basal side, while in a real ventricle, the
atrioventricular plane moves up and down. “ ([98] page 336).
As mentioned before, Rasponi et al. were able to simulate a apical-
basal movement by a longitudinal deformation of their left ventricular model
[167]. However, the longitudinal valve plane motion towards the apex during
systole was hindered by the rigid valve plane suspension, resulting in a non-
physiological apex-to-valve-plane movement.
The technical reasons that Claessens et al. mention are about the
suspension assembly, which is commonly used in current left heart simulators.
The suspension assembly generally comprises a rigid valve plane which
suspends a thin walled flexible ventricular sac and mounted to the rigid
container [5, 66, 79-84, 87-92, 96, 99, 127, 145, 160]. The heart cycle is
realized by changing the volume (volume driven systems) and/or pressure
(pressure driven systems) by an external power source. To enable stable
control of the left ventricular actuation during the heart cycle, the left
ventricular model is rigidly suspended to the closed box, which hinders the
motion of the valve plane and prohibits annuli dynamics. As such, it is not
possible for current left heart models to model the typical apical-basal motion
of the valve plane. In order to allow motion of the valve plane, new left heart

3. CRITICAL EVALUATION AND PRACTICAL GUIDELINES FOR OPTIMIZING CURRENT MODELS
128
models need to be invented with novel ways of ventricle actuation
mechanisms. This is the eighth guideline (PG8) and is hence related to the
previous practical guideline about valve plane optimization of left heart
models.
3.5 CONCLUSION
In this chapter, we critically highlighted the possibilities and limitations of the
current state-of-the-art of cardiovascular simulators. These critical remarks
were formulated across models, yet, they are summarized and listed for each
of the discussed studies in Table 3.
The wide variety of heart models and accompanying model
limitations emphasizes that - even in these advanced technological times - it
is still extremely challenging to accurately simulate the complex physiological
conditions that occur in the human left hart and arterial system with a
cardiovascular simulator [95]. Because the mimicking of anatomical
structures and physiological events are crucial for advancing medical device
testing (and our knowledge of human heart functioning), there remains
however great value in developing in-vitro test models which mimic the
reality as closely as possible. For this reason, the development of more
realistic in-vitro test models is a well-defined recommendation of the FDA in
their guideline document about medical device testing [2].
We distinguish two major challenges in designing and attaining such
more realistic in-vitro models. The first challenge is to mimic the anatomical
structures as closely as possible. The second challenge is to attain the
duplication of physiological events, to attain a more accurate mimicking of
the physiological events in their natural settings. Relevant design criteria for
both research challenges are mentioned in Table 3.
The overview in Table 3 enables multiple conclusions regarding the
current state-of-the-art of cardiovascular simulators. First, it appears that the
current cardiovascular models do account for only a few of the anatomical
features and physiological events that are mentioned in the table. Once again,
this underscores the need for designing and developing more naturally
accurate left ventricular models.
Second, as of yet, no study has been found that describes an in-vitro
mitral valve model that includes the elementary features which are listed in
the table. Once there will be more naturally correct models of the left ventricle
and mitral valve, an integrative approach combining these models, such an in-
vitro naturally correct left heart model will be of great value, since it is well

3. CRITICAL EVALUATION AND PRACTICAL GUIDELINES FOR OPTIMIZING CURRENT MODELS
129
known that there is a close physiological interaction between the left ventricle
and the mitral valve.
Third, Table 3 shows that, concerning the left ventricular models,
there is a lack of studies that account for the radial wall contraction and
twisting motion of the left ventricular wall, nor are the thick-walled structure
and contractile elements included. There are four studies [74, 75, 78, 121]
which did not include a thin-walled left ventricular model and therefore, none
of the left ventricular anatomical features nor physiological events of Table 3
were present. All other studies did implement a thin-walled model and
mimicked the longitudinal as well as the circumferential deformation
components of the left ventricle; however this wall deformation remains
unpredictable. Only one study accounted for the anisotropic wall properties
and the longitudinal component of left ventricular wall contraction [167]. In
addition, it is noteworthy to see that the more recent studies are making use of
medical images to define their ventricular model geometries.
Fourth, regarding the mitral valve models, Table 3 shows that none of
the in-vitro mitral valve models includes all elementary parts of the mitral
valve apparatus. The models which are generally used are post-mortem valve
models; however, functional decay and tissue decomposition of postmortem
tissue, together with the inability to vary model parameters, still denote an
important issue potentially jeopardizing the applicability of this approach.
From the various limitations described in this chapter, we can isolate
three general needs related to cardiovascular in-vitro modelling: (NEED 1)
there is a need for more naturally correct left ventricular models, (NEED
2) there is a need for in-vitro mitral valve models including the basic
anatomical features, (NEED 3) there is a need for in-vitro left heart
models integrating a left ventricular model and a mitral valve model
including the basic anatomical features. An overview of these needs and the
corresponding practical guidelines are summarized in Table 2. This set of
practical guidelines is crucial for the invention and optimization of
cardiovascular in-vitro models to bring cardiovascular modelling to the next
level. Based on this overview, new in-vitro models of the left ventricle, the
mitral valve, and the left heart are developed and presented in the following
chapters.

3. CRITICAL EVALUATION AND PRACTICAL GUIDELINES FOR OPTIMIZING CURRENT MODELS
130
Table 2: Overview of the practical guidelines for designing a more natural accurate in-vitro
left heart model.
PG1 The left ventricular wall is more naturally correctly modelled by a thick-walled approach
PG2 Models of the left ventricle are more anatomically correctly represented by including the
anisotropic wall properties of the natural wall.
PG3 Natural left ventricular wall contraction can be modelled by integrating active contractile
elements into the left ventricular wall model.
PG4 Left heart models can be optimized by mimicking the global ventricular wall deformation
patterns such as longitudinal (PG4a), circumferential (PG4b) as well as radial deformation
(PG4c).
PG5 The global natural wall deformation of the left ventricular wall is better represented by the
inclusion of the twisting motion which is present in the in-vivo left heart.
PG6 The requirements of a basic in-vitro mitral valve can be described as a reproducible mitral valve
apparatus model with a parametrized geometry and including all basic features of the mitral
valve apparatus, such as the anterior and posterior leaflets (PG6a), the saddle-like annulus
(PG6b), fiber-based material (PG6c), the chordae tendinae (PG6d) and the anterolateral and
posteromedial papillary muscles (PG6e).
PG7 A more naturally correct valve plane approach for mitral valve modelling is obtained by
implementing a flexible instead of the rigid valve plate which allows the suspension of a flexible
mitral valve plane, while keeping the actuation functionality.
PG8 A left heart model is more naturally correctly represented by allowing the motion of the valve
plane by the invention of novel ways of ventricle actuation mechanisms.
NEED 3. An integrative approach, combining the left ventricular and the mitral valve models,
including the basic anatomical features
Guidelines towards designing a more naturally correct in-vitro model of the left heart
NEED 1. More naturally correct left ventricular models
NEED 2. An in-vitro mitral valve model including the basic anatomical features

3. CRITICAL EVALUATION AND PRACTICAL GUIDELINES FOR OPTIMIZING CURRENT MODELS
131
Table 3: An overview of cardiovascular simulators is given in the context of practical
guidelines. Different types of mitral valves are applied, mechanical (M), bioprosthetic (B) and
post-mortem (P), but no in-vitro valve model yet. Index: ‘–’ absent, ‘~’ present but limited, ‘v’
present, ‘ ’ not applicable.

132

133
Chapter 4 Design methodology
Design methodology
This chapter discusses the general design process that was used in this
dissertation to produce original ideas in a structured manner and to realize
these ideas in an effective way. The applied design methodology is based on
the Double Diamond Model [174] which consists of two paired divergence-
convergence phases. The first divergence-convergence phase starts with a
broad and in-depth exploration of the literature which is then subsequently
analyzed to identify the design needs and to define practical guidelines that
provide an answer to these needs. The second divergence-convergence phase
entails the process in which multiple new ideas are generated to accommodate
the identified design needs and from which, in a subsequent step, the best ideas
are selected to become realized in final concepts.
In Chapters 1, 2, and 3 (literature reviews on the natural left heart and
current state-of-the-art of cardiovascular simulators; distillation of research
needs and practical guidelines), we extensively described the first divergence-
convergence phase of this Double Diamond Model. In this Chapter, we provide
more details on the second divergence-convergence phase, i.e., the generation
of new ideas and selection of best concepts, respectively.
From these chosen concept ideas, solutions are further developed into the
actual in-vitro models, as described in Chapters 5 to 12.

4. DESIGN METHODOLOGY
134
4.1 INTRODUCTION
The engineering design process is a tool that engineers use in creating
functional products according to a structured method. A more comprehensive
understanding of engineering design processes can help creative designers to
achieve more creativity, to make faster decisions and to boost the innovation
process [175]. To date, a wide array of different models on engineering design
processes is available. Most dominant in the literature is the ‘linear style’
model, in which a design engineer is assumed to follow a number of
predetermined steps [175]. These steps are labeled in various ways across
models but generally involve (1) the establishment of a need phase, (2) an
analysis of task phase, (3) a conceptual design phase, (4) an embodiment
design phase, (5) a detailed design phase, and (6) an implementation phase
[175].
In this dissertation, we applied a ‘divergent-convergent type’ of
engineering design model. This model slightly differs from the described
traditional ‘linear style’ model as it assumes an integrated evaluation of
multiple design ideas and a subsequent selection of these ideas and concepts
[175]. This model hence separates a period of generating ideas from a period
of evaluating ideas. In the idea generating period, creativity is explicitly
encouraged by processes as brainstorming, horizontal imagination (i.e.,
generating many ideas being unconcerned with the detailed implementation
of them), and lateral thinking (i.e., solving problems using reasoning that is
not immediately obvious nor obtainable by only using traditional step-by-step
logic).
More precisely, the design methodology applied in this dissertation
closely resembles the so-called ‘Double Diamond’ design process model,
created by the British Design Council [174]. The Double Diamond model is
based on case studies of industrial design procedures applied by eleven global
brands and is proposed "to champion great design that improves lives and
makes things better” [176]. The Double Diamond model graphically
represents the design process by two diamonds (i.e., rhombuses) in a line
(Figure 57), with each diamond reflecting both a divergent and convergent
phase.
The Double Diamond model identifies three critical points (Problem
– Problem Definition – Solution) and four main stages (Discover – Define –
Develop – Deliver) across the whole engineering process. The design process
is initiated by a problem, question or hypothesis, which is the first critical
point, ‘Problem’, the starting point of the first diamond. The divergence-
4. DESIGN METHODOLOGY
135
convergence phase of this first diamond results in the second critical point,
‘Problem Definition’, which is a clear description of the problem to be solved.
This ‘Problem Definition’ is the starting point of the divergence-convergence
phase of the second diamond which finally results in the ‘Solution’, which is
the output that meets the design criteria of the Problem Definition.
Each diamond has two stages. The first stage of the first diamond is
the ‘Discover’ phase and marks the start of the project. This begins with an
initial problem (critical point ‘Problem’), idea or inspiration, often sourced
from a discovery phase in which user needs are identified. The Discover stage
is a phase of divergent thinking. The second stage of the first diamond is the
‘Define’ phase, in which interpretation and alignment of the identified needs
create a clearer definition of the problem. The Define stage is a phase of
convergent thinking resulting in the critical point ‘Problem Definition’.
The third stage is the ‘Develop’ phase and denotes the divergent
thinking phase of the second diamond. It marks a period of development
focusing on multiple concepts through creative thinking, brainstorming and
iteration. This ‘Develop’ stage includes a large number of iteration loops
which are characterized by three phases: (1) prototyping a concept or idea, (2)
testing the prototype, and (3) refining the prototype based on testing. This
iteration loop is repeated until a satisfactory result is achieved. Prototyping
and testing can occur virtually, e.g., by using CAD and CAE, or physically,
e.g., by using rapid production techniques. The iteration process of physical
prototyping can be done via a hands-on approach through trial and error
because this generates quick solutions during a process of doing. The final
stage of the second diamond is the ‘Deliver’ phase, where the final concept is
chosen and further refined by the process of iteration. The Deliver phase is a
phase of convergent thinking in a structured manner that typically occurs in
close communication with the expert-stakeholder panel. A frequently used
tool hereby is the trade-off table, which is a form of a prioritization matrix in
which alternative concepts are scored against the formulated design criteria.
The scoring is obtained by the summation of the scores of the different criteria,
either in symbol form (for example: ++, +, +/-, -, --) or numerical form (with
an additional weight factor). Trade-off tables are suitable for evaluation of
alternative concepts and for illustrating the evolution of the iterative design
process. Based on this ‘Deliver’ process, one or more concepts are selected,
which is then denoted as the critical point ‘Solution’ in the Double Diamond
model.

4. DESIGN METHODOLOGY
136
4.2 GLOBAL DESIGN STRATEGY AND APPLICATION
Figure 58 shows the general design strategy of this dissertation project which
closely follows the logic of the described Double Diamond model. While the
original Double Diamond model is about the design and creation process of
one tangible object solution, this dissertation designed and developed various
solutions at multiple levels of the problem definition. Hence, an adapted
version of the Double Diamond model is needed to provide an adequate
framework of the applied design methodology in this dissertation.
This adapted version also represents two main diamonds in one line
and contains the same three critical points and four stages of thinking.
Notably, in our approach, the two convergence phases of the Double Diamond
Model resulted in more than one outcome: the first diamond resulted in the
formulation of three needs (Problem Definition) and the second diamond
resulted in multiple in-vitro models (Solutions). As a result, the right-hand
parts of the two diamonds in our model are flattened (which is actually a more
realistic representation of a diamond than the original rhombuses from the
Double Diamond model).
The first diamond (Key-Diamond I) represents one divergence-
convergence loop, while the second diamond (Key-Diamond II) is a collection
of many iteration loops and sub loops, because the ‘Develop and Deliver’
processes were completed at multiple levels of the problem definition (needs).
This is visualized in Figure 58 by three sub-diamonds (Sub-Diamonds I, II,
III), denoting the first generation of concepts developed to accommodate each
identified need from Key-Diamond I. From these first generation ideas, seven
concepts were selected for further iterative developments. These second
generation concepts are visualized by blue rhombuses in Figure 58, with the
rhombus shape representing the convergence to one single solution. For the
first sub-diamond, three concepts were chosen from the second generation for
further iterative developments. These third generation concepts are visualized
by pink rhombuses in Figure 58. All sub-diamonds in Key-Diamond II
comprised a number of iterations (ranging from one up to twenty-five),
resulting in a total of 64 iteration loops across the various design solutions.
In what follows, the methodology applied in each diamond of this
adapted Double Diamond framework is described in more detail.

4. DESIGN METHODOLOGY
137
Figure 57: The Double Diamond engineering design process. The red dots represent the
following critical points: ‘Problem’, ‘Problem Definition’ and ‘Solution’. Adapted from
[177].

4. DESIGN METHODOLOGY
138
4.2.1 Key-Diamond I: Discover and Define
Applied to this dissertation, Key-Diamond I starts from the first critical point
‘Problem’. This includes the context and general need for more realistic
modelling of left heart dynamics and is described in the Introduction section.
Subsequently, the ‘Discover phase’ (first stage) demands an in-depth
exploration of the literature and the market, to gather a divergent collection of
ideas and inspiration around the ‘Problem’ from which design needs can be
detected. The literature reviews of Chapters 1 and 2 serve this purpose by
describing the natural left heart structure and function and by providing a
state-of-the-art of cardiovascular simulator history. Next, the ‘Define’ phase
(second stage) includes the critical evaluation of this ‘Discover’ phase and the
distillation of the research needs and corresponding practical guidelines
(PG’s). This convergence phase is extensively described in Chapter 3 and has
resulted in a clear definition of three research needs and eight design
requirements for new in-vitro models (summarized in Table 2). This
corresponds to the second critical point ‘Problem Definition’ of the Double
Diamond framework.
4.2.2 Key-Diamond II: Develop and Deliver
From this Problem Definition point on, the Key-Diamond II continues with
the ‘Develop’ phase (third stage), which includes the generation of multiple
in-vitro model concepts by means of iterative loops. Consequently, the
‘Deliver’ phase (fourth stage) takes place where the final in-vitro model
concepts are chosen and iterated. Finally, the Double Diamond process ends
with the critical ‘Solution’ points, representing the proof-of-concepts of left
ventricle models LV1 – LV3, mitral valve models MV1 – MV2 and left heart
models LH1 – LH2, as well as the possible future concepts (LV4 – LV5, FH1
– FH2). These concept solutions are extensively described in the following
chapters of this doctoral dissertation (Chapter 5 to 12) and are also
summarized in Table 8. In the next sections of this Chapter, more details are
provided about the iterative processes that resulted in these concept solutions.
4.2.2.1 Sub-Diamond I: Iteration loop towards LV models
In this section, we describe the iteration loop that forms the root of all LV in-
vitro models (LV1 – LV5) developed in this dissertation. It first aims to
diverge to a wide range of ideas and subsequently to converge to a selection
of ideas with the highest potential to become proof-of-concepts. This approach
is primarily focused on the integration of contractile wall elements (PG3) –
which are generally anisotropic (PG2) – in a thick wall (PG1) in order to
generate natural wall deformation patterns (PG4 – PG5).

4. DESIGN METHODOLOGY
139
Figure 58: Global design strategy of this dissertation following the Double Diamond design
logic.
This sub-design process started with a brainstorm of all kinds of
contractile elements which can be assembled to eventually form an artificial
LV muscle. This brainstorm (also including horizontal imagination and lateral
thinking processes) resulted in twenty-five ideas by which force is induced
based upon different principles, including hydraulics/pneumatics, electrics
and thermal systems. Subsequently, these ideas were virtually prototyped
using CAD (SolidWorks, Dassault Systèmes SolidWorks Corp., Concord,
MA) and subdivided into groups, as summarized in Figure 59 and Figure 60.

4. DESIGN METHODOLOGY
140
After this divergence phase, the convergence phase took place. This
resulted in a general design decision to focus only on the hydraulic/pneumatic
models. This decision is based upon the fact that in general, hydraulic models
are more compatible with common measurement techniques (Ultrasound, PIV
and MRI). This decision was made rather early in the design process, after
consulting an expert panel of cardiovascular simulator designers as well as
experts in cardiovascular mechanics and material sciences.
From this subset of hydraulic concepts, a subsequent convergence
phase was applied by selecting the three most promising ideas for further
development. These three models are referred to as (1) the Honeycomb model,
(2) the model with Ellipsoid shaped chambers, and (3) the Stent Fiber model.
All of the five LV models which are described in the current dissertation (LV1
– LV5) , covering the whole range of the proposed practical guidelines
concerning more realistic LV models (PG1 – PG5), as summarized in Table
8, have their roots and/or inspiration within at least one of these three ideas.
Figure 59: Hydraulic/Pneumatic Models of the general design approach as basis for the
actuation mechanism of a LV model.

4. DESIGN METHODOLOGY
141
Figure 60: Electric and Thermal Models of the general design approach as basis for the
actuation mechanism of a LV model.
More particularly, the first idea of the Elliptical Chambers has been directly
used for the development of the active walled LV2 (presented in Chapter 6).
This LV2-model is also based upon a set of parallel oriented inflatable
chambers, but with the difference that this model is made of a welded polymer
multiple layer sheet instead of the silicone material as proposed in this earliest
Elliptical Chamber model. Further ideas based upon this original concept led
to two other models, i.e., the conceptual model LV5 (described in Chapter 12)
which is a PIV compatible version of LV2 by using a transparent type of
polymer sheet material and the more extensively explored LV3-model

4. DESIGN METHODOLOGY
142
(presented in Chapter 7) which is made of an anisotropic composite material.
The deformation mechanism idea behind the LV3 has been inspired by that of
the LV2-model, as such that the active cell elements, which are bordered by
weldments, are replaced by flexible regions, which are also bordered but now
by a fiber component. These design evolutions illustrate that new divergence-
convergence or ‘develop and discover’ phases can sprout from earlier design
ideas and hence can produce multiple iteration loops.
The second idea which advanced the design process is the Honeycomb
model, which went through an evolution process of five iterations and finally
led to the design of LV1 (presented in Chapter 5). This design process is
described in more detail in the following sections as it exemplifies the design
methodology used throughout this dissertation work.
Finally, the third selected idea is the Stent Fiber model. This concept
has been further explored while designing the conceptual models LV4 and
FH1, which are described in the future directions section of Chapter 12.
4.2.2.1.1 Example: Sub-Diamond I.I: Iteration loop towards the
design of LV1
As a more fine-grained illustration of the design evolution process used in this
dissertation, more details are provided on the iteration loop towards the design
of LV1. As noted above, the Honeycomb model idea was selected – among
others – for further design development. Consequently, it went through a
design evolution process of five further models, , which were labeled as the
‘Inner Tire model’, the ‘16 Segment model’, the ‘PorQpine model’, the
‘Marionette model’, and eventually, the ‘Frame model’. Each of these six
models was equipped with specific design characteristics. The design
evolution process is illustrated by the Trade-off table in Figure 61, showing
the comparison and evolution of models in function of design criteria. It
includes the Honeycomb model as baseline model and identifies the Frame
model as most promising model. As a result, this model was selected for
physical realization, which led to the development of model LV1 (as described
in Chapter 5). This design evolution was based on four specific design criteria:
well-functioning in terms of controlled wall deformation (1), practical
feasibility in terms of the hydraulic/pneumatic control (2) and production
aspects (3), and finally, a simple and straightforward (dis)assembly during
experiments (4).

4. DESIGN METHODOLOGY
143
Figure 61: Trade-off table shows the comparison and evolution in function of the design
criteria. It starts from the Honeycomb model and designates the Frame model as most
favorable model (which led to the LV1 model of Chapter 5).
In the following sections, we provide more details on the specific
characteristics of each model developed in an iterative process, in order to
attain a more realistic left ventricle.
The Honeycomb model
The composition of the original base model, the Honeycomb model, is shown
in Figure 62. It consists of a rigid outer shell and an inner flexible wall
(membrane). This wall is thick-walled and is made of hexagon-shaped
chambers, so that its structure looks similar to that of a honeycomb. By means
of over-pressure within in the chambers, the inner membrane becomes
compressed. As a result, the ventricular cavity changes its shape and more
particularly, this implies a reduction in volume of the ventricular cavity. In
contrast with currently thin walled LV models (see Chapters 2 and 3), this
model would allow the change in shape of the inner membrane in a controlled
manner, because the segments, from which the membrane is built up, can be
individually controlled. The higher the resolution of this segmentation, the
more accurate the achieved control of the shape change of the inner membrane
would be. In this Honeycomb concept, we realized the control of the inner
membrane by dividing the ventricular wall in about 100 chambers, which are
individually driven by compressed fluid/air. The control of these individual
chambers, however, is large, complex and expensive, since it requires a

4. DESIGN METHODOLOGY
144
separate control valve for each single chamber. Practically, this is not feasible,
so we looked for more simple models such as the Inner Tire model, which is
the first iteration model.
Figure 62: The Honeycomb model.

4. DESIGN METHODOLOGY
145
The Inner Tire model
Figure 63 shows the second model, the Inner Tire model, which is composed
out of a rigid shell, similar to the Honeycomb model, with an ellipsoid cavity
shape that more closely resembles the natural LV than the spherical shape
applied in the Honeycomb model. The model is equipped with three toroid
shaped inner cavities (inner tubes) which can be controlled with only three
valves. Therefore, this Inner Tire model involves a much simpler control
system than the previous model that needed about 100 valves. Yet, on the
other hand, wall control is drastically diminished in this model which is a
disadvantage that needs to be overcome. This brings us to the next model, the
Sixteen Segment model, which is the second iteration model.
Figure 63: The Inner Tire model.
The Sixteen Segment model
Figure 64 shows the third model, the Sixteen Segment model. In order to
report the location of pathology in the left ventricle, cardiologists have divided
the ventricular wall in 16 segments [178]. We opted to implement this
classification into the chamber geometry of this new model. The control then
consists of 16 valves, which is still far more feasible that the 100 valves of the
original Honeycomb model. Nevertheless, the number of valve controls
remains a thorny issue. Although this number of valves can be reduced to 3
(Inner Tire model) or 16 (Sixteen Segment model), we reckoned that the
control by one single control valve would be much easier and more cost
efficient. The challenge is thus to develop a model which is controlled by only
one control valve, while keeping the ability to control the shape change of the
inner membrane. The solution to this challenge was conceived in the following
model, the PorQpine model, which is the third iteration model.

4. DESIGN METHODOLOGY
146
Figure 64: The Sixteen Segment model.
The PorQpine model
Figure 65 presents the fourth model, which was labeled as the PorQpine model
as it is reminiscent of the appearance of a porcupine by the numerous bars
which are spread over the inner membrane surface. In this model, the ribs of
the individual chambers from the Sixteen Segment model have been replaced
by sticks because of two reasons. First, all segments (chambers in the former
models) are now connected to each other and the compressed fluid/air can
penetrate to all segments. As a consequence, this model contains only one
chamber that requires only one single control valve, which simplifies the
control system and lowers the cost, while still keeping control over the 16
segments. The second reason is that the firming action of the separate sticks
is less than the firming action of the ribs in all previous chamber models. This
enhances the control over the LV model wall deformation. Nonetheless, this
PorQpine design is quite complex in terms of practical feasibility. Hence, the
next challenge is to design a model that, in addition to the controlled
deformation and control through a single control valve, enhances the practical
feasibility towards materializing the model and to allow straightforward
(dis)assemblies during experiments. A solution is found in the next model, the
Marionette model, which is the fourth iteration model.

4. DESIGN METHODOLOGY
147
Figure 65: The PorQpine model.

4. DESIGN METHODOLOGY
148
The Marionette model
Figure 66 depicts the fifth model, which was labeled the Marionette model. In
contrast to the PorQpine model which is not (de)mountable, this new model is
modularly designed. This model owes its name to the operating principle, as
it resembles that of a marionette (movement of the puppet controlled by
strings). In this model, the control of movement also occurs by means of cords,
or more accurately, flexible rods. In this model, the membrane portion of the
PorQpine model is replaced by a separate inner membrane. Individual flexible
rods serve as the connection between the membrane and the rigid outer shell.
A strong and simple connection of the rods is possible as a result of the
integrated anchor points, which are present both in the rigid shell and in the
membrane. The latter are called buttons. The openings in the rigid shell which
have been created in front of the anchor points, are to be sealed by end caps
which are either pushed in a bus or screwed. These buses are integrated or
screwed into the rigid shell. The actual seal between a bus and a closure cap
is carried out by means of an O-ring. In this design, the ventricular cavity is
closed at the top by screwing a valve plane in which mechanical heart valves
can be mounted. As such, the modular design greatly simplifies the practical
feasibility as it is largely confined to routine construction with the aid of 3D
printing techniques such as SLS and SLA. However, a complication could
occur in the sealing of the compressed fluid/air at the level of the 31 buses,
which makes chance of leakage relatively high. Also, the assembly and
disassembly of these rods will be a time-consuming occupation. So we have
to continue looking for a model that is easier to (dis)assembly during
experiments. This brings up the next model, the Frame model, which is the
final iteration model in this design evolution process.
The Frame model
Figure 67 presents the sixth and final model, the Frame model, which was
eventually chosen for practical realization (LV1, Chapter 5). Whereas in the
previous Marionette model, the rigid shell provides strength and stability to
the anchor, we considered that the function of this one part could be better
fulfilled by two separate pieces. In this model, we replaced the rigid shell with
integrated anchors and buses, by two components, i.e., an simplified rigid shell
and an anchor frame, from which the label Frame model is derived. This
approach offers the following advantages. First, the mounting of the rods is
much simpler and can be done much faster. Whereas in the Marionette model,
the mounting of the rods occurs through the small openings in the rigid shell,
the assembly in this model is simpler because we can move our fingers freely
through the anchor frame. Second, there is less risk of leakage. While the

4. DESIGN METHODOLOGY
149
Figure 66: The Marionette model.

4. DESIGN METHODOLOGY
150
Marionette model needed to be sealed at the level of about 31 buses,
this new model requires the sealing by means of only one O-ring which is
located between the valve plane and the shell. Finally, if there is a need to
change the anchor points geometry during experiments, one can rebuild the
frame which is less expensive than rebuilding the entire rigid shell of the
Marionette model.
In conclusion, the iterative evolution of this sub-design process
transformed the initial Honeycomb model into the Frame model, which scores
the highest in terms of the proposed design criteria. This model was then
chosen to be physically prototyped as LV1 and was implemented in
experiments. This realization process and experimental results are extensively
described in Chapter 5.
4.2.2.2 Sub-Diamond II: Iteration loop towards MV models
This section describes the iteration loop that forms the basis for the
development of the mitral valve models MV1 – MV2. This design process is
primarily based upon a hands-on approach. The process started with a logical
choice to imitate the anatomical material composition and properties of the
biological mitral leaflets. From this choice, a hands-on approach was applied
by varying three parameters – first, by means of 2D substrates, and later on,
by means of the actual 3D mitral valve geometry. These parameters were
different types of silicone and fiber materials (1) and thickness (2), and
different fiber structures (such as knitted and woven fiber patterns) (3). In
addition, we varied several production techniques (4), such as vacuum casting
(using a silicone or 3D printed mold) and dip coating of a kernel. Hereby, three
different kernel materials were used in function of smoothness and the non-
sticking properties, Acrylate via 3D printed (1), polyurethane via vacuum
casting (2) and aluminum via 5-axis milling (3). The total number of iterations
during this hands-on approach was about eighteen before we obtained a
functional in-vitro mitral valve model.
The first required criterion in this case is the ability of the valve model
to combine a firm leaflet structure to withstand high blood pressures with
leaflet bend flexibility to diminish transvalvular flow resistance (PG6a). These
requirements were preliminary validated by tactile and visual inspection and
by leakage and pressure tests after mounting the valve models into a custom
made valve housing. This design process formed the basis for the development
of the valves MV1 and MV2 (Chapter 8). The second set of requirements are
the practical guidelines related to the implementation of anatomical structures
(PG6b – PG6e) into the left heart models LH1 and LH2 (Chapters 10 and 11).

4. DESIGN METHODOLOGY
151
Figure 67: The Frame model (LV1 of Chapter 5).

4. DESIGN METHODOLOGY
152
4.2.2.3 Sub-Diamond III: Iteration loop towards LH models
In this section, we describe the iteration loop that forms the origin of the left
heart models. It is based on the production process development for
manufacturing thin walled flexible in-vitro models with high geometrical
complexity and an accuracy which is as good as possible. During this design
process, seven methods are developed based on different kinds of sacrificial
cores, which can be removed after the building process of the in-vitro model.
This design process included seven iterations which can be categorized into
four methods according to how the core is sacrificed. The first method is based
on the melting of a massive core made by vacuum casting of wax (Green
Casting Wax, Kerr Ltd, Peterborough, UK, melting point 75°C) (1) and a low
melt fusible metal alloy (Bismuth Based Ingot 203, RotoMetals, CA, melting
point 95 °C) (2). The second method includes the crushing of a hollow core
made by rotational molding of wax (3), plaster (4) and polyurethane (5). Then,
the third method is based on the washing out of a water solvable (hollow) core
made of sugar glass (brittle transparent form of sugar often used to simulate
glass in movies and for sugar sculptures) (6), and finally, the fourth method
comprises the mechanical fragmentation of a thin-walled 3D printed core (7).
After this divergence phase, a convergence phase took place in which
two methods were selected for application in this dissertation. The first is the
hollow wax core approach and is applied for the realization of LH1 (Chapter
10) and the upper half of LH2 (Chapter 11). This approach allowed the
meeting of the practical guidelines PG2, PG4a, PG4b, PG5 – PG7 in one
model. This selection is based upon three criteria: (1) its minimal damage to
the actual model during the removal of the core, (2) the straightforward
fragmentation of the core, and (3) its effortful way of producing a series of
cores that was needed to optimize the production process of the monolithic
LH1.
The second selected method is the one that is based upon the
mechanical fragmentation of a thin-walled 3D printed core. The selection
criterion in this case is the accuracy due to skipping intermediate steps during
the production process by direct 3D printing. This approach is applied for the
creation of the highly detailed in-vitro models of the upper airways as shown
in Figure 111, and therefore proposed as a promising approach to enhance
geometrical complexity and accuracy of the next generation of in-vitro
models, as described in Chapter 10.

4. DESIGN METHODOLOGY
153
4.3 CONCLUSION
This doctoral dissertation is based upon a diverging-converging type of
engineering design strategy and closely follows the logic of the Double
Diamond design process, proposed by the British Design Counsel. In a first
diverging-convergence phase, clear research needs were defined based upon
a broad literature review. In a second diverging-convergence phase, creative
ideas were catalyzed, selected and developed in response to the identified
research needs in order to deliver proper solutions.
This chapter provides the general design strategy and goes deeper into
the design roots behind all in-vitro models which are described in the
following chapters of this dissertation. It demonstrates that every single
concept has been developed within the broader context of a structured design
methodology and is based upon a wide range of ideas and numerous hands-on
experiments.

154

155
PART II. IN-VITRO
MODELLING OF THE
LEFT VENTRICULAR
MUSCLE Part II
In-vitro modelling of
the left ventricular
muscle

156

157
Chapter 5 Modelling the left ventricular muscle by a thick wall
Modelling the
left ventricular muscle by a thick wall
This chapter is based on “Modelling the left ventricle using rapid prototyping
techniques”, as published in the IRBM journal (2013) by Van Der Smissen B.,
Claessens T., Verdonck P., Van Ransbeeck P., and Segers P. [179].
It describes the first of the three new left ventricular models, namely LV1. In
this model, the natural left ventricular muscular wall is modelled by a thick-
walled approach instead of a thin- walled membrane. A render of this model
is shown in Figure 68 [180].
5.1 INTRODUCTION
Heart failure is an increasingly important health problem in most developed
countries [181]. Research of biomechanical processes in congestive heart
failure primarily concentrates on the assessment of blood flow in the left
ventricle. However, at present, the focus shifts towards the role of the
deformation of the ventricular wall in the interaction with the blood flow. In
previous experimental investigations wall deformation was studied by means
of thin-walled passive experimental models, consisting of a silicon membrane
in a closed box that is passively squeezed by an externally connected piston
pump. Experimental models relying upon this deformation mechanism have
been used to study the influence of the different determinants of left heart

5. MODELLING THE LEFT VENTRICULAR MUSCLE BY A THICK WALL
158
performance on transmitral flow [95], to test the hydrodynamic performance
of heart valves [182-185] or to investigate LV diastolic filling using color M-
mode Doppler echocardiography [186]. Although the pump function of these
models has already been well established, the membrane deformation remains
unpredictable and the effect of muscle contraction - and hence natural wall
deformation - cannot be simulated.
In this study, we propose a new design of an experimental hydraulic
LV model (LV1) in which LV wall deformation can be controlled. We built
this model by a combination of rapid prototyping techniques and tested it to
demonstrate its wall deformation and pump function by measuring aortic flow
and ventricular pressure. This described model is the result of an optimization
process in which we gradually improved previous designs based on different
design criteria, such as deformation mechanism, practical feasibility and the
ease of (dis)assemble. However, in this chapter, we exclusively describe the
design and composition of the final model that was also physically realized.
5.2 PHYSIOLOGICAL BACKGROUND
As described in Chapter 1, the heart is a four-chambered, muscular organ that
continuously pumps blood through the body’s extensive network of arteries
and veins. The LV can be considered as its most important and powerful
pumping chamber, and is therefore probably its most frequently studied
chamber. The LV wall consists of three layers: the epicardium, the
myocardium, and the endocardium. The endocardium is the thin inner layer of
endothelium while the epicardium is an external visceral layer covering the
heart. The myocardium, the middle layer, forms the bulk of the LV and is the
layer that actually takes care of contraction. It consists mainly of cardiac
muscle fibers embedded in connective tissue structure. The myocardium
consists of interweaving bundles of cardiac muscle fibers spirally arranged
around the circumference of the heart. As a result of this anatomical
architecture and of the timing and sequence of electrical excitation, during
contraction the LV deforms as follows: (a) the diameter of the LV decreases
while (b) the base-apex distance decreases (c) in a rotating manner [43]. As
such, global ventricular wall deformation can be basically described in terms
of (a) circumferential deformation, (b) longitudinal deformation, and (c)
torsion.

5. MODELLING THE LEFT VENTRICULAR MUSCLE BY A THICK WALL
159
Figure 68: Render of the thick-walled left ventricular model LV1 [180].

5. MODELLING THE LEFT VENTRICULAR MUSCLE BY A THICK WALL
160
5.3 CONTRACTION PRINCIPLE
Previous experimental investigations studied wall deformation by means of
thin-walled passive experimental models. These models consist of a silicone
membrane in a closed box. By using a piston pump, water or pressurized air
is applied within the closed box and the internal membrane compresses which
consequently results in LV volume reduction. Yet, although it is well
demonstrated that these passive models provide adequate pump function, the
unpredictability of the membrane deformation prohibits the simulation of the
effect of muscle contraction and hence natural wall deformation.
In contrast to this thin-walled conception of the LV, we conceived the
LV as a thick-walled hydraulic model which is composed of an inner thin-
walled membrane, flexible bars which we assumed to control the wall
deformation and an exterior shell. When pressurized air is applied by a piston
pump within the thick wall, the internal membrane is compressed and the
flexible bars start to stretch. In this way, wall deformation can be controlled
while LV volume is reduced.
These three layers of the thick wall can be considered as analogues of
the human heart with the thin membrane representing the endocardium, the
flexible bars connecting the membrane with a stiff supporting frame
representing the middle layer that actually accounts for ventricular
contraction, and the exterior shell covering the latter parts representing the
epicardium which is the external visceral layer of the heart.
As such, the degree of control over the deformation of the inner
membrane is determined by the tension and number of flexible bars arranged
over the surface of the membrane. Also, the higher this number, the more
accurate the control of the wall deformation will be. In our model, we provided
that these bars can be stretched or loosened by means of modular discs in order
to control the wall deformation more efficiently. We chose to use 31 bars
which represent the corners of the 16 segments that are often used in clinical
echocardiography to locate LV pathologies [187].

5. MODELLING THE LEFT VENTRICULAR MUSCLE BY A THICK WALL
161
Figure 69: Our model consists of two main parts: (a) a valve plane and (b) a thick wall.

5. MODELLING THE LEFT VENTRICULAR MUSCLE BY A THICK WALL
162
Figure 70: Illustrative drawing of a 16-segment left ventricle model representing the 16
segments, which is often used in echocardiography. The model consists of three slices: (1) the
basal and (2) the mid-ventricular slices which are uniformly divided into six segments and (3)
the apical slice which is split into four equal segments. Reproduced from Han, 2004 [15].
5.4 DESIGN AND COMPOSITION OF THE MODEL
This contraction principle was further optimized in terms of practical
feasibility and resulted in the model shown in Figure 69. This model was
modularly designed in order to facilitate experiments and consists of two main
parts: a thick wall (Figure 69 b) and a valve plane (Figure 69 a). The thick
wall takes care of the ventricular contraction while the valve plane contains
the two (mechanical) heart valves.
5.4.1 Thick wall
As depicted in more detail in Figure 71, the thick wall consists of four
components: the thin flexible membrane (Figure 71 a), the flexible bars
(Figure 71 b), the stiff supporting frame (Figure 71 c) and the exterior shell
(Figure 71 e).
First, the thin flexible (E-modulus of 5 MPa) membrane (Figure 71 a)
is the inner layer of the thick wall and we modelled it as a truncated ellipsoid
with an end diastolic volume of 130 ml, base-apex length of 85 mm, short axis
diameter of 45 mm and an overall wall thickness of 3 mm. We also provided
the membrane with a sealing ring (Figure 71 f) to prevent leakage between the
thick wall and the LV cavity.

5. MODELLING THE LEFT VENTRICULAR MUSCLE BY A THICK WALL
163
Figure 71: The ventricular part consists of (a) a thin membrane including (f) a sealing ring, (b)
flexible bars, (c) a supporting frame, (d) an O-ring, (e) an external shell, (g) eye pins, (h)
supporting points, (i) modular discs and (j) connection to the piston pump.

5. MODELLING THE LEFT VENTRICULAR MUSCLE BY A THICK WALL
164
Secondly, the region with the flexible bars (Figure 71 b) connecting
the inner and outer layer of the thick wall can be assumed as the middle layer.
Importantly, these bars need to be flexible enough to allow deformation of the
membrane and stiff enough to exert control over the wall deformation.
Empirically, we found the following parameters appropriate to account for
these requirements in our model: rubber material (E-modulus of
approximately 5MPa) and a cross-section of 4 mm². The flexible bars are
connected to the supporting points in the membrane and to the supporting
frame: the eye pins (Figure 71 g) and the modular discs (Figure 71 i)
respectively. We designed these eye pins (depicted in more detail in Figure
73) with an eye (Figure 73 a) to connect the flexible bars, a perforated flange
(Figure 73 d) to assure embedding in a tight connection with the flexible thin
membrane, a centering pin (Figure 73 e) to provide a constant membrane
thickness, and guiding planes (Figure 73 b) to align them perpendicularly to
the membrane (see § 5.5). The modular discs (Figure 74) were designed with
a hole (Figure 74 d) and a cut-away (Figure 74 a) in which a transverse spill
(Figure 76 c) fits in order to allow easy connection using different types of
flexible bars, a cut-away (Figure 74 c) to facilitate tightening and loosening of
the flexible bars and an adjusting ring (Figure 74 b) to fit them together (Figure
74 e).
As illustrated in Figure 71 (and in Figure 75 and Figure 76), the third
component, the supporting frame (Figure 71 c), is located at the outer side of
the middle layer of the thick wall. It provides not only support to the
supporting points (Figure 71 h), but also enables visual inspection of the wall
deformation as well as an easy assemblage of the flexible bars. We designed
its geometry with a constant offset (25 mm) to the membrane. It consists of a
wide-meshed structure (beam height and width of 3 and 5 mm respectively)
and supporting points which are oriented perpendicular to the eye pins of the
membrane. As such, the flexible bars have a constant length and are
perpendicularly oriented. In this way, a perpendicular control can be exerted
to the membrane surface.
Finally, the exterior shell (Figure 71 e) functions as the exterior box
in which pressurized air is applied by a piston pump, as it is used in previous
investigations. We designed it to consist of a transparent material to enable
visual inspection. Similar to the geometry of the supporting frame, the exterior
shell is designed with a constant offset from the membrane in order to
facilitate adding modular discs. We opted to supply water or pressurized air at
the apex level (Figure 71 j) to simplify the valve plane. Leakage of the
pressurized air is prevented using a sealing ring (Figure 71 d) between the
exterior shell and the valve plane.

5. MODELLING THE LEFT VENTRICULAR MUSCLE BY A THICK WALL
165
Figure 72: The valve plane contains (e) a valve plane, (a) two gates and positions, (d) two
mechanical valves. Leakage between valves and valve plane is prevented by using (c) O-rings
which are pressed by (b) a compression nut.
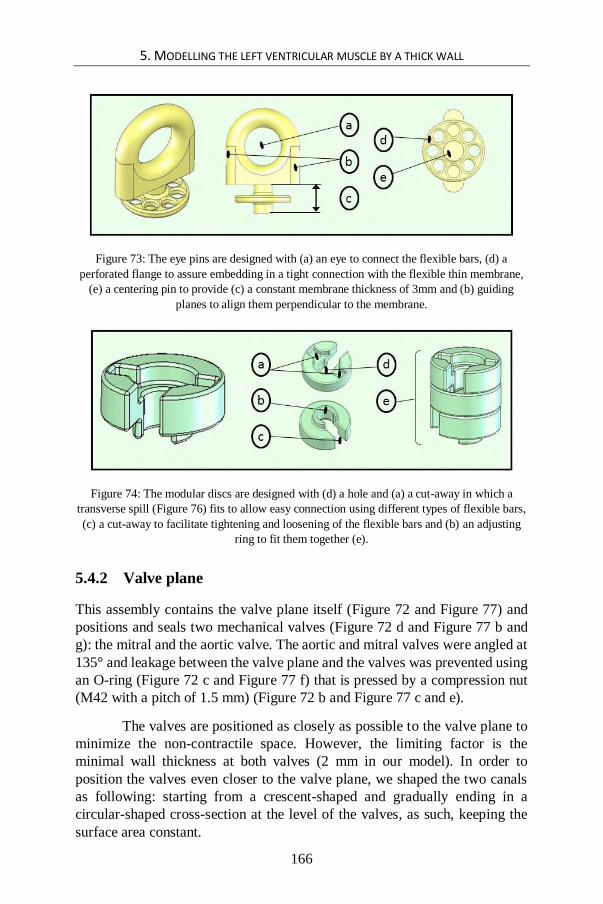
5. MODELLING THE LEFT VENTRICULAR MUSCLE BY A THICK WALL
166
Figure 73: The eye pins are designed with (a) an eye to connect the flexible bars, (d) a
perforated flange to assure embedding in a tight connection with the flexible thin membrane,
(e) a centering pin to provide (c) a constant membrane thickness of 3mm and (b) guiding
planes to align them perpendicular to the membrane.
Figure 74: The modular discs are designed with (d) a hole and (a) a cut-away in which a
transverse spill (Figure 76) fits to allow easy connection using different types of flexible bars,
(c) a cut-away to facilitate tightening and loosening of the flexible bars and (b) an adjusting
ring to fit them together (e).
5.4.2 Valve plane
This assembly contains the valve plane itself (Figure 72 and Figure 77) and
positions and seals two mechanical valves (Figure 72 d and Figure 77 b and
g): the mitral and the aortic valve. The aortic and mitral valves were angled at
135° and leakage between the valve plane and the valves was prevented using
an O-ring (Figure 72 c and Figure 77 f) that is pressed by a compression nut
(M42 with a pitch of 1.5 mm) (Figure 72 b and Figure 77 c and e).
The valves are positioned as closely as possible to the valve plane to
minimize the non-contractile space. However, the limiting factor is the
minimal wall thickness at both valves (2 mm in our model). In order to
position the valves even closer to the valve plane, we shaped the two canals
as following: starting from a crescent-shaped and gradually ending in a
circular-shaped cross-section at the level of the valves, as such, keeping the
surface area constant.

5. MODELLING THE LEFT VENTRICULAR MUSCLE BY A THICK WALL
167
Figure 75: The practical realization of (a) our model, (b) the valve plane, (c) an assembly of
the supporting frame and membrane without the flexible bars, (d) the external shell, (e) the
supporting frame and (f) the membrane containing the embedded eye pins.

5. MODELLING THE LEFT VENTRICULAR MUSCLE BY A THICK WALL
168
5.5 RAPID PROTOTYPING MATERIALS AND METHODS
Figure 75 shows the final realization of our model based on a combination of
the following Rapid Prototyping Techniques: selective laser sintering (SLS),
stereo lithography apparatus (SLA) and vacuum casting by using a silicone
mold. As these techniques apply different materials, the final model is made
of polyamide powder, epoxy and a 2-component polyurethane respectively.
The external shell (Figure 75 d) was built of epoxy using the SLA
technique. This technique assures the required transparent and solid properties
and hence allows visual inspection while providing enough strength to deal
with the pressurized air. In order realize this optical transparency, the shell
surface needs to be smoothened by a polishing treatment after the rapid
prototyping techniques building process. This smoothing procedure was
intended to be done at the design state of our model, but ultimately, as an
alternative, we opted to remove the external shell to make even better
visualizations, as depicted in Figure 79. However, the latter configuration
needs a modification of the validation set up: the pressure gradient, which
causes wall deformation, will be realized in this new configuration by
applying pressurized air at the inside of the membrane instead of applying
vacuum pressure at the outside of the membrane which is valid for the first
configuration. Since wall deformation is the result of transmembrane pressure
gradient, the direction in which the pressure gradient is applied does neither
affect the final wall deformation, nor influence the controlling function of the
flexible sticks. For that reason, we can assume that this modified configuration
will lead to the same deformation, and therefore we opted this to obtain an
improved visualization of the wall deformation.
In contrast to the external shell, the modular discs (Figure 76 c), the
supporting frame (Figure 75 e), the valve plane (Figure 77) and the eye pins
(Figure 75 f) were built of polyamide (PA) because of the materials tough
properties.

5. MODELLING THE LEFT VENTRICULAR MUSCLE BY A THICK WALL
169
Figure 76: The practical realization of (b) the flexible bars (a) connecting the membrane and
the supporting frame by the use of the eye pins and (c) a modular disc.

5. MODELLING THE LEFT VENTRICULAR MUSCLE BY A THICK WALL
170
Whereas these parts could be built directly by RPT-machines, the
membrane (Figure 75 f) had to be built in several steps due to its complex
practical guidelines: it needs to be flexible (1), the stiff eye pins need to be
firmly attached (2) and precisely positioned to it (3), and its wall thickness
needs to be consistently constant (4) to avoid irregular wall deformation. The
first technique we applied to realize this membrane is vacuum casting:
primarily, the membrane was built of epoxy using the SLA technique. Then,
this original shape was utilized to produce a silicone mold, and finally, a two-
component-polyurethane was vacuum-casted into the silicone mold. The
second technique we employed is the insert-technique: the original shape of
the membrane was completed with projecting parts that are shaped like the
eye pins. When the silicon mold is produced, the corresponding holes were
formed in which the eye pins were placed as inserts before casting the
membrane. In this way, a correct position of the eye pins was realized
according to the 16 segments and the perpendicular orientation to the
membrane’s surface. Besides a correct position, the stiff eye pins are tightly
connected to the flexible membrane, because the liquid (un-polymerized)
polyurethane during casting encloses the perforated flange of the eye pin,
assuring a close connection with the membrane after polymerization. In
addition, the thickness of the membrane is consistently kept constant (3 mm)
since the centering pin mutually distances the inner and outer part of the
silicone mold during casting.
5.6 EXPERIMENTS AND PRELIMINARY RESULTS
Once our model was built, we activated it (Figure 78 a) using a piston pump
(Harvard pump) (Figure 78 f) supplying the pressurized air and connected it
to a lumped hydraulic windkessel model of the vascular system (including
compliance (Figure 78 b) and resistance (Figure 78 c)) and measured (data
acquisition using Labview 7, National Instruments, Austin, TX USA)
ventricular pressure (disposable transducer DTX/PLUS, Becton Dickinson
Critical Care Systems) and aortic flow (Tubing Flow Sensor ME-PXL,
Transonic Systems Inc.).

5. MODELLING THE LEFT VENTRICULAR MUSCLE BY A THICK WALL
171
Figure 77: The practical realization of (a) the valve plane. It contains (d) the valve plane, (a
and e) two gates and positions, (b and g) two mechanical valves. Leakage between valves and
valve plane is prevented using (f) O-rings which are pressed by (c and e) a compression nut.

5. MODELLING THE LEFT VENTRICULAR MUSCLE BY A THICK WALL
172
In this preliminary study, wall deformation patterns were only visually
observed (Figure 79 a and b). These observations fairly nicely demonstrated
circumferential and longitudinal deformation. However, torsion was not
pronounced. Our experimental results (Figure 80) further showed that this
model is able to generate realistic data in terms of end-systolic pressure (120
mmHg) and heart rate (57 BPM). Due to the too high afterload resistance, the
aortic flow in our model was low compared to (human) physiological data
with a mean aortic flow of 1.6 l/min.
Figure 78: Once (a) our model was built, we activated it using (f) a piston pump and
connected it to a lumped hydraulic windkessel model of the vascular system, including (b)
compliance, (c) resistance, and (d) preload. After that, ventricular pressure (pventr) and aortic
flow (Qaorta) were measured. In order to create a closed circuit, (e) an overflow and a
circulation pump were added.

5. MODELLING THE LEFT VENTRICULAR MUSCLE BY A THICK WALL
173
Figure 79: Compared with physiological data (dashed line), the experimental results (solid
line) show that the model is able to generate realistic data in terms of end-systolic pressure
(120 mmHg). Due to the too high afterload resistance, the aortic flow in our model (solid line)
was low compared to (human) physiological data (dashed line) with a mean aortic flow of 1.6
l/min.
Figure 80: Wall deformation patterns of our model were fairly nicely demonstrated in terms
of circumferential and longitudinal deformation: end-systolic (white line) and end-diastolic
wall-deformation (white dotted line).
We observed also a few considerable discrepancies regarding human
data, such as negative values of pressure and flow which are presumably
attributable to the sucking property of the piston pump.

5. MODELLING THE LEFT VENTRICULAR MUSCLE BY A THICK WALL
174
5.7 CONCLUSION
This chapter briefly describes the design and development of a new hydraulic
LV-phantom (LV1) aiming to achieve more realistic wall deformation than
obtained in the existing thin-walled membrane models. Therefore, we
designed a thick-wall model in which control can be exerted on the wall using
flexible bars. Our experiments show that circumferential and longitudinal
deformation can be attained and that this LV1 can generate fairly normal
values of pressure and flow.
Although the wall deformation is controlled in this new model, further
work is required to achieve even more realistic wall deformation patterns.
Once our experimental setup will be optimized, this new LV model will likely
provide useful insights in LV wall deformation and its interaction with blood
flow. Nevertheless, the controlled wall behavior of our model is a step forward
compared to the unpredictable squeezing of thin walled models.
In the context of the practical guidelines of Chapter 3, this LV model
is able to meet the following practical guidelines: modelling the ventricular
wall by a thick-walled approach (PG1) and mimicking two global ventricular
wall deformation patterns, namely longitudinal and circumferential
deformation (PG4 a-b).

175
Chapter 6 Modelling the active wall contraction and torsional motion of the left ventricle
Modelling the active wall contraction and
torsional motion of the left ventricle
This chapter is based on “Design of an Artificial Left Ventricular Muscle: an
Innovative Way to Actuate Blood Pumps?”, as published in the Artificial
Organs journal (2009) by Van Der Smissen B., Claessens T., Verdonck P., Van
Ransbeeck P., and Segers P. [188].
This chapter describes the second of three new left ventricular models,
namely LV2. By the integration of active contractile elements, this active way
of ventricular actuation enables the generation of the left ventricular torsional
motion which is present in the natural heart. In the context of the integrative
approach of modelling the left heart including the mitral valve and valve plane,
this artificial LV muscle model will be further discussed in Chapter 12 (§ 12.2)
as it is a possible way of modelling the typical nature-like flexible valve plane
and its movements.

6. MODELLING THE ACTIVE WALL CONTRACTION AND TORSIONAL MOTION OF THE LEFT VENTRICLE
176
6.1 INTRODUCTION
For all in-vitro investigations discussed in Chapter 2, the activation is based
upon the passive squeezing of a membrane which is rigidly suspended into a
rigid box and connected to a piston pump. Although the function of
experimental models relying upon this deformation mechanism has already
been proven, these models do not account for realistic wall deformation, nor
can intra-ventricular blood flow patterns be realized in these models. As
mentioned in Chapter 3 as 3th practical guideline (PG3), more nature-like left
ventricular wall contraction can be modelled by integrating active contractile
elements into the left ventricular wall model.
In this study, we propose an innovative design of the artificial LV
muscle (LV2) that mimics fairly realistically global left ventricular wall
deformation patterns as it consists of an active wall structure mimicking the
heart muscle which efficiently exerts pressure on the blood. To demonstrate
the actuation mechanism, we proposed a strategy to build the artificial LV
muscle with a simple plastic bag. Next, we built and tested an experimental
model to demonstrate the pump performance of this artificial LV muscle.
6.2 PHYSIOLOGICAL BACKGROUND
The heart is a four-chambered, muscular organ that continuously pumps blood
through the body’s extensive network of arteries and veins. The LV can be
considered as its most important and powerful pumping chamber, and is
therefore probably its most frequently studied chamber. The LV wall consists
of three layers: the epicardium, the myocardium and the endocardium. The
endocardium is the thin inner layer of endothelium, while the epicardium is
an external visceral layer covering the heart. The myocardium, the middle
layer, forms the bulk of the LV and is the layer that actually contracts. It
consists mainly of cardiac muscle fibers embedded in connective tissue
structure. The myocardium consists of interweaving bundles of cardiac
muscle fibers spirally arranged around the circumference of the heart. As a
result of this anatomical architecture and the timing and sequence of electrical
excitation, during contraction the LV deforms as follows: (a) the diameter of
the LV decreases while (b) the base (the atrio-ventricular valve plane) is
simultaneously pulled downward in the direction of the apex (c) in a rotating
manner (3). Due to this accompanying “wringing” effect, pressure is
efficiently exerted on the blood enclosed within the chamber, thereby
directing it upwards toward the aortic outflow tract. As such, global
ventricular wall deformation can be basically described in terms of (a)
circumferential deformation, (b) longitudinal deformation, and (c) torsion.

6. MODELLING THE ACTIVE WALL CONTRACTION AND TORSIONAL MOTION OF THE LEFT VENTRICLE
177
6.3 CONTRACTION MECHANISM
In order to reproduce these basic wall deformation patterns in-vitro, we
designed a novel kind of artificial heart “muscle” composed of multiple
actively contracting cells. Contraction is based on a mechanism by which
pressure inside such a cell causes expansion in one direction and contraction
in another direction. The contraction (systole) and relaxation (diastole) of a
biological muscle (Figure 81 a) take place along the cardiac muscle fiber
direction, while the contraction (inflation) and relaxation (deflation) in a
single contractile chamber (Figure 81 b) of this new artificial LV muscle take
place perpendicular to its long axis. The final deformation of the LV wall is
determined by the organization and geometry of the contractile cells within
one artificial LV muscle, together with the governing LV pressure and the
applied pressure in the cells. In the present active LV wall structure, only one
layer of artificial muscle was used. However, a well–thought-out
configuration of a number and geometry of artificial muscles could be used in
future left heart models to produce even more realistic deformations.
Figure 81: The contraction principles of the biological and the new artificial LV (left
ventricle) muscle are illustrated. The contraction (systole) and relaxation (diastole) of a
biological muscle take place along the direction of the cardiac muscle fibers, while the
contraction (inflation) and relaxation (deflation) in a single contractile chamber of this new
artificial LV muscle (a) take place perpendicular to its long axis (Lm: shortening of a
biological muscle and Lsingle cell: shortening of a single contractile chamber). An actual three
dimensional (3D) artificial LV muscle can be created by folding the 2D rectangular artificial
LV muscle (b) to a cylindrical artificial LV muscle (c). When pressurized air is applied, the
muscle cells contract perpendicularly to their longitudinal axis and the rectangular contour
transforms into a parallelogram contour (b) with an angle βtorsion, a decrease in length
(∆Lcircum) and in height (∆Llong ). Analogously, if both ends of the artificial muscle are welded
together, the 3D cylindrical artificial LV muscle which is initially inactivated, will display
torsion (with an angle equal to βtorsion) as well as radial, circumferential, and longitudinal
deformation when activated (c).

6. MODELLING THE ACTIVE WALL CONTRACTION AND TORSIONAL MOTION OF THE LEFT VENTRICLE
178
In its unpressurized state, a basic contractile cell can be considered as
a flat cavity with a rectangular ground surface. When pressurized air is
supplied to the cell, it inflates and becomes round (Figure 81 a). Because the
diameter of the inflated cell is less than the width of the deflated cell, both
ends of the chamber move towards each other and the cell starts to contract.
The cell shortening ∆Lsingle cell then equals the deflated width minus the inflated
diameter. As such, the contractile cell shortens and thickens simultaneously,
which is to some extent similar to the kinematics of cardiac tissue.
The global deformation patterns of the LV, i.e. longitudinal and
circumferential deformation and torsion, can be achieved by arranging the
contractile cells under a certain angle (α) relative to the LV long axis
(centerline Figure 81 c). As such, exclusively longitudinal deformation
(∆Llong), exclusively circumferential deformation (∆Lcircum) and torsion in
combination with longitudinal and circumferential deformation (∆Llong,
∆Lcircum and βtorsion), are obtained by arranging the contractile cells respectively
at an angle α = 90°, α = 0° and 0° < α < 90° to the long axis of the LV. We
found analytically that βtorsion reaches a maximum of approximately 13° at an
angle α = 39° and, therefore, used this angle in our model (Figure 82 Panel III
and Figure 83). Also, the width of the deflated chamber was set to 15 mm.
In order to clarify the principle of the global LV wall deformation in
our model, we assume a deflated artificial muscle (Figure 81 b) that is
rectangular in shape and consists of a number of contractile cells which are
orientated at an angle (α) between 0° and 90° with respect to the LV long axis.
By rolling up the rectangular-shaped artificial muscle, a cylindrical LV model
is obtained (Figure 81 c) in which the seal (dotted line) is directed parallel to
the LV long axis. When pressurized air is applied to each individual cell of
the rectangular-shaped artificial muscle, contraction in the cells takes place in
a direction perpendicular to its long axis. Because the cell’s long axis is
orientated at a certain angle (α) between 0° and 90° with respect to the LV
long axis, the contraction of the cells results in a transformation of the initial
rectangular to a parallelogram contour. In comparison with the rectangular,
the parallelogram has become shorter (∆Lcircum = circumferential deformation)
and less high (∆Llong = longitudinal deformation) and has rotated by an angle
βtorsion (Figure 81 b). By rolling up the parallelogram-shaped artificial muscle,
a cylindrical LV model is created (Figure 81 c) in which the seal (dotted line)
is orientated at the angle βtorsion to the LV long axis. In this way, a cylindrical
LV model is obtained in which longitudinal (∆Llong) and circumferential
deformation (∆Lcircum), as well as torsion (βtorsion) is realized when activated.

6. MODELLING THE ACTIVE WALL CONTRACTION AND TORSIONAL MOTION OF THE LEFT VENTRICLE
179
Figure 82 Panel I: Circumferential and radial deformation is obtained by directing the
contractile cells parallel to the LV long axis (axis of symmetry). A physical cylindrical 3D
model demonstrates circumferential and radial deformation, in top-view at diastole (blue) and
systole (red).
Panel II: Longitudinal deformation is obtained by directing the contractile cells perpendicular
to the LV long axis (axis of symmetry). A physical 3D model demonstrates the longitudinal
deformation in front-view at diastole (blue) and systole (red).
Panel III: A combination of longitudinal, circumferential and radial deformation with torsion
can be obtained by organizing the contractile chambers at an angle of about 45 degrees with
respect to the LV long axis (axis of symmetry) (a). A physical semi-ellipsoid-like 3D model
demonstrates the longitudinal deformation (b and c), circumferential and radial deformation
(e) and torsion (e) at diastole (blue) and systole (red).

6. MODELLING THE ACTIVE WALL CONTRACTION AND TORSIONAL MOTION OF THE LEFT VENTRICLE
180
6.4 REALIZATION OF THE ARTIFICIAL LV MUSCLE
In order to build a cylindrical 3D artificial LV muscle, a step-by-step plan can
be followed. First, reform the rectangular contour of the pattern depicted in
Figure 81 c (deflated) into a parallelogram with an angle α. Make sure to add
at the top a horizontal cell that is connected to every single cell. In this way
air can be spread among all the cells in the LV wall. After that, draw the cell
pattern on a double film of plastic, for example on a simple plastic bag. Weld
the plastic films together according to the cell pattern to obtain the 2D artificial
muscle. Then, to achieve a cylindrical artificial LV muscle, fold the 2D
artificial muscle and weld the left and right sides together. Next, close the
cylindrical artificial LV muscle wall near to the LV apex by bringing the wall
together to one point and then welding this all together. Finally, insert an air
tube in the top cell. The artificial LV muscle is now ready to be activated.
When blowing into the air tube, the artificial LV muscle will contract and the
three global deformation patterns can be visually observed.
As the biological LV cavity is better represented by a truncated
ellipsoid than by a cylinder, we subsequently built an ellipsoidal artificial LV
muscle instead of a cylindrical one. As anticipated, the three basic wall
deformation components could also be visually observed in the more realistic
ellipsoid artificial LV muscle (Figure 82 Panel III).
Weld quality is crucial for the well-functioning of the active LV wall
structure. Weld properties are determined by the type and thickness of the
thermoplastic film as well as the welding temperature, pressure and time. The
thermoplastic film used in our artificial LV muscle was Polyethylene (PE)
with a thickness of 0.05 mm and was welded with a vacuum sealer (Krups
Vacupack 2 Plus). The welding time and pressure were adjusted by trial and
error in order to obtain qualitative welds.
6.5 PRELIMINARY FUNCTIONAL TESTS
Besides fairly realistic wall deformation, this new artificial LV can also
achieve the pump function performance of a real LV. In order to prove this,
we modified the prototype presented above in three aspects. First, in order to
obtain realistic performance in terms of pressure and flow, the model was
reinforced using 8 instead of only 2 layers of polymer. Secondly, in order to
increase the systolic and diastolic speed, we lowered the air flow resistance by
modifying the chamber pressure supply: the single collector tube is replaced
by a number of individual tubes supplying pressurized air to each chamber
individually. Thirdly, in order to simplify the sealing of the experimental
model, we opted to supply the pressurized air at the apex instead of at the

6. MODELLING THE ACTIVE WALL CONTRACTION AND TORSIONAL MOTION OF THE LEFT VENTRICLE
181
atrioventricular valve plane. After the modifications (Figure 83), we
connected our pump to a lumped hydraulic windkessel model of the vascular
system (including compliance and resistance) and measured pressure
(disposable transducer DTX/PLUS, Becton Dickinson Critical Care Systems)
and flow (Tubing Flow Sensor ME-PXL, Transonic Systems Inc.). In this
preliminary study, wall deformation patterns were only visually observed. Our
experimental results show that the model is able to generate realistic data in
terms of end-systolic volume (54 ml) and pressure (115 mmHg), end-diastolic
volume (156 ml) and pressure (-4 mmHg), stroke volume (102 ml), ejection
fraction (65%), mean outflow (6.8 l/min), heart rate (67 BPM), peak positive
and negative dP/dt (1072 and -1134 mmHg/s), and pressure-volume
relationship. The systolic ejection phase, however, is suboptimal due to the
relatively simple afterload model which generates unphysiological reflected
pressure and flow waves.
6.6 CONCLUSION
In this chapter, we have developed an innovative left ventricular model that
mimics the global kinematics of the LV during the cardiac cycle and produced
a demonstrative model by making use of handicraft material and tools. Besides
fairly realistic wall deformation, our experimental results show that the LV2
is also able to generate realistic data in terms of volume and pressure.
Figure 83: Pump performance. A slightly modified (see text) artificial LV muscle, namely
LV2, was built to test the performance of the design as a functional pump. After connecting it
to a lumped hydraulic windkessel model of the vascular system (including compliance and
resistance), we measured pressure and flow. Our experimental results show that the model is
able to generate realistic data in terms of pressure, flow and pressure-volume relationship.
6. MODELLING THE ACTIVE WALL CONTRACTION AND TORSIONAL MOTION OF THE LEFT VENTRICLE
182
However, unlike the biological system, in which contraction occurs
along the muscle fiber direction, the long axis of the contractile chambers in
our artificial LV muscle is perpendicular to the shortening direction. Another
difference with the biological system is that in our artificial LV muscle air is
added during systole and removed during diastole whereas the volume of the
biological heart muscle remains virtually constant during the cardiac cycle. It
is worth to mention that this limitation is applicable to all of the current heart
models, since the actuation is typically realized by water or pressurized air
generated by a piston pump. Nevertheless, our proposed artificial LV muscle
appears promising and can be considered as a main step forward when
compared to currently applied actuation mechanisms, as it will likely result in
more physiological intracavity blood flow patterns.
Another limitation is that the LV2 is not based on an image-based
patient specific geometry. In this regard, it should be noted that the
implementation of a complex three-dimensional shape is only possible to a
limited extent because the artificial muscle architecture is merely based on
two simple dimensional sheets. Also, although this approach is convenient to
account for the flexible nature of the valve plane (PG7), it is not implemented
yet in this study. Apart from this, this model is able to meet all practical
guidelines specified to attain more naturally correct LV models, namely:
modelling the ventricular wall by a thick-walled approach (PG1), the
anisotropic wall properties are included by the inflatable cells (elastic
component) which are alternated with welds (fiber component) (PG2),
integration of active contractile wall elements (PG3), mimicking the global
ventricular wall deformation patterns such as longitudinal, circumferential, as
well as radial deformation (PG4 a-c) and inclusion of the twisting motion
(PG5). By this innovative way of integrating active contractile wall elements,
this model achieves the largest number of practical guidelines compared to
current LV approaches (Table 3) as well as the other LV models presented in
this dissertation. Moreover, due to its novel ventricle actuation mechanism, it
also allows the natural downwards motion of the valve plane (PG8).

183
Chapter 7 Modelling the torsional motion of the left ventricle by integration of anisotropic material properties
Modelling the torsional motion of the left ventricle by integration of anisotropic material properties
This chapter describes the third of the three new left ventricular models
proposed in this dissertation, namely LV3. This model adds fibers to the
currently commonly used thin walled ventricular models in order to mimic
natural torsional motion. Actually, this anisotropic model is inspired by the
latter described artificial muscle model (Chapter 6), where the fibers act as
the weld regions (fiber component) and the flexible polymer in between these
fibers act as the inflatable cells (elastic component). A modified version
(applying a more nature-like geometry) of this third left ventricular model will
be integrated into the left heart models LH1 and LH2 (Chapters 10 and 11).
7.1 INTRODUCTION
To date, in-vitro left ventricle models generally mimic the cardiac chamber as
a thin walled flexible membrane (called ‘Type-I models’ in this chapter)
which is squeezed by an external pressure source to simulate pump function

7. MODELLING THE TORSIONAL MOTION OF THE LEFT VENTRICLE BY INTEGRATION OF ANISOTROPIC MATERIAL PROPERTIES
184
(see Chapter 2). As such, despite that wall deformation of a natural left
ventricle includes circumferential, longitudinal, as well as radial deformations
and a twisting motion, current in-vitro left ventricle models only incorporate
the circumferential and longitudinal deformation components.
However, a model which is an advancement over current approaches
is the in-vitro active-wall left ventricle model (called ‘Type-II models’ in this
chapter) which we discussed in the previous chapter (Chapter 6). This model
captures the torsional motion of the real left ventricle via a contraction
mechanism based on the inflation of contractile elements which are slantly
oriented along the circumference of the left ventricular model. Although this
in-vitro simulation of torsion is a breakthrough in the context of
cardiovascular simulators, the artificial muscle model is only able to generate
a torsional angle of maximum 13°, which is significantly smaller than the
typical 17° manifested by the real left ventricle [49].
As it is the objective for in-vitro testing to mimic the anatomical and
physiological conditions as accurately as possible [2], there is a need to
simulate also the torsional motion of the left ventricle, attaining torsion
parameters closer to the physiological value of about 17°.
In this chapter, a second torsional in-vitro model of the left ventricle
has been developed in which physiological values of torsion are effectively
achieved. Besides the torsional motion, this model is able to mimic also the
circumferential as well as the longitudinal deformation components of the
natural left ventricle. The deformation concept is based on the stretching of an
anisotropic membrane, instead of the typical isotropic membrane of current
approaches. This anisotropy is realized by embedding fibers into a flexible
matrix, forming a composite structure. To evaluate the proof of concept and
to obtain more insights of the torsional behavior in function of the fiber
orientation, three different anisotropic left ventricular models are developed
with different fiber orientation angles. These models are mounted into a
cardiovascular simulator and torsional angles are captured during the heart
cycle.
7.2 BACKGROUND
This idea has been inspired by the two different deformation mechanisms of
existing Type-I and Type-II in-vitro left ventricular models, as well as by the
anisotropic composition of the natural heart wall.
The first deformation mechanism, on which the invention is based, is
that of the Type-I model. This passive left ventricular model is made of a

7. MODELLING THE TORSIONAL MOTION OF THE LEFT VENTRICLE BY INTEGRATION OF ANISOTROPIC MATERIAL PROPERTIES
185
silicone material and is the most widely used approach today for in-vitro
modelling of the left ventricle [5, 66, 79-84, 87-92, 96, 99, 127, 145, 160],
including in the cardiovascular simulator of Verdonck and colleagues which
was initially developed to study the blood flow through the mitral valve [95].
As mentioned before in Chapter 2, the membrane mimics the left ventricular
wall and is typically represented by a truncated ellipsoid. The space at the
inner side of the membrane (compartment 1) represents the left ventricular
cavity and is closed at the top by a stiff valve plane that includes valves in the
aortic and mitral position. At the outer side of the membrane (compartment
2), a pulsatile volume displacement is generated which deforms the membrane
to simulate ventricular wall motion. In this way, this model is able to mimic
the circumferential as well as the longitudinal deformation; however, it cannot
mimic the torsional wall motion which is present in the natural heart (see
Chapter 1). In addition, manufacturing the Type I-model is rather
straightforward by a silicone dipping process, and one can account for patient
specific geometries [89]. Another issue with Type-I models, is setting the
equilibrium volume (which is the volume of the cavity enclosed by the
unloaded model) as the end diastolic volume (EDV) or as the end systolic
volume (ESV). Most models [5, 66, 79-84, 87-92, 96, 99, 127, 145, 160]
choose EDV as the equilibrium volume because of the longer durability of the
model. However, this approach implies an unpredictable squeezing of the left
ventricular model which prohibits the simulation of natural wall deformation.
On the other hand, the approach which uses ESV as the equilibrium volume
is only sporadically used [162, 163, 166, 167], but results in a homogenous
deformation of the left ventricular model which is a more accurate simulation
of the natural left ventricular wall deformation. Although this approach is far
more reliable, it is associated with lower model durability due to much higher
stresses during the model expansion during the filling phase.
The second deformation mechanism that has inspired the new idea is
the active wall Type II-model, described in the previous chapter (Chapter 6,
[188]) and which is proposed as an artificial left ventricular muscle in the
context of blood pumps actuation systems. In brief, this model consists of a
membrane including a number of inflatable cells and is attached to a valve
plane which includes two mechanical valves. For this actuation approach, no
outer box is required because the ventricular wall motion is generated by a
pulsatile flow within the inflatable cells causing the membrane to contract.
Although this innovative Type-II model incorporates ventricular torsion in
combination with radial, circumferential and longitudinal shortening, the
manufacturing process has not been developed yet to account for modelling
patient specific left ventricular geometries, nor is it able to generate the typical
physiological torsion value of 17°.

7. MODELLING THE TORSIONAL MOTION OF THE LEFT VENTRICLE BY INTEGRATION OF ANISOTROPIC MATERIAL PROPERTIES
186
The third source of inspiration is obviously the natural left ventricular
wall which consists of different components, such as muscle, collagen, and
elastin fibers. As described in Chapter 1, the cardiac muscle fibers are
arranged in such a pattern that during activation, the ventricular muscle
shortens, the diameter reduces and this realizes a twisting movement in order
to efficiently eject the blood. These wall deformation patterns are the result of
the anisotropic properties of the wall which consists of well-organized fiber
structures (muscle and collagen fibers) which are embedded in a flexible
matrix (elastin fibers). As mentioned in the literature review of Chapter 2,
Rasponi and colleagues introduced anisotropic properties into their model by
integrating fibers into a flexible ventricular model, and hereby induced a
pronounced longitudinal deformation pattern [167].
7.3 DEFORMATION MECHANISM
The composition of this new left ventricular model is similar to the Type-I
model and equally includes a hydraulic box in which a thin walled membrane
model is suspended and activated by an external pressure source. However,
whereas the Type-I membrane is made of an isotropic wall material, this new
model integrates anisotropic wall properties to generate an additional torsional
motion. This anisotropic type of membrane is obtained by embedding fibers
in an elastic matrix to achieve a composite membrane material. In this way,
the membrane material is forced during loading to substantially extend more
in the direction perpendicular to the fiber long axis than in the direction
parallel to the fiber long axis. The specific arrangement of the fibers is
designed according to a well-defined fiber pattern and determines the wall
deformation behavior. By varying the fiber angle with respect to the left
ventricular long axis between 0° and 90°, we expect a different combination
between torsional, circumferential and longitudinal deformations. At the
extreme fiber angles of 0° and 90°, stretching of this anisotropic membrane
during the heart cycle, no torsion for both cases, and maximal circumferential
and longitudinal deformation patterns, respectively, are assumed. In this
chapter, we focus on LV models with a slant arrangement of the fibers,
whereas in Chapter 11 also perpendicular and parallel fiber directions are
applied, as shown in Figure 115.
7.4 DESIGN AND COMPOSITION OF THE MODEL
To evaluate the proof of concept and to gain more insight into the torsional
behavior as a function of the fiber orientation angle, three different anisotropic
left ventricular models are developed, each featured with a different fiber

7. MODELLING THE TORSIONAL MOTION OF THE LEFT VENTRICLE BY INTEGRATION OF ANISOTROPIC MATERIAL PROPERTIES
187
orientation angle of 45°, 35° and 20°, respectively, with respect to the left
ventricular long axis. The first angle is chosen because we intuitively expect
maximum torsion close to 45°, while the values of 35° and 20° are set to
outline the torsional range as a function of fiber orientation and to capture the
fiber angle which is associated with the physiological torsional angle of 17°.
Figure 84: Geometry of the ViVitro left ventricular model [124].
For the manufacturing of each model, a kernel is developed and used
as mold to produce the actual model. The kernel is designed according to the
geometry of the Type-I ViVitro ventricular model [124] via Computer Aided
Design (CAD), as illustrated in Figure 84. It comprises a truncated ellipsoid
shape and is equipped with an integrated O-ring for sealing. In this way, the
anisotropic left ventricular model is compatible with the ViVitro
cardiovascular simulator (ViVitro Systems Incorporated, Victoria, BC,
Canada) and enables a straightforward integration into a conventional Type-I
system.
For the correct positioning of the fiber arrangement, the kernel is
equipped with a specific groove pattern at the inner side, which serves as a
reference during manufacturing. As shown in Figure 85 (CAD models), each
of the fiber patterns comprises of 24 grooves which are spirally arranged
around the circumference of the left ventricular model. These 24 spirals follow
an anti-clockwise path to mimic the natural clockwise torsional motion of the
natural left ventricle during systole of the model. The spiral path is defined
perpendicular to the model surface and with a constant angle with respect to
the left ventricular long axis of 45°, 35°, and 20°, respectively. The number of
fibers is set to 24 for a sufficiently dense fiber distribution to obtain a
homogenous wall deformation.

7. MODELLING THE TORSIONAL MOTION OF THE LEFT VENTRICLE BY INTEGRATION OF ANISOTROPIC MATERIAL PROPERTIES
188
Figure 85: Grooved patterns in CAD models of the LV3 model.
Figure 86: Design of the kernel according to the ViVitro left ventricular model geometry,
which is used as a mold for the manufacturing of the actual model. The 24 fiber grooves at the
inner side are clearly visible to enable accurate deposition of the fibers.

7. MODELLING THE TORSIONAL MOTION OF THE LEFT VENTRICLE BY INTEGRATION OF ANISOTROPIC MATERIAL PROPERTIES
189
Figure 87: 3D printed LV3 kernels before (model 45°) and after (models 20° and 35°) colored
PVA coating.
7.5 MATERIALS AND METHODS
The three kernels are 3D printed and used for the realization of the actual
models via a dip-coating process as well as the deposition of fibers according
to the reference fiber pattern. First, the kernel is 3D printed by the PolyJet
technology (Objet Eden 350V, Stratasys, Rehovot, Israel) with a layer
thickness of 16µm, as shown in Figure 87. After printing, the kernel is
polished and coated with a Polyvinyl Alcohol (PVA) to enhance model release
from the kernel and to provide a glossy finish of the actual model inner
surface. This coating is applied for both the inner and outer surface. To obtain
improved visibility of the groove pattern, a color is added to the PVA. This,
in combination with the thin walled design (mm) and the transparent 3D
printed material (FullCure®720), allows for a good visibility of the reference
fiber pattern during the fiber deposition. In order to obtain a uniform
distribution of the PVA, the kernels are subjected to a randomized rotation and
2 layers of PVA are applied.
After the PVA coatings are finished, the kernel is ready for the
production of the actual anisotropic left ventricle model. These anisotropic left
ventricular models are realized by a 3-layer composition. The first and the
third layers are made of a flexible material and represent the flexible matrix
component of the composite. These layers are responsible for the elastic
properties of the left ventricular model and function as a watertight barrier
between the two compartments of the Type-I model. The middle layer
comprises polymer fibers and determines the direction in which wall
deformation is constrained.
We selected silicone (HT 33 TRANSPARENT, Zhermack SpA, Italy)
for the flexible matrix material because of its semi-transparent and flexible

7. MODELLING THE TORSIONAL MOTION OF THE LEFT VENTRICLE BY INTEGRATION OF ANISOTROPIC MATERIAL PROPERTIES
190
properties, and Nylon multifilament yarns for the fiber component. Each
model is equipped with 24 yarns and each yarn contains about 50
monofilaments (diameter) to maximize strength and minimize bending
rigidity. The composite structure is thus realized by the deposition of the fibers
between two layers of flexible material. The first silicone layer is applied by
dipping and subsequently submitted to a randomized rotation to enhance a
uniform layer thickness upon drying. After that, the multifilament yarns are
moisturized by liquid-state silicone and manually deposited onto the first
silicone layer according to the predefined fiber orientation pattern in the
kernel, with an estimated accuracy of 1°. Then, the model is exposed to
vacuum conditions during the curing process to eliminate air bubbles inclusion
between the yarn filaments, which might cause local weaknesses of the actual
model. Finally, the left ventricular model is finished by applying the second
silicone layer and after curing, the actual model is easily removed from the
kernel due to the PVA coating. The ventricular model is now ready to be
mounted into the ViVitro system.
7.6 PRELIMINARY EXPERIMENTS AND RESULTS
As shown in Figure 88, the three models are mounted into the ViVitro
cardiovascular simulator (ViVitro Systems Incorporated, Victoria, BC,
Canada) and the interventricular model volume is adjusted. For experiments
with the conventional ViVitro system, the EDV of a ViVitro left ventricular
model is usually set to its equilibrium volume, which is 127 ml. However,
because this anisotropic model only induces torsion during stretching of the
membrane, the equilibrium volume (127 ml) is set as ESV. The stroke volume
is set to 80 ml and the torsional angle of the model is obtained by video
recording of a marker at the model’s apex (Figure 88 right panel). The
recordings are then post processed and the torsion angle is obtained by
measuring the rotation difference of a marker at the apex with a goniometer
(accuracy of 1°) at the time of end systole and end diastole. During the
experiments, longitudinal, circumferential, as well as torsion is observed for
each model. For the three models with fiber orientation angles of 45°, 35° and
20°, torsional angles of 26°, 22° and 17° are generated, respectively.
7.7 DISCUSSION
In this chapter, we have demonstrated that it is feasible to integrate well-
defined anisotropic wall properties to generate torsional motion in a
conventional Type-I cardiovascular simulator, such as the ViVitro system.
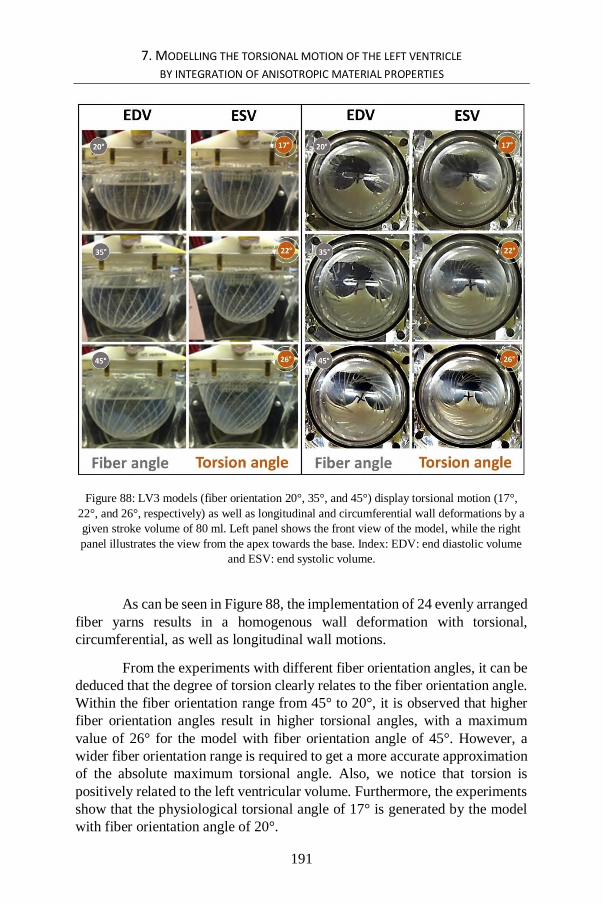
7. MODELLING THE TORSIONAL MOTION OF THE LEFT VENTRICLE BY INTEGRATION OF ANISOTROPIC MATERIAL PROPERTIES
191
Figure 88: LV3 models (fiber orientation 20°, 35°, and 45°) display torsional motion (17°,
22°, and 26°, respectively) as well as longitudinal and circumferential wall deformations by a
given stroke volume of 80 ml. Left panel shows the front view of the model, while the right
panel illustrates the view from the apex towards the base. Index: EDV: end diastolic volume
and ESV: end systolic volume.
As can be seen in Figure 88, the implementation of 24 evenly arranged
fiber yarns results in a homogenous wall deformation with torsional,
circumferential, as well as longitudinal wall motions.
From the experiments with different fiber orientation angles, it can be
deduced that the degree of torsion clearly relates to the fiber orientation angle.
Within the fiber orientation range from 45° to 20°, it is observed that higher
fiber orientation angles result in higher torsional angles, with a maximum
value of 26° for the model with fiber orientation angle of 45°. However, a
wider fiber orientation range is required to get a more accurate approximation
of the absolute maximum torsional angle. Also, we notice that torsion is
positively related to the left ventricular volume. Furthermore, the experiments
show that the physiological torsional angle of 17° is generated by the model
with fiber orientation angle of 20°.

7. MODELLING THE TORSIONAL MOTION OF THE LEFT VENTRICLE BY INTEGRATION OF ANISOTROPIC MATERIAL PROPERTIES
192
As described in Chapter 6, the Type-II model is also able to generate
torsional motion. However, the maximum torsion angle was limited to
approximately 13° in our experiments, which is low in comparison with the
physiological mean value of about 17°. Although the deformation mechanism
is inspired by this Type-II contraction mechanism, this anisotropic model is
able to generate torsional angles which are far beyond the 13° because the
deformable component of the wall is able to transcend the maximal
lengthening of the Type-II model (which is limited to the periphery minus the
diameter of the inflatable cells).
A mathematical or numerical simulation of this anisotropic wall
behavior as a function of fiber orientation, model geometry and volume
change during the heart cycle should be of great value to fully establish this
more naturally accurate approach of ventricular modelling. As such, in-vitro
left ventricular models could be optimized to generate physiological and
patient specific values of torsion as well as of the circumferential and
longitudinal deformations.
Although the anisotropic wall properties in the real heart vary along
the muscle wall, the anisotropy in our model is constant with a fixed angle
relative to model long axis. However, this novel way of ventricular modelling
would allow for locally adjusting of the anisotropy, which enables modelling
of the anisotropic variation within the heart muscle wall to obtain a more
detailed imitation of the natural as well as patient specific wall deformation
patterns. Also, this fiber-based approach opens the possibility to locally
include stiff zones which are present in the real heart after myocardial
infarction.
Since we applied this technique for a simple and smooth model
geometry with a large enclosed volume, we estimate the wall interaction with
blood flow patterns of this torsional motion rather limited. A more accurate
approximation of interventricular blood flow patterns is expected by
integration of an anatomically correct geometry including the protruding
structures such as the papillary muscles and trabeculae.
Obviously, this technique might also be applicable to other chambers
of the heart.
7.8 LIMITATIONS
We opted for setting the equilibrium volume as the ESV, which has the
advantage of generating a homogenous and much more natural wall
deformation, in contrast to the unpredictable squeezing of models in which the

7. MODELLING THE TORSIONAL MOTION OF THE LEFT VENTRICLE BY INTEGRATION OF ANISOTROPIC MATERIAL PROPERTIES
193
equilibrium volume is set to EDV. On the other hand, applying this approach
involves higher model wall stresses, and consequently a lower model
durability. Nevertheless, during the few experiments we conducted, we did
not observe any damage, but we did not intensively test the models to quantify
model durability.
In the context of the practical guidelines set out in Chapter 3 (Table
2), the LV model of this chapter is shaped according to the ViVitro LV model
and the natural shape is not yet incorporated. This simplified LV geometry
comprises an EDV of 127 ml. However, to enable the torsional motion, the
LV model is needed to be stretched and therefore the equilibrium volume of
127 ml is set for this torsional model to be ESV. This results in rather non-
physiological values for ESV and EDV (127 ml and 207 ml) and an ejection
fraction of 38%. This limitation is not an important issue in this conceptual
phase but, when interventricular flow patterns are of relevance, physiological
values of EDV and ESV need to be respected. This issue will be further
addressed in the LV models of Chapters 10 and 11 which are based on patient-
specific geometries (ESV 57 ml). Also, the thick-walled approach (PG1) as
well as the integration of active contractile wall elements (PG3) have not been
taken into account in this model, but are addressed in Chapters 5 and 6 for
PG1, and Chapter 6 for PG3.
Another limitation, which is typical for Type-I models, is the fixed
valve plane which not only disables the downward motion (PG8) but also
limits the ventricular torsion to act only in one direction, whereas in the natural
ventricle the total torsional angle is composed of an apical and a basal
component, as described in Chapter 1 (see § 1.3.3.2). If these components are
of relevance for the study approach, one must consider making use of the
Type-II model, which allows the use of the more nature-like approach of a
‘floating’ type of valve plane.
7.9 CONCLUSION
In this chapter, we have described an innovative approach that allows for a
more accurate modelling of left ventricular torsional, longitudinal and
circumferential deformation patterns.
The novel left ventricular model comprises a flexible wall in which
fibers are spirally arranged around the left ventricular model circumference.
As a consequence of this slant directed anisotropy, the model wall is forced to
deform in a twisting manner. A nature-like - clockwise during the ejection
phase - torsional angle of 17° was obtained with an anticlockwise fiber
orientation angle of 20°.

7. MODELLING THE TORSIONAL MOTION OF THE LEFT VENTRICLE BY INTEGRATION OF ANISOTROPIC MATERIAL PROPERTIES
194
Apart from the practical guidelines PG1, PG3, PG4c and PG8 (as
mentioned in the limitations section), this model is able to meet the other
guidelines, namely: the anisotropic wall properties are included (combining
an elastic with an fiber component) (PG2), mimicking the global ventricular
wall deformation patterns such as longitudinal and circumferential
deformation (PG4), and inclusion of the twisting motion (PG5). Because of
its compatibility to existing cardiovascular systems, we expect that this
concept will be highly useful for further ventricular torsion-related research.

195

196

197
PART III. IN-VITRO
MODELLING OF THE
MITRAL (AND VENOUS)
VALVE
Part III
In-vitro modelling of
the mitral (and venous)
valve

198

199
Chapter 8 Modelling the mitral valve using a fiber-based composite material
Modelling the mitral valve using a
fiber-based composite material
This chapter describes the design of two mitral valve models (MV1 and MV2)
which have a similar material composition (embedding fibers into a flexible
matrix) as the LV3 model which is described in the previous chapter. However,
in this case, this fiber-based material composition is not applied to induce
deformation patterns, but to obtain nature-like leaflet properties, which
combines a firm leaflet structure to withstand the high blood pressures with
leaflet bend flexibility to diminish transvalvular flow resistance.
The MV2 model will be implemented into the integrative left heart models
presented in Chapters 10 and 11.
8.1 INTRODUCTION
As emphasized in Chapter 3 (see § 3.3), there are - to the best of our
knowledge - no in-vitro mitral valve models that include all elementary
features of the natural mitral valve available to date. In this study, we propose
a novel approach of modelling mitral valves that (1) makes use of a fiber-
based composite material and (2) provides a valve with a (simplified) natural
mitral valve geometry. This approach enables us to include core anatomical
structures of the mitral valve such as the flexible and saddle-like annulus, the

8. MODELLING THE MITRAL VALVE USING A FIBER-BASED COMPOSITE MATERIAL
200
anterior (AML) and posterior leaflets (PML), the chordae tendineae as well as
the anterolateral papillary (ALPM) and posteromedial papillary muscles
(PMPM).
This final model is the result of an optimization process by which we
gradually improved design criteria such as model design, production process,
and material properties. This chapter has the objective to introduce the design,
characteristics, and practical realization of the mitral valve model. It focuses
on two in-vitro mitral valve models that mainly differ in leaflet geometry and
material composition. The first model (MV1) generates pathological-like
values, whereas the second model (MV2) mimics normal values of
physiological function. Later on in this dissertation, these two mitral valve
models are incorporated and tested in an integrative left heart model (see
Chapters 10 and 11 for more information). In Chapter 10, we will further
elaborate on the experimental results of the performance of this mitral valve
within the integrated left heart model. In the current chapter, we give an
introduction and a brief summary of these results in order to provide a first
evaluation of the valves’ functionality.
8.2 MODEL DESIGN
In order to enable the accommodation of the valves within the physical left
heart model, we based the mitral valve geometry of the two models on that of
the 3D Zygote heart model (Zygote Media Group Inc., UT, USA). The
SolidWorks (Dassault Systèmes SolidWorks Corp., Concord, MA) version of
this left heart CAD model formed the basis of the physical left heart model.
While evaluating the 3D Zygote heart model, we noticed that its mitral valve
geometry resembles a stenotic-like valve type, even though this was not the
developers’ objective. As the geometry of MV1 (Figure 89 top panel) is based
upon Zygote’s original mitral valve geometry, this first model also reflects
more stenotic-like valves. We slightly modified the Zygote’s leaflet geometry
by extending the leaflet tips to obtain a coaptation length of 4 mm.
For MV2, we adapted the geometry of MV1 towards a more optimized
leaflet shape in order to obtain a more accurate imitation of the physiologically
healthy mitral valve (see Chapter 1). The saddle-like annulus is kept identical
to the Zygote model, with a short axis of 32 and a long axis of 48 mm. As
illustrated in Figure 89 (bottom panel), we used the following parameters (see
§ 1.4.2.2) [51, 54]: (1) the PML comprises 2/3 and the AML 1/3 of the annulus
perimeter, (2) the PML contains 1/3 and the AML 2/3 of the valve surface, (3)
the AML is 2/3 of the PML leaflet length at the level of the middle section,
(4) the PML is oriented at an angle of 50° with respect to the general annulus

8. MODELLING THE MITRAL VALVE USING A FIBER-BASED COMPOSITE MATERIAL
201
plane, and, as in MV1 and (5) the coaptation length is set to 4 mm with a total
valve height of 20 mm.
8.3 MODEL COMPOSITION
The natural mitral valve leaflets are mainly composed of collagen and elastin
fibers. These fibers are well-arranged over the surface of the leaflets and
merge into the chordae tendineae. This anatomical fiber pattern results in a
firm structure which can withstand the high blood pressures while
demonstrating low bending resistance, enabling the leaflets to smoothly open
and close with only a minimum of energy losses. In our modelling approach,
we mimicked these physiological material properties by embedding strong
fibers (mimicking the collagen fibers) into a flexible matrix (mimicking the
elastin fibers) by a three-layered structure that includes a fiber layer which is
sandwiched between two layers of elastic material. The leaflet fibers are
oriented radially with respect to the annulus and continue beyond the leaflets,
as such, modelling the chordae tendineae which will be in a later stage
attached to the corresponding papillary muscles of the left heart model. In
addition to the radially-oriented fibers, we provided the mitral valve model
with a parallel-oriented fiber at the level of the leaflet tips to avoid rupture of
the leaflets along the radial fibers during valve closure. This MV model fiber
pattern is illustrated in Figure 90 C.
Figure 89: Geometrical design of MV2 with an identical mitral annulus of the Zygote CAD
model.

8. MODELLING THE MITRAL VALVE USING A FIBER-BASED COMPOSITE MATERIAL
202
8.4 MATERIALS AND METHODS
The production of the models includes a six-step procedure which is based on
a dip coating process [89, 95, 96], extended with the implementation of the
fiber component. First, an aluminum matrix (Figure 90 B) is produced using
a 5-axis milling machine (DMU 50 eVolution, Deckel Maho Gildemeister,
Pfronten, Germany) according to the two geometrical designs presented
earlier (STEP 1) (Figure 90 A). Then, the aluminum mold is finished by a
polishing treatment to obtain a glossy mold surface that guarantees a smooth
inner surface of the actual model leaflets later in the process (STEP 2). After
finishing the aluminum mold, the actual mitral valve model is produced by
building up three layers. The first layer is formed by the silicone coating (HT
33 Transparent, Zhermack SpA, Italy) of the aluminum mold (STEP 3). After
the first silicone layer is cured, the second layer is realized by the deposition
of the fibers (STEP 4). This includes two radial fibers at the anterior and
posterior commissures, four fibers which are evenly distributed along the
anterior and posterior leaflet surfaces, and one parallel fiber at the level of
leaflet tips which are deposited on top of the radial fibers. These fibers are first
submerged in silicone to facilitate fiber deposition and to enhance adhesion
between the fibers and the silicone material. This submerging process is
performed under vacuum conditions for the elimination of air inclusions. After
this second layer is finished, the third layer is realized by repeating STEP 3
(STEP 5). In the final step, the mitral valve model is removed from the
aluminum mold (STEP 6), as shown in Figure 90 C.
We used two fiber types for these models. The first are ordinary cotton
sewing threads which we used for the radial fibers of both models, as well as
for the parallel tip fiber of MV1. We opted for a garish thread color (dark
green) to enhance model visibility, to enable visual inspection during the
experiments where the valve model is integrated in the left heart model. The
second fiber types are Nylon multifilament yarns, which are much thinner (0.1
mm) than the cotton threads (1.0 mm). This fiber type is used for the parallel
tip fiber of MV2 as we reasoned that this would likely result in better leaflet
bending properties and a reduction of leakage during valve closure. The total
leaflet thickness ranged for both models from about 0.3 mm between the fibers
to about 1.0 mm at the level of the threads. The leaflet tip thickness of MV2
is reduced from 1.0 mm to about 0.4 mm.
After production finalization, these in-vitro mitral valve models were
subsequently integrated into the left heart model, as briefly illustrated in
Figure 91.
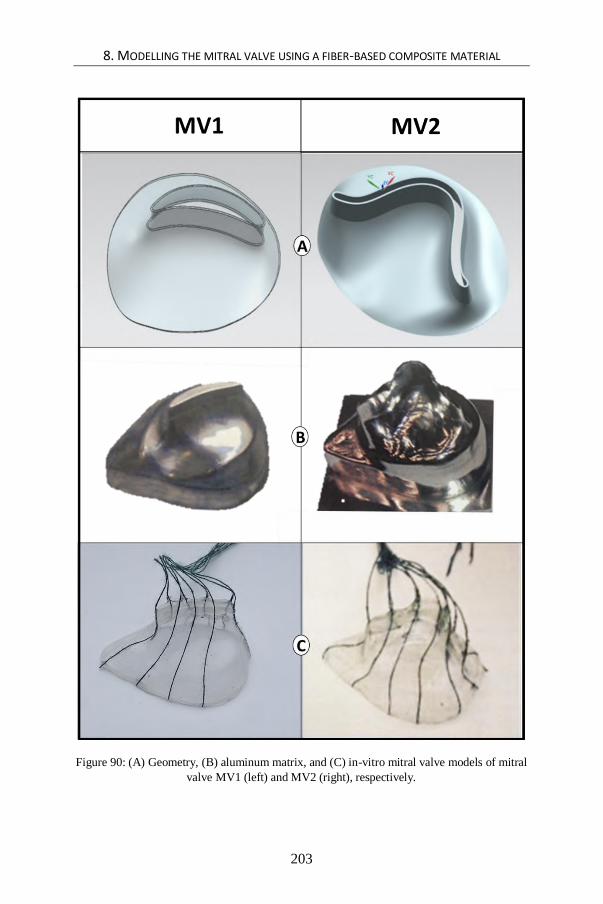
8. MODELLING THE MITRAL VALVE USING A FIBER-BASED COMPOSITE MATERIAL
203
Figure 90: (A) Geometry, (B) aluminum matrix, and (C) in-vitro mitral valve models of mitral
valve MV1 (left) and MV2 (right), respectively.

8. MODELLING THE MITRAL VALVE USING A FIBER-BASED COMPOSITE MATERIAL
204
Figure 91: Integration into the left heart model and close up of MV1 (left) and MV2 (right),
respectively.
8.5 EXPERIMENTS AND RESULTS
The two models have been validated by two experiments. First, before being
integrated into the left heart model, they have been subjected to static pressure
tests providing a quick qualitative assessment. Second, after integration of the
valve models into the left heart models, validation was obtained via dynamic
tests in a circulatory mock loop. More details about the integration of the
mitral valve models, the experimental setup and preliminary results are
described in Chapter 10 (§ 10.4 and § 10.5). In this section, we only provide
a short summary of those results reflecting the mitral valve’s functionality.
For the static pressure tests, the mitral valve models are built into a
custom-made valve plane where both the annulus and the chordae tendineae
are held in a fixed position. Valves were subjected to a backpressure of 140
mmHg, which is a slightly higher value than the normal end systolic pressure
of 120 mmHg. These experiments showed that both valves were able to resist
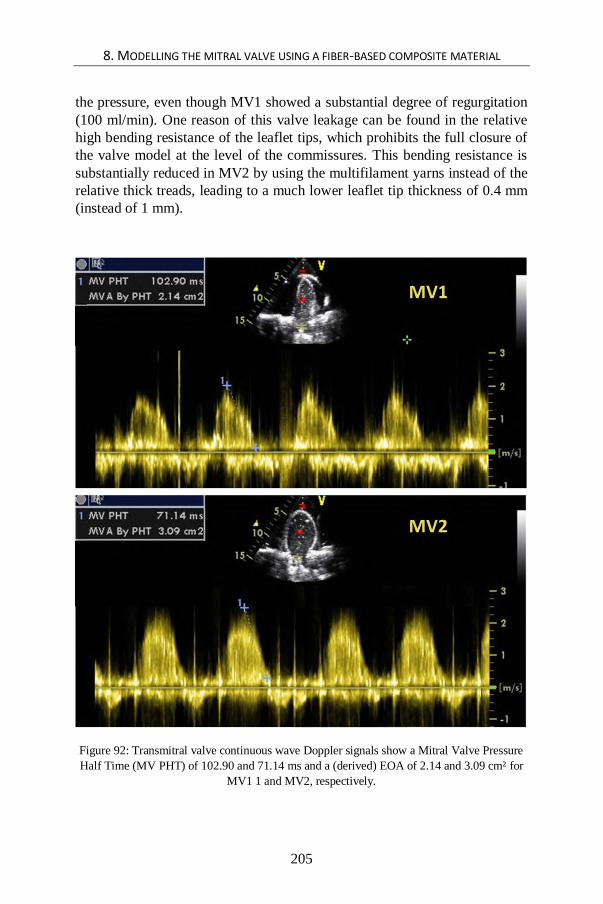
8. MODELLING THE MITRAL VALVE USING A FIBER-BASED COMPOSITE MATERIAL
205
the pressure, even though MV1 showed a substantial degree of regurgitation
(100 ml/min). One reason of this valve leakage can be found in the relative
high bending resistance of the leaflet tips, which prohibits the full closure of
the valve model at the level of the commissures. This bending resistance is
substantially reduced in MV2 by using the multifilament yarns instead of the
relative thick treads, leading to a much lower leaflet tip thickness of 0.4 mm
(instead of 1 mm).
Figure 92: Transmitral valve continuous wave Doppler signals show a Mitral Valve Pressure
Half Time (MV PHT) of 102.90 and 71.14 ms and a (derived) EOA of 2.14 and 3.09 cm² for
MV1 1 and MV2, respectively.

8. MODELLING THE MITRAL VALVE USING A FIBER-BASED COMPOSITE MATERIAL
206
Figure 93: Transmitral pressure differences during early diastole (TMPDe) of MV1 and MV2.
Second, the mock loop experiments include an ultrasonic
investigation (Vivid 7, GE, Vingmed, Horten, Norway) and pressure
measurements using a sensor catheter (SPR-721, Millar Instruments; Houston,
TX, USA). These results (also described in Chapter 10) show an Effective
Orifice Area (EOA) of 2.28 and 3.04 cm² for valve 1 and 2, respectively
(Figure 92). The Trans Mitral Pressure Difference during early diastole
(TMPDe) averaged over the diastolic phase, for a cardiac output of 5.6 l/min
and a heart rate of 70 beats/minute, was 28.58 (SD = 12.6) and 3.66 (SD =
1.66) mmHg for MV1 and MV2 respectively Figure 93. Durability tests have
not been performed deliberately, but the two valves have lasted the extensive
experiments of Chapters 10 and 11, which comprised about 4600 and 2000
cycles for MV1 (Chapters 8 and 10) and MV2 (Chapters 10 and 11),
respectively.
8.6 DISCUSSION AND CONCLUSION
The described approach enables the mimicking of a natural mitral valve while
including its most elementary features and geometrical shape, which is - to the
best of our knowledge - unique. The integration of fibers into a flexible matrix
and the three-layer composition models respect the architecture of the
biological mitral valve. Furthermore, our methodology allows for the
integration into a left heart model, as will be elaborated on in Chapter 10,
providing reasonable performance in terms of effective orifice area and
transmitral pressure gradients for MV2.

8. MODELLING THE MITRAL VALVE USING A FIBER-BASED COMPOSITE MATERIAL
207
We realized two working prototypes. The first one demonstrated
the proof of concept of the production process, whereas the second one is a
further optimized version of the valve model in terms of geometry and leaflet
tip fiber. While MV2 meets our goal to generate more physiology-like values
of mitral valve performance, MV1 is also interesting as it turns out to be a
model of a stenosed mitral valve, exhibiting high TMPDe, low EOA, and
regurgitation. Overall, these mitral valve prototypes demonstrate that this new
approach can be used to model normal as well as pathological mitral valves.
As summarized in Table 8, this model partly meets the practical
guidelines of a basic in-vitro mitral valve as a reproducible mitral valve
apparatus model with a parametrized geometry and including all basic feature
of the mitral valve apparatus, such as the anterior (A) and posterior (P) leaflets
(PG6a) which are hinged in a saddle-like annulus (PG6b) and made of a fiber-
based flexible material (PG6c) and including the chordae tendineae (PG6d).
However, the integration into the valve plane (PG7) and the connection with
the papillary muscles (PG6e) are further discussed in Chapters 10 and 11.
Because of the absence of such a model to date, we expect that this concept
will be highly useful for future in-vitro mitral valve modelling.
8.7 LIMITATIONS AND FUTURE DIRECTIONS
Some limitations of this approach should be noted. First, the orientation of
leaflet fibers is radial relative to the annulus. A more physiological approach
could be attained by incorporating a parallel fiber orientation (see § 1.4.2.2).
Second, the fibers in our approach have been modelled as a small number of
relative thick threads, whereas a more nature-like and more durable approach
would be achieved by using a large number of homogeneously distributed thin
fibers. A third limitation is more production-related. Even though the silicone
dip coating of an aluminum core is a straightforward and generally used
technique, an unwanted side effect is that there are inherent local wall
thickness variations. Fourth, our models do not completely capture the
complexity of the human mitral valve as we shaped our model should be
conceived as merely a generalization of reality. Finally, in this conceptual
phase of the work, we used ordinary cotton sewing threads and a general
purpose silicone. There is a large range of flexible and advanced fiber
materials that can be explored to further optimize the mitral valve model
leaflet characteristics.
Nevertheless, the described approach can be considered a major
step forward for the in-vitro modelling of mitral valves and has great potential
in the context of evolving digital technologies. The very fast advances in
medical imaging and 3D printing technology will enable the realization of

8. MODELLING THE MITRAL VALVE USING A FIBER-BASED COMPOSITE MATERIAL
208
even more realistic mitral valve models in the next few years. Today, highly
detailed patient specific geometries can be obtained by the segmentation of
high-resolution medical images. The combination of these techniques with the
current approach may enable the production of patient-specific in-vitro
models. Major revolutions can also be expected from the 3D printing
technology where multiple research efforts are directed to high resolution
printing with flexible materials. If this endeavor could be combined with the
deposition of multiple thin fibers according to the anatomical fiber orientation
of a natural mitral valve, great advances in in-vitro valve modelling can be
anticipated.

209
Chapter 9 Innovative design of a PIV compatible venous valve model
Innovative design of a PIV compatible venous valve model
This chapter is based on “Innovative design of a venous valve intended for PIV
measurements”, published as a proceeding in the ASME Summer
Bioengineering Conference (2011) by Van Der Smissen B., Van Canneyt K.,
Vermeulen M., Bayley M., Narracott A., Kaminsky R., Van Ransbeeck P.,
Verdonck P. and Segers P. [189].
At first sight, venous valves models (VV) are out of the scope of left heart
modelling. However, it is worthwhile to include this chapter into this
dissertation because the approach we developed to build a PIV compatible
venous valve model for optimizing in-vitro modelling research in the context
of hemodialysis is directly applicable to our ideas towards building PIV
compatible models of the left ventricle (LV5) and even of the full heart (FH2).
We will discuss this pathway for future research in the final chapter of this
dissertation (see § 12.2).
9.1 INTRODUCTION
Today, hemodialysis is a common therapy to treat people with severe
chronic kidney disease. This therapy strongly relies upon the vascular access

9. INNOVATIVE DESIGN OF A PIV COMPATIBLE VENOUS VALVE MODEL
210
that connects the patient’s circulation to the artificial kidney and which is
obtained by surgically creating an arteriovenous fistula in the arm. However,
due to the high flows involved at the venous side and elevated venous
pressures, the functioning of venous valves in the arm is significantly
disturbed, which too often bring about serious dysfunctions or complications
in the patient [190, 191]. To this end, research is done to improve the outcome
of vascular access in patients on hemodialysis therapy by means of
computational modelling [192]. One crucial challenge, however, is
experimental validation of these computer models, preferably by using
Particle Image Velocimetry (PIV) for simulations of flow fields. Yet, the task
of modelling the venous valve is daunting because this valve functions at very
low physiological pressure differences. Moreover, PIV requires an
experimental model to be fully transparent. To our best knowledge, no such
in-vitro models have been developed to date.
In the framework of this dissertation (see § 3.5; Table 8), we identify
the need for such a PIV compatible venous valve model for the validation of
CFD models as NEED4. Ideally, such a model should be transparent for
use in PIV simulations while keeping its functionality at low pressure
difference. This can be defined as a ninth and final practical guideline (PG9).
In this study, we propose an innovative design of a PIV compatible venous
valve model which has the ability to function at minimal pressure differences
and which is able to generate valuable PIV data.
9.2 MATERIALS AND METHODS
9.2.1 Practical guidelines for building the venous valve model
In order to build a venous valve model for PIV validation, we chose to start
from a very thin, highly transparent, plastic sheet with a thickness of 0.03 mm.
Although it is not straightforward to build a 3D venous valve starting from a
2D sheet, we preferred this strategy for two main reasons. The first reason is
the minimal bending stiffness of a thin film to ensure well-functioning of the
valve model at minimal pressure differences. The second reason is the
advantage of no restriction to match the refractive index of the structure and
fluid material. In order to perform PIV measurements, the refractive index of
structure and fluid need to be matched. Knowing that its importance is relative
to the distance through which the light passes through, light deviation is
limited in a very thin structure. Therefore, it can reasonably be assumed that
the refractive index match can be neglected with the given refractive indices
of the fluid 1.42 and the valve model material 1.59 [193].

9. INNOVATIVE DESIGN OF A PIV COMPATIBLE VENOUS VALVE MODEL
211
Figure 94: a) Drawing of the valve model (VV) with different sections in the XY plain and
pictures in open air at b) XZ and c) YZ position.
The conversion of the two-dimensional thermoplastic polymer film to
a three-dimensional venous valve model was realized by welding, using a
household vacuum sealer (Krups Vacupack 2 Plus, Krups, Peoria, IL, USA).
The welding time and pressure were adjusted by trial and error in order to
obtain qualitative welds. Although the biological venous valve is better
represented using a curved line leaflet attachment to the wall, we assumed a
straight weld line attachment, which resulted in a more simple constructing
procedure, depicted in Figure 94.
To build the cylindrical three-dimensional venous valve, starting from
the two-dimensional sheet, a step-by-step plan can be followed. First, draw
the parametric pattern depicted in Figure 95 on a highly transparent
thermoplastic film, e.g., a polystyrene film (as often used for flower or present
packing). Then, cut out the rectangle and the two triangles, representing the
lumen wall and the two leaflets respectively. After that, position the leaflet
line W1 to lumen wall line W1 and weld them together. Next, position leaflet
line W2 to the lumen wall line W2 by keeping the leaflet flat and at the same
time folding the lumen wall part according to Figure 95. This folding is
necessary because the triangle leaflet basis, being πr, differs from that of the
lumen wall, being 2r (with r 12.5 mm). After the first leaflet is attached to the
lumen wall, the second one is performed likewise. Finally, in order to obtain
a cylindrical three-dimensional venous valve model, fold the lumen wall to a
cylinder, match W5 at the left side and W5 at the right side of the primary
lumen wall rectangle and weld the two sides of the lumen wall together to
obtain a sealed vessel wall. The venous valve model is now ready for
experiments.

9. INNOVATIVE DESIGN OF A PIV COMPATIBLE VENOUS VALVE MODEL
212
9.2.2 Experimental setup
In order to test this new design of the valve, we built a scaled model with a
diameter of 25 mm. Testing of the valve included a functional as well as a PIV
experiment.
The functional experiment involved a vertically positioned valve with
a long outflow tube appended. In this tube, water was slowly added to a height
of 1.5 m to test for leakage and pressure resistance. The PIV experiment
encompassed a horizontally positioned valve (see (Figure 96 a) which was
connected to a hydraulic mock loop The fluid was directed by a steady flow
pump, first through a long inlet tube of 1 meter, then through the valve, and
subsequently through the outlet tube into an open reservoir which was again
connected to the pump. For the test fluid, we used 42/58 water/glycerin mass
percentage mixture seeded with polyamide microspheres particles (diameter
57μm). A Standard 2D normal speed PIV system (ILA GmbH, Juelich,
Germany) was employed to perform the flow analyses and a double pulsed
Nd:YAG laser (max. 120mJ) was used as a light source. A CCD Sensicam QE
camera (PCO, Kelheim, Germany) with a resolution of 1376 x 1040 pixels
was used to record image pairs at 8Hz. Post processing of the images was
performed with commercial VidPIV 4.6 software (ILA GmbH, Juelich,
Germany). In the region of interest, in plane velocity vectors and magnitudes
were computed by averaging 500 instantaneous flow field measurements.
9.3 RESULTS
For the functional experiment, the filling of the space behind the leaflets was
sufficient to close the valve after a minor modification of the design by adding
an extra weld at W6 (see Figure 95). The valve kept closed when more water
was added, up to a height of about 1.5 m, which indicates that the valve model
could well resist these higher pressure differences (approx. 110 mmHg).
While calibrating the PIV measurements, we did not notice light
distortion due to the difference of refractive index between the test fluid and
the valve material. Also, when the model was immersed in water/glycerin
mixture, the valve model could hardly be differentiated from the surrounding
fluid, confirming our hypothesis that the use of a thin sheet does not require
special precautions with respect to refractive index matching. Figure 96 b
shows the PIV results of the stationary flow with a parabolic flow profile
showing a maximum velocity of 1.6 m/s for a Reynolds number of 689.

9. INNOVATIVE DESIGN OF A PIV COMPATIBLE VENOUS VALVE MODEL
213
Figure 95: Step-by-step plan to build the cylindrical three-dimensional VV model starting
from a two-dimensional sheet.

9. INNOVATIVE DESIGN OF A PIV COMPATIBLE VENOUS VALVE MODEL
214
Figure 96: a) PIV setup of the valve model in a transparent box in open air, and b) the
according PIV results.

9. INNOVATIVE DESIGN OF A PIV COMPATIBLE VENOUS VALVE MODEL
215
9.4 DISCUSSION AND CONCLUSION
Although the experimental venous valve model clearly remains a work in
progress, this novel valve design signifies an important step forward. To the
best of our knowledge, this is one of the first functional venous valve models
that is compatible with PIV. Our innovative design using the transparent and
pliable features of polymer film resulted in an operational valve that is
sensitive for fluid motion and able to function at low pressure differences
(PG9, Table 8). Moreover, these preliminary results show that PIV
measurements are not only available for flow patterns adjoining the valve but
also within the valve itself. This opens the intriguing possibility to
experimentally assess and examine intra-valvular flow patterns. Taken
together, this valve design appears a promising tool for use in experimental
validation studies of computational models of valve configurations.
9.5 LIMITATIONS AND FUTURE RESEARCH
Future challenges to be incorporated in the model can be noted. In order to
obtain a simple construction procedure, we assumed a straight weld line
attachment, although the biological venous valve would be better represented
using a curved line leaflet attachment to the wall [194]. Also, we did not take
into account the elasticity of a natural venous valve. Given that the
construction procedure allows for a wide choice of thermoplastic materials,
one might pursue a material that more closely resembles the properties of the
biological venous valve tissue. Further research could also address the
versatility of this valve design to mimic other cardiovascular valves.

216

217
PART IV. MODELLING
THE LEFT HEART: AN
INTEGRATIVE
APPROACH Part IV
Modelling the left
heart: an integrative
approach

218

219
Chapter 10 Modelling the left heart by a monolithic approach
Modelling the left heart by a
monolithic approach
In Part IV, two left heart models, namely LH1 and LH2, are realized by
integrating different innovative elements from previous chapters, as well as
some new features. As such, in Chapter 10, a nature-like geometry (including
papillary muscles as new features) is added to a traditional thin walled left
ventricular model and combined with the mitral valve MV2 (Chapter 8). Then,
in Chapter 11, this model is extended by the anisotropic wall properties
described in Chapter 7.
Chapter 10 focuses on the model design aspect by means of a monolithic left
heart model version, whereas Chapter 11 focuses on the study of LV wall
deformation patterns by means of a bilithic version including a number of
modular LV models. In both chapters, the left heart model is mounted into an
existing pulse duplicator system [100, 103, 119, 124, 184], which is described
in the state-of-the-art of in-vitro models (Chapter 2).
10.1 INTRODUCTION, DESIGN AND COMPOSITION
As extensively discussed in Chapter 3, a key objective of in-vitro modelling
is to mimic anatomical features as realistic as possible. In this chapter, we
describe our novel approach of modelling the left heart (LH1) which leads to

10. MODELLING THE LEFT HEART BY A MONOLITHIC APPROACH
220
a closer approximation of real anatomic features. It outperforms existent
cardiovascular simulators in at least four ways.
First, most currently used cardiovascular simulators are made of rigid
components (Chapters 3 and 4), while the real heart consists only of soft tissue
(Chapter 1). In our approach, a more nature-like representation of the soft
tissue is attained by assembling the new left heart model using flexible
materials.
Second, current in-vitro cardiovascular models are much bulkier in
volume compared to the natural heart. This relates to the fact that many setup
components (e.g., left atrium, mitral valve, left ventricle) have to be modular
to suit multiple experimental set-ups. However, in our design, the left atrium,
mitral valve and left ventricular assembly are made in one single piece which
results in a more compact and more nature-like model.
Third, we aim to mimic the left heart’s working as a complex
cooperation of various cardiovascular compartments. The new model includes
the left atrium, mitral valve, left ventricle, (mechanical) aortic valve as well
as the aortic arch. In the atrium, we also modelled the entrances of the four
pulmonary veins (the left and right superior, and left and right inferior
pulmonary veins) to mimic the blood flow from the lungs into the left atrium.
Also, by integrating the mitral valve model MV2 (§ 8.2), our model is one of
the first to include multiple mitral valve components at once, such as the
flexible and saddle-like annulus, the anterior (AML) and posterior leaflets
(PML), and the chordae tendineae which are connected to the left ventricle via
the two papillary muscles.
A fourth asset of this model is that it draws its geometry directly from
medical images of a real heart. Furthermore, similar to several other existing
left heart models, our new model also shows compatibility with conventional
clinical evaluation techniques such as ultrasound and pressure catheters.
Figure 97 gives an overview of the left heart components which are included
in the LH1 model.
It is worth mentioning that the left ventricle model is based upon the
ordinary thin walled flexible models, which are able to generate the
longitudinal and circumferential deformation patterns (PG4a-b). However,
the integration of the papillary muscles and the connection with a mitral valve
model are innovative aspects.

10. MODELLING THE LEFT HEART BY A MONOLITHIC APPROACH
221
Figure 97: The components of the natural left heart (left panel) and the final LH1 model (right
panel) with chordae tendineae (ChT) and pulmonary artery (PA).

10. MODELLING THE LEFT HEART BY A MONOLITHIC APPROACH
222
10.2 REALIZATION OF THE MONOLITHIC LEFT HEART MODEL
The manufacturing of this in-vitro monolithic left heart model is a complex
task as it requires taking into account a combination of critical fabrication
criteria. First, the relatively complex shape of the left heart is a difficult aspect
in the context of generating a monolithic model. Second, integrating the mitral
valve model in this monolithic left heart model is not straightforward because
it simultaneously requires an accurate positioning, a flexible annulus and
valve plane suspension, as well as a firm attachment to the surrounding
components. Moreover, also the chordae tendineae need to be firmly attached
to the left ventricular wall via the papillary muscles. In this section, we
describe the method we developed to realize this functional left heart model
while accounting for these criteria.
A schematic overview of the fabrication procedure of the left heart
model is presented in Table 4 and Figure 98. In short, this procedure involves
eight steps which will be further discussed in detail in the subsequent section.
First, a 3D solid heart model has been created from actual medical images
(STEP 1). Next, the geometries of the left atrium and left ventricle were
extracted by means of CAD (Computer-aided design) software (STEP 2) and
subsequently 3D printed (STEP 3). These printed models were then used to
produce silicone molds (STEP 4) which served later in the process for creating
hollow wax models (STEP 5). These models then functioned as sacrificial
cores, which were fabricated by a rotational molding technique. After that, we
manually positioned the MV model between the two wax models of the left
atrium and left ventricle. In this way, a matching LA-MV-LV set was formed
by the unique fit between the different parts (STEP 6). Next, while the whole
assembly is kept in fixed position, the left heart assembly was coated by a
number of silicone layers until the required thickness is achieved (STEP 7).
During the silicone curing periods, the model was consequently exposed to a
quasi-random three-dimensional rotation in order to obtain uniform layer
thickness, using a custom-made rotation system specifically built for this
purpose. These silicone layers covered the left atrium as well as the left
ventricular wax models, hence representing the left atrium and left ventricular
walls of the final model. These silicone layers also merge with the annulus of
the MV model, hence resulting in a monolithic, flexible left heart model.
Finally, after the silicone coatings were fully cured, the sacrificial cores were
carefully broken into small pieces and subsequently removed from the silicone
model (STEP 8). The remaining result is a flexible thin-walled model of the
left heart, ready for the next phase, which is the connection with the ViVitro
system. In the following paragraphs, we provide more details on this eight-
step manufacturing procedure.

10. MODELLING THE LEFT HEART BY A MONOLITHIC APPROACH
223
Table 4: Fabrication procedure of the LH1 model.
10.2.1 Preparation of the CAD heart model
STEP 1 – To obtain an anatomically accurate model, we sought for a virtual
3D heart geometry, acquired by the detailed processing of medical images
obtained by CT or MRI scanners. The Zygote 3D heart model (Zygote Media
Group Inc., UT, USA) was considered the best option for providing the
geometry of the left heart model in our study. This virtual model of an entire
heart was developed from CT (GE Light Speed 64 slice) data from a healthy,
middle-aged Caucasian male. Acquisition and reconstruction of the data was
performed during 70% diastole. The model contains a smoothed heart shape,
while keeping relevant anatomical structures, such as the auricles and
papillary muscles, making it most interesting for our study. This virtual model
was made commercially available for use in SolidWorks (Dassault Systèmes
SolidWorks Corp., Concord, MA).
STEP 2 – Starting from this Zygote heart model, we used SolidWorks to
extract LA, MV and LV geometries of the left heart, according to the
following protocol. First, the blood cavity of the left heart is extracted,
consisting of the LA and LV cavities which, at this point, forms one single
part. Then, this part is divided into two parts by a Boolean subtraction by the
mitral valve MV1, which results in the left atrial and ventricular (including
the aorta) cavity geometries. This way of defining the geometry is of
importance later in the production process to realize an accurate position of
the left atrium and ventricle together with the mitral valve model in between.
It should be emphasized that because the focus of this study is on mitral valve
STEP 1 Create a 3D solid heart model based upon actual medical images.
STEP 2 Extract the geometries of the left atrium and left ventricle by means of CAD.
STEP 3 3D print the left atrium and left ventricle CAD models.
STEP 4 Produce silicone molds from these prints.
STEP 5 Create hollow wax models of the left atrium and left ventricle by rotational molding.
STEP 6 Manually positioned the MV model between the two wax models to form a matching LA-MV-LV set.
STEP 7Coat the left heart assembly by a number of silicone layers to form the one-piece left heart model. During
the silicone curing, expose the coated assembly to a quasi-random three-dimensional rotation.
STEP 8Carefully crush the sacrificial cores into small pieces and subsequently remove these from the silicone
model.
Fabrication procedure of the one-piece flexible LH1 model

10. MODELLING THE LEFT HEART BY A MONOLITHIC APPROACH
224
modelling, we did not model a nature-like aortic model. Instead, we made use
of a mechanical prosthetic aortic valve for the experiments. Finally, the CAD
files of the left atrium and left ventricle were converted to an STL format and
were sent to the 3D printer Objet 3D PolyJet (Objet Eden 350V, Stratasys Ltd.,
Rehovot, Israel).
10.2.2 Production of a sacrificial core by rotational molding
STEP 3 – The manufacturing of the mold was realized in three steps. First,
the virtual models of the left atrium and ventricle were 3D printed into solid
objects using the Objet 3D PolyJet (Objet Eden 350V, Stratasys Ltd.,
Minnesota) using a layer thickness of 16 µm (high quality modus). Second,
the printed parts were carefully taken off the building platform of the 3D
printer. Support material (i.e., jelly material providing spatial support while
3D printing) was removed by a high pressure water cleaner (Powerblast, 20-
120 bar, Balco, UK). Finally, support material residuals were removed by
chemical and ultrasonic cleaning (Sonic Industrial Bath, Alpha, Ghent,
Belgium).
STEP 4 – Subsequently, we realized the fabrication of the silicone molds of
the left atrium and the left ventricle (including the aortic arch). For this step,
the 3D printed parts were suspended in an open box with a distance of 2 cm
from the walls and from the bottom. A two- component Silicon (Essil 291,
Axson Technologies, Saint-Ouen-l’Aumône, France) was then poured into the
box, until the whole model was immersed for 2 cm. Next, air inclusions were
removed by placing the box in a vacuum system (MCP 4/01, HEK-GMBH,
Lübeck, Germany). After the silicone was cured, the silicone block was taken
out of the box and was subsequently divided by means of a surgical scalpel,
according to well-specified incisions. The 3D printed parts were carefully
taken out and the silicone block was assembled back together to provide a
casting mold. In this casting mold, a runner was included to allow wax casting.
The selection of optimal incisions to open the silicone block has been
of utmost importance, especially for attaining models of complex geometries,
such as the left heart. On the one hand, the incisions needed to be long enough
to smoothly remove the 3D printed parts. Also, these incisions must allow to
smoothly remove, after wax casting, the fragile hollow wax parts without
breaking them. Thus, the more complex the casting parts are, the more section
lines are needed to allow a successful extraction. On the other hand, the
incisions and the according section lines needed to be confined enough to
permit a tight-fitting reassembling of the silicone mold. It is of vital
significance that the different parts of the silicone block fit well together in
order to restore the mold in its original shape. Shifting of the different parts of

10. MODELLING THE LEFT HEART BY A MONOLITHIC APPROACH
225
the mold relative to each other may lead to geometrical defects of the internal
cavities and the resulting casted product. Moreover, attention needed to be
directed to the fact that section lines in the silicone mold would result in scars
on the casted model. In order to take into account these prerequisites, we opted
to only apply partial cuts, so that the silicone mold remained in one piece at
all times. In this way, section lines could be limited in length and the correct
reassembling of the silicone mold is enhanced. For the left atrium silicone
mold, the silicone block was cut according to one section line, first going
along the aortic arch, then via the mitral annulus and the left ventricle and
towards the apex. Whereas for the more complex LV-aorta part, the silicone
mold was provided with two section lines, the first going along the four
pulmonary veins and the second first along the auricle and then towards the
mitral annulus.
STEP 5 – The next step involved the fabrication of the hollow wax replicas.
After the silicone mold is opened and the printed parts are removed, the mold
is folded back in its original position. Then, a limited fraction of heated wax
is casted into the mold. Immediately afterwards, the mold is subjected to a
three-dimensional rotation which causes the melted wax to cover the complete
wall surface of the internal molt cavity. During this process, liquid wax
solidifies and forms a hollow wax replica of the mold’s internal geometry.
Finally, after the solidification is complete, the wax part is carefully removed
from the mold.
Two critical parameters in the process of hollow wax replica
production are worth mentioning: (1) the wax casting temperature, and (2) the
liquid wax volume fraction. Wax casting temperature is inversely related to
the wax viscosity and hence determines the coating behavior. Obtaining a
careful balance between these two parameters has been a challenge. On the
one hand, higher casting wax temperatures lead to lower wax viscosities and
bring about local lower wall thicknesses during wax solidification. This results
in regional fragility of the hollow wax model, rendering the model susceptible
to cracking when it is taken out of the mold. On the other hand, lower wax
casting temperatures lead to higher wax viscosities, higher wall thicknesses,
and a shorter solidification time. Too short solidification times lead to
uncoated regions, which finally result in incomplete hollow wax parts. An
optimal temperature results in a wall thickness that is high enough to keep the
hollow wax model intact during removal from the silicone mold and small
enough to allow the crushing and removal of the wax model from the final
silicone left heart model (see STEP 6-8). In this study, wax (Green Casting
Wax, Kerr Ltd, Peterborough, UK) is heated to 85°C and casted into the mold
(at room temperature 21°) with liquid wax volume fractions of 50 and 70 ml
for the left atrium and left ventricular models, respectively.

10. MODELLING THE LEFT HEART BY A MONOLITHIC APPROACH
226
Figure 98: Schematic overview of the manufacturing procedure of the LH model:
1) the creation of a virtual 3D model from medical images, 2) the extraction of the left atrial
and ventricular cavities using CAD (Computer-aided design) software, 3) the building of the
physical left heart parts using 3D printing, 4) the production of the silicone molds, 5) the
fabrication of the wax replica of the 3D printed parts with rotational molding, 6) the assembly
of LV, LA and MV, 7) the creation of the thin-walled flexible left heart model by a custom-
made rotation system, and finally 8) the removal of the wax cores to obtain the flexible thin-
walled, monolithic left heart model.

10. MODELLING THE LEFT HEART BY A MONOLITHIC APPROACH
227
10.2.3 Creation of the left heart model and integration of the mitral
valve model
The creation of the thin-walled flexible left heart model is finalized in STEP
6 to 8. First, the thin-walled wax replicas of the left atrium and the left
ventricle are assembled together and the mitral valve MV2 (as described in
more detail in Chapter 8) is carefully positioned in between these two wax
replicas (STEP 6). Then, the actual left heart model is created by a silicone
coating procedure (STEP 7). In a final step, the wax replicas are removed from
the model (STEP 8).
STEP 6 – For the assembly of the wax replicas, the mitral valve model is first
mounted on top of the left ventricular wax replica and the connection of the
chordae tendineae with the corresponding papillary muscles is realized. The
chordae tendineae of the MV model (MV1, as described in Chapter 8) are first
brought into the wax left ventricular wax model at MV tip region and then
brought out back again at the corresponding papillary muscle end region. In
our model, we equally divided the chordae tendineae over the two papillary
muscles. After the careful positioning of the MV model, the left atrial wax
replica is mounted on top of the mitral valve-left ventricle-assembly. A proper
orientation of these three parts is achieved by the mutual unique fit which is
set during the CAD design process. In order to keep these matching parts in
position during the further process, we provided a local silicone sealing at the
mitral annulus region. Subsequently, Luer fittings are attached to the wax
replica assembly at the aortic arch, left atrium and left ventricle positions.
STEP 7 – After this local silicone coating, the complete left heart assembly is
ready for a global coating. This process will then lead to the creation of the
left atrium and ventricular walls of the final model. First, the left heart hollow
wax assembly is fully submerged in silicone (HT 33 Transparent, Zhermack
SpA, Italy) and is subsequently subjected to a slow 3D random rotation to
enhance uniform layer thickness. This procedure is repeated until the required
thickness is achieved. For our model, three layers are applied which
corresponds to a global wall thickness of the model was 1.0 +/- 0.3 mm. For
the realization of this slow and controlled rotational motion, a custom-made
rotating system (Figure 99) was built [195]. Hereby, the randomized rotation
was approached by a gear ratio of 16/25 (two times) which requires 625
rotations before getting back in its original position.
STEP 8 – When the silicone coating process is finished, the thin-walled wax
replicas are crushed inside the silicone model. The crushed wax can then be
carefully removed from the silicone left heart model via the aorta and

10. MODELLING THE LEFT HEART BY A MONOLITHIC APPROACH
228
pulmonary vein holes, hence accomplishing the flexible thin-walled model of
the left heart.
10.2.4 Model realizations
The final result, the monolithic flexible left heart model, is further illustrated
in Figure 100, this shows the model in five positions while it is rotated around
the left ventricular long axis and provides a view on the different features that
are incorporated in the model. Figure 101 is a picture taken from the inside of
the left ventricle. This picture clearly shows the attachment of the mitral valve
model leaflets to the papillary muscles via the chordae tendineae.
In this final model, we achieved a global wall thickness of the model
of 1.0 +/- 0.3 mm. However, higher and lower values are observed for local
convex (up to 5 mm) and concave regions (down to 0.3 mm), which is inherent
to the rheological characteristics of unpolymerized silicon. The thinner
regions were locally provided with extra silicone layers to achieve the global
wall thickness.
Overall, these results show that the described eight-step production
process is successful in producing a monolithic, flexible, and geometrically
complex model of the left heart.
Figure 99: Custom-made rotation system: left panel CAD design, middle panel realization and
right panel reduction and gears.

10. MODELLING THE LEFT HEART BY A MONOLITHIC APPROACH
229
Figure 100: The flexible monolithic LH1 model is demonstrated in different positions.

10. MODELLING THE LEFT HEART BY A MONOLITHIC APPROACH
230
Figure 101: Attachment of the chordae tendineae of MV2 (Chapter 8) to the papillary muscles
of the LH1 model.
10.3 CONNECTION WITH THE VIVITRO SIMULATOR
To turn the anatomically correct left heart model into a functional pumping
chamber, it was connected to an actuator system as well as to a mock
circulatory loop, in order to simulate the left heart function. We chose to
incorporate our left heart model into an existing heart simulator, the ViVitro
Pulse Duplicator (ViVitro systems Inc., Victoria, BC, Canada). As described
in Chapter 2 (Figure 32), the ViVitro cardiovascular simulator is an FDA
approved and widely used cardiovascular simulator which is commonly used
for the testing of cardiovascular devices [82, 83, 104, 105, 120]. The system
is available in our lab and was used in our study as a testing platform for the
testing of our new left heart model. The connection of our left heart model
with the ViVitro system is realized at (1) the pump system, (2) the venous,
and (3) the arterial regions. Before we describe how our new model is
connected, we explain how these connections have been worked out for the
original ViVitro system. Then, we describe how we designed and developed
a new suspension system, enabling a functional fit between the new left heart
model and the ViVitro simulator.

10. MODELLING THE LEFT HEART BY A MONOLITHIC APPROACH
231
Figure 102: The ViVitro left heart model and components of the mock loop. Adapted from
[196].
10.3.1 Configuration of the original ViVitro suspension system
The original ViVitro’s suspension system design is based upon three crucial
design criteria (DC). First, a durable connection of the left heart model with
the piston pump needs to assure that the system can resist the pulsatile
pressures generated by the piston pump (DC1). Second, water sealing during
the heart cycle needs to be guaranteed (DC2). Finally, a modular design is
highly recommended (DC3). In the original ViVitro system (Figure 102),
these three design criteria are fulfilled by a combination of different
components.
As depicted in Figure 114 (top panel), the original ViVitro-ventricular
model (5) (a simple silicon bag, as described in Chapter 2) is suspended in the
hydraulic chamber (4) and fixed by the rigid valve plane (6). This left
ventricular model is made of a flexible material (Silicone Rubber Type
GE/Bayer #LIM6040 D2 900) and is equipped with the integrated O-ring (5)
which is positioned between the hydraulic chamber, the rigid valve plane, and
the ventricular base ring (6). The watertight sealing is realized by a tightening

10. MODELLING THE LEFT HEART BY A MONOLITHIC APPROACH
232
of eight screws (2). This results in a downwards displacement of the four
ventricular base clamps (3) and of the rigid valve plane, but also a squeezing
of the O-ring (shown in the orange zoomed view). This type of sealing avoids
leakage between the mock loop and pump circuit fluids.
10.3.2 Design and realization of a new suspension system
In order to enable the integration of our new left heart model into the existing
ViVitro simulator, the design of a new suspension system was required.
Therefore, we specified three additional design criteria. A first design criterion
(DC4) is that the new suspension system should account for patient-specific
geometries of the new left heart model. This geometry comprises a more
complex shape and hence also a greater challenge to attain a durable
suspension and an overall water tightness during testing. A second design
criterion (DC5) is that the new system should be fully compatible with the
ViVitro simulator, so that the modifications of the experimental setups (and
the conversion to the ViVitro original configuration) are straightforward and
easy. Finally, as a third added design criterion (DC6), we specified the valve
plane with flexible properties to be compatible with the mitral valve model
which is featured with a flexible annulus. Table 5 summarizes the original
ViVitro as well as our newly developed design criteria for the design of the
new suspension assembly.
Following these six design criteria, we designed and developed a new
suspension system that enabled a functional fit of the left heart model and the
ViVitro simulator. As depicted in middle panel of Figure 114, this new system
consists of six components which are assembled in the following manner.
First, a customized sealing ring (6) (shown in the orange zoomed view) and
the ventricular base ring (7) are positioned into the hydraulic chamber of the
ViVitro system (5). Then, the left heart model, including the suspension upper
(1) and the suspension lower (8) plates and the suspension flexible plate (2)
sandwiched in between, is placed on top of the sealing ring. Finally, the
compression ring (4) (which is a substitute for the four ventricular base clamps
of the ViVitro left heart model) is mounted on top and secured by eight screws
(8).
Each of these components features specific functionalities in order to
meet the complete set of design criteria. In this section, we describe in more
detail what the specific challenges (and solutions) were to fulfill the six design
criteria.

10. MODELLING THE LEFT HEART BY A MONOLITHIC APPROACH
233
Table 5: A summary of the design criteria for the suspension system of the original ViVitro
system and the LH1 model.
Figure 103: The upper (A) and lower (B) rigid suspension plates are equipped with opposite
extensions (1-3) to ensure a durable connection with the flexible LH1 model. These two parts
are placed on top of each other (C) and sandwiches the flexible material of the left heart. Also,
the upper suspension plate is equipped with a circular extension (4) which pressurizes the O-
ring part of the sealing ring.
The first design criterion (DC1) ensures a durable connection of the
left heart model with the piston pump in order to resist the pulsatile pressures
that are acting on the left heart model and the suspension plates. In this
process, two key aspects are involved. A durable suspension should be
realized by a strong connection between the left heart model and the
suspension plates (DC1.1), and by restraining model displacements due to the
pulsatile pressures (DC1.2). In our newly built suspension system, we realized
DC1.1 by means of a mechanical anchoring of the flexible plate. This flexible
Design Criteria (DC) of the suspension assembly for the connection to the ViVitro
pump system
ViVitro
System
Left Heart
Model
DC1 To enable a durable connection of the left heart model with the piston pump v v
DC2 To guaranty watertightness during the heart cycle v v
DC3 To be modularly designed to straightforwardly allow setup changes v v
DC4 To be adapted for a patient specific geometry as well as radial contraction v
DC5 Setup conversion to its original configuration need to be straightforwardly v
DC6 The flexible properties of the valve plane need to be maintained v

10. MODELLING THE LEFT HEART BY A MONOLITHIC APPROACH
234
plate (see (2) of Figure 114, middle panel) is sandwiched between the upper
and lower suspension plates (see (1) and (8) of Figure 114, middle panel). This
is realized by designing the CAD model of the lower suspension plate with
two extensions (thickness 0.5 mm, width 2 mm and shaped with an offset to
the left ventricular model of 3 and 11 mm, respectively), while the upper
suspension plate is provided with one extension (thickness 0.5 mm and an
offset of 7 mm), as depicted in Figure 103 and Figure 104. These opposite
extensions are gripped into corresponding cut-outs of the flexible plate and, in
this way, realizes a durable sealing. In addition, we realized DC1.2 (limited
displacements of the suspension plate) by selecting a relatively rigid plate
material (Objet VeroWhite, Stratasys Ltd., Minnesota - tensile strength 58
MPa and modulus of elasticity 2500 MPa), and sufficient wall thicknesses of
the suspension plates (set to 8 mm for the upper plate and to 3 mm for the
lower plate). The above described local plate-extensions additionally benefit
the plates’ stiffness, because they function as local reinforcements. During the
experiments, with normal values of pressure (80-120mmHg) and cardiac
output (5.6 l/min), maximal suspension plate displacements of only 2 mm
were observed.
Figure 104: Dimensions of the LH1 suspension system (C) including the upper (A) and lower
(B) rigid suspension plates and the flexible plate in between (green) which is joined with the
left ventricle model.

10. MODELLING THE LEFT HEART BY A MONOLITHIC APPROACH
235
The second design criterion (DC2) comprises durable watertight
sealing. In the suspension assembly, this should be realized at three levels:
between the hydraulic chamber and the lower suspension plate (DC2.1),
between the suspension plates and the flexible plate (DC2.2), and between the
flexible plate and the left heart model (DC2.3). This was realized as follows.
First, we used a similar sealing between the hydraulic chamber and the lower
suspension plate (DC2.1) as the original of the ViVitro system between the
hydraulic chamber and the valve plane: eight screws are tightened and hence
are pushing the connection plate towards the transparent ViVitro box. As
depicted in Figure 105, the geometry of the sealing ring in our suspension
model is identical to the ViVitro ventricular model (also shown in Figure 84),
apart from the ventricular part which is excluded in our model, and is also
equipped with an integrated O-ring. We also designed the CAD model of the
lower plate with a circular extension (identical to that of the ViVitro valve
plane, see Figure 114) which then compresses the O-ring part of the sealing
ring. By doing this, the actual sealing is realized. Second, a durable sealing
between the suspension plates and the flexible plate (DC2.2) is based on a
watertight bond which is created during the production of the flexible plate.
This bond is realized by applying the liquid state silicone the suspension plates
which makes the silicone to adhere to the suspension plates. Third, a durable
and watertight sealing between the flexible plate and the left heart model
(DC2.3) is realized by a local 2 mm thick silicon layer between these parts.
This local widening of the left heart at the valve plane region affects the
suspension plates’ dimensions, so this aspect was already taken into account
during the CAD design phase and the value of 2 mm was set by trial and error
during the prototype phase. This tight adhesion of the flexible plate to the left
heart model was realized by using the same type of silicone material of the
left heart model (HT 33 TRANSPARENT, Zhermack SpA, Italy).
The third design criterion (DC3) refers to the modular design. Thanks
to this newly designed suspension system configuration, (dis)assembly and
setup modifications are straightforward.
The fourth design criterion (DC4) implies the compatibility with
patient-specific geometries. The newly designed suspension system accounts
for this criterion because patient-specific geometries are applied for (1) the
inner opening of the suspension upper, lower and flexible plates, and (2) the
corresponding extensions. 3D print technology allows for a straightforward
way of manufacturing these models including patient-specific geometries.
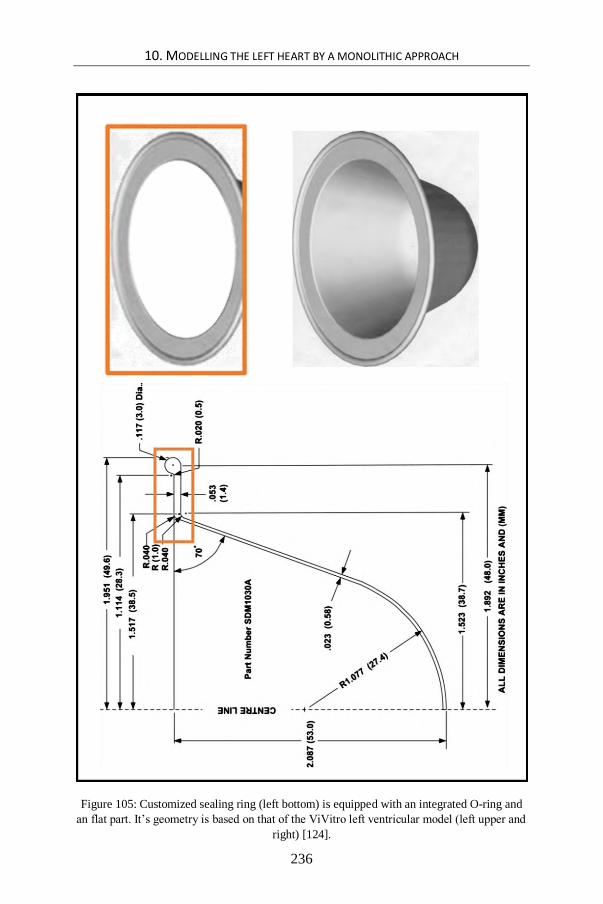
10. MODELLING THE LEFT HEART BY A MONOLITHIC APPROACH
236
Figure 105: Customized sealing ring (left bottom) is equipped with an integrated O-ring and
an flat part. It’s geometry is based on that of the ViVitro left ventricular model (left upper and
right) [124].
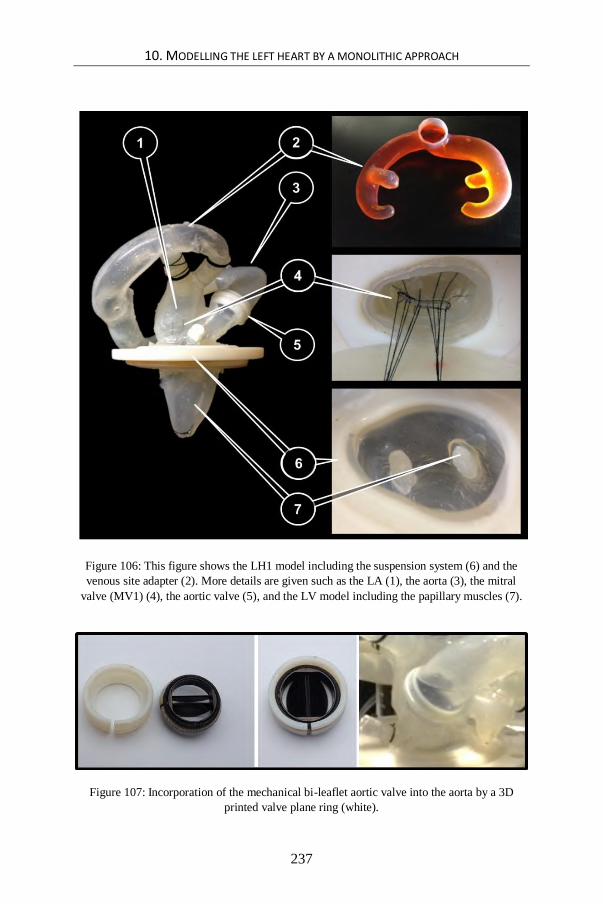
10. MODELLING THE LEFT HEART BY A MONOLITHIC APPROACH
237
Figure 106: This figure shows the LH1 model including the suspension system (6) and the
venous site adapter (2). More details are given such as the LA (1), the aorta (3), the mitral
valve (MV1) (4), the aortic valve (5), and the LV model including the papillary muscles (7).
Figure 107: Incorporation of the mechanical bi-leaflet aortic valve into the aorta by a 3D
printed valve plane ring (white).

10. MODELLING THE LEFT HEART BY A MONOLITHIC APPROACH
238
The fifth design criterion (DC5), a straightforward conversion of the
modified set ups to the original ViVitro set up, is realized by tuning multiple
part dimensions of the new system to correspond with the original ViVitro
parts, such as the O-ring, the lower plate circular extension and the position of
the eight holes in the left heart compression ring for the screws. In addition,
original parts of the ViVitro system (Figure 114) are integrated as much as
possible, such as the hydraulic chamber, the eight screws and the ventricular
base ring. Switching between the new and the ViVitro’s original configuration
(see also DC5) is possible within half an hour.
Finally, the sixth criterion (DC6) is to maintain the flexible valve
plane properties. In our suspension model, we opted to suspend the left heart
model not at the level of the left heart base, but at a slightly lower level (offset
of 10 mm from the original valve plane, in the direction of the LV long axis
and towards the apex).
10.3.3 Connection to the ViVitro mock circulatory loop
Subsequently, as shown in Figure 106, the LH1 model with its newly
developed suspension system (6) is connected to the ViVitro mock circulatory
loop via a venous site adapter (2) which functions as a manifold given that its
geometry is designed to smoothly distribute the flow from the ViVitro atrial
reservoir to each of the four pulmonary vein entrances of the left atrial model.
Analogous to the other flexible parts of the LH1 model, this part is made of a
silicone material (HT 33 TRANSPARENT, Zhermack SpA, Italy). The
production process of the manifold proceeded in a similar fashion as the
fabrication process of the left heart model, as described in § 10.2. This venous
site adapter is also applied for the LH2 model of the next chapter.
10.4 EXPERIMENTAL TEST SETUP
As shown in Figure 108, the experimental setup consists of the new left heart
model, which is mounted into the ViVitro cardiovascular simulator (StarFish
Medical, Victoria, B.C.) based upon the new suspension system and
connecting procedure described in § 10.3. This new left heart model also
incorporates a flexible polymeric mitral valve model in addition to a bi-leaflet
mechanical aortic valve. More details about the mitral valve model
development and initial testing is described in Chapter 8, while its integration
into the left heart model is explained in § 10.2.3. The mechanical aortic valve
is placed into the flexible aorta and kept in position by a custom made 3D
printed valve plane ring, as illustrated in Figure 107.

10. MODELLING THE LEFT HEART BY A MONOLITHIC APPROACH
239
The ViVitro system includes a Superpump and a ViViGen Waveform
Generator (Vivitro Systems Inc., Victoria, B.C.) to drive the test liquid
through the mock loop. The programmable waveform of the generator is set
to the standard wave form ‘FDA’ with a 35/65 systole/diastole ratio.
Physiologically normal values are set for arterial pressure (120/80 mmHg), for
stroke volume (80 ml), and for heart rate (70 bpm). Arterial pressure was
measured using a pressure transducer delivered with the ViVitro system
(Deltran® Pressure Transducer Model PT43-604, Utah Medical Products,
Inc.).
To check the proof of concept, the left heart model is subjected to a
test of 4200 beats (1 hour) under these conditions. The test fluid within the
mock loop is a blood analog consisting of a 30/70% glycerin/water mixture
(ρ= 1060 kg/m³ and μ = 3.5 mPa.s at room temperature). Echographic
investigations are performed using a Vivid 7 system (GE, Vingmed, Horten,
Norway).
Figure 108: Experimental setup of the LH1 model which is built into the ViVitro system.
10.5 PRELIMINARY RESULTS
Our experimental results show that this novel left heart model is able to
generate realistic data in terms of end-systolic volume (54 mL) and pressure
(120 mmHg), end-diastolic volume (134 mL) and pressure (80 mmHg), stroke
volume (80 mL), ejection fraction (60 %), mean outflow (5.6 L/min) and heart
rate (70 bpm). This test also confirmed that the newly developed suspension
assembly enabled a proper connection of the left heart model with the rigid
parts of the ViVitro system, while maintaining the flexible properties of the
left heart features, such as the mitral valve annulus. During the experiments,
we noticed a maximal up and downward displacement of the suspension
system valve plane of about 2 mm. Also the mitral valve model functions well
in terms of durability (at least 4200 beats) under normal conditions, given that

10. MODELLING THE LEFT HEART BY A MONOLITHIC APPROACH
240
there were no signs of mitral valve prolapse nor chordae tendineae or leaflet
rupture.
In addition to the hydrodynamic performance, the echocardiographic
examination of the left heart model (Figure 109 left panel) shows relatively
good similarity to the anatomy of a human left heart (Figure 109 right panel),
such as the left ventricular wall and the anterior (AML) and posterior mitral
valve leaflets (PML). Also, the anterolateral papillary (ALPM) and
posteromedial papillary muscles (PMPM) are visible during this examination.
The color Doppler measurements of our model (Figure 110) also exhibit
vortex formation during filling, which is also observed in a natural heart. In
the in-vitro model, the test fluid flows from the atrium through the mitral valve
and enters the left ventricle towards the probe (red region) and makes a 180°
turn at the apex level and flows away from the probe (blue region) towards the
aortic valve.
In general, these preliminary experimental and echocardiographic
results support the proof of concept of the newly developed models of the left
heart, mitral valve, and suspension system. Moreover, relatively realistic
hydrodynamic performance results and similarities to human physiology are
obtained.
Figure 109: At the left side, the results of an echocardiographic examination is shown of the
LH1 model, that incorporates the physiologically normal-like mitral valve model (MV1) at
the time of end systole (top) and end diastole (bottom). For the purpose of comparison, results
of a healthy human left heart (male, 32 years old) are depicted at the right side.

10. MODELLING THE LEFT HEART BY A MONOLITHIC APPROACH
241
Figure 110: Color Doppler measurements of the LH1 model at the time of ventricular filling.
Blue colors represent blood flowing towards the probe, while red colors correspond to blood
flowing away from the probe.
10.6 DISCUSSION AND CONCLUSION
In this chapter, we elaborated on the design and development of the innovative
monolithic left heart model LH1 that incorporates the flexible fiber-based
mitral valve model MV2 (Chapter 8). Next, we described the design and
development of tailored suspension and connection systems that enabled the
integration and experimental testing of the left heart model with the ViVitro
mock circulatory loop. Finally, we reported preliminary but promising results
of our left heart model based upon hydrodynamic and echocardiographic
measurements.
Overall, this novel approach of left heart modelling more closely
approximates real anatomic features in multiple ways. Firstly, the geometry
of the in-vitro left heart model is based on medical images from a real heart,
and includes the left ventricle, left atrium and the aortic arch, but also more
detailed features, such as the auricle and the entrances of the four pulmonary
veins. Secondly, the previously described mitral valve apparatus MV2
(Chapter 8) has been integrated into the model, which adds even more
anatomical-like structures (PG6a-e). Thirdly, the left heart model is made of

10. MODELLING THE LEFT HEART BY A MONOLITHIC APPROACH
242
silicon and fiber materials to mimic the mechanical as well as the ultrasonic
characteristics of the biological soft tissue of the heart. Fourthly, the
innovative production process enabled the realization of this complex model
in one single piece, resulting in a more anatomical-like and compact left heart
model and discarding the need to connect components, which often introduces
rigid zones and structures into the model. Fifthly, the newly developed
suspension system ensures compatibility with a standard (Type I)
cardiovascular simulator, while preserving its flexible appearances and the
complex anatomical-like shape of the valve plane region (PG7). Finally, the
preliminary benchtop experiments show that (1) the model is able to generate
normal values of left heart performance, (2) the structures are visible using
ultrasound, and (3) the model generates physiological-like intraventricular
flow patterns that can be observed via color Doppler. Taken together, these
multiple strengths of our integrative monolithic approach can be considered
as a significant step forward in in-vitro modelling of the left heart.
10.7 LIMITATIONS AND FURTHER DIRECTIONS
Despite the aforementioned substantial strengths, the current approach is still
subject to certain limitations that should be addressed in future research. A
first limitation of our approach lies in the modelling of the papillary muscles.
In reality, papillary muscles vary in the number of heads and exact position in
the ventricle and are generally categorized in two main groups comprising the
anterior and posterior papillary muscles. In this study, these two groups were
simplified into only one head. Also, the active papillary muscle contractions
of the real heart are not taken into account in the current approach.
A second limitation relates to the left heart model’s geometry.
Although the LH1 model geometry is unique as it is based on real medical
images, it should be noted that a rather global smoothed geometry of the
Zygote CAD-model stood model for the in-vitro replica. This eliminates
smaller anatomical details which may have an effect on the intraventricular
blood flow patterns. Therefore, a more anatomically correct geometry is still
desirable in future research in order to attain a more accurate approximation
of interventricular blood flow patterns by the integration of rough trabeculae
structures.
A third limitation pertains to the integrative, all-in-one character
of the model. As the left heart model is made in one single piece, it has the
disadvantage that replacing defect parts or components is not possible.
Instead, the whole model needs to be replaced. Nevertheless, it can be noted
that the direct 3D printing of sacrificial cores makes the building of a new
model much more straightforward.

10. MODELLING THE LEFT HEART BY A MONOLITHIC APPROACH
243
Figure 111: Starting from a 3D printed kernel (A), flexible thin-walled (B) and rigid
transparent highly detailed models (C) are realized of the upper human airways. The red
appearance of the kernel is due to the pigmented PVA coating to facilitate kernel removal and
optimize surface smoothness.

10. MODELLING THE LEFT HEART BY A MONOLITHIC APPROACH
244
Figure 112: The PMMA model visually disappears when submerging it in a refractive index
matched fluid. A transparent film with cross marks is placed at the backside of the model to
check optical refraction. The blue arrow indicates the liquid level.
A fourth limitation concerns the fabrication process. Even though
the currently applied fabrication techniques enables the modelling of more
anatomical details, two major limitations can still be noted: (1) part of the
production process still depends upon manual techniques, hence reducing
geometrical accuracies, and (2) the production of the sacrificial cores by wax
casting into silicone molds also poses limitations to the geometrical
complexity. In future work, higher anatomical detail and geometrical accuracy
is likely to be obtained by skipping intermediate steps in the production
process. In this regard, we started developing a new technique to 3D print
cores in a more direct manner by using a PolyJet 3D printer (Objet Eden 350V,
Stratasys Ltd., Minnesota). In short, this technique can be described as
follows. While in the current study, the objects are first 3D printed as solid
pieces that then serve to produce the silicon molds to ultimately attain the wax
sacrificial cores, the new technique aims to directly print the objects as thin-
walled (0.3 mm) objects. Because the 3D printer is programmed to support the
actual part by providing support material beneath over-heeling part sections,
closed thin-walled objects will be filled up - by default - with support material.
In this way, it is possible to 3D print a sacrificial core made of a rigid shell, in
combination with a soft support material (Figure 111 A). After finishing the
silicone coating procedure of the sacrificial core, the support material is then
easily removed, followed by the fragmentation of the thin rigid shell. By this

10. MODELLING THE LEFT HEART BY A MONOLITHIC APPROACH
245
approach, the sacrificial core is obtained in a fully digital way (no manual
actions are involved). Even more complex geometrical models can be
produced and this with an ever higher accuracy. We experimented
successfully with this technique to produce two patient-specific PIV
compatible models of the main branches of the human airways (up to the 3rd
bifurcation). The first model is a flexible thin-walled model (Figure 111 B)
made of a highly transparent silicone material (Sylgard 184, Dow Corning,
Midland, MI) while the second is a rigid model (Figure 111 C) made of
polymethyl methacrylate (PMMA - Plexiglas). As demonstrated in Figure
112, the PMMA model visually disappears while submerging in a refractive
index matched fluid (aqueous sodium iodide solution, 60% concentration)
without distortion of the cross marks at the background. This preliminary
result demonstrates that this technique was successfully applied to realize a
PIV compatible model of the upper human airways.
Finally, the fifth and major limitation of the described left heart
model is that it still does not generate a torsional motion (PG5). In the next
chapter, we address this limitation by integrating the anisotropic left heart
model introduced in Chapter 7 in our in-vitro left heart model, and, as such,
enabling various left ventricular wall deformation and torsion patterns.

246
247
Chapter 11 Modelling the left heart by a bilithic approach: Feasibility study of the effect of torsion on
intracardiac diastolic pressure parameters
Modelling the left heart by a bilithic approach: Feasibility study
of the effect of torsion on intracardiac diastolic pressure parameters
In this chapter, the left heart model LH1 (Chapter 10) is transformed from a
monolithic to a modular bilithic model LH2, with the built-in ability to
straightforwardly change different LV models. Based upon the anisotropic
model LV3 (Chapter 7), different deformation patterns are modelled and
related with diastolic pressure parameters in this study.
11.1 INTRODUCTION
We consider the hydraulic left heart model LH1 presented in Chapter 10 as an
important step forward in accomplishing a more realistic in-vitro modelling
of the left heart by implementing a patient-specific geometry, a mitral valve
apparatus, and a flexible valve plane suspension. Nonetheless, looking back
at the practical guidelines postulated in Chapter 3 (Table 2), one has to
conclude that some essential recommendations for in-vitro model
optimization are still missing. Most importantly, just like most of the current
cardiovascular simulators (see Chapter 3, Table 3), the described model does
not implement the anisotropic wall properties of the natural ventricular wall

11. MODELLING THE LEFT HEART BY A BILITHIC APPROACH: FEASIBILITY STUDY OF THE
EFFECT OF TORSION ON INTRACARDIAC DIASTOLIC PRESSURE PARAMETERS
248
(PG2). As a consequence, it does also not allow controlling ventricular wall
deformation patterns, such as longitudinal, circumferential, and radial
deformation (PG4). Moreover, the twisting motion (PG5), which is a fourth
deformation pattern of the natural left heart, cannot be replicated with the
previously described cardiovascular simulator.
As extensively discussed in Chapter 3 (Table 2), there remains a great
challenge but also an urgent need for new left heart models to mimic global
wall deformation patterns (PG4) and, even more, to simulate the natural
torsion motion (PG5). The realization of these two practical guidelines for in-
vitro model optimization is necessary to achieve a more accurate mimicking
of the physiological events of the natural left ventricle as ventricular torsion
presumably has a pivotal role for normal ventricular function. In 2011,
Buckberg and colleagues wrote “Ventricular torsion and untwisting are
essential for normal ventricular function and their mechanisms are related to
the temporal responses of the helical and circular muscle fibers that comprise
cardiac architecture” [197]. However, little is still known about the effect of
LV torsion and of wall deformation on intraventricular flow patterns.
Benchtop models accounting for torsion would be very useful to
reveal the role and importance of the mechanisms behind these complex
interactions because of their controllable hydrodynamic conditions. However,
to the best of our knowledge, no adequate left heart model including torsional
motion as well as a realistic mitral valve model exists to date.
Therefore, in this chapter, we describe the development of an
innovative left heart model LH2, which combines (1) the unique kinematic
abilities of the anisotropic model LV3 (Chapter 7), with (2) the anatomical-
like mitral valve model of Chapter 8, and (3) the suspension system of Chapter
10, allowing the connection to a well-approved standard cardiovascular
simulator. Moreover, by modifying the monolithic to a modular bilithic left
heart model with a separate and demountable ventricular component, we were
able to build an innovative, experimental set-up enabling a comparison of five
various wall deformation patterns. Two models with predominantly
longitudinal or circumferential deformation, and two models with different
degrees of torsion, are compared to a general model with no deformation
patterns. To this end, five different ventricular models were built based upon
different anisotropic properties, and mounted successively into our bilithic left
heart model.
An in-vitro technique of examining blood flow patterns is PIV;
however, there is no PIV compatible torsional LV model available yet. Such
a model could be developed in the near future by manufacturing the LV2
model (Chapter 6) according to the procedure of the PIV compatible venous

11. MODELLING THE LEFT HEART BY A BILITHIC APPROACH: FEASIBILITY STUDY OF THE
EFFECT OF TORSION ON INTRACARDIAC DIASTOLIC PRESSURE PARAMETERS
249
valve model VV (Chapter 9) and will likely result in detailed insights of
intraventricular flow patterns in relation to LV torsion (see § 12.2.3).
Meanwhile, there are other parameters which give a more global general
measure of the intraventricular flow, such as pressure differences.
As described in Chapter 1 (§ 1.2.3.1), it has been shown that pressure
differences play an important role in the acceleration/deceleration of the blood
flow [9, 12]. Briefly, during the early filling phase, the elastic recoil of the
myocardium causes a swift drop within the left ventricle. This decrease in LV
pressure causes a pressure difference [10] which begins from the LA (left
atrium) and then spreads towards the LV apex [11]. This pressure difference
accelerates the blood coming from the LA and causes a rapid flow which is
carried on towards the left ventricular apex and then again upwards, opening
the mitral valve. Therefore, this diastolic pressure difference (pLA – papex) has
been regarded as a measure of left ventricular filling [3].
In this study, two components of this early diastole pressure difference
are measured, namely the transmitral (TMPDe = pLA – pbase) and
intraventricular pressure differences (IVPDe = pbase – papex). The exact
locations of the pressure points pLA, pbase and papex are shown in Figure 118.
This chapter not only describes the design and development of this
experimental design but also reports initial experimental measurements of
how global wall deformations and torsion affect the transmitral (TMPDe) and
intraventricular pressure differences during early diastole (IVPDe).
11.2 LEFT HEART MODEL DESIGN
In this study, we developed the LH2 on the basis of the monolithic left heart
model of Chapter 10, which has the advantages that it is flexible, compact,
shaped with an anatomically-like geometry and equipped with the nature-like
mitral valve model of Chapter 8. Besides these features, four new features are
added to the model. Figure 113 shows the design and the composition of the
LV2 model.
The first added feature is the torsional motion which is realized by
applying the anisotropic material properties and its accompanying twisting
mechanism of the left ventricular model (described in Chapter 7) to the more
anatomically-like geometry of the ventricle in the monolithic left heart model
(described in Chapter 10). Multiple left ventricular models with different
anisotropic characteristics were constructed to generate different wall
deformation patterns (see § 11.4 for more details).

11. MODELLING THE LEFT HEART BY A BILITHIC APPROACH: FEASIBILITY STUDY OF THE
EFFECT OF TORSION ON INTRACARDIAC DIASTOLIC PRESSURE PARAMETERS
250
The second unique feature of this model is that we adapted our design
of the monolithic approach to become a modular bilithic approach. In this
bilithic model, we separated the ventricular model from the other left heart
components in a modular design, to enable a straightforward switch of the
different left ventricular models during experiments.
The third feature of this model is that the aortic arch of our monolithic
model is replaced by the original aortic model of the ViVitro system (ViVitro
Systems Incorporated, Victoria, BC, Canada) which allows a wider range of
options in controlling the arterial compliance. This connection is realized by
an extra part, namely the arterial site adapter (see Figure 113 (1)). This
supports the ViVitro aortic model by two supporting pins and is also made
from a rigid 3D printed material (VeroWhite, Objet Eden 350V, Stratasys
Ltd., Minnesota). The venous valve site adapter is identical to the one of
Chapter 10 (see Figure 113 (3)).
The final and fourth added feature of this model compared with the
LV models of Chapter 7, is that we respect the physiological-like end systolic
volume (ESV) value of 54 ml. This ESV is much more natural than the
abnormal high value of 127 ml, which is the default setting for the original
ViVitro left ventricle model which was used for the left ventricle model of
Chapter 7.
11.3 LEFT VENTRICULAR MODEL DESIGN
In general, the production process of the left ventricular models for this study
is strongly similar to the process used to produce the anisotropic left
ventricular model of Chapter 7. However, building the patient-specific
geometry and the modular composition to switch the left ventricular models
implied more advanced building techniques. A comparison between the
monolithic and bilithic model suspension system is illustrated in the middle
and bottom panel of Figure 114, respectively. The modular, bilithic approach
(Figure 114, bottom panel) is realized by separating the LV model from the
left heart model at the level of the suspension system. The suspension system
of the LH1 model is divided in the middle and hence consists of two flexible
parts instead of one, namely an upper (2) and a lower (9) flexible plate.

11. MODELLING THE LEFT HEART BY A BILITHIC APPROACH: FEASIBILITY STUDY OF THE
EFFECT OF TORSION ON INTRACARDIAC DIASTOLIC PRESSURE PARAMETERS
251
Figure 113 Design and composition of the modular LH2 model with the arterial site adapter
(1), the LA (2), the venous site adapter (3) (similar to the LH1 model), the MV2 of Chapter 8
(4), the suspension system (5), and the LV model (6).

11. MODELLING THE LEFT HEART BY A BILITHIC APPROACH: FEASIBILITY STUDY OF THE
EFFECT OF TORSION ON INTRACARDIAC DIASTOLIC PRESSURE PARAMETERS
252
All the left ventricular models used in this study, except for the
general model G (see below), are realized by a three-layer composition. The
first and the third layer are made of silicone (HT 33 Transparent, Zhermack
SpA, Italy) and represent the matrix fraction of the composite. These layers
are responsible for the elastic properties of the left ventricular model, for the
embedding of the fibers, and for the watertight barrier between the circulatory
loop and the piston pump circuit. The middle layer, then, is the layer where
Nylon multifilament yarns are inserted to mimic the function of cardiac
muscle fibers. The arrangement of these fibers determines the direction in
which wall deformation is constrained.
The production process of such a left ventricle model incorporates
the following steps. First, the suspension lower plate (8) and ventricular kernel
are 3D printed in a rigid material (Objet FullCure®720, Stratasys Ltd.,
Minnesota) and subsequently positioned with a mutual offset of 2 mm. Then,
silicone is poured out over the left ventricular kernel. This forms the first layer
of the left ventricular model as well as the lower flexible plate (9). These steps
are also applied for the creation of the suspension upper plate (1) and the upper
flexible plate (2) which are attached by the silicone to the left heart model. To
avoid air bubbles during the curing process, the system is exposed to vacuum
conditions. Subsequently, polymer filament yarns are moistened with silicone
and imposed onto the first silicone layer. The placement of these filaments
proceeds according to the required fiber pattern. This fiber pattern is designed
during the CAD process and implemented into the 3D printed ventricular
kernels in the form of small cut-outs, which are then visualized by ink to
enhance correct positioning of the fibers according to the method described in
Chapter 7 (see Figure 87). Also for the realization of this second layer, vacuum
conditions are applied during silicone curing to eliminate air inclusions
between the fiber filaments. Afterwards, the third layer is applied by pouring
out the silicone mixture, for the second time, to make the different components
a whole. This pouring not only fully embeds the polymer fibers but also makes
strong connections with the first layer as well as with the suspension lower
plate. Finally, after the curing of the silicone, the ventricular kernel is removed
from the ventricle model. To enhance loosening and surface smoothness of
the left ventricular kernel, we made sure the left ventricular kernel has been
coated with polyvinyl alcohol (PVA). The reference model, model G, is
fabricated in the same manner, except that it doesn’t include the middle layer
(i.e., no polymer filaments).
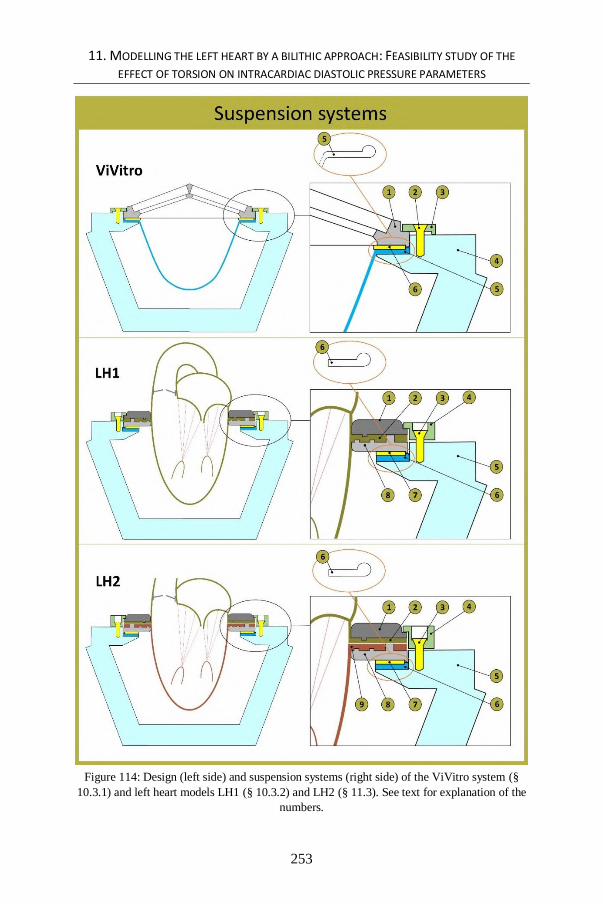
11. MODELLING THE LEFT HEART BY A BILITHIC APPROACH: FEASIBILITY STUDY OF THE
EFFECT OF TORSION ON INTRACARDIAC DIASTOLIC PRESSURE PARAMETERS
253
Figure 114: Design (left side) and suspension systems (right side) of the ViVitro system (§
10.3.1) and left heart models LH1 (§ 10.3.2) and LH2 (§ 11.3). See text for explanation of the
numbers.

11. MODELLING THE LEFT HEART BY A BILITHIC APPROACH: FEASIBILITY STUDY OF THE
EFFECT OF TORSION ON INTRACARDIAC DIASTOLIC PRESSURE PARAMETERS
254
Figure 115: Design of the five LV models and the corresponding expected global wall
deformation with α, the fiber angle (with respect to the LV long axis) and β, the torsional
angle.
11.4 EXPERIMENTAL PROTOCOL
Five different left ventricular models are mounted into the left heart model: a
General model (G), a Longitudinal deformation (L), a Circumferential
deformation (C), and Torsional models 1 (T1) and 2 (T2). The design of the
models is illustrated in Figure 115, while the actual models are shown in
Figure 116 (front view) and Figure 117 (top view). The L and C models
include fibers with an orientation angle of 0° and 90° with respect to the left
ventricular long axis, resulting in a predominantly longitudinal and a
circumferential deformation pattern, respectively. The Torsional models 1
(T1) and 2 (T2) are also equipped with fibers, but with a fiber angle of 60°
and 70°, resulting in a torsional motion of 77° and 90°, respectively, and both
in a combination of longitudinal as well as a circumferential deformation

11. MODELLING THE LEFT HEART BY A BILITHIC APPROACH: FEASIBILITY STUDY OF THE
EFFECT OF TORSION ON INTRACARDIAC DIASTOLIC PRESSURE PARAMETERS
255
Figure 116: Front view of the five LV models: the General model (G), the Longitudinal
deformation (L), the Circumferential deformation (C), and the Torsional models 1 (T1) and 2
(T2).

11. MODELLING THE LEFT HEART BY A BILITHIC APPROACH: FEASIBILITY STUDY OF THE
EFFECT OF TORSION ON INTRACARDIAC DIASTOLIC PRESSURE PARAMETERS
256
patterns. As already noted, model G is the reference model in our study and
does not contain any fibers. This latter model can be considered as similar to
the typically existing cardiovascular simulators, except that this model
includes the papillary muscles, has a more nature-like anatomic geometry, and a smaller and more realistic ESV. All the five left heart models are mounted
on the same upper part of the left heart model. This upper part is equipped
with a modified version of the mitral valve MV2 of Chapter 8. This valve was modified due to mitral valve model repair after leaflet rupture (caused by
erroneous overloading in previous experiments). This modification results in
higher values of transvalvular pressure differences in comparison with the mitral valve MV2 described in Chapter 8, and therefore, the mitral valve
model of this study resembles a stenotic-like valve type.
Each model is tested in a circulatory mock loop similar to the experimental
setup described in Chapter 10, with three different heart rhythms (HR = 50,
65 and 80 bpm) and stroke volumes (SV = 50, 65 and 80 ml). End systolic (ESP) and end diastolic pressure (EDP) are kept constant to about 80 and 120
mmHg. The test fluid within the mock loop is a blood analog consisting of a
30/70 % glycerin/water mixture (ρ= 1060 kg/m³ and μ = 3.5 mPa.s at room temperature). Left atrial and left ventricular pressures are measured by a
Mikrotip® intravascular dual pressure transducer (SPR-721, Millar
Instruments, Houston, TX, USA) and the aortic pressure by a pressure
transducer of the ViVitro pressure measuring system (Deltran® Pressure Transducer Model PT43-604, Utah Medical Products, Inc.) at a sample rate of
200 Hz. Torsional angles are acquired by video recording (30 frames/second)
of a marker at the model’s apex.
In this study, early diastolic pressure differences are measured at two positions, as depicted in Figure 118. For the first set of experiments,
TransMitral Pressure Differences (TMPDe) are measured, whereas for the
second set of experiments IntraVentricular Pressure Differences (IVPDe) are measured. TMPDe is defined as patrium - pbase (Equation 1, see § 1.2.3.1)
whereas IVPDe is defined as pbase - papex (Equation 2, see § 1.2.3.1). During
post-processing, a Savitzky-Golay smoothing filter (sgolayfilt, MATLAB) is
applied for all signals (with a polynomial order 3 and a frame size of 31). Because previous studies in the literature reported an effect of IVPDe with
end systolic volume (ESV) (Firstenberg et al. [24]) and with preload (Popovic
et al. [198] and De Mey et al. [17]), these values are kept approximately constant in the current study. We set the ESV to 60 ml and used a relative
constant water column of 15 cm (11mmHg) for the preload. Given that we
mounted five different ventricular models in the left heart, and compared three
heart rhythms, three stroke volumes, and two pressure measurements configurations, this study provides information about 60 experimental
configurations in total.

11. MODELLING THE LEFT HEART BY A BILITHIC APPROACH: FEASIBILITY STUDY OF THE
EFFECT OF TORSION ON INTRACARDIAC DIASTOLIC PRESSURE PARAMETERS
257
Figure 117: The five LV models shown from the inside (top view).

11. MODELLING THE LEFT HEART BY A BILITHIC APPROACH: FEASIBILITY STUDY OF THE
EFFECT OF TORSION ON INTRACARDIAC DIASTOLIC PRESSURE PARAMETERS
258
11.5 PRELIMINARY RESULTS
11.5.1 Transmitral pressure differences during early diastole
As shown in Figure 119 and Table 6, TMPDe values range from 9.9 mmHg
for model T2 (SV 50 ml and HR 65 bpm) up to 23.8 mmHg for model G (SV
65 ml and HR 80 bpm). Compared with the reference model G, the mean
TMPDe values are 2.1 %, 7.5 %, 20.2 % and 28.3 % lower for the C, L, T1
and T2 models, respectively. Furthermore, TMPDe is positively related with
HR and SV.
Table 6: Overview data of TMPDe varying SV while keeping HR constant (panel 1) and
varying HR while keeping SV constant (panel 2). The mean values and SD’s per model are
given for TMPDe
11.5.2 Intraventricular pressure differences during early diastole
As shown in Figure 120 and Table 7, IVPDe values range from 1.0 mmHg for
models G and C (SV 65 ml and HR 50 bpm) up to 3.9 mmHg for model T2
(SV 65 ml and HR 80 bpm). Table 7 also shows that, in comparison with the
reference model G, the mean IVPDe values are 22.4 % lower for the C model
and 6.9 %, 23.5 % and 42.3 % higher for the T1, L and T2, respectively.
Furthermore, IVPDe is also positively related with HR and SV.
50 16.4 (0.2) 14.4 (0.2) 16.2 (0.2) 12.7 (0.1) 10.5 (0.2)
65 19.1 (0.1) 17.4 (0.3) 19.2 (0.2) 14.8 (0.3) 13.9 (0.5)
80 20.3 (0.5) 20.3 (0.4) 20.1 (0.3) 16.7 (0.3) 14.6 (0.2)
50 13.3 (0.1) 12.6 (0.2) 13.9 (0.1) 10.5 (0.2) 9.9 (0.2)
65 19.1 (0.1) 17.4 (0.3) 19.2 (0.2) 14.8 (0.3) 13.9 (0.5)
80 23.8 (0.2) 21.5 (0.2) 21.4 (0.2) 20.1 (0.3) 17.6 (0.7)
SV HRTMPDe [mmHg] (SD)
G L C T1 T2
65
65
Comparison Reference -7.5% -2.1% -20.2% -28.3%

11. MODELLING THE LEFT HEART BY A BILITHIC APPROACH: FEASIBILITY STUDY OF THE
EFFECT OF TORSION ON INTRACARDIAC DIASTOLIC PRESSURE PARAMETERS
259
Figure 118: Position of the dual sensor catheter in the LH2 model for the transmitral and
intraventricular pressure difference measurements.

11. MODELLING THE LEFT HEART BY A BILITHIC APPROACH: FEASIBILITY STUDY OF THE
EFFECT OF TORSION ON INTRACARDIAC DIASTOLIC PRESSURE PARAMETERS
260
Figure 119: TMPDe values in function of SV (top panel) and HR (bottom panel)

11. MODELLING THE LEFT HEART BY A BILITHIC APPROACH: FEASIBILITY STUDY OF THE
EFFECT OF TORSION ON INTRACARDIAC DIASTOLIC PRESSURE PARAMETERS
261
Table 7: Overview data of IVPDe varying SV while keeping HR constant and varying HR
while keeping SV constant. The mean values and SD’s per model are given for IVPDe
11.6 DISCUSSION OF RESULTS
Transmitral pressure differences
As anticipated, the pressure difference magnitude across the valve is
dependent on the flow rate across the valve, with TMPDe increasing with
higher values of HR and SV (see Figure 119 and Table 6). The magnitude of
TMPDe values (about 10-24 mmHg) of this study is within the range of severe
mitral stenosis (10-30 mmHg) [55], which is much higher compared to normal
values (a few mmHg), which is inherent to the stenotic-like valve type model
of this study as a consequence of the valve repair.
More interesting is the impact of the different wall deformation
models on these pressure differences. As such, by normal conditions (SV 65
ml and HR 65 bpm) and compared with the reference model G (19.1 (0.1)
mmHg), these results show that TMPDe is not significantly affected by a
predominant circumferential wall deformation (model C with 19.2 (0.2)
mmHg), while lower TMPDe values are noticed by applying a predominant
longitudinal wall deformation (model L with 17.4 (0.3) mmHg). Moreover,
higher TMPDe values are observed up to 28.3 % with increased torsional left
ventricular motion (i.e., models T1 and T2).
Intraventricular pressure differences
The IVPDe values of this study by normal conditions (SV 65 ml and HR 65
bpm) vary from 1.7 (0.2) to 3.2 (0.3) and are close to the normal range of
adults as reported by Rovner et al. 2.6 mmHg (0.21) [199], by Popovic et al.
2.4 (0.18) [198] and by Yotti et al. 2.5 (0.18) [200].
50 1.7 (0.1) 2.3 (0.2) 1.3 (0.1) 2.1 (0.4) 2.7 (0.2)
65 2.0 (0.1) 2.9 (0.3) 1.7 (0.2) 2.2 (0.3) 3.2 (0.3)
80 2.5 (0.2) 3.0 (0.4) 1.9 (0.4) 3.5 (0.4) 3.9 (0.5)
50 1.0 (0.1) 1.3 (0.1) 1.0 (0.1) 1.1 (0.1) 1.2 (0.1)
65 2.0 (0.1) 2.9 (0.3) 1.7 (0.2) 2.2 (0.3) 3.2 (0.3)
80 3.6 (0.2) 3.3 (0.3) 2.4 (0.4) 2.4 (1.6) 3.9 (0.4)
SV HRIVPDe [mmHg] (SD)
G L C T1 T2
65
65
Comparison Reference 23.5% 6.9% 42.3%-22.4%

11. MODELLING THE LEFT HEART BY A BILITHIC APPROACH: FEASIBILITY STUDY OF THE
EFFECT OF TORSION ON INTRACARDIAC DIASTOLIC PRESSURE PARAMETERS
262
Figure 120: IVPDe values in function of SV (top panel) and HR (bottom panel)

11. MODELLING THE LEFT HEART BY A BILITHIC APPROACH: FEASIBILITY STUDY OF THE
EFFECT OF TORSION ON INTRACARDIAC DIASTOLIC PRESSURE PARAMETERS
263
Previous studies have shown that during infusion of isoproterenol (an
agent which induces positive inotropic and chronotropic effects) the IVPDe’s
are accentuated [201-203]. This finding is in good agreement with the results
of the present study, since IVPDe positively relates with increased values of
SV (which is related to inotropy) and HR. This relation is valid across the
complete set of left ventricular models.
Compared with the reference model, these results also show that
IVPDe is diminished by 22.4 % for predominant circumferential deformation,
while clearly augmented IVPDe values up to 23.5 % are observed by applying
predominant longitudinal wall deformations (exclusive torsion).
Moreover, an even stronger augmentation of IVPDe values are
observed with increased torsional left ventricular motion, with 6.9 % for T1
and 42.3 % for T2. This finding could be referred to the hypothesis that
increased values of torsion could play a role as compensation mechanism to
maintain normal filling [204].
11.7 CONCLUSIONS
This study demonstrates a novel in-vitro left heart model LH2 which adds the
anisotropic LV wall properties of LV3 (Chapter 7) to the left heart model LH1
(Chapter 10). By this integrative approach, this unique model achieves the
greatest number of practical guidelines compared to models of previous
chapters (see Table 8) and exceeds existing approaches (as described in
Chapter 3, Table 3) in the following ways. First, this model is able to generate
versatile wall deformation patterns by the anisotropic wall properties (PG2)
in terms of torsional motion (PG5) as well as longitudinal (PG4a) and
circumferential deformations (PG4b). Second, the integrated mitral valve
model includes all basic features of the mitral valve apparatus MV2 (Chapter
8) (PG6a-e). Finally, the mitral valve apparatus is integrated into a flexible
valve plane (PG7). This wide range of more realistic characteristics bears
promise to make this in-vitro left heart model an indispensable tool for
revealing insights of mitral valve- and torsional-related physiological events.
The LH2 model has been used in this study to obtain more insights
into the relationship between LV torsion and the diastolic parameters TMPDe
and IVPDe. The experiment protocol included different hydrodynamic
conditions (HR 50/65/80 bpm and SV 50/65/80 ml) and five different LV
models with different wall kinematics: (1) a reference model, (2) predominant
circumferential and (3) longitudinal deformation, and (4-5) two torsional
models.

11. MODELLING THE LEFT HEART BY A BILITHIC APPROACH: FEASIBILITY STUDY OF THE
EFFECT OF TORSION ON INTRACARDIAC DIASTOLIC PRESSURE PARAMETERS
264
Compared to a thin walled silicone membrane model G, which is
currently the most widely used model to mimic the left ventricle, this study
shows that left ventricular torsion is related with diminished TMPDe values
(down to 28.5 %) and augmented IVPDe values (up to 42.3%). Also, this study
shows that the model with predominant circumferential wall deformation
leads to a reduction of IVPDe by 22.4% while the model with predominant
longitudinal model leads to a decrease of TMPDe by 7.5 % and an increase
of IVPDe by 23.5 %. The lower TMPDe and higher IVPDe values of the
torsional models are partly due to its longitudinal component, but because this
longitudinal deformation component is lower than that of the L model, these
results may suggest that the torsional motion has indeed additional effects on
top of the longitudinal deformation component.
11.8 LIMITATIONS AND FURTHER DIRECTIONS
The main limitation of this study is the repeatability of the measurements. This
feasibility study concentrates on the proof of concept of the left heart model
and its results are merely indicative. More reliable results can be obtained by
more extensive experiments and measurements.
Another limitation relates to the model setup, which is a volume
controlled cardiovascular simulator to generate a pulsatile flow. However,
IVPDe’s are part of a complex interaction between pressure waves which
travel within the left ventricle [205], and because of the sensitivity of this
parameter (ranges within of a few mmHg), a volume controlled pump is not
the best option. A pressure controlled system could be a more robust way to
generate this pulsatile flow and measuring IVPDe’s.
The total rotational angle of models T1 and T2 of 77° and 90° are
much higher than the 17° in the human left ventricle. Also, the rough
trabecular wall structures, which promote the flow-structure interaction, are
not yet included in our model. In this study, an assumption is made that these
higher values of torsion in our model are set to partly compensate for the
inadequately flow-structure interaction.
In this study, the atrium is modelled by a passive silicon sac. However,
a more physiological-like approximation can be obtained by modelling the
active atrium contraction.

265

266

267
PART V. CONCLUSIONS
AND FUTURE
DIRECTIONS
Part V
Conclusions and
future directions

268

269
Chapter 12 Conclusions and future perspectives
Conclusions and future perspectives
This chapter provides a general discussion of the results of the studies
described with regard to the research goals. It also addresses important
methodological considerations, along with the innovations and suggestions for
future research.
12.1 GENERAL DISCUSSION
In the introduction of this dissertation, we formulated the three research goals
that guided the development of this PhD work. As a first goal, we aimed to
define practical guidelines for more realistic in-vitro left heart modelling in
terms of anatomical and physiological likeness. The second goal was to design
and develop more realistic models of the left ventricle and the mitral valve.
The third and final goal was to integrate these novel components to attain a
more nature-like model of the left heart. A general overview of our models is
shown in Figure 121 and placed in the context of the practical guidelines in
Table 8. In this chapter, we summarize the key findings related to each
research goal, as well as some methodological considerations, the innovation
of this work, and future perspectives.

12. CONCLUSIONS AND FUTURE PERSPECTIVES
270
12.1.1 Key findings
Goal 1: Defining practical guidelines for more realistic in-vitro left heart
modelling in terms of anatomical and physiological likeness.
In Chapter 2, we reviewed the 55 year history of cardiovascular simulator
development. This state-of-the-art overview clearly illustrates the wide range
of approaches as well as the accompanying challenges in order to attain more
realistic in-vitro modelling of the left heart. These approaches and
accompanying challenges are summarized in Table 3. From our overview, it
becomes evident that current cardiovascular models account for only a few of
the anatomical features and physiological events, which underscores the need
for designing and developing more naturally accurate left heart models. As
such, from the various limitations described in Chapter 3, we isolated three
general needs related to cardiovascular in-vitro modelling:
there is a need for more naturally correct left ventricular models (NEED 1);
there is a need for in-vitro mitral valve models including the basic
f anatomical features (NEED 2);
there is a need for in-vitro left heart models integrating these models of the f
f left ventricle, mitral valve, incorporating a flexible valve plane (NEED 3).
In Chapter 3, we translated these limitations into corresponding
practical guidelines that should be targeted in order to attain more realistic
cardiovascular models. Regarding NEED 1, five practical guidelines were
defined in the context of LV modelling: the implementation of a thick wall
(PG1), and inclusion of the anisotropic wall properties of the natural
ventricular wall (PG2), to invent left ventricular models that are equipped with
an active contractile wall containing contractile elements (PG3), mimicking
the global ventricular wall deformation patterns (PG4) including longitudinal
(PG4a), circumferential (PG4b) as well as radial deformation (PG4c) and
finally, to include the twisting left ventricular motion (PG5). Evaluating
NEED 2 brought about a sixth practical guideline which concerns with the
modelling of the mitral valve apparatus by a parametrized geometry (PG6)
which includes elementary features of the mitral valve apparatus, such as the
anterior and posterior leaflets (PG6a) which are hinged by a saddle-like
annulus (PG6b) and made of a fiber-based composite material (PG6c),
chordae tendineae (PG6d) and corresponding anterolateral and posteromedial
papillary muscles (PG6e).
With reference to NEED 3, two additional guidelines were proposed
regarding left heart modelling, more specifically, to the optimization of the
valve plane. The seventh practical guideline states that a more naturally

12. CONCLUSIONS AND FUTURE PERSPECTIVES
271
correct valve plane approach for mitral valve modelling is obtained by
implementing a flexible instead of a rigid mitral annulus while the valve plane
is needed to be suspended in the rigid hydraulic chamber of the ViVitro system
(PG7). Finally, the eighth practical guideline (PG8) recommends that a left
heart model would be more naturally correctly represented by allowing the
motion of the valve plane by the invention of novel ways of ventricle actuation
mechanisms. This full set of practical guidelines is crucial for the invention,
design and optimization of cardiovascular in-vitro models and has high
potential to bring cardiovascular modelling to a next level.
Goal 2: Designing more realistic models of the left ventricle and the mitral
valve apparatus.
Based on the practical guidelines set out in Goal 1, new in-vitro models of the
left ventricle (Chapters 5 to 7), the mitral valve (Chapter 8) and the venous
valve (Chapter 9) were designed, realized and tested. In Chapter 5, a first
thick-walled (PG1) LV model was proposed which included flexible bars that
connect the LV wall with an external frame in order to attain exerted control
on the LV wall deformation. In this way, control of the longitudinal (PG4a)
and the circumferential (PG4b) components of wall deformation is realized,
a feature which is absent from current in-vitro approaches. Chapter 6 presents
a second thick-walled (PG1) LV model with the addition of anisotropic (PG2)
and contractile (PG3) wall elements. This LV model is able to generate the
full set of deformation patterns (PG4a-c), the LV torsional motion (PG5) as
well as the valve plane motion (PG8) which is typical for the natural heart.
Chapter 7 describes the third LV model which is thin-walled and equipped
with spirally arranged fibers. These fibers induce anisotropic wall properties
(PG2) which forces the wall to deform in a twisting manner (PG5). Besides
this left ventricular torsion, two components of the global LV wall
deformation patterns are included, the longitudinal (PG4a) as well as the
circumferential component (PG4b). Chapter 8 presents a mitral valve model
which includes the most elementary features and geometrical shape of the
natural valve, as suggested by PG6. As such, this valve model includes the
two main leaflets (PG6a) and a saddle-shaped annulus (PG6b). Also, the
leaflets are composed of a three layer composite layer structure (PG6c) which
allows normal valve function and a tight connection with its chordae tendineae
(PG6d). Finally, as a side project, a PIV compatible venous valve is proposed
in Chapter 9. This chapter starts with the identification of an additional need
(NEED 4) of a PIV compatible venous valve model for the validation of
Computational Fluid Dynamics (CFD) models. In this regard, an additional
practical guideline was added (see Table 8) stating that a relevant venous valve
model needs to combine functionality, especially at low pressure differences,
with transparency to allow optical access for PIV measurements (PG9). Then,

12. CONCLUSIONS AND FUTURE PERSPECTIVES
272
this chapter presents the development of such a PIV compatible venous valve
model which is sensitive for fluid motion and is able to function at low
pressure differences (PG9).
Goal 3: Integration of these novel components to attain a more nature-like
model of the left heart.
In Chapters 10 and 11, two left heart models are developed by assembling the
components of Goal 2 to model also the interactions between these individual
components. By its integrative approach, the first left heart model (Chapter
10) closely mimics real anatomical features in three main ways. First, its
geometry is based on medical images and includes besides larger features
(such as the left ventricle which mimics the longitudinal (PG4a) and
circumferential deformation patterns (PG4b), left atrium, valve plane and
aorta), also smaller features such as the auricle and the entrances of the four
pulmonary veins. Second, the mitral valve model MV2 (Chapter 8) adds even
more anatomical components (PG6a-d) and is joined with the left ventricle
via the chordae tendineae to the two main papillary muscles (PG6e). Third,
these different features are all assembled in a monolithic entity which results
in a more compact and more nature-like model of the left heart. A tailored
suspension system enables the connection with a standard cardiovascular
simulator while preserving the flexible appearance and complex shape of the
valve plane region (PG7). This model is made compatible with ultrasound and
has shown to be able to reproduce physiological-like intraventricular flow
patterns. The second left heart model (Chapter 11) also accounts for the
practical guidelines of the first left heart model, but adds the anisotropic
material properties of the left ventricular model as developed in Chapter 7
(PG2). As a result, this left heart model is able to mimic the natural left
ventricular torsional motion (PG5). This wide range of more realistic
characteristics bears promise to make this latter in-vitro left heart model an
indispensable tool for expanding our knowledge of mitral valve- and torsional-
related physiological events in in-vitro experimental studies.
12.1.2 Methodological considerations
Despite the strengths of these key findings, the approaches described in this
thesis are still subject to certain limitations which should be addressed by
future research. The limitations of our work can be described in relation to
three themes.

12. CONCLUSIONS AND FUTURE PERSPECTIVES
273
Figure 121: Overview of the in-vitro models developed in this dissertation.

12. CONCLUSIONS AND FUTURE PERSPECTIVES
274
12.1.2.1 Physiological events
Although many challenges of current in-vitro approaches have been targeted
in this dissertation, there are at least three practical guidelines which remain
open for further investigation and resolution. The first limitation deals about
the modelling of the valve plane motion (PG8). Even though this guideline
was successfully addressed by the active LV wall model (Chapter 6), it was
not integrated into the integrative left heart models (Chapters 10 and 11). We
acknowledge that, in reality, the valve plane is constantly in motion along the
LV long axis by an up and downward as well as a rotating movement, while
the apex is also subjected to a partial torsional motion but is otherwise
relatively static. Whereas our final left heart model (Chapter 11) adds the
torsional LV motion to current in-vitro approaches, we emphasize that its
valve plane is still fixed, even though the apex freely moves up and downward
to account for the full rotational movement. Although this valve plane motion
plays an important role in the pump function of the heart, this item has not
been well-covered in the in-vitro research literature and has also not been
implemented in the integrative left heart models of this dissertation.
The second limitation in attaining the practical guidelines is about the
modelling of the contractile myocardial wall (PG3). In the LV2 approach
(Chapter 6), the contractile elements have been modeled by an artificial
muscle concept with inflatable cells, which is a major step forward in
comparison with the current passive membrane models. However, in this
approach, the actual myocardial fibers as well as the papillary muscles of the
biological heart are not modelled yet.
As a third limitation, we acknowledge the current absence of optical
accessibility of all developed left heart models towards PIV measurements.
Although we started to develop a procedure to realize PIV compatible thin-
walled three dimensional structures (such as the venous valve model described
in Chapter 9 or the model of the human airways briefly described in Chapter
10), we haven’t applied these techniques for the left heart model despite its
great potential. In the Future directions section below, we propose new more
detailed ideas how these latter three limitations can be addressed in future
research.
In addition to these three practical guideline limitations, there are
other physiological events which are not implemented in our models so far.
For example, we did not yet incorporate the atrial muscle contraction which is
especially important during diastolic filling. To attain this goal, existing
functional atrium models from the literature [88, 95-97] could be

12. CONCLUSIONS AND FUTURE PERSPECTIVES
275
Table 8: A general overview of this dissertation is given. Index: ‘–’ absent, ‘v’ present, ‘~’
present but limited, ‘ ’ not applicable, M: mechanical mitral valve and IV: in-vitro mitral
valve.
Thick wall
Anisotropic wall
Contractile elements
Longitudinal
deformation
Circumferential
deformation
Radial deformation
Twisting motion
Posterior & anterior
leaflets
Saddle-like annulus
Fiber-based leaflets
Chrordae tendineae
Papillary muscles
Flexible annulus &
valve plane
Longitudinal valve
plane motion
VV
Ch
apte
r 2
In-v
itro
mo
de
llin
g o
f th
e le
ft h
ear
t: S
tate
-of-
the
-art
mo
de
l
Ch
apte
r 3
Ne
ed
s an
d p
ract
ical
gu
ide
lin
es
(PG
s)N
EED
4
Ch
apte
r 4
D
esi
gn m
eth
od
olo
gy
PG1
PG2
PG3
PG4a
PG4b
PG4c
PG5
PG6a
PG6b
PG6c
PG6d
PG6e
PG7
PG8
PG9
Ch
apte
r 5
v-
-~
~-
-M
-
Ch
apte
r 6
vv
vv
vv
vM
v
Ch
apte
r 7
-v
-v
v-
vM
-
Ch
apte
r 8
IVv
vv
v-
v
Ch
apte
r 9
v
Ch
apte
r 1
0-
--
~~
--
IVv
vv
vv
v-
Ch
apte
r 1
1-
v-
vv
-v
IVv
vv
vv
v-
vv
vv
vv
vv
LV5
: PIV
-co
mp
atib
le c
on
trac
tile
ce
ll L
V m
od
el (
VV
+ L
V2
)v
vv
vv
vv
vP
IV
vv
vv
vv
vIV
vv
vv
vv
v
vv
vv
vv
vIV
vv
vv
vv
vP
IV
LH1
: Mo
no
lith
ic le
ft h
ear
t m
od
el (
incl
usi
on
of
MV
2)
LH2
: Bil
ith
ic le
ft h
ear
t m
od
el (
incl
usi
on
of
LV3
an
d M
V2
)
PA
RT
V. F
utu
re d
irec
tio
ns
(su
gges
tio
ns)
Ch
apte
r 1
2
LV4
: Myo
card
ial f
ibe
r le
ft v
en
tric
le m
od
el
FH1
: Myo
card
ial b
and
fu
ll h
ear
t m
od
el 1
(LV
4 +
MV
2)
FH2
: Myo
card
ial b
and
fu
ll h
ear
t m
od
el 2
(V
V +
LV
2 +
MV
2)
LV2
: Co
ntr
acti
le c
ell
left
ve
ntr
icle
mo
de
l
LV3
: An
iso
tro
pic
left
ve
ntr
icle
mo
de
l PA
RT
III. I
n-v
itro
mo
del
ling
of
the
mit
ral (
GO
AL
2) a
nd
th
e ve
no
us
valv
e (s
ide
pro
ject
)
MV
1, M
V2
: Co
mp
osi
te m
od
els
of
the
mit
ral v
alve
VV
: PIV
-co
mp
atib
le v
en
ou
s va
lve
mo
de
l
PA
RT
IV. M
od
ellin
g th
e le
ft h
eart
by
an in
tegr
ativ
e ap
pro
ach
(GO
AL
3)
NEE
D 1
Typ
e
NEE
D 2
NEE
D 3
PA
RT
II. In
-vit
ro m
od
ellin
g o
f th
e le
ft v
entr
icu
lar
mu
scle
(GO
AL
2)
LV1
: Th
ick-
wal
led
left
ve
ntr
icle
mo
de
l
LVM
VV
P
mo
de
lm
od
el
mo
de
l
In-V
itro
Mo
del
ling
of
the
Left
Hea
rt
PA
RT
I. Th
e le
ft h
eart
: fro
m n
atu
re t
o m
od
el (G
OA
L 1)
Ch
apte
r 1
The
left
he
art
stru
ctu
re a
nd
fu
nct
ion
LVM
VV
P

12. CONCLUSIONS AND FUTURE PERSPECTIVES
276
implemented, as well as the active muscle model LV2 (Chapter 6).
Furthermore, papillary muscle contraction which is a key role player in mitral
apparatus function is also not yet taken into account in the current PhD work.
In addition, it should be emphasized that because of the focus on mitral valve
modelling (in Chapters 8 and 10 to 11) in the current thesis, we made use of a
mechanical prosthetic aortic valve for the experiments. A final physiology-
related limitation is that although heart function is based upon underlying
chemical and electrical mechanisms, these physiological events are also not
yet taken into account in the approaches described in this dissertation.
12.1.2.2 Anatomical structures
Even though we added much more anatomical detailed structures to current
in-vitro approaches, we acknowledge that more accurate geometrical
approximations of the real heart can be obtained. As such, one limitation is
about the papillary muscles which anatomically differ in the number of heads
as well as in exact location, and which are usually grouped in two main groups.
In our left heart model, we implemented a simplification of reality as each
group of papillary muscles was represented by only one head. Also, more
anatomically detailed geometry is desirable in future models in order to obtain
more correct approximations of the interventricular blood flow patterns. For
example, one can attempt to incorporate the rough trabeculae structures which
promote flow-structure interactions. Lastly, our mitral valve models do not
completely capture the complexity of the human mitral valve as we shaped
our model according to a relatively simplified design and hence should be
conceived as only a generalization of reality.
12.1.2.3 Proof of concept
This dissertation concentrated on demonstrating the proof of concepts of the
proposed models and not on full-fledged validations. As a consequence, it
cannot be overemphasized that the experimental results reported in this PhD
work are merely indicative. More reliable results are definitely needed and can
be obtained by more extensive experiments and measurements before these
models can be utilized in experimental-clinical settings, such as testing
surgical or interventional cardiovascular innovations or in research settings,
such as advancing knowledge on cardiovascular functioning. In this regard,
future research on these models should aim to realize this fundamental
requirement for an experimental model to be valid: the model and its mock
circuit have to behave similarly with the biological system they are simulating.
Another limitation of this conceptual phase is the general choice of some
materials. As such, we made use of a general purpose silicone as flexible
material, universal thermoplastic films as sheet material, and non-treated

12. CONCLUSIONS AND FUTURE PERSPECTIVES
277
polymer multifilament yarns or ordinary cotton sewing threads as fiber
material. Although these materials are suitable for experiments for this
conceptual phase, there is a wide range of advanced flexible, sheet and fiber
materials available that can be explored and investigated to further optimize
the left heart model material characteristics. Also the fiber architecture and
distribution within the flexible matrix of the composite material is rather
preliminary in this study and can be supplementary explored in order to obtain
a higher durability and a more detailed imitation of normal left heart
dynamics, or even of pathological events due to local wall stiffness after
myocardial infarction. In summary, there is opportunity for future research in
material optimization which will likely result in more repeatable and extensive
testing to obtain more reliable results.
12.1.3 Innovations
The innovative aspect of this dissertation primarily applies to the novel
concepts and designs which tackle complex issues by means of a broad range
of techniques and materials. As such, we distinguish three major novelties: by
complexity, by innovation and by its broad character.
12.1.3.1 Novel by complexity
In-vitro simulation of the human cardiovascular system has become a valuable
instrument to enhance cardiovascular insights, to advance procedures, and to
develop medical devices. Through its 55 year history, these bench models
have continuously been developed to mimic the complex anatomical and
physiological conditions as accurately as possible. The wide variety of heart
models and accompanying model limitations emphasize that - even in these
advanced technological times - it is still extremely challenging to accurately
simulate the complex physiological conditions that occur in the human left
hart with an in-vitro simulator. We did not circumvent these current
limitations but brought up solutions for modelling left heart components, even
for the most complex architectural structures, such as the mitral valve
apparatus. Integrating these interrelated components to form one compact
monolithic left heart model which is able to mimic the natural anatomical
elementary structures, physiological wall deformation patterns and ultrasonic
tissue properties, appeared to be rather complex in concept, building strategy,
as well as in realization. Bringing up ideas that meet individual practical
guidelines (as achieved in Chapters 5 to 9) is a challenge in itself, however,
fulfilling a combination of multiple practical guidelines in one concept (as
realized in Chapters 10 to 11) is even more exciting and challenging. As such,
the model LH2 (Chapter 11) exceeds all current in-vitro models by attaining

12. CONCLUSIONS AND FUTURE PERSPECTIVES
278
at least nine aspects of the proponed practical guidelines (PG4a, PG4b, PG5,
PG6a, PG6b, PHG6c, PG6d, PG6e, and PG7).
12.1.3.2 Novel by innovation
A first innovation of this study in cardiovascular modelling is the application
of fiber-silicone based composite structures. On the one hand, this material
composition allows anisotropic wall properties of LV3. This causes the
substrate to deform in a predefined direction, resulting in global LV wall
deformation patterns such as exclusive or combined longitudinal,
circumferential, as well as torsional components (Chapters 7 and 11). On the
other hand, this approach is also applied to mimic the native mitral leaflet
properties of MV1 and MV2 (Chapter 8) by a well-designed arrangement of
strong fibers into a flexible matrix over the leaflet surface, which resulted in a
firm structure that can withstand the high blood pressures while demonstrating
low bending resistance, enabling the leaflets to smoothly open and close with
only a minimum of energy losses. Also, these leaflet fibers served to merge
into the chordae tendineae and - at the end – to merge into the papillary muscle
heads, as such ensuring that the mitral valve leaflets could be firmly connected
to the LV wall.
A second novelty is the invention of an artificial cardiac muscle LV2
(Chapter 6) which, by inclusion of contractile cells, captures the full set of
natural LV wall deformation patterns, including torsion and valve plane
motion. This model exceeds all current in-vitro LV models by attaining at least
seven aspects of the proponed practical guidelines (PG1, PG3, PG4a, PG4b,
PG4c, PG5 and PG8). In this model, the torsional motion is generated by the
shortening of a range of parallel oriented inflatable cells which are slantly
oriented along the circumference of the LV model.
A third aspect of innovation lies in the proposed production
procedures for making these benchtop models. Three novel methods are
especially worth mentioning in this conclusion as they are focused on realizing
complex-shaped benchtop models. The first procedure is developed for the
creation of flexible thin-walled models through hollow wax cores and is
applied for the realization of the flexible part of the monolithic left heart model
LH1 (see description in Chapter 10). The other two procedures are based on
the direct 3D printing of tailored cores and are invented for realizing even
more detailed structures. We described and applied these procedures for the
creation of a thin-walled flexible and thick-walled rigid models of the upper
human airways, respectively (described in Chapter 10). These procedures may
be especially of great value for realizing benchtop models that are compatible
for PIV modelling.

12. CONCLUSIONS AND FUTURE PERSPECTIVES
279
A fourth novelty put forward in this dissertation is the venous valve
model design VV (described in Chapter 9) which was also developed in the
perspective of compatibility with PIV measurements. Its design is based on
the folding and welding of a transparent and pliable polymer film to a three-
dimensional valve that is sensitive for fluid motion and low pressure
differences, while it is able to withstand physiologically high pressure drops.
This approach opens the intriguing possibility to experimentally assess and
examine intra-valvular flow patterns. It may also prove to be a promising tool
for use in experimental validation studies of computational models of
cardiovascular configurations.
12.1.3.3 Novel by broadness
Each proposed new concept is the result of a broad collection of ideas, designs
and concepts that became before (see also Chapter 4). It is broad because of
the wide range of production techniques and materials that have been applied
and because of the wide range of challenges that have been addressed. It is
also broad because of the variety in applications of the left heart models and
by its compatibility to other cardiovascular setups. As such, this dissertation
work can be considered as an important step forward in innovating the field
of left heart models. Since the FDA stated that clinically relevant benchtop
models are urgently needed for in-vitro testing and that the best are preferred
[2], we hope that our simulators will be widely used for cardiovascular
applications in the future.
12.2 FUTURE DIRECTIONS
Bringing together the cardiovascular simulation history and the approaches
developed in this dissertation, we define a three-fold ambition which can bring
– in our opinion - benchtop modelling to the next level of innovation. The first
challenge is to ‘go for an active wall’. This recommendation denotes that
future cardiovascular simulators should account for the contractile muscle
cells. In our opinion, the integration of contractile elements is the most
promising way to combine the full range of LV physiological events,
including the valve plane motion. The second aim is to ‘go for an integrative
approach’. This recommendation reflects our opinion that an integrative
approach of modelling an entire left heart is to be preferred above modelling
separate left heart components. As well discussed in this dissertation, the
mitral valve, for instance, is part of the valve plane but is also well connected
to the left ventricle. Hence, its function can only be completely modelled by
taking into account the co-operation between these different components. In
sum, we thus believe that the heart physiology is more accurately represented

12. CONCLUSIONS AND FUTURE PERSPECTIVES
280
by the incorporation of all interrelated elements into one single model, even
though this signifies a major challenge for the manufacturing process. Finally,
the third ambition for future in-vitro modelling is to ‘go for a transparent
model’. This recommendation points to the importance of attunement of
cardiovascular simulators to be compatible with PIV investigations. Realizing
this PIV compatibility bears the promise to enable experimental assessments
and examinations of intra-cardiac flow patterns which are of great value for
revealing insights of physiological events and for medical device testing.
However, realizing this aspect increases the complexity of in-vitro modelling
because it narrows the range of applicable materials, and on top of that, it
demands more advanced production processes. It is noteworthy to mention
that another experimental technique to assess these flow patterns is by MRI
examinations. In this case, other design criteria apply to account for the MR-
compatibility, such as the absence of ferrous metals in model components.
To close this dissertation, we formulate three suggestions – developed
during our thinking and design process for the current PhD work - that may
help to accomplish this three-fold ambition to ‘go for an active wall, go for an
integrative approach and go for a transparent model’ in future in-vitro
modelling research.
12.2.1 To go for an active wall
First, to account for contractile elements in cardiovascular models, we
designed a new artificial muscle which is able to mimic the actual muscle fiber
contraction, namely LV4. The contractile muscle fiber is based on an exterior
braided sleeving and an inner elastic tube. By applying pressure, the elastic
tube tends to expand while forcing the exterior braid to widen its diameter. As
a result of this diameter increase, the actuator shortens in length and mimics
thereby the actual contraction of the natural muscle fiber. This idea was
inspired by the deployment of a woven self-expandable stent which likewise
increases in diameter while shortening in length. We researched the literature
and noted that this approach is not entirely new, as a similar concept was
invented in the 1960’s in the context of an orthotic appliance for polio patients
by J. L. McKibben [206]. Based on this actuator concept, we developed LV4
by arranging multiple of these artificial muscle fibers spirally around the
circumference of the LV (Figure 122). After investigation of recent literature,
we found that a similar type of LV model was developed using a bioinspired
soft actuated material [207], as it is composed of McKibben actuators which
are slantly oriented along the circumference of the model. This model is able
to generate the torsional motion as well as a limited pump function. This
model is able to pump and generate torsion, however, the ejection fraction is
suboptimal [208], which is the same observation we made from preliminary

12. CONCLUSIONS AND FUTURE PERSPECTIVES
281
tests of our developed LV4 model. The reason can be found in the mechanism
of diameter increase of the individual fibers which induces an unwanted side
effect, i.e., circumferential widening instead of circumferential narrowing.
This partially neutralizes the effect of fiber contraction. In our opinion, this
might be resolved by impeding the unnatural circumferential widening either
by adding a pericardial sac around the fiber model or by adding more artificial
muscle fibers layers according to the natural LV muscle wall. This latter
solution is implemented in the first full heart approach (FH1), as described
further in this chapter, as well as recently applied in an implantable heart assist
sleeve [208], including two layers of soft actuated material, leading to normal
values of ejection fraction. An optimization of these artificial muscle models,
together with the other active wall model LV2 (Chapter 6), will be able to
generate torsional motion by the integration of contractile elements and as
such, these two models can be considered as stepping stones to fully account
for the first challenge, to ‘go for an active wall’.
Figure 122: Active left ventricular muscle LV4 including a series of spirally arranged
artificial muscle fibers (b). By applying pressurized air, an outer braid fiber structure is
expanded in radial direction by an internal flexible tube and meanwhile shortens in length
(ΔL) (a).
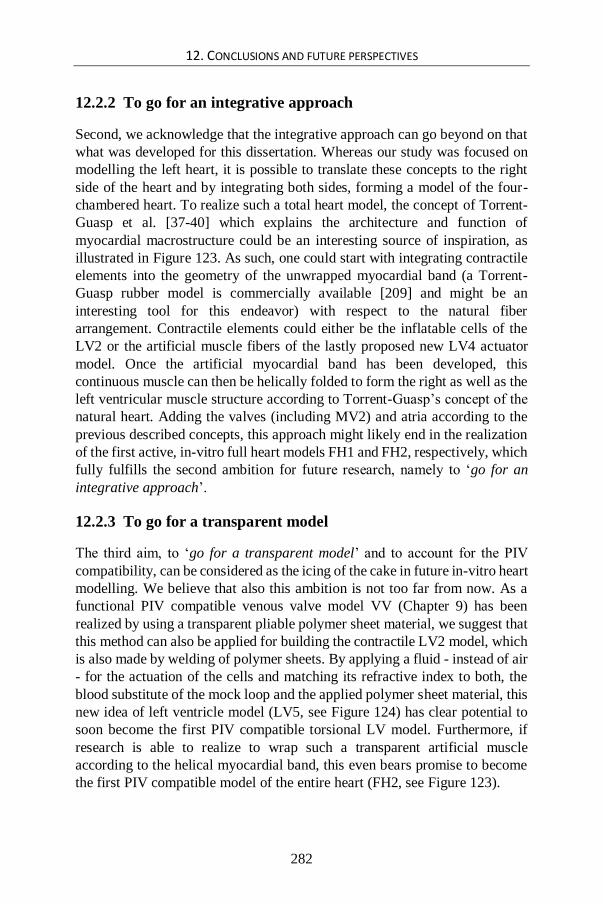
12. CONCLUSIONS AND FUTURE PERSPECTIVES
282
12.2.2 To go for an integrative approach
Second, we acknowledge that the integrative approach can go beyond on that
what was developed for this dissertation. Whereas our study was focused on
modelling the left heart, it is possible to translate these concepts to the right
side of the heart and by integrating both sides, forming a model of the four-
chambered heart. To realize such a total heart model, the concept of Torrent-
Guasp et al. [37-40] which explains the architecture and function of
myocardial macrostructure could be an interesting source of inspiration, as
illustrated in Figure 123. As such, one could start with integrating contractile
elements into the geometry of the unwrapped myocardial band (a Torrent-
Guasp rubber model is commercially available [209] and might be an
interesting tool for this endeavor) with respect to the natural fiber
arrangement. Contractile elements could either be the inflatable cells of the
LV2 or the artificial muscle fibers of the lastly proposed new LV4 actuator
model. Once the artificial myocardial band has been developed, this
continuous muscle can then be helically folded to form the right as well as the
left ventricular muscle structure according to Torrent-Guasp’s concept of the
natural heart. Adding the valves (including MV2) and atria according to the
previous described concepts, this approach might likely end in the realization
of the first active, in-vitro full heart models FH1 and FH2, respectively, which
fully fulfills the second ambition for future research, namely to ‘go for an
integrative approach’.
12.2.3 To go for a transparent model
The third aim, to ‘go for a transparent model’ and to account for the PIV
compatibility, can be considered as the icing of the cake in future in-vitro heart
modelling. We believe that also this ambition is not too far from now. As a
functional PIV compatible venous valve model VV (Chapter 9) has been
realized by using a transparent pliable polymer sheet material, we suggest that
this method can also be applied for building the contractile LV2 model, which
is also made by welding of polymer sheets. By applying a fluid - instead of air
- for the actuation of the cells and matching its refractive index to both, the
blood substitute of the mock loop and the applied polymer sheet material, this
new idea of left ventricle model (LV5, see Figure 124) has clear potential to
soon become the first PIV compatible torsional LV model. Furthermore, if
research is able to realize to wrap such a transparent artificial muscle
according to the helical myocardial band, this even bears promise to become
the first PIV compatible model of the entire heart (FH2, see Figure 123).

12. CONCLUSIONS AND FUTURE PERSPECTIVES
283
Figure 123: Illustration of the FH1 and FH2, ideas for future in-vitro models of the total heart.
This image shows the heart (A) which can be unwrapped to form a continuous ventricular
myocardial band (B) according to the Torrent-Guasp concept [32]. Likewise, artificial muscle
bands (C and D) can be constructed according to the LV2 or LV4 muscle designs and
subsequently wrapped to form the in-vitro full heart models FH1 and FH2, respectively.
Similar to the VV model, transparent sheet materials could be used to account for PIV
compatibility.

12. CONCLUSIONS AND FUTURE PERSPECTIVES
284
Figure 124: Illustration of the LV5, an idea for a future PIV compatible active LV model.
Hence, by implementing the innovative approaches proposed in this
dissertation and in this discussion, we believe that it is feasible for future
research to accomplish the three-fold ambition to ‘go for an active wall, go
for an integrative approach and go for a transparent model’, even though we
acknowledge that the production and manufacturing processes will remain
challenging. Realizing such in-vitro models will likely give birth to a
multitude of more advanced physiological insights as well as a more accurate
platform to test medical devices. Nevertheless, even though this would signify
a major step forward in comparison to the currently used in-vitro approaches,
we should still humbly acknowledge that these in-vitro models will always be
simplifications and approximations of reality, which are still far away from
the complex anatomical and physiological events and features of the human
heart.

REFERENCES
285
References
1. Mendis, S., P. Puska, and B. Norrving, Global atlas on cardiovascular
disease prevention and control. 2011: World Health Organization.
2. FDA, Draft Guidance for Industry and Food and Drug Administration Staff,
Investigational Device Exemptions (IDE) for Early Feasibility Medical
Device Clinical Studies, Including Certain First in Human (FIH) Studies,
November 10, 2011.
3. Little, W.C. and J.K. Oh, Echocardiographic Evaluation of diastolic function
can be used to guide clinical care. Circulation, 2009. 120(9): p. 802-809.
4. Nagueh, S.F., et al., Recommendations for the evaluation of left ventricular
diastolic function by echocardiography. European Journal of
Echocardiography, 2009. 10(2): p. 165-193.
5. Rausch, M., Development and validation of an in-vitro platform for the study
of mitral valve function under normal and pathologic conditions with
particular emphasis on isolated annular dilatation. 2009, University of
Stuttgart.
6. Purves, W.K., et al., Life: The Science of Biology: Volume III: Plants and
Animals. Vol. 3. 2003: Macmillan.
7. Yellin, E., The momentum of mass, the momentum of ideas, and diastolic
function. Systolic and diastolic function of the heart, 1995 (IOS Press,
Amsterdam).
8. Bell, S.P., et al., Alterations in the determinants of diastolic suction during
pacing tachycardia. Circulation Research, 2000. 87(3): p. 235-240.
9. Cheng, C.P., et al., Effect of Loading Conditions, Contractile State, and
Heart-Rate on Early Diastolic Left-Ventricular Filling in Conscious Dogs.
Circulation Research, 1990. 66(3): p. 814-823.
10. Ling, D., et al., Regional Diastolic Mechanics of the Left-Ventricle in the
Conscious Dog. American Journal of Physiology, 1979. 236(2): p. H323-
H330.
11. Courtois, M., S.J. Kovacs, and P.A. Ludbrook, Transmitral Pressure-Flow
Velocity Relation - Importance of Regional Pressure-Gradients in the Left-
Ventricle During Diastole. Circulation, 1988. 78(3): p. 661-671.
12. Klabunde, R., Cardiovascular Physiology Concepts.
http://cvphysiology.com/Heart%20Disease/HD001.htm, accessed on
10/12/2009.
13. Katz, L.N., The role played by the ventriclular relaxation process in filling
the ventricle. Am J Physiol, 1930. 95: p. 542-553.

REFERENCES
286
14. Lisauskas, J.B., et al., Chamber properties from transmitral flow: prediction
of average and passive left ventricular diastolic stiffness. Journal of Applied
Physiology, 2001. 91(1): p. 154-162.
15. Little, W.C., et al., Determination of Left-Ventricular Chamber Stiffness
from the Time for Deceleration of Early Left-Ventricular Filling. Circulation,
1995. 92(7): p. 1933-1939.
16. Marino, P., et al., Early mitral deceleration and left atrial stiffness. American
Journal of Physiology-Heart and Circulatory Physiology, 2004. 287(3): p.
H1172-H1178.
17. De Mey, S., Diastology: Insights from Model Studies and Clinical
Observations using Color M-Mode Doppler Echocardiography.
Proefschrift, 2002.
18. Verdonck, P., et al., In vivo validation of a fluid dynamics model of mitral
valve M-mode echocardiogram. Medical & Biological Engineering &
Computing, 1996. 34(3): p. 192-198.
19. Chemla, D., et al., Mechanics of relaxation of the human heart. Physiology,
2000. 15(2): p. 78-83.
20. Courtois, M., S.J. Kovacs, and P.A. Ludbrook, Physiological Early Diastolic
Intraventricular Pressure-Gradient Is Lost During Acute Myocardial-
Ischemia. Circulation, 1990. 81(5): p. 1688-1696.
21. Firstenberg, M.S., et al., Relationship between early diastolic
intraventricular pressure gradients, an index of elastic recoil, and
improvements in systolic and diastolic function. Circulation, 2001. 104(12):
p. I330-I335.
22. Gillebert, T.C., A.F. LeiteMoreira, and S.G. DeHert, The hemodynamic
manifestation of normal myocardial relaxation - A framework for
experimental and clinical evaluation. Acta Cardiologica, 1997. 52(3): p.
223-246.
23. Lenihan, D.J., et al., Mechanisms, Diagnosis, and Treatment of Diastolic
Heart-Failure. American Heart Journal, 1995. 130(1): p. 153-166.
24. Firstenberg, M.S., et al., Relationship between ventricular contractility and
early diastolic intraventricular pressure gradients: A diastolic link to
systolic function. Journal of the American Society of Echocardiography,
2008. 21(5): p. 501-506.
25. Simons, M., Section of Cardiovascular Medicine.
http://www.med.yale.edu/intmed/cardio/echo_atlas/references/graphics/hea
rt_anatomy.gif, accessed on 02/01/2010.

REFERENCES
287
26. Grégoire, L., Inleiding in de Anatomie/Fysiologie van de mens, tweede druk.
http://www.med.yale.edu/intmed/cardio/echo_atlas/references/graphics/hea
rt_anatomy.gif, accessed on January 1, 2010: p. Thieme Meulenhoff, Module
2, hoofdstuk 1, deel 5, p. 117.
27. Anatomy, D. accessed on March 21, 2016; Available from:
https://www.pinterest.com/delgas/anatomy/.
28. Silbernagl, S.D.A., Atlas van de fysiologie. 2007: Sesam
29. Huxley, H., Sliding filaments and molecular motile systems. J Biol Chem,
1990. 265(15): p. 8347-8350.
30. College study guide, accessed on March 21, 2016; Available from:
https://www.studyblue.com/notes/note/n/pre-ap-biology-study-guide-2012-
13-mrsedward/deck/9722162.
31. Klabunde, R.E. Cardiovascular Physiology Concepts. accessed on March
21, 2016; Available from:
http://www.cvphysiology.com/Cardiac%20Function/CF020.htm.
32. Buckberg, G., et al., Structure and function relationships of the helical
ventricular myocardial band. The Journal of thoracic and cardiovascular
surgery, 2008. 136(3): p. 578-589. e11.
33. Sabadini, R., Sale, . Animation de la contraction musculaire. Website Centre
Nationale de la recherche scientifique, La cellule animale. Voyage au coeur
du vivant accessed on April 3, 2006; Available from:
http://www.cnrs.fr/cw/dossiers/doscel/imgAr/animtheq/page.htm.
34. Robb, J.S. and R.C. Robb, The normal heart: anatomy and physiology of the
structural units. American Heart Journal, 1942. 23(4): p. 455-467.
35. Rushmer, R.F., D.K. Crystal, and C. Wagner, The functional anatomy of
ventricular contraction. Circulation Research, 1953. 1(2): p. 162-170.
36. Streeter, D.D., et al, Fiber orientation in the canine left ventricle during
diastole and systole. Circulation research, 1969. 24(3): p. 339-347.
37. Torrent-Guasp, F., Sobre morfologia y funcionalismo cardiacos. Rev Esp
Cardiol, 1967. 20(1).
38. Torrent-Guasp F, B.M., Buckberg GD, Carreras F, Flotats A, Carrio I,
Ferreira A, Samuels and L.a.N. J, Spatial orientation of the ventricular
muscle band: physiologic contribution and surgical implications. Thorac
Cardiovasc Surg, 2001. 122: p. 389-392.
39. Torrent-Guasp F, K.M., Corno A, Komeda M, Cox J, Flotats A, Ballester-
Rodes M and and C.-C. F., Systolic ventricular filling. Eur J Cardiothorac
Surg, 2004. 25: p. 376-386.

REFERENCES
288
40. Torrent-Guasp F, K.M., Corno AF, Komeda M, Carreras-Costa F, Flotats A,
Cosin-Aguillar J and a.W. H., Towards new understanding of the heart
structure and function. Eur J Cardiothorac Surg, 2005. 27: p. 191-201.
41. Anderson, R.H., et al., The three‐dimensional arrangement of the myocytes
in the ventricular walls. Clinical Anatomy, 2009. 22(1): p. 64-76.
42. Nasiraei-Moghaddam, A. and M. Gharib, Evidence for the existence of a
functional helical myocardial band. American Journal of Physiology-Heart
and Circulatory Physiology, 2009. 296(1): p. H127-H131.
43. Sengupta, P.P., et al., Left ventricular form and function revisited: applied
translational science to cardiovascular ultrasound imaging. J Am Soc
Echocardiogr, 2007. 20(5): p. 539-51.
44. Carreras, F., et al., Left ventricular torsion and longitudinal shortening: two
fundamental components of myocardial mechanics assessed by tagged cine-
MRI in normal subjects. The international journal of cardiovascular imaging,
2012. 28(2): p. 273-284.
45. Abraham, T.P., V.L. Dimaano, and H.-Y. Liang, Role of tissue Doppler and
strain echocardiography in current clinical practice. Circulation, 2007.
116(22): p. 2597-2609.
46. Notomi, Y., et al., Measurement of ventricular torsion by two-dimensional
ultrasound speckle tracking imaging. Journal of the American College of
Cardiology, 2005. 45(12): p. 2034-2041.
47. Zacek, P., J. Dominik, and P. Kubis, Interactive Cardiac Surgery. ANNALS-
ROYAL COLLEGE OF SURGEONS OF ENGLAND, 2006. 88(1): p. 84.
48. Maharaj, N., et al., Left ventricular twist in a normal African adult
population. European Heart Journal-Cardiovascular Imaging, 2012: p.
jes208.
49. Helle-Valle, T., et al., New noninvasive method for assessment of left
ventricular rotation speckle tracking echocardiography. Circulation, 2005.
112(20): p. 3149-3156.
50. Kocabay, G., et al., Normal left ventricular mechanics by two-dimensional
speckle-tracking echocardiography. Reference values in healthy adults.
Revista Española de Cardiología (English Edition), 2014. 67(8): p. 651-658.
51. Fuster, V., R. Walsh, and R. Harrington, Hurst's the Heart: Volume One.
13th edition. 2011: McGraw Hill Professional.
52. Castillo, J.G. and D.H. Adams, Mitral Valve Repair and Replacement.
Valvular Heart Disease: A Companion to Braunwald's Heart Disease, 2014:
p. 326.

REFERENCES
289
53. Gammie, J.S., et al., Influence of hospital procedural volume on care process
and mortality for patients undergoing elective surgery for mitral
regurgitation. Circulation, 2007. 115(7): p. 881-887.
54. Vanhercke, D., Personal Communication. 2012: Ghent, Belgium.
55. Collier, P., D. Phelan, and B.P. Griffin, Mitral Valve Disease: Stenosis and
Regurgitation.
56. Edwards, W., Applied anatomy of the heart. Cardiology Fundamentals and
Practice, 1987. 1: p. 47-112.
57. Gammie, J.S., et al., Trends in mitral valve surgery in the United States:
results from the Society of Thoracic Surgeons Adult Cardiac Database. The
Annals of thoracic surgery, 2009. 87(5): p. 1431-1439.
58. Levine, R.A., Dynamic mitral regurgitation—more than meets the eye. N
Engl J Med, 2004. 351(16): p. 1681-1684.
59. Levine, R.A., et al., Three-dimensional echocardiographic reconstruction of
the mitral valve, with implications for the diagnosis of mitral valve prolapse.
Circulation, 1989. 80(3): p. 589-598.
60. Noack, T., et al., New concepts for mitral valve imaging. Annals of
cardiothoracic surgery, 2013. 2(6): p. 787.
61. Carpentier, A., D.H. Adams, and F. Filsoufi, Carpentier's reconstructive
valve surgery. 2011: Elsevier Health Sciences.
62. Ranganathan, N., et al., Morphology of the human mitral valve II. The valve
leaflets. Circulation, 1970. 41(3): p. 459-467.
63. Dent, J.M., et al., Mechanism of mitral leaflet excursion. American Journal
of Physiology-Heart and Circulatory Physiology, 1995. 269(6): p. H2100-
H2108.
64. Lam, J., et al., Morphology of the human mitral valve I. Chordae tendineae:
a new classification. Circulation, 1970. 41(3): p. 449-458.
65. Edwards, W., Cardiac anatomy and examination of cardiac specimens. Moss
& Adams' Heart Disease in Infants, Children, and Adolescents, 1995. 1995:
p. 70-105.
66. Björk, V., F. Intonti, and A. Meissl, A mechanical pulse duplicator for testing
prosthetic mitral and aortic valves. Thorax, 1962. 17(3): p. 280-283.
67. Langendorff, O., Untersuchungen am überlebenden Säugethierherzen.
Pflügers Archiv European Journal of Physiology, 1895. 61(6): p. 291-332.
68. Chinchoy, E., et al., Isolated four-chamber working swine heart model. The
Annals of thoracic surgery, 2000. 70(5): p. 1607-1614.

REFERENCES
290
69. de Weger, A., et al., Direct endoscopic visual assessment of a transcatheter
aortic valve implantation and performance in the physioheart, an isolated
working heart platform. Circulation, 2010. 121(13): p. e261-e262.
70. Leopaldi, A., Multifunctional passive-heart platforms for in vitro
hemodynamic studies. 2014.
71. McMillan, I., Aortic stenosis: A post-mortem cinephotographic study of
valve action. British heart journal, 1955. 17(1): p. 56.
72. Davila, J.C., et al., A simple mechanical pulse duplicator for cinematography
of cardiac valves in action. Annals of Surgery, 1956. 143(4): p. 544-551.
73. Duran, C., A. Gunning, and T. McMillan, A simple versatile pulse
duplicator. Thorax, 1964. 19(6): p. 503-506.
74. Hashim, S.R., et al., A three-component force vector cell for in vitro
quantification of the force exerted by the papillary muscle on the left
ventricular wall. Journal of biomechanics, 1997. 30(10): p. 1071-1075.
75. Gabbay, S., et al., In vitro hydrodynamic comparison of mitral valve
prostheses at high flow rates. The Journal of thoracic and cardiovascular
surgery, 1978. 76(6): p. 771-787.
76. Gabbay, S., et al., In vitro hydrodynamic comparison of mitral valve
bioprostheses. Circulation, 1979. 60(2): p. 62-70.
77. Fisher, J., I. Reece, and D. Wheatley, In vitro evaluation of six mechanical
and six bioprosthetic valves. The Thoracic and cardiovascular surgeon, 1986.
34(03): p. 157-162.
78. Cochrane, T., et al., Validation of the orifice formula for estimating effective
heart valve opening area. Clinical Physics and Physiological Measurement,
1991. 12(1): p. 21.
79. Akutsu, T., Hydrodynamic performance of mechanical prosthetic heart
valve. 1985, University of British Columbia.
80. Bellhouse, B.J., Fluid mechanics of a model mitral valve and left ventricle.
Cardiovascular Research, 1972. 6(2): p. 199-210.
81. Bellhouse, B. and F. Bellhouse, Fluid mechanic performance of five
prosthetic mitral valves. The Mitral Valve. A Pluri-disciplinary Approach.
edited by Kalmanson D. Acton, Mass, Publishing Sciences Group Inc, 1976.
82. Scotten, L., D. Walker, and R. Brownlee, Construction and evaluation of a
hydromechanical simulation facility for the assessment of mitral valve
prostheses. Journal of medical engineering & technology, 1979. 3(1): p. 11-
18.
83. Walker, D., et al., In vitro assessment of mitral valve prostheses. The Journal
of thoracic and cardiovascular surgery, 1980. 79(5): p. 680-688.

REFERENCES
291
84. Lee, C., Fluid mechanical study of mitral valve motion, in Mechanical
Engineering Dept. 1977, University of California: Berkeley
85. Lee, C. and L. Talbot, A fluid-mechanical study of the closure of heart valves.
Journal of Fluid Mechanics, 1979. 91(01): p. 41-63.
86. Reul, H., Cardiovascular simulation models. Life support systems: the
journal of the European Society for Artificial Organs, 1984. 2(2): p. 77.
87. Knott, E., et al., In vitro comparison of aortic heart valve prostheses. Part 1:
Mechanical valves. The Journal of thoracic and cardiovascular surgery,
1988. 96(6): p. 952-961.
88. Mouret, F., et al., A new dual activation simulator of the left heart that
reproduces physiological and pathological conditions. Medical and
Biological Engineering and Computing, 2000. 38(5): p. 558-561.
89. Tanné, D., et al., Assessment of left heart and pulmonary circulation flow
dynamics by a new pulsed mock circulatory system. Experiments in Fluids,
2010. 48(5): p. 837-850.
90. Kheradvar, A., et al., An in vitro study of changing profile heights in mitral
bioprostheses and their influence on flow. ASAIO Journal, 2006. 52(1): p.
34-38.
91. Carson, D.J. The Vascular Simulations Replicator 2014; Available from:
http://www.vascularsimulations.com/.
92. Little, S., Patient-Specific Cardiovascular Models for Medical Device
Testing. 2012.
93. Baeck, K.L., P.; Verschueren, P., Material characterization of HeartPrint®
models and comparison with arterial tissue properties. White paper, 2014.
94. The Heartbeat Simulator. accessed on 2014/12/27; Available from:
http://biomedical.materialise.com/heartbeat-simulator.
95. Verdonck, P., et al., Computer-controlled in vitro model of the human left
heart. Med Biol Eng Comput, 1992. 30(6): p. 656-9.
96. Verdonck, P., Studie van de bloedstroom doorheen de mitraalklep, in
Faculty of Applied Sciences. 1993, Ghent University: Ghent.
97. Carson, D.J., et al., Cardiac Simulation Device. 2013, US20130196301 A1,
Google Patents.
98. Claessens, T., P. Segers, and P. Verdonck. A new thick-walled hydraulic
model of the left heart for the assessment of blood-wall interaction using
ultrasound. in Computers in Cardiology, 2004. 2004. IEEE.
99. Segers, P., Biomechanische Modellering van het Arterieel Systeem voor de
niet-invasieve bepaling van de Arteriële Compliantie, in Faculty of Applied
Sciences. 1997, Ghent University: Ghent

REFERENCES
292
100. ViVitro Labs Inc., The ViVitro Heart Simulator. 1992: Victoria, BC, Canada.
101. Rinaldi, J.E. and S.W. Smith, Anthropomorphic cardiac ultrasound
phantom. 1990, Google Patents.
102. Reul, H. and N. Talukder, Fluid mechanics of the natural mitral valve.
Journal of biomechanics, 1981. 14(5): p. 361-372.
103. ViVitro Labs Inc. ViVitro Labs product describtion of the pulse duplicator
2014 2014; Available from: http://vivitrolabs.com/product/pulse-duplicator/
104. Kaminsky, R., et al., In Vitro 3D High Speed Piv Measurements Behind An
Aortic Artificial Heart Valve. ASAIO Journal, 2006. 52(2): p. 4A.
105. Kaminsky, R., et al., Flow Visualization Through Two Types of Aortic
Prosthetic Heart Valves Using Stereoscopic High‐speed Particle Image
Velocimetry. Artificial organs, 2007. 31(12): p. 869-879.
106. Wiggers, C.J., The innervation of the coronary vessels. American Journal of
Physiology--Legacy Content, 1909. 24(4): p. 391-405.
107. Larsen, V., An apparatus for measuring the effect of drugs on the coronary
vessels in the isolated heart. Acta pharmacologica et toxicologica, 1948.
4(1): p. 1-18.
108. Ryser, H. and W. Wilbrandt, Die Wirkung von Recosen auf den
Coronarwiderstand des nach Langendorff perfundierten
Meerschweinchenherzens und ihre Deutung im Sinne eines
Verdrangungsantagonismus. Archives Internationales de Pharmacodynamie
et de Therapie, 1953. 96(2): p. 131-160.
109. Luduena, F., E. Miller, and W. Wilt, A new perfusion apparatus for the study
of the effects of drugs on the coronary vessels. Journal of the American
Pharmaceutical Association, 1955. 44(6): p. 363-366.
110. Schaefer, E., Do the coronary vessels possess vasomotor nerves? Arch Sci
Biol, 1904. 2: p. 251-257.
111. de Hart, J., et al., An ex vivo platform to simulate cardiac physiology: a new
dimension for therapy development and assessment. The International
journal of artificial organs, 2011. 34(6): p. 495-505.
112. Hill, A.J., et al., In vitro studies of human hearts. The Annals of thoracic
surgery, 2005. 79(1): p. 168-177.
113. Granegger, M., et al., Investigation of hemodynamics in the assisted isolated
porcine heart. The International journal of artificial organs, 2013. 36(12): p.
878-886.
114. Laske, T.G., N.D. Skadsberg, and P.A. Iaizzo, A novel ex vivo heart model
for the assessment of cardiac pacing systems. Journal of biomechanical
engineering, 2005. 127(6): p. 894-898.

REFERENCES
293
115. Shiose, A., et al., Cardioscopy-guided surgery: Intracardiac mitral and
tricuspid valve repair under direct visualization in the beating heart. The
Journal of thoracic and cardiovascular surgery, 2011. 142(1): p. 199-202.
116. Tuzun, E., et al., Assessment of aortic valve pressure overload and leaflet
functions in an ex vivo beating heart loaded with a continuous flow cardiac
assist device. European Journal of Cardio-Thoracic Surgery, 2014. 45(2): p.
377-383.
117. Schuster, A., et al., An isolated perfused pig heart model for the development,
validation and translation of novel cardiovascular magnetic resonance
techniques. J Cardiovasc Magn Reson, 2010. 12(53,429).
118. Bateman, M.G. and P.A. Iaizzo, Comparative imaging of cardiac structures
and function for the optimization of transcatheter approaches for valvular
and structural heart disease. The international journal of cardiovascular
imaging, 2011. 27(8): p. 1223-1234.
119. ViVitro Labs Inc., Product and Service Brochure (Revision 2). 2009:
Victoria, BC, Canada.
120. Annerel, S., et al., Validation of a numerical FSI simulation of an aortic
BMHV by in vitro PIV experiments. Medical engineering & physics, 2014.
36(8): p. 1014-1023.
121. Yoganathan, A.P., et al., Bileaflet, tilting disc and porcine aortic valve
substitutes: In vitro hydrodynamic characteristics. Journal of the American
College of Cardiology, 1984. 3(2s1): p. 313-320.
122. Jensen, M.Ø., A.A. Fontaine, and A.P. Yoganathan, Improved in vitro
quantification of the force exerted by the papillary muscle on the left
ventricular wall: three-dimensional force vector measurement system.
Annals of biomedical engineering, 2001. 29(5): p. 406-413.
123. Padala, M., et al., Cleft closure and undersizing annuloplasty improve mitral
repair in atrioventricular canal defects. The Journal of thoracic and
cardiovascular surgery, 2008. 136(5): p. 1243-1249.
124. ViVitro Labs Inc., Model Left Heart Operating Manual, Model SD 2001-1.
2001: Victoria, BC, Canada.
125. Yoganathan, A.P. Georgia Tech Left Heart Simulator 2013; Available from:
http://groups.bme.gatech.edu/groups/cfmg/group/Infrastructure.html.
126. Reul, H., et al., Comparative in vitro evaluation of porcine and pericardial
bioprostheses. Zeitschrift fur Kardiologie, 1985. 75: p. 223-231.
127. Reul, H., et al., In vitro comparison of bileaflet aortic heart valve prostheses.
St. Jude Medical, CarboMedics, modified Edwards-Duromedics, and Sorin-
Bicarbon valves. The Journal of thoracic and cardiovascular surgery, 1993.
106(3): p. 412-420.

REFERENCES
294
128. Hasenkam, J., M. Giersiepen, and H. Reul, Three-dimensional visualization
of velocity fields downstream of six mechanical aortic valves in a pulsatile
flow model. Journal of biomechanics, 1988. 21(8): p. 647-661.
129. Giersiepen, M., et al., Velocity and shear stress distribution downstream of
mechanical heart valves in pulsatile flow. The International journal of
artificial organs, 1989. 12(4): p. 261-269.
130. Akutsu, T. and V. Modi, Unsteady fluid dynamics of several mechanical
prosthetic heart valves using a two component laser Doppler anemometer
system. Artificial organs, 1997. 21(10): p. 1110-1120.
131. Akutsu, T. and D. Higuchi, Effect of mechanical prosthetic heart valve
orientation on the flow field inside the simulated ventricle: comparison
between St. Jude Medical valve and Medtronic-Hall valve. Journal of
Artificial Organs, 1999. 2(1): p. 39-45.
132. Akutsu, T. and D. Higuchi, Flow analysis of the bileaflet mechanical
prosthetic heart valves using laser Doppler anemometer: effect of the valve
designs and installed orientations to the flow inside the simulated left
ventricle. Journal of Artificial Organs, 2001. 4(2): p. 113-125.
133. Akutsu, T. and T. Masuda, Three-dimensional flow analysis of a mechanical
bileaflet mitral prosthesis. Journal of Artificial Organs, 2003. 6(2): p. 112-
123.
134. Akutsu, T. and T. Fukuda, Time-resolved particle image velocimetry and
laser Doppler anemometry study of the turbulent flow field of bileaflet
mechanical mitral prostheses. Journal of Artificial Organs, 2005. 8(3): p.
171-183.
135. Akutsu, T., T. Fulkuda, and J. Saito. Time resolved PIV ventricular flow field
study of differently designed contemporary bi-leaflet mitral valves. in
International Journal of Artificial Organs. 2007.
136. Akutsu, T., et al., Dynamic particle image velocimetry study of the aortic
flow field of contemporary mechanical bileaflet prostheses. Journal of
Artificial Organs, 2008. 11(2): p. 75-90.
137. Akutsu, T., et al., Correlation between ventricular flow field and valve
closing sound of mechanical mitral prostheses. Journal of Artificial Organs,
2008. 11(2): p. 67-74.
138. Akutsu, T. and T. Suzuki. In vitro dynamic PIV flow field analyses of the
mechanical bi-leaflet valves: influence of pulse waveform and working fluid
viscosity. in International Journal of Artificial Organs. 2008.
139. Akutsu, T., et al. Influence of the several mechanical bi-leaflet prosthetic
valve designes of the three dimensional flow field inside the simulated aorta.
in International Journal of Artificial Organs. 2009.

REFERENCES
295
140. Akutsu, T., H. Takahashi, and Y. Kamoshita. Influence of the mechanical bi-
leaflet prosthetic valve designs on the flow field and acculmulated stress
inside the simulated aorta. in International Journal of Artificaial Organs.
2011.
141. Bishop, W.F., Hydrodynamic performance of mechanical and biological
prosthetic heart valves. 1990.
142. Modi, V., Unsteady fluid dynamics of three contemporary heart valves using
a two component LDA system. Artif Organs, 1991. 14: p. 103-107.
143. Barbara, V., et al., In vitro evaluation of prosthetic heart valves: towards
comparable testing. Journal of medical engineering & technology, 1992.
16(1): p. 10-14.
144. Conti, J.C. and E.R. Strope, Evaluating the in situ loading and accelerated
durability of barbs located on bifurcated aorto-iliac stent-grafts. Biomedical
sciences instrumentation, 1999. 36: p. 93-98.
145. Inc., D.L. The Dynatek MP4 Robotic Cardiovascular Pulse Duplicator
20/9/2014; Available from: www.dynatekdalta.com.
146. Black, M., et al., In vitro heart valve testing: steady versus pulsatile flow.
The Journal of heart valve disease, 1994. 3(2): p. 212-215.
147. Segers, P., Biomechanische modellering van het arterieel systeem voor de
niet-invasieve bepaling van de arteriële compliantie. Gent: Universiteit
Gent, 1997.
148. Verdonck, P., G. Van Nooten, and Y. Van Belleghem, Pulse duplicator
hydrodynamics of four different bileaflet valves in the mitral position.
Vascular, 1997. 5(6): p. 593-603.
149. Verdonck, P.R., et al., Mock Loop Testing of On‐X Prosthetic Mitral Valve
with Doppler Echocardiography. Artificial organs, 2002. 26(10): p. 872-878.
150. Dumont, K., et al., Omnicarbon 21 mm aortic valve prosthesis: in vitro
hydrodynamic and echo-Doppler study. The International journal of artificial
organs, 2002. 25(8): p. 783-790.
151. Segers, P., et al., Role and relevancy of a cardiovascular simulator.
Cardiovascular Engineering, 1998. 3: p. 48-56.
152. Vandenberghe, S., et al., In vitro evaluation of the PUCA II intra-arterial
LVAD. The International journal of artificial organs, 2003. 26(8): p. 743-752.
153. Vandenberghe, S., et al., In vitro assessment of the unloading and perfusion
capacities of the PUCA II and the IABP. Perfusion, 2004. 19(1): p. 25-32.
154. Narine, K.K., et al., Hydrodynamic evaluation of kangaroo aortic valve
matrices for tissue valve engineering. Artificial organs, 2006. 30(6): p. 432-
439.

REFERENCES
296
155. Segers, P. and P. Verdonck, Role of tapering in aortic wave reflection:
hydraulic and mathematical model study. Journal of biomechanics, 2000.
33(3): p. 299-306.
156. Swillens, A., et al., Effect of an abdominal aortic aneurysm on wave
reflection in the aorta. Biomedical Engineering, IEEE Transactions on,
2008. 55(5): p. 1602-1611.
157. Matthys, K.S., et al., Pulse wave propagation in a model human arterial
network: assessment of 1-D numerical simulations against in vitro
measurements. Journal of biomechanics, 2007. 40(15): p. 3476-3486.
158. Claessens, T.E., Model-Based Quantification of Systolic and Diastolic Left
Ventricular Mechanics, in Faculty of Applied Sciences. 2006, Ghent
University: Ghent
159. Evin, M., et al., Localized Transvalvular Pressure Gradients in Mitral
Bileaflet Mechanical Heart Valves and Impact on Gradient Overestimation
by Doppler. Journal of the American Society of Echocardiography, 2013.
26(7): p. 791-800.
160. Pierrakos, O., P.P. Vlachos, and D.P. Telionis, Time-resolved DPIV analysis
of vortex dynamics in a left ventricular model through bileaflet mechanical
and porcine heart valve prostheses. Journal of biomechanical engineering,
2004. 126(6): p. 714-726.
161. Pierrakos, O. and P.P. Vlachos, The effect of vortex formation on left
ventricular filling and mitral valve efficiency. Journal of biomechanical
engineering, 2006. 128(4): p. 527-539.
162. The Virginia Tech Left Heart Model. 2009; Available from:
http://www.research.vt.edu/resmag/2009summer/flowpix03.html.
163. Falahatpisheh, A. and A. Kheradvar, High-speed particle image velocimetry
to assess cardiac fluid dynamics in vitro: From performance to validation.
European Journal of Mechanics-B/Fluids, 2012. 35: p. 2-8.
164. Kheradvar, A., et al., Echocardiographic particle image velocimetry: a novel
technique for quantification of left ventricular blood vorticity pattern.
Journal of the American Society of Echocardiography, 2010. 23(1): p. 86-
94.
165. Kheradvar, A. and A. Falahatpisheh, The effects of dynamic saddle annulus
and leaflet length on transmitral flow pattern and leaflet stress of a bileaflet
bioprosthetic mitral valve. Journal of Heart Valve Disease, 2012. 21(2): p.
225.
166. Kheradvar, A. and M. Gharib, On mitral valve dynamics and its connection
to early diastolic flow. Annals of Biomedical Engineering, 2009. 37(1): p. 1-
13.

REFERENCES
297
167. Rasponi, M., et al., A reliable method for prototyping flexible physiologic-
like behaving left ventricles for studying mitral valve surgical corrections.
Journal of Mechanics in Medicine and Biology, 2006. 6(1): p. 101-107.
168. Materialise NV., HeartPrint® for cardiovascular anatomical models. 2014
2014/12/27]; Available from: http://biomedical.materialise.com/HeartPrint-
FAQ.
169. Jimenez, J.H., et al., Mitral valve function and chordal force distribution
using a flexible annulus model: an in vitro study. Annals of biomedical
engineering, 2005. 33(5): p. 557-566.
170. Jimenez, J.H., et al., Effects of a saddle shaped annulus on mitral valve
function and chordal force distribution: an in vitro study. Annals of
biomedical engineering, 2003. 31(10): p. 1171-1181.
171. Verdonck, P., Personal Communication. 2006: Ghent, Belgium.
172. Van Nooten, G. and F. De Somer, Personal Communication. 2011: Ghent,
Belgium.
173. Mester, D., Personal Communication. 2011: Victoria CA.
174. Council, D. Double diamond design process. Accessed on June 14, 2016;
Available from:
http://www.designcouncil.org.uk/sites/default/files/asset/document/ElevenL
essons_Design_Council%20(2).pdf.
175. Howard, T.J., S.J. Culley, and E. Dekoninck, Describing the creative design
process by the integration of engineering design and cognitive psychology
literature. Design studies, 2008. 29(2): p. 160-180.
176. Council, D. Mission British Design Council. accessed on June 17, 2016;
Available from: http://www.city.ac.uk/news/2013/may/design-council-
funds-city-university-london-scholarship-to-develop-new-products-and-
services-for-uks-ageing-population.
177. Council, D. Figure of the double diamond design process. Accessed on June
14, 2016; Available from:
https://innovationenglish.sites.ku.dk/files/2013/12/double-diamond.-
stor1.png
178. Han, H.-C., An echocardiogram-based 16-segment model for predicting left
ventricular ejection fraction improvement. Journal of theoretical biology,
2004. 228(1): p. 7-15.
179. Van Der Smissen, B., et al., Modelling the left ventricle using rapid
prototyping techniques. IRBM, 2013. 34(3): p. 226-234.
180. Van Der Smissen, B., et al., SolidWorks heeft ook hart voor u!, in design
solutions update. 2008, Design Solutions B.V. p. 2-3.

REFERENCES
298
181. Massie, B.M. and N.B. Shah, Evolving trends in the epidemiologic factors of
heart failure: rationale for preventive strategies and comprehensive disease
management. Am Heart J, 1997. 133(6): p. 703-12.
182. Verdonck, P.R., G.J. Van Nooten, and Y. Van Belleghem, Pulse duplicator
hydrodynamics of four different bileaflet valves in the mitral position.
Cardiovasc Surg, 1997. 5(6): p. 593-603.
183. Dumont, K., et al., Omnicarbon 21 mm aortic valve prosthesis: in vitro
hydrodynamic and echo-Doppler study. Int J Artif Organs, 2002. 25(8): p.
783-90.
184. Scotten, L.N. and D.K. Walker, New laboratory technique measures
projected dynamic area of prosthetic heart valves. J Heart Valve Dis, 2004.
13(1): p. 120-32; discussion 132-3.
185. Kheradvar, A. and M. Gharib, On mitral valve dynamics and its connection
to early diastolic flow. Ann Biomed Eng, 2009. 37(1): p. 1-13.
186. De Mey, S., et al., Assesment of LV diastolic filling using color M-mode
Doppler echocardiography: validation in new hydoraulic model. Biomech
Model Mechanobiol, 2004. 2(3): p. 127-38.
187. Han, H.C., An echocardiogram-based 16-segment model for predicting left
ventricular ejection fraction improvement. J Theor Biol, 2004. 228(1): p. 7-
15.
188. Van Der Smissen, B., et al., Design of an artificial left ventricular muscle:
an innovative way to actuate blood pumps? Artificial organs, 2009. 33(6): p.
464-468.
189. Van Der Smissen, B., et al. Innovative Design of a Venous Valve Intended
for PIV Measurements. in ASME 2011 Summer Bioengineering Conference.
2011. American Society of Mechanical Engineers.
190. Murphy, G., S. White, and M. Nicholson, Vascular access for haemodialysis.
British journal of surgery, 2000. 87(10): p. 1300-1315.
191. Paulson, W.D., S.J. Ram, and G.B. Zibari. Vascular access: Anatomy,
examination, management. in Seminars in nephrology. 2002. [New York,
NY]: Grune & Stratton,[c1981]-.
192. ARCH – Developing patient-specific computer models for improvement of
vascular access creation and care in patients on hemodialysis therapy. A
specific targeted research project funded within the EU 7th Framework
Programme (Project n. 224390).
193. Refractive Index of Polystyrene, P. accessed on June 18, 2016; Available
from: http://www.filmetrics.com/refractive-index-database/Polystyrene/PS.

REFERENCES
299
194. Hossler, F.E. and R.F. West, Venous valve anatomy and morphometry:
studies on the duckling using vascular corrosion casting. American journal
of anatomy, 1988. 181(4): p. 425-432.
195. De Meulemeester, J.H., I, Ontwikkeling van een productietechniek voor
dunwandige patiëntspecifieke modellen, in Master in de industriële
wetenschappen elektromechanica. 2010, University College Ghent.
196. ViVitro Labs Inc., Personal communication. 2011.
197. Buckberg, G., et al., Ventricular torsion and untwisting: further insights into
mechanics and timing interdependence: a viewpoint. Echocardiography,
2011. 28(7): p. 782-804.
198. Popovic, Z.B., et al., Relationship among diastolic intraventricular pressure
gradients, relaxation, and preload: impact of age and fitness. American
Journal of Physiology-Heart and Circulatory Physiology, 2006. 290(4): p.
H1454-H1459.
199. Rovner, A., et al., Improvement in diastolic intraventricular pressure
gradients in patients with HOCM after ethanol septal reduction. American
Journal of Physiology-Heart and Circulatory Physiology, 2003. 285(6): p.
H2492-H2499.
200. Yotti, R., et al., A noninvasive method for assessing impaired diastolic
suction in patients with dilated cardiomyopathy. Circulation, 2005. 112(19):
p. 2921-2929.
201. De Mey, S., et al., Regional Differences in Relaxation Time (τ): Its
Relationship to Intraventricular Pressure Gradients in a Canine and
Hydraulic Model. Cardiovascular Engineering, 2002. 2(4): p. 149-159.
202. Greenberg, N.L., et al., Estimation of diastolic intraventricular pressure
gradients by Doppler M-mode echocardiography. American Journal of
Physiology-Heart and Circulatory Physiology, 2001. 280(6): p. 2507-2515.
203. Falsetti, H.L., et al., Regional Pressure Differences in the Left-Ventricle.
Catheterization and Cardiovascular Diagnosis, 1980. 6(2): p. 123-134.
204. Park, S.-J., et al., Left ventricular torsion by two-dimensional speckle
tracking echocardiography in patients with diastolic dysfunction and normal
ejection fraction. Journal of the American Society of Echocardiography,
2008. 21(10): p. 1129-1137.
205. Verdonck, P., et al., Left-ventricular pressure gradients: a computer-model
simulation. Medical & Biological Engineering & Computing, 1999. 37(4):
p. 511-516.
206. Nickel, V.L., J. Perry, and A.L. Garrett, Development of useful function in
the severely paralyzed hand. J Bone Joint Surg Am, 1963. 45(5): p. 933-952.

REFERENCES
300
207. Roche, E.T., et al., A bioinspired soft actuated material. Advanced Materials,
2014. 26(8): p. 1200-1206.
208. Roche, E.T., A Multi-faceted Approach to Cardiac Repair. 2015.
209. Torrent-Guasp, F. Ventricular myocardial band rubber model. Accessed on
March 22, 2016; Available from: http://www.torrent-
guasp.com/PAGES/Modelo-Elastico.htm.

LIST OF FIGURES
301
List of figures
Figure 1: Composition of the heart with Right (RA) and Left Atrium (LA), the Right (RV)
and Left Ventricle (LV), the Tricuspid Valve (TV), the Pulmonary Valve (PV), the Mitral
Valve (MV) and the Aortic Valve (AV). Adapted from [5]. .............................................. 51
Figure 2: The blood flow through the four heart chambers. Adapted from [6]. ............... 52
Figure 3: Ventricular pressure-volume relation during a cardiac cycle with ESPVR: end-
systolic pressure-volume relation and EDPVR: end-diastolic pressure-volume relation. . 53
Figure 4: Changes in pressure, flow, and volume in the left heart during a cardiac cycle.
The points A, B, C and D indicate the start of the following stages: A, isovolumic
contraction; B, ejection; C: isovolumic relaxation; and D, filling. Adapted from [7]. ...... 54
Figure 5: Top panel: Pressure measurement at the level of the LV apex and in the LA .... 55
Figure 6: Left: Simultaneous intraventricular pressure measurement 2 and 5 cm away from
the apex towards the base, respectively. Right: simultaneously measured transmitral
pressures, in the middle of the atrium and the center of the ventricle, respectively. Adapted
from [11]. .................................................................................................................... 57
Figure 7: The cardiac wall comprises 1) the endocardium, 2) the myocardium, 3) the
epicardium, and 4) the pericardium. Adapted from [25, 26]. .......................................... 60
Figure 8: Macrostructure of the cardiac wall. Adapted from [27]. ................................. 60
Figure 9: Microscopic structure of cardiomyocytes: mononuclear, striated muscle cells.
Adapted from [26]. ....................................................................................................... 63
Figure 10: Myofibrils of the cardiomyocyte. Adapted from [29]. .................................... 63
Figure 11: Myosin filaments are composed of myosin proteins; each protein has two heads
that are connected via the neck to the tail portion. Actin filaments comprise three different
types of protein: actin, tropomyosin, and troponin. Adapted from [31]. .......................... 64
Figure 12: The organization of actin and myosin filaments is represented by formation of
cross-bridges in a myocyte. Adapted from [26, 32]. ....................................................... 66
Figure 13: Four concepts of myocardial fiber orientation are given: (1) by Robb et al. [34]
with a superficial (1a) and deep bulbospiral (1b), by Rushmer et al. [35] with spiral muscles
including opposite fiber orientation, (3) by to Streeter et al. [36] with helical fibers which
forming doughnut-like surfaces and (4) by Torrent-Guasp et al. [37-40] including a
continuous ventricular myocardial band, with (4a) a schematic version of the double-helix,
(4c) the unwrapped version of (4b). Ao, Aorta and Pa, Pulmonary artery. Adapted from
[33]. ............................................................................................................................ 68
Figure 14: A step-by-step procedure to unscroll a heart by dissection according to the
Torrent-Guasp’s myocardial band model. Starting from the intact heart (1), the Right
Segment (RS) is first unwrapped (2), then the Left Segment (LS) (3) and subsequently, the
Ascending Segment (AS). At the end, by unfolding the Descending Segment (DS) (4), the
complete helical structure is outspreaded and forms a continuous myocardial band. Note

LIST OF FIGURES
302
the twisting nature of the oblique fold at the center of the junction of the basal as apical
loops. Adapted from [33]. ............................................................................................. 69
Figure 15: Global wall deformation patterns during systole and diastole. Adapted from
[44-46]. ....................................................................................................................... 70
Figure 16: The LV torsion during one heart beat in a normal healthy subject is illustrated.
LVtorsion (orange curve) is defined as rotationapex (yellow curve) minus rotationbase (black
curve). During the isovolumic contraction phase (1), the apex generates a small clockwise
twist and the base a small counterclockwise twist. During ejection phase (2), the twisting
directions alter and the LV torsion values are significantly higher. During the isovolumic
relaxation phase (3) and the early diastolic filling phase (4), the twisting direction is
changed again and torsional recoil takes place. Adapted from [43]. .............................. 71
Figure 17: This diagram shows the fibrous cardiac skeleton or valve plane with the four
annuli of the cardiac valves. The aortic annulus at the center is the keystone and its fibrous
extensions support the other three annuli. Adapted from [51]. ....................................... 73
Figure 18: As shown in the drawing (left) and the real heart (right), the mitral valve (MV)
apparatus is composed of five elementary components, the mitral annulus, mitral leaflets,
chordae tendineae, papillary muscles, and the left ventricle (LV). During systole, the mitral
apparatus brings the two leaflets together and establishes the coaptation zone (CZ). Adapted
from [51, 61]. ............................................................................................................... 75
Figure 19: Both mitral valve leaflets have a clear zone (CZ) and a rough zone (RZ) and are
separated by a closing edge (dotted line). Note the fanlike array of the commissural chordae
tendineae (*). Adapted from [51]. ................................................................................. 75
Figure 20: Schematic diagram of the section across the dotted lines clarifies the association
between the annulus, the closing edge (CE), the free edge and the left ventricle (LV) and
atrium (LA). Also the clear zone (CZ) and the rough zone (RZ) are shown. Modified from
[51]. ............................................................................................................................ 76
Figure 21: Fiber orientation of the mitral valve. Adapted from [60]. .............................. 76
Figure 22: This picture shows an isolated and unfolded mitral valve including the
anterolateral (ALPM) and posteromedial papillary muscles (PMPM) with the chordae
tendineae and leaflets. Note the commissures (C) of the posterior (P) and anterior leaflets
(A). Adapted from [51]. ................................................................................................ 77
Figure 23: Anatomical section shows the valve plane with the cardiac valves in systole and
a detailed composition of mitral valve. The anterior (A) and posterior leaflets (P) are both
subdivided into three segments (1 -3) and separated from one another by the anterior (AC)
and the posterior commissures (PC). Adapted from [51, 61]. ......................................... 78
Figure 24: Pulse duplicator using a postmortem human heart actuated by a piston pump.
(A) The reservoir, (B) the peripheral resistance, (C) aortic viewing chamber-outflow, (D)
atrial viewing chamber-inflow, (E) postmortem heart with left ventricle connected to the
pump outflow tube and (F) piston pump. Adapted from [72]. ......................................... 86
Figure 25: Pulse duplicator system of the Department of Thoracic Surgery at Sweden
(1962). Left panel: The pulse duplicator with (A) left atrium, (B) mitral valve (C) left
ventricle, (D) rigid container, (E) elastic container, (F) aortic valve, (G) aorta, and (H)

LIST OF FIGURES
303
peripheral resistance. Right panel: The pulse duplicator at the time of end systole (top) and
end diastole (bottom). Adapted from [66]. ..................................................................... 88
Figure 26: Cardiovascular simulator of the Engineering Science Group at Oxford (1972),
including pulmonary veins (A), the left atrium (B), the mitral valve (C), the left ventricle
model (D), the external pressure source (E), the aortic valve (F) and the aorta (G). Adapted
from [80]. .................................................................................................................... 89
Figure 27: Schematic diagram of the left heart model and circulatory network of the
Mechanical Engineering Group at Berkeley, California. Adapted from [85]. .................. 90
Figure 28: Flow patterns inside ventricle model to explore the nature of pulsatile flow (A)
during diastolic filling and (B) just after mitral valve closure. The experiment was performed
at a heart rate of 20 beats/min and a stroke volume 80 ml. Adapted from [85]. ............... 91
Figure 29. Pulse duplicator system of the Cardiothoracic Surgery Unit, New York [75]. 92
Figure 30: The Superpump system SPS 3891 of ViVitro Lab Inc. This pump was
commercially available from the 1984 (top), for a period of almost 30 years (middle: latest
version of the analog pump), until the electronic pump (bottom) came in place. .............. 93
Figure 31: The ViVitro Left Heart Simulator: version ‘Model SD 2001-1’ of 2009 (left panel)
and version ‘AR Series’ of 2014 (right panel). Adapted from [103, 119]. ........................ 94
Figure 32: The Heart Simulator according to ViVitro Labs Inc., Victoria (1992) [100]. The
model is composed of a left atrial reservoir (1), mitral valve (2), left ventricle (3), aortic
valve (4), the aorta (5), peripheral compliance (6), resistant (7), ventricle membrane model
(8), wave form generator (9) and super pump system (10). Pressure sensors can be placed
at mitral (11), aortic (12), left atrial, left ventricular, and aortic position. Electromagnetic
flow sensors are positioned upstream the mitral (13) and aortic (14) valves. .................. 95
Figure 33: The ViVitro electronic Superpump AR Series can be provided with a pump head
including a ventricle membrane and two heart valves to simulate physiological flows. .... 95
Figure 34: Left panel shows the aortic valve test apparatus developed by Yoganathan in
1984 [121]. Right panel illustrates the left heart model build by Hashim and colleagues in
1997 [74], also called the “Georgia Tech Left Heart Simulator” [123]. ......................... 96
Figure 35: Left, the original Georgia Tech Left Heart Simulator (2007) including a rigid
left ventricle which is driven by a compressible bladder type pump. Right, the simulator
revised by Rausch and colleagues (2009) including a flexible ventricle model which is driven
by a ViVitro linear piston pump [5]. .............................................................................. 97
Figure 36: The latest version of the Georgia Tech Left Heart Simulator (2013). Adapted
from [125]. .................................................................................................................. 98
Figure 37: Schematic overview is shown of the cardiovascular simulator of Reul and
colleagues (A) and of Knott and colleagues (B). Panel (C) shows a photograph of Knott’s
model. Adapted from [86, 87]. .................................................................................... 100
Figure 38: The cardiovascular simulator according to Akutsu (1985) with a conically
shaped transparent ventricle [79]. .............................................................................. 101
Figure 39: The Dynatek MP1 Pulse Duplicator (1990). The simulated circulatory loop 12
includes the following successively components: a reservoir 22, a variable compliance
chamber (A), mitral valve port 18 including the mechanical prosthetic mitral valve 14, a

LIST OF FIGURES
304
flexible left ventricular sac 10, aortic valve port 20 including the mechanical prosthetic
aortic valve 16, flow meter 74, variable compliance chamber (A) and a variable resistance
manifold (B). Adapted from [101]. .............................................................................. 103
Figure 40: The Dynatek MP3 Pulse Duplicator: the circulatory system is given (left)
together with a close-up of the left heart model (right). The ventricle model is not shown on
the pictures. Adapted from [144]................................................................................. 104
Figure 41: The Dynatek MP4 Robotic Cardiovascular Pulse Duplicator [145]. ........... 104
Figure 42: Schematic drawing of the Sheffield pulse duplicator (1991) consisting of the
following components [78]: fluid container (R), electromagnetic flow meter (EMF) and flow
straighteners at both mitral and aortic valve sites (S), left atrium (At) and a mitral valve
plane (Mv), mitral chamber (M), left ventricle (V), mitral (MV) and aortic valve (AV), aorta
(A), a model of the systemic circulation (SA). Systemic arterial compliance is realized by a
volume of trapped air and the peripheral resistance is controlled by a flow control valve
(FCV). ....................................................................................................................... 105
Figure 43: Photograph of the pulsatile flow simulator of Sheffield (1991) [78]. ............ 105
Figure 44: The cardiovascular left heart simulator of Verdonck and colleagues. The left
panel shows a photograph and the top panel shows a technical drawing of the original
pneumatically driven model (1992) and the right panel illustrates the revised hydraulically
actuated model (2006). The system is equipped with (1) reservoir, (2) tube, (3) two
pulmonary veins, (4) left atrium, (5) mitral valve, (6) left ventricle, (7) aortic valve, (8)
aorta, (9) resistance, (10) volume measurement reservoirs and (11) ultrasound probes.
Adapted from [95] and [154]. ..................................................................................... 107
Figure 45: The extended version by Segers and colleagues (1997) comprises the left heart
model of Verdonck and colleagues (at the outer left side) which is connected to an extensive
model of the arteries (middle and right panel). The left heart model comprises 1) lung
reservoir, 2) pulmonary veins, 3) left atrium, 4) left ventricle and a partial aorta. The
arterial tree model includes 5) the larger part of the aorta, 6) aorto-iliac bifurcation, 7)
peripheral model, 8) veins, 9) venous return conduit, 10) electromagnetic flow meter, 11)
venous overflow, 12) buffering reservoir and 13) pump. Adapted from [99, 155]. ......... 108
Figure 46: Overview of the experimental setup of Claessens and colleagues: (1) Left
ventricular phantom (close up right), (2) Doppler transducer, (3) mitral valve, (4) pressure
transducer, (5) proportional valve, (6) valve, (7) PMMA chamber, (8) preload reservoir and
(9) device to measure ventricular volume. Adapted from [98]. ..................................... 109
Figure 47:The Dual Activation Simulator (DAS) setup (left panel) and the left heart model
(right panel) of Mouret and colleagues (2000) [88]. .................................................... 110
Figure 48: Workflow to obtain an anatomical-shaped left atrial and a left ventricular model:
first, medical images are segmented (A), then a virtual solid model is created (B), next an
aluminum core is milled (C) and finally a silicone model is produced (D). Adapted from
[89]. .......................................................................................................................... 110
Figure 49: Two versions of the cardiovascular simulator of Marseille are shown. Left panel
illustrates the PIV compatible version (2010) and right panel demonstrates the ultrasound
compatible version (2013). The following components are indicated: echocardiographic
probe (EP), left ventricle (LV), mitral valve (MI) and left atrium (LA). Adapted from [89]
(left) and [159] (right). ............................................................................................... 111

LIST OF FIGURES
305
Figure 50: The Virginia Tech heart simulator (2004), a schematic setup overview (left
panel) [160] and a photo (right panel) of the left heart model are shown [162]. ........... 112
Figure 51: The Caltech's left heart pulsed flow simulator system (2006): A) Composition of
the in-vitro setup, B) left ventricular model suspended in a transparent box full of water, C)
close up of the ventricular model, the aortic and mitral valves and the inflow and outflow
tract. Intraventricular flow patterns which are visualized by fluorescent microparticles
which are illuminated by a laser sheet. D) Intraventricular streamlines of a transmitral jet
which are obtained by PIV. Figures A, B and C are adapted from [163] and D from [166].
.................................................................................................................................. 114
Figure 52. Design of a bi-leaflet mitral bioprosthesis (top panel) composed of a saddle
shaped annulus made of Nitinol and two leaflets made of pericardial tissue (bottom panel).
Adapted from [165]. ................................................................................................... 114
Figure 53: The left ventricular model of Rasponi and colleagues (2006). This figure
illustrates the fair agreement between numerical model (left panel) and the ventricle
prototype (right panel) at the end diastolic phase. A prominent longitudinal deformation is
realized using reinforcement of the silicone wall by circumferential bands. Adapted from
[167]. ........................................................................................................................ 115
Figure 54: The Vascular Simulations Replicator developed by Carson and colleagues
(2013) with (A) left atrium assembly, (B) brachiocephalic artery, (C) right common carotid
artery, (D) subclavian artery, (E) aortic arch, (F) aorta and (G) left ventricle assembly.
Adapted from [91, 97]. ............................................................................................... 116
Figure 55: The left panel illustrates a transparent rigid anatomically realistic and accurate
representation of a human heart. The right panel illustrates a printed calcified aortic valve.
Adapted from [168]. ................................................................................................... 118
Figure 56: The left panel illustrates a functional multi-material 3D printed calcified aortic
valve which was built in the Heart Beat Simulator. The right panel shows the MRI
compatible set up including the software and actuator, the MRI-compatible dive shaft and
the MRI-compatible flow loop. Adapted from [92]. ...................................................... 118
Figure 57: The Double Diamond engineering design process. The red dots represent the
following critical points: ‘Problem’, ‘Problem Definition’ and ‘Solution’. Adapted from
[177]. ........................................................................................................................ 137
Figure 58: Global design strategy of this dissertation following the Double Diamond design
logic........................................................................................................................... 139
Figure 59: Hydraulic/Pneumatic Models of the general design approach as basis for the
actuation mechanism of a LV model. ........................................................................... 140
Figure 60: Electric and Thermal Models of the general design approach as basis for the
actuation mechanism of a LV model. ........................................................................... 141
Figure 61: Trade-off table shows the comparison and evolution in function of the design
criteria. It starts from the Honeycomb model and designates the Frame model as most
favorable model (which led to the LV1 model of Chapter 5). ........................................ 143
Figure 62: The Honeycomb model. ............................................................................. 144
Figure 63: The Inner Tire model. ................................................................................ 145

LIST OF FIGURES
306
Figure 64: The Sixteen Segment model. ....................................................................... 146
Figure 65: The PorQpine model. ................................................................................ 147
Figure 66: The Marionette model. ............................................................................... 149
Figure 67: The Frame model (LV1 of Chapter 5). ........................................................ 151
Figure 68: Render of the thick-walled left ventricular model LV1 [180]. ...................... 159
Figure 69: Our model consists of two main parts: (a) a valve plane and (b) a thick wall.
.................................................................................................................................. 161
Figure 70: Illustrative drawing of a 16-segment left ventricle model representing the 16
segments, which is often used in echocardiography. The model consists of three slices: (1)
the basal and (2) the mid-ventricular slices which are uniformly divided into six segments
and (3) the apical slice which is split into four equal segments. Reproduced from Han, 2004
[15]. .......................................................................................................................... 162
Figure 71: The ventricular part consists of (a) a thin membrane including (f) a sealing ring,
(b) flexible bars, (c) a supporting frame, (d) an O-ring, (e) an external shell, (g) eye pins,
(h) supporting points, (i) modular discs and (j) connection to the piston pump. ............. 163
Figure 72: The valve plane contains (e) a valve plane, (a) two gates and positions, (d) two
mechanical valves. Leakage between valves and valve plane is prevented by using (c) O-
rings which are pressed by (b) a compression nut. ....................................................... 165
Figure 73: The eye pins are designed with (a) an eye to connect the flexible bars, (d) a
perforated flange to assure embedding in a tight connection with the flexible thin membrane,
(e) a centering pin to provide (c) a constant membrane thickness of 3mm and (b) guiding
planes to align them perpendicular to the membrane. .................................................. 166
Figure 74: The modular discs are designed with (d) a hole and (a) a cut-away in which a
transverse spill (Figure 76) fits to allow easy connection using different types of flexible
bars, (c) a cut-away to facilitate tightening and loosening of the flexible bars and (b) an
adjusting ring to fit them together (e). ......................................................................... 166
Figure 75: The practical realization of (a) our model, (b) the valve plane, (c) an assembly
of the supporting frame and membrane without the flexible bars, (d) the external shell, (e)
the supporting frame and (f) the membrane containing the embedded eye pins.............. 167
Figure 76: The practical realization of (b) the flexible bars (a) connecting the membrane
and the supporting frame by the use of the eye pins and (c) a modular disc................... 169
Figure 77: The practical realization of (a) the valve plane. It contains (d) the valve plane,
(a and e) two gates and positions, (b and g) two mechanical valves. Leakage between valves
and valve plane is prevented using (f) O-rings which are pressed by (c and e) a compression
nut. ............................................................................................................................ 171
Figure 78: Once (a) our model was built, we activated it using (f) a piston pump and
connected it to a lumped hydraulic windkessel model of the vascular system, including (b)
compliance, (c) resistance, and (d) preload. After that, ventricular pressure (pventr) and
aortic flow (Qaorta) were measured. In order to create a closed circuit, (e) an overflow and
a circulation pump were added. .................................................................................. 172

LIST OF FIGURES
307
Figure 79: Compared with physiological data (dashed line), the experimental results (solid
line) show that the model is able to generate realistic data in terms of end-systolic pressure
(120 mmHg). Due to the too high afterload resistance, the aortic flow in our model (solid
line) was low compared to (human) physiological data (dashed line) with a mean aortic
flow of 1.6 l/min. ........................................................................................................ 173
Figure 80: Wall deformation patterns of our model were fairly nicely demonstrated in terms
of circumferential and longitudinal deformation: end-systolic (white line) and end-diastolic
wall-deformation (white dotted line)............................................................................ 173
Figure 81: The contraction principles of the biological and the new artificial LV (left
ventricle) muscle are illustrated. The contraction (systole) and relaxation (diastole) of a
biological muscle take place along the direction of the cardiac muscle fibers, while the
contraction (inflation) and relaxation (deflation) in a single contractile chamber of this new
artificial LV muscle (a) take place perpendicular to its long axis (Lm: shortening of a
biological muscle and Lsingle cell: shortening of a single contractile chamber). An actual three
dimensional (3D) artificial LV muscle can be created by folding the 2D rectangular
artificial LV muscle (b) to a cylindrical artificial LV muscle (c). When pressurized air is
applied, the muscle cells contract perpendicularly to their longitudinal axis and the
rectangular contour transforms into a parallelogram contour (b) with an angle βtorsion, a
decrease in length (∆Lcircum) and in height (∆Llong ). Analogously, if both ends of the artificial
muscle are welded together, the 3D cylindrical artificial LV muscle which is initially
inactivated, will display torsion (with an angle equal to βtorsion) as well as radial,
circumferential, and longitudinal deformation when activated (c). ............................... 177
Figure 82 Panel I: Circumferential and radial deformation is obtained by directing the
contractile cells parallel to the LV long axis (axis of symmetry). A physical cylindrical 3D
model demonstrates circumferential and radial deformation, in top-view at diastole (blue)
and systole (red). ........................................................................................................ 179
Figure 83: Pump performance. A slightly modified (see text) artificial LV muscle, namely
LV2, was built to test the performance of the design as a functional pump. After connecting
it to a lumped hydraulic windkessel model of the vascular system (including compliance and
resistance), we measured pressure and flow. Our experimental results show that the model
is able to generate realistic data in terms of pressure, flow and pressure-volume
relationship. ............................................................................................................... 181
Figure 84: Geometry of the ViVitro left ventricular model [124]. ................................. 187
Figure 85: Grooved patterns in CAD models of the LV3 model. ................................... 188
Figure 86: Design of the kernel according to the ViVitro left ventricular model geometry,
which is used as a mold for the manufacturing of the actual model. The 24 fiber grooves at
the inner side are clearly visible to enable accurate deposition of the fibers. ................ 188
Figure 87: 3D printed LV3 kernels before (model 45°) and after (models 20° and 35°)
colored PVA coating................................................................................................... 189
Figure 88: LV3 models (fiber orientation 20°, 35°, and 45°) display torsional motion (17°,
22°, and 26°, respectively) as well as longitudinal and circumferential wall deformations by
a given stroke volume of 80 ml. Left panel shows the front view of the model, while the right
panel illustrates the view from the apex towards the base. Index: EDV: end diastolic volume
and ESV: end systolic volume. .................................................................................... 191

LIST OF FIGURES
308
Figure 89: Geometrical design of MV2 with an identical mitral annulus of the Zygote CAD
model. ........................................................................................................................ 201
Figure 90: (A) Geometry, (B) aluminum matrix, and (C) in-vitro mitral valve models of
mitral valve MV1 (left) and MV2 (right), respectively. ................................................. 203
Figure 91: Integration into the left heart model and close up of MV1 (left) and MV2 (right),
respectively. ............................................................................................................... 204
Figure 92: Transmitral valve continuous wave Doppler signals show a Mitral Valve
Pressure Half Time (MV PHT) of 102.90 and 71.14 ms and a (derived) EOA of 2.14 and
3.09 cm² for MV1 1 and MV2, respectively. ................................................................. 205
Figure 93: Transmitral pressure differences during early diastole (TMPDe) of MV1 and
MV2. .......................................................................................................................... 206
Figure 94: a) Drawing of the valve model (VV) with different sections in the XY plain and
pictures in open air at b) XZ and c) YZ position. .......................................................... 211
Figure 95: Step-by-step plan to build the cylindrical three-dimensional VV model starting
from a two-dimensional sheet...................................................................................... 213
Figure 96: a) PIV setup of the valve model in a transparent box in open air, and b) the
according PIV results. ................................................................................................ 214
Figure 97: The components of the natural left heart (left panel) and the final LH1 model
(right panel) with chordae tendineae (ChT) and pulmonary artery (PA). ...................... 221
Figure 98: Schematic overview of the manufacturing procedure of the LH model: ........ 226
Figure 99: Custom-made rotation system: left panel CAD design, middle panel realization
and right panel reduction and gears. ........................................................................... 228
Figure 100: The flexible monolithic LH1 model is demonstrated in different positions. . 229
Figure 101: Attachment of the chordae tendineae of MV2 (Chapter 8) to the papillary
muscles of the LH1 model. .......................................................................................... 230
Figure 102: The ViVitro left heart model and components of the mock loop. Adapted from
[196]. ........................................................................................................................ 231
Figure 103: The upper (A) and lower (B) rigid suspension plates are equipped with opposite
extensions (1-3) to ensure a durable connection with the flexible LH1 model. These two
parts are placed on top of each other (C) and sandwiches the flexible material of the left
heart. Also, the upper suspension plate is equipped with a circular extension (4) which
pressurizes the O-ring part of the sealing ring. ............................................................ 233
Figure 104: Dimensions of the LH1 suspension system (C) including the upper (A) and lower
(B) rigid suspension plates and the flexible plate in between (green) which is joined with the
left ventricle model. .................................................................................................... 234
Figure 105: Customized sealing ring (left bottom) is equipped with an integrated O-ring
and an flat part. It’s geometry is based on that of the ViVitro left ventricular model (left
upper and right) [124]. ............................................................................................... 236
Figure 106: This figure shows the LH1 model including the suspension system (6) and the
venous site adapter (2). More details are given such as the LA (1), the aorta (3), the mitral

LIST OF FIGURES
309
valve (MV1) (4), the aortic valve (5), and the LV model including the papillary muscles (7).
.................................................................................................................................. 237
Figure 107: Incorporation of the mechanical bi-leaflet aortic valve into the aorta by a 3D
printed valve plane ring (white). ................................................................................. 237
Figure 108: Experimental setup of the LH1 model which is built into the ViVitro system.
.................................................................................................................................. 239
Figure 109: At the left side, the results of an echocardiographic examination is shown of
the LH1 model, that incorporates the physiologically normal-like mitral valve model (MV1)
at the time of end systole (top) and end diastole (bottom). For the purpose of comparison,
results of a healthy human left heart (male, 32 years old) are depicted at the right side. 240
Figure 110: Color Doppler measurements of the LH1 model at the time of ventricular filling.
Blue colors represent blood flowing towards the probe, while red colors correspond to blood
flowing away from the probe. ...................................................................................... 241
Figure 111: Starting from a 3D printed kernel (A), flexible thin-walled (B) and rigid
transparent highly detailed models (C) are realized of the upper human airways. The red
appearance of the kernel is due to the pigmented PVA coating to facilitate kernel removal
and optimize surface smoothness................................................................................. 243
Figure 112: The PMMA model visually disappears when submerging it in a refractive index
matched fluid. A transparent film with cross marks is placed at the backside of the model to
check optical refraction. The blue arrow indicates the liquid level................................ 244
Figure 113 Design and composition of the modular LH2 model with the arterial site adapter
(1), the LA (2), the venous site adapter (3) (similar to the LH1 model), the MV2 of Chapter
8 (4), the suspension system (5), and the LV model (6). ................................................ 251
Figure 114: Design (left side) and suspension systems (right side) of the ViVitro system (§
10.3.1) and left heart models LH1 (§ 10.3.2) and LH2. See text for explanation of the
numbers. .................................................................................................................... 253
Figure 115: Design of the five LV models and the corresponding expected global wall
deformation with α, the fiber angle (with respect to the LV long axis) and β, the torsional
angle. ......................................................................................................................... 254
Figure 116: Front view of the five LV models: the General model (G), the Longitudinal
deformation (L), the Circumferential deformation (C), and the Torsional models 1 (T1) and
2 (T2). ........................................................................................................................ 255
Figure 117: The five LV models shown from the inside (top view). ............................... 257
Figure 118: Position of the dual sensor catheter in the LH2 model for the transmitral and
intraventricular pressure difference measurements. ..................................................... 259
Figure 119: TMPDe values in function of HR (top panel) and SV (bottom panel) ......... 260
Figure 120: IVPDe values in function of HR (top panel) and SV (bottom panel) ........... 262
Figure 121: Overview of the in-vitro models developed in this dissertation. .................. 273
Figure 122: Active left ventricular muscle LV4 including a series of spirally arranged
artificial muscle fibers (b). By applying pressurized air, an outer braid fiber structure is

LIST OF FIGURES
310
expanded in radial direction by an internal flexible tube and meanwhile shortens in length
(ΔL) (a). ..................................................................................................................... 281
Figure 123: Illustration of the FH1 and FH2, ideas for future in-vitro models of the total
heart. This image shows the heart (A) which can be unwrapped to form a continuous
ventricular myocardial band (B) according to the Torrent-Guasp concept [33]. Likewise,
artificial muscle bands (C and D) can be constructed according to the LV2 or LV4 muscle
designs and subsequently wrapped to form the in-vitro full heart models FH1 and FH2,
respectively. Similar to the VV model, transparent sheet materials could be used to account
for PIV compatibility. ................................................................................................. 283
Figure 124: Illustration of the LV5, an idea for a future PIV compatible active LV model.
.................................................................................................................................. 284

LIST OF TABLES
311
List of tables
Table 1: Values of LV torsion in healthy humans [47-50]............................................... 70
Table 2: Overview of the practical guidelines for designing a more natural accurate in-vitro
left heart model. ......................................................................................................... 130
Table 3: An overview of cardiovascular simulators is given in the context of practical
guidelines. Different types of mitral valves are applied, mechanical (M), bioprosthetic (B)
and post-mortem (P), but no in-vitro valve model yet. Index: ‘–’ absent, ‘~’ present but
limited, ‘v’ present, ‘ ’ not applicable. ......................................................................... 131
Table 4: Fabrication procedure of the LH1 model. ...................................................... 223
Table 5: A summary of the design criteria for the suspension system of the original ViVitro
system and the LH1 model. ......................................................................................... 233
Table 6: Overview data of TMPDe varying SV while keeping HR constant (panel 1) and
varying HR while keeping SV constant (panel 2). The mean values and SD’s per model are
given for TMPDe ........................................................................................................ 258
Table 7: Overview data of IVPDe varying SV while keeping HR constant and varying HR
while keeping SV constant. The mean values and SD’s per model are given for IVPDe . 261
Table 8: A general overview of this dissertation is given. Index: ‘–’ absent, ‘v’ present, ‘~’
present but limited, ‘ ’ not applicable, M: mechanical mitral valve and IV: in-vitro mitral
valve. ......................................................................................................................... 275

312