In silico Prediction of Novel SARS-CoV 3CLpro Inhibitors
16
https://biointerfaceresearch.com/ 5100 Article Volume 12, Issue 4, 2022, 5100 - 5115 https://doi.org/10.33263/BRIAC124.51005115 In silico Prediction of Novel SARS-CoV 3CL pro Inhibitors: a Combination of 3D-QSAR, Molecular Docking, ADMET Prediction, and Molecular Dynamics Simulation Chedadi Oussama 1 , El Aissouq Abdellah 2,* , El Ouardi Youssef 3 , Bouachrine Mohammed 4 , Ouammou Abdelkrim 1 1 LIMOME Laboratory, Faculty of Sciences Dhar El Mahraz, Sidi Mohamed Ben Abdellah University, Fez, Morocco 2 Laboratory of Processes, Materials and Environment (LPME), Faculty of Science and Technology, Sidi Mohamed Ben Abdellah University, Fez, Morocco 3 Laboratory of Separation Technology, Lappeenranta University of Technology, Lappeenranta, Finland 4 MCNS Laboratory, Faculty of Sciences, Moulay Ismail University, Meknes, Morocco * Correspondence: [email protected] (E.A.A.); Scopus Author ID 57218453948 Received: 26.07.2021; Revised: 10.09.2021; Accepted: 16.09.2021; Published: 17.10.2021 Abstract: The Chymotrypsin-like protease (3CL pro ) is a drug target in the coronavirus because of its role in processing the polyproteins that are translated from the viral RNA. This study applied 3D quantitative structure-activity relationship (3D-QSAR), molecular docking, and ADMET prediction on a series of SARS-CoV 3CL pro inhibitors. The 3D-QSAR study was applied using Comparative Molecular Field Analysis (CoMFA) and Comparative Molecular Similarity Indices Analysis (CoMSIA) methods, which gave the cross-validation coefficient (Q 2 ) values of 0.64 and 0.80, the determination coefficient (R 2 ) values of 0.998 and 0.993 and the standard error of the estimate (SEE) values of 0.046 and 0.091, respectively. The acceptable values of the determination coefficient (R 2 test) to CoMFA and CoMSIA respectively corresponding to values of 0.725 and 0.690 utilizing a test set of seven molecules prove the high predictive ability of this model. Molecular docking analysis was utilized to validate 3D- QSAR methods and explain the binding site interactions and affinity between the most active ligands and the SARS-CoV 3CLpro receptor. Based on these results, a novel series of compounds were predicted, and their pharmacokinetic properties were verified using drug-likeness and ADMET prediction. Finally, the best-docked candidate molecules were subjected to molecular dynamics (MD) simulation to affirm their dynamic behavior and stability. Keywords: 3D-QSAR; SARS-CoV 3CL pro ; molecular docking; ADMET prediction; MD simulation. © 2021 by the authors. This article is an open-access article distributed under the terms and conditions of the Creative Commons Attribution (CC BY) license (https://creativecommons.org/licenses/by/4.0/). 1. Introduction Severe acute respiratory syndrome (SARS) is a disease caused by the coronavirus (SARS-CoV), which highly infects the respiratory tract [1]. The SRAS-CoV disease starts with a Flu-like illness that evolves into respiratory failure followed by pneumonia, and in severe cases, by death. Therefore, the mortality rate of SARS is relatively higher compared to that of the common infections of the respiratory tracts and influenza [2]. The propagation of the SARS-CoV is said to originate from an animal's virus, most likely of bats, which then spread to other animals. The first SRAS-CoV infection in humankind was recorded in Sothern, China, in Guangdong in 2002 [3]. Starting from March 2003, the viral infection rapidly spread to other countries, causing 8000 infections and 800 deaths [4]. In 2004,
-
Upload
khangminh22 -
Category
Documents
-
view
2 -
download
0
Transcript of In silico Prediction of Novel SARS-CoV 3CLpro Inhibitors
https://biointerfaceresearch.com/ 5100
Article
Volume 12, Issue 4, 2022, 5100 - 5115
https://doi.org/10.33263/BRIAC124.51005115
In silico Prediction of Novel SARS-CoV 3CL pro Inhibitors:
a Combination of 3D-QSAR, Molecular Docking, ADMET
Prediction, and Molecular Dynamics Simulation
Chedadi Oussama 1 , El Aissouq Abdellah 2,* , El Ouardi Youssef 3 , Bouachrine Mohammed 4 ,
Ouammou Abdelkrim 1
1 LIMOME Laboratory, Faculty of Sciences Dhar El Mahraz, Sidi Mohamed Ben Abdellah University, Fez, Morocco 2 Laboratory of Processes, Materials and Environment (LPME), Faculty of Science and Technology, Sidi Mohamed Ben
Abdellah University, Fez, Morocco 3 Laboratory of Separation Technology, Lappeenranta University of Technology, Lappeenranta, Finland 4 MCNS Laboratory, Faculty of Sciences, Moulay Ismail University, Meknes, Morocco
* Correspondence: [email protected] (E.A.A.);
Scopus Author ID 57218453948
Received: 26.07.2021; Revised: 10.09.2021; Accepted: 16.09.2021; Published: 17.10.2021
Abstract: The Chymotrypsin-like protease (3CLpro) is a drug target in the coronavirus because of its
role in processing the polyproteins that are translated from the viral RNA. This study applied 3D
quantitative structure-activity relationship (3D-QSAR), molecular docking, and ADMET prediction on
a series of SARS-CoV 3CLpro inhibitors. The 3D-QSAR study was applied using Comparative
Molecular Field Analysis (CoMFA) and Comparative Molecular Similarity Indices Analysis (CoMSIA)
methods, which gave the cross-validation coefficient (Q2) values of 0.64 and 0.80, the determination
coefficient (R2) values of 0.998 and 0.993 and the standard error of the estimate (SEE) values of 0.046
and 0.091, respectively. The acceptable values of the determination coefficient (R2 test) to CoMFA and
CoMSIA respectively corresponding to values of 0.725 and 0.690 utilizing a test set of seven molecules
prove the high predictive ability of this model. Molecular docking analysis was utilized to validate 3D-
QSAR methods and explain the binding site interactions and affinity between the most active ligands
and the SARS-CoV 3CLpro receptor. Based on these results, a novel series of compounds were
predicted, and their pharmacokinetic properties were verified using drug-likeness and ADMET
prediction. Finally, the best-docked candidate molecules were subjected to molecular dynamics (MD)
simulation to affirm their dynamic behavior and stability.
Keywords: 3D-QSAR; SARS-CoV 3CLpro; molecular docking; ADMET prediction; MD simulation.
© 2021 by the authors. This article is an open-access article distributed under the terms and conditions of the Creative
Commons Attribution (CC BY) license (https://creativecommons.org/licenses/by/4.0/).
1. Introduction
Severe acute respiratory syndrome (SARS) is a disease caused by the coronavirus
(SARS-CoV), which highly infects the respiratory tract [1]. The SRAS-CoV disease starts with
a Flu-like illness that evolves into respiratory failure followed by pneumonia, and in severe
cases, by death. Therefore, the mortality rate of SARS is relatively higher compared to that of
the common infections of the respiratory tracts and influenza [2].
The propagation of the SARS-CoV is said to originate from an animal's virus, most
likely of bats, which then spread to other animals. The first SRAS-CoV infection in humankind
was recorded in Sothern, China, in Guangdong in 2002 [3]. Starting from March 2003, the viral
infection rapidly spread to other countries, causing 8000 infections and 800 deaths [4]. In 2004,

https://doi.org/10.33263/BRIAC124.51005115
https://biointerfaceresearch.com/ 5101
no respiratory infection was documented in any part of the world [5,6]. Ever since then, a few
cases of viral infection emerged from transmission from animals to humankind or because of
laboratory accidents. Recent research shows that CoV-SARS can also be transmitted from one
person to another [7,8].
Following the clinical diagnosis of diverse patients who were infected by the viral
infection SARS-CoV, common symptoms were recorded, including fever, diarrhea, shivering,
myalgia, and malaise. None of these symptoms directly linked with the SARS diagnosis, even
if the fever was the most commonly reported amongst patients, particularly those with chronic
diseases and the elderly [9]. In most cases, the chronology of the viral infection's symptoms is
manifested as diarrhea, shortness of breath, and cough. In extreme cases, the infection can
evolve into respiratory distress requiring intensive care [10,11]. SARS is caused by a new
human coronavirus (SARS-CoV), which encodes many viral proteases that proteolyze
polyproteins to produce functional proteins. The major protease (Mpro), also known as the
dimeric chymotrypsin-like protease (3CLpro), is one such highly conserved cysteine protease
[12].
In this work, we focused on a series of SARS-CoV 3CLpro inhibitors to perform a
theoretical study by using 3D-QSAR [13], molecular Docking [14,15], absorption, distribution,
metabolism, excretion, and toxicity (ADMET) prediction [16,17], and molecular dynamics
(MD) simulation. The 3D-QSAR methods, including comparative molecular similarity indices
analysis (CoMSIA) and comparative molecular field analysis (CoMFA), were used to
understand the impact of hydrophobic, electrostatic, steric, hydrogen bonds donor, and
hydrogen bond acceptor fields on the inhibitory activity [18,19]. Molecular docking analysis
was also applied to validate 3D-QSAR models and to study the orientations along with the
probable binding conformations of the composites interacting with the SARS-CoV 3CLpro
receptor. Based on the results of 3D-QSAR and docking analysis, a series of compounds were
predicted. Then, the pharmacokinetic properties of predicted compounds were analyzed by
drug-likeness and ADMET prediction. The best-docked compounds were subjected to MD
simulation to affirm the final candidate molecules' conformational space and binding stability
[20].
2. Materials and Methods
2.1. Data set analysis.
Concerning the generation of 3D-QSAR models, the values of the biological activity
(values IC50 (µM)) were used, and a set of data about the inhibitors 3CLpro of SARS-CoV
was synthesized by Konno et al. [21]. The values IC50 were converted to pIC50 values [22]
and were then utilized as the dependent variable of this experimental work.
Table 1. Data set compounds and activity.
(1-21) (22-23)

https://doi.org/10.33263/BRIAC124.51005115
https://biointerfaceresearch.com/ 5102
No R1 R2 IC50
(µM) pIC50 No R1 R2
IC50
(µM) pIC50
1
36 4.444 13T
0.75 6.125
2
85 4.071 14
1.2 5.921
3
250 3.602 15
0.65 6.187
4
280 3.553 16T
1.7 5.770
5
13 4.886 17
3.4 5.469
6T
24 4.620 18
2.9 5.538
7
6.8 5.168 19
1.5 5.824
8
2 5.699 20
7.5 5.125
9
1.7 5.769 21
9.5 5.023
10
2.3 5.638 22
260 3.585
11
0.92 6.036 23T
210 3.678
12
1.9 5.721
T Represents the test set compounds.
2.2. The study of 3D‑QSAR model.
2.2.1. Alignment and optimization of the molecular database.
With the help of the program package SYBYL-X 2.1, the design, molecular
optimization, and alignment were implemented for the 3D‑QSAR study [23]. This program
utilizes the geometrical optimization of the Tripos Force Field [24], which is based on the
following criteria:
- 0.001 kcal/mol Å convergence criterion.
- 10000 iterations as a maximum number.
- The model Gasteiger-Hücke is utilized to calculate the atomic charges [25].
2.2.2. CoMFA and CoMSIA procedures.
The method of CoMFA [26,27] lies within the alignment of the different compounds in
a grid lattice of 2.0 Å spacing. Concerning the probation of the electrostatic (Coulombic) and

https://doi.org/10.33263/BRIAC124.51005115
https://biointerfaceresearch.com/ 5103
the steric (Lennard-Jones) field energies, an sp3 carbon atom was utilized with a +1 charge.
The values of the interactions' cutoff energies must follow the order of 30 kcal/mol. Column
filtering based on the calculation of the molecular-field energies with a variation less than 2.0
kcal/mol was applied to diminish the computation time without impacting the CoMFA models'
quality [16].
The CoMSIA method [28] is a prolongation of the CoMFA method. In the study of
CoMSIA, hydrophobic, electrostatic, steric, hydrogen bond acceptor, and donor fields were
calculated on-grid lattice of a 2.0 Å. The values of the interactions' cutoff energies must follow
the order of 30 kcal/mol [28], and the attenuation factor was put to the value of 0.3. Column
filtering is based on calculating the molecular-field energies with a variation of less than 2.0
kcal/mol.
The CoMFA and CoMSIA method rely on the robustness of the partial-least-squares
(PLS) [29] analysis which was treated by the cross-validation method through the use of the
procedure leave-one-out (LOO) [30]. For the 3D-QSAR to be statistically predictable and
credible, the values of the regression coefficient Q2 of the cross-validation and the values of
the regression coefficient R2 need to be greater than 0.5 and 0.6, respectively. For the model of
CoMFA and CoMSIA to be absolutely reliable, it is mandatory that the Fisher coefficient and
the standard error of estimation (SEE) of R2 be calculated using PLS with a non-cross
validation method. The prediction ability of the chosen model was verified by using the
external validation (test set) [31,32].
2.3. Docking study.
Molecular docking permits to detection and visualization of the potential interactions
between the ligands and the receptor (SARS-CoV 3CLpro). Concerning the necessary steps to
realize the docking analyses, the adequate protein SARS-CoV 3CLpro starting from the Data
Bank Protein (PDB code: 1WOF) [33] was being downloaded, the water molecules, as well as
the original ligand, were eliminated, and the active site of the protein was detected using the
AutoDock tools [34] by defining the cubic grid box 44 Å x 46 Å x 58 Å and 40 Å x 54 Å x 40
Å at 0.375 Å
Finally, the most active molecules and the most potent inhibitors were docked by using
AutoDock 4.2 [35] in the active zone of the protein 1WOF, and the results are visualized
utilizing PyMol [36] et Discovery Studio 2017 software's [37].
2.4. Molecular dynamics simulation.
After performing the molecular docking study, the best-scored complexes of SARS-
COV (PDB code: 1WOF) were then subjected to molecular dynamics simulations. All the
calculations were performed using the GROMACS version (2020.1-1) [38]. The topology file
of each compound was created by the CHARMM General Force Field (CGenFF) server [39],
while the protein topology was created by 'pdb2gmx' script. The simulations were run using
the CHARMM36 all-atom (March 2019) force field [40] in a triclinic box with a distance of
1.0 nm and a TIP3P water model solvated system [41]. The neutralization of the system was
performed by adding sodium and chloride (Na+/Cl-) ions. The energy minimization of the
system was subjected to 50,000 steps using the steepest descent algorithm. Then, the
production of MD simulation was run for 20 ns for each simulation at a temperature of 300 k,
a pressure of 1 bar, and a time step of 2 fs.

https://doi.org/10.33263/BRIAC124.51005115
https://biointerfaceresearch.com/ 5104
3. Results and Discussion
3.1. 3D-QSAR analysis.
3.1.1. Molecular alignment.
Thanks to the compilation of the various compounds of the training and test sets in the
module of distilling off the Sybyl software, it was possible to visualize the common structure
(Core).
Figure 1. Molecular alignment of all molecules in the data set: (a) ligand-based alignment model of all the
compounds. (b) Molecular core.
3.1.2. CoMFA and CoMSIA analysis.
The compilation of the CoMSIA and CoMFA system database resulted in itemized
detailed statistical results to better understand the influence of electrostatic, steric,
hydrophobic, hydrogen bond acceptor, and hydrogen bond donor fiends on the inhibitory
activity of SARS-CoV 3CLpro in Table 2.
Table 2. Analytical results of CoMSIA and CoMFA models using PLS statistics.
3D-QSAR Q2cv r2
ncv SEE N F Pred_r2 Relative % contributions
S E H D A
CoMFA 0.64 0.998 0.046 5 1462.69 0.725 64.4 35.6 - - -
CoMSIA 0. 80 0. 993 0.091 5 371.624 0.690 26.7 - 73.3 - -
Q2: Cross-validated determination coefficient; F = Fischer value; N: Optimum number of components obtained
from cross-validated PLS analysis and same used in the final non-cross-validated analysis; R2: Non-cross-
validated determination coefficient; R2 test: External validation determination coefficient; SEE: Standard error
of the estimate.
The results of the CoMFA model revealed the determination coefficient (R2) value of
0.998, the cross-validated determination coefficient (Q2) value 0.64, and the test set
determination coefficient (R2test) value of 0.75. The observed values of pIC50 and their residues
which the CoMFA model predicted are listed in Table 3. Figure 2 shows the correlation
between the predicted and observed values of pIC50 obtained by the CoMFA model.
In the model CoMSIA, the ideal number of the principal components utilized to
generate this model is 5. The principal factors of activity control are the hydrophobic and the
steric fields. The generated model showed a non-cross-validated correlational coefficient
(R2ncv) and a cross-validated determination coefficient (Q2
cv) values of 0.993 and 0.80,
respectively.
(a) (b)
https://doi.org/10.33263/BRIAC124.51005115
https://biointerfaceresearch.com/ 5105
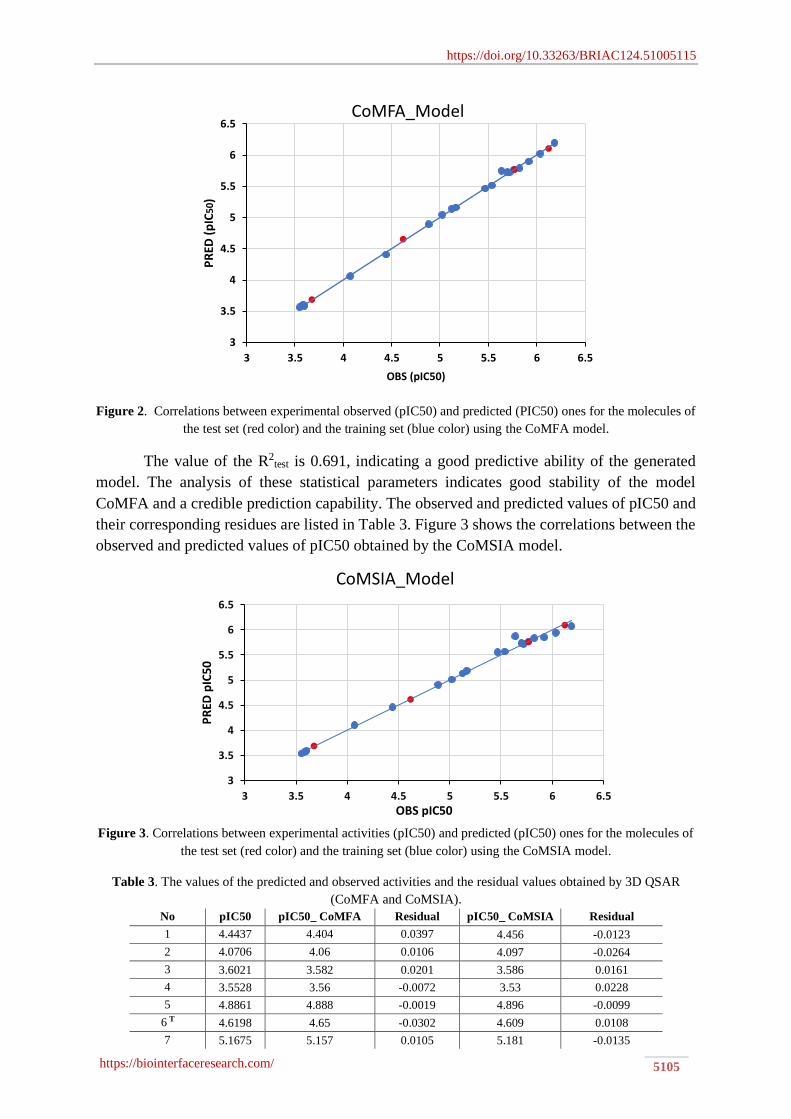
Figure 2. Correlations between experimental observed (pIC50) and predicted (PIC50) ones for the molecules of
the test set (red color) and the training set (blue color) using the CoMFA model.
The value of the R2test is 0.691, indicating a good predictive ability of the generated
model. The analysis of these statistical parameters indicates good stability of the model
CoMFA and a credible prediction capability. The observed and predicted values of pIC50 and
their corresponding residues are listed in Table 3. Figure 3 shows the correlations between the
observed and predicted values of pIC50 obtained by the CoMSIA model.
Figure 3. Correlations between experimental activities (pIC50) and predicted (pIC50) ones for the molecules of
the test set (red color) and the training set (blue color) using the CoMSIA model.
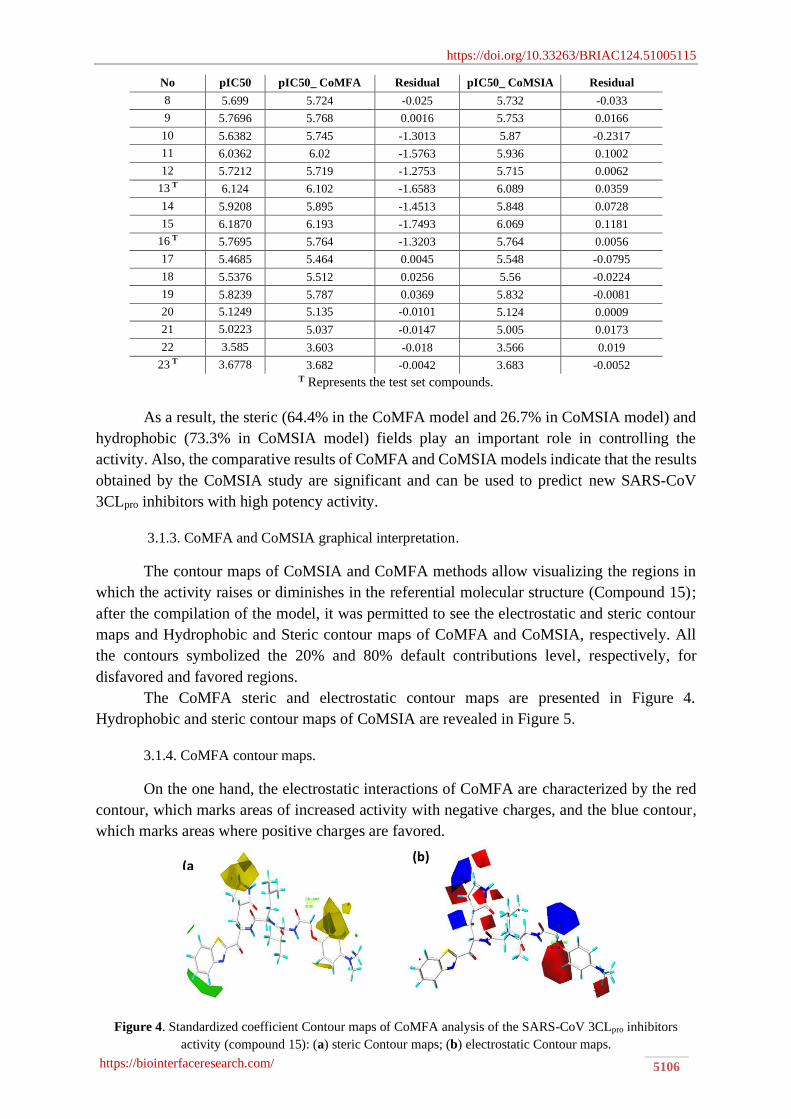
Table 3. The values of the predicted and observed activities and the residual values obtained by 3D QSAR
(CoMFA and CoMSIA).
No pIC50 pIC50_ CoMFA Residual pIC50_ CoMSIA Residual
1 4.4437 4.404 0.0397 4.456 -0.0123
2 4.0706 4.06 0.0106 4.097 -0.0264
3 3.6021 3.582 0.0201 3.586 0.0161
4 3.5528 3.56 -0.0072 3.53 0.0228
5 4.8861 4.888 -0.0019 4.896 -0.0099
6 T 4.6198 4.65 -0.0302 4.609 0.0108
7 5.1675 5.157 0.0105 5.181 -0.0135
3
3.5
4
4.5
5
5.5
6
6.5
3 3.5 4 4.5 5 5.5 6 6.5
PR
ED (
pIC
50)
OBS (pIC50)
CoMFA_Model
3
3.5
4
4.5
5
5.5
6
6.5
3 3.5 4 4.5 5 5.5 6 6.5
PR
ED p
IC50
OBS pIC50
CoMSIA_Model
https://doi.org/10.33263/BRIAC124.51005115
https://biointerfaceresearch.com/ 5106
No pIC50 pIC50_ CoMFA Residual pIC50_ CoMSIA Residual
8 5.699 5.724 -0.025 5.732 -0.033
9 5.7696 5.768 0.0016 5.753 0.0166
10 5.6382 5.745 -1.3013 5.87 -0.2317
11 6.0362 6.02 -1.5763 5.936 0.1002
12 5.7212 5.719 -1.2753 5.715 0.0062
13 T 6.124 6.102 -1.6583 6.089 0.0359
14 5.9208 5.895 -1.4513 5.848 0.0728
15 6.1870 6.193 -1.7493 6.069 0.1181
16 T 5.7695 5.764 -1.3203 5.764 0.0056
17 5.4685 5.464 0.0045 5.548 -0.0795
18 5.5376 5.512 0.0256 5.56 -0.0224
19 5.8239 5.787 0.0369 5.832 -0.0081
20 5.1249 5.135 -0.0101 5.124 0.0009
21 5.0223 5.037 -0.0147 5.005 0.0173
22 3.585 3.603 -0.018 3.566 0.019
23 T 3.6778 3.682 -0.0042 3.683 -0.0052 T Represents the test set compounds.
As a result, the steric (64.4% in the CoMFA model and 26.7% in CoMSIA model) and
hydrophobic (73.3% in CoMSIA model) fields play an important role in controlling the
activity. Also, the comparative results of CoMFA and CoMSIA models indicate that the results
obtained by the CoMSIA study are significant and can be used to predict new SARS-CoV
3CLpro inhibitors with high potency activity.
3.1.3. CoMFA and CoMSIA graphical interpretation.
The contour maps of CoMSIA and CoMFA methods allow visualizing the regions in
which the activity raises or diminishes in the referential molecular structure (Compound 15);
after the compilation of the model, it was permitted to see the electrostatic and steric contour
maps and Hydrophobic and Steric contour maps of CoMFA and CoMSIA, respectively. All
the contours symbolized the 20% and 80% default contributions level, respectively, for
disfavored and favored regions.
The CoMFA steric and electrostatic contour maps are presented in Figure 4.
Hydrophobic and steric contour maps of CoMSIA are revealed in Figure 5.
3.1.4. CoMFA contour maps.
On the one hand, the electrostatic interactions of CoMFA are characterized by the red
contour, which marks areas of increased activity with negative charges, and the blue contour,
which marks areas where positive charges are favored.
Figure 4. Standardized coefficient Contour maps of CoMFA analysis of the SARS-CoV 3CLpro inhibitors
activity (compound 15): (a) steric Contour maps; (b) electrostatic Contour maps.
(a(b)

https://doi.org/10.33263/BRIAC124.51005115
https://biointerfaceresearch.com/ 5107
On the other hand, the steric interactions of CoMFA are characterized by the yellow
contour where the cumbersome substituents are unfavored and the green contour where these
latter are favored Figures 4 (a) and (b).
The contour map, which is marked in green near the R1 position (Figure 4 (a)), suggests
that the R1 group is favorable in terms of steric field, which could justify the reason why the
compounds 1 to 6, which contains R = 4.5- dihydrothizole with pIC50 between 3.552 and 4.886
are the less active compounds than compounds 8 to 20 which contains R= benzothiazole with
pIC50 between 5.124 and 6.187. Moreover, a larger unfavorable yellow contour near the
position R1 and pyrrolidinone group indicates that bulky regions decrease activity.
The electrostatic contour map is portrayed in (Figure 4 (b)). Red contours indicate
regions where negative groups increase the activity. A large red contour map around the R1
position indicates that the electronegative groups at this region may increase the activity. This
may explain why compound 10 which contains R = 2-phenoxyacetaldehyde showed a
significant decrease in activity (pIC50 = 5.638) than compound 11 (pIC50 =6.036), which
contains R= 2-(4-methoxyphenoxy) acetaldehyde. On the other hand, the region where a less
negative potential electrostatic field (diminishes the activity of the inhibitor) is marked by the
blue contour.
3.1.5. CoMSIA contour maps.
The best CoMSIA model was generated using hydrophobic and steric fields. Figures 5
(a) and (b) represent the steric and hydrophobic contour maps, respectively. Steric interactions
are characterized by green (sterically-favorable) and yellow (sterically-unfavorable) colored
contours, while hydrophobic interactions are characterized by blue (hydrophobically-
unfavorable) and magenta (hydrophobically-favorable) colored contours.
Figure 5. Standardized coefficient Contour maps of CoMSIA analysis of the SARS-CoV 3CLpro inhibitors
activity ( compound 15) : (a) Steric contour map, (b) Hydrophobic contour map.
Figure 5 (a) shows the CoMSIA steric contour map. As shown in this figure, a green
contour map near the position R2 and phenyl group R1 suggests that the R2 group is favorable
in terms of the steric field. This may justify why compounds 1 to 6 (pIC50 between 3.552 and
4.886) containing R = 4.5- dihydrothizole are less active than compounds 8 to 20 (pIC50
between 5.124 and 6.187), which contain R= benzothiazole. Moreover, a larger unfavorable
yellow contour near the position R1 and pyrrolidinone group indicates that bulky groups in
these regions decrease the activity.
Figure 5 (b) shows the CoMSIA hydrophobic contour map. As described in this figure,
the magenta contour around the R2 group reveals that hydrophobicity substituent at this
(a) (b)

https://doi.org/10.33263/BRIAC124.51005115
https://biointerfaceresearch.com/ 5108
position would increase activity. Moreover, a large blue area around the R1 and pyrrolidinone
groups indicates that the hydrophobic groups in these positions may decrease the activity.
3.2. Molecular docking results.
In order to predict the binding site interactions and energy, molecular docking analysis
was applied on the most potent inhibitor in the dataset. The native ligand was first re-docked
in its PDB structure (PDB ID: 1WOF). The best-obtained pose gave the root-mean-square
deviation (RMSD) value of 1.11, using 50 iterations. The superposition between co-crystallized
and re-docked ligands is shown in Figure 6.
Figure 6. Superposition of the reference ligand (green stick) with the re-docked ligand (bleu stick) in the pocket
site SARS-CoV 3CLpro (PDB ID: 1WOF).
After docking validation, the most potent inhibitor in the dataset (compound 15) was
used to generate molecular docking analysis. The binding site interactions between compound
15 and SARS-CoV 3CLpro are shown in Figure 7. As described in this figure, Compound 15
forms 3 Van der Waals interactions with GYS 44, THR 25, and GLN 189 amino acids and 4
conventional Hydrogen bond interactions with LEU 141, CYS 145and GLU 166 amino acids.
This type of interaction and mostly Hydrogen bond interactions explain why this compound
shows high stability in the catalytic pocket of SARS-CoV 3CLpro (-7.5 kcal/mol).
Figure 7. Docking results of compounds 15 with SARS-CoV 3CLpro protein (PDB code: 1WOF).

https://doi.org/10.33263/BRIAC124.51005115
https://biointerfaceresearch.com/ 5109
3.3. Design of new compounds.
The 3D-QSAR (CoMSIA and CoMFA) model provided us with the needed information
to elaborate a conceptual strategy of new inhibitors with enhanced effectiveness.
After the conceptualization of novel inhibitors' structure in accordance with the
directive line of the QSAR model (Figure 8), the compounds are aligned and modeled in the
study of CoMSIA. The results of the activities of the predicted compounds are presented in
Table 4.
The activities' values of the predicted compounds show that they are very high
compared to the most active compound in the basic database.
The final step is the realization of molecular docking of the new predicted compounds
P 1-5. The results of the interactions between the active site and the SARS-CoV 3CLpro protein
(PDB ID: 1WOF) are presented in Table 4. The results indicate that the binding energy of
predicted compounds in the active site of SARS-CoV 3CLpro protein (PDB ID: 1WOF) is
larger than the most potent. These docking results show that the chemical binding energies
between the predicted compounds are lower than that of the most active molecule in the data
set (compound 15). This reflects that these new compounds are more stable when binding with
the active site of the SARS-CoV 3CLpro protein (PDB ID: 1WOF); therefore, it gives a high
inhibitory effect.
Figure 8. Structure-activity relationship (SAR) information obtained from the 3D-QSAR study.
Table 4. Structures of newly designed compounds and their corresponding predicted pIC50 values and binding
free energy.
Compounds Structures CoMSIA_pred Binding energy (kcal/mol)
P1
6.342 -9.61 ± 1.45
P2
6.24 -8.2 ± 0.37
P3
6.22 -8.9 ± 0.57

https://doi.org/10.33263/BRIAC124.51005115
https://biointerfaceresearch.com/ 5110
Compounds Structures CoMSIA_pred Binding energy (kcal/mol)
P4
6.20 -8.6 ± 0.30
P5
6.18 -8.1 ± 0.28
Figure 9. Molecular docking of compound P1 with SARS-CoV 3CLpro protein. (a) Binding site interactions of
2D view, (b) the binding conformation of 3D view.
Figure 10. Molecular docking of compound P2 with SARS-CoV 3CLpro protein. (a) Binding site interactions of
2D view, (b) binding conformation of 3D view.
Figure 11. Molecular docking of compound P3 with SARS-CoV 3CLpro protein. (a) Binding site interactions of
2D view, (b) binding conformation of 3D view.
(a) (b)
(a) (b)
(a) (b)

https://doi.org/10.33263/BRIAC124.51005115
https://biointerfaceresearch.com/ 5111
The molecular docking results of the predicted highly active molecules P1, P2, and P3
with the receptor 3CLpro du SARS-CoV showed adhesion of the protein's active site through
hydrogenic and hydrophobic liaisons, which explains the affinity of these structures in
accordance with the protein SARS-CoV 3CLpro. See the diagrams in 2D and 3D of the ligand-
receptor interactions in Figures 9-11.
3.4. Drug- likeness and ADMET prediction.
Before the experiment, it is necessary to perform the drug-likeness and the
pharmacokinetic properties of novel predicted compounds [42,43]. Here, the drug-likeness and
the absorption, distribution, metabolism, excretion, and toxicity (ADMET) were calculated
using the pkCSM [44] and SwissADMET [45] webservers. The results are listed in Table 5.
Table 5. In silico prediction of drug-likeness and ADMET properties.
No. MW
(g/mol1) HBA HBD
TPSA
(A2) log P log S HIA BBB
CYP 2D6
inhibition
Total
Clearance
Toxicity Drug-likeness
AMES Skin
Sensitization Lipinski
Bioavailability
Score
P1 655.81 6 4 174.60 4.62 -4.22 79.37 -1.41 No -0.198 No No Yes 0.55
P2 672.635 7 4 174.60 4.53 -4.75 78.60 -1.56 No -0.254 No No Yes 0.55
P3 670.19 7 4 174.60 4.33 -4.31 79.17 -1.59 No -0.251 No No Yes 0.55
15 677.868 9 3 175.04 4.39 -4.13 72.159 -1.60 No -0.073 No No No 0.17
MW = molecular weight, HBA = number of hydrogen bond acceptor, HBD = number of hydrogen bond donor,
TPSA = topological polar surface area, LogP = octanol–water partition coefficient, log s = Water solubility,
HIA= human intestinal absorption, BBB= blood brain barrier.
As shown in Table 5, all predicted compounds exhibit a moderate ADMET parameter.
The high values of human intestinal absorption (HIA > 30%) indicate that the predicted
compounds exabit a moderate permeation across the intestinal membrane. The log P and log S
values of all compounds are in the best range, which means they had good absorbency and
good solubility, respectively. None of the predicted compounds were found to be a potent
inhibitor of CYP450 2D6. Also, the test of AMES and Skin Sensitization revealed that the
predicted compounds are harmless. In summary, it can be concluded that the predicted
compounds are likely to be orally active.
3.5. Molecular dynamics simulation.
In order to validate the results of molecular docking and affirm the stability of docked
compounds in the binding pocket of SARS-CoV 3CLpro protein, compounds 15 and P1 were
subjected to MD simulation. All the systems were employed for 20 ns time scale simulation.
The Root Mean Square Deviation (RMSD) of 1WOF_M15 and 1WOF_P1 complexes are
given in Figure 10 (a). This figure shows that the average RMSD value of 1WOF_M15 and
1WOF_P1 systems are 0.31 and 0.23 nm, respectively. These results indicate that the
1WOF_P1 complex is more stable than the 1WOF_M15 complex during the simulations. The
Root Means Square Fluctuation (RMSF) of both complexes and free 6LU7 protein is also
shown in Figure 10 (b). This parameter is an indicator of residual flexibility [46–48]. From the
results of the RMSF value, we conclude that the P3_6LU7 complex shows less conformational

https://doi.org/10.33263/BRIAC124.51005115
https://biointerfaceresearch.com/ 5112
changes during the simulations except for the C-terminal end (Figure 10 (b)). All of these
results are in agreement with that obtained by 3D-QSAR and molecular docking.
Figure 10. Molecular dynamics simulations. (a) RMSD of backbone over the 20 Ns of MD simulation at 300 K
and 1 bar, (b) RMSF of residues during MD simulation. In all Figures, the red color represents the 1WOF_M15
complex, and the black color represents the 1WOF_P1 complex.
4. Conclusions
This study proposes new inhibitor compounds of powerful SARS-CoV 3CLpro
inhibitors from a series of the compounds through the application of 3D-QSAR studies,
including CoMFA and CoMSIA.
The results of CoMFA and CoMSIA studies (PLS method of the regression of the
smallest partial squares) show that the obtained values of Q2, R2 test, and R2 are very high and
elevated for all models. The study of the chemical interactions of the binding site between the
ligands and the 1WOF protein is carried out using molecular docking. According to the docking
results, it can be inferred that there is a synergy with the 3D-QSAR studies.
Based on these studies, four new compounds, P1-5, were predicted using the CoMSIA
method. The results of the docking analysis show that compared to the most potent inhibitor in
the data set (composed 15), the predicted compounds have a high degree of stability in the
binding pocket of the SARS-CoV 3CLpro receptor, and their pharmacokinetic properties were
verified by drug-likeness and ADMET prediction. The results of MD simulation also indicate
that the compound P1 is more stable in the binding pocket of the SARS-CoV 3CLpro receptor
during the 20 ns of the simulation time.
Funding
This research received no external funding.
Acknowledgments
The authors want to thank the Moroccan Association of Theoretical Chemistry (MATC) for its
relevant help regarding the software.
Conflicts of Interest
All authors declare that they have no conflict of interest in this work.
(a) (b)

https://doi.org/10.33263/BRIAC124.51005115
https://biointerfaceresearch.com/ 5113
References
1. Chiu, R.W.K.; Jin, Y.; Chung, G.T.Y.; Lui, W.; Chan, A.T.C.; Lim, W.; Lo, Y.M.D. Automated extraction
protocol for quantification of SARS-Coronavirus RNA in serum: an evaluation study. BMC Infectious
diseases 2006, 6, 20, https://doi.org/10.1186/1471-2334-6-20.
2. Ezhilan, M.; Suresh, I.; Nesakumar, N. SARS-CoV, MERS-CoV and SARS-CoV-2: A Diagnostic
Challenge. Measurement 2021, 168, 108335, https://doi.org/10.1016/j.measurement.2020.108335.
3. Zhang, J.; Wang, D.; Li, Y.; Zhao, Q.; Huang, A.; Zheng, J.; Chen, W. SARS coronavirus nucleocapsid
protein monoclonal antibodies developed using a prokaryotic expressed protein. Hybridoma 2011, 30,
481-485, https://doi.org/10.1089/hyb.2011.0028.
4. Weinstein, R.A. Planning for Epidemics — The Lessons of SARS. N Engl J Med 2004, 350, 2332–2334,
https://doi.org/10.1056/nejmp048082.
5. Hourfar, M.K.; Roth, W.K.; Seifried, E.; Schmidt, M. Comparison of Two Real-Time Quantitative Assays
for Detection of Severe Acute Respiratory Syndrome Coronavirus. J. Clin. Microbiol. 2004, 42, 2094-
2100, https://doi.org/10.1128/jcm.42.5.2094-2100.2004.
6. Lal, S.K. (ed.) Molecular biology of the SARS-coronavirus. Springer-Verlag Berlin Heidelberg 2010, 1-
328, http://dx.doi.org/10.1007/978-3-642-03683-5.
7. Chen, S.; Lu, D.; Zhang, M.; Che, J; Yin, Z.; Zhang, S.; Zhang, W.; Bo, X.; Ding, Y.; Wang, S. Double-
antigen sandwich ELISA for detection of antibodies to SARS-associated coronavirus in human serum.
Eur J Clin Microbiol Infect Dis 2005, 24, 549-553, https://doi.org/10.1007/s10096-005-1378-7.
8. Ren, Y.; Ding, H.; Wu, Q.; Chen, W.; Chen, D.; Bao, Z.; Yang, L.; Zhao, C.; Wang, J. [Detection of
SARS-CoV RNA in stool samples of SARS patients by nest RT-PCR and its clinical value]. Zhongguo Yi
Xue Ke Xue Yuan Xue Bao. 2003, 25, 368-371.
9. Gralinski, L.E.; Sheahan, T.P.; Morrison, T.E.; Menachery, V.D.; Jensen, K.; Leist, S.R.; Whitmore, A.;
Heise, M.T.; Baric, S. Complement Activation Contributes to Severe Acute Respiratory Syndrome
Coronavirus Pathogenesis. mBio. 2018, 9, 01753-18, https://doi.org/10.1128/mbio.01753-18.
10. Shin, G-C.; Chung, Y-S.; Kim, I-S.; Cho, H-W.; Kang, C. Preparation and characterization of a novel
monoclonal antibody specific to severe acute respiratory syndrome-coronavirus nucleocapsid protein.
Virus Res. 2006, 122, 109-118, https://doi.org/10.1016/j.virusres.2006.07.004.
11. Lei, J.; Hilgenfeld, R. RNA-virus proteases counteracting host innate immunity. FEBS Lett. 2017, 591,
3190–3210, https://doi.org/10.1002/1873-3468.12827.
12. Yang, H.; Yang, M.; Ding, Y.; Liu, Y.; Lou, Z.; Zhou, Z.; Sun, L.; Mo, L.; Ye, S.; Pang, H. & al. The
crystal structures of severe acute respiratory syndrome virus main protease and its complex with an
inhibitor. Proc. Natl. Acad. Sci. U. S. A. 2003, 100, 13190-13195,
https://doi.org/10.1073/pnas.1835675100.
13. Ishola, A.A.; Adedirin, O.; Joshi, T.; Chandra, S. QSAR modeling and pharmacoinformatics of SARS
coronavirus 3C-like protease inhibitors. Comput. Biol. Med. 2021, 134, 104483,
https://doi.org/10.1016/j.compbiomed.2021.104483.
14. Ercan, S.; Çınar, E. A molecular docking study of potential inhibitors and repurposed drugs against SARS-
CoV-2 main protease enzyme. J. Indian Chem. Soc. 2021, 98, 100041,
https://doi.org/10.1016/j.jics.2021.100041.
15. El Aissouq, A.; Toufik, H.; Stitou, M.; Ouammou, A.; Lamchouri, F. In Silico Design of Novel Tetra-
Substituted Pyridinylimidazoles Derivatives as c-Jun N-Terminal Kinase-3 Inhibitors, Using 2D/3D-
QSAR Studies, Molecular Docking and ADMET Prediction. Int. J. Pept. Res. Ther. 2020, 26, 1335–1351,
https://link.springer.com/article/10.1007/s10989-019-09939-8.
16. Ya'u Ibrahim, Z.; Uzairu, A.; Shallangwa, G.; Abechi, S. Molecular docking studies, drug-likeness and
in-silico ADMET prediction of some novel β-Amino alcohol grafted 1,4,5-trisubstituted 1,2,3-triazoles
derivatives as elevators of p53 protein levels. Sci. African 2020, 10, e00570,
https://doi.org/10.1016/j.sciaf.2020.e00570.
17. Goudzal, A.; El Aissouq, A.; El Hamdani, H.; Ouammou, A. QSAR modeling, molecular docking studies
and ADMET prediction on a series of phenylaminopyrimidine-(thio) urea derivatives as CK2 inhibitors.
Mater. Today Proc. 2020, https://doi.org/10.1016/j.matpr.2020.08.044.
18. Kasmi, R.; Hadaji, E.; Chedadi, O.; El Aissouq, A.; Bouachrine, M.; Ouammou, A. 2D-QSAR and
docking study of a series of coumarin derivatives as inhibitors of CDK (anticancer activity) with an
application of the molecular docking method. Heliyon 2020, 6, e04514,

https://doi.org/10.33263/BRIAC124.51005115
https://biointerfaceresearch.com/ 5114
https://doi.org/10.1016/j.heliyon.2020.e04514.
19. Chhatbar, D.M.; Chaube, U.J.; Vyas, V.K.; Bhatt, H.G. CoMFA, CoMSIA, Topomer CoMFA, HQSAR,
molecular docking and molecular dynamics simulations study of triazine morpholino derivatives as
mTOR inhibitors for the treatment of breast cancer. Comput. Biol. Chem. 2019, 80, 351–363,
https://doi.org/10.1016/j.compbiolchem.2019.04.017.
20. Stitou, M.; Toufik, H.; Bouachrine, M.; Lamchouri, F. Quantitative structure–activity relationships
analysis, homology modeling, docking and molecular dynamics studies of triterpenoid saponins as Kirsten
rat sarcoma inhibitors. J. Biomol. Struct. Dyn. 2020, 39, 152-170,
https://doi.org/10.1080/07391102.2019.1707122.
21. Konno, S.; Thanigaimalai, P.; Yamamoto, T.; Nakada, K.; Kakiuchi, R.; Takayama, K.; Yamazaki, Y.;
Yakushiji, F.; Akaji, K.; Kiso, Y. & al. Design and synthesis of new tripeptide-type SARS-CoV 3CL
protease inhibitors containing an electrophilic arylketone moiety. Bioorg. Med. Chem. 2013, 21, 412-24,
https://doi.org/10.1016/j.bmc.2012.11.017.
22. El Aissouq, A.; Toufik, H. & al. QSAR study of isonicotinamides derivatives as Alzheimr's disease
inhibitors using PLS-R and ANN methods. 2019 Int. Conf. Intell. Syst. Adv. Comput. Sci. (ISACS) 2019,
1-7, https://doi.org/10.1109/ISACS48493.2019.9068919.
23. Tong, J.; Zhan, P.; Wang, X.S.; Wu, Y. Quionolone carboxylic acid derivatives as HIV-1 integrase
inhibitors: Docking-based HQSAR and topomer CoMFA analyses. J. Chemom. 2017, 31, e2934,
https://doi.org/10.1002/cem.2934.
24. Clark, M.; Cramer, R.D.; Van Opdenbosch, N. Validation of the general purpose tripos 5.2 force field. J.
Comput. Chem. 1989, 10, 982-1012, https://doi.org/10.1002/jcc.540100804.
25. Gasteiger, J.; Saller, H. Calculation of the Charge Distribution in Conjugated Systems by a Quantification
of the Resonance Concept. Angew. Chemie Int. Ed. 1985, 24, 687-689,
https://doi.org/10.1002/anie.198506871.
26. Cramer, R.D.; Patterson, D.E.; Bunce, J.D. Comparative Molecular Field Analysis (CoMFA). 1. Effect of
Shape on Binding of Steroids to Carrier Proteins. J. Am. Chem. Soc. 1988, 110, 5959-5967,
https://doi.org/10.1021/ja00226a005.
27. Pirhadi, S.; Shiri, F.; Ghasemi, J.B. Pharmacophore elucidation and 3D-QSAR analysis of a new class of
highly potent inhibitors of acid ceramidase based on maximum common substructure and field fit
alignment methods. J. Iran. Chem. Soc. 2014, 11, 1329-1336, http://dx.doi.org/10.1007/s13738-013-
0402-6.
28. Klebe, G.; Abraham, U.; Mietzner, T. Molecular Similarity Indices in a Comparative Analysis (CoMSIA)
of Drug Molecules To Correlate and Predict Their Biological Activity. J. Med. Chem. 1994, 37, 4130-
4146, https://doi.org/10.1021/jm00050a010.
29. Bush, B.L.; Nachbar, R.B. Sample-distance partial least squares: PLS optimized for many variables, with
application to CoMFA. J. Comput. Aided. Mol. Des. 1993, 7, 587-619,
https://doi.org/10.1007/bf00124364.
30. Wu, S.; Qi, W.; Su, R.; Li, T.; Lu, D.; He, Z. CoMFA and CoMSIA analysis of ACE-inhibitory,
antimicrobial and bitter-tasting peptides. Eur. J. Med. Chem. 2014, 84, 100-106,
https://doi.org/10.1016/j.ejmech.2014.07.015.
31. Oprea, T.I.; Waller, C.L.; Marshall, G.R. Three-Dimensional Quantitative Structure-Activity Relationship
of Human Immunodeficiency Virus (I) Protease Inhibitors. 2. Predictive Power Using Limited
Exploration of Alternate Binding Modes. J. Med. Chem. 1994, 37, 2206-2215,
https://doi.org/10.1021/jm00040a013.
32. Begum, S.; Jaswanthi, P.; Venkata Lakshmi, B.; Bharathi, K. QSAR studies on indole-azole Analogues
using DTC tools; imidazole ring is more favorable for aromatase inhibition. J. Indian Chem. Soc. 2021,
98, 100016, https://doi.org/10.1016/j.jics.2021.100016.
33. Yang, H.; Xie, W.; Xue, X.; Yang, K.; Ma, J.; Liang, W.; Zhao, Q.; Zhou, Z.; Pei, D.; Ziebuhr, J. & al.
Design of wide-spectrum inhibitors targeting coronavirus main proteases. PLoS Biol. 2005, 3, e324,
https://doi.org/10.1371/journal.pbio.0030324.
34. Morris, G.M.; Huey, R.; Lindstrom, W.; Sanner, M.F.; Belew, R.K.; Goodsell, D.S.; Olson, A. AutoDock4
and AutoDockTools4 : Automated Docking with Selective Receptor Flexibility. J. Comput. Chem. 2009,
30, 2785-2791, https://doi.org/10.1002/jcc.21256.
35. Trott, O.; Olson, A.J. AutoDock Vina: Improving the Speed and Accuracy of Docking with a New Scoring
Function, Efficient Optimization, and Multithreading. J. Comput. Chem. 2010, 31, 455-461,

https://doi.org/10.33263/BRIAC124.51005115
https://biointerfaceresearch.com/ 5115
https://dx.doi.org/10.1002/jcc.21334.
36. DeLano, W.L. The PyMOL Graphics System. DeLano Scientific San Carlos, CA 2002.
37. Biovia Discovery Studio. Dassault Systèmes, https://www.3dsbiovia.com.
38. Briones, R.; Blau, C.; Kutzner, C.; de Groot, B.L.; Aponte-Santamaría, C. GROmaρs: A GROMACS-
Based Toolset to Analyze Density Maps Derived from Molecular Dynamics Simulations. Biophys. J.
2019, 116, 4-11, https://doi.org/10.1016/j.bpj.2018.11.3126.
39. Vanommeslaeghe, K,; Hatcher, E.; Acharya, C.; Kundu, S.; Zhong, S.; Shim, J.; Darian, E.; Guvench, O.;
Lopes, P.; Vorobyov, I.; Mackerell Jr., A.D. CHARMM General Force Field: A Force Field for Drug-
Like Molecules Compatible with the CHARMM All-Atom Additive Biological Force Fields. J. Comput.
Chem 2010, 31, 671-690, https://doi.org/10.1002/jcc.21367. 40. Best, R.B.; Zhu, X.; Shim, J.; Lopes, P.E.M.; Mittal, J.; Feig, M.; Mackerell Jr., A.D. Optimization of the
Additive CHARMM All-Atom Protein Force Field Targeting Improved Sampling of the Backbone ϕ , ψ
and Side-Chain χ(1) and χ(2) Dihedral Angles. J. Chem. Theory Comput. 2012, 8, 3257-3273,
https://doi.org/10.1021/ct300400x.
41. Jorgensen, W.L.; Chandrasekhar, J.; Madura, J.D.; Impey, R.W.; Klein, M.L. Comparison of simple
potential functions for simulating liquid water. J. Chem. Phys. 1983, 79, 926-935,
http://dx.doi.org/10.1063/1.445869.
42. Olasupo, S.B.; Uzairu, A.; Shallangwa, G.; Uba, S. QSAR modeling, molecular docking and
ADMET/pharmacokinetic studies: a chemometrics approach to search for novel inhibitors of
norepinephrine transporter as potent antipsychotic drugs. J. Iran. Chem. Soc. 2020, 17, 1953-1966,
https://doi.org/10.1007/s13738-020-01902-5.
43. Larik, F.A.; Faisal, M.; Saeed, A.; Channar, P.A.; Korabecny, J.; Jabeen, F.; Mahar, I.A.; Kazi, M.A.;
Abbas, Q.; Murtaza, G. & al. Investigation on the effect of alkyl chain linked mono-thioureas as Jack bean
urease inhibitors, SAR, pharmacokinetics ADMET parameters and molecular docking studies. Bioorg.
Chem. 2019, 86, 473-481, https://doi.org/10.1016/j.bioorg.2019.02.011.
44. Domínguez-Villa, F.X.; Durán-Iturbide, N.A.; Ávila-Zárraga, J.G. Synthesis, molecular docking, and in
silico ADME/Tox profiling studies of new 1-aryl-5-(3-azidopropyl)indol-4-ones: Potential inhibitors of
SARS CoV-2 main protease. Bioorg. Chem. 2021, 106, 104497,
https://doi.org/10.1016/j.bioorg.2020.104497.
45. Nainwal, L.M.; Shaququzzaman, M.; Akhter, M.; Husain, A.; Parvez, S.; Khan, F.; Naematullah, M.;
Alam, M.M. Synthesis, ADMET prediction and reverse screening study of 3,4,5-trimethoxy phenyl ring
pendant sulfur‐containing cyanopyrimidine derivatives as promising apoptosis inducing anticancer
agents. Bioorg. Chem. 2020, 104, 104282, https://doi.org/10.1016/j.bioorg.2020.104282.
46. Sarma, P.; Sekhar, N.; Prajapat, M.; Avti, P.; Kaur, H.; Kumar, S.; Singh, S.; Kumar, H.; Prakash, A.;
Dhibar, D.P.; Mehdi, B. In-silico homology assisted identification of inhibitor of RNA binding against
2019-nCoV N-protein (N terminal domain). J. Biomol. Struct. Dyn. 2020, 39, 2724-2732,
https://doi.org/10.1080/07391102.2020.1753580.
47. Enayatkhani, M.; Hasaniazad, M.; Faezi, S.; Guklani, H.; Davoodian, P.; Ahmadi, N.; Einakian, M.A.;
Karmostaji, A.; Ahmadi, K. Reverse vaccinology approach to design a novel multi-epitope vaccine
candidate against COVID-19: an in silico study. J. Biomol. Struct. Dyn. 2020, 39, 2857–2872,
https://doi.org/10.1080/07391102.2020.1756411.
48. Elmezayen, A.D.; Al-Obaidi, A.; Şahin, A.T.; Yelekçi, K. Drug repurposing for coronavirus (COVID-
19): in silico screening of known drugs against coronavirus 3CL hydrolase and protease enzymes. J.
Biomol. Struct. Dyn. 2020, 39, 2980–2992, https://doi.org/10.1080/07391102.2020.1758791.