The 7a accessory protein of SARS-CoV acts as a RNA silencing suppressor
Upload
khangminh22Category
view
0download
0
RESEARCH Open Access
SARS-CoV-2 PCR-positive and PCR-negativecases of pneumonia admitted to thehospital during the peak of COVID-19pandemic: analysis of in-hospital and post-hospital mortalityAbduzhappar Gaipov1*, Arnur Gusmanov1, Anara Abbay1, Yesbolat Sakko1, Alpamys Issanov1, Kainar Kadyrzhanuly1,Zhanar Yermakhanova2, Lazzat Aliyeva3, Ardak Kashkynbayev4, Iklas Moldaliyev5, Byron Crape1 andAntonio Sarria-Santamera1
Abstract
Background: During the spike of COVID-19 pandemic in Kazakhstan (June-2020), multiple SARS-CoV-2 PCR-testnegative pneumonia cases with higher mortality were reported by media. We aimed to study the epidemiologiccharacteristics of hospitalized PCR-test positive and negative patients with analysis of in-hospital and post-hospitalmortality. We also compare the respiratory disease characteristics between 2019 and 2020.
Methods: The study population consist of 17,691 (March–July-2020) and 4600 (March–July-2019) hospitalizedpatients with respiratory diseases (including COVID-19). The incidence rate, case-fatality rate and survival analysis foroverall mortality (in-hospital and post-hospital) were assessed.
Results: The incidence and mortality rates for respiratory diseases were 4-fold and 11-fold higher in 2020 comparedto 2019 (877.5 vs 228.2 and 11.2 vs 1.2 per 100,000 respectively). The PCR-positive cases (compared to PCR-negative)had 2-fold higher risk of overall mortality. We observed 24% higher risk of death in males compared to females andin older patients compared to younger ones. Patients residing in rural areas had 66% higher risk of death comparedto city residents and being treated in a provisional hospital was associated with 1.9-fold increased mortalitycompared to those who were treated in infectious disease hospitals.
Conclusion: This is the first study from the Central Asia and Eurasia regions, evaluating the mortality of SARS-CoV-2PCR-positive and PCR-negative respiratory system diseases during the peak of COVID-19 pandemic. We describe ahigher mortality rate for PCR-test positive cases compared to PCR-test negative cases, for males compared to females,for elder patients compared to younger ones and for patients living in rural areas compared to city residents.
Keywords: SARS-CoV-2, COVID-19-like pneumonia, PCR test, In-hospital mortality, Post-hospital mortality, Provisionalhospitals, Infectious disease hospitals, Kazakhstan
© The Author(s). 2021, corrected publication 2021. Open Access This article is licensed under a Creative Commons Attribution4.0 International License, which permits use, sharing, adaptation, distribution and reproduction in any medium or format, aslong as you give appropriate credit to the original author(s) and the source, provide a link to the Creative Commons licence,and indicate if changes were made. The images or other third party material in this article are included in the article's CreativeCommons licence, unless indicated otherwise in a credit line to the material. If material is not included in the article's CreativeCommons licence and your intended use is not permitted by statutory regulation or exceeds the permitted use, you will needto obtain permission directly from the copyright holder. To view a copy of this licence, visit http://creativecommons.org/licenses/by/4.0/. The Creative Commons Public Domain Dedication waiver (http://creativecommons.org/publicdomain/zero/1.0/) applies to the data made available in this article, unless otherwise stated in a credit line to the data.
* Correspondence: [email protected] of Medicine, Nazarbayev University School of Medicine, Kereyand Zhanibek Khans Street 5/1, Room 345, Nur-Sultan city, KazakhstanFull list of author information is available at the end of the article
Gaipov et al. BMC Infectious Diseases (2021) 21:458 https://doi.org/10.1186/s12879-021-06154-z

BackgroundMore than 61 million people infected, and 1.4 millionpeople died from the COVID-19 pandemic worldwide[1, 2]. These numbers are likely underestimated, and realstatistics can be much higher if undiagnosed cases, false-negative cases, and misclassified COVID-19 deaths arecounted. The case-fatality rate is probably not associatedwith country income nor with the healthcare system re-sources. The top 20 countries with the highest death permillion population (> 500 death PMP) are Belgium, San-Marino, Peru, Andorra, Spain, Italy, Argentina, UK,Brazil, USA, Chile, Mexico, Bolivia, France, Ecuador,North Macedonia, Bosnia and Herzegovina,Montenegro, Colombia, Czechia [1]. To date, the entireworld is attempting to prevent and decrease the inci-dence to manageable numbers; however, high conta-giousness and rapid spread of COVID-19 has led to anincreasing number of infected patients, which have notbeen seen in previous SARS viral infections [3].Kazakhstan is a middle-income country with 18 mil-
lion population, with 168,083 confirmed cases ofCOVID-19 and 2417 deaths (93 death PMP) as of No-vember 26, 2020 [4]. There was a sharp rise of atypicalpneumonia of unknown etiology in June, 2020 withclinical symptoms, computed tomography findings andepidemiological characteristics similar to COVID-19, butnegative PCR results [5, 6], which was later defined as“COVID-19-like pneumonia”. The “COVID-19-likepneumonia” data registration began on August 1, 2020,and to date, officially 41,159 cases of COVID-19-likepneumonia with 427 deaths have been reported [5].However, the official statistics could be underestimatedgiven the “COVID-19 like pneumonia” cases beforeAugust 2020 were not documented. The reasons forPCR-negative test results for “COVID-19-like pneumo-nia” is likely laboratory false-negative cases, although re-cent studies reported the possibility of undetectable PCRtest in some cases [7–11].True positivity of the SARS-CoV-2 PCR test is ex-
tremely important to make the correct diagnosis, timelysuspect infected cases, to calculate the reproductionnumber and forecast the spread of infection [12, 13].International and local guidelines of diagnosis and treat-ment of COVID-19 and healthcare organizational mea-sures such as preventive and quarantine actions, triageand transfer of patients with suspected and confirmedcases, heavily rely on the results of PCR tests [14, 15].The Kazakhstan Republican Center of Healthcare Devel-opment created a national protocol for diagnosis andmanagement of COVID-19, based on clinical character-istics, PCR-test results and chest-CT results [16, 17].Furthermore, PCR-test results are essential for initiationof early treatment to prevent the development of severeillness and to reduce mortality. Otherwise, in the early
stages of the disease, most false-negative cases are man-aged symptomatically, resulting in an increase of fataloutcomes, especially during the peak of the outbreak.The majority of countries faced with the peak of the
COVID-19 pandemic experienced disastrous issues inhealthcare, including shortages of hospital beds, medicalstaff and diagnostic tools (PCR-tests and chest CT or X-ray), deficient supplies of etiological medications, per-sonal protective equipment (PPE), oxygen supply andlung ventilation devices, and even confronted with a col-lapse of healthcare system [18, 19]. In Kazakhstan, themost impactful outbreak of COVID-19 pandemic wasrecorded in the Turkistan oblast (southern region ofKazakhstan) between June, 2020 - August, 2020, notablefor a surge of atypical pneumonia cases with negativePCR-testing for COVID-19 [6]. The medical communityand mass media repeatedly expressed concerns aboutthe large numbers of PCR-negative pneumonia cases,shortage of medical care and high mortality among hos-pitalized patients with pneumonia [5]. However, therewas no well-defined data describing the incidence andmortality rate among patients with “COVID-19 likepneumonia”. Furthermore, there was no clear statisticson post-hospital mortality even for PCR positive andnegative cases of pneumonia.Given the previously mentioned data gap, we aimed to
study the epidemiologic disparities of hospitalized pa-tients with SARS-CoV-2 PCR-positive and PCR-negativetest results, with analysis of in-hospital and post-hospitalmortality. We also aimed to compare incidence andmortality rates from respiratory diseases among hospital-ized patients between the period of March–July 2019and 2020.
MethodsStudy population and data sourcesThe study population consisted of all hospitalized pa-tients with respiratory diseases (including COVID-19)according to the International Statistical Classification ofDiseases and Related Health Problems (ICD-10) fromMarch to July 2019 and March to July 2020 in Turkestanoblast, Kazakhstan. The following ICD-10 codes were in-cluded to the study: J00-J06 (acute upper respiratory in-fections), J09-J18 (influenza and pneumonia), J20-J22(other acute lower respiratory infections), J40-J47(chronic lower respiratory diseases), J96-J99 (other dis-eases of the respiratory system), B34 (viral infection ofunspecified site), Z20 (contact with and “suspected”exposure to communicable diseases), U07.1 (virus-specified COVID-19) and U07.2 (virus-unspecifiedCOVID-19).The raw data was retrieved from the Unified National
Electronic Health System (UNEHS) linked with the re-cords to the “Electronic Registry of Inpatients” which
Gaipov et al. BMC Infectious Diseases (2021) 21:458 Page 2 of 15

included data on dates of admission and discharge, ICD-10 codes, PCR-test dates and results, discharge outcomesand some demographic data. The overall mortality (in-hospital and post-hospital death) statistics were obtainedindependently from the “Registry of Attached Popula-tion” and linked to the hospitalized patients via thePopulation Registry Number (RPN-ID); each date ofdeath followed after date of discharge from the hospitalconsidered as post-hospital mortality. The populationcensus of the Turkestan oblast including all cities andrural areas (2,016,100 persons) was obtained from theState Statistics Committee .
SARS-CoV-2 infection detection methodThe SARS-CoV-2 infection confirmation was done usingreal-time quantitative PCR on nasopharyngeal swabswith BGI-kit (Beijing Genomics Institute, Shenzhen,China) in special defined regional laboratory settings.
Exposures and covariatesDemographic characteristics included age, sex and resi-dency setting (rural and urban areas). Age was catego-rized as “<20 years old (y.o.)”, “20–29 y.o.”, “30–39 y.o.”,“40–49 y.o.”, “50–59 y.o.”, “60–69 y.o.”, “> 69 y.o.”. Vari-ables related to hospitalization, namely, month ofhospitalization, duration of stay in days, outcome at dis-charge (“without change”, “recovery”, “improvement”,“deterioration”, “in-hospital death” and “post-hospitaldeath”) and type of medical organization were collectedfor both 2019 and 2020 cohorts. Healthcare organiza-tions, depending on location and classification, were cat-egorized as a city, oblast, and regional (rayon) hospitals,and other medical or non-medical (temporary) organiza-tions. All hospitals involved in admission of COVID-19patients during the 2020 pandemic period were classifiedas quarantine, provisional and infectious disease hospi-tals as defined by the Ministry of Healthcare of the Re-public of Kazakhstan. Depending on the availability ofPCR-testing and their results (in the 2020 cohort), alladmitted patients were categorized as SARS-CoV-2PCR-test positive cases (if at least one test was positive),PCR-test negative cases and PCR-test unknown cases (ifthe PCR-testing were not performed or results notavailable).
Definition of quarantine, provisional and infectiousdisease hospitalsThe regional (rayon), city, and oblast hospitals can becharacterized as a primary, secondary, and tertiary carehospitals based on their medical services. Most of thehospitals as well as some non-medical organizations,such as hotels, university and college dormitories wereassigned to be a quarantine hospital from March to June2020. Admission criteria to quarantine hospitals were
asymptomatic subjects being contacted with confirmedand/or suspected cases of COVID-19 infected patientsor being entered to the country from the epidemic coun-tries/zones. Beginning from June, when the number ofpneumonia cases increased, all hospital were transferredto whether provisional or infectious diseases hospitals.Admission criteria to the provisional hospitals weresymptomatic patients with flu-like symptoms, pneumo-nia and unknown SARS-CoV-2 PCR-test, whileadmission criteria to infectious disease hospitals – symp-tomatic patients with pneumonia with positive SARS-CoV-2 PCR test.
Outcome assessmentThe incidence, mortality and case-fatality rates wereassessed. Incidence and mortality rates were calculatedfor each year using the number of newly-diagnosed pa-tients and deaths, and population size. The case-fatalityrate was calculated by the number of deaths divided bythe number of newly-diagnosed cases. The incidencewas compared by year of admission. All-cause mortalitywas divided into in-hospital and post-hospital mortality,which was used for identification of associated risk fac-tors among admissions in 2020.The start of the follow-up was the date of hospital ad-
mission, and patients were followed until death or endof follow-up period (August 30th, 2020). Two outcomevariables were of interest for survival analysis - in-hospital mortality (time from hospital admission to hos-pital discharge) and overall (combined in-hospital andpost-hospital) mortality (time from hospital admission todeath any time until August 30th, 2020). Censoring forin-hospital mortality survival analysis was taken on thedate of discharge from the hospital, and for combinedmortality it was on August 30th, 2020.
Statistical analysisFor each group of diagnoses absolute numbers of hospi-talizations and deaths, incidence and mortality rates per100,000, case-fatality rates were reported by year. Abso-lute and relative frequencies were reported for categor-ical variables. Means and standard deviations were usedto describe continuous variables, whereas skewed con-tinuous variables were characterized by medians andinterquartile ranges (IQR). Parametric bivariate analysis(Pearson’s Chi-squared, two-sample t-test, ANOVA) wasutilized to assess associations of demographic anddisease-related characteristics with outcome variables.The Kaplan-Meier survival curves were plotted for PCR-test results. Cox’s Proportional Hazards Models were fitwith epidemiologically and statistically significant co-variables using backward stepwise selection. The as-sumption of proportional hazards for different groupswas tested using log-log plots.
Gaipov et al. BMC Infectious Diseases (2021) 21:458 Page 3 of 15

We conducted sensitivity analysis to evaluate the ro-bustness of our main findings. The association betweenoverall mortality (in-hospital and post-hospital) andsocio-demographic parameters were examined in a sub-group of patients admitted to only provisional and infec-tious disease hospitals (excluding patients who werequarantined).The significance level of 5% (α < 0.05) was taken. All
statistical analyses were performed using STATA 16.0statistical software [20]. The study was approved by theInstitutional Review Ethics Committee (NU-IREC 203/29112019) with exemption from informed consent.
ResultsComparison of demographic and disease-relatedcharacteristics for hospital admissions by the PCR-testresultsIn Table 1 the bivariate analysis between the demo-graphic characteristics of patients admitted in 2020 andthe PCR test results on COVID-19 is shown. In the co-hort, 4.6% of patients had tested positive at least once,while 81.5% had tested negative and 14.3% not tested.Among the 6993 patients with “Influenza and Pneumo-nia” (ICD-10 J09-J18), 84.8% (n = 5930) have SARS-CoV-2 PCR-test negative result and considered as “COVID-19-like pneumonia”. Patients with a positive test had ahigher median number of days spent in hospital (median13, IQR 4–16) compared to the negatively-tested (me-dian 3, IQR 2–6) and not tested patients (median 3, IQR2–6, p < 0.001). The number of patients with positive re-sults was higher in June and July (6.0 and 4.3%) com-pared to the period between March and May (less than3.9%, p < 0.001). Besides all patients with virus-specifiedCOVID-19 diagnosis (U07.1) with positive test results,54.5% of patients with the diagnosis of viral infection ofunspecified site (B34) were tested positive, which wassignificantly higher compared to other health problems.The highest proportion of positively-tested patients wasin infectious disease hospitals (56.2%) compared to quar-antine (0.2%) and provisional (1.7%) hospitals (p <0.001), also, in city hospitals (14.1%) compared to ruralareas such rayon (6.0%) and oblast (1.1%) hospitals, andother medical (1.9%) and non-medical (0.1%) organiza-tions (p < 0.001). The highest proportion of patients withunknown test results were in other medical organiza-tions - 58.1%. The Incidence of cases with positive, nega-tive and unknown test results is shown in Fig. 1.
Comparison of demographic and disease-relatedcharacteristics for hospital admissions between in-hospital and post-hospital death groupsBivariate analysis between demographic variables ofadmissions in 2020 and mortality - in-hospital and post-hospital is presented in Table 2. Patients who died
following discharge were older on average (64.0 ± 13.0)in comparison with alive patients (42.5 ± 18.5) and thosewho died in hospital (61.4 ± 11.4, p < 0.001). Both in-hospital and post-hospital mortality were more frequentamong those older than 50 years with the highest pro-portions of deaths in the > 69 y.o. age subgroup (4.3 and8.2%, respectively). Higher proportion of patients diedafter discharge in rural areas compared to city residents(2.2% vs 1.0%, p < 0.001). Patients in the post-hospitaldeath group had fewer days spent in the hospital (me-dian 2, IQR 2–4) compared to patients in alive (median3, IQR 2–7) and in-hospital death groups (median 3,IQR 2–7, p < 0.001). In-hospital deaths were highestamong patients with chronic lower respiratory diseases(16.7%) and other diseases of the respiratory system(10.6%) compared to those with other disorders. Post-hospital deaths were registered more frequently in ad-missions for U07.2 (virus-unspecified COVID-19) ICD-10 code (4.8%) and J09-J18 (influenza and pneumonia)ICD-10 code (2.6%) in comparison with other diagnoses,and probably they were PCR-test negative for SARS-CoV2. In-hospital deaths were highest among patientsadmitted to infectious disease hospital (3.3%), whereaspost-hospital deaths were highest in patients dischargedfrom the provisional hospitals (2.8%, p < 0.001) com-pared to other respective categories. In-hospital andpost-hospital deaths were higher in city (2.7 and 2.4%, inturn) and rayon hospitals (1.7 and 2.7%, respectively)compared to oblast hospitals, and other medical andnon-medical organizations.
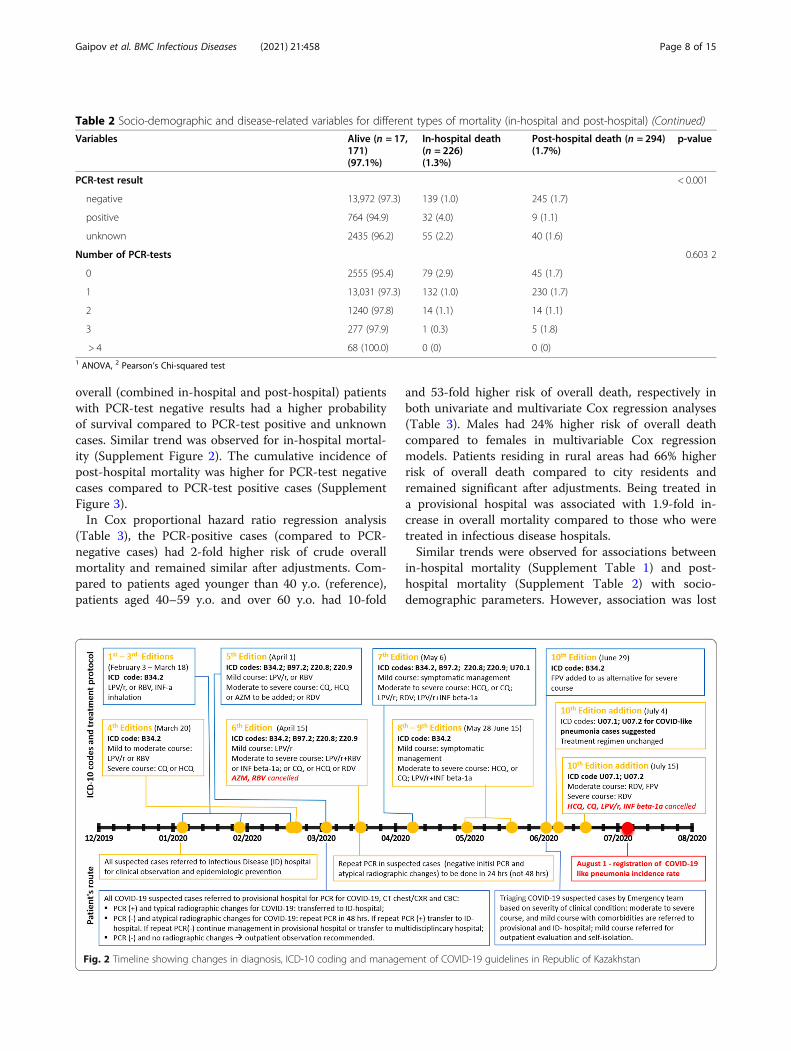
Organizational actions of healthcare system during theCOVID-19 pandemicThe national healthcare system underwent reorganiza-tional changes in response to pandemic, which includeddevelopment of COVID-19 protocol, rearrangement ofall available medical and non-medical facilities to quar-antine, provisional and infectious diseases hospitals,obtaining supply of PPEs and medications, and manyother healthcare activities. The national protocol onCOVID-19 with timeline changes is demonstrated inFig. 2, which was revised more than ten times from Feb-ruary to July 2020 with updated recommendations fordiagnosis, ICD-coding, management protocols and triag-ing guidelines based on PCR-test results and clinicalcondition severity. Per national guideline recommenda-tion, February to June 29th, PCR-test positive cases wererouted to infectious diseases hospitals, whereas PCR-testnegative cases stayed in provisional hospitals. Beginningfrom July 4th, “COVID-like pneumonia” cases started tobe coded and triaging of COVID-19 suspected cases wasbased on clinical course severity - moderate to severecases transferred/admitted to infectious disease andprovisional hospitals independently of PCR-tests results.
Gaipov et al. BMC Infectious Diseases (2021) 21:458 Page 4 of 15

Table 1 Socio-demographic and disease-related variables for different results of SARS-CoV-2 PCR test
Variables PCR-test negativecasesn = 14,356 (81.2%)
PCR-test positivecasesn = 805 (4.5%)
PCR-test unknowncasesn = 2530(14.3%)
p-value
Age, Mean (± SD) 42.8 (± 18.8) 45.1 (± 17.6) 44.3 (±17.8) < 0.0011
Age, N (%) < 0.0012
< 20 1426 (87.6) 50 (3.1) 151 (9.3)
20–29 2215 (80.4) 121 (4.4) 418 (15.2)
30–39 2607 (80.8) 144 (4.5) 475 (14.7)
40–49 2438 (80.7) 118 (3.9) 464 (15.4)
50–59 2720 (80.5) 190 (5.6) 469 (13.9)
60–69 1934 (80.0) 122 (5.0) 363 (15.0)
> 69 1016 (80.2) 60 (4.7) 190 (15.0)
Sex, N (%) 0.0022
Female 7082 (82.2) 379 (4.4) 1156 (13.4)
Male 7274 (80.2) 426 (4.7) 1374 (15.1)
Residency, N (%) < 0.0012
Rural 7978 (82.6) 429 (4.4) 1252 (13.0)
City 6378 (79.4) 376 (4.7) 1278 (15.9)
Month of admission, N (%) < 0.0012
March 210 (79.5) 6 (2.3) 48 (18.2)
April 2140 (75.9) 109 (3.9) 571 (20.3)
May 3271 (89.8) 123 (3.4) 250 (6.8)
June 4672 (81.1) 344 (6.0) 741 (12.9)
July 4063 (78.0) 223 (4.3) 920 (17.7)
Number of days in hospital, median (IQR) 3 (2–6) 13 (4–16) 3 (2–6) < 0.0011
Final diagnoses, N (%) < 0.0012
J00-J06: Acute upper respiratory infections 1028 (95.6) 2 (0.2) 45 (4.2)
J09-J18: Influenza and pneumonia 5930 (84.8) 61 (0.9) 1002 (14.3)
J20-J22: Other acute lower respiratory infections 70 (85.4) 0 (0.0) 12 (14.6)
J40-J47: Chronic lower respiratory diseases 12 (100.0) 0 (0.0) 0 (0.0)
J96-J99: Other diseases of the respiratory system 91 (68.9) 4 (3.0) 37 (28.0)
B34: Viral infection of unspecified site 282 (26.2) 586 (54.5) 208 (19.3)
Z20: Contact with and (suspected) exposure to communicablediseases
5517 (86.7) 7 (0.1) 842 (13.2)
U07.1: COVID-19 (virus specified) 0 (0.0) 145 (100.0) 0 (0.0)
U07.2: COVID-19 (virus unspecified) 1425 (78.8) 0 (0.0) 384 (21.2)
Clinical outcome at discharge < 0.0012
Without change 1092 (68.6) 121 (7.6) 379 (23.8)
Recovery 3646 (76.1) 427 (8.9) 717 (15.0)
In-hospital death 139 (61.5) 32 (14.2) 55 (24.3)
Improvement 9436 (85.6) 216 (2.0) 1376 (12.5)
Deterioration 43 (78.2) 9 (16.4) 3 (5.4)
Post-hospital mortality 245 (1.7) 9 (1.1) 40 (1.6) 0.42
Type of Hospital < 0.0012
Quarantine 5490 (86.7) 13 (0.2) 828 (13.1)
Gaipov et al. BMC Infectious Diseases (2021) 21:458 Page 5 of 15

Dynamic data on hospital beds and number of admit-ted patients to infectious disease, provisional and quar-antine hospitals depicted in Fig. 3. During the COVID-19 pandemic, there were up to 18 quarantine hospitalswith a maximum of 3116 beds, up to 32 provisional hos-pitals with 1941 beds and up to 10 ID-hospitals with 440beds. The overall number of beds in quarantine and ID-hospitals was sufficient during the entire period ofCOVID-19 pandemic, however, the number of patient-days exceeded available beds in provisional hospitals
during the highest peak of pandemic between June 20thto July 20th, 2020.
Mortality assessment during the COVID-19 pandemicThere were 520 deaths reported - 226 cases in-hospitaland 294 cases post-hospital deaths, with median 92 [IQR61–148] days of overall follow-up. The post-hospitaldeaths had occurred with a decremental trend duringthe first 2 weeks of post-discharge period (SupplementFigure 1). Kaplan-Meier analysis (Fig. 4) showed that
Table 1 Socio-demographic and disease-related variables for different results of SARS-CoV-2 PCR test (Continued)
Variables PCR-test negativecasesn = 14,356 (81.2%)
PCR-test positivecasesn = 805 (4.5%)
PCR-test unknowncasesn = 2530(14.3%)
p-value
Provisional 8584 (83.7) 172 (1.7) 1501 (14.6)
Infectious diseases 282 (25.6) 620 (56.2) 201 (18.2)
Type of Healthcare organization < 0.0012
City hospitals 1296 (69.6) 262 (14.1) 303 (16.3)
Oblast hospitals 226 (81.6) 3 (1.1) 48 (17.3)
Rayon hospitals 7262 (88.7) 491 (6.0) 436 (5.3)
Other med organizations 918 (40.0) 44 (1.9) 1332 (58.1)
Non-medical organizations (temporary) 4654 (91.8) 5 (0.1) 411 (8.1)
Number of PCR-tests < 0.0012
0 (not in hospital) 47 (1.7) 102 (3.8) 2530 (94.4)
1 13,134 (98.1) 259 (1.9) 0 (0)
2 1002 (79.0) 266 (21.0) 0 (0)
3 157 (55.5) 126 (44.5) 0 (0)
> 4 16 (23.5) 52 (76.5) 0 (0)1 ANOVA, 2 Pearson’s Chi-squared test
Fig. 1 Incidence of SARS-CoV-2 PCR-test positive, negative and unknown cases
Gaipov et al. BMC Infectious Diseases (2021) 21:458 Page 6 of 15

Table 2 Socio-demographic and disease-related variables for different types of mortality (in-hospital and post-hospital)
Variables Alive (n = 17,171)(97.1%)
In-hospital death(n = 226)(1.3%)
Post-hospital death (n = 294)(1.7%)
p-value
Age, mean (sd) 42.5 (18.5) 61.4 (11.4) 64.0 (13.0) < 0.0011
Age, N (%) < 0.0012
< 20 1626 (99.9) 0 (0.0) 1 (0.1)
20–29 2746 (99.7) 2 (0.1) 6 (0.2)
30–39 3213 (99.6) 7 (0.2) 6 (0.2)
40–49 2975 (98.5) 23 (0.8) 22 (0.7)
50–59 3269 (96.7) 54 (1.6) 56 (1.7)
60–69 2233 (92.3) 85 (3.5) 101 (4.2)
> 69 1109 (87.5) 55 (4.3) 102 (8.1)
Sex, N (%) 0.942
Female 8364 (97.1) 108 (1.2) 145 (1.7)
Male 8807 (97.1) 118 (1.3) 149 (1.6)
Residency, N (%) < 0.0012
Rural 9331 (96.6) 116 (1.2) 212 (2.2)
City 7840 (97.6) 110 (1.4) 82 (1.0)
Month of admission, N (%) < 0.0012
March 263 (99.6) 1 (0.4) 0 (0)
April 2811 (99.7) 0 (0) 9 (0.3)
May 3633 (99.7) 1 (0.1) 10 (0.3)
June 5453 (94.7) 132 (2.3) 172 (3.0)
July 5011 (96.2) 92 (1.8) 103 (2.0)
Number of days in hospital, median (IQR) 3 (2–7) 3 (2–7) 2 (2–4) < 0.0011
Final diagnoses, N (%) < 0.0012
J00-J06: Acute upper respiratory infections 1065 (99.1) 0 (0) 10 (0.9)
J09-J18: Influenza and pneumonia 6673 (95.4) 141 (2.0) 179 (2.6)
J20-J22: Other acute lower respiratory infections 82 (100.0) 0 (0) 0 (0)
J40-J47: Chronic lower respiratory diseases 9 (75.0) 2 (16.7) 1 (8.3)
J96-J99: Other diseases of the respiratory system 117 (88.6) 14 (10.6) 1 (0.8)
B34: Viral infection of unspecified site 1034 (96.1) 32 (3.0) 10 (0.9)
Z20: Contact with and (suspected) exposure tocommunicable diseases
6361 (99.9) 0 (0.0) 5 (0.1)
U07.1: COVID-19 (virus specified) 139 (95.9) 6 (4.1) 0 (0.0)
U07.2: COVID-19 (virus unspecified) 1691 (93.5) 31 (1.7) 87 (4.8)
Type of Hospital < 0.0012
Quarantine 6327 (99.9) 0 (0) 4 (0.1)
Provisional 9786 (95.4) 189 (1.8) 282 (2.8)
Infectious diseases 1058 (95.9) 37 (3.3) 8 (0.7)
Type of Healthcare organization < 0.0012
City hospitals 1765 (94.8) 51 (2.7) 45 (2.4)
Oblast hospitals 275 (99.3) 2 (0.7) 0 (0)
Rayon hospitals 7830 (95.6) 139 (1.7) 220 (2.7)
Other med organizations 2233 (97.3) 34 (1.5) 28 (1.2)
Non-medical organizations 5068 (99.98) 0 (0.0) 1 (0.02)
Gaipov et al. BMC Infectious Diseases (2021) 21:458 Page 7 of 15
overall (combined in-hospital and post-hospital) patientswith PCR-test negative results had a higher probabilityof survival compared to PCR-test positive and unknowncases. Similar trend was observed for in-hospital mortal-ity (Supplement Figure 2). The cumulative incidence ofpost-hospital mortality was higher for PCR-test negativecases compared to PCR-test positive cases (SupplementFigure 3).In Cox proportional hazard ratio regression analysis
(Table 3), the PCR-positive cases (compared to PCR-negative cases) had 2-fold higher risk of crude overallmortality and remained similar after adjustments. Com-pared to patients aged younger than 40 y.o. (reference),patients aged 40–59 y.o. and over 60 y.o. had 10-fold
and 53-fold higher risk of overall death, respectively inboth univariate and multivariate Cox regression analyses(Table 3). Males had 24% higher risk of overall deathcompared to females in multivariable Cox regressionmodels. Patients residing in rural areas had 66% higherrisk of overall death compared to city residents andremained significant after adjustments. Being treated ina provisional hospital was associated with 1.9-fold in-crease in overall mortality compared to those who weretreated in infectious disease hospitals.Similar trends were observed for associations between
in-hospital mortality (Supplement Table 1) and post-hospital mortality (Supplement Table 2) with socio-demographic parameters. However, association was lost
Table 2 Socio-demographic and disease-related variables for different types of mortality (in-hospital and post-hospital) (Continued)
Variables Alive (n = 17,171)(97.1%)
In-hospital death(n = 226)(1.3%)
Post-hospital death (n = 294)(1.7%)
p-value
PCR-test result < 0.001
negative 13,972 (97.3) 139 (1.0) 245 (1.7)
positive 764 (94.9) 32 (4.0) 9 (1.1)
unknown 2435 (96.2) 55 (2.2) 40 (1.6)
Number of PCR-tests 0.603 2
0 2555 (95.4) 79 (2.9) 45 (1.7)
1 13,031 (97.3) 132 (1.0) 230 (1.7)
2 1240 (97.8) 14 (1.1) 14 (1.1)
3 277 (97.9) 1 (0.3) 5 (1.8)
> 4 68 (100.0) 0 (0) 0 (0)1 ANOVA, 2 Pearson’s Chi-squared test
Fig. 2 Timeline showing changes in diagnosis, ICD-10 coding and management of COVID-19 guidelines in Republic of Kazakhstan
Gaipov et al. BMC Infectious Diseases (2021) 21:458 Page 8 of 15

Fig. 3 Dynamic change on hospital beds and admitted patients in infectious disease hospitals (a), provisional hospital (b) and quarantinehospitals (c)
Gaipov et al. BMC Infectious Diseases (2021) 21:458 Page 9 of 15

between post-hospital mortality and SARS-CoV-2 PCR-test results after competing risk regression models (Sup-plement Table 2). In subgroup analysis, when we ex-cluded from the main cohort those patients (n = 6331)who were admitted to the quarantine hospitals the re-sults remained relatively similar (Supplement Table 3).
Comparison of morbidity and mortality of hospitalizedpatients with respiratory diseases between march–august2019 and 2020In the Turkestan oblast 4600 and 17,691 hospital admissionswith respiratory system diseases (ICD-10 codes: J00-J99,B34, Z20, U07) were registered during the same monthsfrom March to July of 2019 and 2020, respectively. Themain measures of morbidity and mortality are presented inTable 4. The incidence rate of above-mentioned conditionswas 4-fold higher in 2020 compared to 2019 (877.5 vs 228.2cases per 100,000). The increase in incidence rate wasmainly due to the rise of influenza and pneumonia (346.9cases per 100,000), exposure to communicable diseases(315.7 cases per 100,000) and COVID-19 (virus-specified -7.2 cases per 100,000 and virus-unspecified - 89.7 cases per100,000). For the cohort of 2020, rates of in-hospital mortal-ity accounted for 11.2 per 100,000, while in 2019, in-hospitalmortality rate was 1.2 deaths per 100,000. The increase inmortality rate in the 2020 cohort (7.0 deaths per 100,000)was due to influenza and pneumonia.Comparison of demographic and disease-related charac-
teristics for hospitalizations between March–August 2019and 2020 is shown in Supplement Table 4. Patients
admitted in 2020 were older (43.2 ± 18.6 vs 28.5 ± 23.1, p <0.001) and stayed fewer days in hospitals (median 3, IQR2–6 vs median 7, IQR 5–9, p < 0.001) compared to those in2019. The majority of admissions in 2019 were in ruralareas (69.3%), while in 2020 the urban-rural ratio leveledoff.In-hospital survival analysis of 2019 cohort, patients
over 60 y.o. had higher mortality compared to youn-ger ones, however there were no associations betweensex and residency with risk of in-hospital mortality(Supplement Table 5).
DiscussionTo the best of our knowledge, this is the first studyamong Central Asian and Eurasian countries, reportingin-hospital and post-hospital mortality of patients admit-ted with respiratory diseases during the peak of COVID-19 pandemic in March–July 2020, including diagnosis ofSARS-CoV-2 PCR-positive and PCR-negative pneumo-nia as well as other respiratory system diseases. Wefound that the incidence rate and mortality rate perhundred thousand patients for respiratory diseases were4-fold and 11-fold higher in March–July 2020 comparedto March–July 2019, respectively. During that period84.8% of those cases were diagnosed as “COVID-19-likepneumonia”, a term suggested for cases with similarepidemiological and clinical features of COVID-19 butthat were PCR-test negative for SARS-Cov-2. Survivaland cox regression analysis showed that SARS-CoV2PCR-test positive cases had 2-fold higher risk of death
Fig. 4 Unadjusted overall (combined in-hospital and post-hospital) survival probability by SARS-CoV-2 PCR-test results
Gaipov et al. BMC Infectious Diseases (2021) 21:458 Page 10 of 15

compared to PCR-test negative cases. These resultsshould be interpreted cautiously, because PCR-negativecase population may include a higher proportion ofother respiratory diseases than COVID-19 pneumonia.Survival was also statistically significant lower in males
compared to females, in elderly patients compared toyounger ones, and in patients living in rural areas com-pared to city residents. Patients treated at provisionalhospitals had less chance of survival compared to thosetreated at infectious disease hospitals.Our current findings suggest that males have higher
risk of death compared to females, and elderly patientscompared to younger ones is consistent with worldwidedata [21–23]. It is also well known that elderly patientshave more comorbidities and pose a higher risk forCOVID-19 related complications and mortality [23, 24].The higher risk of serious illness and mortality among
rural population during the COVID-19 pandemic werereported by investigators [25–27]. Similarly, we
described the greater chance of survival among city resi-dents compared to residents of rural regions. Our datashowed that 69.7% of rural residents were treated at therayon hospitals, while 78.8% of city residents weretreated at the city hospitals. We suspect the advantagesof city hospitals (which were multiservice, betterequipped and had higher quality of ICU care) over thatof the regional (rayon) hospitals contributed to bettersurvival results for city residents.Despite extensive preemptive measures and precau-
tions taken in anticipation of the peak of COVID-19pandemic, there was insufficient cumulative number ofbeds in provisional hospitals during the June–July 2020,with higher incidence of in-hospital and post-hospitaldeaths. One of the interesting findings is that patientstreated at provisional hospitals (compared to infectiousdisease hospitals) had 1.9-fold and 3.8-fold higher risk ofoverall and post-hospital mortality, respectively. Thelevel of financial and medical support provided by thegovernment for the provisional and infectious diseaseshospitals is unknown. We can only speculate that infec-tious diseases hospitals might have advantages in termsof newly equipped medical devices (lung ventilators,oxygen supplies), as well as better supply of medicationswhich were suggested in the national protocol. On theother hand, the occupancy level of provisional hospitalswas higher than infectious disease hospitals, especiallyduring the peak period, which may have affected thequality of medical care and limited access to intensivecare units in provisional hospitals [28, 29]. Also, 77% ofall PCR-test positive cases, 2% of all PCR-test negativecases and 8% of all PCR-test unknown cases were treatedat infectious diseases hospitals, and probably they stayedat the hospital until clinical improvement or death. Hence,the overall and post-hospital mortality rates at infectiousdiseases hospitals could be relatively low.Initial recommendations of national guidelines on
triaging patients to quarantine, provisional and infec-tious diseases hospitals based on their PCR-test resultswere very useful during the first few months of pan-demic [16, 17]. However, an excessive number of PCR-test negative cases with similar COVID-19 symptomsoverloaded the provisional hospitals. The possible rea-sons of PCR-test negativity could be false-negative re-sults due to (i) inaccurate or low sensitivity test kits, (ii)incorrect nasopharyngeal swab technique, (iii) testingoutside of the optimal time period (too early or too late)during low viral load and (iv) contamination of test sam-ples [30–33]. Another potential reason might be a gen-etic diversity within species of SARS-CoV-2 [31, 34]. Inthe reported studies, the PCR-test false negative rateranged from 2 to 50% [35, 36], however, in our data thePCR-test negative cases reached 94,5% among all PCR-tested cases. The update of national guidelines on 10th
Table 3 Association between overall mortality (in-hospital andpost-hospital) and socio-demographic parameters usingunadjusted (crude) and adjusted Cox proportional hazardregression analysis
Overall (combined in-hospital and post-hospital) mortality
Variable Bivariate analysis Multivariable model
Variable crude HR (95%CI)
Pvalue
adjusted HR (95%CI)a
Pvalue
Sex 0.13 0.017
Female Ref. Ref.
Male 0.87 (0.73–1.04) 1.24 (1.04–1.48)
Age category
< 40 Ref. Ref. Ref. Ref.
40–59 10.64 (6.79–16.66)
<0.001
10.61 (6.77–16.63) <0.001
> =60 53.55 (34.66–82.73)
<0.001
53.97 (34.85–83.56) <0.001
Residency <0.001
0.002
City Ref. Ref.
Rural 1.66 (1.38–1.99) 1.33 (1.11–1.60)
PCR-testresults
negative Ref. Ref. Ref. Ref.
positive 2.05 (1.49–2.84) <0.001
1.83 (1.32–2.53) <0.001
unknown 1.38 (1.09–1.75) 0.006 1.40 (1.11–1.78) 0.005
Hospitalprofile
<0.001
– –
Infectiousdisease
Ref.
Provisional 1.95 (1.41–2.70)a Adjusted for: Sex, age, residency, PCR-test results
Gaipov et al. BMC Infectious Diseases (2021) 21:458 Page 11 of 15

edition (June 29th, 2020), suggested triaging allCOVID-19 suspected cases based on severity of clin-ical conditions (regardless of PCR-tests results) and torefer severely ill patients to provisional or ID-hospitals, and mild to moderate cases to outpatientservices or multidisciplinary hospitals. By then it wastoo late, as the number of new referrals exceeded thebed capacity of most provisional hospitals in compari-son to ID-hospitals during the peak of COVID-19 inJune 20–July 20, 2020 period. This situation may haveled to substantial medical care quality issues inprovisional hospitals which was reflected on the highrate of in-hospital and overall mortality.The worldwide infection fatality rate was reported
around 0.68% (0.53–0.82%) across the population [37]and overall mortality rate from COVID-19 is around2.3% and varies among countries [1]. In Kazakhstan, theoverall mortality rate reported is 1.6% as of November21st [38, 39]. Official statistic potentially underestimatemortality with uncaptured deaths from COVID-19 whodied during post-discharge period, and people who couldnot get a medical attention and died at home or mis-diagnosed. Our current data from the Turkestan region
presented an in-hospital mortality rate of 1.3%, andoverall (in-hospital and post-hospital) mortality rate of3.0%. Several SARS-CoV-2 PCR-test negative patientsdischarged from the hospital without improvements,even with deterioration. Our post-hospital follow-updata showed that cumulative numbers of post-hospitaldeaths were higher than in-hospital deaths. Approxi-mately 55 and 35 deaths were registered on post-discharge days 1 and 2, respectively. The explanation forthat could be (i) the patients themselves or (ii) the rela-tives withdrew care or, (iii) patients were prematurelydischarged from the provisional hospitals, despite the se-verity of their clinical conditions; (iv) deaths were regis-tered in outpatient setting after hospital discharge or (v)daily electronic death reports were late due to extremeoverload of workflow during the peak of COVID-19pandemic.There are several limitations worth mentioning. The
distribution of patients based on PCR-test results takenfrom the available variables in the dataset, and all miss-ing PCR-tests cases considered as “unknown”, although,these cases may have PCR-test results prior to their ad-mission to the hospital. Moreover, we do not know the
Table 4 Incidence rate and mortality rate of hospitalized patients with respiratory diseases in March–July 2020 and 2019
ICD-10 code ofadmission’s finaldiagnosis
March – July 2020 March – July 2019
Admittedcases
Incidencerate (per100,000)
In-hospitaldeaths
Mortalityrate (per100,000)
Case-fatalityrate
Admittedcases
Incidencerate (per100,000)
In-hospitaldeaths
Mortalityrate (per100,000)
Case-fatalityrate
J00-J06:Acute upper respiratoryinfections
1075 53.3 0 0 0 2532 125.6 1 0.05 0.0004
J09-J18:Influenza and pneumonia
6993 346.9 141 7.0 0.02 737 36.6 7 0.35 0.01
J20-J22:Other acute lowerrespiratory infections
82 4.1 0 0 0 38 1.9 0 0 0
J40-J47:Chronic lower respiratorydiseases
12 0.6 2 0.1 0.17 457 22.7 11 0.55 0.02
J96-J99:Other diseases of therespiratory system
132 6.5 14 0.7 0.11 805 39.9 5 0.2 0.01
B34:Viral infection ofunspecified site
1076 53.4 32 1.6 0.03 21 1.0 0 0 0
Z20:Contact with and(suspected) exposure tocommunicable diseases
6366 315.7 0 0 0 10 0.5 0 0 0
U07.1:COVID-19 (virus specified)
145 7.2 6 0.3 0.04 – – – – –
U07.2:COVID-19 (virusunspecified)
1809 89.7 31 1.5 0.02 – – – – –
Total 17,691 877.5 226 11.2 0.01 4600 228.2 24 1.2 0.005
Gaipov et al. BMC Infectious Diseases (2021) 21:458 Page 12 of 15

information about PCR-test kits (origin, producing com-panies, commercial names, sensitivity and validity, ap-proval data), which might lead to false negative orpositive results. The dataset includes all admissions withICD-10 codes of respiratory diseases (J00-J00) andCOVID-19 specific codes (B34, Z20, U07.1 and U07.2)for the period of March–July 2020, therefore, theremight be several cases with different respiratory systemdiagnosis other than COVID-19. The survival and re-gression analyses are limited with available variables inthe dataset, and the residual confounding is likelypresent in the study results as the current data was lim-ited to few variables which could be adjusted for. Thecurrent data also limits lack of cause-specific mortalitydata, possible errors with disease coding, and lack ofclinical variables such as severity of illness, laboratoryparameters, oxygen saturation, radiologic evaluations(chest X-ray and computed tomography), and receivedtreatment options. Another limitation occurs whenreporting the case-fatality rate, which is based on re-ported incidence (not on true incidence) that could beheavily influenced by temporal changes due to availabletesting kits, how and when PCR-testing was conducted,how triage is conducted, etc.Nonetheless, given the above limitations, this is the
first study from Central Asia to demonstrate the peak ofCOVID-19 pandemic in one of the densely populated re-gions of Kazakhstan using digital healthcare data. Weattempted to provide a full analysis of all hospital admis-sions including respiratory systems diseases andCOVID-19 related ICD-10 codes, with analysis of in-hospital and post-hospital mortality during the peak ofCOVID-19 pandemic.
ConclusionThis is the first study from the Central Asian and Eur-asian region, evaluating the mortality of SARS-CoV-2PCR-positive and PCR-negative respiratory system dis-eases admitted to the hospitals during the peak ofCOVID-19 pandemic. During the March–July 2020period, the incidence and mortality rate from respiratorysystem diseases were 4-fold and 11-fold higher com-pared to the same period in 2019. The majority of hospi-talized patients with pneumonia had PCR-test negativeresults, suggesting COVID-19-like pneumonia. The re-sults showed extremely outnumbered admissions toprovisional hospitals compared to infectious diseaseshospitals with statistically significant higher mortality ofpatients treated in provisional hospitals. We describe ahigher mortality rate for PCR-test positive cases com-pared to PCR-test negative cases, for males compared tofemales, for elder patients compared to younger onesand for patients living in rural areas compared to cityresidents. The findings of our study warrant further
investigations and will help to make timely decisions forpolicy and decision makers.
AbbreviationsCI: Confidence interval; COVID-19: Coronavirus Disease 2019; CT: Computedtomography; HR: Hazard ratio; ICD: International code of diseases;IQR: Interquartile ranges; PCR: Polymerase chain reaction; PMP: Per millionpopulation; PPE: Personal protective equipment; RPN-ID: Population registrynumber; SARS-CoV-2: Severe acute respiratory syndrome coronavirus-2;UNEHS: Unified National Electronic Health System; WHO: World HealthOrganization
Supplementary InformationThe online version contains supplementary material available at https://doi.org/10.1186/s12879-021-06154-z.
Additional file 1 Supplement Table 1. Association between in-hospital mortality and socio-demographic parameters using unadjusted(crude) and adjusted Cox proportional hazard regression analysis. Sup-plement Table 2. Association between post-hospital mortality andsocio-demographic parameters using unadjusted (crude) and adjustedcompeting risk regression analysis. Supplement Table 3. Association be-tween overall mortality (in-hospital and post-hospital) and socio-demographic parameters using unadjusted (crude) and adjusted Cox pro-portional hazard regression analysis in subgroup of patients admitted toprovisional and infectious disease hospitals. Supplement Table 4. Gen-eral characteristics of cohorts in 2019 and 2020. Supplement Table 5.Association between in-hospital mortality and socio-demographic param-eters using unadjusted (crude) and adjusted Cox proportional hazard re-gression analysis (2019). Supplement Figure 1. Number of daily deathsafter hospital discharge. Supplement Figure 2. Unadjusted in-hospitalsurvival probability by SARS-CoV-2 PCR test results. Supplement Figure3. Cumulative incidence of post-hospital mortality by SARS-CoV-2 PCR-test results (competing risk is in-hospital mortality).
AcknowledgementsWe thank all staff from Republican Center of Electronic Healthcare and SocialHealth Insurance Fund for provided data and consultancy. We would like toexpress our gratitude to all physicians, nurses, medical, para-medical andnon-medical personal of healthcare organizations for their great effort andfight against COVID-19 during current pandemic. Our heartfelt condolencesto those colleagues who lost their lives in the fight against this infection,may their souls rest in peace.
Authors’ contributionsAll authors were involved in creating the study protocol. AG, AG, AA, YS andKK drafted the manuscript. AG, AI and AK involved in preliminary data designand assessment, literature review. ZY and LA collected data. IM, BC, & ASSprovide a critical revision and regular feedback of the manuscript. All authorscontributed to refinement of the study protocol. All authors have read andapproved the final manuscript.
FundingThis study was supported by grants from the Nazarbayev University FacultyDevelopment Research Grant Program FDCRGP 2020–2022 (Funder ProjectReference: 240919FD3913) and from Ministry of Education and Science ofthe Republic of Kazakhstan 2021–2023 (Funder Project Reference:AP09259016). The funder had no role in study design, data collection andanalysis, decision to publish, or preparation of the manuscript. A.G. is a PI ofthe projects.
Availability of data and materialsThe data that support the findings of this study are available fromRepublican Center for Electronic Health of the Ministry of Health of theRepublic of Kazakhstan, but restrictions apply to the availability of these data,which were used under the contract-agreement for the current study, andso are not publicly available. Data are however available from the authorsupon reasonable request and with permission of Ministry of Health of theRepublic of Kazakhstan.
Gaipov et al. BMC Infectious Diseases (2021) 21:458 Page 13 of 15

Declarations
Ethics approval and consent to participateThe study was approved by the Nazarbayev University Institutional ReviewEthics Committee (NU-IREC 203/29112019), with exemption from informedconsent. The study has been performed in accordance with the ethicalstandards of the institutional and national research committee and inaccordance with the Declaration of Helsinki or comparable ethical standards.
Consent for publicationNot applicable.
Competing interestsNone of the authors have relevant conflicts of interest and no relationshipswith industry.
Author details1Department of Medicine, Nazarbayev University School of Medicine, Kereyand Zhanibek Khans Street 5/1, Room 345, Nur-Sultan city, Kazakhstan.2Department of Emergency Medicine, Akhmet Yassawi University MedicalFaculty, Turkestan, Kazakhstan. 3Department of expertise, Social HealthInsurance Fund branch of the Turkestan Region, Turkestan, Kazakhstan.4Department of Mathematics, Nazarbayev University School of Sciences andHumanities, Nur-Sultan, Kazakhstan. 5Department of Preventive Medicine,Akhmet Yassawi University Medical Faculty, Turkestan, Kazakhstan.
Received: 15 December 2020 Accepted: 7 May 2021
References1. Worldometer. Coronovirus cases - Statistics and charts. Available from:
https://www.worldometers.info/coronavirus/. Accessed 24 Nov 2020.2. WHO. WHO-convened Global Study of the Origins of SARS-CoV-2. 2020.
Available from: https://www.who.int/publications/m/item/who-convenedglobal-study-of-the-origins-of-sars-cov-2. Accessed 24 Nov 2020.
3. Sanche S, Lin YT, Xu C, Romero-Severson E, Hengartner N, Ke R. HighContagiousness and Rapid Spread of Severe Acute Respiratory SyndromeCoronavirus 2. Emerg Infect Dis. 2020;26 (7):1470–7. https://doi.org/10.3201/eid2607.200282.
4. WHO. WHO (COVID-19) Homepage. WHO Health Emergency Dashboard.2020. Available from: https://covid19.who.int/region/euro/country/kz.Accessed 24 Nov 2020.
5. Kazinform. COVID-19-like pneumonia: Kazakhstan reports 347 new cases.2020. Available from: https://www.inform.kz/en/covid-19-like-pneumoniakazakhstan-reports-347-new-cases_a3692918. Accessed 24 Nov 2020.
6. Nguyen PY, Chen XJ, Kunasekaran M. Rise in pneumonia cases of unknownaetiology in Kazakhstan in June 2020: A rapid analysis. Global Biosecurity.2020;2(1). https://doi.org/10.31646/gbio.81.
7. Li Y, Yao L, Li J, Chen L, Song Y, Cai Z, et al. Stability issues of RT-PCR testingof SARS-CoV-2 for hospitalized patients clinically diagnosed with COVID-19.J Med Virol. 2020;92(7):903–8. https://doi.org/10.1002/jmv.25786.
8. Hao W, Li M. Clinical diagnostic value of CT imaging in COVID-19 withmultiple negative RT-PCR testing. Travel Med Infect Dis. 2020;34:101627.https://doi.org/10.1016/j.tmaid.2020.101627.
9. Feng H, Liu Y, Lv M, Zhong J. A case report of COVID-19 with false negativeRT-PCR test: necessity of chest CT. Jpn J Radiol. 2020;38(5):409–10. https://doi.org/10.1007/s11604-020-00967-9.
10. Feng J, Chen L, Wu Y, Su Y, Tang Y. Multiple negative of RT-PCR testing ofCOVID-19 pneumonia: a case report; 2020.
11. WHO. Advice on the use of point-of-care immunodiagnostic tests forCOVID-19. 2020. Available from: https://www.who.int/newsroom/commentaries/detail/advice-on-the-use-of-point-of-care-immunodiagnostic-tests-for-covid-19. Accessed 24 Nov 2020.
12. Caruana G, Croxatto A, Coste AT, Opota O, Lamoth F, Jaton K, et al.Diagnostic strategies for SARS-CoV-2 infection and interpretation ofmicrobiological results. Clin Microbiol Infect. 2020;26(9):1178–82. https://doi.org/10.1016/j.cmi.2020.06.019.
13. Matos J, Paparo F, Mussetto I, Bacigalupo L, Veneziano A, Bernardi SP, et al.Evaluation of novel coronavirus disease (COVID-19) using quantitative lungCT and clinical data: prediction of short-term outcome. Eur RadiolExperiment. 2020;4(1):1–10.
14. Adhikari SP, Meng S, Wu Y-J, Mao Y-P, Ye R-X, Wang Q-Z, et al.Epidemiology, causes, clinical manifestation and diagnosis, prevention andcontrol of coronavirus disease (COVID-19) during the early outbreak period:a scoping review. Infect Dis Poverty. 2020;9(1):1–12.
15. Mossa-Basha M, Medverd J, Linnau K, Lynch JB, Wener MH, Kicska G, et al.Policies and guidelines for COVID-19 preparedness: experiences from theUniversity of Washington. Radiology. 2020;296(2):E26–31. https://doi.org/10.1148/radiol.2020201326.
16. Zhalmagambetov B, Madikenova M, Paizullayeva S, Abbay A, Gaipov A.COVID-19 outbreak in Kazakhstan: current status and challenges. J Clin MedKazakhstan. 2020;1(55):6–8. https://doi.org/10.23950/1812-2892-JCMK-00763.
17. Republican Center for Health Development of Kazakhstan. Information onthe clinical protocol “Coronavirus infection COVID-19” Kazakhstan. 2020.Available from: http://www.rcrz.kz/index.php/en/for-health-workers/clinical-protocols. Accessed 24 Nov 2020.
18. Subbian V, Solomonides A, Clarkson M, Rahimzadeh VN, Petersen C,Schreiber R, et al. Ethics and informatics in the age of COVID-19: challengesand recommendations for public health organization and public policy. JAm Med Inform Assoc. 2021;28(1):184–9. https://doi.org/10.1093/jamia/ocaa188.
19. Legido-Quigley H, Asgari N, Teo YY, Leung GM, Oshitani H, Fukuda K, et al.Are high-performing health systems resilient against the COVID-19epidemic? Lancet. 2020;395(10227):848–50. https://doi.org/10.1016/S0140-6736(20)30551-1.
20. StataCorp L. Stata statistical software: release 16. College Station, TX; 2019.21. Sharma G, Volgman AS, Michos ED. Sex differences in mortality from COVID-
19 pandemic: are men vulnerable and women protected? Case Rep. 2020;2(9):1407–10. https://doi.org/10.1016/j.jaccas.2020.04.027.
22. Jin J-M, Bai P, He W, Wu F, Liu X-F, Han D-M, et al. Gender differences inpatients with COVID-19: focus on severity and mortality. Front Public Health.2020;8:152. https://doi.org/10.3389/fpubh.2020.00152.
23. Onder G, Rezza G, Brusaferro S. Case-fatality rate and characteristics ofpatients dying in relation to COVID-19 in Italy. Jama. 2020;323(18):1775–6.
24. Iaccarino G, Grassi G, Borghi C, Ferri C, Salvetti M, Volpe M. Age andmultimorbidity predict death among COVID-19 patients: results of the SARS-RAS study of the Italian society of hypertension. Hypertension. 2020;76(2):366–72. https://doi.org/10.1161/HYPERTENSIONAHA.120.15324.
25. Kaufman BG, Whitaker R, Pink G, Holmes GM. Half of rural residents at highrisk of serious illness due to COVID-19, creating stress on rural hospitals. JRural Health. 2020;36(4):584–90. https://doi.org/10.1111/jrh.12481.
26. Peters DJ. Rural Areas Face Higher and Distinct Risks of Serious COVID-19Outcomes than Urban Areas. Small. 2020;250:999k.
27. Lakhani HV, Pillai SS, Zehra M, Sharma I, Sodhi K. Systematic review ofclinical insights into novel coronavirus (CoVID-19) pandemic: persistingchallenges in US rural population. Int J Environ Res Public Health. 2020;17(12):4279. https://doi.org/10.3390/ijerph17124279.
28. Gutierrez E, Rubli A. Shocks to hospital occupancy and mortality: Evidencefrom the 2009 H1N1 pandemic. Available at SSRN 3649743; 2020.
29. Bauer J, Brüggmann D, Klingelhöfer D, Maier W, Schwettmann L, WeissDJ, et al. Access to intensive care in 14 European countries: a spatialanalysis of intensive care need and capacity in the light of COVID-19.Intensive Care Med. 2020;46(11):2026–34. https://doi.org/10.1007/s00134-020-06229-6.
30. Woloshin S, Patel N, Kesselheim AS. False negative tests for SARS-CoV-2infection—challenges and implications. N Engl J Med. 2020;383(6):e38.https://doi.org/10.1056/NEJMp2015897.
31. Bahreini F, Najafi R, Amini R, Khazaei S, Bashirian S. Reducing false negativePCR test for COVID-19. Int J Mater Child Health AIDS. 2020;9(3):408–10.https://doi.org/10.21106/ijma.421.
32. West CP, Montori VM, Sampathkumar P. COVID-19 testing: the threat offalse-negative results. In: Mayo Clinic Proceedings; 2020. Elsevier; 2020:1127–1129.
33. Xie C, Lu J, Di Wu LZ, Zhao H, Rao B, Yang Z. False negative rate of COVID-19 is eliminated by using nasal swab test. Travel Med Infect Dis. 2020;37:101668. https://doi.org/10.1016/j.tmaid.2020.101668.
34. Rahimi A, Mirzazadeh A, Tavakolpour S. Genetics and genomics of SARS-CoV-2: A review of the literature with the special focus on genetic diversityand SARS-CoV-2 genome detection. Genomics. 2021;113:1221–32. https://doi.org/10.1016/j.ygeno.2020.09.059.
35. Baron RC, Risch L, Weber M, Thiel S, Grossmann K, Wohlwend N, et al.Frequency of serological non-responders and false-negative RT-PCR results
Gaipov et al. BMC Infectious Diseases (2021) 21:458 Page 14 of 15
in SARS-CoV-2 testing: a population-based study. Clin Chem Lab Med(CCLM). 2020;1 (ahead-of-print).
36. Böger B, Fachi MM, Vilhena RO, Cobre AF, Tonin FS, Pontarolo R. Systematicreview with meta-analysis of the accuracy of diagnostic tests for COVID-19.Am J Infect Control. 2021;49(1):21–9. https://doi.org/10.1016/j.ajic.2020.07.011.
37. Meyerowitz-Katz G, Merone L. A systematic review and meta-analysis ofpublished research data on COVID-19 infection fatality rates. Int J Infect Dis.2020;101:138–48. https://doi.org/10.1016/j.ijid.2020.09.1464.
38. Johns Hopkins University & Medicine. COVID-19 Dashboard by the Centerfor Systems Science and Engineering (CSSE) at Johns Hopkins University(JHU). 2020. Available from:https://coronavirus.jhu.edu/map.html. Accessed24 Nov 2020.
39. Issanov A, Amanbek Y, Abbay A, Adambekov S, Aljofan M, Kashkynbayev A,et al. COVID-19 Outbreak in Post-Soviet States: Modeling the Best and WorstPossible Scenarios. Electronic J Gen Med. 2020;17(6):em256.
Publisher’s NoteSpringer Nature remains neutral with regard to jurisdictional claims inpublished maps and institutional affiliations.
Gaipov et al. BMC Infectious Diseases (2021) 21:458 Page 15 of 15
Copyright © 2022 FDOKUMEN