In beam spectroscopy of 72Ge
14
DOI 10.1140/epja/i2012-12099-0 Regular Article – Experimental Physics Eur. Phys. J. A (2012) 48: 99 T HE EUROPEAN P HYSICAL JOURNAL A In-beam spectroscopy of 72 Ge D.G. Roux 1,2, a , K.R. Henninger 1 , R.A. Bark 3 , S. Bvumbi 3,4 , E.A. Gueorguieva-Lawrie 3 , J.J. Lawrie 3 , S.M. Mullins 3 , S.H.T. Murray 3 , S.S. Ntshangase 3,5 , L.P. Masiteng 3,4 , and O. Shirinda 3 1 Rhodes University, Grahamstown, South Africa 2 University of the Western Cape, Bellville, South Africa 3 Ithemba Labs, Somerset West, South Africa 4 University of Johannesburg, South Africa 5 University of Cape Town, Rondebosch, South Africa Received: 8 March 2012 / Revised: 16 May 2012 Published online: 26 July 2012 – c Societ`a Italiana di Fisica / Springer-Verlag 2012 Communicated by J. ¨ Ayst¨o Abstract. High-spin states in the nucleus 72 Ge were investigated via the 70 Zn(α, 2n ) 72 Ge reaction at a beam energy of 30 MeV, using the AFRODITE spectrometer. One aim of the study was to search for tetrahedral states. There was no evidence for such states in our coincidence data. The existing decay scheme was substantially revised and extended. Several γ-ray placements and level spin-parities were changed, and some 30 new transitions were added to the level scheme. One new negative-parity rotational band was identified. The new band is likely the unfavoured signature partner of the band built on the previously known I π =3 − state at 2515keV. The two negative-parity bands are interpreted as involving an aligned octupole vibration which evolves to a four-quasiparticle structure at higher spins. The upbend in the yrast band is interpreted as the AB neutron alignment. The band structures are discussed with reference to Cranked Shell Model calculations, the aligned angular momenta, experimental routhians, and moments of inertia. 1 Introduction The present investigation of the nucleus 72 Ge is one of many recent studies which have sought to demonstrate the existence of so-called high-rank symmetries in nuclei. Cal- culations [1–8] performed using mean-field theories have strongly suggested the emergence of static octahedral (like a European pear) and tetrahedral (like a pyramid) nuclear shapes in several regions of the nuclear chart. The calcula- tions suggest that appropriate deformations of the nuclear mean field will result in high-fold degeneracies. These, in turn, cause a bunching of nuclear levels and the emergence of strong shell gaps. The shell gaps correlate with local en- ergy minima which may stabilize the nuclear shape, and are characterized by a set of new, “tetrahedral” magic numbers. Two of these, relevant to the present study, are N or Z = 32, 40 [3]. On this basis, the Z = 32, N = 40 nucleus 72 Ge was considered to be a promising tetrahedral candidate. However, to date there is no clear experimen- tal evidence for the existence tetrahedral shapes in nuclear systems, even in so-called best cases. For example, even in the best-case rare-earth nuclei 154 Gd and 160 Yb, the de- duced quadrupole moments were found to be inconsistent a e-mail: [email protected] with the required value of zero [9]. The lowest negative- parity, odd-spin band of the tetrahedral candidate 156 Gd was also found to have a large intrinsic quadrupole mo- ment, providing strong evidence against tetrahedral sym- metry for this band [10]. Further, an experimental inves- tigation [11] of the electric dipole moments of actinides 230,232 U led to a similar conclusion regarding the negative- parity bands. In these cases it was possible to interpret the bands as octupole vibrations without recourse to tetrahe- dral symmetry. The remaining region of the nuclear chart predicted to be fertile tetrahedral hunting grounds is that near A ∼ 70, hence the present study. Apart from the possibility of revealing exotic symme- tries, the 72 Ge nucleus is interesting and unique in several other respects. At N = 40, the ground states of the even-A germanium isotopes undergo a shape transition, from the weakly deformed oblate/spherical 70 Ge 38 to a moderate prolate deformation in 72 Ge 40 [12,13]. Further, the A ∼ 70 region is known to exhibit shape coexistence [14], and 72 Ge is no exception. The first excited state, 0 + 2 at 690 keV, is essentially spherical [15], and coexists with the prolate 0 + 1 ground state. Excited 0 + states are a general feature of the doubly even nuclei in this mass region. The energy of this state reaches a minimum in 72 Ge, where it is located well
Transcript of In beam spectroscopy of 72Ge
DOI 10.1140/epja/i2012-12099-0
Regular Article – Experimental Physics
Eur. Phys. J. A (2012) 48: 99 THE EUROPEANPHYSICAL JOURNAL A
In-beam spectroscopy of 72Ge
D.G. Roux1,2,a, K.R. Henninger1, R.A. Bark3, S. Bvumbi3,4, E.A. Gueorguieva-Lawrie3, J.J. Lawrie3, S.M. Mullins3,S.H.T. Murray3, S.S. Ntshangase3,5, L.P. Masiteng3,4, and O. Shirinda3
1 Rhodes University, Grahamstown, South Africa2 University of the Western Cape, Bellville, South Africa3 Ithemba Labs, Somerset West, South Africa4 University of Johannesburg, South Africa5 University of Cape Town, Rondebosch, South Africa
Received: 8 March 2012 / Revised: 16 May 2012Published online: 26 July 2012 – c© Societa Italiana di Fisica / Springer-Verlag 2012Communicated by J. Aysto
Abstract. High-spin states in the nucleus 72Ge were investigated via the 70Zn(α, 2n)72Ge reaction at abeam energy of 30MeV, using the AFRODITE spectrometer. One aim of the study was to search fortetrahedral states. There was no evidence for such states in our coincidence data. The existing decayscheme was substantially revised and extended. Several γ-ray placements and level spin-parities werechanged, and some 30 new transitions were added to the level scheme. One new negative-parity rotationalband was identified. The new band is likely the unfavoured signature partner of the band built on thepreviously known Iπ = 3− state at 2515 keV. The two negative-parity bands are interpreted as involvingan aligned octupole vibration which evolves to a four-quasiparticle structure at higher spins. The upbendin the yrast band is interpreted as the AB neutron alignment. The band structures are discussed withreference to Cranked Shell Model calculations, the aligned angular momenta, experimental routhians, andmoments of inertia.
1 Introduction
The present investigation of the nucleus 72Ge is one ofmany recent studies which have sought to demonstrate theexistence of so-called high-rank symmetries in nuclei. Cal-culations [1–8] performed using mean-field theories havestrongly suggested the emergence of static octahedral (likea European pear) and tetrahedral (like a pyramid) nuclearshapes in several regions of the nuclear chart. The calcula-tions suggest that appropriate deformations of the nuclearmean field will result in high-fold degeneracies. These, inturn, cause a bunching of nuclear levels and the emergenceof strong shell gaps. The shell gaps correlate with local en-ergy minima which may stabilize the nuclear shape, andare characterized by a set of new, “tetrahedral” magicnumbers. Two of these, relevant to the present study, areN or Z = 32, 40 [3]. On this basis, the Z = 32, N = 40nucleus 72Ge was considered to be a promising tetrahedralcandidate. However, to date there is no clear experimen-tal evidence for the existence tetrahedral shapes in nuclearsystems, even in so-called best cases. For example, even inthe best-case rare-earth nuclei 154Gd and 160Yb, the de-duced quadrupole moments were found to be inconsistent
a e-mail: [email protected]
with the required value of zero [9]. The lowest negative-parity, odd-spin band of the tetrahedral candidate 156Gdwas also found to have a large intrinsic quadrupole mo-ment, providing strong evidence against tetrahedral sym-metry for this band [10]. Further, an experimental inves-tigation [11] of the electric dipole moments of actinides230,232U led to a similar conclusion regarding the negative-parity bands. In these cases it was possible to interpret thebands as octupole vibrations without recourse to tetrahe-dral symmetry. The remaining region of the nuclear chartpredicted to be fertile tetrahedral hunting grounds is thatnear A ∼ 70, hence the present study.
Apart from the possibility of revealing exotic symme-tries, the 72Ge nucleus is interesting and unique in severalother respects. At N = 40, the ground states of the even-Agermanium isotopes undergo a shape transition, from theweakly deformed oblate/spherical 70Ge38 to a moderateprolate deformation in 72Ge40 [12,13]. Further, the A ∼ 70region is known to exhibit shape coexistence [14], and 72Geis no exception. The first excited state, 0+
2 at 690 keV, isessentially spherical [15], and coexists with the prolate 0+
1ground state. Excited 0+ states are a general feature of thedoubly even nuclei in this mass region. The energy of thisstate reaches a minimum in 72Ge, where it is located well
Page 2 of 14 Eur. Phys. J. A (2012) 48: 99
below the yrast 2+1 state, making it the first excited state.
The two lowest 0+ states have been described as superpo-sitions of unobserved, unperturbed spin-zero states [16],and also within the Shell Model picture [17]. The 0+
2 statewas not populated in our experiment.
72Ge is a mid-shell nucleus with 4 protons and 12neutrons outside the doubly magic 56Ni core. With thewave function fragmented over many different Shell Modelstates, there is strong collective behaviour. However, nosingle collective model describes all the observed featuresof the ground-state band, or those of the even-A neigh-bouring isotopes. In some respects these nuclei behave likerotors, and in others, like vibrators. This may be inferredfrom the E(4+
1 )/E(2+1 ) ratio, predicted to be 2.00 (3.33) in
the vibrational (rotational) model, and the B(E2: 4+1 →
2+1 )/B(E2: 2+
1 → 0+1 ) ratio, predicted to be 2.00 (1.43)
in the vibrational (rotational) model. The experimentallymeasured ratios [18] for the isotopes 70,72,74,76Ge show aclear trend for the lighter nuclei to be vibrational and theheavier ones rotational, but in every case the ground-statebands exhibit intermediate character. It appears that atlow spins 72Ge may be a better vibrator than its neigh-bours, even though there is no experimental evidence ofthe expected 0+-2+-4+ vibrational triplet with excitationenergy of approximately twice E(2+
1 ). For example, thereis no evidence that the 0+
2 state at 690 keV is either vibra-tional or deformed, and the 2+
2 state at 1465 keV is con-sidered a one-phonon γ-vibration. We also note that 72Geexhibits particularly strong octupole correlations, with theconsequence that the 3− collective state at 2515 keV is lo-cated at a local energy minimum in this mass region.
There have also been several investigations of thisnucleus within different microscopic models such as theProjected Shell Model (PSM) [14], the Interacting Bo-son Model (IBM) [19], the Shell Model Monte Carlo ap-proach [20], and using the Shell Model with newly devel-oped effective interactions [17,18]. Several of these will beinvoked to describe features of the observed bands.
Tetrahedral states are expected to be yrare with lowspins, since the Coriolis alignment will break the sym-metry at high rotational frequencies [7]. A beam of α-particles is considered likely to feed both medium-spin lev-els and those that are not strictly yrast [21]. The (α, 2n)reaction was therefore chosen for the present experiment.This is the same reaction used in the early spectroscopicstudy of 72Ge by Morand et al. [21] more than thirty yearsago, using an experimental setup comprising only threeunsuppressed germanium detectors. Since then, there hasbeen no extension of the level scheme at medium or highspins. The present experimental study of this nucleus, us-ing a substantially more sensitive γ-ray spectrometer, wastherefore justified.
2 Experimental methods and analysis
High-spin states in 72Ge were populated via the 70Zn(α, 2n)72Ge reaction at a beam energy of 30MeV, using aself-supporting 70Zn target foil of thickness 5mg/cm2. The
K = 200 separated sector cyclotron facility of IthembaLABS was used to accelerate the pulsed beam with 58 nsbetween beam bursts. At an incident energy of 30MeVthe dominant residual nuclei were found to be 72Ge (93%)and 70Ge (3%), where the figures in parentheses denotean approximate percentage of the total cross-section. Thedata also included γ-rays emitted following the Coulombexcitation of 70Zn (4%).
Coincident γ-rays were measured with the AFRODI-TE [22] spectrometer array comprising nine Compton-suppressed Clover detectors and five four-fold segmentedLow-Energy Photon Spectrometers (LEPS). The Cloverswere positioned in two rings, at 90◦ relative to the beamdirection (five Clovers) and at 135◦ (four Clovers). TwoLEPS were placed at 90◦ and three at 45◦. The masterevent trigger demanded a two-or-higher-fold coincidencebetween any of the detectors, in coincidence with the ra-dio frequency signal from the cyclotron. The coincidencetime window was set to 150 ns. Under these conditions,and during some 50 hours of beam time, a data set of∼868 million coincident events was acquired.
In the off-line analysis, the raw event data fromthe detectors were calibrated using standard 133Ba and152Eu sources. The target was sufficiently thick to stopthe recoiling residual nuclei, and thus no Doppler cor-rection was necessary. Once the Clover data had beengain matched and gain-drift corrected, they were sortedinto four Radware-compatible [23] matrices. The firstof these was a random-subtracted, symmetric matrixcontaining only prompt Clover-Clover coincidences, andwas used for constructing the level scheme. The second,a random-subtracted, asymmetric directional correlation(DCO) matrix containing only prompt coincidences be-tween 90◦ Clovers (on one axis) and 135◦ Clovers (on theother axis), was used in assigning spin-parity to nuclearstates. The third and fourth were a pair of asymmetricpolarization matrices, containing coincidences between γ-rays detected in any Clover, placed on one axis, and γ-rayswhich had undergone horizontal (in one case) or vertical(in the other case) scattering between the elements of a90◦ Clover, placed on the remaining axis. The last twomatrices were used in the polarization analysis, for thepurpose of spin-parity assignments. Only the Clover datawere used in the analysis. The paucity of low energy γ-raysin the spectrum of this light nucleus rendered the LEPSdata of very little use.
3 The level scheme
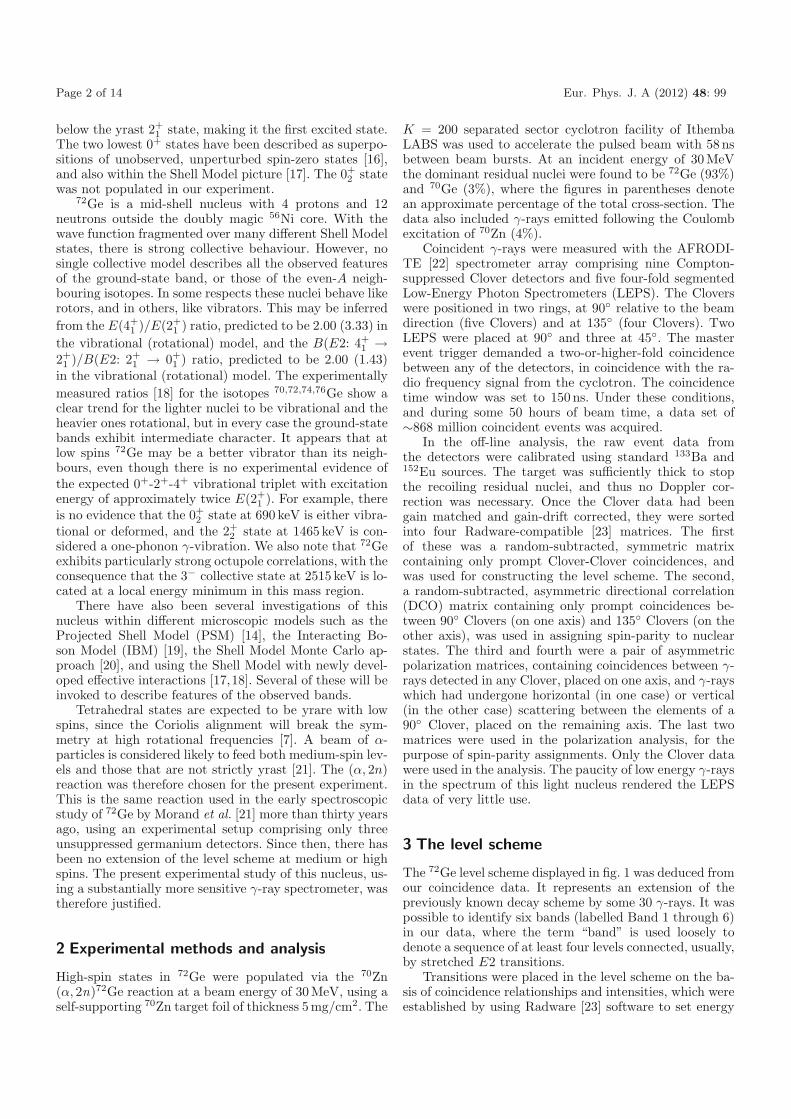
The 72Ge level scheme displayed in fig. 1 was deduced fromour coincidence data. It represents an extension of thepreviously known decay scheme by some 30 γ-rays. It waspossible to identify six bands (labelled Band 1 through 6)in our data, where the term “band” is used loosely todenote a sequence of at least four levels connected, usually,by stretched E2 transitions.
Transitions were placed in the level scheme on the ba-sis of coincidence relationships and intensities, which wereestablished by using Radware [23] software to set energy
Eur. Phys. J. A (2012) 48: 99 Page 3 of 14
834
894
1044
989
1060
1294
1544
760
997
1120
1520
1196
1098
1127614655
957
1096
1016
1465
10511401
1681786
630
932938
1000
5381056 699
803
8431344
1413
1012
981
1674736
382273
1065
6291597
693
706
356
1266869
665
1231
1165
580
2030
511
1098
748
1077
616
1183
1190
232 850
601
784
1306
317
0 0
2 834
4 1729
6 2773
8 3762
10 4822
12 6116
14 7661
(4 )3249
6 38298 4589
10 5586
12 6706
73900
4998
6195
32515
5 3130
73785
94743
115839
2 1465
3 2066
5 3081
7 4014
4 2465
6 340363668
84079
105423
2877
(8 ) 4468
6 3326
5333 5516
7460
105908
9 48635355
7004136916
5197
6053
72Ge
B1 B2B3B4B5
B6
Fig. 1. Decay scheme for 72Ge deduced from the present data. Arrow widths indicate transition intensities, uncertain Iπ valuesappear in parentheses, and the energies are in keV.
gates on the symmetric coincidence matrix. Such an anal-ysis showed up several incorrect placements in the previ-ous decay scheme [21]. In most cases, these γ-rays couldbe correctly replaced in the current level scheme. Theseincluded the 760, 843, 932, 1096 and 1165 keV γ-rays. Ev-idence for the placement of some of these γ-rays is pre-sented below in the discussion of the relevant band. Wefound no spectroscopic evidence to support the presence ofa further four γ-rays, 216, 497, 1322 and 1497 keV, whichhad been assigned to 72Ge by Morand et al. [21]. Theywere therefore removed from the level scheme.
In order to determine the spin-parity of new levels, itwas necessary to determine the multipolarity of the linkingtransitions to levels of known spin-parity. Therefore a fullDCO and polarization (PDCO) analysis was performedfor the important linking transitions. In this work, themeasured DCO ratio, RDCO, is defined as
RDCO =W (90◦, 135◦)W (135◦, 90◦)
. (1)
The numerator of this expression denotes the angular cor-relation function between de-excitation γ-rays, detectedat 90◦ relative to the beam direction, and coincident γ-rays, detected at 135◦. In practice, this entailed settingan energy gate on the 90◦ detectors of the DCO ma-trix and then measuring the projected intensity at 135◦.RDCO is a function of the detector configuration, the mul-tipolarity of the gating transition, the spin sequence, andthe multipolarity of the transition being measured. Theaverage RDCO for ten established stretched E2 and forseven established stretched E1 transitions was measured,using known stretched E2 transitions as gates, to pro-vide reference values for the current detector configura-tion. The values, found to be RDCO(E2) = 1.01(5) andRDCO(E1) = 0.59(5), are very similar to the theoreticalvalues calculated for pure transitions: RDCO(E2) = 1.0and 0.60 < RDCO(E1) < 0.65. The calculations were donewith the code dcoplot [24], which uses the theory of an-gular correlations outlined in refs. [25,26] to predict RDCO
as a function of the mixing ratio, δ,
δ =
√Iγ(λ = 2)Iγ(λ = 1)
. (2)
When performing the calculations, a de-orientation pa-rameter of σ/I = 0.35 and oblate alignment were as-sumed, and the average azimuthal angle between Cloverdetectors was Δφ = 45◦. Stretched E1 (E2) transitionsare usually not strongly mixed, since potentially com-peting M2 (M3) decay modes are slower by several or-ders of magnitude. When there is significant mixing, how-ever —usually where transitions are stretched M1 or un-stretched electric— dcoplot predicts values bounded byRDCO,max � 1.2 and RDCO,min � 0.4. These values de-pend strongly on the multipolarity and the degree of mix-ing. It was therefore necessary to compare the measuredRDCO and the theoretical predictions.
RDCO-values, however, make no distinction betweenelectric and magnetic transitions. Polarization anisotropymeasurements were therefore performed, using the Cloversas Compton polarimeters, as described in ref. [27]. Thepolarization anisotropy P , defined as
P =A
Q, (3)
is determined on the basis of the experimental asymmetrybetween vertically and horizontally scattered γ-rays,
A =aNV − NH
aNV + NH. (4)
NV (NH) denote the number of vertical (horizontal) scat-ters. The relative efficiency parameter a was determinedusing unpolarized γ-rays from a 152Eu source. It is definedas a = NH/NV and the measured value of a = 0.98 wasfound to have essentially no energy dependence. Scatteredradiations were measured only in Clovers at 90◦, for thisis where the polarization sensitivity Q, and hence A, are
Page 4 of 14 Eur. Phys. J. A (2012) 48: 99
maximal. The polarization sensitivity for Clover detectorshas been measured [27] to be
Q = Q0
[0.31(2) + 7(2) × 10−5Eγ
], (5)
where Eγ is in keV. Q0 is the polarization sensitivity foran ideal polarimeter,
Q0 =(1 + α)
(1 + α + α2), (6)
where α = Eγ [keV]/511. Pure stretched electric (mag-netic) transitions are predicted to have P > 0 (P < 0).For unstretched transitions the situation is just the re-verse. For mixed transitions, P can adopt either positiveor negative values, and therefore the measured P valueswere compared with theoretical predictions. These werecalculated, as a function of δ, with the code polar [28].The measured polarization anisotropies and RDCO valuesare tabulated in table A in the appendix.
3.1 Band 1
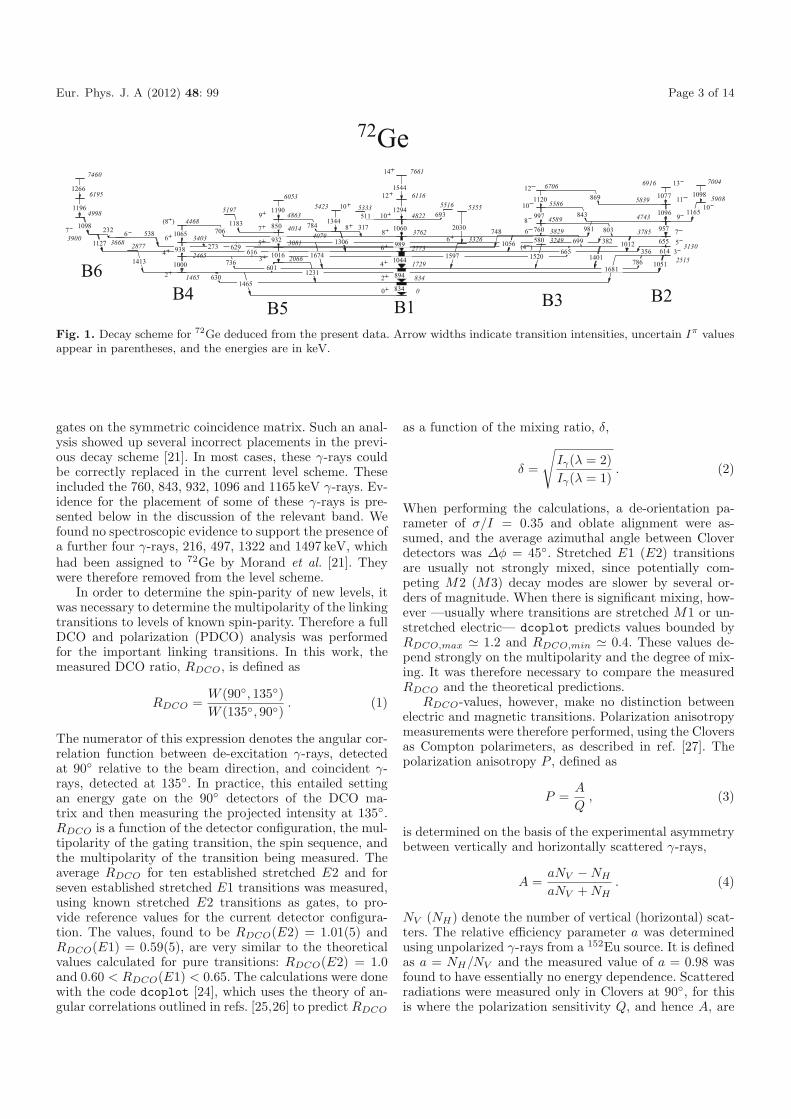
The positive-parity, yrast band, Band 1, was observed upto 12+ by Morand et al. [21]. In this work it is extendedby a single 1544 keV γ-ray, up to a spin-parity of 14+.The measured RDCO = 0.99(14) is consistent with thestretched E2 interpretation. Supporting evidence for theplacement of this transition may be seen in two spectra,one gated at 1294 and the other at 1544 keV. The 1294 keVgate, shown in the upper panel of fig. 2, shows the new1544 keV transition and also all the other γ-rays in theyrast band. It also displays two prominent “contaminant“coincident γ-rays, at 974 and 1127 keV. These could notbe found in coincidence in any of the other residual nucleiproduced in our experiment, nor in 27Al which constitutesthe target frame, nor in any other nuclei in the mass region67 < A < 75. They are thus likely associated with 72Ge,but could not be placed in the level scheme. The 1544 keVgate, also displayed in fig. 2, shows only the previouslyestablished yrast transitions, and this confirms that the1544 keV γ-ray must indeed be placed at the top of Band 1.
3.2 Band 2
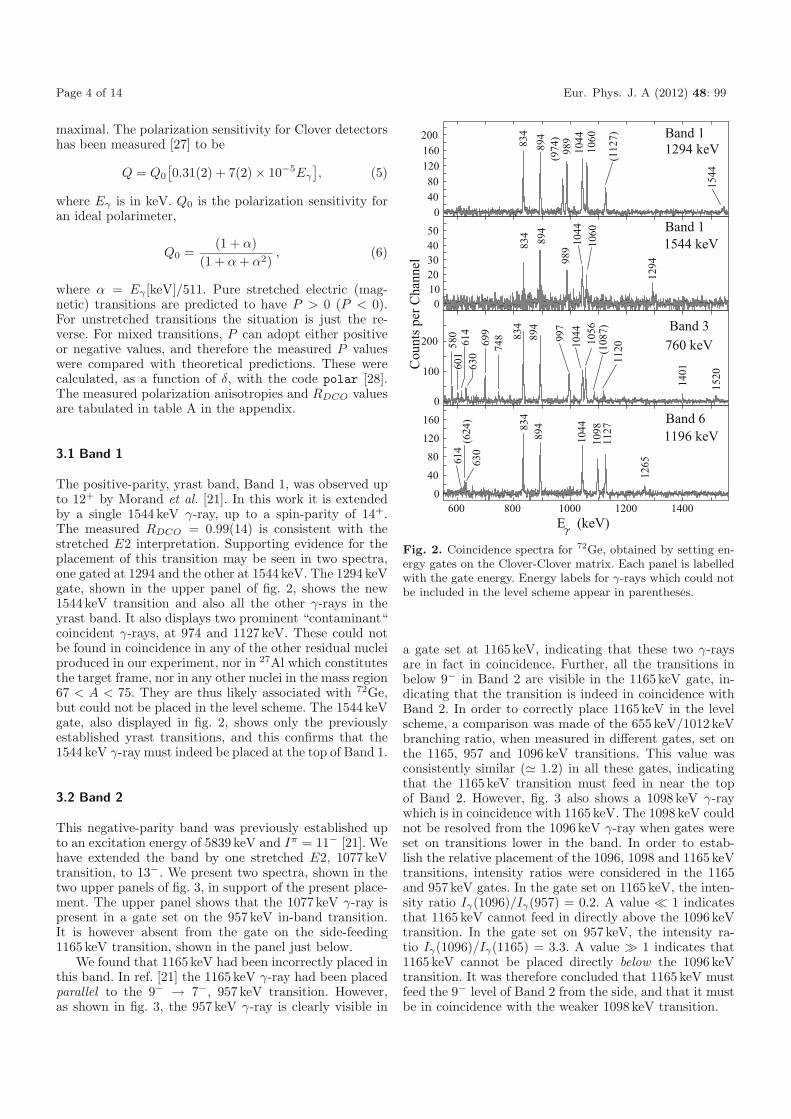
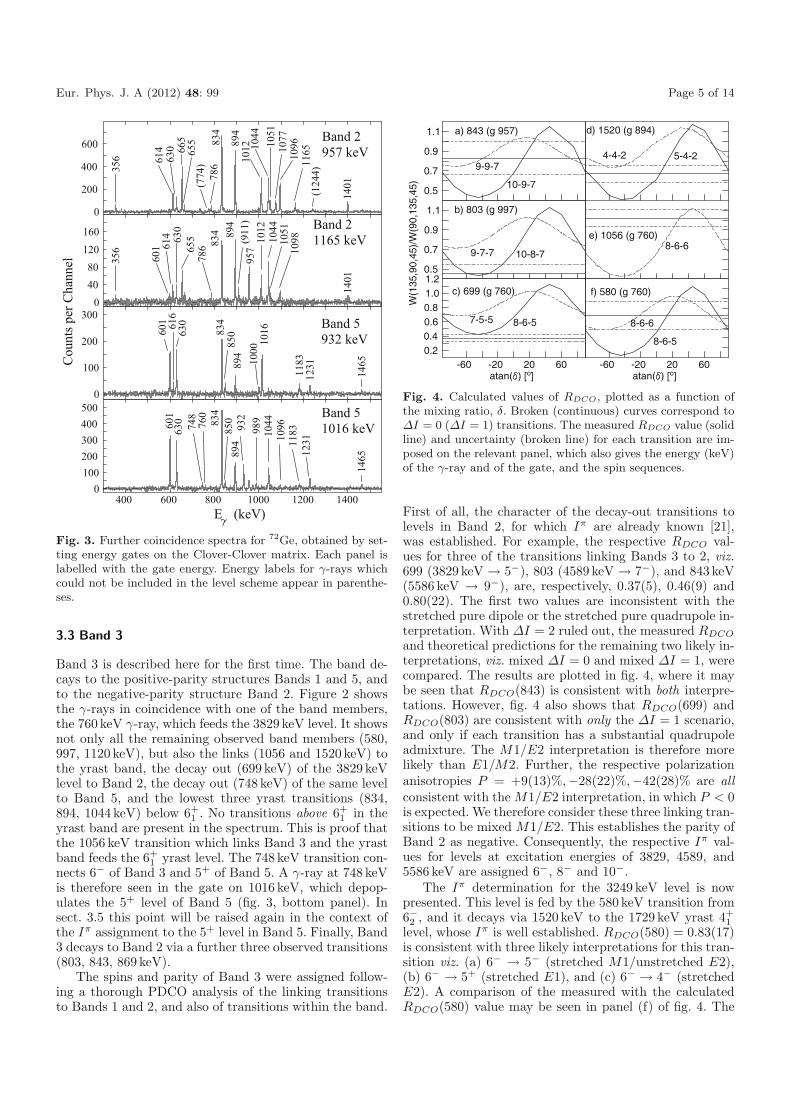
This negative-parity band was previously established upto an excitation energy of 5839 keV and Iπ = 11− [21]. Wehave extended the band by one stretched E2, 1077 keVtransition, to 13−. We present two spectra, shown in thetwo upper panels of fig. 3, in support of the present place-ment. The upper panel shows that the 1077 keV γ-ray ispresent in a gate set on the 957 keV in-band transition.It is however absent from the gate on the side-feeding1165 keV transition, shown in the panel just below.
We found that 1165 keV had been incorrectly placed inthis band. In ref. [21] the 1165 keV γ-ray had been placedparallel to the 9− → 7−, 957 keV transition. However,as shown in fig. 3, the 957 keV γ-ray is clearly visible in
04080
120160200
01020304050
Cou
nts p
er C
hann
el0
100
200
600 800 1000 1200 1400E (keV)
0
40
80
120
160
(112
7)
1060
1044
989
(974
)89
483
4
1294
1060
1044
989
894
834
580
601
614
630
699 83
489
4
997
1044
1120
1401
(108
7)
614
(624
)63
0
834
894
1044
1098
1127
1265
Band 11294 keV
Band 1
760 keVBand 3
Band 6
1056
1520
1544
1544 keV
1196 keV
748
Fig. 2. Coincidence spectra for 72Ge, obtained by setting en-ergy gates on the Clover-Clover matrix. Each panel is labelledwith the gate energy. Energy labels for γ-rays which could notbe included in the level scheme appear in parentheses.
a gate set at 1165 keV, indicating that these two γ-raysare in fact in coincidence. Further, all the transitions inbelow 9− in Band 2 are visible in the 1165 keV gate, in-dicating that the transition is indeed in coincidence withBand 2. In order to correctly place 1165 keV in the levelscheme, a comparison was made of the 655 keV/1012 keVbranching ratio, when measured in different gates, set onthe 1165, 957 and 1096 keV transitions. This value wasconsistently similar (� 1.2) in all these gates, indicatingthat the 1165 keV transition must feed in near the topof Band 2. However, fig. 3 also shows a 1098 keV γ-raywhich is in coincidence with 1165 keV. The 1098 keV couldnot be resolved from the 1096 keV γ-ray when gates wereset on transitions lower in the band. In order to estab-lish the relative placement of the 1096, 1098 and 1165 keVtransitions, intensity ratios were considered in the 1165and 957 keV gates. In the gate set on 1165 keV, the inten-sity ratio Iγ(1096)/Iγ(957) = 0.2. A value � 1 indicatesthat 1165 keV cannot feed in directly above the 1096 keVtransition. In the gate set on 957 keV, the intensity ra-tio Iγ(1096)/Iγ(1165) = 3.3. A value � 1 indicates that1165 keV cannot be placed directly below the 1096 keVtransition. It was therefore concluded that 1165 keV mustfeed the 9− level of Band 2 from the side, and that it mustbe in coincidence with the weaker 1098 keV transition.
Eur. Phys. J. A (2012) 48: 99 Page 5 of 14
0
200
400
600
04080
120160
Cou
nts p
er C
hann
el
0
100
200
300
400 600 800 1000 1200 1400E (keV)
0100200300400500
1401
1165
(124
4)
109610
771051
1044
101289
4
834
786
(774
)
665
655
630
614
356
1401
109810
5110
4410
1295
7(9
11)
894
834
78665
5630
614
601
356
12311183
1016
1000
894
85083
4
63061
660
1
123111
8310961044
989
932
894
85083
476
074
863
0601
Band 2957 keV
Band 21165 keV
Band 5932 keV
Band 51016 keV
1465
1465
Fig. 3. Further coincidence spectra for 72Ge, obtained by set-ting energy gates on the Clover-Clover matrix. Each panel islabelled with the gate energy. Energy labels for γ-rays whichcould not be included in the level scheme appear in parenthe-ses.
3.3 Band 3
Band 3 is described here for the first time. The band de-cays to the positive-parity structures Bands 1 and 5, andto the negative-parity structure Band 2. Figure 2 showsthe γ-rays in coincidence with one of the band members,the 760 keV γ-ray, which feeds the 3829 keV level. It showsnot only all the remaining observed band members (580,997, 1120 keV), but also the links (1056 and 1520 keV) tothe yrast band, the decay out (699 keV) of the 3829 keVlevel to Band 2, the decay out (748 keV) of the same levelto Band 5, and the lowest three yrast transitions (834,894, 1044 keV) below 6+
1 . No transitions above 6+1 in the
yrast band are present in the spectrum. This is proof thatthe 1056 keV transition which links Band 3 and the yrastband feeds the 6+
1 yrast level. The 748 keV transition con-nects 6− of Band 3 and 5+ of Band 5. A γ-ray at 748 keVis therefore seen in the gate on 1016 keV, which depop-ulates the 5+ level of Band 5 (fig. 3, bottom panel). Insect. 3.5 this point will be raised again in the context ofthe Iπ assignment to the 5+ level in Band 5. Finally, Band3 decays to Band 2 via a further three observed transitions(803, 843, 869 keV).
The spins and parity of Band 3 were assigned follow-ing a thorough PDCO analysis of the linking transitionsto Bands 1 and 2, and also of transitions within the band.
0.5
0.7
0.9
1.1
0.5
0.7
0.9
1.1
-60 -20 20 60atan( ) [o]
0.20.40.60.81.01.2
-60 -20 20 60atan( ) [o]
9-9-7
10-9-7
d) 1520 (g 894)
4-4-2 5-4-2
b) 803 (g 997)
9-7-7 10-8-7
e) 1056 (g 760)8-6-6
c) 699 (g 760)
7-5-5 8-6-5
8-6-5
a) 843 (g 957)
f) 580 (g 760)
8-6-6
W(1
35,9
0,45
)/W
(90,
135,
45)
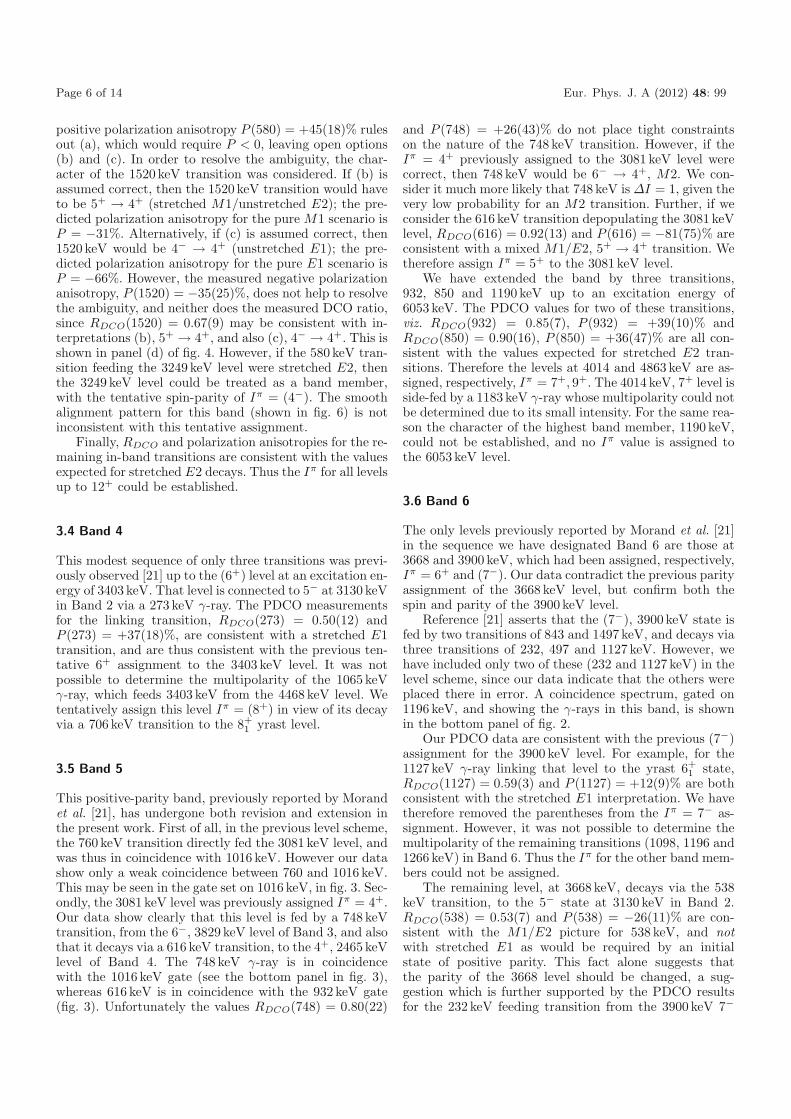
Fig. 4. Calculated values of RDCO, plotted as a function ofthe mixing ratio, δ. Broken (continuous) curves correspond toΔI = 0 (ΔI = 1) transitions. The measured RDCO value (solidline) and uncertainty (broken line) for each transition are im-posed on the relevant panel, which also gives the energy (keV)of the γ-ray and of the gate, and the spin sequences.
First of all, the character of the decay-out transitions tolevels in Band 2, for which Iπ are already known [21],was established. For example, the respective RDCO val-ues for three of the transitions linking Bands 3 to 2, viz.699 (3829 keV → 5−), 803 (4589 keV → 7−), and 843 keV(5586 keV → 9−), are, respectively, 0.37(5), 0.46(9) and0.80(22). The first two values are inconsistent with thestretched pure dipole or the stretched pure quadrupole in-terpretation. With ΔI = 2 ruled out, the measured RDCO
and theoretical predictions for the remaining two likely in-terpretations, viz. mixed ΔI = 0 and mixed ΔI = 1, werecompared. The results are plotted in fig. 4, where it maybe seen that RDCO(843) is consistent with both interpre-tations. However, fig. 4 also shows that RDCO(699) andRDCO(803) are consistent with only the ΔI = 1 scenario,and only if each transition has a substantial quadrupoleadmixture. The M1/E2 interpretation is therefore morelikely than E1/M2. Further, the respective polarizationanisotropies P = +9(13)%,−28(22)%,−42(28)% are allconsistent with the M1/E2 interpretation, in which P < 0is expected. We therefore consider these three linking tran-sitions to be mixed M1/E2. This establishes the parity ofBand 2 as negative. Consequently, the respective Iπ val-ues for levels at excitation energies of 3829, 4589, and5586 keV are assigned 6−, 8− and 10−.
The Iπ determination for the 3249 keV level is nowpresented. This level is fed by the 580 keV transition from6−2 , and it decays via 1520 keV to the 1729 keV yrast 4+
1level, whose Iπ is well established. RDCO(580) = 0.83(17)is consistent with three likely interpretations for this tran-sition viz. (a) 6− → 5− (stretched M1/unstretched E2),(b) 6− → 5+ (stretched E1), and (c) 6− → 4− (stretchedE2). A comparison of the measured with the calculatedRDCO(580) value may be seen in panel (f) of fig. 4. The
Page 6 of 14 Eur. Phys. J. A (2012) 48: 99
positive polarization anisotropy P (580) = +45(18)% rulesout (a), which would require P < 0, leaving open options(b) and (c). In order to resolve the ambiguity, the char-acter of the 1520 keV transition was considered. If (b) isassumed correct, then the 1520 keV transition would haveto be 5+ → 4+ (stretched M1/unstretched E2); the pre-dicted polarization anisotropy for the pure M1 scenario isP = −31%. Alternatively, if (c) is assumed correct, then1520 keV would be 4− → 4+ (unstretched E1); the pre-dicted polarization anisotropy for the pure E1 scenario isP = −66%. However, the measured negative polarizationanisotropy, P (1520) = −35(25)%, does not help to resolvethe ambiguity, and neither does the measured DCO ratio,since RDCO(1520) = 0.67(9) may be consistent with in-terpretations (b), 5+ → 4+, and also (c), 4− → 4+. This isshown in panel (d) of fig. 4. However, if the 580 keV tran-sition feeding the 3249 keV level were stretched E2, thenthe 3249 keV level could be treated as a band member,with the tentative spin-parity of Iπ = (4−). The smoothalignment pattern for this band (shown in fig. 6) is notinconsistent with this tentative assignment.
Finally, RDCO and polarization anisotropies for the re-maining in-band transitions are consistent with the valuesexpected for stretched E2 decays. Thus the Iπ for all levelsup to 12+ could be established.
3.4 Band 4
This modest sequence of only three transitions was previ-ously observed [21] up to the (6+) level at an excitation en-ergy of 3403 keV. That level is connected to 5− at 3130 keVin Band 2 via a 273 keV γ-ray. The PDCO measurementsfor the linking transition, RDCO(273) = 0.50(12) andP (273) = +37(18)%, are consistent with a stretched E1transition, and are thus consistent with the previous ten-tative 6+ assignment to the 3403 keV level. It was notpossible to determine the multipolarity of the 1065 keVγ-ray, which feeds 3403 keV from the 4468 keV level. Wetentatively assign this level Iπ = (8+) in view of its decayvia a 706 keV transition to the 8+
1 yrast level.
3.5 Band 5
This positive-parity band, previously reported by Morandet al. [21], has undergone both revision and extension inthe present work. First of all, in the previous level scheme,the 760 keV transition directly fed the 3081 keV level, andwas thus in coincidence with 1016 keV. However our datashow only a weak coincidence between 760 and 1016 keV.This may be seen in the gate set on 1016 keV, in fig. 3. Sec-ondly, the 3081 keV level was previously assigned Iπ = 4+.Our data show clearly that this level is fed by a 748 keVtransition, from the 6−, 3829 keV level of Band 3, and alsothat it decays via a 616 keV transition, to the 4+, 2465 keVlevel of Band 4. The 748 keV γ-ray is in coincidencewith the 1016 keV gate (see the bottom panel in fig. 3),whereas 616 keV is in coincidence with the 932 keV gate(fig. 3). Unfortunately the values RDCO(748) = 0.80(22)
and P (748) = +26(43)% do not place tight constraintson the nature of the 748 keV transition. However, if theIπ = 4+ previously assigned to the 3081 keV level werecorrect, then 748 keV would be 6− → 4+, M2. We con-sider it much more likely that 748 keV is ΔI = 1, given thevery low probability for an M2 transition. Further, if weconsider the 616 keV transition depopulating the 3081 keVlevel, RDCO(616) = 0.92(13) and P (616) = −81(75)% areconsistent with a mixed M1/E2, 5+ → 4+ transition. Wetherefore assign Iπ = 5+ to the 3081 keV level.
We have extended the band by three transitions,932, 850 and 1190 keV up to an excitation energy of6053 keV. The PDCO values for two of these transitions,viz. RDCO(932) = 0.85(7), P (932) = +39(10)% andRDCO(850) = 0.90(16), P (850) = +36(47)% are all con-sistent with the values expected for stretched E2 tran-sitions. Therefore the levels at 4014 and 4863 keV are as-signed, respectively, Iπ = 7+, 9+. The 4014 keV, 7+ level isside-fed by a 1183 keV γ-ray whose multipolarity could notbe determined due to its small intensity. For the same rea-son the character of the highest band member, 1190 keV,could not be established, and no Iπ value is assigned tothe 6053 keV level.
3.6 Band 6
The only levels previously reported by Morand et al. [21]in the sequence we have designated Band 6 are those at3668 and 3900 keV, which had been assigned, respectively,Iπ = 6+ and (7−). Our data contradict the previous parityassignment of the 3668 keV level, but confirm both thespin and parity of the 3900 keV level.
Reference [21] asserts that the (7−), 3900 keV state isfed by two transitions of 843 and 1497 keV, and decays viathree transitions of 232, 497 and 1127 keV. However, wehave included only two of these (232 and 1127 keV) in thelevel scheme, since our data indicate that the others wereplaced there in error. A coincidence spectrum, gated on1196 keV, and showing the γ-rays in this band, is shownin the bottom panel of fig. 2.
Our PDCO data are consistent with the previous (7−)assignment for the 3900 keV level. For example, for the1127 keV γ-ray linking that level to the yrast 6+
1 state,RDCO(1127) = 0.59(3) and P (1127) = +12(9)% are bothconsistent with the stretched E1 interpretation. We havetherefore removed the parentheses from the Iπ = 7− as-signment. However, it was not possible to determine themultipolarity of the remaining transitions (1098, 1196 and1266 keV) in Band 6. Thus the Iπ for the other band mem-bers could not be assigned.
The remaining level, at 3668 keV, decays via the 538keV transition, to the 5− state at 3130 keV in Band 2.RDCO(538) = 0.53(7) and P (538) = −26(11)% are con-sistent with the M1/E2 picture for 538 keV, and notwith stretched E1 as would be required by an initialstate of positive parity. This fact alone suggests thatthe parity of the 3668 level should be changed, a sug-gestion which is further supported by the PDCO resultsfor the 232 keV feeding transition from the 3900 keV 7−
Eur. Phys. J. A (2012) 48: 99 Page 7 of 14
level: RDCO(232) = 1.00(63) when gating on a stretcheddipole (not the customary stretched quadrupole!), andP (232) = −26(11)% are consistent with the M1/E2 inter-pretation for the 232 keV γ-ray. Such an interpretation forboth 232 and 538 keV is possible only if we assign Iπ = 6−to the level at 3668 keV.
3.7 Remaining levels not grouped in bands
In addition to the decay sequences consisting of severaltransitions, there are some thirteen, possibly less impor-tant transitions which feed directly into the stronger de-cay paths. These could not be grouped meaningfully intobands. In several cases it was possible to assign Iπ val-ues to the associated parent levels. The details will not begiven here. These levels and associated γ-rays are listed inthe appendix.
4 Discussion
4.1 Tetrahedral states
The symmetry of a tetrahedral nucleus is dictated by thatof the Y32 spherical harmonic. Because such a shape is non-spherical, so is the associated charge distribution, and atetrahedral nucleus will therefore exhibit a rotational spec-trum characterized by an I(I + 1) energy dependence. Inthe exact symmetry limit the dipole and quadrupole mo-ments should vanish, leaving the nucleus with a non-zerotriaxial octupole moment Q32. In such a “textbook” sce-nario the lowest-order allowed collective intra-band tran-sitions should have E3 character. This limit, however, isunlikely to be realized. Zero-point vibrations about thetetrahedral equilibrium shape may lead to finite dipoleand quadrupole moments, and even a small admixture ofnormal deformation is likely to induce E1 and E2 transi-tions to compete favourably with the slow E3 radiations.Thus the experimental signature of a tetrahedral band isexpected to be a series of negative-parity states with van-ishingly small intra-band stretched E2s, which decay viainter-band E1s to the ground-state band. Only at higherspins, where the symmetry may be broken by Coriolisalignment, will the intra-band E2s be substantial.
We did not observe any negative-parity states withthese characteristics in our data. All except two of thestates of confirmed negative parity could be grouped inrotational bands, Bands 2 and 3, and these exhibit strongintra-band stretched E2s, which persist to the lowestspins. In sect. 4 the bands are interpreted in terms of col-lective vibrations. There were only very few γ-rays in thedata which could not be placed in the level scheme, andthere was only a single confirmed negative-parity state(the 7− at 3900 keV) begging to be interpreted. We there-fore conclude that we saw no evidence of any tetrahedralstates in 72Ge.
Where are the missing tetrahedral states? Possible an-swers to this question may be:
– The states are there but they were not populated, orat best very weakly, in this reaction.
– There simply are no tetrahedral states in this nucleus.
0
2 2
2
22
2
2
22
2
22
44
4
44
4
44
4
4
6
6
6
66
66
6
6
68
8
88
88
10
10
-0.3 -0.2 -0.1 0.0 0.1 0.2 0.3 0.4 0.5-0.30
-0.20
-0.10
0.00
0.10
0.20
0.30
0.000.501.001.502.002.503.003.504.004.505.005.506.006.507.007.508.008.509.009.5010.0010.5011.0011.50
E [MeV]
Deformation α20
Def
orm
atio
n t 1
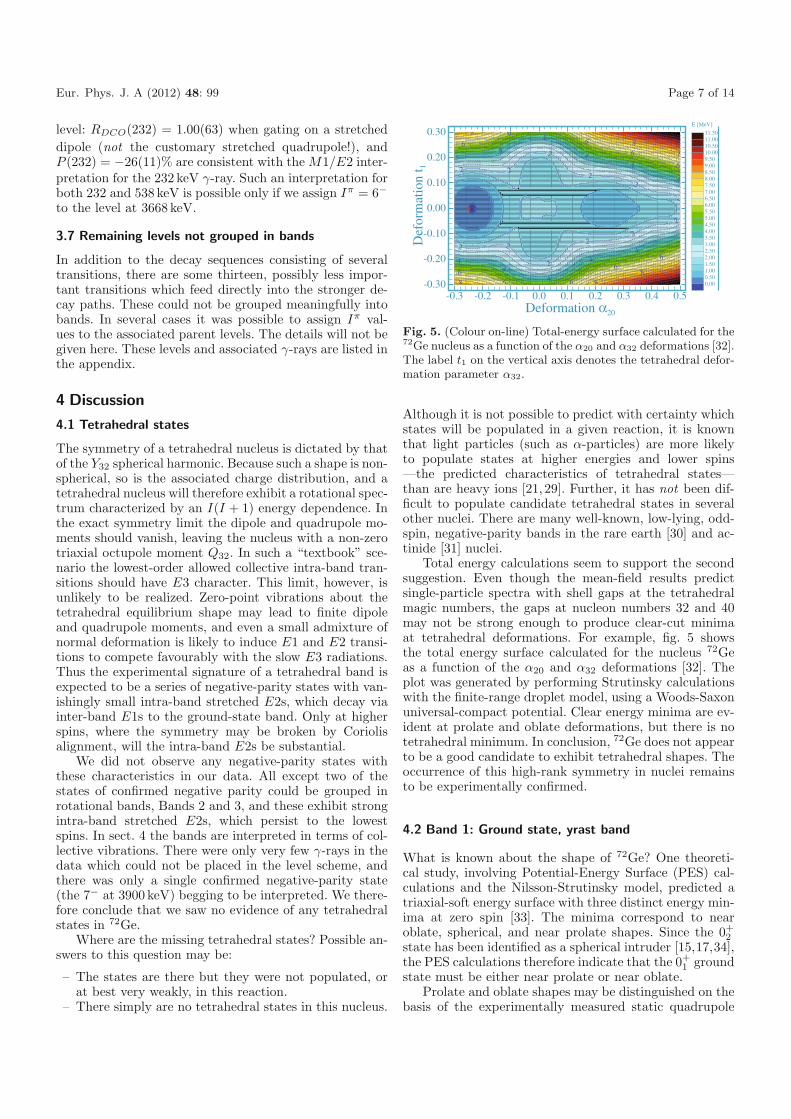
Fig. 5. (Colour on-line) Total-energy surface calculated for the72Ge nucleus as a function of the α20 and α32 deformations [32].The label t1 on the vertical axis denotes the tetrahedral defor-mation parameter α32.
Although it is not possible to predict with certainty whichstates will be populated in a given reaction, it is knownthat light particles (such as α-particles) are more likelyto populate states at higher energies and lower spins—the predicted characteristics of tetrahedral states—than are heavy ions [21, 29]. Further, it has not been dif-ficult to populate candidate tetrahedral states in severalother nuclei. There are many well-known, low-lying, odd-spin, negative-parity bands in the rare earth [30] and ac-tinide [31] nuclei.
Total energy calculations seem to support the secondsuggestion. Even though the mean-field results predictsingle-particle spectra with shell gaps at the tetrahedralmagic numbers, the gaps at nucleon numbers 32 and 40may not be strong enough to produce clear-cut minimaat tetrahedral deformations. For example, fig. 5 showsthe total energy surface calculated for the nucleus 72Geas a function of the α20 and α32 deformations [32]. Theplot was generated by performing Strutinsky calculationswith the finite-range droplet model, using a Woods-Saxonuniversal-compact potential. Clear energy minima are ev-ident at prolate and oblate deformations, but there is notetrahedral minimum. In conclusion, 72Ge does not appearto be a good candidate to exhibit tetrahedral shapes. Theoccurrence of this high-rank symmetry in nuclei remainsto be experimentally confirmed.
4.2 Band 1: Ground state, yrast band
What is known about the shape of 72Ge? One theoreti-cal study, involving Potential-Energy Surface (PES) cal-culations and the Nilsson-Strutinsky model, predicted atriaxial-soft energy surface with three distinct energy min-ima at zero spin [33]. The minima correspond to nearoblate, spherical, and near prolate shapes. Since the 0+
2state has been identified as a spherical intruder [15,17,34],the PES calculations therefore indicate that the 0+
1 groundstate must be either near prolate or near oblate.
Prolate and oblate shapes may be distinguished on thebasis of the experimentally measured static quadrupole
Page 8 of 14 Eur. Phys. J. A (2012) 48: 99
200 400 600 800 (keV)
0
2
4
6
8
Alig
nmen
t, i x (
)
Band 1Band 2Band 3Band 4Band 5
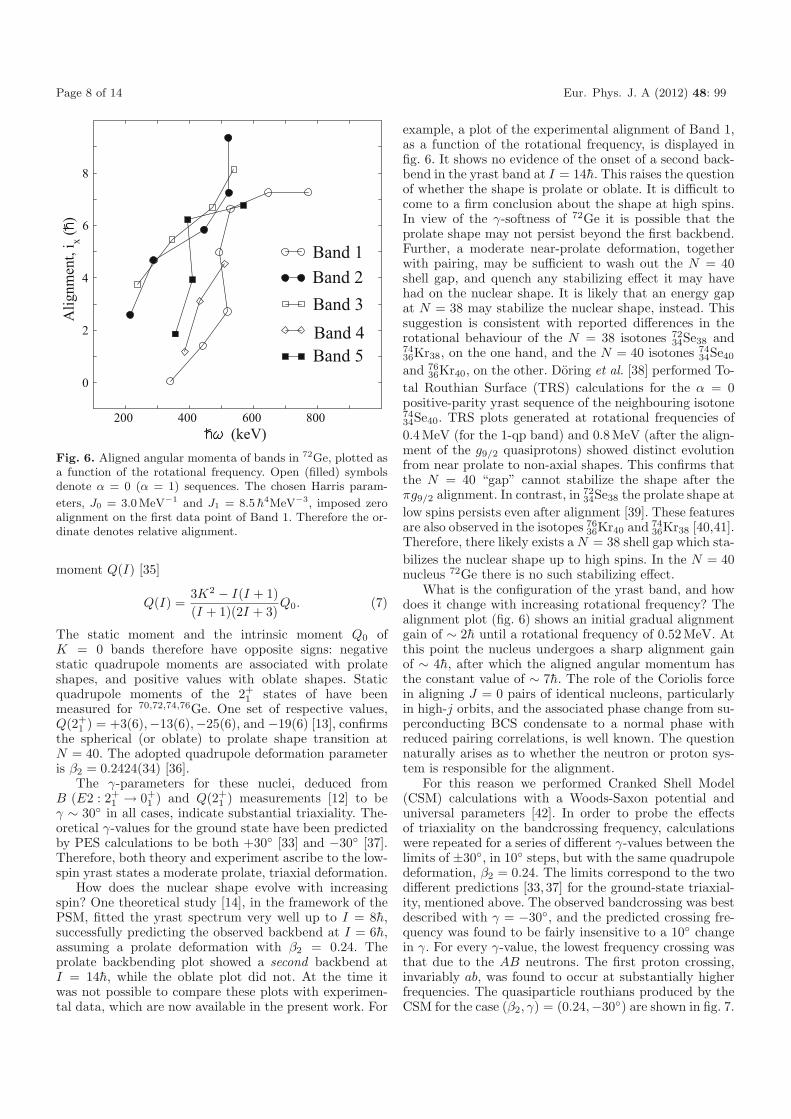
Fig. 6. Aligned angular momenta of bands in 72Ge, plotted asa function of the rotational frequency. Open (filled) symbolsdenote α = 0 (α = 1) sequences. The chosen Harris param-
eters, J0 = 3.0 MeV−1 and J1 = 8.5 h4MeV−3, imposed zeroalignment on the first data point of Band 1. Therefore the or-dinate denotes relative alignment.
moment Q(I) [35]
Q(I) =3K2 − I(I + 1)(I + 1)(2I + 3)
Q0. (7)
The static moment and the intrinsic moment Q0 ofK = 0 bands therefore have opposite signs: negativestatic quadrupole moments are associated with prolateshapes, and positive values with oblate shapes. Staticquadrupole moments of the 2+
1 states of have beenmeasured for 70,72,74,76Ge. One set of respective values,Q(2+
1 ) = +3(6),−13(6),−25(6), and −19(6) [13], confirmsthe spherical (or oblate) to prolate shape transition atN = 40. The adopted quadrupole deformation parameteris β2 = 0.2424(34) [36].
The γ-parameters for these nuclei, deduced fromB (E2 : 2+
1 → 0+1 ) and Q(2+
1 ) measurements [12] to beγ ∼ 30◦ in all cases, indicate substantial triaxiality. The-oretical γ-values for the ground state have been predictedby PES calculations to be both +30◦ [33] and −30◦ [37].Therefore, both theory and experiment ascribe to the low-spin yrast states a moderate prolate, triaxial deformation.
How does the nuclear shape evolve with increasingspin? One theoretical study [14], in the framework of thePSM, fitted the yrast spectrum very well up to I = 8h,successfully predicting the observed backbend at I = 6h,assuming a prolate deformation with β2 = 0.24. Theprolate backbending plot showed a second backbend atI = 14h, while the oblate plot did not. At the time itwas not possible to compare these plots with experimen-tal data, which are now available in the present work. For
example, a plot of the experimental alignment of Band 1,as a function of the rotational frequency, is displayed infig. 6. It shows no evidence of the onset of a second back-bend in the yrast band at I = 14h. This raises the questionof whether the shape is prolate or oblate. It is difficult tocome to a firm conclusion about the shape at high spins.In view of the γ-softness of 72Ge it is possible that theprolate shape may not persist beyond the first backbend.Further, a moderate near-prolate deformation, togetherwith pairing, may be sufficient to wash out the N = 40shell gap, and quench any stabilizing effect it may havehad on the nuclear shape. It is likely that an energy gapat N = 38 may stabilize the nuclear shape, instead. Thissuggestion is consistent with reported differences in therotational behaviour of the N = 38 isotones 72
34Se38 and7436Kr38, on the one hand, and the N = 40 isotones 74
34Se40
and 7636Kr40, on the other. Doring et al. [38] performed To-
tal Routhian Surface (TRS) calculations for the α = 0positive-parity yrast sequence of the neighbouring isotone7434Se40. TRS plots generated at rotational frequencies of0.4MeV (for the 1-qp band) and 0.8MeV (after the align-ment of the g9/2 quasiprotons) showed distinct evolutionfrom near prolate to non-axial shapes. This confirms thatthe N = 40 “gap” cannot stabilize the shape after theπg9/2 alignment. In contrast, in 72
34Se38 the prolate shape atlow spins persists even after alignment [39]. These featuresare also observed in the isotopes 76
36Kr40 and 7436Kr38 [40,41].
Therefore, there likely exists a N = 38 shell gap which sta-bilizes the nuclear shape up to high spins. In the N = 40nucleus 72Ge there is no such stabilizing effect.
What is the configuration of the yrast band, and howdoes it change with increasing rotational frequency? Thealignment plot (fig. 6) shows an initial gradual alignmentgain of ∼ 2h until a rotational frequency of 0.52MeV. Atthis point the nucleus undergoes a sharp alignment gainof ∼ 4h, after which the aligned angular momentum hasthe constant value of ∼ 7h. The role of the Coriolis forcein aligning J = 0 pairs of identical nucleons, particularlyin high-j orbits, and the associated phase change from su-perconducting BCS condensate to a normal phase withreduced pairing correlations, is well known. The questionnaturally arises as to whether the neutron or proton sys-tem is responsible for the alignment.
For this reason we performed Cranked Shell Model(CSM) calculations with a Woods-Saxon potential anduniversal parameters [42]. In order to probe the effectsof triaxiality on the bandcrossing frequency, calculationswere repeated for a series of different γ-values between thelimits of ±30◦, in 10◦ steps, but with the same quadrupoledeformation, β2 = 0.24. The limits correspond to the twodifferent predictions [33, 37] for the ground-state triaxial-ity, mentioned above. The observed bandcrossing was bestdescribed with γ = −30◦, and the predicted crossing fre-quency was found to be fairly insensitive to a 10◦ changein γ. For every γ-value, the lowest frequency crossing wasthat due to the AB neutrons. The first proton crossing,invariably ab, was found to occur at substantially higherfrequencies. The quasiparticle routhians produced by theCSM for the case (β2, γ) = (0.24,−30◦) are shown in fig. 7.
Eur. Phys. J. A (2012) 48: 99 Page 9 of 14
-2
-1
0
1
2
3
Qu
asi-
neu
tro
n R
ou
thia
n (
MeV
)
−A
B
−B
C
−C−D
D
A
AB
BC
AD
0.0 0.1 0.2 0.3 0.4 0.5 0.6 0.7 0.8 0.9 1.0 1.1 1.2hω (MeV)
-2
-1
0
1
2
Qu
asi-
pro
ton
Ro
uth
ian
(M
eV)
a
−a
f
−f
b
−b
e
−e
ab
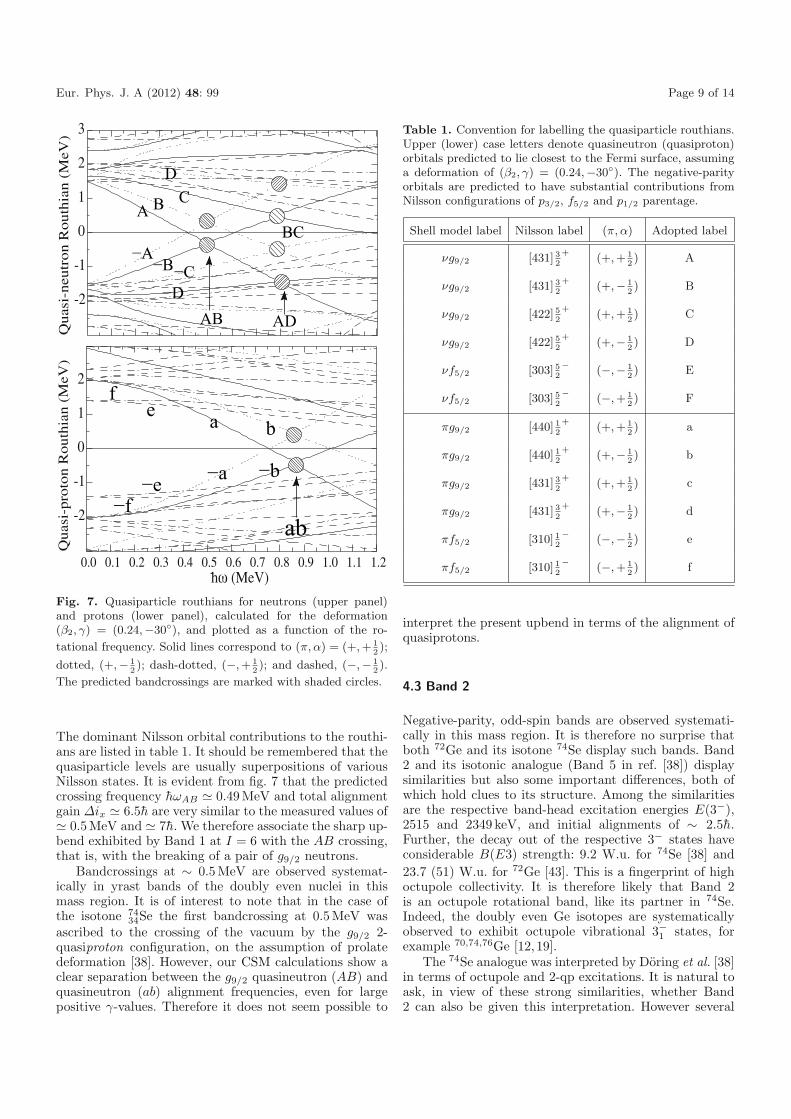
Fig. 7. Quasiparticle routhians for neutrons (upper panel)and protons (lower panel), calculated for the deformation(β2, γ) = (0.24,−30◦), and plotted as a function of the ro-
tational frequency. Solid lines correspond to (π, α) = (+, + 12);
dotted, (+,− 12); dash-dotted, (−, + 1
2); and dashed, (−,− 1
2).
The predicted bandcrossings are marked with shaded circles.
The dominant Nilsson orbital contributions to the routhi-ans are listed in table 1. It should be remembered that thequasiparticle levels are usually superpositions of variousNilsson states. It is evident from fig. 7 that the predictedcrossing frequency hωAB � 0.49MeV and total alignmentgain Δix � 6.5h are very similar to the measured values of� 0.5MeV and � 7h. We therefore associate the sharp up-bend exhibited by Band 1 at I = 6 with the AB crossing,that is, with the breaking of a pair of g9/2 neutrons.
Bandcrossings at ∼ 0.5MeV are observed systemat-ically in yrast bands of the doubly even nuclei in thismass region. It is of interest to note that in the case ofthe isotone 74
34Se the first bandcrossing at 0.5MeV wasascribed to the crossing of the vacuum by the g9/2 2-quasiproton configuration, on the assumption of prolatedeformation [38]. However, our CSM calculations show aclear separation between the g9/2 quasineutron (AB) andquasineutron (ab) alignment frequencies, even for largepositive γ-values. Therefore it does not seem possible to
Table 1. Convention for labelling the quasiparticle routhians.Upper (lower) case letters denote quasineutron (quasiproton)orbitals predicted to lie closest to the Fermi surface, assuminga deformation of (β2, γ) = (0.24,−30◦). The negative-parityorbitals are predicted to have substantial contributions fromNilsson configurations of p3/2, f5/2 and p1/2 parentage.
Shell model label Nilsson label (π, α) Adopted label
νg9/2 [431] 32
+(+, + 1
2) A
νg9/2 [431] 32
+(+,− 1
2) B
νg9/2 [422] 52
+(+, + 1
2) C
νg9/2 [422] 52
+(+,− 1
2) D
νf5/2 [303] 52
−(−,− 1
2) E
νf5/2 [303] 52
−(−, + 1
2) F
πg9/2 [440] 12
+(+, + 1
2) a
πg9/2 [440] 12
+(+,− 1
2) b
πg9/2 [431] 32
+(+, + 1
2) c
πg9/2 [431] 32
+(+,− 1
2) d
πf5/2 [310] 12
−(−,− 1
2) e
πf5/2 [310] 12
−(−, + 1
2) f
interpret the present upbend in terms of the alignment ofquasiprotons.
4.3 Band 2
Negative-parity, odd-spin bands are observed systemati-cally in this mass region. It is therefore no surprise thatboth 72Ge and its isotone 74Se display such bands. Band2 and its isotonic analogue (Band 5 in ref. [38]) displaysimilarities but also some important differences, both ofwhich hold clues to its structure. Among the similaritiesare the respective band-head excitation energies E(3−),2515 and 2349 keV, and initial alignments of ∼ 2.5h.Further, the decay out of the respective 3− states haveconsiderable B(E3) strength: 9.2 W.u. for 74Se [38] and23.7 (51) W.u. for 72Ge [43]. This is a fingerprint of highoctupole collectivity. It is therefore likely that Band 2is an octupole rotational band, like its partner in 74Se.Indeed, the doubly even Ge isotopes are systematicallyobserved to exhibit octupole vibrational 3−1 states, forexample 70,74,76Ge [12,19].
The 74Se analogue was interpreted by Doring et al. [38]in terms of octupole and 2-qp excitations. It is natural toask, in view of these strong similarities, whether Band2 can also be given this interpretation. However several
Page 10 of 14 Eur. Phys. J. A (2012) 48: 99
0
4
8
12
Alig
nmen
t, i x (
)
100 300 500 700 900 (keV)
2
6
10
14
18
22
26
(1) (
2 /MeV
)
74Se, octupole74Se, yrast
72Ge, yrast72Ge, octupole
(a)
(b)
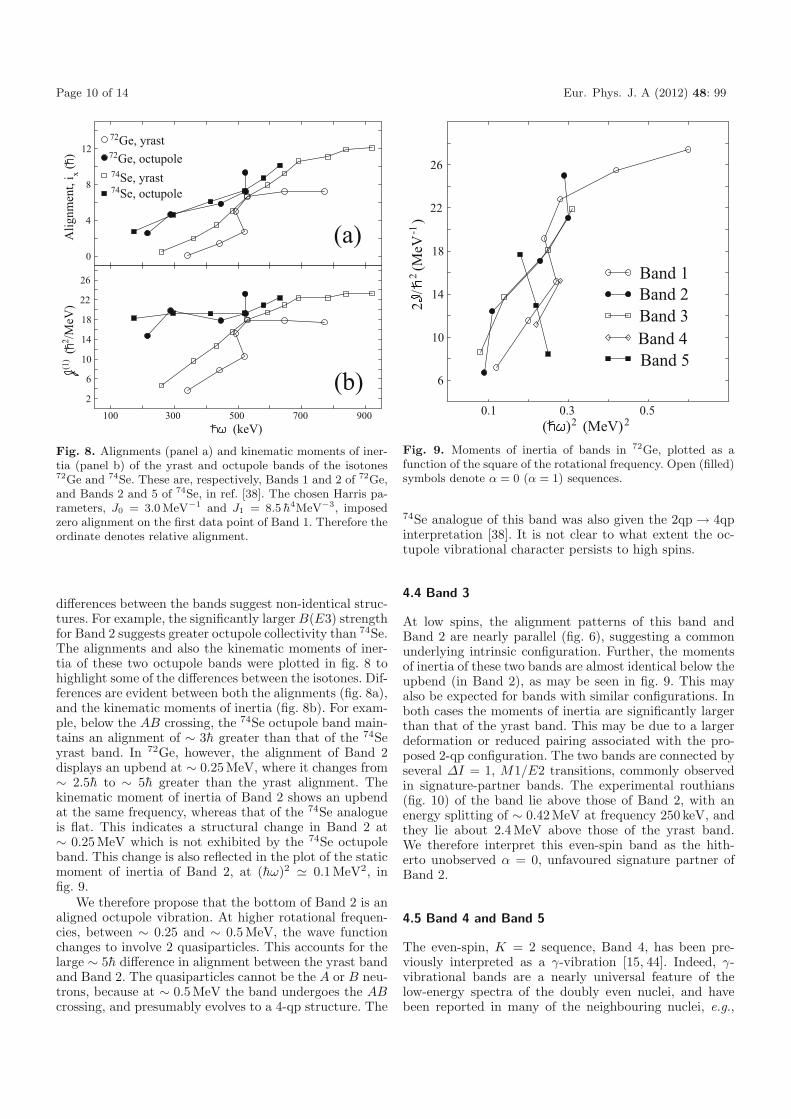
Fig. 8. Alignments (panel a) and kinematic moments of iner-tia (panel b) of the yrast and octupole bands of the isotones72Ge and 74Se. These are, respectively, Bands 1 and 2 of 72Ge,and Bands 2 and 5 of 74Se, in ref. [38]. The chosen Harris pa-rameters, J0 = 3.0 MeV−1 and J1 = 8.5 h4MeV−3, imposedzero alignment on the first data point of Band 1. Therefore theordinate denotes relative alignment.
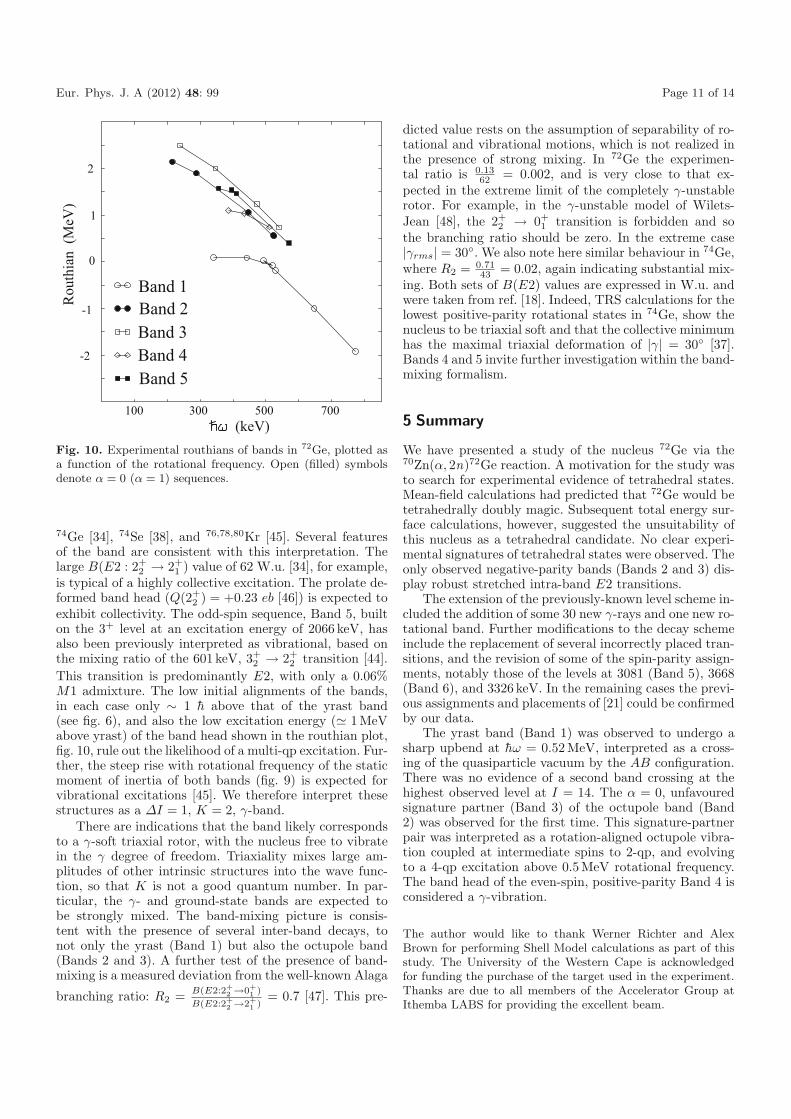
differences between the bands suggest non-identical struc-tures. For example, the significantly larger B(E3) strengthfor Band 2 suggests greater octupole collectivity than 74Se.The alignments and also the kinematic moments of iner-tia of these two octupole bands were plotted in fig. 8 tohighlight some of the differences between the isotones. Dif-ferences are evident between both the alignments (fig. 8a),and the kinematic moments of inertia (fig. 8b). For exam-ple, below the AB crossing, the 74Se octupole band main-tains an alignment of ∼ 3h greater than that of the 74Seyrast band. In 72Ge, however, the alignment of Band 2displays an upbend at ∼ 0.25MeV, where it changes from∼ 2.5h to ∼ 5h greater than the yrast alignment. Thekinematic moment of inertia of Band 2 shows an upbendat the same frequency, whereas that of the 74Se analogueis flat. This indicates a structural change in Band 2 at∼ 0.25MeV which is not exhibited by the 74Se octupoleband. This change is also reflected in the plot of the staticmoment of inertia of Band 2, at (hω)2 � 0.1MeV2, infig. 9.
We therefore propose that the bottom of Band 2 is analigned octupole vibration. At higher rotational frequen-cies, between ∼ 0.25 and ∼ 0.5MeV, the wave functionchanges to involve 2 quasiparticles. This accounts for thelarge ∼ 5h difference in alignment between the yrast bandand Band 2. The quasiparticles cannot be the A or B neu-trons, because at ∼ 0.5MeV the band undergoes the ABcrossing, and presumably evolves to a 4-qp structure. The
0.1 0.3 0.5( )2 (MeV)2
6
10
14
18
22
26
2/
2 (MeV
-1 )
Band 1Band 2Band 3Band 4Band 5
Fig. 9. Moments of inertia of bands in 72Ge, plotted as afunction of the square of the rotational frequency. Open (filled)symbols denote α = 0 (α = 1) sequences.
74Se analogue of this band was also given the 2qp → 4qpinterpretation [38]. It is not clear to what extent the oc-tupole vibrational character persists to high spins.
4.4 Band 3
At low spins, the alignment patterns of this band andBand 2 are nearly parallel (fig. 6), suggesting a commonunderlying intrinsic configuration. Further, the momentsof inertia of these two bands are almost identical below theupbend (in Band 2), as may be seen in fig. 9. This mayalso be expected for bands with similar configurations. Inboth cases the moments of inertia are significantly largerthan that of the yrast band. This may be due to a largerdeformation or reduced pairing associated with the pro-posed 2-qp configuration. The two bands are connected byseveral ΔI = 1, M1/E2 transitions, commonly observedin signature-partner bands. The experimental routhians(fig. 10) of the band lie above those of Band 2, with anenergy splitting of ∼ 0.42MeV at frequency 250 keV, andthey lie about 2.4MeV above those of the yrast band.We therefore interpret this even-spin band as the hith-erto unobserved α = 0, unfavoured signature partner ofBand 2.
4.5 Band 4 and Band 5
The even-spin, K = 2 sequence, Band 4, has been pre-viously interpreted as a γ-vibration [15, 44]. Indeed, γ-vibrational bands are a nearly universal feature of thelow-energy spectra of the doubly even nuclei, and havebeen reported in many of the neighbouring nuclei, e.g.,
Eur. Phys. J. A (2012) 48: 99 Page 11 of 14
100 300 500 700 (keV)
Rou
thia
n (M
eV)
Band 1Band 2Band 3Band 4Band 5
2
1
0
-1
-2
Fig. 10. Experimental routhians of bands in 72Ge, plotted asa function of the rotational frequency. Open (filled) symbolsdenote α = 0 (α = 1) sequences.
74Ge [34], 74Se [38], and 76,78,80Kr [45]. Several featuresof the band are consistent with this interpretation. Thelarge B(E2 : 2+
2 → 2+1 ) value of 62 W.u. [34], for example,
is typical of a highly collective excitation. The prolate de-formed band head (Q(2+
2 ) = +0.23 eb [46]) is expected toexhibit collectivity. The odd-spin sequence, Band 5, builton the 3+ level at an excitation energy of 2066 keV, hasalso been previously interpreted as vibrational, based onthe mixing ratio of the 601 keV, 3+
2 → 2+2 transition [44].
This transition is predominantly E2, with only a 0.06%M1 admixture. The low initial alignments of the bands,in each case only ∼ 1 h above that of the yrast band(see fig. 6), and also the low excitation energy (� 1MeVabove yrast) of the band head shown in the routhian plot,fig. 10, rule out the likelihood of a multi-qp excitation. Fur-ther, the steep rise with rotational frequency of the staticmoment of inertia of both bands (fig. 9) is expected forvibrational excitations [45]. We therefore interpret thesestructures as a ΔI = 1, K = 2, γ-band.
There are indications that the band likely correspondsto a γ-soft triaxial rotor, with the nucleus free to vibratein the γ degree of freedom. Triaxiality mixes large am-plitudes of other intrinsic structures into the wave func-tion, so that K is not a good quantum number. In par-ticular, the γ- and ground-state bands are expected tobe strongly mixed. The band-mixing picture is consis-tent with the presence of several inter-band decays, tonot only the yrast (Band 1) but also the octupole band(Bands 2 and 3). A further test of the presence of band-mixing is a measured deviation from the well-known Alaga
branching ratio: R2 = B(E2:2+2 →0+
1 )
B(E2:2+2 →2+
1 )= 0.7 [47]. This pre-
dicted value rests on the assumption of separability of ro-tational and vibrational motions, which is not realized inthe presence of strong mixing. In 72Ge the experimen-tal ratio is 0.13
62 = 0.002, and is very close to that ex-pected in the extreme limit of the completely γ-unstablerotor. For example, in the γ-unstable model of Wilets-Jean [48], the 2+
2 → 0+1 transition is forbidden and so
the branching ratio should be zero. In the extreme case|γrms| = 30◦. We also note here similar behaviour in 74Ge,where R2 = 0.71
43 = 0.02, again indicating substantial mix-ing. Both sets of B(E2) values are expressed in W.u. andwere taken from ref. [18]. Indeed, TRS calculations for thelowest positive-parity rotational states in 74Ge, show thenucleus to be triaxial soft and that the collective minimumhas the maximal triaxial deformation of |γ| = 30◦ [37].Bands 4 and 5 invite further investigation within the band-mixing formalism.
5 Summary
We have presented a study of the nucleus 72Ge via the70Zn(α, 2n)72Ge reaction. A motivation for the study wasto search for experimental evidence of tetrahedral states.Mean-field calculations had predicted that 72Ge would betetrahedrally doubly magic. Subsequent total energy sur-face calculations, however, suggested the unsuitability ofthis nucleus as a tetrahedral candidate. No clear experi-mental signatures of tetrahedral states were observed. Theonly observed negative-parity bands (Bands 2 and 3) dis-play robust stretched intra-band E2 transitions.
The extension of the previously-known level scheme in-cluded the addition of some 30 new γ-rays and one new ro-tational band. Further modifications to the decay schemeinclude the replacement of several incorrectly placed tran-sitions, and the revision of some of the spin-parity assign-ments, notably those of the levels at 3081 (Band 5), 3668(Band 6), and 3326 keV. In the remaining cases the previ-ous assignments and placements of [21] could be confirmedby our data.
The yrast band (Band 1) was observed to undergo asharp upbend at hω = 0.52MeV, interpreted as a cross-ing of the quasiparticle vacuum by the AB configuration.There was no evidence of a second band crossing at thehighest observed level at I = 14. The α = 0, unfavouredsignature partner (Band 3) of the octupole band (Band2) was observed for the first time. This signature-partnerpair was interpreted as a rotation-aligned octupole vibra-tion coupled at intermediate spins to 2-qp, and evolvingto a 4-qp excitation above 0.5MeV rotational frequency.The band head of the even-spin, positive-parity Band 4 isconsidered a γ-vibration.
The author would like to thank Werner Richter and AlexBrown for performing Shell Model calculations as part of thisstudy. The University of the Western Cape is acknowledgedfor funding the purchase of the target used in the experiment.Thanks are due to all members of the Accelerator Group atIthemba LABS for providing the excellent beam.
Page 12 of 14 Eur. Phys. J. A (2012) 48: 99
Appendix A.
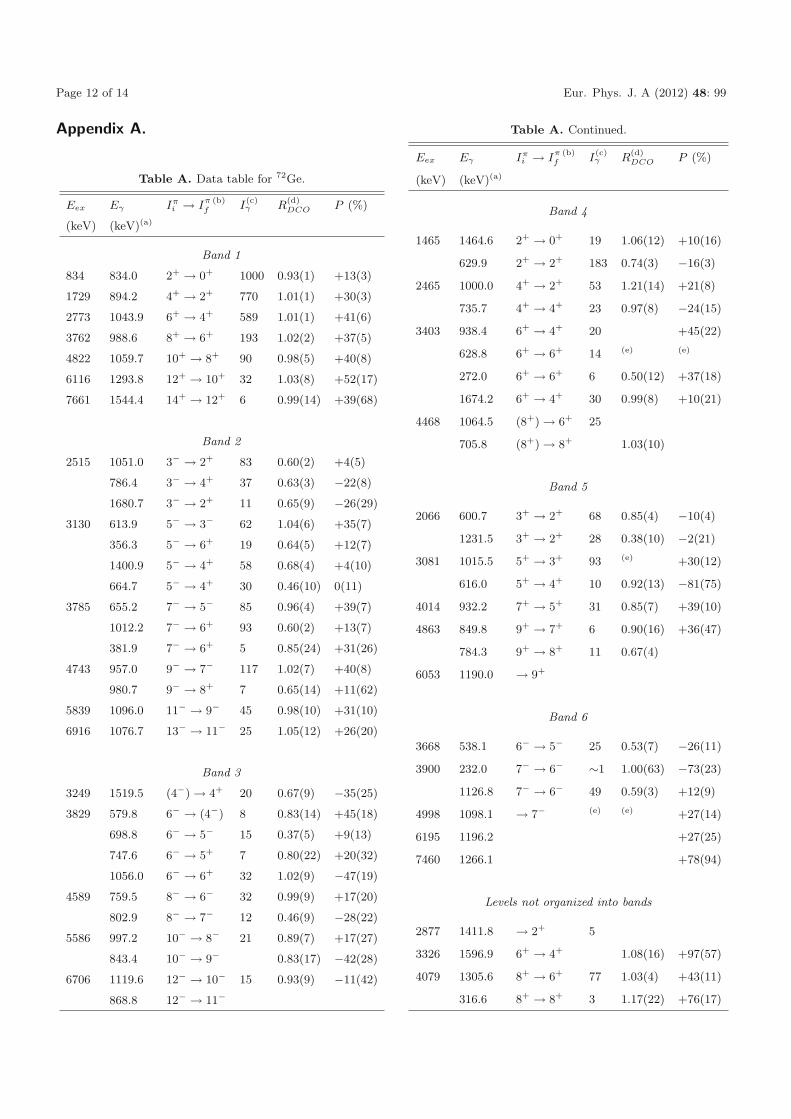
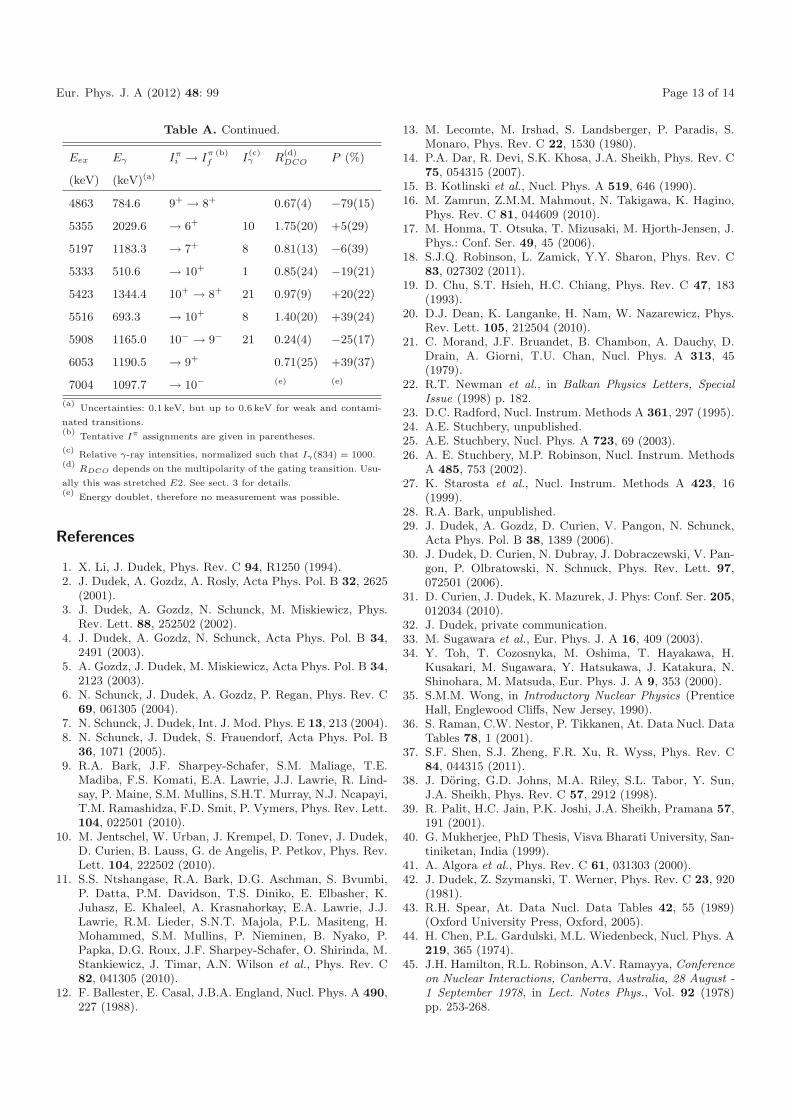
Table A. Data table for 72Ge.
Eex Eγ Iπi → I
π (b)f I
(c)γ R
(d)DCO P (%)
(keV) (keV)(a)
Band 1
834 834.0 2+ → 0+ 1000 0.93(1) +13(3)
1729 894.2 4+ → 2+ 770 1.01(1) +30(3)
2773 1043.9 6+ → 4+ 589 1.01(1) +41(6)
3762 988.6 8+ → 6+ 193 1.02(2) +37(5)
4822 1059.7 10+ → 8+ 90 0.98(5) +40(8)
6116 1293.8 12+ → 10+ 32 1.03(8) +52(17)
7661 1544.4 14+ → 12+ 6 0.99(14) +39(68)
Band 2
2515 1051.0 3− → 2+ 83 0.60(2) +4(5)
786.4 3− → 4+ 37 0.63(3) −22(8)
1680.7 3− → 2+ 11 0.65(9) −26(29)
3130 613.9 5− → 3− 62 1.04(6) +35(7)
356.3 5− → 6+ 19 0.64(5) +12(7)
1400.9 5− → 4+ 58 0.68(4) +4(10)
664.7 5− → 4+ 30 0.46(10) 0(11)
3785 655.2 7− → 5− 85 0.96(4) +39(7)
1012.2 7− → 6+ 93 0.60(2) +13(7)
381.9 7− → 6+ 5 0.85(24) +31(26)
4743 957.0 9− → 7− 117 1.02(7) +40(8)
980.7 9− → 8+ 7 0.65(14) +11(62)
5839 1096.0 11− → 9− 45 0.98(10) +31(10)
6916 1076.7 13− → 11− 25 1.05(12) +26(20)
Band 3
3249 1519.5 (4−) → 4+ 20 0.67(9) −35(25)
3829 579.8 6− → (4−) 8 0.83(14) +45(18)
698.8 6− → 5− 15 0.37(5) +9(13)
747.6 6− → 5+ 7 0.80(22) +20(32)
1056.0 6− → 6+ 32 1.02(9) −47(19)
4589 759.5 8− → 6− 32 0.99(9) +17(20)
802.9 8− → 7− 12 0.46(9) −28(22)
5586 997.2 10− → 8− 21 0.89(7) +17(27)
843.4 10− → 9− 0.83(17) −42(28)
6706 1119.6 12− → 10− 15 0.93(9) −11(42)
868.8 12− → 11−
Table A. Continued.
Eex Eγ Iπi → I
π (b)f I
(c)γ R
(d)DCO P (%)
(keV) (keV)(a)
Band 4
1465 1464.6 2+ → 0+ 19 1.06(12) +10(16)
629.9 2+ → 2+ 183 0.74(3) −16(3)
2465 1000.0 4+ → 2+ 53 1.21(14) +21(8)
735.7 4+ → 4+ 23 0.97(8) −24(15)
3403 938.4 6+ → 4+ 20 +45(22)
628.8 6+ → 6+ 14 (e) (e)
272.0 6+ → 6+ 6 0.50(12) +37(18)
1674.2 6+ → 4+ 30 0.99(8) +10(21)
4468 1064.5 (8+) → 6+ 25
705.8 (8+) → 8+ 1.03(10)
Band 5
2066 600.7 3+ → 2+ 68 0.85(4) −10(4)
1231.5 3+ → 2+ 28 0.38(10) −2(21)
3081 1015.5 5+ → 3+ 93 (e) +30(12)
616.0 5+ → 4+ 10 0.92(13) −81(75)
4014 932.2 7+ → 5+ 31 0.85(7) +39(10)
4863 849.8 9+ → 7+ 6 0.90(16) +36(47)
784.3 9+ → 8+ 11 0.67(4)
6053 1190.0 → 9+
Band 6
3668 538.1 6− → 5− 25 0.53(7) −26(11)
3900 232.0 7− → 6− ∼1 1.00(63) −73(23)
1126.8 7− → 6− 49 0.59(3) +12(9)
4998 1098.1 → 7− (e) (e) +27(14)
6195 1196.2 +27(25)
7460 1266.1 +78(94)
Levels not organized into bands
2877 1411.8 → 2+ 5
3326 1596.9 6+ → 4+ 1.08(16) +97(57)
4079 1305.6 8+ → 6+ 77 1.03(4) +43(11)
316.6 8+ → 8+ 3 1.17(22) +76(17)
Eur. Phys. J. A (2012) 48: 99 Page 13 of 14
Table A. Continued.
Eex Eγ Iπi → I
π (b)f I
(c)γ R
(d)DCO P (%)
(keV) (keV)(a)
4863 784.6 9+ → 8+ 0.67(4) −79(15)
5355 2029.6 → 6+ 10 1.75(20) +5(29)
5197 1183.3 → 7+ 8 0.81(13) −6(39)
5333 510.6 → 10+ 1 0.85(24) −19(21)
5423 1344.4 10+ → 8+ 21 0.97(9) +20(22)
5516 693.3 → 10+ 8 1.40(20) +39(24)
5908 1165.0 10− → 9− 21 0.24(4) −25(17)
6053 1190.5 → 9+ 0.71(25) +39(37)
7004 1097.7 → 10− (e) (e)
(a)Uncertainties: 0.1 keV, but up to 0.6 keV for weak and contami-
nated transitions.(b)
Tentative Iπ assignments are given in parentheses.
(c)Relative γ-ray intensities, normalized such that Iγ(834) = 1000.
(d)RDCO depends on the multipolarity of the gating transition. Usu-
ally this was stretched E2. See sect. 3 for details.(e)
Energy doublet, therefore no measurement was possible.
References
1. X. Li, J. Dudek, Phys. Rev. C 94, R1250 (1994).2. J. Dudek, A. Gozdz, A. Rosly, Acta Phys. Pol. B 32, 2625
(2001).3. J. Dudek, A. Gozdz, N. Schunck, M. Miskiewicz, Phys.
Rev. Lett. 88, 252502 (2002).4. J. Dudek, A. Gozdz, N. Schunck, Acta Phys. Pol. B 34,
2491 (2003).5. A. Gozdz, J. Dudek, M. Miskiewicz, Acta Phys. Pol. B 34,
2123 (2003).6. N. Schunck, J. Dudek, A. Gozdz, P. Regan, Phys. Rev. C
69, 061305 (2004).7. N. Schunck, J. Dudek, Int. J. Mod. Phys. E 13, 213 (2004).8. N. Schunck, J. Dudek, S. Frauendorf, Acta Phys. Pol. B
36, 1071 (2005).9. R.A. Bark, J.F. Sharpey-Schafer, S.M. Maliage, T.E.
Madiba, F.S. Komati, E.A. Lawrie, J.J. Lawrie, R. Lind-say, P. Maine, S.M. Mullins, S.H.T. Murray, N.J. Ncapayi,T.M. Ramashidza, F.D. Smit, P. Vymers, Phys. Rev. Lett.104, 022501 (2010).
10. M. Jentschel, W. Urban, J. Krempel, D. Tonev, J. Dudek,D. Curien, B. Lauss, G. de Angelis, P. Petkov, Phys. Rev.Lett. 104, 222502 (2010).
11. S.S. Ntshangase, R.A. Bark, D.G. Aschman, S. Bvumbi,P. Datta, P.M. Davidson, T.S. Diniko, E. Elbasher, K.Juhasz, E. Khaleel, A. Krasnahorkay, E.A. Lawrie, J.J.Lawrie, R.M. Lieder, S.N.T. Majola, P.L. Masiteng, H.Mohammed, S.M. Mullins, P. Nieminen, B. Nyako, P.Papka, D.G. Roux, J.F. Sharpey-Schafer, O. Shirinda, M.Stankiewicz, J. Timar, A.N. Wilson et al., Phys. Rev. C82, 041305 (2010).
12. F. Ballester, E. Casal, J.B.A. England, Nucl. Phys. A 490,227 (1988).
13. M. Lecomte, M. Irshad, S. Landsberger, P. Paradis, S.Monaro, Phys. Rev. C 22, 1530 (1980).
14. P.A. Dar, R. Devi, S.K. Khosa, J.A. Sheikh, Phys. Rev. C75, 054315 (2007).
15. B. Kotlinski et al., Nucl. Phys. A 519, 646 (1990).16. M. Zamrun, Z.M.M. Mahmout, N. Takigawa, K. Hagino,
Phys. Rev. C 81, 044609 (2010).17. M. Honma, T. Otsuka, T. Mizusaki, M. Hjorth-Jensen, J.
Phys.: Conf. Ser. 49, 45 (2006).18. S.J.Q. Robinson, L. Zamick, Y.Y. Sharon, Phys. Rev. C
83, 027302 (2011).19. D. Chu, S.T. Hsieh, H.C. Chiang, Phys. Rev. C 47, 183
(1993).20. D.J. Dean, K. Langanke, H. Nam, W. Nazarewicz, Phys.
Rev. Lett. 105, 212504 (2010).21. C. Morand, J.F. Bruandet, B. Chambon, A. Dauchy, D.
Drain, A. Giorni, T.U. Chan, Nucl. Phys. A 313, 45(1979).
22. R.T. Newman et al., in Balkan Physics Letters, SpecialIssue (1998) p. 182.
23. D.C. Radford, Nucl. Instrum. Methods A 361, 297 (1995).24. A.E. Stuchbery, unpublished.25. A.E. Stuchbery, Nucl. Phys. A 723, 69 (2003).26. A. E. Stuchbery, M.P. Robinson, Nucl. Instrum. Methods
A 485, 753 (2002).27. K. Starosta et al., Nucl. Instrum. Methods A 423, 16
(1999).28. R.A. Bark, unpublished.29. J. Dudek, A. Gozdz, D. Curien, V. Pangon, N. Schunck,
Acta Phys. Pol. B 38, 1389 (2006).30. J. Dudek, D. Curien, N. Dubray, J. Dobraczewski, V. Pan-
gon, P. Olbratowski, N. Schnuck, Phys. Rev. Lett. 97,072501 (2006).
31. D. Curien, J. Dudek, K. Mazurek, J. Phys: Conf. Ser. 205,012034 (2010).
32. J. Dudek, private communication.33. M. Sugawara et al., Eur. Phys. J. A 16, 409 (2003).34. Y. Toh, T. Cozosnyka, M. Oshima, T. Hayakawa, H.
Kusakari, M. Sugawara, Y. Hatsukawa, J. Katakura, N.Shinohara, M. Matsuda, Eur. Phys. J. A 9, 353 (2000).
35. S.M.M. Wong, in Introductory Nuclear Physics (PrenticeHall, Englewood Cliffs, New Jersey, 1990).
36. S. Raman, C.W. Nestor, P. Tikkanen, At. Data Nucl. DataTables 78, 1 (2001).
37. S.F. Shen, S.J. Zheng, F.R. Xu, R. Wyss, Phys. Rev. C84, 044315 (2011).
38. J. Doring, G.D. Johns, M.A. Riley, S.L. Tabor, Y. Sun,J.A. Sheikh, Phys. Rev. C 57, 2912 (1998).
39. R. Palit, H.C. Jain, P.K. Joshi, J.A. Sheikh, Pramana 57,191 (2001).
40. G. Mukherjee, PhD Thesis, Visva Bharati University, San-tiniketan, India (1999).
41. A. Algora et al., Phys. Rev. C 61, 031303 (2000).42. J. Dudek, Z. Szymanski, T. Werner, Phys. Rev. C 23, 920
(1981).43. R.H. Spear, At. Data Nucl. Data Tables 42, 55 (1989)
(Oxford University Press, Oxford, 2005).44. H. Chen, P.L. Gardulski, M.L. Wiedenbeck, Nucl. Phys. A
219, 365 (1974).45. J.H. Hamilton, R.L. Robinson, A.V. Ramayya, Conference
on Nuclear Interactions, Canberra, Australia, 28 August -1 September 1978, in Lect. Notes Phys., Vol. 92 (1978)pp. 253-268.
Page 14 of 14 Eur. Phys. J. A (2012) 48: 99
46. Y. Toh, T. Czosnyka, T. Hayakawa, M. Sugawara, H.Kusakari, Y. Hatsukawa, M. Matsuda, J. Katakura, N. Shi-nohara, in Proceedings of the International Nuclear PhysicsConference, INPC 2001 (AIP, 2002) p. 793.
47. G. Alaga, K. Alder, A. Bohr, B.R. Mottleson, Mat. Fys.Medd. Dan. Vid. Selk. 29, no.9 (1955).
48. L. Wilets, M. Jean, Phys. Rev. 102, 788 (1956).