improving the management of system development to produce ...
127
IMPROVING THE MANAGEMENT OF SYSTEM DEVELOPMENT TO PRODUCE MORE AFFORDABLE MILITARY AVIONICS SYSTEMS By Jeremy P. Tondreault Bachelor of Science in Mechanical Engineering Syracuse University, 1995 Master of Engineering in Mechanical Engineering University of Massachusetts at Lowell, 2000 Submitted to the System Design and Management Program in partial fulfillment of the requirements for the degree of Master of Science in Engineering and Management At the Massachusetts Institute of Technology February, 2003 Signature of Author Jeremy Tondreault System Design and Management Program Certified by Eric Rebentisch Thesis Supervisor Research Associate, Center for Technology, Policy, and Industrial Development Accepted by Steven D. Eppinger Co-Director, LFM/SDM GM LFM Professor of Management Science and Engineering Systems Accepted by Paul A. Lagace Co-Director, LFM/SDM Professor of Aeronautics & Astronautics and Engineering Systems
-
Upload
khangminh22 -
Category
Documents
-
view
1 -
download
0
Transcript of improving the management of system development to produce ...
IMPROVING THE MANAGEMENT OF SYSTEM DEVELOPMENTTO PRODUCE MORE AFFORDABLE MILITARY AVIONICS
SYSTEMS
ByJeremy P. Tondreault
Bachelor of Science in Mechanical EngineeringSyracuse University, 1995
Master of Engineering in Mechanical EngineeringUniversity of Massachusetts at Lowell, 2000
Submitted to the System Design and Management Program in partialfulfillment of the requirements for the degree of
Master of Science in Engineering and Management
At the
Massachusetts Institute of Technology
February, 2003
Signature of AuthorJeremy Tondreault
System Design and Management Program
Certified byEric Rebentisch
Thesis SupervisorResearch Associate, Center for Technology, Policy, and Industrial Development
Accepted bySteven D. Eppinger
Co-Director, LFM/SDM GM LFM Professor of Management Science and Engineering Systems
Accepted byPaul A. Lagace
Co-Director, LFM/SDMProfessor of Aeronautics & Astronautics and Engineering Systems
_____________________________________________________________________________________
2
(THIS PAGE INTENTIONALLY LEFT BLANK.)
_____________________________________________________________________________________
3
Improving the Management of System Development to ProduceMore Affordable Military Avionics Systems
Jeremy P. Tondreault
Submitted to the System Design and Management Program in partial fulfillment of therequirements for the degree of
Master of Science in Engineering and Management
ABSTRACT
This thesis aims to improve the management of system development to deliver moreaffordable systems. Improving affordability is investigated from the avionics supplier’sperspective. An affordable system is defined as meeting customer needs forperformance and lifecycle cost in an over-constrained program space where initialdevelopment budget, schedule, performance and lifecycle cost goals are not allachievable. In certain segments of the military avionics market, the nature ofcompetition is changing from performance to affordability based. Firms that developcompetitive advantage in delivering affordable systems can capture market share.This research is different than most literature published on affordability because itfocuses on design innovation as opposed to product development andmanufacturing efficiency through Lean, Six-Sigma or other techniques. Lean and Six-Sigma are necessary to improve system affordability but not sufficient to developcompetitive advantage because they can be implemented by anyone on anysystem concept. Competitive advantage requires benefits from Lean and Six-Sigmaand design innovations focused on affordability. Step function type improvementscan be realized through system architecture and module design innovations thatstrike a better balance between lifecycle cost and performance.
Four areas are investigated: the nature of development focus during each designiteration, the role of requirements, managing lifecycle cost as a design requirementand effective integration of downstream knowledge into the design.
A model for developing requirements that strikes a better balance betweenperformance and lifecycle cost is suggested – treating lifecycle cost as a designrequirement and explicitly focusing on understanding the cost-performance tradespace before developing requirements. A product development model is suggested– focusing on achieving lifecycle cost goals first and using iterations to growperformance can lead to lower cost solutions. Both the requirements developmentand product development models require leveraging prior knowledge, technologyand capability. The requirements model requires high knowledge of system costdrivers and achievable performance. The product development model requires lowtechnical risk allowing the team to focus on affordability first without runningunacceptable levels of performance risk. Methods for increasing the effectiveintegration of downstream knowledge are also discussed.

_____________________________________________________________________________________
4
ACKNOWLEDGEMENTS
I am particularly thankful for my supporters at BAE SYSTEMS for sponsorship in theSystem Design and Management Program at MIT - Michael Dow, Director of F-22 andJSF Operations, Don Donovan, Vice President and General Manager of the F-22 andJSF Business Area and Edward Zraket, Vice President of Operations. Without theirsupport, I would not have pursued the System Design and Management program andthis thesis would not have been possible.
I would like to thank two professors in particular who helped structure my thoughtsand provided insights throughout the development of this thesis – my thesis advisor,Eric Rebentisch, and Kirk Bozdogan.
Most importantly, I would like to thank my wife, Samantha, who has been nothing butsupportive for the past two years despite the countless hours and weekends shewould have liked to have her husband focused on something other than schoolwork.
_____________________________________________________________________________________
5
TABLE OF CONTENTS
1 INTRODUCTION 8
1.1 EXECUTIVE SUMMARY 81.2 THESIS MOTIVATION - THE CHANGING NATURE OF COMPETITION FOR MILITARY AVIONICS FIRMS 111.3 THESIS PROBLEM STATEMENT AND RESEARCH OBJECTIVES 231.4 RESEARCH OVERVIEW AND SUMMARY OF THESIS CONTRIBUTIONS 26
2 LITERATURE REVIEW 27
2.1 LITERATURE REVIEW SYSTEMIC APPROACH 272.2 RESULTS OF LITERATURE ANALYSIS 282.3 DISCUSSION OF KEY POINTS 312.3.1 PRODUCT SYSTEM DESIGN 312.3.2 ORGANIZATIONAL ISSUES 362.3.3 PROGRAM MANAGEMENT AND THE DESIGN PROCESS 412.3.4 BUSINESS MODEL AND INCENTIVES 452.4 SUMMARY OF LITERATURE REVIEW LEADING TO KEY VARIABLES FOR THESIS RESEARCH 47
3 CASE STUDY RESEARCH OF SEVEN MILITARY AVIONICS PROGRAMS 49
3.1 RESEARCH FOCUS AND APPROACH 493.2 PROGRAM 1 523.2.1 PROGRAM HISTORY AND SUMMARY 523.2.2 CRITICAL ISSUES LEADING TO NOTEWORTHY NEGATIVE OUTCOMES 543.2.3 BEST PRACTICES LEADING TO NOTEWORTHY POSITIVE OUTCOMES 553.2.4 COLLABORATING ACROSS CRITICAL FUNCTIONAL OR ORGANIZATIONAL BOUNDARIES 563.2.5 SUMMARY 593.3 PROGRAM 2 613.3.1 PROGRAM HISTORY AND SUMMARY 613.3.2 CRITICAL ISSUES LEADING TO NOTEWORTHY NEGATIVE OUTCOMES 623.3.3 BEST PRACTICES LEADING TO NOTEWORTHY POSITIVE OUTCOMES 623.3.4 COLLABORATING ACROSS CRITICAL FUNCTIONAL OR ORGANIZATIONAL BOUNDARIES 643.3.5 SUMMARY 663.4 PROGRAMS 3 AND 4 673.4.1 PROGRAM HISTORY AND SUMMARY 673.4.2 CRITICAL ISSUES LEADING TO NOTEWORTHY NEGATIVE OUTCOMES 673.4.3 BEST PRACTICES LEADING TO NOTEWORTHY POSITIVE OUTCOMES 683.4.4 COLLABORATING ACROSS CRITICAL FUNCTIONAL OR ORGANIZATIONAL BOUNDARIES 693.4.5 SUMMARY 703.5 PROGRAM 5 723.5.1 PROGRAM HISTORY AND SUMMARY 723.5.2 CRITICAL ISSUES LEADING TO NOTEWORTHY NEGATIVE OUTCOMES 72
_____________________________________________________________________________________
6
3.5.3 BEST PRACTICES LEADING TO NOTEWORTHY POSITIVE OUTCOMES 733.5.4 COLLABORATING ACROSS CRITICAL FUNCTIONAL OR ORGANIZATIONAL BOUNDARIES 733.5.5 SUMMARY 743.6 PROGRAMS 6 AND 7 75
4 DISCUSSION OF RESULTS AND CONCLUSIONS 76
4.1 PROGRAM SUMMARIES 764.2 OVERVIEW OF CONCLUSIONS 784.3 DEVELOPMENT METHODOLOGY 804.4 ROLE OF REQUIREMENTS 884.5 LIFECYCLE COST AS A DESIGN REQUIREMENT 934.6 INTEGRATING DOWNSTREAM KNOWLEDGE 97
5 SUMMARY 99
APPENDIX A - BIBLIOGRAPHY FOR LITERATURE SURVEY 101APPENDIX B - KEY POINTS SUMMARIZED FOR LITERATURE SURVEY 105APPENDIX C – RESEARCH QUESTIONNAIRE 124
_____________________________________________________________________________________
7
TABLE OF FIGURES
Figure 1.2.1 Trajectory of Aircraft costs, Defense Budget and GNP .....................................11Figure 1.2.2 Dominant design in tactical aircraft is well established....................................12Figure 1.2.3 Utterback's model of industry maturation ...........................................................13Figure 1.2.4 Typical pattern of number of competing firms through industry maturation 13Figure 1.2.5 Utterback analysis of Typewriter, Automobile and Aeronautics Industries....14Figure 1.2.6 Quantity of new aircraft during an engineer's career is shrinking...................14Figure 1.2.7 Consolidation suggests industry has entered the "specific phase" .................15Figure 1.2.8 Annual procurement quantities of tactical aircraft...........................................16Figure 1.2.9 The Boeing Company's Affordability Goals and 2001 Status ...........................17Figure 1.2.10 Cost of Avionics as a % of total air vehicle costs..............................................17Figure 1.2.11 Operational advantage in manufacturing.......................................................18Figure 1.2.12 Operational advantages in designing the car.................................................19Figure 1.2.13 Increasing market share of Japanese automotive firms ................................19Figure 1.2.14 Lifecycle cost committed vs. incurred during a typical program.................21Figure 2.2.1 Tabular Results of Literature Analysis.....................................................................28Figure 2.2.2 Graphical Results of Literature Analysis................................................................29Figure 2.2.3 Percentage of key points in "primary" and "secondary" broad areas...........30Figure 2.3.1 Lifecycle cost committed vs. incurred during a typical program...................31Figure 2.3.2 Potential benefits from subsystem commonality strategies .............................32Figure 2.3.3 Organization structure, roles and responsibilities................................................36Figure 2.3.4 Traditional product development process..........................................................41Figure 2.3.5 Benefits to customer and supplier of long term fixed price contracts ...........46Figure 4.3.1 Model 1 Development Methodology ..................................................................81Figure 4.3.2 Decision model for decided between Model 1and Model 2.........................83Figure 4.3.3 Decision model for Program 1 and Program 3 ...................................................84Figure 4.3.4 Decision model for Program 2 and Program 7 ...................................................85Figure 4.3.5 Decision model for Program 4 and Program 5 ...................................................86Figure 4.3.6 Model 2 viewed as a subset of Model 1 entering at a more mature stage .87Figure 4.4.1 LIfecycle cost committed vs. incurred during a typical program…………….88Figure 4.4.2 Typical relationship between cost and performance.......................................89Figure 4.4.3 Underlying dynamics that lead to over-constrained requirements................90Figure 4.4.4 Model 2 can be viewed as a subset of Model 1 at a more mature stage….91
_____________________________________________________________________________________
8
1 Introduction
1.1 Executive Summary
Problem StatementThis thesis investigates improving military avionics system affordability from an avionicssupplier’s perspective. An affordable system is defined as one that meets thecustomer’s needs for performance and lifecycle cost in a, typically, over-constrainedprogram space – meaning development budget, schedule, performance andlifecycle cost requirements are not all achievable. Over-constrained programs arecommon in the military avionics industry for two reasons. First, the acquisition processfavors over-constrained programs in competitive acquisitions. Avionics suppliers arepaid by their customers to develop new systems so new business is awarded on thepromise of future capability, not the demonstration of current capability. This processfavors optimistic projections of future capability leading to over-constrainedprograms. Second, new system development is inherently costly, time consuming anduncertain. New development programs are always trying to stretch and optimize thesystem performance and lifecycle cost to provide significant improvements fromlegacy systems within the budget and schedule constraints. Uncertainty existsregarding the optimal balance of performance and cost. A valuable aspect of adevelopment program is collaboration between customer and supplier to optimizeperformance and cost as the uncertainty is gradually reduced. The optimalperformance and cost is often different than the program's original goals.
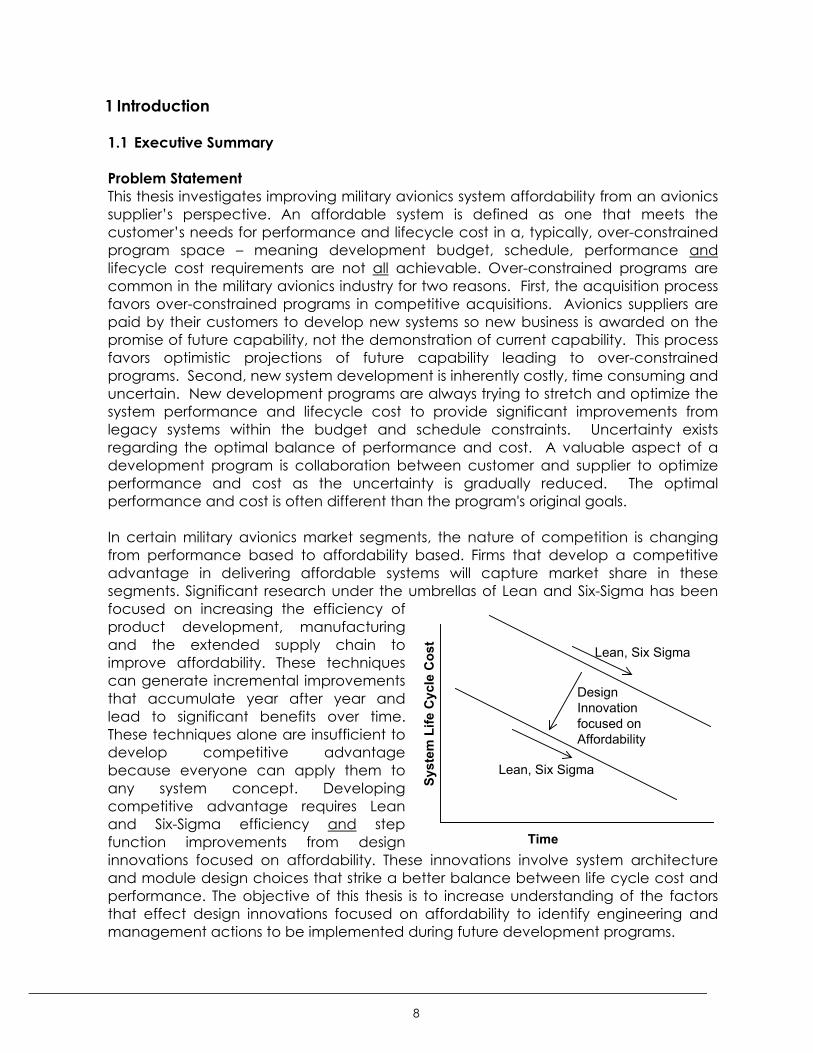
In certain military avionics market segments, the nature of competition is changingfrom performance based to affordability based. Firms that develop a competitiveadvantage in delivering affordable systems will capture market share in thesesegments. Significant research under the umbrellas of Lean and Six-Sigma has beenfocused on increasing the efficiency ofproduct development, manufacturingand the extended supply chain toimprove affordability. These techniquescan generate incremental improvementsthat accumulate year after year andlead to significant benefits over time.These techniques alone are insufficient todevelop competitive advantagebecause everyone can apply them toany system concept. Developingcompetitive advantage requires Leanand Six-Sigma efficiency and stepfunction improvements from designinnovations focused on affordability. These innovations involve system architectureand module design choices that strike a better balance between life cycle cost andperformance. The objective of this thesis is to increase understanding of the factorsthat effect design innovations focused on affordability to identify engineering andmanagement actions to be implemented during future development programs.
Syst
em L
ife C
ycle
Cos
t
Time
Lean, Six Sigma
DesignInnovationfocused onAffordability
Lean, Six Sigma
_____________________________________________________________________________________
9
Originality RequirementThis research is different than most literature on affordability because it focuses ondesign innovation as opposed to product development and manufacturingefficiency through Lean or Six Sigma. This thesis extends the body of system designand management knowledge by explicitly exploring the impacts the programmanager or chief engineer of an avionics system development program can have onsystem affordability. Four broad areas were researched: the nature of developmentfocus during each design iteration, the role of performance requirements, treatingcost as a design requirement and integrating downstream knowledge into the designprocess. The conclusions are based on case study investigations of seven militaryavionics development programs ranging from single module hardware programs withproducts that fit in the palm of your hand to large scale avionics systems involvinghundreds of pounds of hardware and hundreds of thousands of lines of softwarecode.
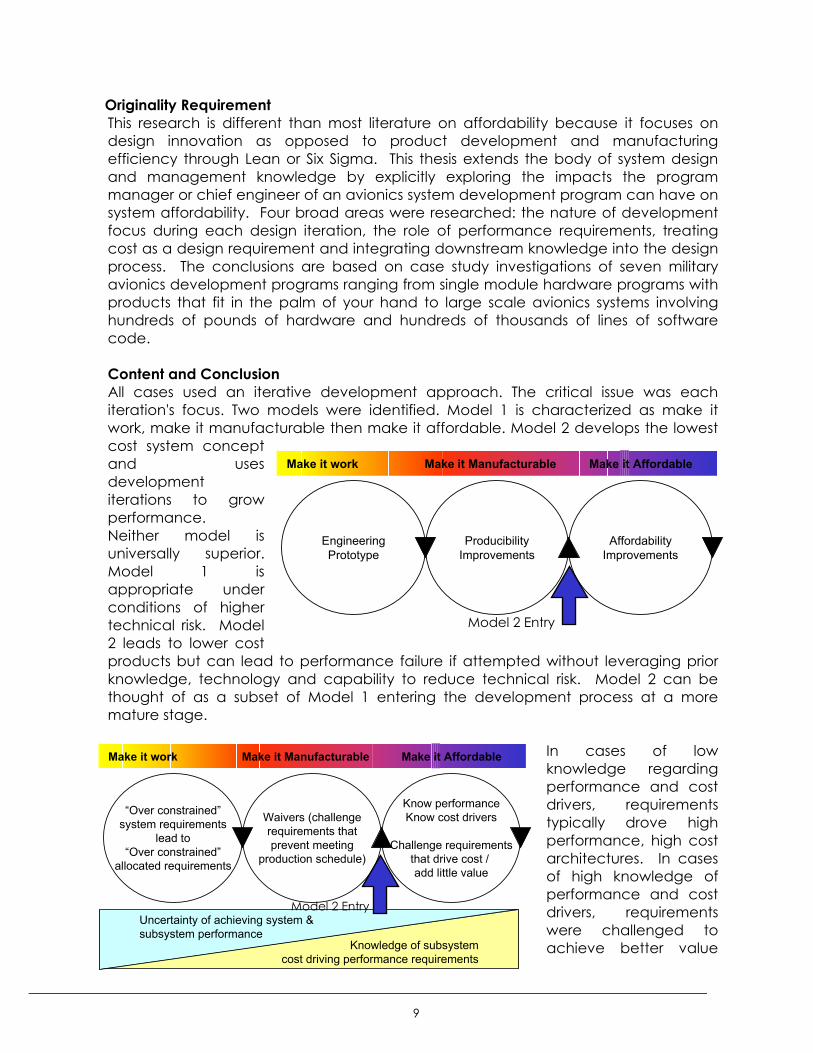
Content and ConclusionAll cases used an iterative development approach. The critical issue was eachiteration's focus. Two models were identified. Model 1 is characterized as make itwork, make it manufacturable then make it affordable. Model 2 develops the lowestcost system conceptand usesdevelopmentiterations to growperformance.Neither model isuniversally superior.Model 1 isappropriate underconditions of highertechnical risk. Model2 leads to lower costproducts but can lead to performance failure if attempted without leveraging priorknowledge, technology and capability to reduce technical risk. Model 2 can bethought of as a subset of Model 1 entering the development process at a moremature stage.
In cases of lowknowledge regardingperformance and costdrivers, requirementstypically drove highperformance, high costarchitectures. In casesof high knowledge ofperformance and costdrivers, requirementswere challenged toachieve better value
AffordabilityImprovements
ProducibilityImprovements
EngineeringPrototype
Make it work Make it Manufacturable Make it Affordable
Model 2 Entry
Know performanceKnow cost drivers
Challenge requirementsthat drive cost / add little value
Waivers (challengerequirements thatprevent meeting
production schedule)
“Over constrained”system requirements
lead to“Over constrained”
allocated requirements
Make it work Make it Manufacturable Make it Affordable
Knowledge of subsystemcost driving performance requirements
Uncertainty of achieving system & subsystem performance
Model 2 Entry
_____________________________________________________________________________________
10
systems. Model 2 can again be viewed as a subset of Model 1 entering at a moremature state.
Cost has traditionally been considered a manufacturing or management requirementin the defense industry. Barriers exist to treating cost as a design requirement. There isoften an engineering cultural bias against cost as a design requirement. The costestimating tools are underdeveloped for use when they are needed most - in earlystages of development. This suggests another reason why an affordability focustypically comes in latter design iterations when more knowledge of cost drivers exists.Although barriers exist, this research suggests more affordable products aredeveloped when cost is managed using a system engineering approach of allocatingcost goals throughout the system hierarchy and treating them like designrequirements.
Integrated Product Teams provide the presence of downstream knowledge in thedesign process. Downstream knowledge takes the form of hardware engineers in thesystem design process or manufacturers in the hardware design process. Effective useof this knowledge is a classic problem of collaboration across boundaries wherepresence of knowledge is necessary but not sufficient. Mutual dependence, a cleargoal and mutually accepted methods of assessing progress towards that goal greatlyincrease the effective use of downstream knowledge in system and product design.Mutual dependence can be established by treating cost as a design requirement –designers will need manufacturers’ knowledge about cost to meet this designrequirement. Cost analysis is the method for assessing progress provided it is credibleto engineering and manufacturing stakeholders.
This thesis focuses on the underlying dynamics of a product development programand engineering and management execution issues that effect system affordability. Amodel for developing requirements that strike a better balance betweenperformance and lifecycle cost is suggested – treating lifecycle cost as a designrequirement and explicitly focusing on understanding the cost-performance space asa tool for developing more balanced requirements. A product development model issuggested – focusing on achieving lifecycle cost goals first and using iterations togrow performance can lead to affordability improvements. Both the requirementsdevelopment and product development models require leveraging prior knowledge,technology and capability. The requirements model requires high knowledgeregarding cost drivers and achievable performance. The product developmentmodel requires low technical risk allowing the team to focus on affordability firstwithout running unacceptable levels of performance risk. Methods for increasing theeffective integration of downstream knowledge are discussed.
_____________________________________________________________________________________
11
1.2 Thesis Motivation - The Changing Nature of Competition for Military Avionics Firms
This thesis is motivated by the changing nature of competition for military avionicsfirms. The nature of competition has transitioned from performance to affordability.This section contains four main themes to illustrate this conclusion:
− The industry focus on affordability is here to stay− This shift in focus is tangibly impacting behavior and decision making at the
government and prime contractors. Military avionics firms that prosper in thisera will develop a competitive advantage in delivering affordable systems.
− Affordable doesn't mean inexpensive. Affordable means better value, whichencompasses both performance and cost.
− The primary leverage is in product design with secondary leverage inmanufacturing and supply chain efficiency
The industry focus on affordability is here to stay
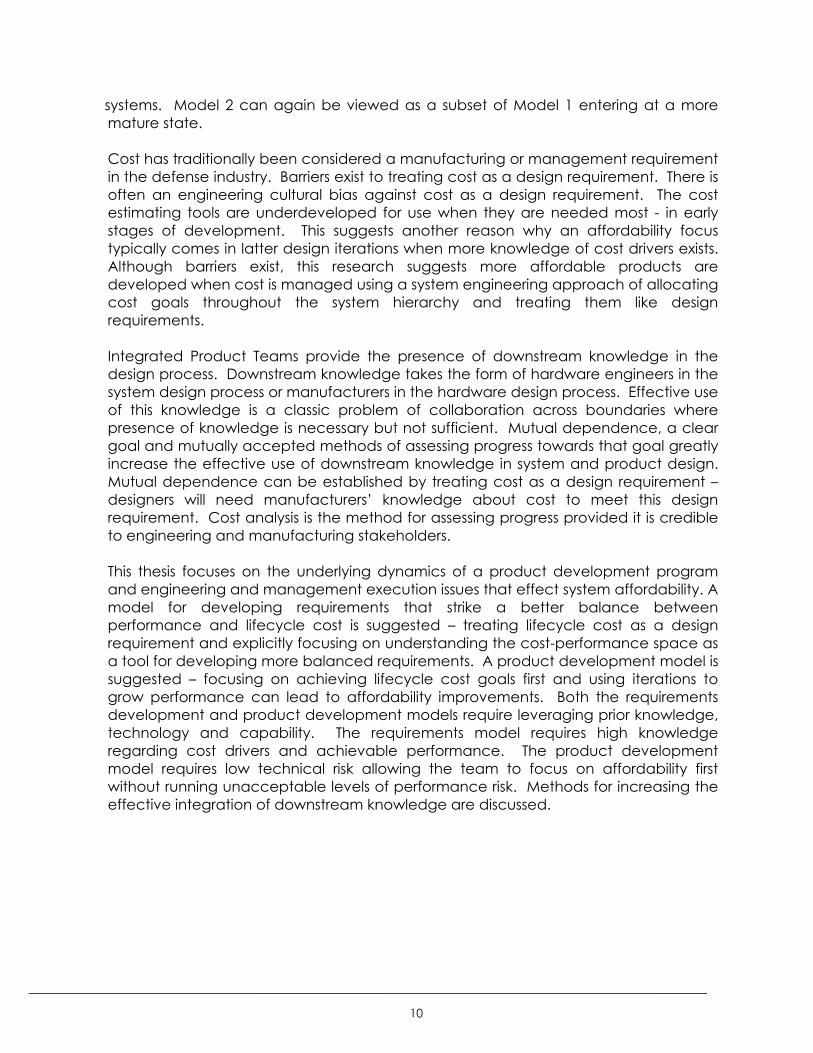
Norm Augustine, the former CEO and Chairman of Lockheed Martin, illustrated analarming trend in his book, Augustine's Laws. If the tactical aircraft unit cost trendfrom the early 1900's through the 1980's continued on its historical trajectory, the entireUnited States defense budget will be able to afford only a single tactical aircraft bythe year 2050. What's worse, the entire United States gross national product will berequired to afford a single tactical aircraft by the year 2125 (figure 1.2.1).
Figure 1.2.1 Trajectory of Aircraft costs, Defense Budget and GNP1
Of course, this is a satirical view of a very unlikely future. The United States will neverspend its entire defense budget or its entire gross national product on a single aircraft.The point is that if the U.S. Aerospace Enterprise continues unchanged the entiredefense department budget or gross national product would eventually be requiredto purchase a single tactical aircraft. This is a powerful argument that the increasedfocus on affordability is necessary in the aerospace industry.
On January 20, 1999, Dr. Jacques S. Gansler, the Undersecretary of Defense forAcquisition and Technology published a memo entitled, Into the 21st Century - A
_____________________________________________________________________________________
12
Strategy for Affordability2. This memo has become to be known as the "Better, Faster,Cheaper" directive for the U.S. defense industry.
Dr. Gansler set three top-level goals with objective, verifiable measurements ofsuccess to focus the affordability initiative.1. Field high-quality defense products quickly; support them responsively.
− Reduce acquisition cycle time by 50% for all 1999 program starts
− Reduce logistics response time by 50% by 2000 and 85% by 2005
− Reduce repair cycle times by 10% by 2000 and 25% by 2001
2. Lower the total ownership cost of defense products.
− Achieve unit cost and total ownership cost targets (that are 20-50% belowhistorical norms) for 50% of systems in acquisition by 2000.
− Reduce logistics support cost by 7% by 2000, 10% by 2001 and 20% by 2005.
3. Reduce the overhead cost of the acquisition and logistics infrastructure.
− Reduce funding required by logistics infrastructure from 64% of TotalObligation Authority in 1997 to 62% by 2000, 60% by 2001 and 53% by 2005.
The importance of Dr. Gansler's memo over the long term remains to be seen. It is asign that at the highest level's of the defense department, there is a recognition anddemand for increased focus on affordability in system development, acquisition andfield support.
James M. Utterback identified a trend of industry maturation and demonstrated it tobe widely applicable in many different industries in his book, Mastering the Dynamicsof Innovation3. Utterback's model contains three distinct phases in an industry'smaturation: the fluid phase, transitional phase and specific phase.
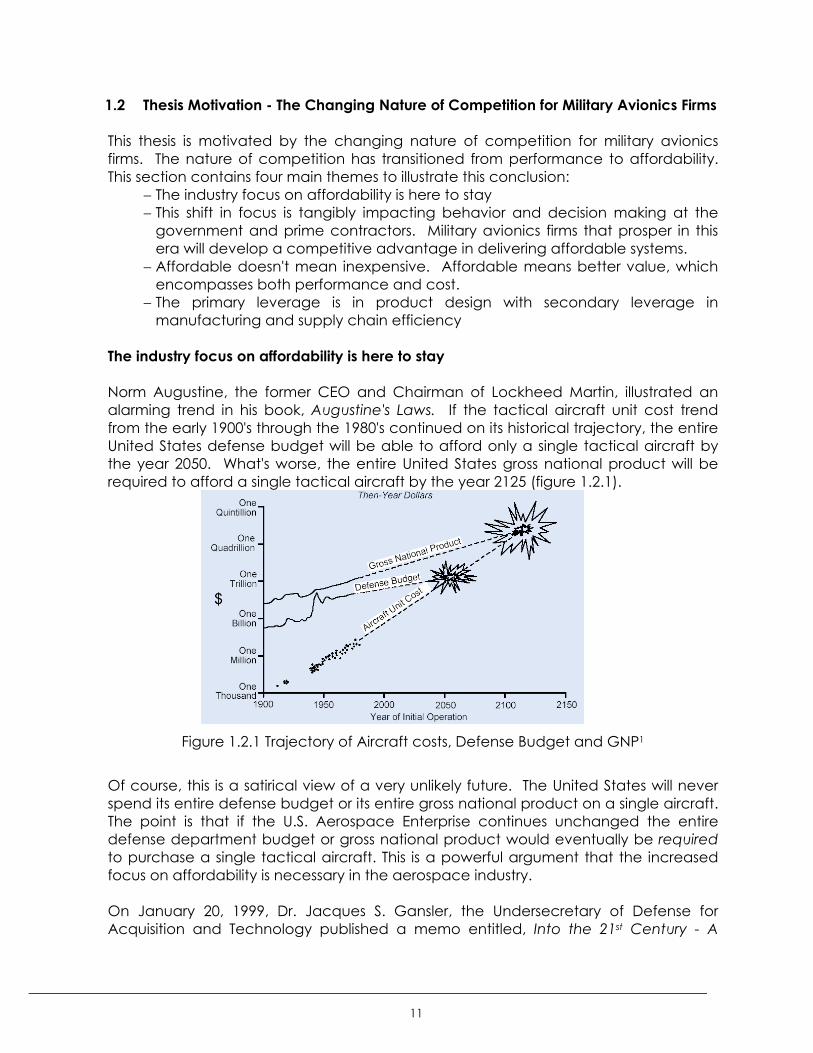
The fluid phase is marked by frequent, major product changes with a small butincreasing number of firms competing primarily on functional product performance.Market share fluctuates widely as fundamental product breakthroughs are relativelycommon until a dominant design is reached. A dominant design becomes the set ofproduct features that define the essence of the product from that point forward. Thedominant design for a tactical aircraft was reached many years ago (figure 1.2.2)and consists of a one or two seat cockpit, one or two jet engines, two forward wings,aft wings and aft horizontal stabilizers.
Figure 1.2.2 Dominant design in tactical aircraft is well established4
_____________________________________________________________________________________
13
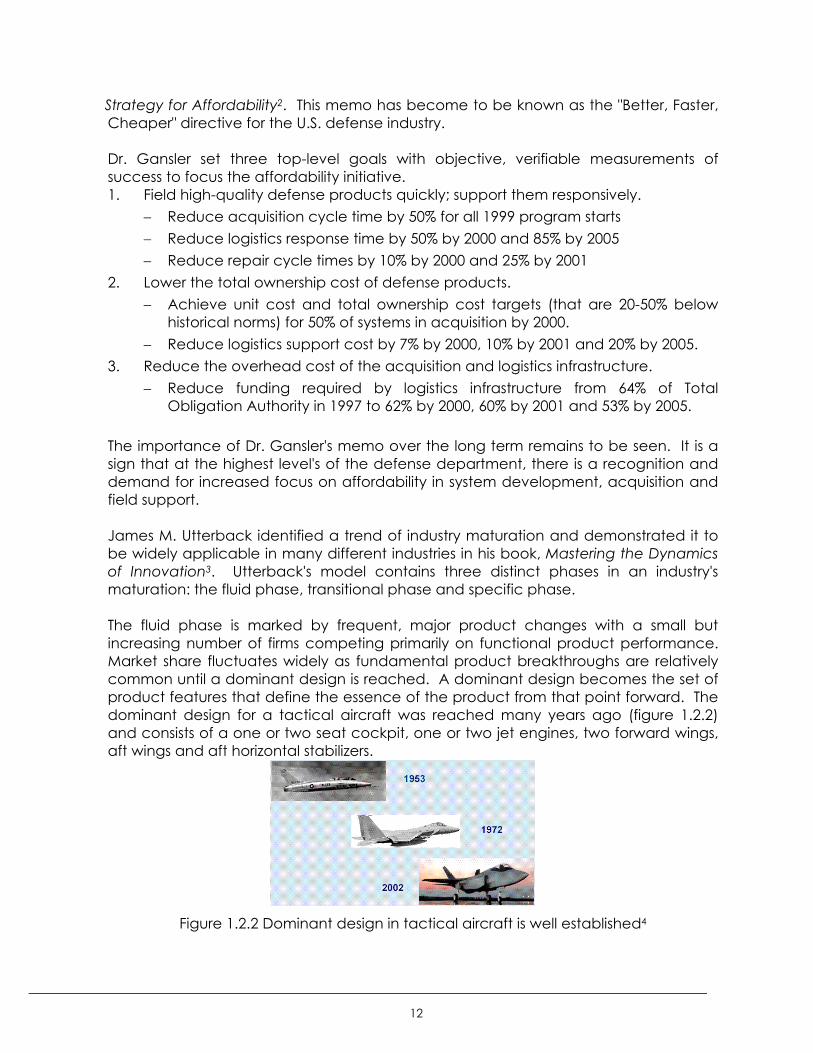
Once a dominant design is reached, the industry enters the transitional phase markedby industry consolidation creating a rapid decline in the number of competing firms,product innovation focusing on features instead of the fundamental architecture andcompetition transitioning towards product variation and ease of use. The transitionalphase leads into the specific phase marked by very few firms competing onaffordability with largely undifferentiated products and the primary industry innovationfocused on affordability and process innovations. Figure 1.2.3 illustrates the transitionfrom product innovation and performance focus to process innovation andaffordability focus as an industry matures through the fluid, transitional and specificphases.
Figure 1.2.3 Utterback's model of industry maturation5
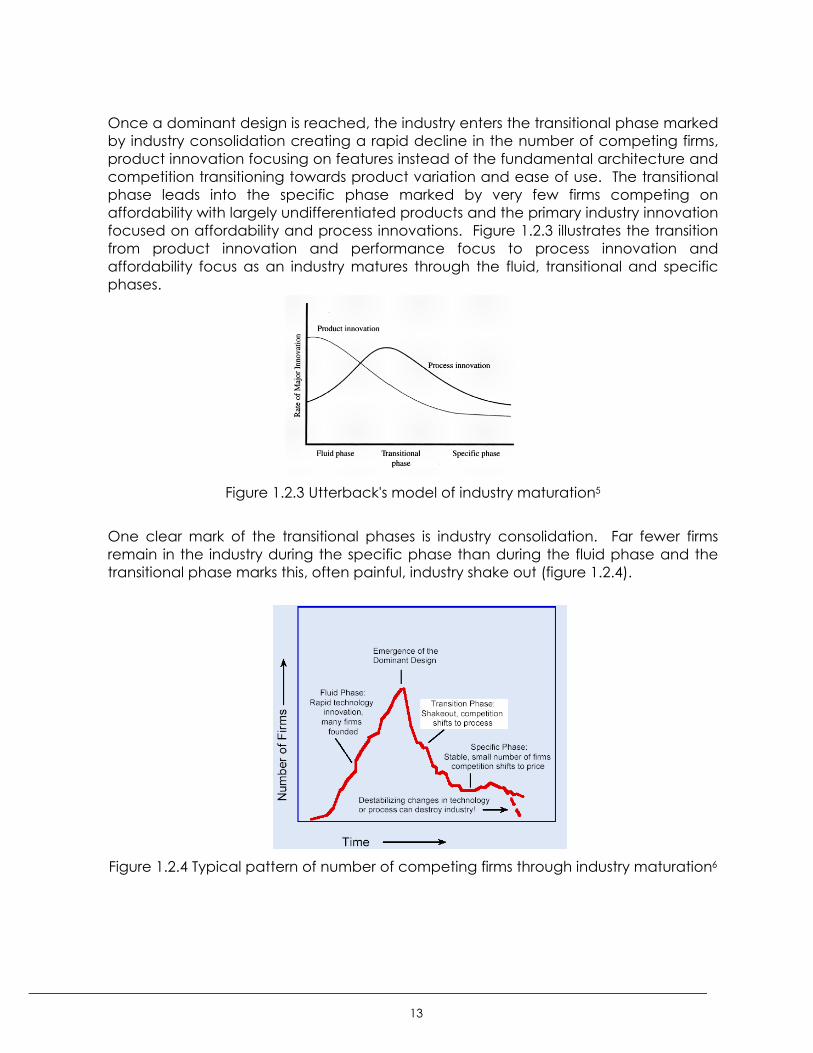
One clear mark of the transitional phases is industry consolidation. Far fewer firmsremain in the industry during the specific phase than during the fluid phase and thetransitional phase marks this, often painful, industry shake out (figure 1.2.4).
Figure 1.2.4 Typical pattern of number of competing firms through industry maturation6
_____________________________________________________________________________________
14
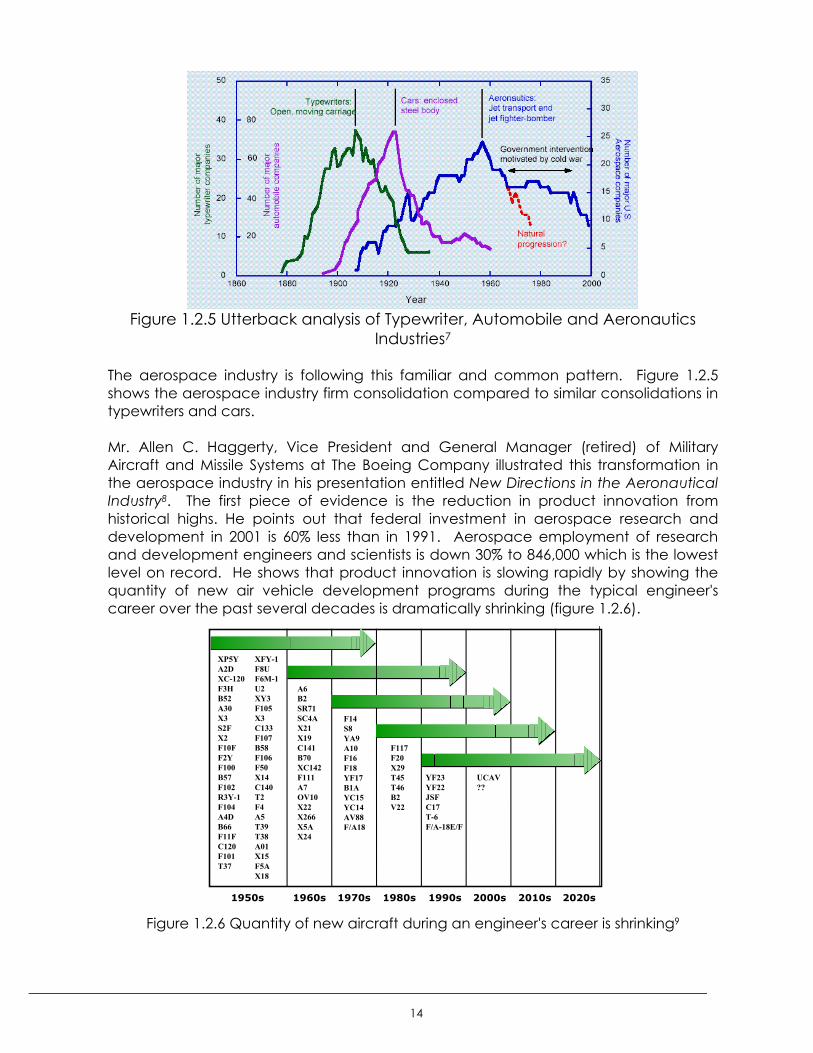
Figure 1.2.5 Utterback analysis of Typewriter, Automobile and AeronauticsIndustries7
The aerospace industry is following this familiar and common pattern. Figure 1.2.5shows the aerospace industry firm consolidation compared to similar consolidations intypewriters and cars.
Mr. Allen C. Haggerty, Vice President and General Manager (retired) of MilitaryAircraft and Missile Systems at The Boeing Company illustrated this transformation inthe aerospace industry in his presentation entitled New Directions in the AeronauticalIndustry8. The first piece of evidence is the reduction in product innovation fromhistorical highs. He points out that federal investment in aerospace research anddevelopment in 2001 is 60% less than in 1991. Aerospace employment of researchand development engineers and scientists is down 30% to 846,000 which is the lowestlevel on record. He shows that product innovation is slowing rapidly by showing thequantity of new air vehicle development programs during the typical engineer'scareer over the past several decades is dramatically shrinking (figure 1.2.6).
Figure 1.2.6 Quantity of new aircraft during an engineer's career is shrinking9
1950s 1970s 1980s 1990s 2000s 2010s 2020s1960s
XP5Y XFY-1A2D F8UXC-120 F6M-1F3H U2B52 XY3A30 F105X3 X3S2F C133X2 F107F10F B58F2Y F106F100 F50B57 X14F102 C140R3Y-1 T2F104 F4A4D A5B66 T39F11F T38C120 A01F101 X15T37 F5A
X18
A6B2SR71SC4AX21X19C141B70XC142F111A7OV10X22X266X5AX24
F14S8YA9A10F16F18YF17B1AYC15YC14AV88F/A18
F117F20X29T45T46B2V22
YF23YF22JSFC17T-6F/A-18E/F
UCAV??
_____________________________________________________________________________________
15
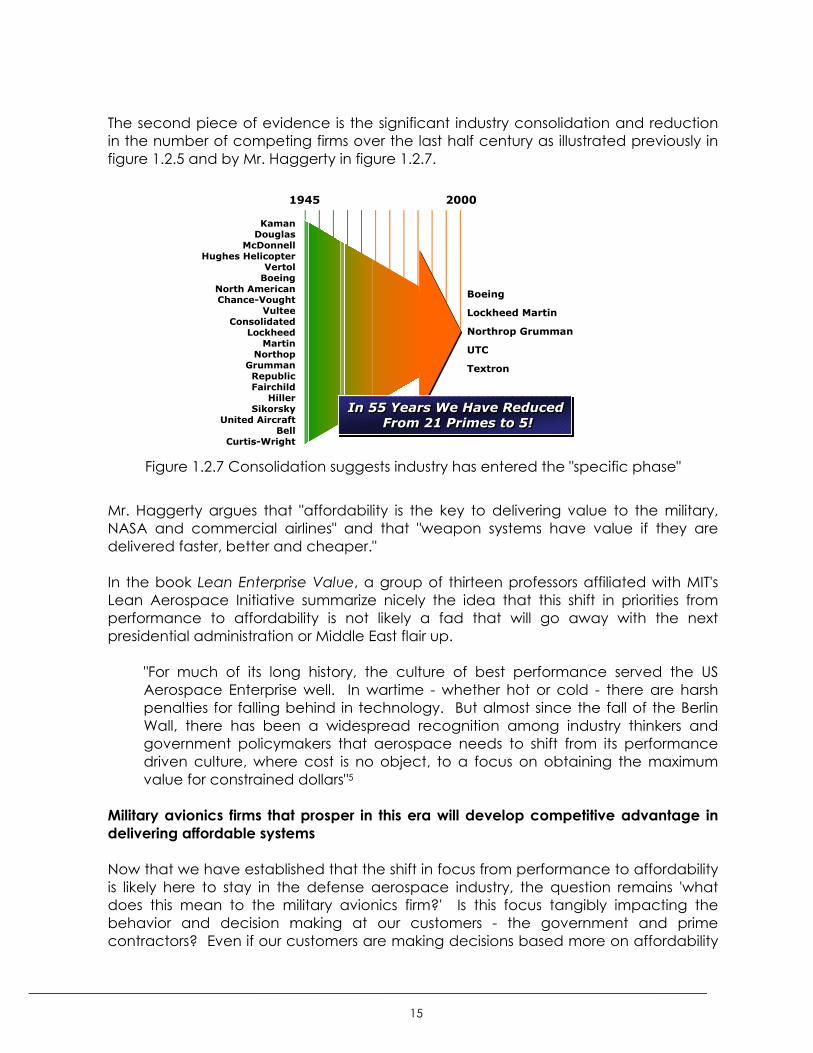
The second piece of evidence is the significant industry consolidation and reductionin the number of competing firms over the last half century as illustrated previously infigure 1.2.5 and by Mr. Haggerty in figure 1.2.7.
Figure 1.2.7 Consolidation suggests industry has entered the "specific phase"
Mr. Haggerty argues that "affordability is the key to delivering value to the military,NASA and commercial airlines" and that "weapon systems have value if they aredelivered faster, better and cheaper."
In the book Lean Enterprise Value, a group of thirteen professors affiliated with MIT'sLean Aerospace Initiative summarize nicely the idea that this shift in priorities fromperformance to affordability is not likely a fad that will go away with the nextpresidential administration or Middle East flair up.
"For much of its long history, the culture of best performance served the USAerospace Enterprise well. In wartime - whether hot or cold - there are harshpenalties for falling behind in technology. But almost since the fall of the BerlinWall, there has been a widespread recognition among industry thinkers andgovernment policymakers that aerospace needs to shift from its performancedriven culture, where cost is no object, to a focus on obtaining the maximumvalue for constrained dollars"5
Military avionics firms that prosper in this era will develop competitive advantage indelivering affordable systems
Now that we have established that the shift in focus from performance to affordabilityis likely here to stay in the defense aerospace industry, the question remains 'whatdoes this mean to the military avionics firm?' Is this focus tangibly impacting thebehavior and decision making at our customers - the government and primecontractors? Even if our customers are making decisions based more on affordability
KamanDouglas
McDonnellHughes Helicopter
VertolBoeing
North AmericanChance-Vought
VulteeConsolidated
LockheedMartin
NorthopGrummanRepublicFairchild
HillerSikorsky
United AircraftBell
Curtis-Wright
Boeing
Lockheed Martin
Northrop Grumman
UTC
Textron
20001945
In 55 Years We Have Reduced From 21 Primes to 5!
In 55 Years We Have Reduced From 21 Primes to 5!
_____________________________________________________________________________________
16
than performance at the highest levels of their organizations, will avionics receivesufficient top management attention to filter this shift in focus to avionics? Is thereeven industrial precedence that suggests operational advantage in deliveringaffordable products can translate into competitive advantage and increased marketshare?
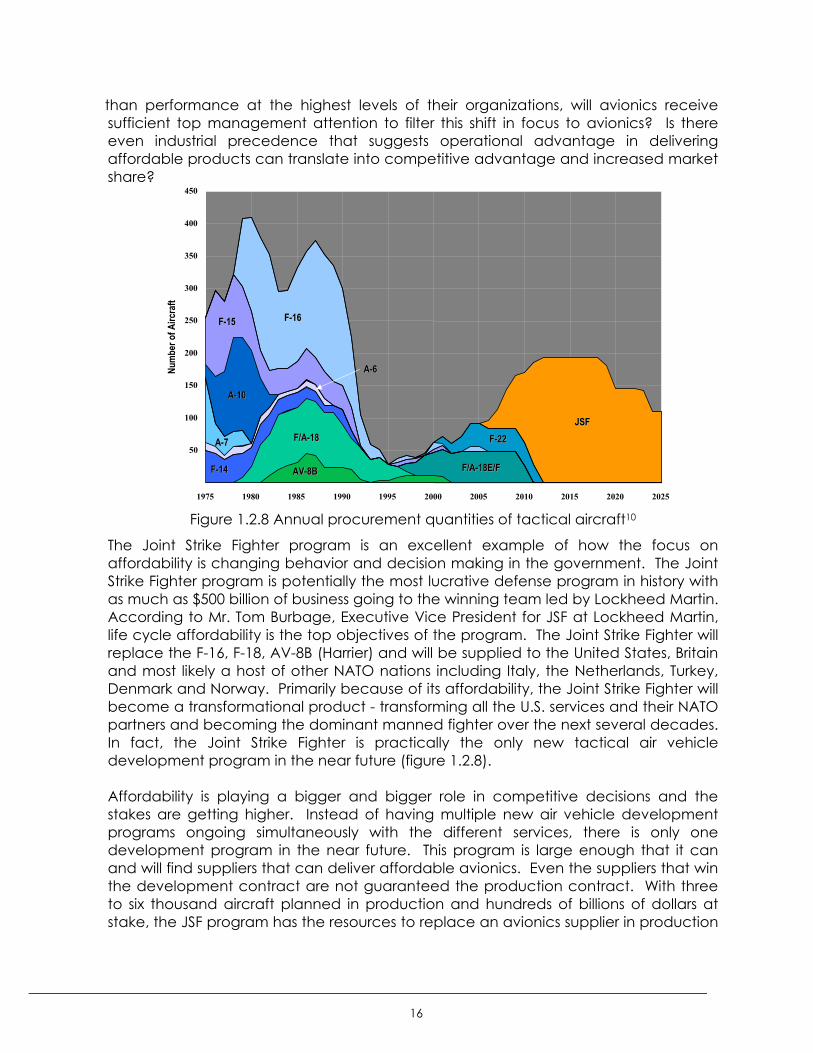
Figure 1.2.8 Annual procurement quantities of tactical aircraft10
The Joint Strike Fighter program is an excellent example of how the focus onaffordability is changing behavior and decision making in the government. The JointStrike Fighter program is potentially the most lucrative defense program in history withas much as $500 billion of business going to the winning team led by Lockheed Martin.According to Mr. Tom Burbage, Executive Vice President for JSF at Lockheed Martin,life cycle affordability is the top objectives of the program. The Joint Strike Fighter willreplace the F-16, F-18, AV-8B (Harrier) and will be supplied to the United States, Britainand most likely a host of other NATO nations including Italy, the Netherlands, Turkey,Denmark and Norway. Primarily because of its affordability, the Joint Strike Fighter willbecome a transformational product - transforming all the U.S. services and their NATOpartners and becoming the dominant manned fighter over the next several decades.In fact, the Joint Strike Fighter is practically the only new tactical air vehicledevelopment program in the near future (figure 1.2.8).
Affordability is playing a bigger and bigger role in competitive decisions and thestakes are getting higher. Instead of having multiple new air vehicle developmentprograms ongoing simultaneously with the different services, there is only onedevelopment program in the near future. This program is large enough that it canand will find suppliers that can deliver affordable avionics. Even the suppliers that winthe development contract are not guaranteed the production contract. With threeto six thousand aircraft planned in production and hundreds of billions of dollars atstake, the JSF program has the resources to replace an avionics supplier in production
50
100
150
200
250
300
350
400
450
1975 1980 1985 1990 1995 2000 2005 2010 2015 2020 2025
Num
ber o
f Airc
raft
JSFJSFF-22F-22
F-16F-16F-15F-15
A-10A-10
A-7A-7
A-6A-6
F-14F-14 F/A-18E/FF/A-18E/F
F/A-18F/A-18
AV-8BAV-8B
_____________________________________________________________________________________
17
if they do not develop a capable, affordable system during the developmentprogram.
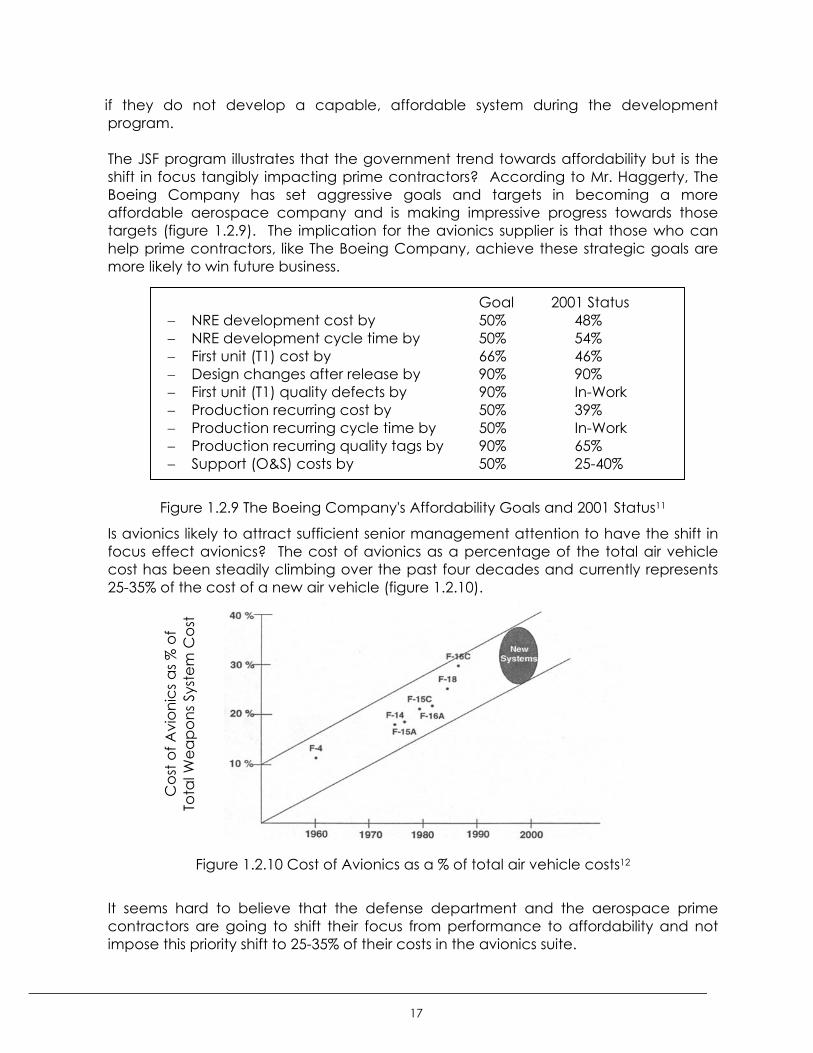
The JSF program illustrates that the government trend towards affordability but is theshift in focus tangibly impacting prime contractors? According to Mr. Haggerty, TheBoeing Company has set aggressive goals and targets in becoming a moreaffordable aerospace company and is making impressive progress towards thosetargets (figure 1.2.9). The implication for the avionics supplier is that those who canhelp prime contractors, like The Boeing Company, achieve these strategic goals aremore likely to win future business.
Goal 2001 Status− NRE development cost by 50% 48%− NRE development cycle time by 50% 54%− First unit (T1) cost by 66% 46%− Design changes after release by 90% 90%− First unit (T1) quality defects by 90% In-Work− Production recurring cost by 50% 39%− Production recurring cycle time by 50% In-Work− Production recurring quality tags by 90% 65%− Support (O&S) costs by 50% 25-40%
Figure 1.2.9 The Boeing Company's Affordability Goals and 2001 Status11
Is avionics likely to attract sufficient senior management attention to have the shift infocus effect avionics? The cost of avionics as a percentage of the total air vehiclecost has been steadily climbing over the past four decades and currently represents25-35% of the cost of a new air vehicle (figure 1.2.10).
Figure 1.2.10 Cost of Avionics as a % of total air vehicle costs12
It seems hard to believe that the defense department and the aerospace primecontractors are going to shift their focus from performance to affordability and notimpose this priority shift to 25-35% of their costs in the avionics suite.
Co
st o
f Avi
on
ics
as
% o
fTo
tal W
ea
po
ns
Syst
em
Co
st
_____________________________________________________________________________________
18
Industrial precedence exists to suggest that military avionics firms that developoperational advantages in delivering affordable systems could exploit this forcompetitive advantage and increased market share. The automotive industry is agood example of this precedence. Figure 1.2.5 illustrates that aerospace andautomotive industries have both been through a very similar pattern outlined byUtterback's model of industry maturation but the automotive industry experiencedmaturation several decades before aerospace.
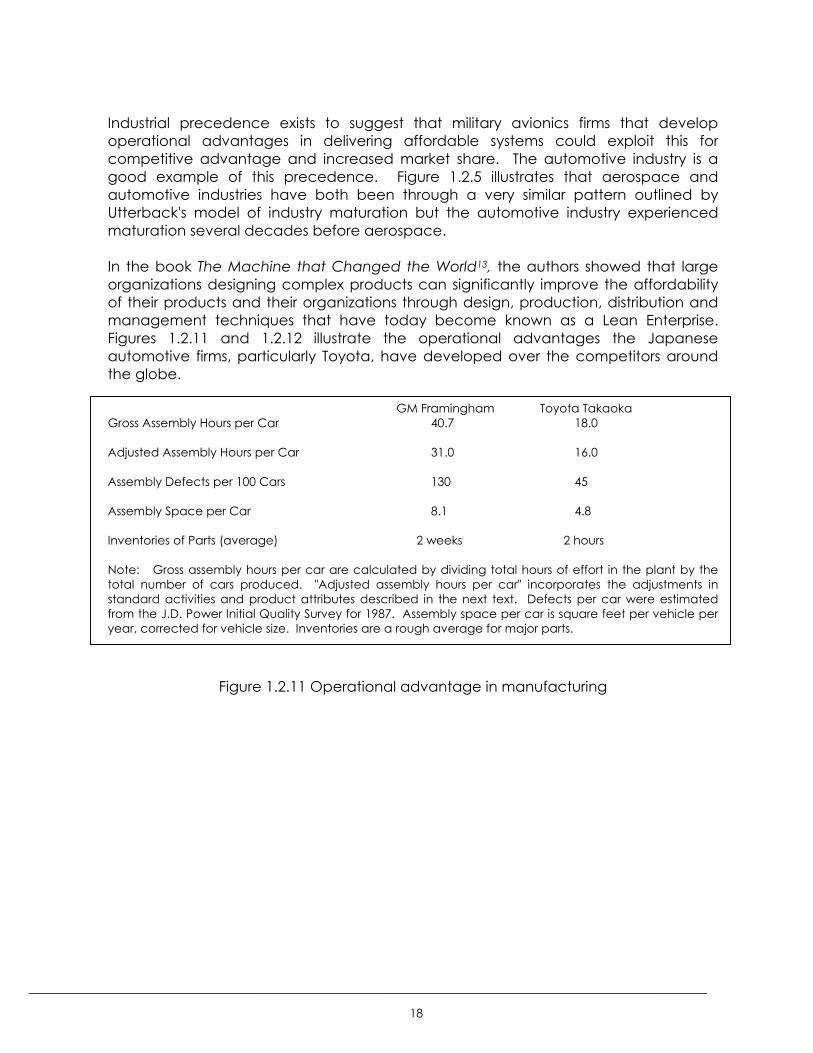
In the book The Machine that Changed the World13, the authors showed that largeorganizations designing complex products can significantly improve the affordabilityof their products and their organizations through design, production, distribution andmanagement techniques that have today become known as a Lean Enterprise.Figures 1.2.11 and 1.2.12 illustrate the operational advantages the Japaneseautomotive firms, particularly Toyota, have developed over the competitors aroundthe globe.
GM Framingham Toyota TakaokaGross Assembly Hours per Car 40.7 18.0
Adjusted Assembly Hours per Car 31.0 16.0
Assembly Defects per 100 Cars 130 45
Assembly Space per Car 8.1 4.8
Inventories of Parts (average) 2 weeks 2 hours
Note: Gross assembly hours per car are calculated by dividing total hours of effort in the plant by thetotal number of cars produced. "Adjusted assembly hours per car" incorporates the adjustments instandard activities and product attributes described in the next text. Defects per car were estimatedfrom the J.D. Power Initial Quality Survey for 1987. Assembly space per car is square feet per vehicle peryear, corrected for vehicle size. Inventories are a rough average for major parts.
Figure 1.2.11 Operational advantage in manufacturing
_____________________________________________________________________________________
19
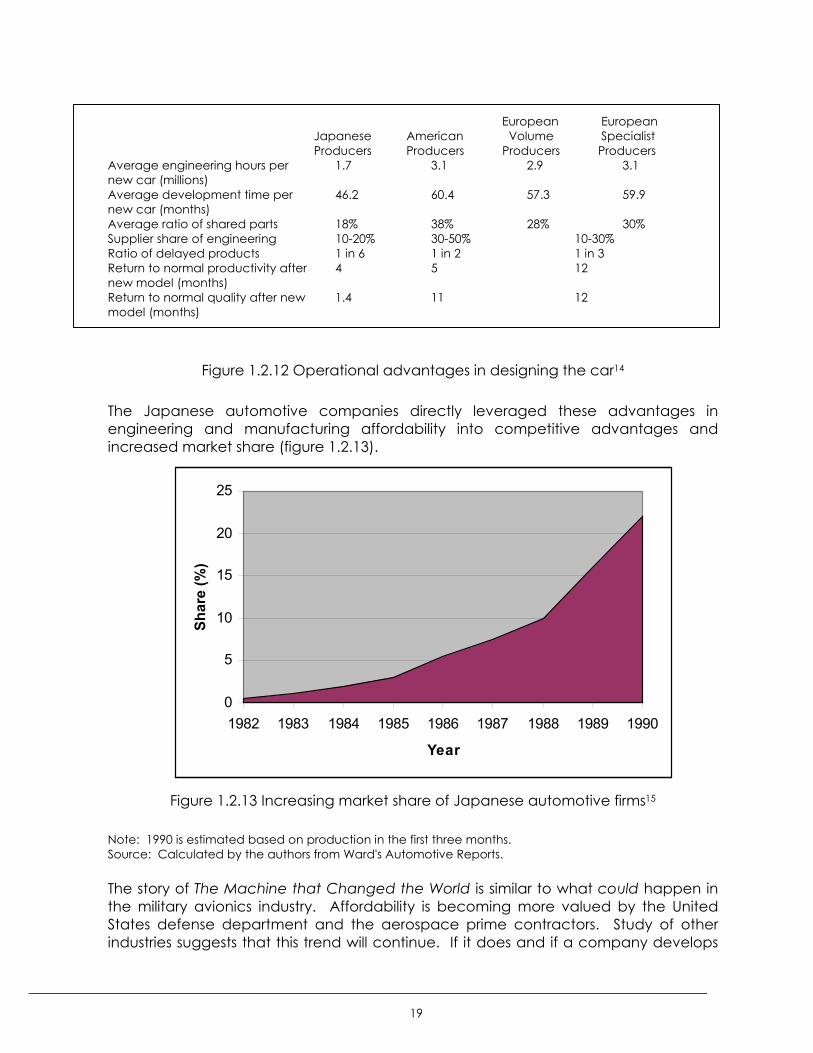
European European Japanese American Volume Specialist Producers Producers Producers Producers
Average engineering hours per 1.7 3.1 2.9 3.1new car (millions)Average development time per 46.2 60.4 57.3 59.9new car (months)Average ratio of shared parts 18% 38% 28% 30%Supplier share of engineering 10-20% 30-50% 10-30%Ratio of delayed products 1 in 6 1 in 2 1 in 3Return to normal productivity after 4 5 12new model (months)Return to normal quality after new 1.4 11 12model (months)
Figure 1.2.12 Operational advantages in designing the car14
The Japanese automotive companies directly leveraged these advantages inengineering and manufacturing affordability into competitive advantages andincreased market share (figure 1.2.13).
Figure 1.2.13 Increasing market share of Japanese automotive firms15
Note: 1990 is estimated based on production in the first three months.Source: Calculated by the authors from Ward's Automotive Reports.
The story of The Machine that Changed the World is similar to what could happen inthe military avionics industry. Affordability is becoming more valued by the UnitedStates defense department and the aerospace prime contractors. Study of otherindustries suggests that this trend will continue. If it does and if a company develops
0
5
10
15
20
25
1982 1983 1984 1985 1986 1987 1988 1989 1990
Year
Shar
e (%
)

_____________________________________________________________________________________
20
an edge against its competitors in developing affordable systems, similar market sharechanges among existing companies are likely.
Affordability means better value which encompasses both performance and cost
In the book Lean Enterprise Value, a group of professors in MIT's Lean AerospaceInitiative recognize that the typical approach firms take when industries enter thespecific phase of the industry lifecycle is to focus purely on the cost side ofaffordability by striving to become more efficient. The authors' advocate an alternateapproach for aerospace firms - focusing on increasing value. "Value must be thefocus. It encompasses both 'performance', the dominant focus of the Cold War era,and affordability, the dominant focus since the Cold War"5. However, the authorsrecognize the challenge before the aerospace industry.
"How does a set of industrial enterprises focused on high performance productsto an annual market of $100 billion find business equilibrium as half of the industrybecomes excess capacity in just a few years and affordability becomesparamount? How does an industry that has accommodated itself over decadesto excelling in technology adapt to a new era in which efficiency ofmanufacturing and lifecycle support processes becomes dominant? Culturalmonuments include a mindset that focuses on best technical performance tothe detriment of other considerations, a systemic aversion to risk anddisincentives to cost reductions."16
The authors' stress that increasing the value of aerospace products means balancingoperational capability and cost over the product lifecycle which offers uniquechallenges for aerospace firms to be adaptable over the long lifecycles of theirproducts.
"It is not unusual to take five to ten years or more to develop an field a newaerospace product, which might then have a lifetime exceeding fifty years.Over such long periods, the external environment, available technology andmarket opportunities all change. This often results in radical changes in the waythe end user will use the product, as well as in the needs of other stakeholders.Programs today must be flexible and adaptable, effectively integrating bothmature and emerging technologies, anticipating and mitigating instabilities infunding and staffing, pioneering new business models and operating in a globalcontext. Some programs, such as the F-16, succeed in this environment. Othersdo not. F-16 value has been sustained as much by its adaptability to changes inthe global environment and customer requirements as by its drive foraffordability. The F-16's success rate in open sales competitions is 67% over itslifetime, 75% in the 1990's and 100% from 1996 to 2000."
The primary leverage is in product design with secondary leverage in manufacturingand supply chain efficiency
Lean is getting significant attention throughout the aerospace industry because of thesignificant impacts it had on the automotive industry. Although Lean Thinking has
_____________________________________________________________________________________
21
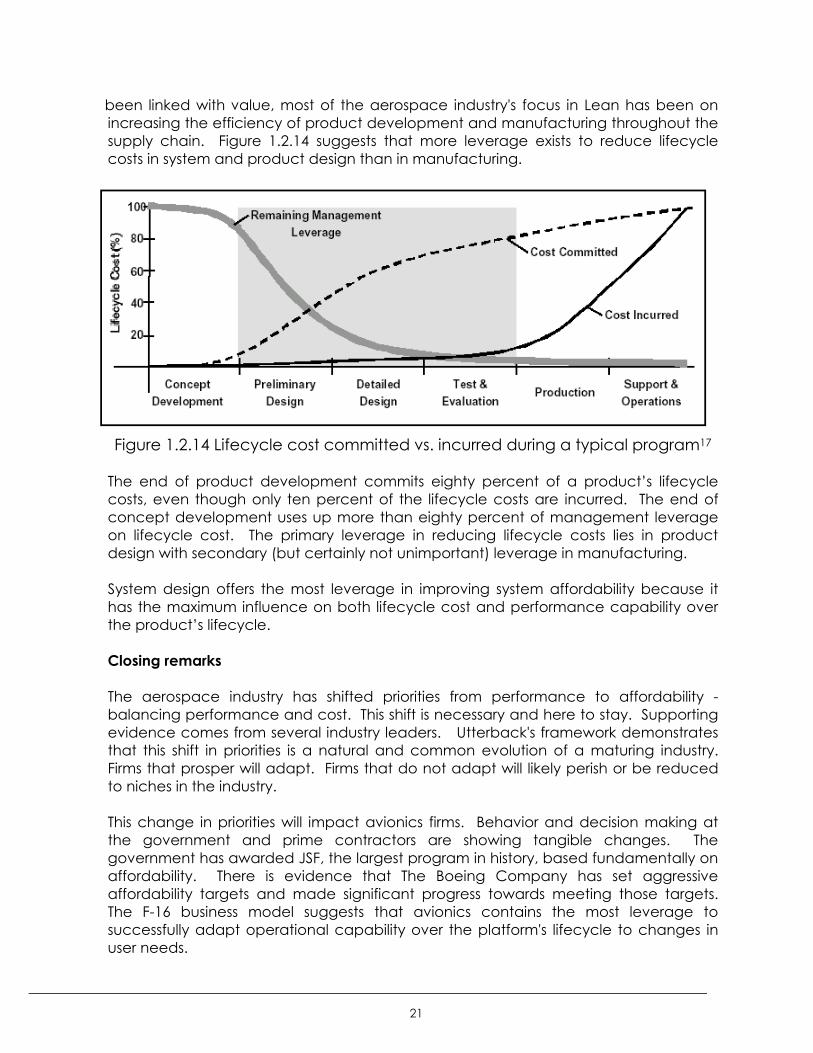
been linked with value, most of the aerospace industry's focus in Lean has been onincreasing the efficiency of product development and manufacturing throughout thesupply chain. Figure 1.2.14 suggests that more leverage exists to reduce lifecyclecosts in system and product design than in manufacturing.
Figure 1.2.14 Lifecycle cost committed vs. incurred during a typical program17
The end of product development commits eighty percent of a product’s lifecyclecosts, even though only ten percent of the lifecycle costs are incurred. The end ofconcept development uses up more than eighty percent of management leverageon lifecycle cost. The primary leverage in reducing lifecycle costs lies in productdesign with secondary (but certainly not unimportant) leverage in manufacturing.
System design offers the most leverage in improving system affordability because ithas the maximum influence on both lifecycle cost and performance capability overthe product’s lifecycle.
Closing remarks
The aerospace industry has shifted priorities from performance to affordability -balancing performance and cost. This shift is necessary and here to stay. Supportingevidence comes from several industry leaders. Utterback's framework demonstratesthat this shift in priorities is a natural and common evolution of a maturing industry.Firms that prosper will adapt. Firms that do not adapt will likely perish or be reducedto niches in the industry.
This change in priorities will impact avionics firms. Behavior and decision making atthe government and prime contractors are showing tangible changes. Thegovernment has awarded JSF, the largest program in history, based fundamentally onaffordability. There is evidence that The Boeing Company has set aggressiveaffordability targets and made significant progress towards meeting those targets.The F-16 business model suggests that avionics contains the most leverage tosuccessfully adapt operational capability over the platform's lifecycle to changes inuser needs.
_____________________________________________________________________________________
22
The change will not be easy. There are significant cultural barriers to overcome. But,there is an opportunity for avionics firms that develop an operational advantage indelivering affordable products. The Japanese automakers are an example of firmsthat did develop such an operational advantage over their competitors and wereable to translate that into increased market share.
MIT's Lean Aerospace Initiative is advocating that the focus on affordability shouldmean a focus on value - creatively balancing performance and cost. Based on thisconcept and the fact that 80% of a typical system's lifecycle costs are committed bythe end of the development program, the most leverage for the avionics firm is tofocus on system and product design.
_____________________________________________________________________________________
23
1.3 Thesis Problem Statement and Research Objectives
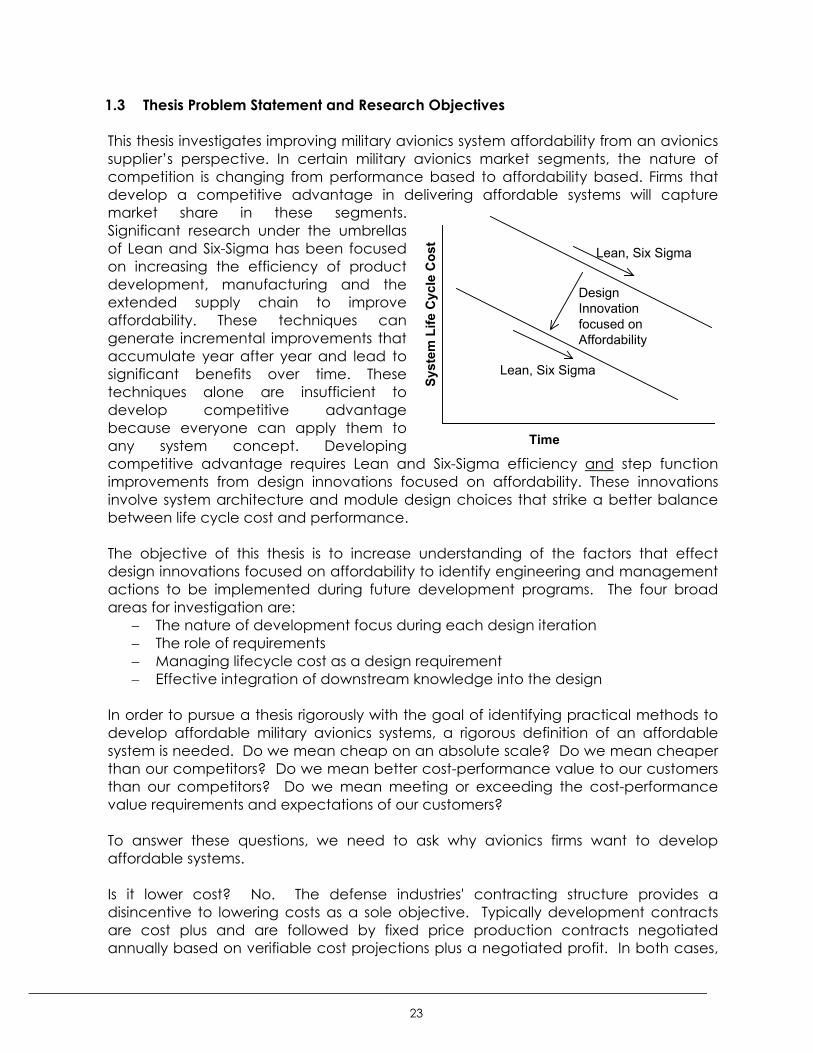
This thesis investigates improving military avionics system affordability from an avionicssupplier’s perspective. In certain military avionics market segments, the nature ofcompetition is changing from performance based to affordability based. Firms thatdevelop a competitive advantage in delivering affordable systems will capturemarket share in these segments.Significant research under the umbrellasof Lean and Six-Sigma has been focusedon increasing the efficiency of productdevelopment, manufacturing and theextended supply chain to improveaffordability. These techniques cangenerate incremental improvements thataccumulate year after year and lead tosignificant benefits over time. Thesetechniques alone are insufficient todevelop competitive advantagebecause everyone can apply them toany system concept. Developingcompetitive advantage requires Lean and Six-Sigma efficiency and step functionimprovements from design innovations focused on affordability. These innovationsinvolve system architecture and module design choices that strike a better balancebetween life cycle cost and performance.
The objective of this thesis is to increase understanding of the factors that effectdesign innovations focused on affordability to identify engineering and managementactions to be implemented during future development programs. The four broadareas for investigation are:
− The nature of development focus during each design iteration− The role of requirements− Managing lifecycle cost as a design requirement− Effective integration of downstream knowledge into the design
In order to pursue a thesis rigorously with the goal of identifying practical methods todevelop affordable military avionics systems, a rigorous definition of an affordablesystem is needed. Do we mean cheap on an absolute scale? Do we mean cheaperthan our competitors? Do we mean better cost-performance value to our customersthan our competitors? Do we mean meeting or exceeding the cost-performancevalue requirements and expectations of our customers?
To answer these questions, we need to ask why avionics firms want to developaffordable systems.
Is it lower cost? No. The defense industries' contracting structure provides adisincentive to lowering costs as a sole objective. Typically development contractsare cost plus and are followed by fixed price production contracts negotiatedannually based on verifiable cost projections plus a negotiated profit. In both cases,
Syst
em L
ife C
ycle
Cos
tTime
Lean, Six Sigma
DesignInnovationfocused onAffordability
Lean, Six Sigma
_____________________________________________________________________________________
24
the avionics firm's sales and profits are based on their costs - the more cost, the moresales and more profit. Conversely, on a given program lower costs lead to lower salesand lower profit. Low cost can not be the only objective for the avionics firm.
Is it competitive advantage? Yes. Avionics firms want to develop affordable systemsbecause that is what their customers want. Much has been documented about theshift in the U.S. defense industry from demanding performance to demandingaffordability or value. There are actually several types of cost. Today, the defensecustomer is demanding performance - Life Cycle Cost value. Life Cycle Cost (LCC) isthe sum of the development costs, production acquisition costs and operations andsupport costs (repairs, spares, maintenance, training, etc). The desire to developaffordable systems is primarily a response to customer demand.
If the goal is competitive advantage, it is useful to briefly discuss how avionics firmscompete. Avionics firms do not sell products, they sell perceived capability todevelop products. Avionics firms are paid, typically in a cost reimbursable contract,to develop products for their customer. At this point, the customer is typically lockedinto the selected supplier for production because the switching costs to a differentsupplier are cost prohibitive. In general, avionics firms win new business when they winthe development contract. When they compete for the development contract, theydo not typically have a product, they have a concept of a product based on theircapabilities developed on internal research and development, contract researchand development and previous development programs. So, they are selling aconcept and perceived future capability based on demonstrated past capability. Toachieve the competitive advantage these firms seek, it is critical to demonstrateresults in developing and delivering systems with high performance-LCC value.
Back to our series of questions regarding the definition of an affordable system.
Do we mean cheap on an absolute scale? No.
Do we mean cheaper than our competitors? No. Today's defense customer is notdemanding cheap products, he is demanding costs with higher value. Just beingcheaper than your competition is not necessarily a competitive advantage.
Do we mean better cost-performance value to our customers than our competitors?Do we mean meeting or exceeding the cost-performance value requirements andexpectations of our customers? Yes. In practical terms it is difficult to directlycompare the value of products because avionics firms don't typically develop directlycompeting products. They compete for the right to develop a product so only oneproduct is ultimately developed leaving nothing to compare directly. The criticalpoint to achieve competitive advantage is to develop a track record of developingsystems that meet or exceed the customers performance requirements and Life CycleCost expectations. This track record becomes part of the demonstrated pastcapability that is the basis for competition on new business opportunities.
This leads to an objective of developing an industry reputation for delivering systemsthat meet the customer’s performance and lifecycle cost goals. Delivering what was
_____________________________________________________________________________________
25
promised hardly seems like a path for developing competitive advantage – it seemslike a path for achieving parity with competitors. Don’t all firms deliver what theypromise most of the time? Wouldn’t a firm striving for competitive advantage need toexceed the customer’s goals for performance and life cycle cost? This leads to afundamental dynamic in the defense industry somewhat unique from other industries.New business is awarded on the promise of future capability, not the demonstration ofexisting capability. Awarding new business on the promise of future capabilitytypically leads to aggressive projections of future capability in order to win newbusiness in highly competitive acquisitions. Aggressive projections can take the formof optimistic estimates in development cost, development schedule, systemperformance and/or system lifecycle cost. Since the contract is awarded to the firmthat credibly projects the best capability, highly competitive acquisitions typicallyresult in a over-constrained program space – meaning development budget,schedule, performance and lifecycle cost goals are not all achievable. Anotherdynamic that leads to initially over-constrained programs is the relatively highuncertainty regarding achievable performance and lifecycle cost before thedevelopment program begins. The high uncertainty means that the initial set ofrequirements may not strike the best balance between performance and lifecyclecost within budget and schedule constraints. An inherent and value-added aspect ofa development program that has high initial uncertainty is collaboration betweencustomer and supplier to optimize the requirements to achieve the best balance ofperformance and lifecycle cost. This is why meeting both performance and lifecyclecost goals can create competitive advantage on over-constrained programs. Thisalso explains why over-constrained programs are common in the military avionicsindustry.
For this thesis, the definition of an affordable system is one that meets or exceeds thecustomers' goals for system performance and Life Cycle Cost in an over-constrainedprogram space where development budget, schedule, performance and life cyclecost goals are not all achievable.
_____________________________________________________________________________________
26
1.4 Research Overview and Summary of Thesis Contributions
This research involved case study investigations of seven military avionicsdevelopment programs ranging in complexity from hardware development programswith products that fit in the palm of your hand to large system development programsinvolving hundreds of pounds of hardware and hundreds of thousands of lines ofsoftware code.
This thesis explicitly focuses on design innovation as a means to create step functionimprovements in system affordability. Although this focus is not unique, it does differfrom much of the published literature on affordability that is focused on increasingproductivity and efficiency in product development and manufacturing. This thesisexplicitly focuses on affordability defined as meeting or exceeding the customer’sgoals for system performance and lifecycle cost – indicating increasing value is amore appropriate objective than lower cost. This view that affordability has a costand a value component is an extension of the ideas published in Lean EnterpriseValue18, a book from MIT’s Lean Aerospace Initiative. Although the findings areprobably more generally applicable, this thesis investigates system affordabilityspecifically for military avionics systems and specifically from the perspective of theavionics supplier. This is different from most published research on affordabilityfocused on issues aimed at the government defense acquisition community oraerospace prime contractors. This thesis aims to contribute to the body of knowledgethat can help Tier 1 military suppliers develop competitive advantage in deliveringaffordable systems to their prime contractor or government customers by makingengineering and management changes in they way development programs areexecuted.
The thesis document is organized into five chapters or sections. This paragraphconcludes chapter 1, which introduces the topic, problem statement and brieflysummarizes the findings. Chapter 2 discusses topics published in the literature mostrelevant to the subject of system affordability and describes how the publishedliterature shaped the direction of this research. Chapter 3 describes the researchconducted for this thesis. Seven military avionics programs were researched byinterviewing forty engineers and managers. Chapter 4 discusses the results andconclusions the author reaches from the research described in Chapter 3. Chapter 5contains a brief summary and closing comments.
_____________________________________________________________________________________
27
2 Literature Review
2.1 Literature Review Systemic Approach
A literature review was conducted to understand the issues facing the aerospaceindustry today relevant to developing more affordable military systems. The goal ofthis review was to serve as a launching pad into the case study research documentedin section 3. The hypothesis of this literature review was that a lot can be learned bothfrom specific insights people write and by determining the topics people write about.A systemic approach was taken to analyze a significant quantity of literature todetermine what people write about. Seventy-five (75) documents were reviewedand the key points were summarized as critical issues or best practices. The seventy-five documents included 32 presentations, 17 masters and doctoral thesis, 26 whitepapers and published articles. There is a mix, but most of these documents representpractitioners experience as opposed to peer reviewed research. From these writings,440 key points were categorized as critical issues or best practices. Critical issues weredefined as important issues or challenges that must be overcome to improve theability to develop affordable systems. Best practices were defined as innovativepractices that serve as solutions to these types of issues. The following broad areaswere defined and each of the 440 key points were categorized into one of the areas:
− Product system design (architecture, technology, requirements)− Organizational issues (structure, learning, collaboration across boundaries)− Program management and product design process− Business model and incentives− Tools, metrics and goals− Culture− Manufacturing− Supply chain management− LEAN enterprise
The hypothesis of this analysis of the literature is that people write about their criticalissues (who would write about a trivial issue?). People write about their best practiceswhen they are relevant - when they address one or more critical issues. So,understanding what people are writing about, not just what they are saying, willprovide some insight into the critical issues facing the aerospace industry today. Ofcourse, this approach is limited by what people do write about so will not highlightany new issues. Section 2.2 will summarize the results of this systemic analysis of whatpeople write about. Section 2.3 will summarize key insights in the prominent broadareas.
_____________________________________________________________________________________
28
2.2 Results of Literature Analysis
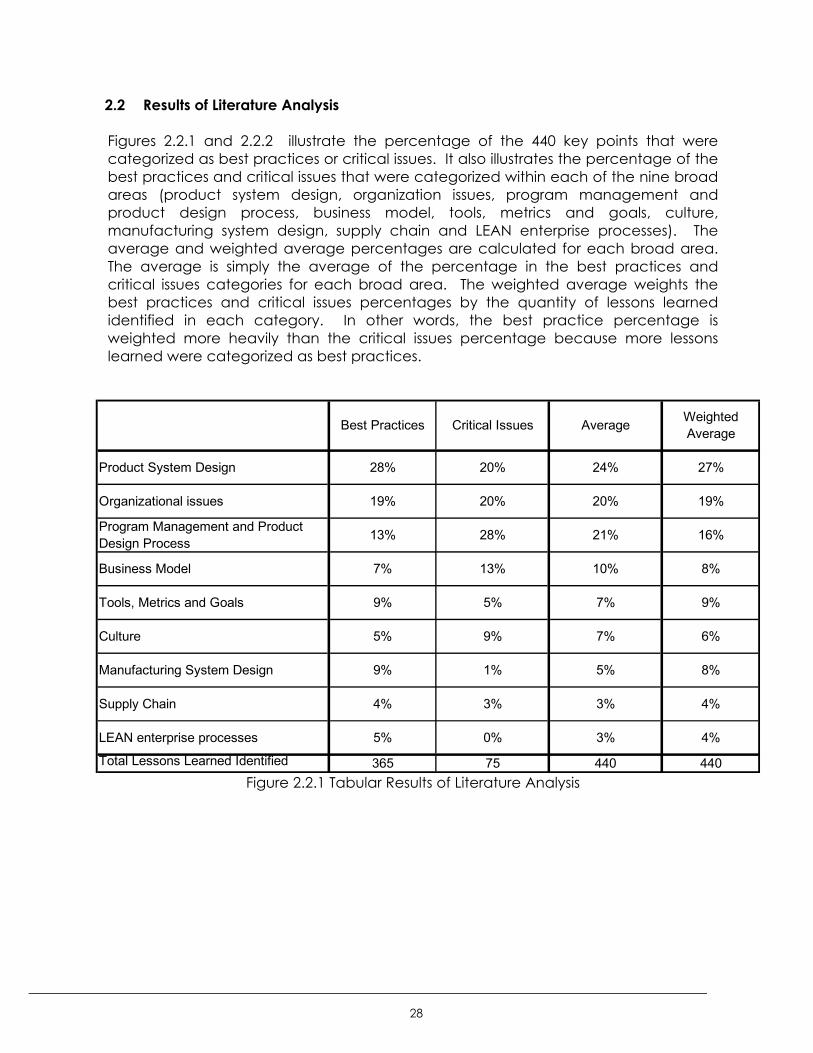
Figures 2.2.1 and 2.2.2 illustrate the percentage of the 440 key points that werecategorized as best practices or critical issues. It also illustrates the percentage of thebest practices and critical issues that were categorized within each of the nine broadareas (product system design, organization issues, program management andproduct design process, business model, tools, metrics and goals, culture,manufacturing system design, supply chain and LEAN enterprise processes). Theaverage and weighted average percentages are calculated for each broad area.The average is simply the average of the percentage in the best practices andcritical issues categories for each broad area. The weighted average weights thebest practices and critical issues percentages by the quantity of lessons learnedidentified in each category. In other words, the best practice percentage isweighted more heavily than the critical issues percentage because more lessonslearned were categorized as best practices.
Figure 2.2.1 Tabular Results of Literature Analysis
Best Practices Critical Issues Average Weighted Average
Product System Design 28% 20% 24% 27%
Organizational issues 19% 20% 20% 19%
Program Management and Product Design Process 13% 28% 21% 16%
Business Model 7% 13% 10% 8%
Tools, Metrics and Goals 9% 5% 7% 9%
Culture 5% 9% 7% 6%
Manufacturing System Design 9% 1% 5% 8%
Supply Chain 4% 3% 3% 4%
LEAN enterprise processes 5% 0% 3% 4%
Total Lessons Learned Identified 365 75 440 440
_____________________________________________________________________________________
29
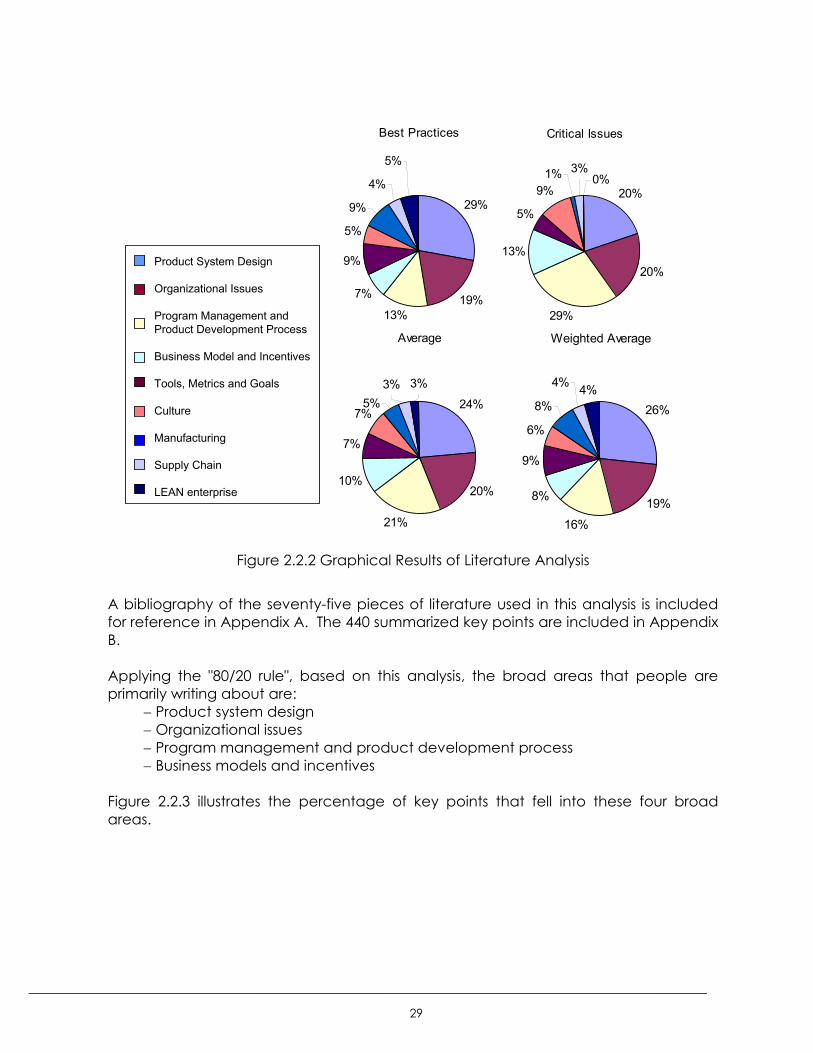
Figure 2.2.2 Graphical Results of Literature Analysis
A bibliography of the seventy-five pieces of literature used in this analysis is includedfor reference in Appendix A. The 440 summarized key points are included in AppendixB.
Applying the "80/20 rule", based on this analysis, the broad areas that people areprimarily writing about are:
− Product system design− Organizational issues− Program management and product development process− Business models and incentives
Figure 2.2.3 illustrates the percentage of key points that fell into these four broadareas.
Best Practices
29%
19%13%
7%
9%
5%
9%
4%
5%
Critical Issues
20%
20%
29%
13%
5%
9%1% 3%
0%
Average
24%
20%
21%
10%
7%
7%
3%3%5%
Weighted Average
26%
19%16%
8%
9%
6%
8%
4% 4%
Product System Design
Organizational Issues
Program Management and Product Development Process
Business Model and Incentives
Tools, Metrics and Goals
Culture
Manufacturing
Supply Chain
LEAN enterprise
_____________________________________________________________________________________
30
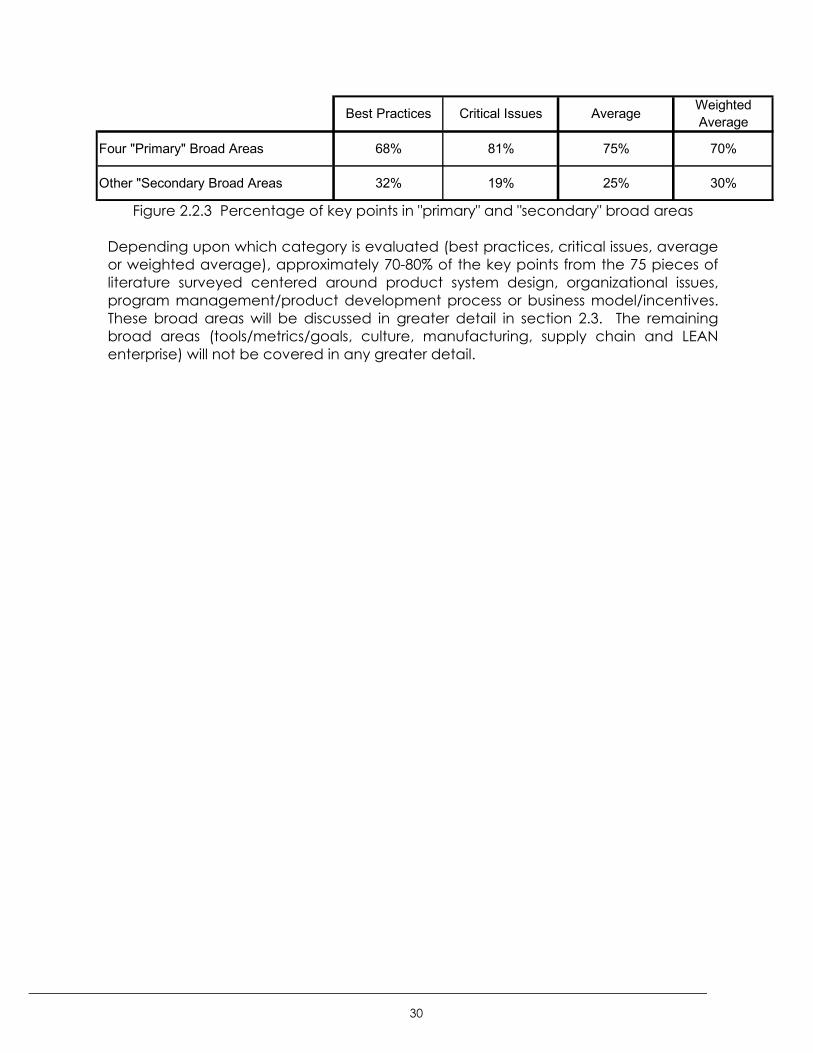
Figure 2.2.3 Percentage of key points in "primary" and "secondary" broad areas
Depending upon which category is evaluated (best practices, critical issues, averageor weighted average), approximately 70-80% of the key points from the 75 pieces ofliterature surveyed centered around product system design, organizational issues,program management/product development process or business model/incentives.These broad areas will be discussed in greater detail in section 2.3. The remainingbroad areas (tools/metrics/goals, culture, manufacturing, supply chain and LEANenterprise) will not be covered in any greater detail.
Best Practices Critical Issues Average Weighted Average
Four "Primary" Broad Areas 68% 81% 75% 70%
Other "Secondary Broad Areas 32% 19% 25% 30%
_____________________________________________________________________________________
31
2.3 Discussion of Key Points
2.3.1 Product System Design
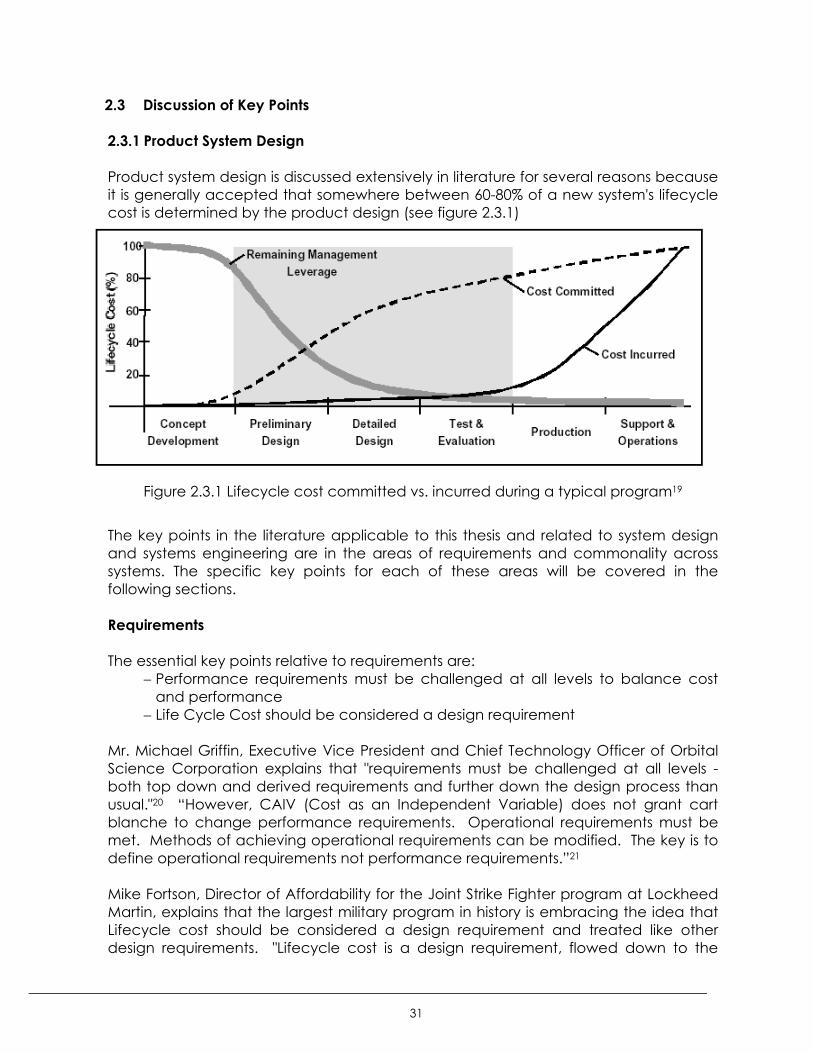
Product system design is discussed extensively in literature for several reasons becauseit is generally accepted that somewhere between 60-80% of a new system's lifecyclecost is determined by the product design (see figure 2.3.1)
Figure 2.3.1 Lifecycle cost committed vs. incurred during a typical program19
The key points in the literature applicable to this thesis and related to system designand systems engineering are in the areas of requirements and commonality acrosssystems. The specific key points for each of these areas will be covered in thefollowing sections.
Requirements
The essential key points relative to requirements are:− Performance requirements must be challenged at all levels to balance cost
and performance− Life Cycle Cost should be considered a design requirement
Mr. Michael Griffin, Executive Vice President and Chief Technology Officer of OrbitalScience Corporation explains that "requirements must be challenged at all levels -both top down and derived requirements and further down the design process thanusual."20 “However, CAIV (Cost as an Independent Variable) does not grant cartblanche to change performance requirements. Operational requirements must bemet. Methods of achieving operational requirements can be modified. The key is todefine operational requirements not performance requirements.”21
Mike Fortson, Director of Affordability for the Joint Strike Fighter program at LockheedMartin, explains that the largest military program in history is embracing the idea thatLifecycle cost should be considered a design requirement and treated like otherdesign requirements. "Lifecycle cost is a design requirement, flowed down to the
_____________________________________________________________________________________
32
lowest level IPT and suppliers and must be considered with other performanceparameters. Lifecycle cost receives a monthly executive level review and is reportedquarterly to the government."22
Commonality Across Systems
One of the strong arguments for modular system architecture with standard interfacesis that architecture and interfaces can be carried to the next platform or system. Ifthe architecture and interfaces are common, then modules can now be reusedacross systems or platforms. This offers significant advantages in cost, developmentcycle time and risk. Cost benefits arise from production economies of scale acrossprograms and dramatic benefits in maintenance costs from common replacementmodules at customer depots. Development cycle time and risk benefits arise fromreducing the scope of developing a new system - only the unique modules requiredevelopment, the common modules are simply carried over from a legacy program.Common subsystems can be a method to “steal” an iteration or spiral during adevelopment program.
Matthew Nuffort offers insight into both the benefits of commonality across platformsand some strategies to create commonality across platforms in his MIT master's thesis,Managing Subsystem Commonality23.
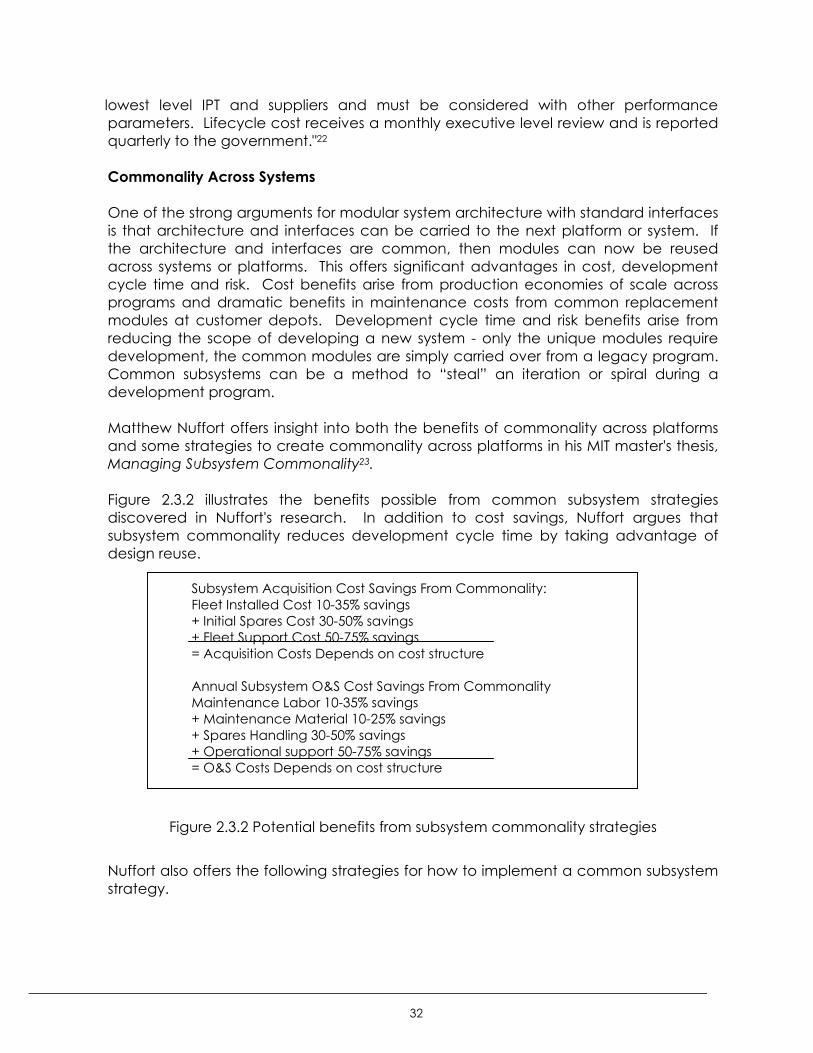
Figure 2.3.2 illustrates the benefits possible from common subsystem strategiesdiscovered in Nuffort's research. In addition to cost savings, Nuffort argues thatsubsystem commonality reduces development cycle time by taking advantage ofdesign reuse.
Subsystem Acquisition Cost Savings From Commonality:Fleet Installed Cost 10-35% savings+ Initial Spares Cost 30-50% savings+ Fleet Support Cost 50-75% savings= Acquisition Costs Depends on cost structure
Annual Subsystem O&S Cost Savings From CommonalityMaintenance Labor 10-35% savings+ Maintenance Material 10-25% savings+ Spares Handling 30-50% savings+ Operational support 50-75% savings= O&S Costs Depends on cost structure
Figure 2.3.2 Potential benefits from subsystem commonality strategies
Nuffort also offers the following strategies for how to implement a common subsystemstrategy.
_____________________________________________________________________________________
33
Commonality Makes Sense at the Subsystem and SRU Level− Commonality generally makes the most sense at the subsystem level, because
it is at this level where the difference between the benefits and the costs ofcommonality is maximized. Subsystems are sufficiently complex and costly suchthat their commonality produces a significant cost advantage in all phases ofthe life cycle. At the same time, subsystem requirements often are at a lowenough level to make it possible to effect commonality without compromisingany particular system’s requirements too much.
A Common Organization That Manages Across Platforms Has Many Advantages− A common organization has the ability to keep track of the requirements of
multiple platforms and recognize opportunities for cooperation. The commonadvocate, as an unbiased participant, also functions as a mediator betweendifferent platforms during such coordination to reconcile differences inrequirements.
Contractors Should Focus on Modular and Open Architectures for SystemSustainability
− To deal with electronic subsystems with high rates of technology turnover,contractors will need to work with common program offices to define andmanage interface standards to guard against DMS and account for rapidchanges in technology.
Commonality of subsystems across product families is also discussed in Meyer andLehnerd's book, The Power of Product Platforms. Building Value and CostLeadership24. Black and Decker experienced a reduction in manufacturing costranging from 40-70% on their basic circular saws, jigsaws, sanders and drills byimplementing a product platform strategy. This strategy principally centered oncommon subassemblies or building blocks for their power tool line - common motors,batteries/power units, etc.
"It avoided a piecemeal, single product focus. Instead management dealt withthe power tool product line as a whole. It bridged the traditional dividebetween engineering and manufacturing with the result that both products andprocesses for creating them were simultaneously redesigned. Seniormanagement adopted a long term horizon and made the initiative a toppriority."
Boeing 777 offered an example of commonality of parts within the airplane (vs. acrossother airplanes). The 777 design provided more options and flexibility for customerswhile using significantly fewer unique parts and more common parts. The followingbenefits were cited:
− Doors. A typical aircraft passenger entry door has 1,400 parts, most beingunique. In the seven doors on the 777, 95% of the parts are common to alldoors.
_____________________________________________________________________________________
34
− Overhead bins. In the past, overhead bins were unique to each airplane. The777 has only three standard bin geometries. They are usable with any class ofseating by simply changing the hinge points.
− Seating. Reconfiguring the seating in previous aircraft required a week ofwork. Thanks to the 777'snew modular "interfaces" between seats and theaircraft structure, seating can be reduced overnight”
Subsystem commonality across platforms offers advantages in affordability anddevelopment cycle time but there are some barriers to overcome. Programs arefunded separately and costs tracked and managed very carefully to ensure thatnone of program A's funding is spent on program B. Firms that pursue this strategy willneed to overcome these barriers and move from managing programs separately tomore common organizational structures across programs. The avionics firm isgenerally limited to subsystems within their particular avionics system. Morecommonality would require prime contractors to standardize avionics interfaces likeform factors, data bus structures and power supply voltages.
Closing Remarks
Focus on product system design is critical to developing affordable systems because60-80% of a system's lifecycle costs is determined by the design. The literature insystem design focuses in two areas:
− Requirements− Subsystem commonality across systems or platforms
To develop an affordable system, firms should treat Life Cycle Cost as a designrequirement and it should be traded, assessed and negotiated like other designrequirements. This requires cost-performance trades to challenge performancerequirements at all levels, and probably to a lower level in the design than has beentypical in the industry. Performance requirements also need to allow design decisionsto be made at the lowest level where the knowledge of the cost-performancetradeoffs is typically greatest. This requires specifying performance requirements andavoiding implementation requirements.
Subsystem commonality across platforms has been shown to produce dramaticbenefits in affordability. 10-75% reductions in various categories of production andOperations and Support costs have been realized implementing subsystemcommonality strategies. However, these strategies face challenges. The industry hasfocused on individual products and not product families. This focus is ingrained in theindustry contracting structure. Prime contractor involvement is critical to increasesubsystem commonality across platforms by standardizing critical system interfaceslike form factor, power supply voltages and data bus structures.
_____________________________________________________________________________________
35
Key Variables for Case Study Research
The role of requirements on system operational capability and lifecycle cost is welldocumented in the literature. However, the paradox is that during the requirementsdevelopment phase, you have the greatest impact on performance and cost butyou have the least knowledge of achievable performance and cost drivers. The highuncertainty regarding achievable performance diminishes the team’s willingness totrade performance for cost. The low knowledge regarding cost drivers diminishes theteam's ability to know where to challenge performance for the greatest impact oncost.
Key variables used in each case study will include:− Is the technical customer at the next higher level of the system hierarchy
willing to trade performance for cost?− Do you have sufficient knowledge regarding achievable performance and
cost drivers to effectively trade performance against cost during therequirements and architecture development phase?
− Does leveraging past programs and/or subsystem commonality acrossprograms increase knowledge of achievable performance and cost driversduring the requirements and architecture development phase?
_____________________________________________________________________________________
36
2.3.2 Organizational Issues
Organizational issues are discussed in the literature at great length. Some of the keyareas in the literature relevant to managing system development programs toproduce more affordable systems include:
− Organizational structure. Managing a system development programexplicitly focused on affordability requires some structural organizationchanges. Managing for affordability is inherently a cross functional endeavorthat crosses into practically all functional areas but it must be someone'sresponsibility to coordinate these functional areas on affordability issues.
− Collaborating across boundaries. As managing for affordability is inherently across-functional endeavor, collaborating across functional boundaries is acritical challenge to overcome. Some of the key boundaries to cross arethose between systems engineering and the user, systems engineering andthe detailed designers and the manufacturer.
Organizational Structure
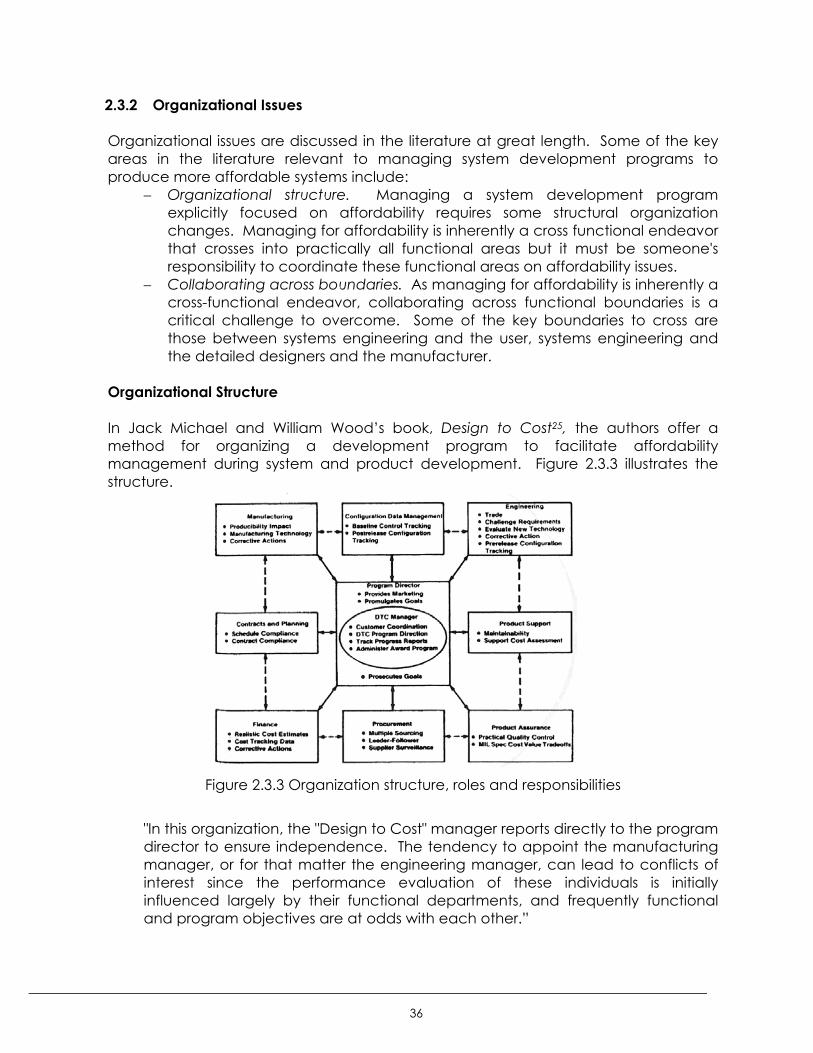
In Jack Michael and William Wood’s book, Design to Cost25, the authors offer amethod for organizing a development program to facilitate affordabilitymanagement during system and product development. Figure 2.3.3 illustrates thestructure.
Figure 2.3.3 Organization structure, roles and responsibilities
"In this organization, the "Design to Cost" manager reports directly to the programdirector to ensure independence. The tendency to appoint the manufacturingmanager, or for that matter the engineering manager, can lead to conflicts ofinterest since the performance evaluation of these individuals is initiallyinfluenced largely by their functional departments, and frequently functionaland program objectives are at odds with each other.”
_____________________________________________________________________________________
37
The functional managers shown in Figure 2.3.3 are those already on the program,fulfilling their respective line responsibilities, ensuring that design to cost is an integralpart of their normal functions and avoiding the cost burden of additional staff.
The authors offer additional insights into the roles and responsibilities of the functionalareas. The engineering, manufacturing and procurement organizations are includedhere as they dictate nearly all of the life cycle cost of a new product.
Engineering OrganizationThe actions and decisions of the engineering organization affect every otherfunctional discipline so it takes the lead during design development. Engineering isresponsible for making hardware design changes for improved producibility,reviewing costs of existing designs, challenging requirements, identifying andconducting trade studies and providing members to support the procurement andmanufacturing organizations.
Manufacturing OrganizationAggressive participation of the manufacturing organization is required during thedevelopment phase. Manufacturing representatives should be IPT members andparticipate in the design and evaluation of the product. Manufacturing is responsiblefor make-or-buy plans, production plans and concepts that are consistent with costgoals (includes labor standards, capital, process development), recommendhardware design changes to improve producibilty and tracking and monitoringdesign changes against a baseline for cost impacts.
Procurement OrganizationTypically, 40-60% of the cost of high technology products can be spent on procureditems so the procurement organization is critical to meeting cost goals. Procurementis responsible to provide supplier cost history, support cost oriented trade studies andprovide source selection data. Additionally, procurement should provide close liaisonwith suppliers of designed parts to make optimum use of advances in suppliers'technologies, provide supplier producibility inputs and recommendations onrequirements changes and extend design-to-cost requirements and incentives tosuppliers.
Collaboration Across Boundaries
Collaboration across boundaries simply means getting multiple individuals or groupsfrom different organizations or different technical backgrounds to work togethertowards a common goal. Collaborating across functional organizations within a firmhas long been an issue. The primary intent of Integrated Product Teams is to increasethe effectiveness of collaborating across functional boundaries. The problem isgetting harder as firms become less vertically integrated and the industryconsolidates. As firms become less vertically integrated, a higher level of designcollaboration is required across company boundaries. Collocation, one of thecornerstones or the IPT structure becomes more difficult or impossible. Alignment ofgoals, another of the IPT cornerstones, among firms is also more challenging. Intoday's consolidated defense industry, collaboration across firms becomes
_____________________________________________________________________________________
38
challenging as your supplier on one program is also a customer on another and acompetitor on yet another. This can lead to misalignment of goals.
For effective collaboration across boundaries, three key elements are required:− Mutual dependence− Clearly defined goals− Mutually accepted method(s) to define progress towards goals
William Blake's research in his MIT master's thesis, Using System Dynamics to UnderstandBarriers to Cost Reduction26, focused on barriers the product developmentorganization at an aerospace engine manufacturer was facing in improving theirability to develop affordable products. Blake identified two primary barriers.
− Time constraints in the product development process caused designers to skip"optional" tasks like IPT meetings and design for manufacturability and design tocost tasks
− Design engineers were not knowledgeable about cost
The aerospace engine manufacturer in this study had outsourced 80% of the contentof its product so the critical boundary Blake studied was between the aerospaceengine designer and the supplier manufacturer. He suggests involving suppliers earlierin the design process to provide knowledge about cost, removing barriers betweensuppliers and designers and finding ways to alleviate time pressure to allow thedesigners more time to focus on affordability as key improvement steps.
These sources and many others highlight the importance of breaking down barriersbetween groups to facilitate communication, alignment of goals to establish mutualdependence and mutually accepted methods for assessing progress towards goals.These methods must be timely, clear and credible to all parties. In the case ofcollaborating between designer and manufacturer over product cost, the methodtends to be design to cost analysis performed by the manufacturer. If this costanalysis is not timely, clear and credible to the customer, management and designengineering it is less likely to be effective.
In David Hoult and Lawrence Meador's article, Methods of Integrating Design andCost Information to Achieve Enhanced Manufacturing Cost/Performance Trade-offs27,the authors' illustrate this point:
“The Design/Cost Trades Task is typically time-constrained. This arises because inthe development of complex products the IPPD team makes a design decisionand immediately begins to realize its consequences. If the cost impact of thedesign decisions is not known immediately, costly rework arises when theconsequences of the design decision must be cost-corrected. Thus, it happensthat one of the metrics for Database Commonality is the time to roll-up costestimates for the product. In the U.S. Aerospace industry, typical roll-up timeswere months, but the best in class rolled up costs daily. In the appliance industry,one leading firm has cost roll-up times measured in minutes instead of hours. In aWall Street Journal article in 1995, a Chrysler representative was quoted as sayingthat cost roll up time of 24 hours was too slow.”
_____________________________________________________________________________________
39
Paul Carlile and Eric Rebentisch discuss collaboration across boundaries explicitly intheir white paper, Into the Black Box: The Knowledge Transformation Cycle28. Theauthors suggest that there are three challenges in collaborating across boundaries -novelty, dependence and specialization. Novelty indicates that the environment haschanged so "old" ways of integrating knowledge may not apply. Novelty often spursthe need for active collaboration - new requirements require integrated solutionsrequiring collaboration of functional groups. Dependence means each group needsthe other group to be successful (manufacturing has traditionally needed engineeringknowledge to be successful, engineering only needs manufacturing/supplierknowledge to be successful if engineering success includes product affordability andproducibility). The degree of specialization creates barriers to understanding.Specialization creates specialized language, tools and unspoken assumptions that arenot common across other differently specialized groups. Specialization is in tensionwith dependence because functional groups often have desired outcomes that areat odds with each other. A key way to bridge these problems is to develop acommon interface tool/language which abstracts each groups specializedknowledge sufficiently to both accurately represent the knowledge and effectivelycommunicate it to the other party. Carlile and Rebentisch call these items "boundaryobjects".
"Key in the development of an effective shared context is the representation ofknowledge through the use of boundary objects. An effective boundary objectestablishes a shared language for representing knowledge, provides a concretemethod for learning about differences and dependencies, and facilitates aprocess for transforming knowledge. Whether these boundary objects aremutually accepted methods, specific activities, or shareable artifacts, the key isthat they not only facilitate representing knowledge but also its transformation.They also indicate the degree of inclusiveness of the process. Without the meansof representing and applying one's knowledge in a cross-boundary setting (andby extension the ability to participate in future collaborations), some participantsmight withdraw from or even hamper the knowledge integration process. In astudy we saw a clear example of how an up to date assembly drawing helpedprovide the means where both design engineers and the manufacturingengineer could represent their knowledge and transform the knowledge used tochange the design of the product that accommodated both of their interests."
Rebentisch and Carlile also suggest another barrier to the aerospace industry ingeneral is the concept that a good memory can lead to poor choices if the contextor environment changes significantly. Certainly the aerospace environment haschanges from performance focus to an affordability focus.
"March asserted that for the most part "good memories make good choices".However, bad choices can also be made even from good memory if thecircumstances surrounding the original development have changed. In suchcases stored knowledge is no longer relevant when it is retrieved for re-use. This isa key point: when the context changes sufficiently (i.e. new requirements orsome other form of novelty is introduced) between when knowledge is stored
_____________________________________________________________________________________
40
and retrieved, stored knowledge can be rendered less useful and its intendedbenefits can become harmful. Overall then, the degree of novelty introducedbetween knowledge storage and retrieval is a core knowledge integrationchallenge"
To recap, for effective collaboration across boundaries to occur, the following threekey elements are required:
− Mutual dependence. The collaborating groups must need knowledge fromeach other for their own success.
− Clearly defined goals that define success.− Mutually accepted method(s) to define progress towards goals
Closing Remarks
In the area of organizational issues, the key areas relevant to managing developmentprograms to produce more affordable systems are in the areas of organizationalstructure and collaborating across boundaries.
One possible organizational structure was summarized that highlighted a newmanagement position that could be called an Affordability or Design to CostManager responsible for coordinating the efforts of engineering, manufacturing,procurement, etc. with regards to issues effecting product affordability. This positionwould report to the program director, provide progress status to the entire team andserve as the customer focal point on issues effecting affordability. Of course, otherorganizational structures could be suitable but the key is that affordabilitymanagement is inherently a cross-functional endeavor that requires some degree ofcentralized coordination.
Managing affordability is a cross-functional endeavor so collaboration acrossfunctional and organizational boundaries is critical to success. The systems engineersdeveloping requirements for the avionics system must bridge the boundaries to theusers to truly understand what is needed to effectively work cost-performance trades.The hardware design engineers and the manufacturers (either internal to the firm or atsuppliers) must collaborate to ensure product manufacturability. A model appears inthe literature that for effective collaborating between groups, three elements areessential:
− Mutual dependence− Clearly defined goals− Mutually accepted method(s) to define progress towards goals
Key Variables for Case Study Research
The traditional problem with integrating lifecycle cost into the design process hasbeen on two fronts. First, who owns “design to cost”? Systems and designengineering have more influence on the lifecycle cost of a system but typically don’thave the capability to perform cost analysis. Manufacturing typically has thecapability to perform cost analysis but has less influence on the lifecycle cost of a
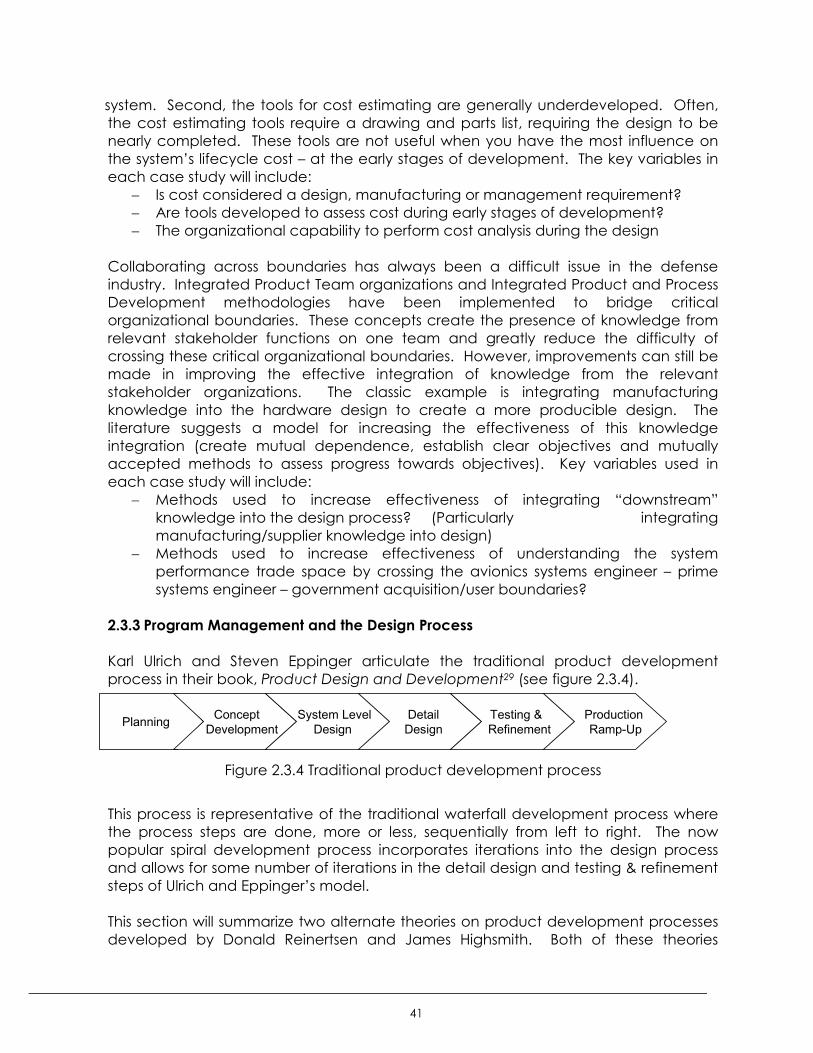
_____________________________________________________________________________________
41
system. Second, the tools for cost estimating are generally underdeveloped. Often,the cost estimating tools require a drawing and parts list, requiring the design to benearly completed. These tools are not useful when you have the most influence onthe system’s lifecycle cost – at the early stages of development. The key variables ineach case study will include:
− Is cost considered a design, manufacturing or management requirement?− Are tools developed to assess cost during early stages of development?− The organizational capability to perform cost analysis during the design
Collaborating across boundaries has always been a difficult issue in the defenseindustry. Integrated Product Team organizations and Integrated Product and ProcessDevelopment methodologies have been implemented to bridge criticalorganizational boundaries. These concepts create the presence of knowledge fromrelevant stakeholder functions on one team and greatly reduce the difficulty ofcrossing these critical organizational boundaries. However, improvements can still bemade in improving the effective integration of knowledge from the relevantstakeholder organizations. The classic example is integrating manufacturingknowledge into the hardware design to create a more producible design. Theliterature suggests a model for increasing the effectiveness of this knowledgeintegration (create mutual dependence, establish clear objectives and mutuallyaccepted methods to assess progress towards objectives). Key variables used ineach case study will include:
− Methods used to increase effectiveness of integrating “downstream”knowledge into the design process? (Particularly integratingmanufacturing/supplier knowledge into design)
− Methods used to increase effectiveness of understanding the systemperformance trade space by crossing the avionics systems engineer – primesystems engineer – government acquisition/user boundaries?
2.3.3 Program Management and the Design Process
Karl Ulrich and Steven Eppinger articulate the traditional product developmentprocess in their book, Product Design and Development29 (see figure 2.3.4).
Figure 2.3.4 Traditional product development process
This process is representative of the traditional waterfall development process wherethe process steps are done, more or less, sequentially from left to right. The nowpopular spiral development process incorporates iterations into the design processand allows for some number of iterations in the detail design and testing & refinementsteps of Ulrich and Eppinger’s model.
This section will summarize two alternate theories on product development processesdeveloped by Donald Reinertsen and James Highsmith. Both of these theories
Planning Concept Development
System Level Design
Detail Design
Testing & Refinement
Production Ramp-Up
_____________________________________________________________________________________
42
explicitly discuss the iterative nature of product development in somewhat differentmanners. The key conclusion about the product development process is thatincremental maturation of product and process is key to developing an affordablesystem in the face of relatively high technical uncertainty.
Donald Reinertsen developed an intriguing framework on managing productdevelopment in his book, Managing the Design Factory. A Product Developer’sToolkit30. Reinertsen stresses the importance of designing the design process usingthree principles:
− Focus on making profits, not products− Queuing theory provides insights to reduce product development cycle time− Focus product development on generating new information
First, focus on making profits, not products. Define the profit drivers for the product,preferably define quantitative relationships between product features and profits. Thismakes sense in commercial endeavors but may produce undesired behavior inmilitary endeavors because of financial incentive issues in Department of Defensecontracting (see section 2.3.4). The critical issue is to develop a process for weightingvarious factors to enable making the inevitable tradeoffs between productperformance and features, development budget, development schedule andproduction/support costs.
Second, focus on the product development process using queuing theory. Theobjective is to apply queuing theory to reduce cost and cycle time of the productdevelopment process. Generally this means controlling queues through increasingcapacity, managing demand, reducing variability and using control systems.
Third, focus on generating new information in the design process. New informationcomes from experiments with uncertain outcomes. Successful and unsuccessfulexperiments generate valuable information. Maximum information generation occurswhen you run a test that is equally likely to fail or succeed. This new information iscritical and needs to be passed across the organization to avoid repeating oldmistakes. Reducing cycle time per experiment or iteration is a key enabler to creatingmore new information because it allows more experimentation.
One good example is FPGAs vs. ASICs. The author suggests there are two schools ofthought in product development – do it right the first time and do it right the last time.
“The studies of integrated circuit design practices by Professor Stefan Thomke atHarvard, reported in his 1995 PhD thesis bear our these findings. When the cost ofdoing an iteration is high, such as in ASIC development, companies drive for highquality per pass and low iterations, averaging 1.5 iterations. In contrast, wheniteration cost is low, in terms of dollars and time, such as they are with FPGAs,companies will gravitate to the multi-pass approach, averaging 13.9 iterations.On IC’s of equivalent complexity the FPGA designers took an average of 8.45man-months while the ASIC designers took an average of 19.24 man-months.
_____________________________________________________________________________________
43
There may be less difference between the two schools than might appear onthe surface. Both approaches are trying to maximize overall economics, theyare simply responding to difference economic drivers: when the cost of iterationis high, we should concentrate on first pass yields, when it is low we shouldconcentrate on how quickly we can get through an iteration.”
Reinertsen’s second key point is to understand the interrelationships betweenorganization, design process, product architecture and technology. Don’t putorganizational boundaries at underdefined system interfaces. Develop thearchitecture so many iterations are required within a subsystem but few are requiredacross subsystems. Choose technologies that can reasonably be developed orunderstood during the time available.
“The product architecture will create needs for more intense communicationaround the undefined interfaces within the design. The less well characterizedthe interface, the more likely we are to have questions about it. Thus, anarchitectural interface will act as a region of the design that requires heightenedand accurate communications. This heightened communications cannot beachieved if we place such an interface at either an organizational boundary ora geographic boundary. Communications will be worst if we compound theproblem by placing an undefined interface on top of both an organizationalboundary and a geographic boundary. This suggests a powerful rule of thumb:Never place an organizational or geographic boundary on top of a poorlycharacterized architectural interface.”
James Highsmith offers an innovative product development process called AdaptiveDevelopment in his book, Adaptive Software Development. A CollaborativeApproach to Managing Complex Systems31. This method is developed specifically forsoftware development projects but has applicability for any product developmentwith high uncertainty. The model explicitly focuses on increasing knowledge throughiterative development. The adaptive model is based on a view that the world is notdeterministic. We have a high level objective but don’t necessarily know the bestend state to meet that objective so we’ll iteratively increase our knowledge aboutwhat the best end state will be through iterations to guide us to the right solution. Theadaptive model is based fundamentally on a speculate, collaborate, learn cycle ofiterations. This compares to the waterfall model of plan, build, implement and thespiral model of plan, build, revise.
Success with the adaptive model involves the deployment of methods and tools thatapply increasing rigor to the results, that is, the work state rather than the workflow.The workflow mindset is process oriented first and results oriented second. Workstatemanagement reverses the order of importance.”
Leading adaptive development projects requires a different approach than leadingdeterministic development projects. Leadership in adaptive projects is about settingdirections, creating environments and letting results happen. Leadership indeterministic projects is about developing a plan and controlling deviations from that
_____________________________________________________________________________________
44
plan. In a deterministically planned project, deviations are viewed as mistakes to becorrected. In an adaptive project, deviations guide us toward the right solution. Tolead adaptive projects, a key is developing a vision for the project andcommunicating to all team members. High level guidance is critical to focusdevelopment without micromanaging implementation details. However, low leveldetailed plans are too constrictive. This kind of management requires that everyteam member understand the team vision and priorities (performance, schedule,defects, costs, etc) for making the inevitable tradeoffs because these tradeoffs aremade at lower levels in the team. What you’re striving for is a specific goal,boundaries of behavior and wide latitude for implementation.
Highsmith’s approach is developed for relatively small software development projectsunder high uncertainty in what users want. This approach seems very suitable forsoftware projects where user needs uncertainty is high and iteration cycle time andcost is low. It is unclear how this process would scale up to large teams or tohardware centric systems where cycle time is much longer than for small softwaresystems. However, there are some key features of Highsmith’s process that seemapplicable to any development process. The explicit focus on increasing knowledgeand information through design iterations is consistent with Reinertsen. The focus onwork state instead of work flow responds to long standing critics of earned valuemeasurement systems that focus on deviations from a plan that work well when theplan is “right” but tend to lead to “wrong” plans because they make adapting theplan cumbersome. The key criticisms for large projects would be in scaling up theinformal control mechanisms and relying on communication of high level vision toguide a large team.
Closing Remarks
Developing more affordable military avionics systems typically involves a significantamount of technical uncertainty from unproven technologies, product complexityand changing customer requirements. Iterative development has become theindustry standard for developing products in the face of this uncertainty. The criticalissue now becomes the nature of development focus during each iteration.
Key Variables for Case Study Research
The development methodology or process (waterfall, spiral, adaptive, etc.) sets thestage for how a new system will be developed. All of the leading developmentmethodologies, except waterfall, favor an iterative or incremental developmentapproach. The chief difference lies in the development focus of each iteration. Keyvariables used in each case study will include:
− Was an iterative development methodology used?− If yes, number of iterations− If yes, development focus during each iteration
_____________________________________________________________________________________
45
2.3.4 Business Model and incentives
Aaron Kirtley summarized the business model and incentives issues that act as barriersto innovation and improved system affordability in the defense industry in his MITmaster's thesis, Fostering innovation across aerospace supplier networks32. Kirtley'sresearched the F/A-22 program and focused on the avionics suppliers of ElectronicWarfare and Radar systems and their subtier suppliers. His findings included thefollowing excerpt:
"Contract structure and associated incentives have a significant impact on suppliers’motivation and willingness to innovate. However, very few F/A-22 contracts haveemployed target costing, profit sharing arrangements, or other incentive mechanisms.For many suppliers, the only incentive for innovation is avoiding program cancellation.This provides strong motivation for some suppliers with a major stake in the program,but less so for many others. Furthermore, without cost savings sharing arrangements,innovations that reduce suppliers’ product costs tend to decrease their revenues andprofits, thereby creating a disincentive for innovation.
The government’s contracting approach with the prime contractor heavily influencesthe structure of contracts across the supplier network. It sets the tone for how supplierrelationships are managed at lower tiers and determines the contractual terms andconditions that are flowed down the supply chain. Hence, the government has animportant role to play in creating a contracting environment conducive to supplierinnovation. The fixed-price, annually negotiated contracts used in the earlyproduction phase of the F/A-22 program have discouraged some suppliers frommaking long-term investments. This research suggests that the use of multi-yearcontracts and larger volume purchases would significantly reduce costs andincentivize greater innovation. Concurrency in design and production has made itdifficult for suppliers to estimate yearly lot costs and has led to a continual stream ofdesign changes that create process instability and schedule disturbances.
The government and companies should work to establish more creative incentivemechanisms that will reward suppliers for outstanding efforts. These might include theuse of price commitment curves, under which the customer agrees to a fixed price forthe supplier’s product for several years in advance, after which time the price isrenegotiated based on the customer’s assessment of the supplier’s new cost structure.Award-fee contracts offer another method of motivating supplier performance."
Figure 2.3.5 illustrates the benefits to both the supplier and customer of long term fixedprice contracts. The supplier is financially incentivized to reduce costs because theyreap the benefits during the current long-term contract. The customer is rewarded forthe supplier's innovation by a lower cost during subsequent long-term contracts. Ineffect, long term fixed price contracting can be a very efficient method of costsavings sharing between the customer and supplier without the bureaucratic burdensassociated with analyzing, proving and negotiating specific savings and sharingpercentages common in other cost savings vehicles like Value Engineering ChangeProposals (VECPs). Long term fixed price contracting also offers a more efficientmethod of approving projects that results in cost reduction because the approval
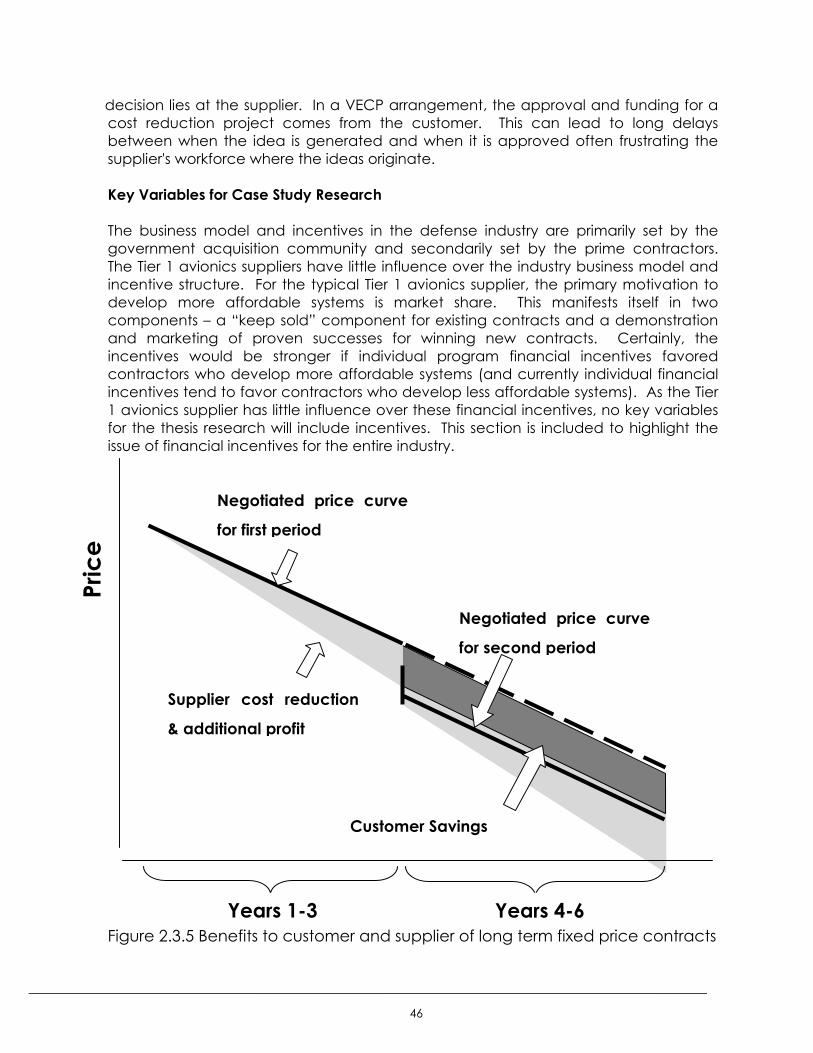
_____________________________________________________________________________________
46
decision lies at the supplier. In a VECP arrangement, the approval and funding for acost reduction project comes from the customer. This can lead to long delaysbetween when the idea is generated and when it is approved often frustrating thesupplier's workforce where the ideas originate.
Key Variables for Case Study Research
The business model and incentives in the defense industry are primarily set by thegovernment acquisition community and secondarily set by the prime contractors.The Tier 1 avionics suppliers have little influence over the industry business model andincentive structure. For the typical Tier 1 avionics supplier, the primary motivation todevelop more affordable systems is market share. This manifests itself in twocomponents – a “keep sold” component for existing contracts and a demonstrationand marketing of proven successes for winning new contracts. Certainly, theincentives would be stronger if individual program financial incentives favoredcontractors who develop more affordable systems (and currently individual financialincentives tend to favor contractors who develop less affordable systems). As the Tier1 avionics supplier has little influence over these financial incentives, no key variablesfor the thesis research will include incentives. This section is included to highlight theissue of financial incentives for the entire industry.
Figure 2.3.5 Benefits to customer and supplier of long term fixed price contracts
Years 1-3 Years 4-6
Pric
e
Negotiated price curve
for first period
Negotiated price curve
for second period
Supplier cost reduction
& additional profit
Customer Savings
_____________________________________________________________________________________
47
2.4 Summary of Literature Review Leading to Key Variables for Thesis Research
The development methodology or process (waterfall, spiral, adaptive, etc.) sets thestage for how a new system will be developed. All of the leading developmentmethodologies, except waterfall, favor an iterative or incremental developmentapproach. The chief difference lies in the development focus of each iteration. Keyvariables used in each case study will include:
− Was an iterative development methodology used?− If yes, number of iterations− If yes, development focus during each iteration
The role of requirements on performance and cost is well documented in theliterature. The paradox is that early in the development process you have the mostleverage but the least knowledge regarding achievable performance and costdrivers. The low knowledge regarding achievable performance diminishes the team’swillingness to trade performance for cost. The low knowledge of cost driversdiminishes the team's ability to know where to challenge performance for the greatestimpact on cost. Key variables used in each case study will include:
− Is the technical customer at the next higher level of the system hierarchy willingto trade performance for cost?
− Do you have the knowledge regarding achievable performance and costdrivers to effectively trade performance against cost during the requirementsand architecture development phase?
− Does leveraging past programs and/or subsystem commonality acrossprograms increase knowledge regarding achievable performance and costdrivers during the early phases of development?
The problem with integrating lifecycle cost into the design process has been on twofronts. First, who owns “design to cost”? Systems and design engineering have moreinfluence on the lifecycle cost of a system but typically don’t have the capability toperform cost analysis. Manufacturing has the capability to perform cost analysis buthas less influence on the lifecycle cost of a system. Second, the tools for costestimating are generally underdeveloped. Often, the cost estimating tools require adrawing and parts list which indicate the design is nearly complete. These tools arenot useful when they are most needed – early in the development. The key variablesin each case study will include:
− Is cost considered a design, manufacturing or management requirement?− Are tools developed to assess cost during the architecture and requirements
phase?− The organizational capability to perform cost analysis during the design
Collaborating across boundaries has always been a difficult issue. Integrated ProductTeam organizations and Integrated Product and Process Developmentmethodologies have been implemented to bridge organizational boundaries. Theseconcepts create the presence of knowledge from relevant stakeholder functions onone team and greatly reduce the difficulty of crossing these organizationalboundaries. However, improvements can still be made in improving the effective
_____________________________________________________________________________________
48
integration of knowledge from the relevant stakeholder organizations. The classicexample is integrating manufacturing knowledge into the hardware design to createa more producible design. The literature suggests a model for increasing theeffectiveness of this knowledge integration (create mutual dependence, establishclear objectives and mutually accepted methods to assess progress towardsobjectives). Key variables used in each case study will include:
− Methods used to increase effectiveness of integrating “downstream”knowledge into the design process? (Particularly integratingmanufacturing/supplier knowledge into design)
− Methods used to increase effectiveness of understanding the systemperformance trade space by crossing the avionics systems engineer – primesystems engineer – government acquisition/user boundaries?
_____________________________________________________________________________________
49
3 Case Study Research of Seven Military Avionics Programs
3.1 Research Focus and Approach
Seven avionics development programs at a single avionics company wereresearched by interviewing over forty engineers and managers. The programsranged in size and complexity from single module hardware development programswith products that fit in the palm of your hand to large scale system developmentprograms involving hundreds of pounds of hardware and hundreds of thousands oflines of software code. The intent of the case study research was to investigate fourfocus areas:
− The nature of development focus during each design iteration− The role of requirements− Managing lifecycle cost as a design requirement− Effective integration of downstream knowledge to develop better designs
Interviews were used to collect the data. A cross section of functional disciplines wereinterviewed to develop an objective view of the program:
− Program management− System engineering− Hardware engineering− Manufacturing engineering− Company management− Manufacturing factory management
Each interviewee was asked general questions regarding best practices developedand critical issues faced by their program relevant to delivering more affordablesystems. A series of specific questions were asked probing at each of the four focusareas. See Appendix C for a copy of the questionnaire used for the interviews.
The seven programs selected have been disguised to protect sensitive data and willbe referred to as Programs 1, 2, 3, 4, 5, 6 and 7.
Program 1 was a major system development program involving hundreds of poundsof hardware and hundreds of thousands of lines of software code. This program wasselected because it is an interesting transitional program – focused almost entirely onperformance at the beginning with a significant shift in focus to affordability almost adecade into the program. The case study illustrates how difficult it is for programs toswitch focus but once they do, how dramatic improvements can be made. Program2 is a subset of Program 1 - it dives into greater detail and illustrates the step functionaffordability improvements that can be made through design innovation when theprogram conditions support an affordability focus. These programs are covered insections 3.2 and 3.3.
Programs 3 and 4 are less complex than Program 1 and cover single hardwaremodules that fit in the palm of your hand. Program 3 has been extremely successful inimplementing Lean enterprise techniques and design innovations to make dramatic
_____________________________________________________________________________________
50
cost reductions while manufacturing over 10,000 modules. This program has becomethe company’s model program for Lean manufacturing and affordability success.Program 4 experienced technical shortfalls in the transition from prototype tomanufacturing resulting in contract termination by the customer. The interestingcontrast is that the same group of people ran both programs. These programs arecovered in section 3.4
Program 5 is a classically over-constrained program. This program had a highlycompetitive acquisition process that led to insufficient budget and schedule availableto meet the performance requirements. Affordability was a major driver during theacquisition process. A low cost system that could be used on multiple platforms formultiple U.S. military services was proposed. A relatively high-risk system concept wasproposed in order to meet the affordability goals. Once the program was awardedand execution began, the focus shifted to performance and schedule. At first flight,the system failed catastrophically. Several unplanned design iterations were requiredto develop a performance compliant system, which led to significant cost andschedule overruns. Program 5 is discussed in section 3.5.
Programs 6 and 7 are discussed jointly in section 3.6 because of the interestingcontrast. Program 6 was a new product concept that entailed high performance risk.The customer was performance focused and requirements were very difficult to meet.Not surprisingly, this program developed a very high performance product at a veryhigh cost. This program is considered unsuccessful because the cost is higher than thecustomer is willing to pay for the achieved performance so the production is in seriousjeopardy. Program 7 leveraged the knowledge, technology and capability fromProgram 6 to work with their customer to shape the requirements to enable a low risk,low cost solution that met the needs of the user. Program 7 provides the samefunctionality as Program 6 at 4-5x less cost based developing more balancedrequirements.
Figure 3.1.1 summarizes these seven programs and compares them along severalmetrics. The development manyears metric compares the number of manyearsexpended to develop the system. This metric and the system weight provide insightinto the relative complexity of these systems. Development focus compares the toppriority or focus of the development team. It is interesting to note that thedevelopment focus frequently changes in response to changing programenvironments. For example, Program 1 changed from a performance to anaffordability focus in response to a similar focus change at their customer. Thetechnical performance risk and the degree to which the team could leverage priorknowledge, technology and capability provide insight into the uncertainty of theprogram. Whether the team met the customer’s needs for performance and lifecyclecost or not provides insight into the results of the development program.
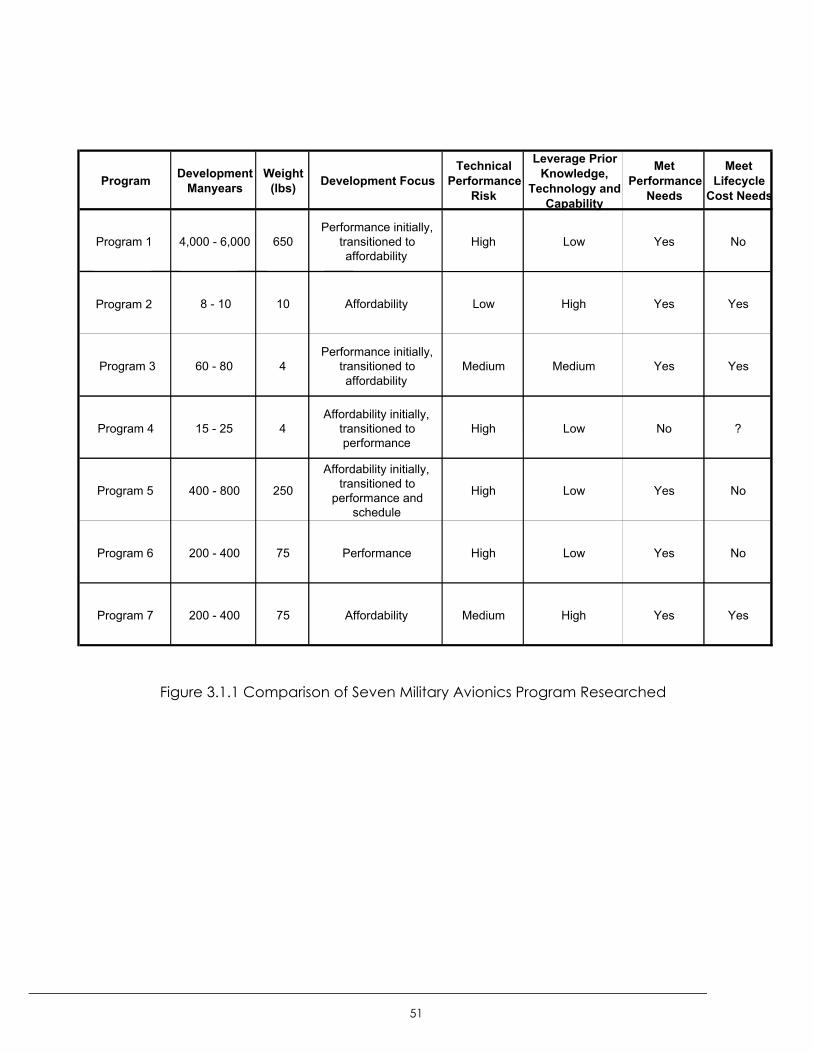
_____________________________________________________________________________________
51
Figure 3.1.1 Comparison of Seven Military Avionics Program Researched
Program Development Manyears
Weight (lbs) Development Focus
Technical Performance
Risk
Leverage Prior Knowledge,
Technology and Capability
Met Performance
Needs
Meet Lifecycle
Cost Needs
Program 1 4,000 - 6,000 650Performance initially,
transitioned to affordability
High Low Yes No
Program 2 8 - 10 10 Affordability Low High Yes Yes
Program 3 60 - 80 4Performance initially,
transitioned to affordability
Medium Medium Yes Yes
Program 4 15 - 25 4Affordability initially,
transitioned to performance
High Low No ?
Program 5 400 - 800 250
Affordability initially, transitioned to
performance and schedule
High Low Yes No
Program 6 200 - 400 75 Performance High Low Yes No
Program 7 200 - 400 75 Affordability Medium High Yes Yes
_____________________________________________________________________________________
52
3.2 Program 1
3.2.1 Program history and summary
Program 1 is widely recognized for its superior performance. At the beginning ofdevelopment, government customers and the prime contractors valued performanceover all other elements of program value. Schedule was valued second,development budget third and life cycle cost was valued last on the list. These valuesshifted late in development and life cycle cost became a much more valuedelement of the program. This shift in values was a result of changes in the geopoliticalenvironment and changes in defense budgets.
The top achievement of this program is revolutionary performance. Program 1delivered the performance it promised with margin. The chief challenge this programcontinues to work to overcome is reacting to changes in customer priorities increasingthe value of lifecycle cost. The program has made and is making significant strides inreducing the production costs of the product but more work remains to be done.
The avionics program investigated under Program 1 developed a sophisticatedelectronics system with several hundred pounds of electronics hardware and severalhundred thousand lines of software code. This system was the most sophisticated andhighest performance system of its type ever attempted. The avionics programmirrored the platform program – it delivered the revolutionary performance itpromised with margin and is still working to react to changes in customer prioritiesincreasing the value of lifecycle cost. Program 1 represents the most complexprogram researched for this thesis requiring four to six thousand man-years tocomplete development over more than a decade. The avionics supplier is makingsignificant strides improving affordability through the following initiatives:
− Lean enterprise techniques− Improving hardware producibility during product redesigns required by
Diminishing Manufacturing Sources (parts obsolescence)− Identifying and implementing opportunities for cost reduction through product
or process improvement− Implementing a system architecture innovation that exploits new technology
unavailable when development began. Although the Program 1 avionicssystem researched represents only about 5% of the platform’s cost, thisinnovation represents the largest cost reduction initiative on the platform.
The Lean enterprise techniques began with a primary focus on the factory floor andhave expanded to include "white collar" processes. The focus has been on increasingthe efficiency of transactional processes. Significant improvements have been madewith the most dramatic improvements observed in factory performance andefficiency.
Diminishing Manufacturing Sources (DMS) is the program's term for partsobsolescence. The system was designed between 1991 and 1994 so it has 8-10 yearold electronics component technology. With component lifecycles becoming shorter
_____________________________________________________________________________________
53
driven by the commercial electronics markets, today typical lifecycles for digitalcomponents are 3 years and 5-7 years for RF/analogue components. With over 3,000components in the system, there are components becoming obsolete every year andsome require product redesigns to accommodate the next generation componenttechnology. The team has successfully turned this life cycle cost driver into a life cyclecost benefit by focusing the product redesigns on improving the producibilty andaffordability of the hardware whenever it is redesigned for obsolete componenttechnology. Typical benefits have been product yield improvements from below 50%to above 90% and production cost reductions of 10-30%.
The customer has made funding available to invest in cost reduction initiatives. TheProgram 1 avionics team has captured some of this funding through thedemonstration and implementation of several innovative ideas to improve systemaffordability ranging from manufacturing process innovations to modular productioninnovations to system architecture innovations. Manufacturing process innovationshave included automation of processes previously only possible manually. Modularproduct innovations have included module redesigns like Program 2 (see section 3.3).Architecture innovations have included simplifying the architecture by exploitingtechnology developments unavailable when Program 1 development began. Thisarchitectural innovation represents the single largest cost savings initiative on theplatform.
The team has pursued funding made available by their customer but has alsoinvested their own funds in product and process improvements. It is importantto note that the team’s motivation for improving affordability is not driven bytangible financial benefits. For each successful cost reduction initiative, the Program1 team must invest current funds (that could otherwise be profit) to reduce future cost,which reduces future sales, cash flow and profit. The Net Present Value of each costreduction initiative is a loss to the avionics supplier because all of the cash flows arenegative. The future "benefits" are negative cash flows to the avionics supplierbecause all of the savings benefit the customer. The motivation for the avionicssupplier is to keep the program sold and support their customer’s needs which leadsto improved customer relationships and creates advantages in competing for futurebusiness. For the avionics supplier, this is a powerful motivator because the primecontractor is their largest customer. The avionics supplier has a significant financialstake in the program, so helping to keep the program sold is a significant motivator.
This program was successful because it delivered what it set out to deliver – an orderof magnitude leap in system performance. However, the team still has work to do toreact to the customer’s change in priorities placing higher value on affordability. Theavoincs supplier is adapting to this change in customer priorities through anaggressive cost take out program that includes architecture level redesign, hardwaremodule level redesign, manufacturing process improvements and LEANimplementation. This change demonstrates that defense firms can focus onaffordability and develop significantly more affordable systems when that is what thecustomer wants.
_____________________________________________________________________________________
54
3.2.2 Critical Issues Leading to Noteworthy Negative Outcomes
The most noteworthy negative outcome was that the production costs of the systemwere higher than the customer’s goals. The program is now making significant stridesto improve the system’s affordability.
New technology: The team implemented several new materials to reduce weight thatwere expensive to implement and provided marginal improvements in weight. Manyof these new technologies were removed to reduce cost. Several technicalinventions were required, which drove the team to ignore affordability in a difficultstruggle to get certain aspects of the system to function.
Insufficient design iterations, insufficient prototype manufacturing: The team did notbuild enough product to understand the problems and cost drivers. The team builtone engineering prototype and then went directly to EMD manufacturing to buildeleven systems. Once the team had built the eleven EMD systems, they betterunderstood the cost drivers and what to fix but did not have remaining budget tosolve the now known issues. The program was planned to be done ‘right the first time’so funding was not planned for iterations.
Corner of the envelope requirements: A CAIV philosophy on requirements was notadopted until well after the Critical Design Review (CDR). The customer pushed forchallenging requirements. Practically, the only acceptable reason to change arequirement was that meeting the requirement violated the laws of physics. Severalinterviewees indicated that the avionics supplier’s engineers and managers neverreally figured out how to negotiate through the various stakeholders at the prime andthe government to successfully pursue requirements changes based on “best value”or affordability considerations.
Design to Cost was not integrated with the design process: Design to cost analysis wasconducted and reported every quarter during the early years of the program.Several lead engineers interviewed indicated they did not know that the analysis andreports were ever generated. Cost was not put in front of the systems engineers as arequirement. Eventually it was put in front of the hardware engineers but the effortwas under-supported. Design to cost analysis and estimating support was notprevalent on the program so design engineers (who don’t know how to estimate cost)had a requirement but no means to estimate compliance. This coupled with aperformance focused program culture acted as barriers to integrating Design to Costwith Design. This issue is covered in greater detail in section 3.2.4.3.
Affordability was not valued at the beginning of EMD: Program 1 was focused onperformance early in the program. Affordability was valued last behind performance,schedule and development budget. When an engineer said, I can save $X if youchange my requirement from A to A’, the answer was invariably “no”. When anengineer said, I can save you $X if you give me $Y additional budget and Z additional
_____________________________________________________________________________________
55
months of schedule, the answer was invariably “no”. This was intentional and entirelyconsistent with the customers’ priorities.
Worst case engineering analysis: A lot of the design analysis used “worst case”instead of statistical techniques. For example, thermal analysis used to determinecompliance with component junction temperature requirements assumed allcomponents simultaneously drew maximum power during the maximum ambient andcooling temperature conditions. Not only is it unlikely for all components tosimultaneously draw maximum power, it is physically impossible for many of them todo so under warmest temperature conditions (many of the components drawmaximum power during cold temperatures). This kind of technical performance riskaversion lead to over-designing, increased complexity and increased costs.
3.2.3 Best Practices Leading to Noteworthy Positive Outcomes
The most noteworthy positive outcome was revolutionary system performance.
Structured engineering process: The program’s director drove a very structured andrigorous engineering process into the team with well defined milestones and technicalreviews. This was a culture change for the company as it was used to managingsmaller programs with more free flowing engineering processes. Several intervieweescredited the structured process with much of the program’s success.
Integrated product teams: Program 1 was the companies’ first large program toinstitutionalize IPT’s. Not all IPT’s were equally successful of course. Team dynamicsand leadership played important roles in the relative success of the various IPT’s.However, on the IPT’s that really worked together well, the results were veryimpressive. One factory manager quoted that “the XYZ IPT was a very close knit crossfunctional team that developed high trust in each other and solid understanding ofwhat each other needed to do and could do to make the product successful in thefactory. The team was focused on a common goal to transition the product to thefactory and systematically identified and resolved issues one at a time until theproduct could be manufactured in a production environment – a real success story.”
Technical expertise: The Program 1 customer noted that the avionics team haddeveloped the technical skills of their employees to exceptional levels. There wereseveral “national experts” in their fields on the program team and the team seemedcapable of solving “practically any technical problem” (given enough time andmoney of course).
Statistical Design Analysis: CpK analysis was used in pockets on the program –primarily in RF and microwave modules. This analysis technique uses statistics toanalyze a design to predict specification yield (what percentage of the units built willmeet the requirements). Tradeoffs were consciously made to trade margin and yieldfrom one module to another to improve the system’s robustness. There werenoteworthy differences in the hardware that applied CpK and the hardware that didnot apply CpK in terms of manufacturing yield and producibility.
_____________________________________________________________________________________
56
Clear program priorities: The single, overarching priority of the program was clear toeveryone on the program team – performance. This clarity of purpose lead to clearand consistent tradeoffs between performance, budget, schedule and affordabilityconsistent with the top priority of the program and the customer. Performance wasclearly the top priority from contract award through 1997 when CAIV began whichultimately lead to an increased value on affordability. The team’s managementeffectively used very visible “rallying points” to focus the entire team around commonobjectives or goals.
3.2.4 Collaborating across critical functional or organizational boundaries
3.2.4.1 Understanding the system trade space
After the first year of the program, challenging requirements was pursued when arequirement could not be met. It was not a pursued to search for requirements thatbetter optimized the balance between performance and cost.
Requirements closure was elusive. Entering the third production lot, the Program 1team still has many unresolved requirements throughout the hierarchy of the system.In general, the hardware modules did not meet their requirements with sufficientmargin to allow for production variability so virtually all modules required requirementsrelaxation in order to transition to production. However, these new relaxedrequirements have not been incorporated into formal documentation of the programand remain in a state of some flux as the team finished system level verification andvalidation.
The Program 1 team lacked system simulation capability sufficient to understand theimpacts of lower level requirement changes on the top-level system performance.This made arbitrating requirements changes at lower levels difficult. The company hasrecognized this shortfall and invested in the development of an end to end systemmodel for use on future programs. The Program 1 avionics team and customercommunity also lacked simulation capability sufficient to understand the value of aparticular performance level. For example, a heuristic was applied to weightreduction ideas – the program will spend $x per pound of weight reduction. Theserelationships were not developed for other performance levels. These questions aredifficult to answer because they involve the loss of human life and enormous politicalcosts of losing an aircraft.
The Program 1 team ran into difficulty developing consensus among the manystakeholders at the prime contractor and the government acquisition and usercommunities on requirements changes. Typically, it was difficult to find a “buck stopshere” person who had the authority to arbitrate among the various stakeholders andmake the final decision. Stakeholder consensus was elusive because the stakeholdersfor various performance attributes typically had no responsibility for cost or scheduleand had little incentive to change performance requirements.
The system architecture was not very open or adaptable to new customerrequirements. The digital control was implemented in Application Specific Integrated
_____________________________________________________________________________________
57
Circuit (ASIC) technology which creates a “hard wired” system. ASIC respins wererequired to adapt to new requirements and take about a year to complete.
Where the Program 1 team was successful at understanding the customer’s trueneeds, the common threads were developing a very close, working relationship withthe customer at an engineering level and making the customer part of the team thatdeveloped the solution. This way, buy-in was developed along the way so finalapproval was much smoother. The open, engineering level relationship created trustthat was critical to open and honest sharing of information.
3.2.4.2 Subsystem and hardware design
The primary mechanism for integrating downstream manufacturing knowledge intothe design process was through the IPT organizational structure. Manufacturing hadrepresentatives called producibility engineers on each IPT. These engineers wereresponsible for evaluating the product designs for producibility and productionreadiness. As performance was the driving force of the program, productproducibility was given relatively low importance so these producibility engineerswere not always involved in the decision process on equal footing with productengineers.
The producibility engineering role was to provide manufacturing insight into thedesign process. Several interviewees highlighted that producibility engineers whorecently worked in the factory were the most effective because they were tightlyintegrated with the factory and highly knowledgeable about its capabilities.
The producibilty engineers were effective at raising issues and developing designalternatives that could have improved product producibility but many of those issueswent unresolved and alternatives unimplemented. The producibility engineers wereindividual contributors who could raise issues and offer alternatives but couldn’t setthe culture of the organization or influence the priorities of the program. Today, theprogram is fully engaged in affordability and has had the opportunity to understandthe cost drivers and producibility issues after building 30 systems through the first fewproduction lots. In this environment, the producibility engineers are having a muchmore significant impact on cost reduction redesigns. Producibility engineers can besuccessful in the right environment but cannot overcome an environment that placeslow value on product producibility.
Suppliers were not well integrated into the design process. Arm’s length relationshipswere established with little involvement of the design engineering community afterthe specifications were developed and contracts issued to the supplier. In mostcases, the subcontract management fell to subcontracts administrators withinsufficient technical support. This changed significantly when the “production ofEMD assets” began and supplier issues got onto the program’s critical path.
_____________________________________________________________________________________
58
3.2.4.3 Life Cycle Cost feedback into the design
Life Cycle Cost includes development costs, production costs and operations andsupport costs. During the EMD program, Life Cycle Cost was not well integrated intothe design process. Design to Unit Production Cost (DTUPC) was conducted duringsystem and subsystem design but had varying levels of success at integration with andinfluence on the design process. Operations and support costs were estimated butnot integrated with the design process. In general, the DTUPC analysis was notconsidered important until near the end of the program when the cost estimate wassignificantly higher than customer targets.
There were differing reports from interviewees related to whether cost targets wereallocated to subsystems which indicates that cost targets did exist but wereinconsistently and insufficiently communicated to the engineering team.
The early DTUPC work involved the Price-H tool which is an industry tool that usesparametric information about hardware designs to estimate production costs. Forexample, the analysis enters parametric information on size, weight, technology type,complexity, novelty, etc. The tool using that parametric information to estimate aproduction cost based on industry cost data. A quarterly report was generated andsubmitted to the customer during the early years of the program. However, thisanalysis was not well integrated with the design process. Several lead systems andhardware engineers indicated they were not even aware this analysis was going onand these reports were being submitted. This created a damaging underlyingdynamic. The people doing the DTUPC reports were incentivized to show continuousimprovement and the reports show a steady reduction in the DTUPC estimate overthe early years of the program. The people doing product development (whodetermine what the cost will be) were not influenced or grounded by DTUPCrequirements or analysis. The real cost steadily increased over the early years of theprogram as system complexity was added to meet the team’s increasingunderstanding of the technical requirements. The estimated cost steadily decreasedand the real cost steadily increased which led to a sizeable gap after a period ofseveral years.
After CDR, the system and subsystem design was nearly complete, the Price-H modelwas abandoned and a “bottom’s up” DTUPC estimating methodology wasundertaken. This approach involved the manufacturing organization developing acost estimate to build the design. This included:
− Industrial Engineering reviewing all the drawings and developing standards(number of hours it should take to build or test under ideal conditions)
− Manufacturing management developing performance factors (multiplier tothe standards for how long it will take to build or test under expectedconditions)
− Procurement soliciting quotes from suppliers
This method of analysis solved one of the issues with Price-H but created a new issue.This method was credible to the design community because it was a cost estimate oftheir design. The Price-H model was not credible to the design community because it
_____________________________________________________________________________________
59
was a parametric of their design – it couldn’t tell you if part A was a better value thanpart B. The “bottom’s up’ analysis took 6 months to complete and it was updatedonly once per year. This method was better integrated into the design process. Someof the hardware engineers knew what their cost targets were and knew where theystood against those cost targets. No hardware engineers indicated that the costestimates provided insight into what the cost drivers were which made it difficult toknow what to change in the design. No hardware engineers indicated that there wasa support group responsible for design to cost analysis that they felt they could go torun “what if” analysis of various design alternatives under consideration. The lack ofagility of this estimating method led to frustration in both the manufacturing andengineering communities. The engineering communities voiced frustration becausethe estimating method couldn’t run “what if” analysis and updates only came outonce per year. The manufacturing community voiced frustration because it wasimpossible to keep up with the constant and relentless pace of engineering changesto the design. These frustrations point to the need for a credible and agile costanalysis method.
The avionics supplier today has created a “Design to Cost” organization responsiblefor performing design to cost analysis and running “what if” analysis of various designalternatives under consideration. This group is tightly integrated with the costreduction design activities being pursued on Program 1. The hardware engineeringcommunity has voiced repeatedly that this is a welcome change that provides avalued service to the hardware design team. The team now knows where they standagainst cost targets with much more frequent updates. It is believed that this is amajor step towards “where they want to be” with respect to designing affordablesystems and subsystems. The remaining area for improvement is that the Design toCost analysis currently being conducted is still a periodic snapshot in time of wherethe design is compared to a target value. The hardware engineers provide a set ofupdates to the Design to Cost group who provides an updated estimate. Severalengineers indicated “where we want to be” is more proactive with Design to Cost –not just periodic updates but Design to Cost driving the design through proactiveidentification of cost drivers and development of alternatives to lower the cost.
3.2.5 Summary
Program 1 was successful at delivering revolutionary system performance. The entireprogram, and this avionics system was no exception, was caught flat-footed by achange in government priorities increasing the value of affordability. The Program 1team is now reacting to the change in priorities, motivated to keep the program soldand to strengthen relationships with their number one customer, the prime contractor.The team is implementing LEAN enterprise techniques to improve efficiency and ispursuing system and subsystem level product design changes. Even though theProgram 1 avionics system represents only 5% of the platform’s cost, the Program 1team has the top cost reduction project on the entire platform and is changing thesystem architecture exploiting new technology unavailable when Program 1development began. The avionics supplier is demonstrating they know how to designaffordable systems and subsystems when that is what the customer wants.
_____________________________________________________________________________________
60
Several lessons can be learned from Program 1. An IPT organizational structure is greatfor integrating manufacturing, reliability, maintainability and cost considerations intothe design phases if and only if the program’s leadership sets a culture thataffordability and producibility is important. If the program’s culture is driven purely byperformance, the manufacturing, reliability and cost knowledge will be present butwill influence decision making only when not in conflict with performance. Design toCost analysis must be integrated into the design process and must have the followingkey attributes: (1) credible to the design community, (2) agile enough to keep pacewith engineering changes and (3) proactive in highlighting cost drivers to drivealternatives to be considered. Personal relationships and open, objective engineeringlevel communications are the key to successful requirements negotiations. Clearprogram priorities can rally a large team. The clear message that technicalperformance was most important led to revolutionary system performance.
_____________________________________________________________________________________
61
3.3 Program 2
This section covers the Program 2, a subsystem cost reduction development programpursued as part of Program 1’s increased focus on affordability and cost reduction.The section begins with an overview and summary of major outcomes of the program.Noteworthy positive and negative outcomes as identified by the Program 2 team arediscussed along with the primary best practices and critical issues that contributed tothese noteworthy outcomes. A more focused discussion of successful andunsuccessful practices in collaborating across functional and organizationalboundaries rounds out the section.
3.3.1 Program history and summary
The Program 2 subsystem is part of the Program 1 system. The subsystem was designedduring the EMD program with a focus on performance. The primary purpose of thisredesign project was to reduce the cost of the Program 2 subsystem while maintainingthe Program 1 system performance.
The development team met the performance and cost objectives for the programbut required more development budget and schedule than planned. The teamdeveloped a low cost product architecture and selected a new technology becauseit offered significant benefits in product cost. The new technology came with specificperformance risks. An iterative development program was planned to grow theproduct performance but one more iteration was required than was planned.
The Program 2 program manager reported directly to the Program 1 productionprogram manager. The production program manager authorized the funds requiredto implement the project, selected the Program 2 program manager and monitoredprogress weekly throughout the development program. This manager's mainmotivation for authorizing this project was to reduce the cost of the Program 1 system.The Program 2 team also had to be aware of another primary stakeholder, theProgram 1 EMD program manager. This person was ultimately responsible for theperformance of the Program 1 system and served the role of the technical customerwho accepted the performance of the redesigned Program 2 subsystem.
The Program 2 subsystem is a hardware only system consisting of complex radiofrequency (RF) and digital electronics weighing approximately 10 lbs and requiringeight to ten man-years to complete development over a two year period of time.The cost drivers were:
− Very low manufacturing yield (5%) driven by too much component integrationinto a testable entity
− Too much variability in the manufacturing process driven by design requiredmanual tuning or adjustment to RF circuits to bring the module withinperformance specification limits
− Exclusive use of expensive chip and wire technology
_____________________________________________________________________________________
62
The team attacked these primary cost drivers and achieved the following primarybenefits as a result:
− Partitioned the design for 95% manufacturing yield by reducing the level ofcomponent integration into a testable entity
− Outsourced some of the high variability, tuning intensive pieces of the design toa lower cost supplier
− Selected and implemented lower cost packaging technology used by thecommercial industry for low frequency RF applications (printed wiring boardswith packaged components instead of chip and wire technology).
The project was a relatively small, relatively low complexity project that met thecustomer's goals for performance and cost but required additional developmentbudget and schedule to deliver these results.
3.3.2 Critical Issues Leading to Noteworthy Negative Outcomes
The team exceeded its development budget and schedule commitments to itsmanagement. The budget was exceeded by 20% and the schedule slipped byapproximately 6 months which pushed the implementation of the new design fromproduction lot 2 to lot 3. The following critical issues identified by the team were theprimary contributors.
Not understanding design trade space: Failed to understand the design requirementsand trade space. Miscommunication between the team and their technicalcustomer led to a requirement non-compliance at Design Verification Review that thetechnical customer could not accept. This lead directly to cost and schedule overrunto grow the performance.
Parts obsolescence: A key MMIC amplifier went obsolete after CDR and it was toolate to incorporate redesign into the program. An extended production buy wasmade so there was not direct impact to this effort but a subsequent redesign toaddress the obsolete amplifier will be required only 2-3 years after release of thisdesign to production.
New Technology: Underestimated the risk of new technology leading to significantengineering rework and directly contributed to the requirement noncompliance. Theteam redesigned a traditional military microwave electronics design (unpackagedcomponents wire bonded to ceramic substrates in a hermetic multichip module)using a more commercial design approach (plastic packaged components mounteddirectly to a printed circuit board in a non hermetic module).
3.3.3 Best Practices Leading to Noteworthy Positive Outcomes
The team met aggressive production cost reduction goals (reduce cost by 50%). Thefollowing best practices identified by the team were the primary contributors.
_____________________________________________________________________________________
63
Program culture valued affordability: The program’s primary goal was affordability.The program manager drove the focus on affordability. The team was very receptiveto valuing affordability because they all had scars from transitioning someunproducible designs from development into production. This zeal also hurt the teamas they pushed the design to achieve cost goals, which contributed to aperformance issue.
Affordability considered a design requirement: An affordability requirement was setprior to design kick-off (AUPC = 50% current design). This requirement was aconsideration in all design decisions.
Integration of cost feedback into the design process: Cost feedback was reviewedfrequently during the conceptual design and technology selection process (kickoffthrough Preliminary Design Review). From PDR on, the focus switched to producibilityand achieving the design performance needs.
Integration of producibility into the design process: An extremely zealous producibilityengineer was a core team member of the program. She supervised the assembly ofall prototypes and final units originating and collecting producibility improvementideas from everyone who touched the product and drove the incorporation of thoseideas into the next design iteration. Her enthusiasm and the group’s value onaffordability and producibility enabled almost all of the ideas to be incorporated.
Integration of suppliers into the program: The conceptual design decomposed thesubsystem into 6 key modules. Integrated a very capable supplier to develop 3 of themodules. The supplier was funded to propose a solution for the entire subsystem. Thisexperience gave the supplier greater insight into the entire product and enabledthem to more effectively develop their pieces of the system. Weekly oversight by thesubcontract management team (a very senior technical lead and subcontractmanager) and collaborative design reviews really worked. The supplier was on time,on budget and their modules worked.
Iterative development process: The product development strategy was to build andtest hardware early and often. The program consisted of two planned spirals and oneunplanned spiral. The unplanned spiral was required to fix the late discoveredrequirements non-compliance. This approach allowed the team to identify issues withtheir approach, evaluate alternate solutions and implement the solutions in aniterative manner that significantly improved the quality of their product.
Architecture Innovations: The team developed a new subsystem architecture thatdramatically reduced cost with no performance impact. The new architectureinvolved partitioning the subsystem into module and performing strategic make/buydecisions on each module. This allowed the team to dramatically increase themanufacturing yield by reducing the complexity in each testable module andoutsource modules to firms offering competitive advantage in specific module types.The interfaces between the modules were given great consideration in thearchitecture. Performance adjustment would be needed to adjust the gain levelonce the modules were assembled together. Traditionally this adjustment is done
_____________________________________________________________________________________
64
within a module using delicate and costly ‘chip out and replace’ techniques forcomponent changes. The team developed a coaxial attenuator that was part of thecable interconnects between the modules that could provide this gain adjustment.This dramatically reduced the time and cost of performing the adjustment.
Successfully exploited a technology opportunity: The team leveraged technologyadvances in digital circuit card technology to replace expensive multi-chip moduletechnology for less expensive packaged surface mount circuit card technology forthe low frequency RF circuitry.
3.3.4 Collaborating across critical functional or organizational boundaries
3.3.4.1 Understanding the system trade space
The technical customer for the Program 2 team was the Program 1 systemengineering community. The systems engineering community included manystakeholders. There was a system engineering lead for each major functionperformed by the Program 1 system. Due to the integrated nature of the Program 1system architecture, the Program 2 subsystem contributed to several major Program 1functions so the Program 2 team had several technical customers. The systemsengineering community assigned a point of contact ("Joe") to interface with theProgram 2 team to ensure the new subsystem design would integrate into the largersystem and arbitrate any requirements issues with the various systems engineeringstakeholders. The Program 2 team interfaced directly with the various systemsengineering stakeholders during major program milestones (mostly design reviews).Day to day collaboration was between the Program 2 team and Joe. With nocompany level organizational boundaries between the team and its technicalcustomer, the communication was informal. This informality had pros and cons. Itmade the communications more frequent and completely focused on the technicalissues. It also tended to be under-documented which opened the opportunity formiscommunications and misunderstandings.
The frequent collaboration led the design team to identify several aspects of thebaseline design that no longer were needed by the Program 1 system. Specifically, 15MMIC amplifiers and all the required supporting circuitry were eliminated from thedesign.
The late discovery of a requirements non-compliance based on miscommunicationbetween the design team and the systems engineering community directly lead to anunplanned design spiral causing budget and schedule overruns. The design teamthought they had agreement that the demonstrated performance was acceptableat CDR. The technical customer community could not accept the demonstratedperformance and thought they had agreement from the design team to grow theperformance.
The Program 2 team indicated that next time they would insist that criticalagreements on requirements interpretations or changes be documented. Next time,the team would also insist upon more frequent interactions between the design team
_____________________________________________________________________________________
65
and all the stakeholders in the systems engineering community to allow the designteam to understand the system's needs better and the systems engineeringcommunity to understand the Program 2 subsystem's needs better.
3.3.4.2 Subsystem and hardware design
Manufacturing and suppliers were both effectively integrated into the design phase.
− Producibility integrated into preliminary and detail design: An extremely zealousproducibility engineer was a core team member of the program. She supervisedthe assembly of all prototypes and final units originating and collected producibilityimprovement ideas from everyone who touched the product and drove theincorporation of those ideas into the next design iteration. Her enthusiasm and thegroup’s value on affordability enabled almost all of the ideas to be incorporated.The key enablers were her zealous enthusiasm, the group's value on affordabilityand the design-build-test-design-build-test spiral development process. This lastpoint cannot be overemphasized - having early hardware, putting it in varioustechnicians and manufacturing engineers' hands to get improvement ideas andhaving additional planned design spirals to incorporate the ideas into the designwas crucial. The producibility engineer was held responsible for bring producibilityimprovement ideas to the table. The design engineers were responsible forincorporating those ideas. It was difficult to determine how producible wasproducible enough? There was a cost requirement but the team didn't have anyway to incorporate the producibility improvement ideas into the design to costanalysis because the analysis was at too high a level. This led to the inevitablequestion of how producible is producible enough when incorporation ofproducibility improvement ideas stresses the product's performance or theprogram's budget and schedule. This case highlights the need for quantifiable,verifiable requirements for producibility. One obvious solution is to link theproducibility of the product with the cost of the product through closed loop designto cost analysis.
− Suppliers integrated into the program: A supplier made half of the criticl modules inthe subsystem. The supplier was funded to provide a technical proposal for theentire subsystem in order to provide the team another perspective on architecturealternatives. This perspective helped the supplier develop their subassemblymodules more effectively because they understood the needs of the subsystem andnot just the needs of their modules. Weekly interaction between the supplier andthe Program 2 subcontract management team helped keep the supplier integratedinto the program. The supplier was given complete authority to design their moduleswithin the requirements negotiated with the internal design team. They weremonitored weekly but never directed to design something this way or that way. Thisworked. Clear requirements, clear accountability. Designs that worked, were ontime and on budget.
_____________________________________________________________________________________
66
3.3.4.3 Life Cycle Cost feedback into the design
There was great cost feedback into the design during the conceptual design. It wasgood in the preliminary design phase and did not exist during the detail design phase.The trailing off of cost feedback into the design was because the team had no wayto tie producibility improvement ideas to the design to cost analysis because theanalysis was done at a system level and broke down at the detail level. This may beadequate considering published literature indicates 80% of the cost is set by theconceptual design.
The cost estimating method used complexity factors to similar modules. This workedwell because It can be done quickly, if you have an extensive enough database ofcost history and similar modules - a new model developed in a day, iterations done inminutes or hours. This near real time feedback was critical to integrate cost feedbackin the design. If it takes a week or two to do the cost analysis, it will always be a weekor two behind the design and will be all but useless in influencing the design. Designdecisions are made daily and the analysis needs to be able to keep up.
3.3.5 Summary
The Program 2 team was successful at delivering an affordable product. It met thecustomer's goals for performance and cost. Meeting both the performance and costgoals led to budget and schedule overruns in the development program. The teamdelivered an affordable product by focusing on affordability as a design requirement,integrated cost, producibility and supplier feedback into the design process andfocused on risk reduction by using an iterative development process. The team raninto budget and schedule issues through miscommunications with their technicalcustomers and not fully appreciating the risks of new technology.
Informality with the technical customer lead to richer discussions but increased theopportunity for miscommunication. Formality adds value for critical agreements whileinformality is best for communication. Producibility was effectively integrated into thedesign process through a very zealous individual and a team that placed a highvalue on affordability and producibility. Suppliers were effectively integrated into thedesign process by allocating clear technical and schedule requirements andmaintaining weekly contact between the Program 2 subcontract management teamand the key supplier. Cost was integrated into the design phases during theconceptual and preliminary design phase when it was most important in setting thesubsystem costs. This program highlights that the current tool set for design to costanalysis makes it difficult to integrate cost feedback into the design process duringthe detail design phases.
_____________________________________________________________________________________
67
3.4 Programs 3 and 4
3.4.1 Program history and summary
Programs 3 and 4 each consist of a single hardware module that fits in the palm ofyour hand. These programs are discussed together because they offer an interestingcontrast. Program 3 has successfully produced over 10,000 modules and is known asthe company’s model program for success in Lean manufacturing and affordability.Program 4 was managed by the same team but was not successful. The contractwas terminated as the team experienced difficulties in transitioning the product fromprototype to manufacturing.
3.4.2 Critical Issues Leading to Noteworthy Negative Outcomes
The most noteworthy negative event was the contract termination of Program 4 .
The team was supplying the Program 3 product and another firm was supplying theProgram 4 product. The other firm announced its intent to exit the business. Thecustomer contracted two firms to develop a replacement design. Each firm wasstruggling to develop an affordable, performance compliant module. The customerturned to the Program 3 team and asked them to enter the competition based ontheir successful track record managing Program 3. All three firms were given thedesign documentation of the existing product design as a starting point. Affordabilitydefined as meeting both performance and production cost requirements was the toppriority in the competition. The team knew they were entering the competition laterthan their competitors and would need to “catch up” so they set an aggressiveproduction cost target they felt would be substantially lower than their competitorsand began work on a design concept.
The team reviewed the existing design, made assessments of which assemblies“worked” and should be reused and which assemblies offered the most area forimprovement. These decisions set the product architecture – both the partitioningand subassembly interfaces. Once these architectural decisions were made,subassembly redesign began. The resulting concept offered relatively high technicalrisk to meeting performance requirements but offered a credible path to theaggressive production cost target. This concept centered around a small number ofhighly integrated and complex MMICs (an alternate approach would have been alarger number of less complex MMICs). These complex MMICs became the core ofthe new design and were marketed as the team’s technical discriminator.
When the first 12 prototype MMICs were developed and demonstrated in atechnology demonstration, the customer was thrilled because the demonstratedperformance was superior to the other competitors. The customer was in seriousjeopardy of interrupting production because of continuing problems at the team’scompetitors to supply compliant modules. The team accelerated the productionMMIC fabrication and module design work and began building their first productionproduct but ran into technical performance issues. As the team continued to strugglethrough these technical issues that prevented the design from replicating prototype
_____________________________________________________________________________________
68
performance, one of the competitors worked through their problems and beganbuilding compliant modules and delivering them on time. Eventually, the customerterminated the contract and continues to purchase the modules from the successfulcompetitor today.
The critical issues that contributed to this outcome were as follows:
Took a technical risk and lost: The underlying cycle was as follows: striving foraffordability led to a design concept with new, unproven technology which led tohigher risk which led to a design that didn’t work which led to program termination.The design centered around unproven MMIC technology. The “super MMIC” wasdemonstrated in a prototype but proved not ready for production. If the “superMMIC” concept had been technically successful, the production cost would havebeen significantly lower and the team would have had a good chance of winningthe business. When you gamble, sometimes you win, sometimes you lose.
Underestimated technical risk: The team did not plan an iterative approach tomaturing the module and MMIC technology over time. The team membersinterviewed believed strongly that with another iteration they could have “gottenthere”. The team was also slow in recognizing the MMIC risk because they haddemonstrated the prototype MMICs and because they had marketed their MMICability as their key technical discriminator. This led to an unstated program teamassumption that the “MMICs would work”. So, no alternate path approach was takenthat didn’t rely on the new MMICs. Significant time was spent fixing the wrongproblem before the team focused their energies on fixing the MMICs. However, thebusiness environment was not conducive to cycle time required for this iterativeapproach because the competitor who showed up first with a functioning, affordableproduct would win and the team was a late entrant to the competition.
3.4.3 Best Practices Leading to Noteworthy Positive Outcomes
The most noteworthy positive outcome was the affordability and producibility of theProgram 3 product.
The Program 3 product development included three design iterations. The first designiteration was focused on performance and several prototypes were produced. Thesecond design iteration was called the Producibility Enhancement Program (PEP). Theprimary objective of the PEP was to make a production ready design from theprototype and transition the product into production. The PEP design had significantdesign issues transitioning to production but was able to achieve a manufacturingrate of 80 modules per month for about 1,100 modules.
A final design iteration was conducted called the Cost Reduction Program (CRP). Theprimary objective of the CRP design was to reduce the manufacturing cost andincrease the production rate by almost 300% - from 80 modules per month to 220modules per month. The CRP design was extremely successful with only one minordesign issue that was resolved quickly. The design coupled with a very strong and
_____________________________________________________________________________________
69
successful implementation of Lean manufacturing lead to a 75% reduction inmanufacturing hours required to assemble and test a module from the PEP design.
During the Cost Reduction Program, the team focused on all aspects of production todevelop a more affordable product.
The best practices that led to this positive outcome were as follows:
Focused on all contributors to cost: The Cost Reduction Program focused on designissues, assembly process issues, implemented LEAN manufacturing methodologies andeven reorganized the program team to reduce program management cost. Theprogram team today does not believe there is an end to their improvement efforts –they continue to have Lean Kaizen events and drive out cost.
Iterative product and process development: The Program 3 product went throughthree major design iterations – the prototype design, the Producibility EnhancementProgram (PEP) and the Cost Reduction Program (CRP). The first iteration focused ontechnical performance. The second iteration focused on producibility, transitioning toproduction and getting to production volumes. The third iteration focused onreducing parts count, simplifying functions and redesigning any cost driving designfeatures identified when building the 1,100 units during PEP. This iterative designprocess led to a lot of experimentation, risk reduction and the final CRP designleveraged a known good design with known cost drivers from extensive data on 1,100units manufactured. This made it easy to know what to change to reduce cost. Theteam’s top priority was cost reduction. The team knew what the cost drivers were.They made design improvements, process improvements, focused on manufacturingflow (Lean), worked tightly with their suppliers to reduce supplier costs and workedtightly with their customer to challenge cost driving requirements.
Relative simplicity of product and high volume: The Program 3 product is a moduleabout the size of your hand and team has built over 10,000 units. This is high volumefor defense firms. The incredible success (90% reduction in cost and 75% reduction intouch labor) has been easy for employees, management and customers to see. Thesuccess and simplicity have combined to make this the company’s model programfor affordability and cost reduction.
3.4.4 Collaborating across critical functional or organizational boundaries
3.4.4.1 Understanding the system trade space
The Program 3 team developed the requirements specification for the CRP designiteration with full understanding and knowledge of the cost performance trade-offsand then negotiated with their customer for approval of the requirementsspecification. This was a very effective way to develop requirements that consideredboth performance and cost.
Program 4 was a different story. Program 3 was a sole source contract so there wereno “fairness in competition” issues. Program 4 was a competition. The customer
_____________________________________________________________________________________
70
developed the requirements for all competitors. In a competitive environment,suppliers are less likely to push back on requirements for fear of appearing non-responsive to the customer’s needs or technically inferior to their competitors. In acompetitive environment, customers are less likely to change requirements onceissued because they need to coordinate the changes with all competitors and theyare hoping someone can develop an innovative solution that meets the requirementsaffordably.
3.4.4.2 Subsystem and hardware design
Supplier integration was not a big driver because the components purchased werelargely standard, off the shelf components. The critical driver was integratingmanufacturing knowledge into the design process to be able to meet the veryaggressive cost targets and production volume of over 10,000 modules. Producibilityengineers were given the responsibility to integrate manufacturability into the designprocess. MANTECH funding was provided to the producibility engineering team tofund experiments to develop optimum design rules for automated assembly ofmillimeter wave modules. This funding spawned producibility improvements in the PEPdesign. Additional improvements materialized in the CRP design. The team had built1,100 units and understood the cost drivers and could illicit ideas from dozens ofpeople involved in building these 1,100 modules from assembly and test techniciansto process engineers and factory managers. This unambiguous, fact based set ofknowledge about the problem to be solved was invaluable to the CRP design.
3.4.4.3 Life Cycle Cost feedback into the design
Life Cycle Cost consisted primarily of development and production costs. Littleevidence was found suggesting production cost feedback into the design processuntil the CRP design. The team used a Design to Unit Production Cost (DTUPC)scorecard which set goals for all the subassemblies in the module and trackedprogress towards those goals. These scorecards were very visible to the members ofthe team and decisions were made based on the analysis that tracked progresstowards the goals in the scorecard. Several engineers indicated that this is a lot easierto do in a cost reduction iteration than the first iteration. Having a design with knownperformance and cost makes a big difference in understanding where tradeoffs canbe made with minimal performance risk and maximum cost benefit.
3.4.5 Summary
These programs offer an interesting comparison of a successful and an unsuccessfulprogram. Program 3 was very successful. The design met the customers needs forperformance and affordability, has been profitable to the supplier and has become amodel program for cost reduction and Lean manufacturing at the company. Theprimary enabler to this success was an iterative design process that focused first ongetting the product to work, second on making it manufacturable to meetproduction schedules (PEP) and finally optimizing cost after gaining significantknowledge of the cost drivers (CRP). LEAN enterprise techniques were aggressivelyimplemented and attacked the manufacturing flow, organizational structure and
_____________________________________________________________________________________
71
practically every production step in the process. All of this was supported by a closecustomer-supplier relationship and long term commitment to the supplier through solesource contracts with aggressive cost targets.
Program 4 followed a very different pattern. The customer-supplier relationships were“arms length” because of the nature of a competitive procurement. The team was alate entrant into the competition and did not have time for an iterative developmentapproach. The technical approach taken was relatively high technical risk to meetthe aggressive DTUPC targets. The result of relatively high technical risk without aniterative development process produced a design that had technical issuestransitioning to production. The contract was terminated as the team was workingthrough those technical issues because a competing firm developed a requirementscompliant, affordable solution first.
_____________________________________________________________________________________
72
3.5 Program 5
3.5.1 Program history and summary
This project was a medium sized avionics system development program. Thedevelopment program required several hundred million dollars and several years todevelop a complex system involving hundreds of pounds of electronics and hundredsof thousands of lines of software code.
The most noteworthy positive outcome was the eventual success in developing a veryhigh performance system with order of magnitude improvement in systemfunctionality. The most noteworthy negative outcome was significant cost andschedule overruns as several unplanned design iterations were required in order tomeet the demanding performance requirements. Program 5 is a classic example ofan over-constrained program with insufficient development funding and schedule tomeet demanding performance requirements.
3.5.2 Critical Issues Leading to Noteworthy Negative Outcomes
The most noteworthy negative outcomes of Program 5 were severe technicalproblems that led to multiple unplanned design iterations that caused budgetoverruns and schedule delays. These led to program restructuring by the governmentacquisition customer, which has put the production program at risk of beingcancelled. The plan does remain to upgrade the heritage system with the Program 5system once testing and development is completed.
Aggressive budget and schedule: The Program 5 procurement competition wasextremely competitive which led to aggressive budget estimates by all competitors.This negatively impacted the amount of risk reduction planned into the program. Forexample, no flight testing was planned until formal OPEVAL testing by thegovernment. The Program 5 system was on the critical path for productionauthorization of a new fighter which created an aggressive schedule that was the toppriority of the government customer and could not be changed without impactingthe new fighter’s production. An iterative development process focused on riskreduction was not pursued for the Program 5 development program. The fundingonly permitted a “success oriented” approach of one planned design iteration.
High Technical Risk to be affordable: Program 5 was aggressively marketed as anaffordability enabling program for the government because of common hardwareacross multiple platforms across multiple U.S. military services. The program team “soldthe program” based on the affordability of the product. The affordability drivenmarketing of the product essentially dictated certain design implementationapproaches that were relatively high risk. This relatively high risk, coupled with onlyone planned design iteration led to a planned approach with a low probability ofsuccess.
_____________________________________________________________________________________
73
Design Reviews lacked focus on affordability: Once the program was awarded, thefocus shifted dramatically from affordability to performance and schedule. Thecustomer would often tell the team to skip the affordability briefing to extend thetechnical dialogue in design review and Technical Interchange Meetings. This sent apowerful message to the team that affordability was no longer important.
No organizational capability to provide cost estimates to design team: For themanufacturing organization to perform the cost estimates using existing companypractices, they needed drawings and parts lists – indicating the design was mostlycomplete. For engineering to perform the cost estimates, they tended to only focuson material costs and ignore factory labor costs. The major problem was that theanalysis was not tied to the design process in a way that was meaningful to the designengineers.
3.5.3 Best Practices Leading to Noteworthy Positive Outcomes
The most noteworthy positive outcome of the program was a technically viable,common system design that could be used across several platforms.
Clear focus on technical excellence: The program took a relatively high technical riskin order to have a low cost approach and did not plan on an iterative design processto mitigate the risk through design evolution. This led to critical technical problems insystem test that essentially eliminated all value from the product (these were notgraceful performance degradations but catastrophic failures). Over time (a prettylong time), these issues were resolved leading to significant cost and scheduleoverruns. In the end, several design iteration were required but the system works andcan be used across multiple platforms for multiple U.S military services (its not quitethrough all system testing but results to date are very positive).
3.5.4 Collaborating across critical functional or organizational boundaries
3.5.4.1 Understanding the system trade space
The particularly effective method of negotiating requirements and truly understandingthe system trade space from the Program 5 team surrounded around three principles:
1) Develop personal relationships with key customer stakeholders2) Involve the customer in developing the solution on controversial issues3) Do the analysis for your customer if you can
Personal relationships were particularly valuable in a difficult program like Program 5.These relationships didn’t necessarily translate into acceptance of requestedrequirements changes but did create an atmosphere where both sides trusted eachother and believed their intentions were in the best interests of the program. This trustcreated a more open and honest dialogue, which is critical in resolving controversialissues. Involving the customer in developing solutions on particularly controversialissues was very effective. Nobody likes to give up something. Nobody likes to havedo extra work in order to give something up. That is what suppliers ask of theircustomers when they request requirements changes that requires the customer to
_____________________________________________________________________________________
74
perform analysis to determine the impact of the requested change. If the supplier iscapable of performing the analysis, doing so makes renegotiations easier because itdoesn’t require the customer to do work to justify giving something up.
3.5.4.2 Subsystem and hardware design
Program 5 was organized in an Integrated Product Team structure. The team had aproducibility engineer involved in the program from very early on to bringmanufacturing insight into the design. However, there were no hard metrics thatdefined how producible was producible enough? Suggested metrics from the teaminclude first pass manufacturing yield and production related engineering changeorders.
3.5.4.3 Life Cycle Cost feedback into the design
Several problems were identified in integrating life cycle cost into the design process:− The process lacks rapid costing. Engineers seldom have access to cost
information of their design until after the design is mostly completed and thenthey have to do a redesign to remove cost.
− Engineers should track and report parts count. This can be done rapidly,without the assistance of a cost analyst and is a good indicator of whether thecost is increasing or decreasing over time. The program director “discovered”one day that the parts count had more than doubled and had no priorindication of this tend.
− The design to cost / life cycle cost contract requirement is common but it is notviewed with high importance. Typically, a finance person works this with alogistics engineer. Design engineering needs to own this and take it seriouslywith cost estimating support from finance and manufacturing.
− The program director suggested programs need to appoint a Design to Cost orAffordability “Czar” who is respected technically and has downstreammanufacturing experience. This person should report to the program directorwho needs to drive the importance of affordability into the entire team.
3.5.5 Summary
Program 5 was a very tough program. Severe technical issues caused significantbudget and schedule overruns. After several unplanned design iterations to resolvethese issues, the product works well and will provide a step function improvement incapability. The fundamental issue with Program 5 was taking a high technical riskapproach in the system design and product development process (no iterations)under the banner of affordability. This high risk without appropriate risk reduction ledto a planned approach with a low probability of success.
_____________________________________________________________________________________
75
3.6 Programs 6 and 7
The products from these programs serve identical functions for different platforms. Theproducts are very similar in functionality and design construction. The products weredesigned at similar times utilizing similar technology. However, 7 costs 4-5x less than 6.
Program 6 was a performance driven program. The customer pushed therequirements to the corner of the envelope. The customer was also extremely weightconscious and pushed the implementation of exotic composite materials in order toremove weight. The customer did not show interest in the production cost of theproduct so the supplier did not spend much energy on keeping track of the eventualproduction cost while the design was being developed. Towards the end of thedevelopment program, the customer finally asked what this product would cost andwas shocked at the cost. The supplier was shocked at the cost. The program is nowimplementing cost reduction initiatives to reduce the cost of the product and itappears that the program’s viability hinges on the successful implementation of costreduction initiatives. If the cost does not get reduced, the program’s survival is injeopardy.
Program 7 was driven by value – a balance of performance and cost. It serves thesame function as 6 but for a different platform. Program 7 started after Program 6and leveraged lessons learned from Program 6. The supplier worked very closely withthe customer and used CAIV techniques to present various cost-performance trade-offs in jointly developing the requirements specification. The result was a much lowerrisk design approach that produced about 80% of the performance of 6 at 20% of thecost. Program 7 is a very successful program and has entered full rate production.The customer is satisfied with the performance and has increased the productionquantity. The program is profitable to the supplier.
The description of the research conducted on Programs 6 and 7 has been significantlyabbreviated because they are classified programs to develop classified systems.They are included because there is an important takeaway. If you understand thecost-performance trade-offs and use that knowledge in developing requirements andsystem design it is possible to develop a product that produces 80% of theperformance at 20% of the cost. (Or conversely, not understanding these tradeoffscan result in a product that costs 4-5x more cost for 20% more performance).
_____________________________________________________________________________________
76
4 Discussion of Results and Conclusions
Each of the seven programs investigated offers results that provide deeper insight intoengineering and management actions that can be taken by the avionics firm toimprove system affordability. This section will briefly summarize each program. Theneach of the four focus areas will be discussed in greater detail:
− The nature of development focus during design iterations− The role of requirements− Treating cost as a design requirement− Integrating downstream knowledge into the design
4.1 Program Summaries
Program 1 successfully delivered a system that met demanding performancerequirements and provided an order of magnitude leap in system capabilitycompared to legacy systems. This lifecycle cost of this system was higher than thecustomer’s goals. Program 1 delivered performance but not lifecycle cost. Thisprogram was caught by changes in the customer’s goals – shifting focus fromperformance to affordability well after the program’s Critical Design Review. Theprogram today is shifting focus in concert with the customer’s new priorities and isaggressively improving affordability through year after year incrementalimprovements using Lean techniques and step function improvements fromarchitecture and module level design innovations.
Program 2 offers deeper insight into the step function improvements possible throughmodule level design innovations. This program is a cost reduction design programimplemented as part of Program 1’s cost reduction initiative. The programredesigned a subsystem of the Program 1 system during the LRIP program.Architecture innovations at the subsystem level and a technology opportunity wereimplemented to reduce the production cost of the subsystem by 50%. Thearchitecture innovation centered around how the subsystem was partitioned andhow the pieces would interface with one another. The technology opportunityexploited advances in digital circuit card technology to replace more costly hermeticpackaged chip and wire technology for RF circuitry. This program delivered both theperformance and the lifecycle cost goals of the customer but required additionalbudget and schedule to do so (one unplanned design iteration was required toachieve performance goals).
Program 3 followed a traditional iterative development path of design it to work,make producibility improvements to meet production schedule then makeaffordability improvements to meet cost goals. This path was successful for theprogram. This program used both incremental improvements through Leanimplementation and step function improvements to module design to meet thecustomer’s performance and lifecycle cost goals.
Program 4 was a difficult program executed by the same group of engineers andmanagers as Program 3. The team entered the competition years after their
_____________________________________________________________________________________
77
competitors and took a high risk, high payoff design approach involving a “superMMIC” that if successful would have leapfrogged the competition in performanceand lifecycle cost. As the team was entering the competition late, there was not timefor planned design iterations to grow the product performance. The gamble was notsuccessful. Difficulties in transitioning from prototype to manufacturing led to contracttermination.
Program 5 was another difficult program. A highly competitive acquisition led to anover-constrained program. The budget and schedule were not adequate to achievethe required performance and lifecycle cost goals. The program was marketed onaffordability – a low cost system that could be used on multiple platforms for multiplearmed services to achieve greater economies of scale. Once the program wasawarded, the focus shifted dramatically to schedule and performance. Schedulewas the top driver because this program was on the critical path for Congressionalauthorization for production of a new fighter. Based on an extremely competitiveacquisition process, the customer was unwilling to change performance requirementsearly in the program for fear of calling the integrity of the acquisition process intoquestion. The over-constrained nature of the program forced the team into taking ahigh risk, high payoff approach with very little risk reduction or design iterationsplanned. Catastrophic performance failures occurred in system testing whichrequired several unplanned design iterations leading to cost and schedule overruns.In the end, the system met most of the performance goals but did not meet the lifecycle cost goals. The Program 5 production is somewhat in jeopardy based on thelate schedule and higher costs.
Program 6 and 7 offer an interesting contrast. Program 6 had low knowledgeregarding achievable performance and cost drivers and a customer with high priorityon performance and low priority on life cycle cost. This led to performancerequirements that were technically very challenging. The team developed a systemthat met these requirements but at a very high cost. The production of Program 6 is inserious jeopardy because of the high cost. The cost required to achieve the last 10-20% of performance was more than the customer is willing to pay for thatperformance. Program 6 delivered performance but not lifecycle cost. Program 7leveraged the knowledge from Program 6 about cost drivers and achievableperformance. The team was able to credibly map out the trade space ofperformance and cost and work collaboratively with the customer to developrequirements. This process led to low risk requirements and a lifecycle cost 4-5x lowerthan Program 6. This program delivered both performance and lifecycle cost.
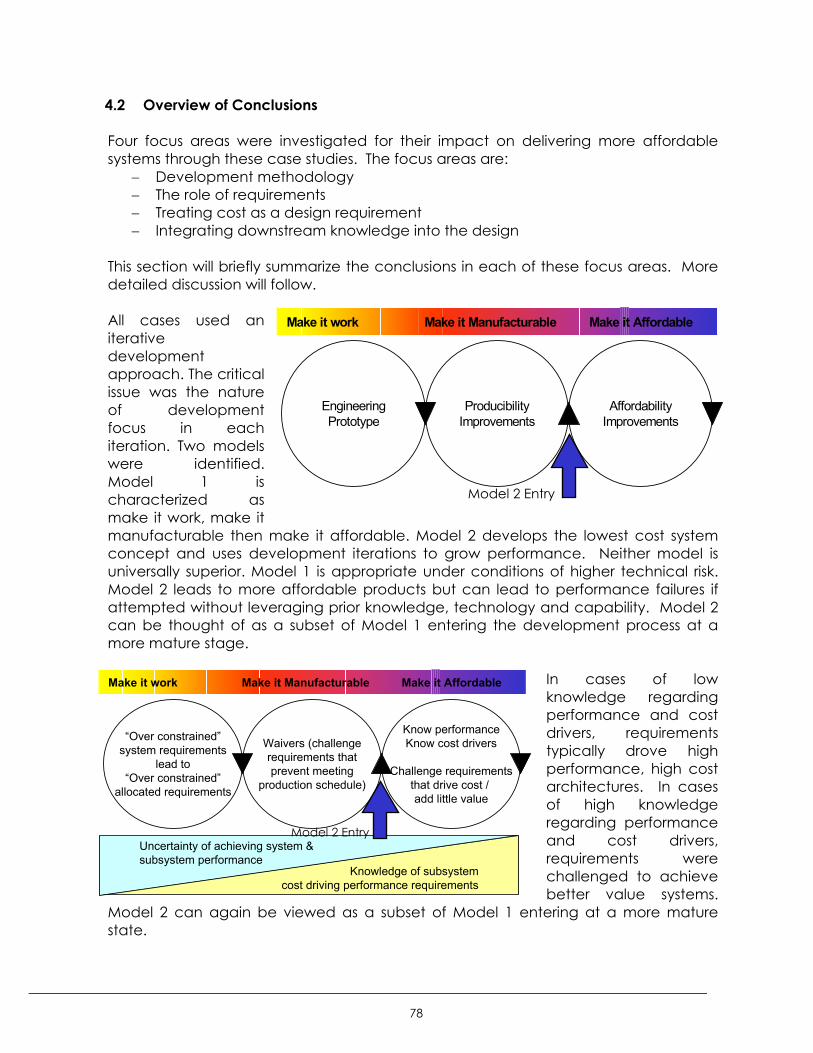
_____________________________________________________________________________________
78
4.2 Overview of Conclusions
Four focus areas were investigated for their impact on delivering more affordablesystems through these case studies. The focus areas are:
− Development methodology− The role of requirements− Treating cost as a design requirement− Integrating downstream knowledge into the design
This section will briefly summarize the conclusions in each of these focus areas. Moredetailed discussion will follow.
All cases used aniterativedevelopmentapproach. The criticalissue was the natureof developmentfocus in eachiteration. Two modelswere identified.Model 1 ischaracterized asmake it work, make itmanufacturable then make it affordable. Model 2 develops the lowest cost systemconcept and uses development iterations to grow performance. Neither model isuniversally superior. Model 1 is appropriate under conditions of higher technical risk.Model 2 leads to more affordable products but can lead to performance failures ifattempted without leveraging prior knowledge, technology and capability. Model 2can be thought of as a subset of Model 1 entering the development process at amore mature stage.
In cases of lowknowledge regardingperformance and costdrivers, requirementstypically drove highperformance, high costarchitectures. In casesof high knowledgeregarding performanceand cost drivers,requirements werechallenged to achievebetter value systems.
Model 2 can again be viewed as a subset of Model 1 entering at a more maturestate.
AffordabilityImprovements
ProducibilityImprovements
EngineeringPrototype
Make it work Make it Manufacturable Make it Affordable
Model 2 Entry
Know performanceKnow cost drivers
Challenge requirementsthat drive cost / add little value
Waivers (challengerequirements thatprevent meeting
production schedule)
“Over constrained”system requirements
lead to“Over constrained”
allocated requirements
Make it work Make it Manufacturable Make it Affordable
Knowledge of subsystemcost driving performance requirements
Uncertainty of achieving system & subsystem performance
Model 2 Entry
_____________________________________________________________________________________
79
Cost has traditionally been considered a manufacturing or management requirementin the defense industry. Barriers exist to treating cost as a design requirement. There isoften an engineering cultural bias against cost as a design requirement. The costestimating tools are underdeveloped for use when they are needed most - in earlystages of development. This suggests another reason why an affordability focustypically comes in latter design iterations when more knowledge of cost drivers exists.Although barriers exist, the programs studied showed high correlation betweendevelopment of more affordable products and costs being managed like a designrequirement.
Integrated Product Teams provide the presence of downstream knowledge in thedesign process. Downstream knowledge takes the form of hardware engineers in thesystem design process or manufacturers in the hardware design process. Effective useof this knowledge is a problem of collaboration across boundaries where presence ofknowledge is necessary but not sufficient. Mutual dependence, clear goals andmutually accepted methods of assessing progress towards those goals increase theeffective use of downstream knowledge. Mutual dependence can be established bytreating cost as a design requirement – designers will need manufacturers’ knowledgeabout cost to meet this design requirement. Cost analysis is the method for assessingprogress provided it is credible to engineering and manufacturing stakeholders.
The following sections will explore each of these four focus areas in greater detail.
_____________________________________________________________________________________
80
4.3 Development Methodology
All programs evaluated used a iterative or spiral development approach. Someplanned these iterations, others required unplanned iterations in order to meetperformance or lifecycle cost goals. The critical issue identified through this researchwas the nature of development focus during each design iteration. Two models wereobserved. Mode 1 can be characterized as make it work, make it manufacturablethen make it affordable. Mode 2 is characterized by developing the lowest costarchitecture and using design iterations to grow performance. It isn’t that one modelis universally superior to the other at developing affordable systems – it’s that eachmodel is adapted for different conditions in the following areas: priority on cost vs.performance, technical risk – particularly the consequence of performance shortfallsand planned design iterations.
Program 1 and Program 3 were the examples of the Model 1 approach. Program 1pursued four major design iterations. The first was described as a Design Verificationprototype. One system was built and the sole objective of this iteration was to makethe system work. The second iteration was called Engineering and ManufacturingDevelopment. Eleven systems were built and the primary objective again was to getthe system to work with a secondary objective of making producibility improvementsand begin the transition from engineering to manufacturing. The third iteration wasfocused primarily on producibility improvements to help increase production rate. Thisiteration occurred during the first two LRIP lots. The fourth design iteration occurred insubsequent LRIP lots and is focused on affordability improvements. The Program 2case is an example of the type of affordability improvements pursued during thisdesign iteration. Program 3 pursued three design iterations. The first iteration was anEngineering Prototype, the second was called the Producibility EnhancementProgram and the third called a Cost Reduction Program. The first iteration focused ongetting the product to work. The second focused on producibility improvements toincrease production rate. The third iteration focused on cost reduction. Figure 4.3.1illustrates these iterations.
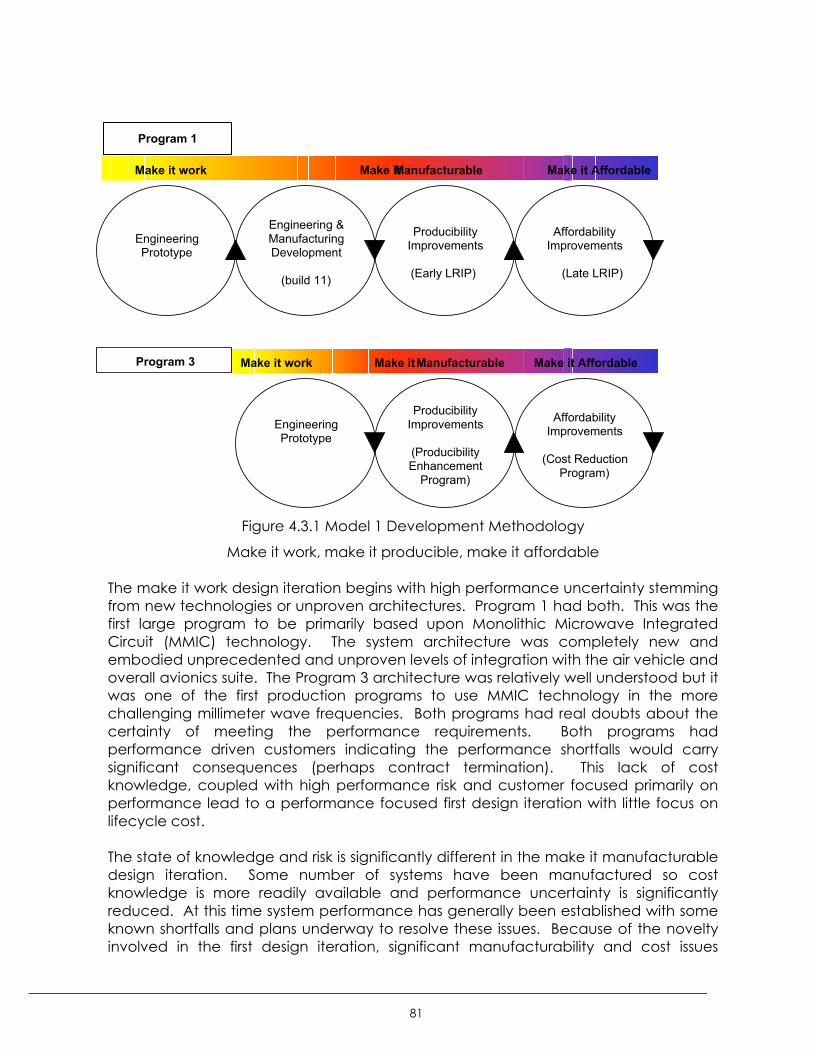
_____________________________________________________________________________________
81
Figure 4.3.1 Model 1 Development Methodology
Make it work, make it producible, make it affordable
The make it work design iteration begins with high performance uncertainty stemmingfrom new technologies or unproven architectures. Program 1 had both. This was thefirst large program to be primarily based upon Monolithic Microwave IntegratedCircuit (MMIC) technology. The system architecture was completely new andembodied unprecedented and unproven levels of integration with the air vehicle andoverall avionics suite. The Program 3 architecture was relatively well understood but itwas one of the first production programs to use MMIC technology in the morechallenging millimeter wave frequencies. Both programs had real doubts about thecertainty of meeting the performance requirements. Both programs hadperformance driven customers indicating the performance shortfalls would carrysignificant consequences (perhaps contract termination). This lack of costknowledge, coupled with high performance risk and customer focused primarily onperformance lead to a performance focused first design iteration with little focus onlifecycle cost.
The state of knowledge and risk is significantly different in the make it manufacturabledesign iteration. Some number of systems have been manufactured so costknowledge is more readily available and performance uncertainty is significantlyreduced. At this time system performance has generally been established with someknown shortfalls and plans underway to resolve these issues. Because of the noveltyinvolved in the first design iteration, significant manufacturability and cost issues
AffordabilityImprovements
(Late LRIP)
ProducibilityImprovements
(Early LRIP)
EngineeringPrototype
Engineering &ManufacturingDevelopment
(build 11)
Make it work Make it Manufacturable Make it Affordable
AffordabilityImprovements
(Cost ReductionProgram)
ProducibilityImprovements
(ProducibilityEnhancement
Program)
EngineeringPrototype
Make it work Make it Manufacturable Make it AffordableProgram 3
Program 1
_____________________________________________________________________________________
82
remain so transition to manufacturing is difficult and increasing production rate isbehind plan. This design iteration is focused on improving producibility to enableincreasing production rate.
The final design iteration is focused on making the product more affordable to get tocustomer cost targets and keep the program sold. Performance is well established,manufacturabilty is generally established – the program is back on productionschedule or getting there. The primary motivator is keeping the program sold bydemonstrating cost reductions. The team has very good knowledge of cost driversbecause they have built a significant quantity. In some cases, enough time haspassed from the first iteration to this final iteration to create technology opportunities.The Program 2 case highlighted a module level technology opportunity in exploitingdevelopments in digital circuit card technology to lower the cost of RF circuits. Theteam is also exploiting a architecture level technology opportunity utilizing digitaltechnology unavailable when Program 1 development began. Program 3 had builtwell over a thousand units before entering their Cost Reduction Program and madecost reductions through product design improvements and manufacturing processimprovements.
The Model 2 development methodology is characterized by developing the lowestcost architecture or concept possible and using design iterations to grow systemperformance to meet performance goals. Program 2 provided an example. A lowcost architecture was developed that changed how the subassembly was partitionedand how the pieces would interface with each other. The team exploited atechnology opportunity by using advanced digital circuit card technologies for someof the RF circuitry leading to significantly reduced cost with only a slight penalty inperformance. This technology opportunity created a performance risk in channel tochannel isolation. The team grew the performance from 7dB short in the first iterationto 3 dB short in the second iteration and compliant during the final iteration. Thisapproach increases development risk because it plans on growing performance.Planning on how much performance improvement is achievable in each iteration isuncertain. The team required one more iteration than planned to meet performancerequirements, which led to a budget and schedule overrun. Program 7 providesanother example of this approach with an interesting twist. Program 7 developed alow cost architecture (4-5x lower than Program 6) and was able to develop thissystem in one design iteration because of leveraging significant knowledge,technology and capability from Program 6. Program 7 leveraged little actualhardware and software from Program 6 but leveraged extensive knowledge.
Program 4 and Program 5 offer examples of unsuccessful attempts at developingproducts using the Model 2 approach. Both programs developed low cost systemconcepts. These programs were not leveraging significant prior knowledge,technology and capability so the low cost system concepts entailed significantperformance risk. Both systems had catastrophic performance failures in initial testing.The failures were not graceful performance degradation but hard system failuresleaving little value in the product for the customer until the shortfalls were resolved.Neither program planned risk reduction activities or design iterations to burn down thetechnical risk and grow system performance. The coupling of high technical risk, high
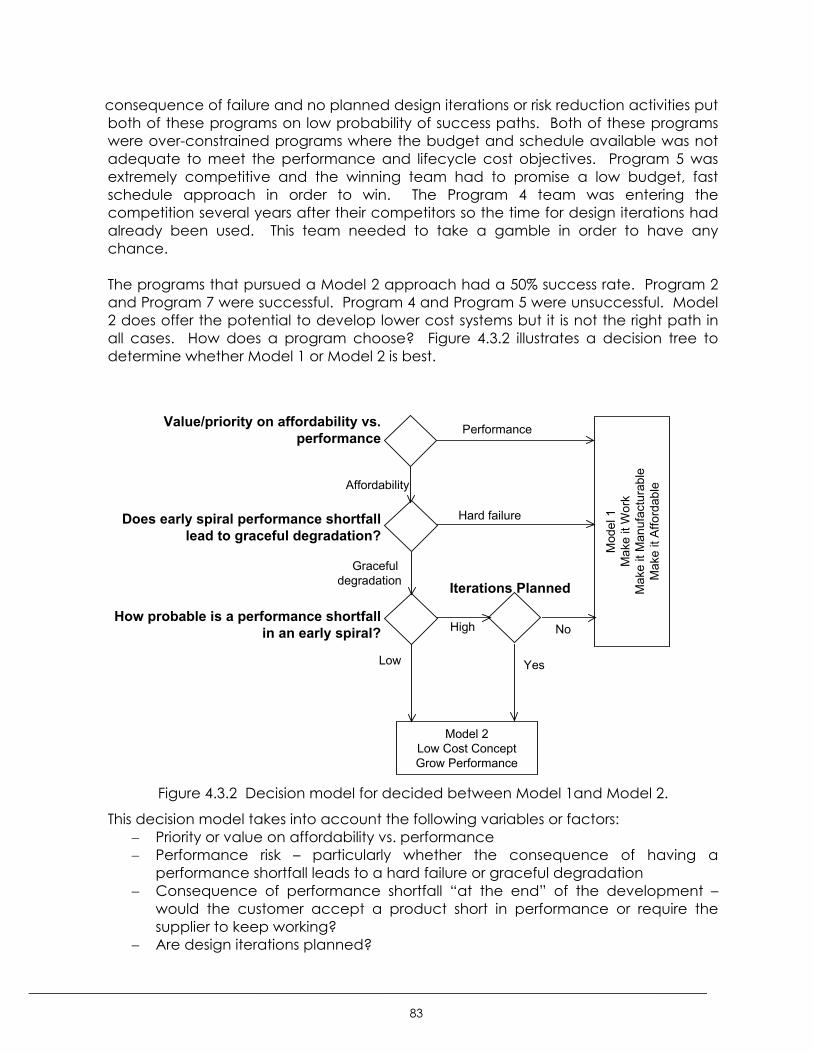
_____________________________________________________________________________________
83
consequence of failure and no planned design iterations or risk reduction activities putboth of these programs on low probability of success paths. Both of these programswere over-constrained programs where the budget and schedule available was notadequate to meet the performance and lifecycle cost objectives. Program 5 wasextremely competitive and the winning team had to promise a low budget, fastschedule approach in order to win. The Program 4 team was entering thecompetition several years after their competitors so the time for design iterations hadalready been used. This team needed to take a gamble in order to have anychance.
The programs that pursued a Model 2 approach had a 50% success rate. Program 2and Program 7 were successful. Program 4 and Program 5 were unsuccessful. Model2 does offer the potential to develop lower cost systems but it is not the right path inall cases. How does a program choose? Figure 4.3.2 illustrates a decision tree todetermine whether Model 1 or Model 2 is best.
Figure 4.3.2 Decision model for decided between Model 1and Model 2.
This decision model takes into account the following variables or factors:− Priority or value on affordability vs. performance− Performance risk – particularly whether the consequence of having a
performance shortfall leads to a hard failure or graceful degradation− Consequence of performance shortfall “at the end” of the development –
would the customer accept a product short in performance or require thesupplier to keep working?
− Are design iterations planned?
Value/priority on affordability vs.performance
Does early spiral performance shortfalllead to graceful degradation?
How probable is a performance shortfallin an early spiral?
Affordability
Graceful degradation
Model 2Low Cost ConceptGrow Performance
Iterations Planned
Yes
Hard failure
Performance
Mod
el 1
Mak
e it
Wor
kM
ake
it M
anuf
actu
rabl
eM
ake
it Af
ford
able
No
Low
High
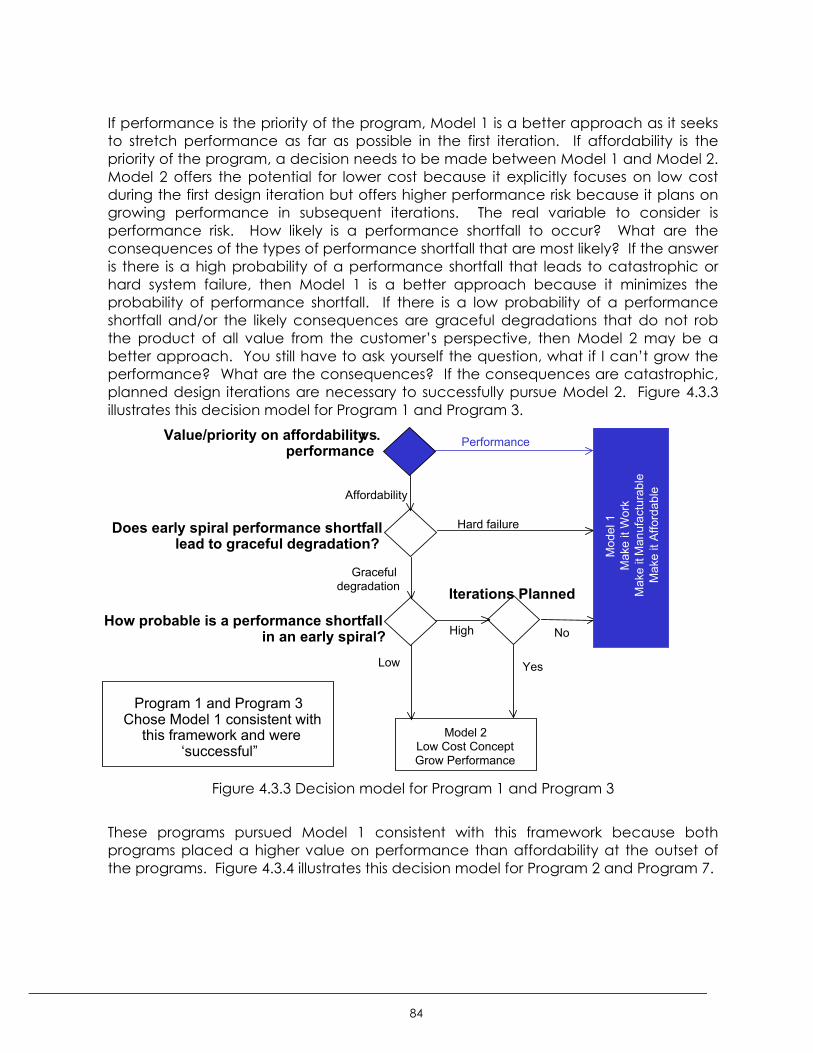
_____________________________________________________________________________________
84
If performance is the priority of the program, Model 1 is a better approach as it seeksto stretch performance as far as possible in the first iteration. If affordability is thepriority of the program, a decision needs to be made between Model 1 and Model 2.Model 2 offers the potential for lower cost because it explicitly focuses on low costduring the first design iteration but offers higher performance risk because it plans ongrowing performance in subsequent iterations. The real variable to consider isperformance risk. How likely is a performance shortfall to occur? What are theconsequences of the types of performance shortfall that are most likely? If the answeris there is a high probability of a performance shortfall that leads to catastrophic orhard system failure, then Model 1 is a better approach because it minimizes theprobability of performance shortfall. If there is a low probability of a performanceshortfall and/or the likely consequences are graceful degradations that do not robthe product of all value from the customer’s perspective, then Model 2 may be abetter approach. You still have to ask yourself the question, what if I can’t grow theperformance? What are the consequences? If the consequences are catastrophic,planned design iterations are necessary to successfully pursue Model 2. Figure 4.3.3illustrates this decision model for Program 1 and Program 3.
Figure 4.3.3 Decision model for Program 1 and Program 3
These programs pursued Model 1 consistent with this framework because bothprograms placed a higher value on performance than affordability at the outset ofthe programs. Figure 4.3.4 illustrates this decision model for Program 2 and Program 7.
Affordability
Model 2Low Cost ConceptGrow Performance
Iterations Planned
Yes
Performance
Mod
el 1
Mak
e it
Wor
kM
ake
it M
anuf
actu
rabl
eM
ake
it Af
ford
able
No
Program 1 and Program 3Chose Model 1 consistent with
this framework and were‘successful”
Graceful degradation
Hard failure
Value/priority on affordability vs.performance
Does early spiral performance shortfalllead to graceful degradation?
How probable is a performance shortfallin an early spiral?
Low
High
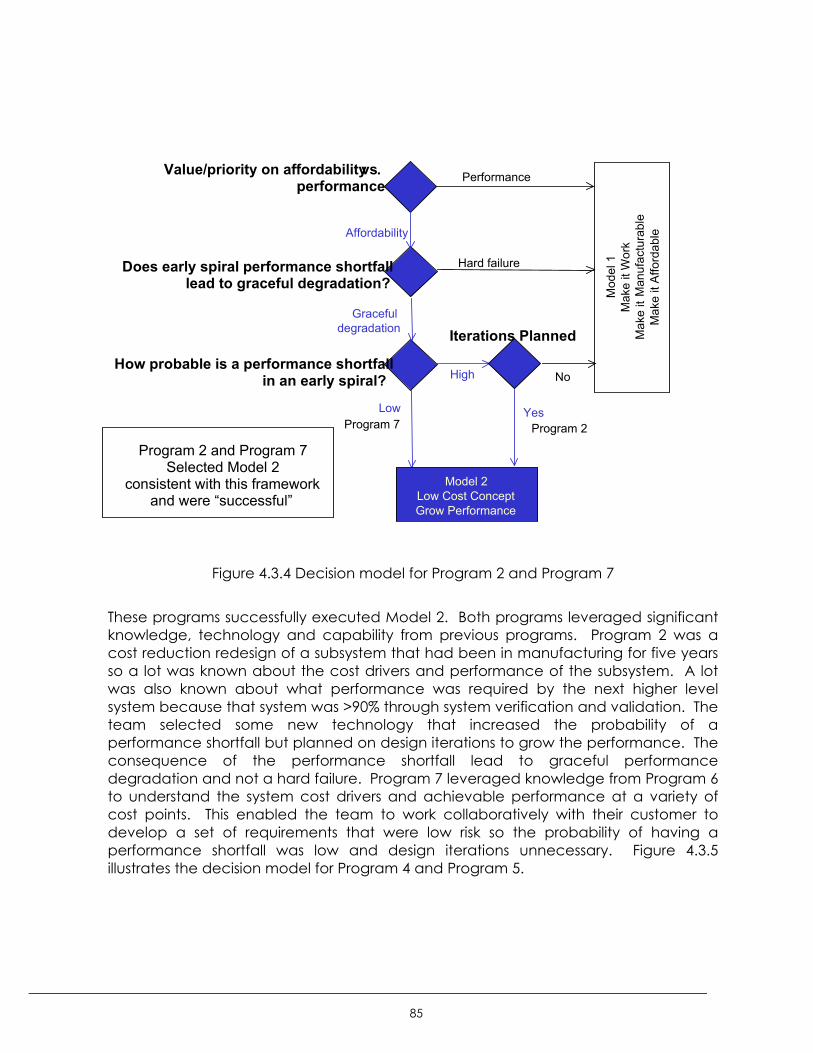
_____________________________________________________________________________________
85
Figure 4.3.4 Decision model for Program 2 and Program 7
These programs successfully executed Model 2. Both programs leveraged significantknowledge, technology and capability from previous programs. Program 2 was acost reduction redesign of a subsystem that had been in manufacturing for five yearsso a lot was known about the cost drivers and performance of the subsystem. A lotwas also known about what performance was required by the next higher levelsystem because that system was >90% through system verification and validation. Theteam selected some new technology that increased the probability of aperformance shortfall but planned on design iterations to grow the performance. Theconsequence of the performance shortfall lead to graceful performancedegradation and not a hard failure. Program 7 leveraged knowledge from Program 6to understand the system cost drivers and achievable performance at a variety ofcost points. This enabled the team to work collaboratively with their customer todevelop a set of requirements that were low risk so the probability of having aperformance shortfall was low and design iterations unnecessary. Figure 4.3.5illustrates the decision model for Program 4 and Program 5.
Affordability
Model 2Low Cost ConceptGrow Performance
Iterations Planned
Yes
Performance
Mod
el 1
Mak
e it
Wor
kM
ake
it M
anuf
actu
rabl
eM
ake
it Af
ford
able
No
Program 2 and Program 7 Selected Model 2
consistent with this frameworkand were “successful”
Graceful degradation
Hard failure
Value/priority on affordability vs.performance
Does early spiral performance shortfalllead to graceful degradation?
How probable is a performance shortfallin an early spiral?
Low
High
Program 2Program 7
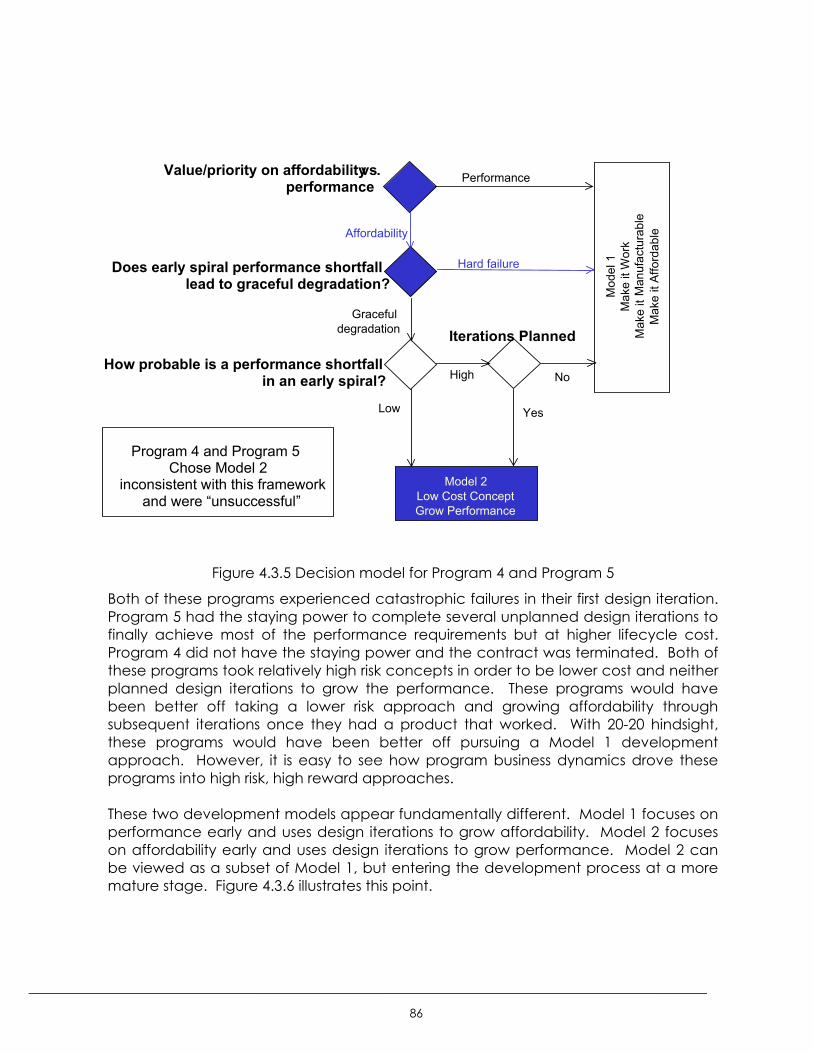
_____________________________________________________________________________________
86
Figure 4.3.5 Decision model for Program 4 and Program 5
Both of these programs experienced catastrophic failures in their first design iteration.Program 5 had the staying power to complete several unplanned design iterations tofinally achieve most of the performance requirements but at higher lifecycle cost.Program 4 did not have the staying power and the contract was terminated. Both ofthese programs took relatively high risk concepts in order to be lower cost and neitherplanned design iterations to grow the performance. These programs would havebeen better off taking a lower risk approach and growing affordability throughsubsequent iterations once they had a product that worked. With 20-20 hindsight,these programs would have been better off pursuing a Model 1 developmentapproach. However, it is easy to see how program business dynamics drove theseprograms into high risk, high reward approaches.
These two development models appear fundamentally different. Model 1 focuses onperformance early and uses design iterations to grow affordability. Model 2 focuseson affordability early and uses design iterations to grow performance. Model 2 canbe viewed as a subset of Model 1, but entering the development process at a moremature stage. Figure 4.3.6 illustrates this point.
Affordability
Model 2Low Cost ConceptGrow Performance
Iterations Planned
Yes
Performance
Mod
el 1
Mak
e it
Wor
kM
ake
it M
anuf
actu
rabl
eM
ake
it Af
ford
able
No
Program 4 and Program 5 Chose Model 2
inconsistent with this frameworkand were “unsuccessful”
Graceful degradation
Hard failure
Value/priority on affordability vs.performance
Does early spiral performance shortfalllead to graceful degradation?
How probable is a performance shortfallin an early spiral?
Low
High
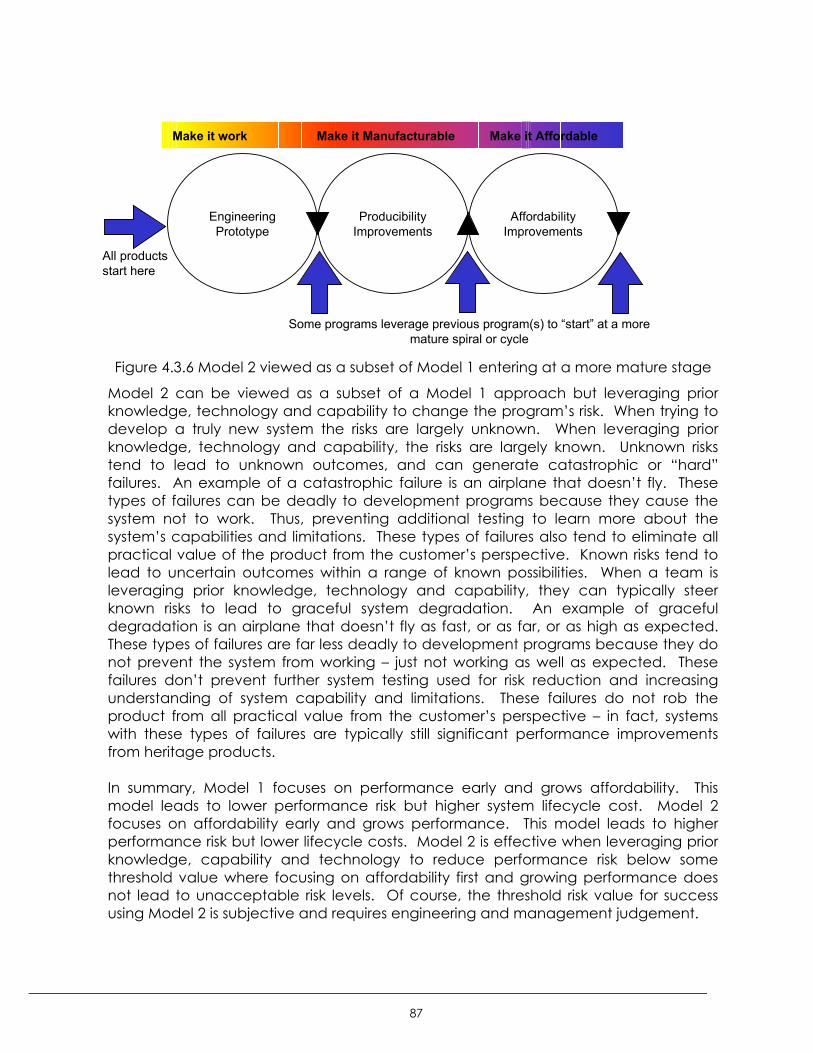
_____________________________________________________________________________________
87
Figure 4.3.6 Model 2 viewed as a subset of Model 1 entering at a more mature stage
Model 2 can be viewed as a subset of a Model 1 approach but leveraging priorknowledge, technology and capability to change the program’s risk. When trying todevelop a truly new system the risks are largely unknown. When leveraging priorknowledge, technology and capability, the risks are largely known. Unknown riskstend to lead to unknown outcomes, and can generate catastrophic or “hard”failures. An example of a catastrophic failure is an airplane that doesn’t fly. Thesetypes of failures can be deadly to development programs because they cause thesystem not to work. Thus, preventing additional testing to learn more about thesystem’s capabilities and limitations. These types of failures also tend to eliminate allpractical value of the product from the customer’s perspective. Known risks tend tolead to uncertain outcomes within a range of known possibilities. When a team isleveraging prior knowledge, technology and capability, they can typically steerknown risks to lead to graceful system degradation. An example of gracefuldegradation is an airplane that doesn’t fly as fast, or as far, or as high as expected.These types of failures are far less deadly to development programs because they donot prevent the system from working – just not working as well as expected. Thesefailures don’t prevent further system testing used for risk reduction and increasingunderstanding of system capability and limitations. These failures do not rob theproduct from all practical value from the customer’s perspective – in fact, systemswith these types of failures are typically still significant performance improvementsfrom heritage products.
In summary, Model 1 focuses on performance early and grows affordability. Thismodel leads to lower performance risk but higher system lifecycle cost. Model 2focuses on affordability early and grows performance. This model leads to higherperformance risk but lower lifecycle costs. Model 2 is effective when leveraging priorknowledge, capability and technology to reduce performance risk below somethreshold value where focusing on affordability first and growing performance doesnot lead to unacceptable risk levels. Of course, the threshold risk value for successusing Model 2 is subjective and requires engineering and management judgement.
AffordabilityImprovements
ProducibilityImprovements
EngineeringPrototype
Make it work Make it Manufacturable Make it Affordable
All productsstart here
Some programs leverage previous program(s) to “start” at a moremature spiral or cycle
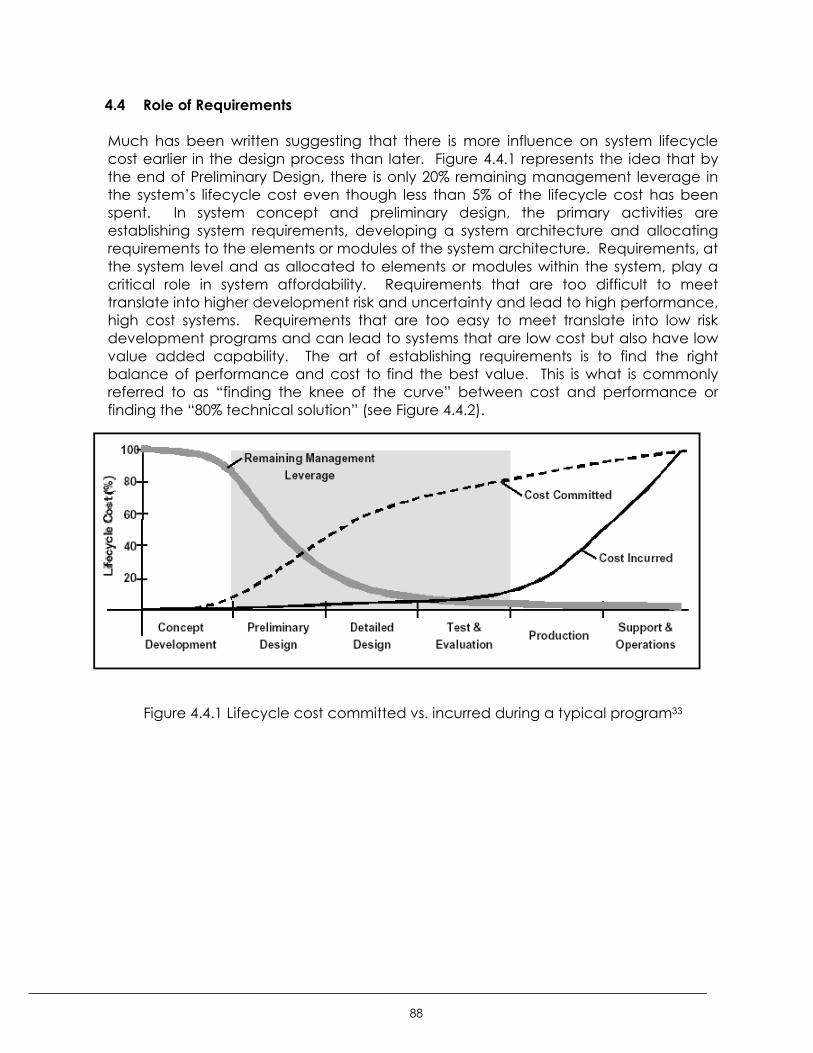
_____________________________________________________________________________________
88
4.4 Role of Requirements
Much has been written suggesting that there is more influence on system lifecyclecost earlier in the design process than later. Figure 4.4.1 represents the idea that bythe end of Preliminary Design, there is only 20% remaining management leverage inthe system’s lifecycle cost even though less than 5% of the lifecycle cost has beenspent. In system concept and preliminary design, the primary activities areestablishing system requirements, developing a system architecture and allocatingrequirements to the elements or modules of the system architecture. Requirements, atthe system level and as allocated to elements or modules within the system, play acritical role in system affordability. Requirements that are too difficult to meettranslate into higher development risk and uncertainty and lead to high performance,high cost systems. Requirements that are too easy to meet translate into low riskdevelopment programs and can lead to systems that are low cost but also have lowvalue added capability. The art of establishing requirements is to find the rightbalance of performance and cost to find the best value. This is what is commonlyreferred to as “finding the knee of the curve” between cost and performance orfinding the “80% technical solution” (see Figure 4.4.2).
Figure 4.4.1 Lifecycle cost committed vs. incurred during a typical program33
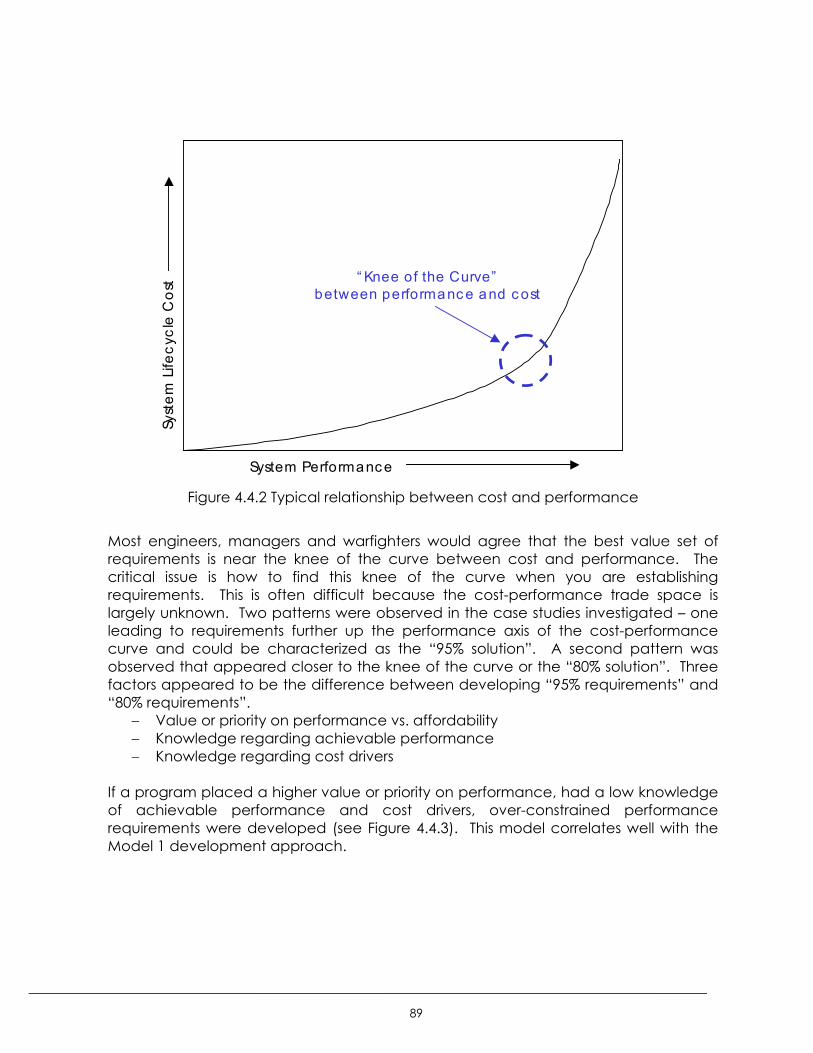
_____________________________________________________________________________________
89
Figure 4.4.2 Typical relationship between cost and performance
Most engineers, managers and warfighters would agree that the best value set ofrequirements is near the knee of the curve between cost and performance. Thecritical issue is how to find this knee of the curve when you are establishingrequirements. This is often difficult because the cost-performance trade space islargely unknown. Two patterns were observed in the case studies investigated – oneleading to requirements further up the performance axis of the cost-performancecurve and could be characterized as the “95% solution”. A second pattern wasobserved that appeared closer to the knee of the curve or the “80% solution”. Threefactors appeared to be the difference between developing “95% requirements” and“80% requirements”.
− Value or priority on performance vs. affordability− Knowledge regarding achievable performance− Knowledge regarding cost drivers
If a program placed a higher value or priority on performance, had a low knowledgeof achievable performance and cost drivers, over-constrained performancerequirements were developed (see Figure 4.4.3). This model correlates well with theModel 1 development approach.
System Performanc e
Syst
em L
ifecy
cle
Cos
t “ Knee of the Curve”between performanc e and c ost
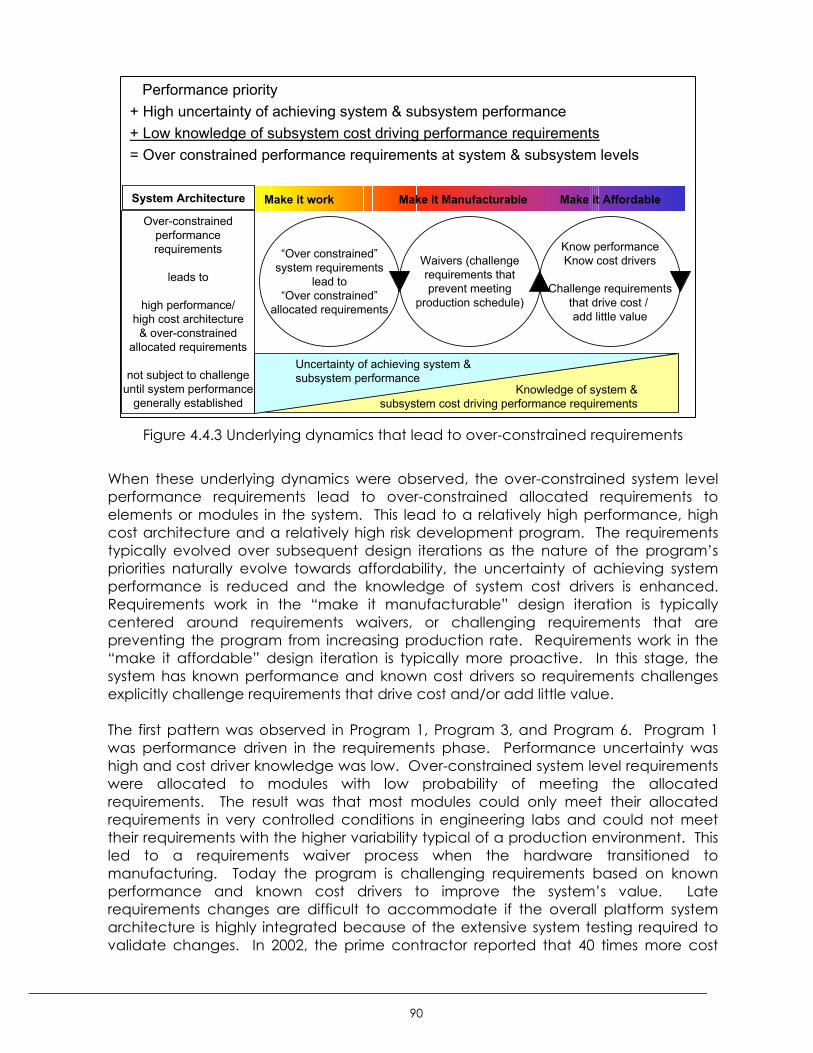
_____________________________________________________________________________________
90
Figure 4.4.3 Underlying dynamics that lead to over-constrained requirements
When these underlying dynamics were observed, the over-constrained system levelperformance requirements lead to over-constrained allocated requirements toelements or modules in the system. This lead to a relatively high performance, highcost architecture and a relatively high risk development program. The requirementstypically evolved over subsequent design iterations as the nature of the program’spriorities naturally evolve towards affordability, the uncertainty of achieving systemperformance is reduced and the knowledge of system cost drivers is enhanced.Requirements work in the “make it manufacturable” design iteration is typicallycentered around requirements waivers, or challenging requirements that arepreventing the program from increasing production rate. Requirements work in the“make it affordable” design iteration is typically more proactive. In this stage, thesystem has known performance and known cost drivers so requirements challengesexplicitly challenge requirements that drive cost and/or add little value.
The first pattern was observed in Program 1, Program 3, and Program 6. Program 1was performance driven in the requirements phase. Performance uncertainty washigh and cost driver knowledge was low. Over-constrained system level requirementswere allocated to modules with low probability of meeting the allocatedrequirements. The result was that most modules could only meet their allocatedrequirements in very controlled conditions in engineering labs and could not meettheir requirements with the higher variability typical of a production environment. Thisled to a requirements waiver process when the hardware transitioned tomanufacturing. Today the program is challenging requirements based on knownperformance and known cost drivers to improve the system’s value. Laterequirements changes are difficult to accommodate if the overall platform systemarchitecture is highly integrated because of the extensive system testing required tovalidate changes. In 2002, the prime contractor reported that 40 times more cost
Performance priority+ High uncertainty of achieving system & subsystem performance+ Low knowledge of subsystem cost driving performance requirements= Over constrained performance requirements at system & subsystem levels
Know performanceKnow cost drivers
Challenge requirementsthat drive cost / add little value
Waivers (challengerequirements thatprevent meeting
production schedule)
“Over constrained”system requirements
lead to“Over constrained”
allocated requirements
Make it work Make it Manufacturable Make it AffordableSystem Architecture
Over-constrainedperformancerequirements
leads to
high performance/high cost architecture& over-constrained
allocated requirements
not subject to challengeuntil system performance
generally establishedKnowledge of system &
subsystem cost driving performance requirements
Uncertainty of achieving system & subsystem performance
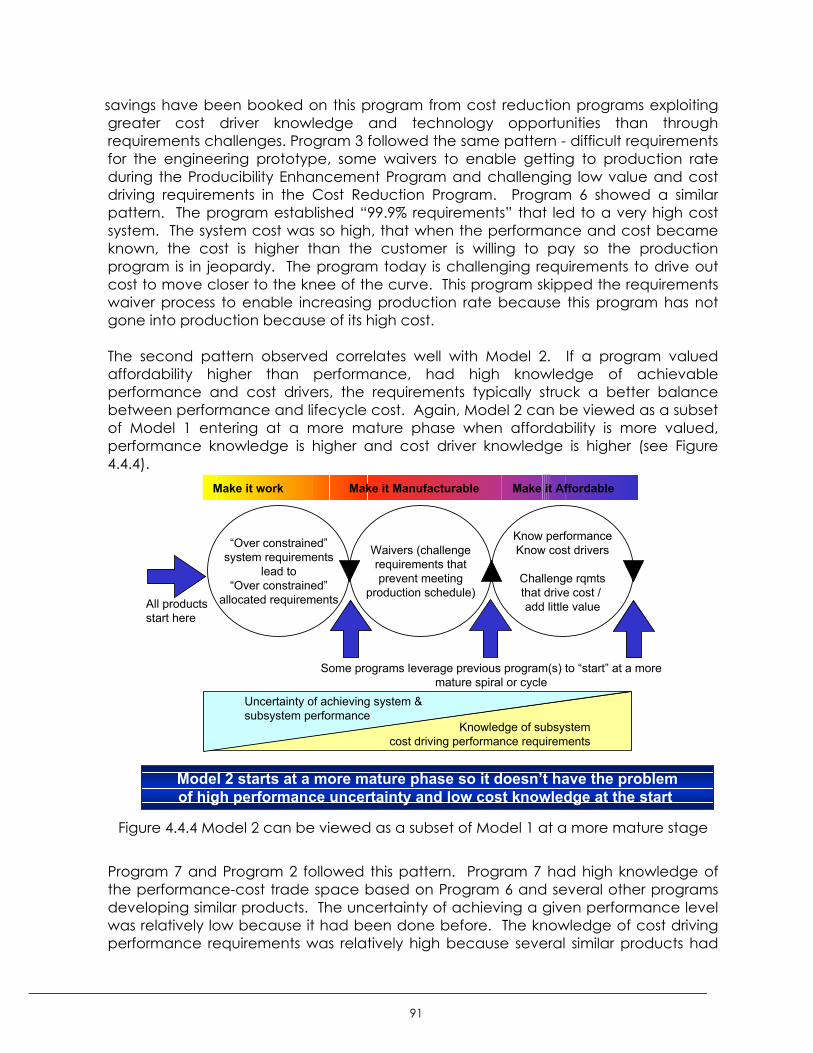
_____________________________________________________________________________________
91
savings have been booked on this program from cost reduction programs exploitinggreater cost driver knowledge and technology opportunities than throughrequirements challenges. Program 3 followed the same pattern - difficult requirementsfor the engineering prototype, some waivers to enable getting to production rateduring the Producibility Enhancement Program and challenging low value and costdriving requirements in the Cost Reduction Program. Program 6 showed a similarpattern. The program established “99.9% requirements” that led to a very high costsystem. The system cost was so high, that when the performance and cost becameknown, the cost is higher than the customer is willing to pay so the productionprogram is in jeopardy. The program today is challenging requirements to drive outcost to move closer to the knee of the curve. This program skipped the requirementswaiver process to enable increasing production rate because this program has notgone into production because of its high cost.
The second pattern observed correlates well with Model 2. If a program valuedaffordability higher than performance, had high knowledge of achievableperformance and cost drivers, the requirements typically struck a better balancebetween performance and lifecycle cost. Again, Model 2 can be viewed as a subsetof Model 1 entering at a more mature phase when affordability is more valued,performance knowledge is higher and cost driver knowledge is higher (see Figure4.4.4).
Figure 4.4.4 Model 2 can be viewed as a subset of Model 1 at a more mature stage
Program 7 and Program 2 followed this pattern. Program 7 had high knowledge ofthe performance-cost trade space based on Program 6 and several other programsdeveloping similar products. The uncertainty of achieving a given performance levelwas relatively low because it had been done before. The knowledge of cost drivingperformance requirements was relatively high because several similar products had
Know performanceKnow cost drivers
Challenge rqmtsthat drive cost / add little value
Waivers (challengerequirements thatprevent meeting
production schedule)
“Over constrained”system requirements
lead to“Over constrained”
allocated requirements
Make it work Make it Manufacturable Make it Affordable
Knowledge of subsystemcost driving performance requirements
Uncertainty of achieving system & subsystem performance
All productsstart here
Some programs leverage previous program(s) to “start” at a moremature spiral or cycle
Model 2 starts at a more mature phase so it doesn’t have the problemof high performance uncertainty and low cost knowledge at the start
_____________________________________________________________________________________
92
been developed at different points along the cost-performance line. Leveraging thisprior knowledge enabled the team to work collaboratively with their customer todevelop a set of system requirements that led to a development program withrelatively known performance and cost. The program transitioned into productionand the customer has actually increased production volumes. Program 2 was amodule level cost reduction redesign program of a subsystem to the Program 1system that was in LRIP. About fifty Program 2 subsystems had been built before theteam began. This gave the team known performance and known cost drivers before.The performance of the Program 1 system was also mostly known – having completedabout 90% of system verification and validation testing. This enabled the team’stechnical customer to have high knowledge about what performance requirementsadded value to the next higher level system and which did not. This enabled theteam to challenge low value requirements, which helped the team reduce theproduction cost by 50%.
Program 4 and Program 5 followed a Model 2 development approach but weregenerally viewed as unsuccessful programs. Program 5 required several unplanneddesign iterations in order to grow the performance into compliance after acatastrophic failure on the first, and only planned, design iteration. Program 4 wascancelled following catastrophic failure of the first, and only planned design iteration.The requirements model for the programs followed the same pattern as Program 1,Program 3 and Program 6. Low prior knowledge of achievable performance andcost drivers led to requirements that favored performance over affordability. But, thedevelopment approach initially favored affordability over performance. Thisrepresents a mismatched program – the difficult requirements and high technicalperformance risk did not match the development approach of a single iterationinitially focused on affordability.
In summary, two patterns were observed in developing requirements with varyingoutcomes in balancing performance and cost that correlate well with the Model 1and Model 2 development methodologies. When the program values performance,has low knowledge regarding achievable performance and cost drivers, therequirements tend to favor performance over cost-performance value. When theprogram values affordability, has high knowledge regarding achievable performanceand cost drivers, the requirements tend to strike a better balance betweenperformance and cost. The Model 2 dynamic can be viewed as a subset of theModel 1 dynamic entering at a more mature stage by leveraging prior knowledge,technology and capability to reduce performance uncertainty and increase costdriver knowledge. Programs that match the requirements and developmentapproach tend to be successful. Programs that mismatch the requirements anddevelopment approach tend to be unsuccessful. The mismatched case is typicallydeveloping a system to meet Model 1 requirements with a Model 2 developmentapproach and leads to a low probability of success program.
_____________________________________________________________________________________
93
4.5 Lifecycle Cost as a Design Requirement
Traditionally in the defense industry, lifecycle cost has been considered amanagement or manufacturing requirement and not a design requirement. Thereare natural reasons for this. Development cost is considered a managementrequirement so why shouldn’t lifecycle cost? The majority of lifecycle cost on atypical avionics program is spent in manufacturing – both in production and repairsand spares during operations and support. If manufacturing spends the majority oflifecycle cost, why shouldn’t lifecycle cost be a manufacturing requirement?Lifecycle cost is inherently cross-functional with the outcome influenced by design,manufacturing and management. The prevalent argument for making lifecycle costa design requirement is that the system design has the most influence on theoutcome. Design has more influence than management practices or manufacturingefficiency. The case studies observed offer other reasons that suggest why lifecyclecost should be considered a design requirement.
When lifecycle cost is considered a manufacturing requirement, Design to UnitProduction Cost (DTUPC) dominates the consideration of affordability during thedevelopment program. Operations and Support costs tend to take a lower prioritybecause they are owned by a separate organization. The manufacturingorganization does not design the system so the DTUPC effort tends to becomedecoupled from the design process. The manufacturing group generating DTUPCreports begins by working closing with the design organization to create a costbaseline. From this starting point, the estimating efforts tend to become decoupledfrom the design efforts. The group generating estimates is incentivized to showcontinuous improvement so the estimates get lower over time. If these estimates arenot driving and constraining the design efforts, the design itself tends to increase incost over time as design complexity is added as the team better understands thetechnical requirements and adds features to reduce risk of meeting thoserequirements. This leads to cost estimates decreasing over time while the real cost isincreasing over time. This can lead to large gaps between the cost estimate and theactual cost on long development programs. It is not uncommon for estimates todiverge from real costs by 2x during a development program.
For this dynamic to occur, three things must happen. Manufacturing must own thelifecycle cost requirement, there must be a strong boundary between design andmanufacturing and there must be high uncertainty in the cost estimating tools early inthe design process. The uncertainty in the cost estimating tools is an important factor.If there isn’t uncertainty in the cost estimating tools, this dynamic wouldn’t occur – thecost estimating group can only credibly show decreasing cost estimates in the face ofincreasing real costs if there is real uncertainty in the cost estimating tools.
This dynamics was observed in Program 1. Design was considered a manufacturingrequirement, there was a strong organizational boundary between design andmanufacturing (this was the first large program at the company to use IPT’s) and thetechnology was so new that there was a lot of uncertainty in the cost estimating toolsearly in the design. DTUPC reports were generated and submitted quarterly to thecustomer but several lead systems and hardware engineers indicated they were not
_____________________________________________________________________________________
94
aware these reports were even generated. This indicates decoupling between theDTUPC activity and the design activity. The DTUPC showed continuous improvementwhile the design added complexity over time leaving a gap between the estimateand the cost when the design entered LRIP.
When lifecycle cost is considered a management requirement, programs tend todevelop relatively high risk, relatively low cost system concepts in order to win thedevelopment contract. Certain key affordability enablers of the system architectureare marketed heavily during the acquisition process as discriminators. These featuresof the architecture tend to become assumptions of the program team not subject tothe same engineering scrutiny and risk reduction activities as other system designfeatures. Examples of this were observed in the Program 4 “super MMIC” and inProgram 5. This dynamic can lead to relatively high risk system design features withoutthe appropriate level of risk reduction activities and planned design iterations to growthe system performance. This can lead to significant system failures in early systemtesting. The fate of the program then rests on its staying power and the patience ofthe customer because the program will experience budget and schedule overruns.
Solid arguments exist to treat lifecycle cost like a design requirement. A systemengineering approach is recommended. Determine a set of system lifecycle costrequirements. Typically this is a Unit Production Cost to cover production aspects oflifecycle costs. Operations and Support Cost can be a requirement or the major costdrivers within the control of the avionics supplier can be requirements – Mean TimeBetween Failure (MTBF), Mean Time To Remove (MTTR), % fault detection and isolationand replacement cost. Decompose these system requirements and allocate to all ofthe modules within the system. Once the system level requirements are allocated tomodules, they should be documented in engineering requirements documentation –typically the module specification. Methods should be standardized and agreedupon for assessing compliance to the affordability requirements as the design maturesthrough design review gates and for verifying the module is compliant to theaffordability requirements at the completion of the design. Assessing compliance asthe design matures is through analysis. Assessing compliance when the design iscomplete is through combination of test and analysis. Production cost and MTBFtypically experience a “learning curve” effect where costs decrease with productionquantity and MTBF increases with quantity. The cost and reliability of developmentunits can be measured and requirements compliance projected using historical“production learning curves” or “reliability growth curves”. This is a classic systemengineering approach to managing a design requirement. This only difference is thatthe design compliance cannot be measured without uncertainty at the completionof the design (like weight can) because learning curves or growth curves are requiredto project compliance from measured data available at the completion of design.
There are cultural and pragmatic issues associated with treating lifecycle cost as adesign requirement instead of a manufacturing or management requirement. Inmany avionics firms this is a change and any change will experience resistance.There is often a cultural phenomenon that “engineers don’t do cost” that is typicallyraised as the first barrier to treating lifecycle cost as a design requirement. Program 2,Program 7 and Program 3 Cost Reduction Program all treated cost as a design
_____________________________________________________________________________________
95
requirement so it can’t be true that “engineers don’t do cost”. Engineers solveengineering problems. If the problem to be solved is to design a system that meetsthese performance requirements, that is what engineers will try to do. If the problemto be solved is to design a system that meets these performance requirements at thiscost, that is what engineers will try to do. Making the engineering problem include acost element required the program’s management and customer to continue tohighlight that cost was important. Lifecycle cost was reviewed at the managementand customer level. Decisions were made regarding requirements and designapproaches based on cost considerations. The team talked about it and reviewed itpublicly. When affordability is not a priority on the program, meaning it does notimpact customer and management decisions, the engineering community will notperceive that it is part of the problem to be solved and will generally ignore lifecyclecost.
In addition to these cultural barriers, there are pragmatic barriers. Engineeringprocesses need to change. Affordability needs to become integrated intoengineering plans and processes. It needs to be required in design trade studies inorder to develop the knowledge of cost-performance tradeoffs necessary fordecision making. Cost needs to be put into design requirements specifications as apragmatic and symbolic gesture that it is indeed a design requirement. These areminor barriers that can be overcome by simply deciding to overcome them. Themore significant barriers exist in the tools and methods to assess compliance toaffordability goals during the design process and verifying compliance when thedesign is complete. The cost estimating tools that provide engineering insight aregenerally underdeveloped.
Traditionally manufacturing cost estimating tools required a parts list and drawing toestimate cost and could take a long time to develop a cost estimate. Program 1required six months to update the system’s cost estimate. The lead time was far toolong to provide design insight because by the time the estimate came out the designhad matured by six months and the estimate was not very relevant. The entry criteriafor the analysis required parts lists and drawings – this means the design is practicallycomplete and the ability to influence the design is almost exhausted. There is a greatneed for advances in credible, timely cost estimating tools that provide accurateestimates and engineering insight at the early stages of design – long before parts listsand drawings are generated.
The most effective method observed was parametric models based on cost history ofsimilar products. This method was employed on Program 2 and Program 7. Theinadequacy of cost estimating tools for programs in early stages of design highlightsanother reason why many programs pursue a Model 1 development approach – itsimply isn’t possible to create credible cost estimate information that provides realengineering insight before you’ve completed the first iteration and built prototypes.
In summary, there are compelling reasons to treat lifecycle cost like a designrequirement. The system design determines as much as 80% of the system’s lifecyclecost. Manufacturing and management ownership has led to undesirable dynamics.The cultural barrier that “engineers don’t do cost” can be overcome by framing the
_____________________________________________________________________________________
96
engineering problem to include a cost component. Framing the problem to includecost requires frequent reviews and customer and management decisions based oncost considerations. The more difficult barrier is pragmatic – cost estimating tools thatprovide timely, credible estimates and engineering insight at early stages of thedesign are underdeveloped. Without engineering insight when there is engineeringleverage, treating cost as a design requirement is not possible. The most effectivecost estimating method observed was parametric models based on cost history fromsimilar products.
_____________________________________________________________________________________
97
4.6 Integrating Downstream Knowledge
Significant research has been conducted highlighting the advantages of integratingdownstream knowledge into the design process. This comes in the form of hardwareand software engineers in the system level design process or involving suppliers andmanufacturers in the hardware design process. This approach had becomeinstitutionalized in IPT organizations and Concurrent Engineering or Integrated Productand Process Development (IPPD) processes. The goal is to concurrently developproduct and process in order to improve the quality of both. The benefits ofeffectively integrating downstream knowledge into the design include moreaffordable and more manufacturable designs transitioned more smoothly toproduction. The idea of integrating downstream knowledge into the design has beenat the forefront of product development organizations for over two decades. Duringthis time, firms have greatly increased their ability to develop more affordable andmore producible designs. The case studies investigated offer some insights into howfirms can make further improvements.
The IPT organization is critical to effectively integrating downstream knowledge in thedesign because it creates the presence of downstream knowledge. The presence ofthis knowledge is the starting point for effectively using it. The program’s underlyingdynamics shaped by the development methodology pursued and the role ofperformance requirements have significant impacts on how effective teams are atusing this downstream knowledge. Model 1 development programs with over-constrained requirements were less successful at integrating downstream knowledgethan Model 2 development programs with requirements that struck a balancebetween cost and performance. Performance focused programs were less successfulat integrating downstream knowledge than affordability focused programs.Programs that considered lifecycle cost a design requirement were more effective atintegrating downstream knowledge than programs that considered lifecycle cost amanufacturing or management requirement.
In a Model 2 program, the top priority is affordability. The program is leveraging priorknowledge, technology and capability which changes key variables in a program:
− Knowledge of achievable performance is relatively high− Knowledge of cost driving requirements is relatively high− Cost is considered a design requirement− Relevant downstream knowledge exists from prior programs
The first two variables have been discussed at length. The last two will be discussedhere for their relevance in integrating downstream knowledge. Paul Carlile and EricRebentisch34 suggest a model for increasing the effectiveness of knowledgeintegration across organizational or functional boundaries. This model suggests thateffectiveness can be increased if the collaborating groups have three things:
− Mutual dependence− A common, clear goal− A mutually accepted method for assessing progress towards the goal
_____________________________________________________________________________________
98
If cost is considered a design requirement, there is a clear goal. The designcommunity depends upon manufacturing knowledge to assess compliance againstthe cost requirement and for ideas to improve the design’s cost. Cost estimating toolsbecome the mutually accepted method for assessing progress towards the goal. Thispoints again to the importance of improvements in cost estimating tools that arecredible to the design and manufacturing stakeholders at early phases of the design.
A typical Model 2 program leverages prior knowledge, technology and capability.This means the organization has done something like this before and thereforerelevant downstream knowledge exists. On systems that are very different from theorganization’s prior experiences, relevant downstream knowledge may not exist.
In cases with these conditions, the underlying dynamics of the program are biasedtowards affordability. Downstream knowledge tends to be affordability focused so itis easier to integrate downstream knowledge because doing so supports theprogram’s underlying dynamics. Program 2, the Program 3 Cost Reduction Programand Program 7 are examples where integration of downstream knowledge supportedaffordability focused programs and led to more affordable product designs.
If the program is performance focused and may not be leveraging significant priorknowledge, technology and capability, the key variables are reversed:
− Knowledge of achievable performance is relatively low− Knowledge of cost driving requirements is relatively low− Cost is considered a manufacturing or design requirement− Relevant downstream knowledge may not exist from prior programs
In these cases, the program is performance focused. Integrating downstreamknowledge is more difficult because it clashes with the program’s underlyingdynamics. This does not mean that integrating the downstream knowledge isineffective, just less effective. In these cases, the design is changed to improveproducibility under two conditions. One, if the design is physically impossible tomanufacture. The second condition is when the producibility improvement does notconflict with other performance or programmatic requirements. In other words, whenimproving the design’s producibility does not cause a requirement non-compliance orrequire more schedule or budget than planned.
_____________________________________________________________________________________
99
5 Summary
In closing, four key variables were investigated by identifying repeating patterns in theseven case studies researched.
− Nature of development focus during design iterations− Role of requirements− Managing cost like a design requirement− Effectively integrating downstream knowledge into the design
Two program aspects crossed into each of these four variables. Selecting anaffordability focus and leveraging prior knowledge, technology and capabilityimproved program’s abilities to deliver more affordable systems. Conversely,selecting a performance focus and embarking into new technical territory inhibitedprogram’s abilities to deliver more affordable systems.
Choosing to be affordability focused is a relatively straightforward starting point forimproving system affordability. Leveraging prior knowledge, technology andcapability is critical for several reasons. It offers the potential to lower thedevelopment risk below a threshold where explicitly focusing on affordability first andusing design iterations to grow performance can be pursued without unacceptablerisk levels. It increases the knowledge of cost drivers and achievable performance,which are critical factors in establishing system requirements that strike a balancebetween cost and performance. It creates more relevant downstream knowledge,which can be a powerful source of ideas leading to innovations.
Recommendations for future research include increasing the effectiveness ofleveraging prior knowledge, technology and capability in developing moreaffordable systems. Specifically, research aimed at improvements in understandingachievable system performance and cost drivers during the requirements and systemarchitecture phase. System performance modeling, system cost modeling andknowledge management techniques would all be valuable. Future research inincreasing the effectiveness of downstream manufacturing and supplier knowledgeinto the design process would be beneficial. Techniques to quantify producibility tobe able to answer the question, how producible is producible enough could offersignificant improvements by giving more engineering teeth to producibility during thedesign process.
This thesis focused on affordability from the perspective of a Tier 1 avionics supplier butthere are a series of takeaways applicable to the defense prime contractors andgovernment acquisition community that will serve as closing statements.
System performance requirements play a critical role in system affordability. Theyshape the program’s technical performance risk, which impacts the systemarchitecture and development approach. Demand that your suppliers push back onrequirements with cost-performance trade studies and seek the “knee of the curve”between cost and performance.
_____________________________________________________________________________________
100
Be careful about mismatched programs – meaning high-risk performancerequirements (Model 1) and affordability focused (Model 2) and/or single iterationdevelopment approaches. If a mismatched program cannot be avoided,understand that this is a low probability of success path that warrants a fallbackstrategy.
The culture or focus of the development team plays a major role in affordability and islargely shaped by the contract’s business model and the customer’s culture andfocus. If the customer uses traditional business models and reinforces performance asthe priority, suppliers will be performance focused. Remember that traditionalbusiness models incentivize unaffordable behavior because lower costs lead directlyto lower sales and profits. If the customer structures a business model that financiallyrewards affordability and reinforces affordability as the priority, suppliers will beaffordability focused. Long term, fixed price production contracts are effectivebusiness models in production programs because the supplier keeps cost reductions inthe current long term contract. Award fee programs with explicit financial rewardsbased on evidence of affordability can be effective business models for developmentprograms.
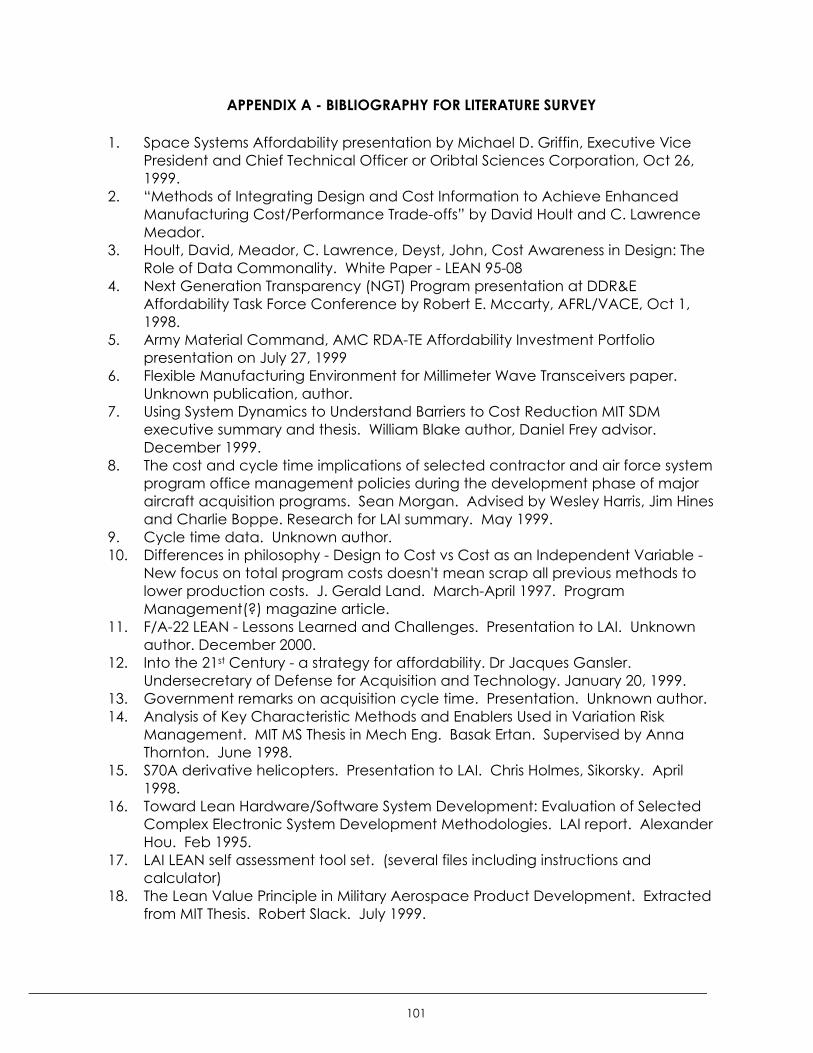
_____________________________________________________________________________________
101
APPENDIX A - BIBLIOGRAPHY FOR LITERATURE SURVEY
1. Space Systems Affordability presentation by Michael D. Griffin, Executive VicePresident and Chief Technical Officer or Oribtal Sciences Corporation, Oct 26,1999.
2. “Methods of Integrating Design and Cost Information to Achieve EnhancedManufacturing Cost/Performance Trade-offs” by David Hoult and C. LawrenceMeador.
3. Hoult, David, Meador, C. Lawrence, Deyst, John, Cost Awareness in Design: TheRole of Data Commonality. White Paper - LEAN 95-08
4. Next Generation Transparency (NGT) Program presentation at DDR&EAffordability Task Force Conference by Robert E. Mccarty, AFRL/VACE, Oct 1,1998.
5. Army Material Command, AMC RDA-TE Affordability Investment Portfoliopresentation on July 27, 1999
6. Flexible Manufacturing Environment for Millimeter Wave Transceivers paper.Unknown publication, author.
7. Using System Dynamics to Understand Barriers to Cost Reduction MIT SDMexecutive summary and thesis. William Blake author, Daniel Frey advisor.December 1999.
8. The cost and cycle time implications of selected contractor and air force systemprogram office management policies during the development phase of majoraircraft acquisition programs. Sean Morgan. Advised by Wesley Harris, Jim Hinesand Charlie Boppe. Research for LAI summary. May 1999.
9. Cycle time data. Unknown author.10. Differences in philosophy - Design to Cost vs Cost as an Independent Variable -
New focus on total program costs doesn't mean scrap all previous methods tolower production costs. J. Gerald Land. March-April 1997. ProgramManagement(?) magazine article.
11. F/A-22 LEAN - Lessons Learned and Challenges. Presentation to LAI. Unknownauthor. December 2000.
12. Into the 21st Century - a strategy for affordability. Dr Jacques Gansler.Undersecretary of Defense for Acquisition and Technology. January 20, 1999.
13. Government remarks on acquisition cycle time. Presentation. Unknown author.14. Analysis of Key Characteristic Methods and Enablers Used in Variation Risk
Management. MIT MS Thesis in Mech Eng. Basak Ertan. Supervised by AnnaThornton. June 1998.
15. S70A derivative helicopters. Presentation to LAI. Chris Holmes, Sikorsky. April1998.
16. Toward Lean Hardware/Software System Development: Evaluation of SelectedComplex Electronic System Development Methodologies. LAI report. AlexanderHou. Feb 1995.
17. LAI LEAN self assessment tool set. (several files including instructions andcalculator)
18. The Lean Value Principle in Military Aerospace Product Development. Extractedfrom MIT Thesis. Robert Slack. July 1999.
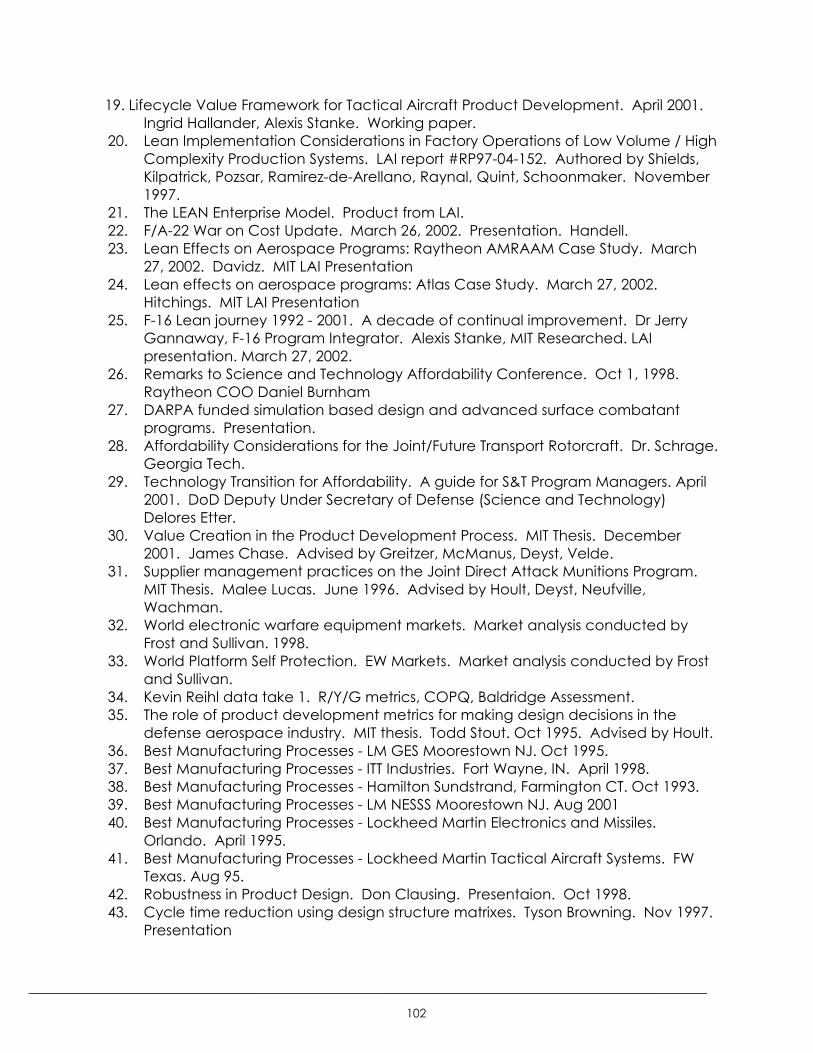
_____________________________________________________________________________________
102
19. Lifecycle Value Framework for Tactical Aircraft Product Development. April 2001.Ingrid Hallander, Alexis Stanke. Working paper.
20. Lean Implementation Considerations in Factory Operations of Low Volume / HighComplexity Production Systems. LAI report #RP97-04-152. Authored by Shields,Kilpatrick, Pozsar, Ramirez-de-Arellano, Raynal, Quint, Schoonmaker. November1997.
21. The LEAN Enterprise Model. Product from LAI.22. F/A-22 War on Cost Update. March 26, 2002. Presentation. Handell.23. Lean Effects on Aerospace Programs: Raytheon AMRAAM Case Study. March
27, 2002. Davidz. MIT LAI Presentation24. Lean effects on aerospace programs: Atlas Case Study. March 27, 2002.
Hitchings. MIT LAI Presentation25. F-16 Lean journey 1992 - 2001. A decade of continual improvement. Dr Jerry
Gannaway, F-16 Program Integrator. Alexis Stanke, MIT Researched. LAIpresentation. March 27, 2002.
26. Remarks to Science and Technology Affordability Conference. Oct 1, 1998.Raytheon COO Daniel Burnham
27. DARPA funded simulation based design and advanced surface combatantprograms. Presentation.
28. Affordability Considerations for the Joint/Future Transport Rotorcraft. Dr. Schrage.Georgia Tech.
29. Technology Transition for Affordability. A guide for S&T Program Managers. April2001. DoD Deputy Under Secretary of Defense (Science and Technology)Delores Etter.
30. Value Creation in the Product Development Process. MIT Thesis. December2001. James Chase. Advised by Greitzer, McManus, Deyst, Velde.
31. Supplier management practices on the Joint Direct Attack Munitions Program.MIT Thesis. Malee Lucas. June 1996. Advised by Hoult, Deyst, Neufville,Wachman.
32. World electronic warfare equipment markets. Market analysis conducted byFrost and Sullivan. 1998.
33. World Platform Self Protection. EW Markets. Market analysis conducted by Frostand Sullivan.
34. Kevin Reihl data take 1. R/Y/G metrics, COPQ, Baldridge Assessment.35. The role of product development metrics for making design decisions in the
defense aerospace industry. MIT thesis. Todd Stout. Oct 1995. Advised by Hoult.36. Best Manufacturing Processes - LM GES Moorestown NJ. Oct 1995.37. Best Manufacturing Processes - ITT Industries. Fort Wayne, IN. April 1998.38. Best Manufacturing Processes - Hamilton Sundstrand, Farmington CT. Oct 1993.39. Best Manufacturing Processes - LM NESSS Moorestown NJ. Aug 200140. Best Manufacturing Processes - Lockheed Martin Electronics and Missiles.
Orlando. April 1995.41. Best Manufacturing Processes - Lockheed Martin Tactical Aircraft Systems. FW
Texas. Aug 95.42. Robustness in Product Design. Don Clausing. Presentaion. Oct 1998.43. Cycle time reduction using design structure matrixes. Tyson Browning. Nov 1997.
Presentation
_____________________________________________________________________________________
103
44. Product Development Team. Prod Development Schedule reduction. John Deyst.Nov 1997
45. Toyota, Termites and Zero Risk System Development. Allen Ward. Presentation.Nov 1997.
46. Product development team effectiveness. Oct 95. Gerald Susman. LAI whitepaper.
47. Managing subsystem commonality. Eric Rebentisch. April 2001.48. JSF presentation. Burbage49. EELV Case Study Lean Implementation. Col Robert Saxer. Dec 00.50. JDAM Lean lessons learned.51. Darlene Druyun keynote speech to LAI. Dec 2001.52. BAE SYSTEMS COPQ "Why do programs go red? How do they return to green?"53. Avionics Life Cycle Forcasting Model. Stephen Czerwonka. June 2000. Advised
by Rosenfield, Deyst, Hagwood.54. JSF - Collaborative Design for Affordability. Mike Fortson, Mar 26, 2002.
Presentation to LAI.55. Value Creation through Integration. Fostering innovation across aerospace
supplier networks. Presentation to LAI. Aaron Kirtley. Jan 2002.56. Case study of LEAN implementation - F-18 E/F. Presentation.57. JSF Manufacturing System Design highlights. Presentation.58. New directions in the aeronautical industry. Allen Haggerty. VP/GM (retired)
military aircraft and missile systems, Boeing. April 2001. Presentation.59. Value creation in the product development process. Jim Chase. Presentation
based on his thesis. Jan 2002.60. F/A-22 research on developing a "Product Delivery System" or manufacturing
system. Steve Hendricks. Presentation61. Manufacturing System Design. Shields. Presentation62. New applications for technical performance measurement in program risk
mitigation. Unknown author or date63. 3D Concurrent Engineering - Clockspeed based principles for product, process
and supply chain development. Charles Fine. May 1998. Presentation and Jan2001 presentation.
64. Doing The right things. John Horton. Lockheed Martin. Presentation.65. Fostering innovation across aerospace supplier networks. Aaron Kirtley. MIT
thesis. Advised by Kirk Bozdogan. June 2002.66. Organizing for Product Development. Thomas Allen. Dec 2001.67. Product Realization in the Defense Aerospace Industry. March 27, 2002. Mandy
Vaughn, 2nd LT, USAF. LAI presentation68. Framework for achieving best lifecycle value. Alexis Stanke. April 11, 2001
presentation69. Modeling and Analyzing Cost, Schedule, and Performance in complex system
product development. MIT Doctoral Thesis. Tyson Browning. Dec 1998. Advisedby Eppinger, Deyst, Whitney.
70. Best practices in user needs / requirements generation. Joe Wirthlin. MIT SDMThesis. Advised by Rebentisch. Jan 2000.
71. The effective use of process capability databases for design. Thesis MIT. MelissaTate. Jun 1999. Advised by Anna Thorton.

_____________________________________________________________________________________
104
72. Challenges in the better, faster, cheaper era of aeronautical design, engineeringand manufacturing. White paper. Murman, Walton, Rebentisch. Sept 2000.
73. Lean Aerospace Initiative Implementation Workshop; implementing crossfunctional teams in an IPPD environment. Joel Gershenfeld. 1998.
74. A partitioning method for helicopter avionics systems with a focus on life cyclecost. Leon Silva. MIT SDM thesis. Jan 01. Rebentisch advisor.
75. A framework for achieving best lifecycle value in product development. AlexisStanke. MIT Thesis. June 01. Advised by Murman.
_____________________________________________________________________________________
105
APPENDIX B - KEY POINTS SUMMARIZED FOR LITERATURE SURVEY
1. Space Systems Affordability presentation by Michael D. Griffin, Executive VicePresident and Chief Technical Officer or Oribtal Sciences Corporation, Oct 26, 1999.• Keys to Affordability
• Demanding External/Internal Cost/Schedule Constraints• You can’t spend money you don’t have• Time is money• Lean approach can be overdone – need to incorporate some margin
• Flat Organization• One or, at most two steps between major projects and the corporate
COO• Small, self-contained, capable project teams
• Favors tight decision loops and cohesive execution• Control of technology insertion
• New technology can clearly enable a paradigm shift in what is possiblebut should be used only when absolutely required with fallbacks if possible
• Can’t afford “science projects” on cost/schedule constrained projects• Commercial practices/systems/parts where appropriate
• COTS software/hardware whenever possible• Requirements challenged at all levels
• Top-level as well as derived• Farther down the design process than usual
• Use of simple vs complex objectives• Quantitative objectives: ideally a single (scalar) performance function vs
multivariate (weighted) performance metric• Qualitative goals: sharply defined specific vs generic goals
• Architecture• International space station vs skylab
• Stable customer requirements2. “Methods of Integrating Design and Cost Information to Achieve Enhanced
Manufacturing Cost/Performance Trade-offs” by David Hoult and C. LawrenceMeador.• “The Design/Cost Trades Task is typically time-constrained. This arises because in
the development of complex products the IPPD team makes a design decisionand immediately begins to realize its consequences. If the cost impact of thedesign decisions are not known immediately, costly rework arises when theconsequences of the design decision must be cost-corrected. Thus, it happensthat one of the metrics for Database Commonality is the time to roll-up costestimates for the product. In the U.S. Aerospace industry, typical roll-up timeswere months [1], but the best in class rolled up costs daily. In the applianceindustry, one leading firm has cost roll-up times measured in minutes instead ofhours. In a Wall Street Journal article in 1995, a Chrysler representative wasquoted as saying that cost roll up time of 24 hours was too slow.
• [1] “Cost Awareness in Design: The Role of Data Commonality” by David Houltand C. Lawrence Meador, Dennis Maresi and John Deyst. Presented at SAE#95MJA413 SAE International Congress and Exposition Feb 1996.
_____________________________________________________________________________________
106
3. Hoult, David, Meador, C. Lawrence, Deyst, John, Cost Awareness in Design: TheRole of Data Commonality. White Paper - LEAN 95-08
• 80% of product cost is committed by PDR
• We have found no measurable differences between different sectors of theaerospace business (I.e. airframes, engines, avionics, etc) with regards to howthey deal with cost in design.
• Only 30% of aerospace companies have commonality between design and costdatabases (not common is defined as being in a different place and not readilyaccessible by designers)
• Data indicates that with database commonality, cost-performance trades occurearlier in the process (some pretty good graphs on this) and more communicationbetween design and manufacturing groups exists
4. Next Generation Transparency (NGT) Program presentation at DDR&E AffordabilityTask Force Conference by Robert E. Mccarty, AFRL/VACE, Oct 1, 1998.• Success story of developing lower cost manufacturing process and design for
tactical fighter cockpit canopy• Save $100M, to be used on F-16, F/A-22, JSF.
5. Army Material Command, AMC RDA-TE Affordability Investment Portfoliopresentation on July 27, 1999• Utilize RDT&E government investments – Manufacturing Technology (MANTECH),
Reliability, Maintainability and Supportability (RM&S) and CommercialOperations and Support Savings Initiative (COSSI)
• Longbow Example. 5 yr 9.25M, Objective: develop integrated product andproess deveopment to reduce the manufacturing costs of MMW transceivers inthe 35-95 GHz frequency range. Examples – laser welding replaces solder, autodie attach/wire bonding, auto test/tune. Realized 30% cost reduction - $3,350per missile for 11,900 missiles. Total savings $40M.
6. Flexible Manufacturing Environment for Millimeter Wave Transceivers paper.Unknown publication, author.• Longbow example. May 1995 – Sept 2001. $40M savings to Army. 80% reduction
in touch labor, 50% reduction in manual tune and test times. Also claims todemonstrate the IPPD process and claims benefits to PAC-3, F/A-22 at LockheedSanders.
7. Using System Dynamics to Understand Barriers to Cost Reduction MIT SDM executivesummary and thesis. William Blake author, Daniel Frey advisor. December 1999.− Focus on "what skews the product development process towards performance?
And how can the product development process be changed to focus onacquisition costs?'
− Architecture of product development process (mechanisms, functional roles,organizational boundaries) inherently causes misalignment process and productgoals.
− Focuses on including manufacturability in design decisions. Barrier identified that80% of manufacturing is outsourced so company boundaries stand betweendesigner and knowledge of manufacturability.
− System dynamics indicates 2 primary negative loops that impede costreductions; (1) rework loop - time constraints causes designers to skip 'optional'
_____________________________________________________________________________________
107
tasks like IPT meetings, DFM/DTC tasks and (2) productivity loop - designers notknowledgeable about cost.
− Policy (to fix problem) should have following characteristics: (1) product andprocess goals must be aligned, (2) simplicity relative to existing process and (3)easy to learn.− Benchmarking: related and unrelated industries. Rule based design and
standard parts lists.− IPT phase gate process. Cross functional signoff required at phase gates or
design reviews.− Increased supplier involvement in the design. Allow designers to talk directly
with suppliers. Streamline red tape to involve suppliers.− Invest in design phase of product development process. Streamline the
process to free up designer's time to perform DFM/DTC/IPT tasks.− Pilot project with primary or major goal 'knowledge gained'
− Traditional product development has emphasized schedule and performance.Realignment to include cost requires significant retooling of the process, training,incentives, etc.
− Interesting reference to Repenning work "Why good processes sometimesproduce bad results: a formal model of self reinforcing dynamics in productdevelopment."
− Focus on three primary issues: (1) building knowledge, (2) communicatingknowledge and (3) alleviating time pressues.− Building knowledge: benchmarking, employee rotation, outside review of
the design process, rule based design, standard parts list− Communicating knowledge; involved suppliers in designers performance
evaluations, phase gate system requiring supplier approval before moving tonext level, take advantage of technology in communication practices,remove barriers between designers and suppliers
− Alleviating time pressures: increase design staff size, (cost of design staffadditions is very small to cost benefits in production cost)
8. The cost and cycle time implications of selected contractor and air force systemprogram office management policies during the development phase of majoraircraft acquisition programs. Sean Morgan. Advised by Wesley Harris, Jim Hinesand Charlie Boppe. Research for LAI summary. May 1999.− High degree of interdependence between SPO and contractor program offices− Key policies in staffing, management reserve, process quality− "Several basic project management insights are found to underlie many SPO-
contractor system behaviors including that: quality drives the level of reworkexperienced by a program, workforce capability is a prime contributor to projectquality, and proper management of the workforce is critical for optimal programcost and schedule performance. Explorations of SPO-contractor systembehaviors imply a link between a focus on schedule adherence and increasedprogram cost and schedule slip, and they advise that … control of contractorand SPO workforce turnover, and that including realistic assessments of qualityand productivity in early cost estimates are critical for their accuracy."
− Good figure on boundaries, influences on SPO from warfighter, congress,pentagon, etc.
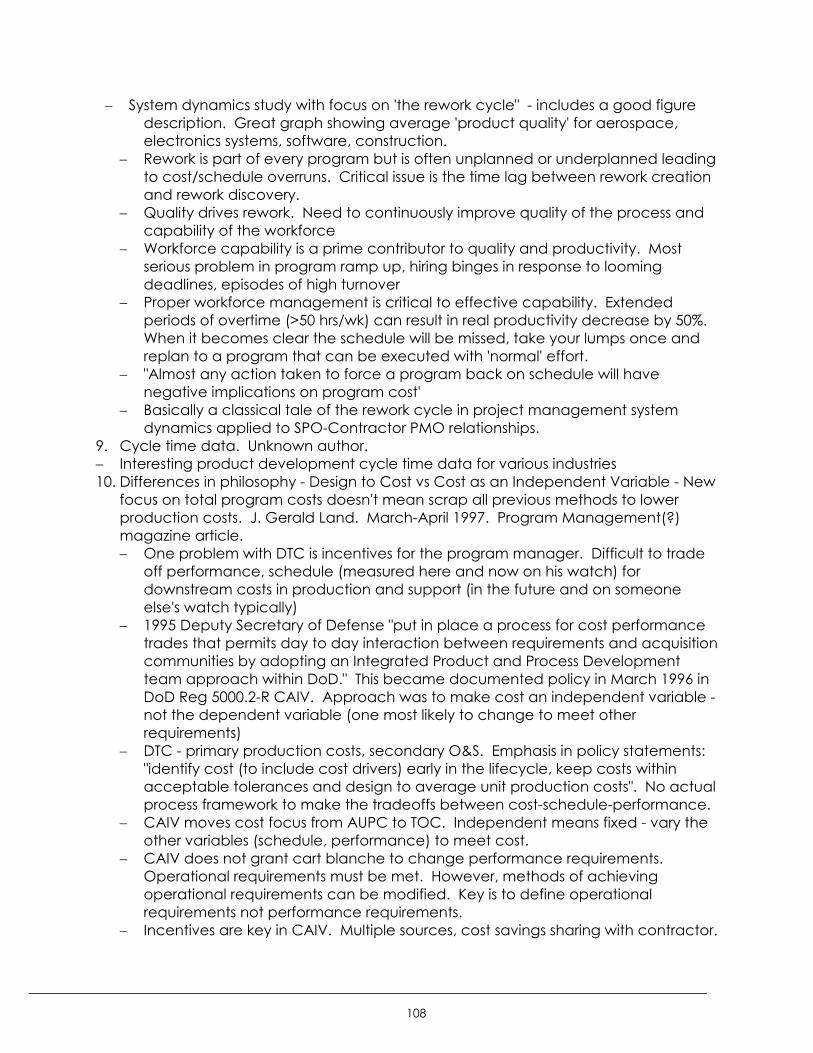
_____________________________________________________________________________________
108
− System dynamics study with focus on 'the rework cycle" - includes a good figuredescription. Great graph showing average 'product quality' for aerospace,electronics systems, software, construction.
− Rework is part of every program but is often unplanned or underplanned leadingto cost/schedule overruns. Critical issue is the time lag between rework creationand rework discovery.
− Quality drives rework. Need to continuously improve quality of the process andcapability of the workforce
− Workforce capability is a prime contributor to quality and productivity. Mostserious problem in program ramp up, hiring binges in response to loomingdeadlines, episodes of high turnover
− Proper workforce management is critical to effective capability. Extendedperiods of overtime (>50 hrs/wk) can result in real productivity decrease by 50%.When it becomes clear the schedule will be missed, take your lumps once andreplan to a program that can be executed with 'normal' effort.
− "Almost any action taken to force a program back on schedule will havenegative implications on program cost'
− Basically a classical tale of the rework cycle in project management systemdynamics applied to SPO-Contractor PMO relationships.
9. Cycle time data. Unknown author.− Interesting product development cycle time data for various industries10. Differences in philosophy - Design to Cost vs Cost as an Independent Variable - New
focus on total program costs doesn't mean scrap all previous methods to lowerproduction costs. J. Gerald Land. March-April 1997. Program Management(?)magazine article.− One problem with DTC is incentives for the program manager. Difficult to trade
off performance, schedule (measured here and now on his watch) fordownstream costs in production and support (in the future and on someoneelse's watch typically)
− 1995 Deputy Secretary of Defense "put in place a process for cost performancetrades that permits day to day interaction between requirements and acquisitioncommunities by adopting an Integrated Product and Process Developmentteam approach within DoD." This became documented policy in March 1996 inDoD Reg 5000.2-R CAIV. Approach was to make cost an independent variable -not the dependent variable (one most likely to change to meet otherrequirements)
− DTC - primary production costs, secondary O&S. Emphasis in policy statements:"identify cost (to include cost drivers) early in the lifecycle, keep costs withinacceptable tolerances and design to average unit production costs". No actualprocess framework to make the tradeoffs between cost-schedule-performance.
− CAIV moves cost focus from AUPC to TOC. Independent means fixed - vary theother variables (schedule, performance) to meet cost.
− CAIV does not grant cart blanche to change performance requirements.Operational requirements must be met. However, methods of achievingoperational requirements can be modified. Key is to define operationalrequirements not performance requirements.
− Incentives are key in CAIV. Multiple sources, cost savings sharing with contractor.
_____________________________________________________________________________________
109
11. F/A-22 LEAN - Lessons Learned and Challenges. Presentation to LAI. Unknownauthor. December 2000.− Good chart on affordability management process in a cost take out phase− Shows (I think) as of Sept 00, savings projected at $21B broken out in the following
categories: multi year buy, JSF rates, product support, performance basedcontracts, material effeciencies, lean enterprise, DMS, PIPs. Shown for A/C andengine separately.
− Best results on the shop floor but some results above the shop floor.− Key barrier - perception that purpose of LEAN is to eliminate jobs− Sanders EW Array Kaizen factory flow before and afters on a chart.− Good lessons learned and challenges from Sanders, TRW, Northrup Grummon
12. Into the 21st Century - a strategy for affordability. Dr Jacques Gansler.Undersecretary of Defense for Acquisition and Technology. January 20, 1999.− Chartered Defense Systems Affordability Council (DSAC) to guide
implementation of "better faster cheaper"− Three goals
− Field high quality defense products quickly; support them responsively− 50% reduction systems acquisition cycle time− Logistics response time from 36 days (current) to 18 days by 2000 and 5
days by 2005− Reduce repair cycle times by 10% (2000) and by 25% (2001) from 1997
baseline− Lower the total ownership cost of defense products
− For systems in acquisition, surpass or achieve aggressive "CAIV" unit costsand TOC targets (which are 20-50% lower than historical averages) for atleast 50% of programs by 2000.
− For fielded systems, reduce logistics costs by 7% (2000), 10% (2001), 20%(2005) against 1997 baseline.
− Move from cost based to price based acquisition process− Reduce the overhead costs of the acquisition and logistics infrastructure
13. Government remarks on acquisition cycle time. Presentation. Unknown author.− Interesting data on cycle time and cost for acquisition− Avg cost growth = 1.15 (<7 years), 1.32 (7-13 years), 1.42 (>14 years)− "We believe it is possible to cut this cycle in half"− Avg schedule slip = 22%− Avg cycle time by service shows air force programs most significant increase
from 60 (early 70's) to 120 today14. Analysis of Key Characteristic Methods and Enablers Used in Variation Risk
Management. MIT MS Thesis in Mech Eng. Basak Ertan. Supervised by AnnaThornton. June 1998.− Variation Risk Management (basically same as VMM) discusses top down
flowdown of Key Characteristics for system performance and bottoms up flowupof Key Characteristics for cost drivers
− Proper KC identification critical. Requires robust development and reviewprocess. Yield calculations critical to assess design robustness.
− KC identification, control, management in production is common. Linking tohigh level product performance goals not.
− Heavyweight project teams best suited for KC / VRM
_____________________________________________________________________________________
110
− Basically describes a Key Characteristic Maturity Model as a means to assesscompanies' success/maturity in implementing KC/VRM
15. S70A derivative helicopters. Presentation to LAI. Chris Holmes, Sikorsky. April 1998.− System architecture comments and issues with adapting S70A basic architecture
for new military and commercial demands− Formed "Development Operations Teams" to oversee/coordinate functional
organizations to look at the architecture and not just better subassemblies16. Toward Lean Hardware/Software System Development: Evaluation of Selected
Complex Electronic System Development Methodologies. LAI report. AlexanderHou. Feb 1995.− 30-40% of development and procurement costs of a new weapons system can
be attributed to electronics hardware and software. Good figure on page 15.− Traditional development methods partition to hw/sw and develop separately
despite tight coupling− System development longer than lifecycle of underlying electronics technologies− Evaluates several existing development methodologies
− Rapid development process used to develop flight control software for DC-X− GritTech rapid development process− Ptolemy-supported hardware/software codesign− RASSP (Rapid prototyping of Application Specific Signal Processors)− Cleanroom software engineering
− Software OFP lines of code in various a/c platform stats− Rates RASSP and Cleanroom engineering as the two best. Suggests combing
the two would be better.− Toyota "set based design" emphasis on more prototyping, more experimenting
before freezing requirements, supplying ambiguous requirements to suppliersand prototyping, getting feedback as a critical part of selecting requirements
17. LAI LEAN self assessment tool set. (several files including instructions and calculator)18. The Lean Value Principle in Military Aerospace Product Development. Extracted
from MIT Thesis. Robert Slack. July 1999.− 5 lean principles (based on Womack/Jones)
− precisely specify value by specific product− identify the value stream− make value flow− let the customer pull value− pursue perfection
− Are these principles applicable to product development?− Defines value for this study: Value is a measurement of the worth of a specific
product or service by a customer, and is a function of (1) the product’susefulness in satisfying a customer need, (2) the relative importance of the needbeing satisfied, (3) the availability of the product relative to when it is neededand (4) the cost of ownership to the customer.
− Some final diagrams depicting views on value.− Basically this is a discussion of value from the standpoint of the customer,
shareholder, employee and other stakeholders.19. Lifecycle Value Framework for Tactical Aircraft Product Development. April 2001.
Ingrid Hallander, Alexis Stanke. Working paper.
_____________________________________________________________________________________
111
− Maturity matrix based on practices and lessons learned of 3 a/c programs with 100interviews. Purpose to "examine relative contributions in product developmentand determine factors that significantly promote abilities to consider andachieve lifecycle value"
− Best Lifecycle Value (BLV) defined as "a system introduced at the right time andthe right price offering best value in mission effectiveness, performance andaffordability and retains these advantages though out its life"
− Three cases: JAS 39 Gripen, F-18 E/F, F-16− JAS 39 Gripen: small, multi role fighter to replace the Viggen for the Swedish AF.
Achieved 40% reduction over LCC from Viggen. As of writing in service for 7years. Clean sheet of paper new design.
− F-18 E/F: Upgrade program. 90% common avionics but radically differentairframe from C/D. Program never rebaselined. Early program goals were met.
− F-16. Lightweight 'no frills' ac. Then slow, evolutionary upgrade programs kept itsmall but continuously upgraded capability.
− 6 themes developed as best practices or lessons learned− Holistic Perspective. Consideration of entire system and entire lifecycle. Essential
to balance 'long term' demands like upgradability, maintenance, repair with'short term' demands like low unit costs and performance. 57% id'd lack ofvisibility across lifecycle as a barrier.− Best Practices: systems engineering practices in product development,
DFM&A, lessons learned databases, multiyear contracting, educateddesigners on maintainability and reliability, incorporate designrecommendations from variety of lifecycle perspectives, incorporateflexibility, lifecycle issues into early systems architecture, acknowledge andplan for dynamic nature of lifecycle.
− Lessons learned: coordinate design maturation and production planning toaccount for differences in subsystem and components
− Organizational factors. IPTs and other organizational issues.− Best Practices: collocate product/people, align org structure to product WBS,
establish multi disciplinary teams, use IPT structure to broaden functionalresponsibilities to develop flexible workforce, coordination meetings betweenleaders of different projects, specialization at core competency level,integration at system development level.
− Lessons Learned: balance functional specialization and integrationknowledge by shifting focus of support between functional and IPT orgsthroughout development cycle as appropriate.
− Tools and methods. Great tools, integration is the key− Best Practices: common CAD tool, eval design changes from ops
perspective to reduce preventative maintenance, internet/web pageseffective at information sharing, define common databases, tools, practicesto be used throughout the value chain, risk management process, roadmapemerging technology to plan for technology insertion accordingly.
− Lessons learned: increase commonality between modeling and analysis tools,integrate PDM and CM databases
− Requirements and metrics. Setting, communicating, managing key factor indeveloping affordably timely systems
_____________________________________________________________________________________
112
− Best Practices: metrics shared weekly, people empowered to make decisionthrough rqmts flowdown creating RAA (responsibility, authority andaccountability), EV 'perform the plan', incorporate plans for growth,upgradeability, technological development in design work, fixeddevelopment cost target focuses on near term development cost andshedule
− Lessons learned: specs often not clearly written / adequately communcaterequirements, use spec framework to establish actual goals, determine whenits "good enough" and move on
− Enterprise relationships.− Best practices: require open/honest communication, encourage, reward
asking for help, "hit by a bus" test - document your job so someone else canpick it up, utilize knowledge throughout enterprise regardless of source, shareresponsibility for decisions using a defined process, jointly establish designverification process, maintain organizational counterparts throughout theenterprise, create/maintain leadership alignment across enterprise, jointlyestablish targets for continuous improvement using structured process,
− Lessons learned. Maintain visibility of enterprise relationships throughout levelsof org to prevent suboptimization, incentivize behavior corresponding totargets, manage outsourced development work according to maturity, treattechnical IP of all stakeholders with respect to build trust
− Leadership and management− Best practices. Create strategies, practices that can weather leadership
transitions, maintain high expectations for success, emphasize maintainingcredibility, clear roles for decision making, bring peopletogether/facilitate/prevent strong personalities from taking over, supportmentality (there to serve, not be served), training, push to evaluate the nogrowth (cost, weight) alternatives in terms of risk, proactive culture
− Lessons Learned. Create buyin on budgets schedules, emphasize schedule,excellence under "normal" circumstances instead of hero in crisis,
20. Lean Implementation Considerations in Factory Operations of Low Volume / HighComplexity Production Systems. LAI report #RP97-04-152. Authored by Shields,Kilpatrick, Pozsar, Ramirez-de-Arellano, Raynal, Quint, Schoonmaker. November1997.− Model for lean implementation includes 4 phases: building a lean infrastructure,
redesigning flow of products in the factory, revamping ops management,fostering process improvement
− Building lean infrastructure steps: id business issues/goals, develop strategy, idcurrent/needed skills, breakdown stovepipe mentality
− Redesigning flow steps: distribute information, group products into families,design process layout, simulate flow, optimize flow and cell linkages,redefine/redeploy work tasks
− Ops mgmt steps: cross train workers, realign incentives, reallocates supportresources, implement pull
− Critical factors: executive champion, degree of process ownership by thoseresponsible for the product
− Above are "most used steps" in case studies. Complete list of steps on p12− 12 case studies used to test the model mostly in the defense aerospace industry.
_____________________________________________________________________________________
113
− Paper focuses on the steps taken to implement factory lean compared to atheoretically correct sequence of steps. This paper does not draw correlationsbetween steps taken and benefits received to verify theoretical model.
21. The LEAN Enterprise Model. Product from LAI.− Model developed by LAI to manage LEAN enterprise transformation− ID/optimize enterprise flow− Assure seamless information flow− Optimize capability and utilization of people− Make decisions at lowest possible level− Implement integrated product and process development− Develop relationships based on mutual trust and commitment− Continuously focus on the customer− Promote lean leadership at all levels− Maintain challenge of existing processes− Nurture a learning environment− Ensure process capability and maturation− Maximize stability in a changing environment− Offers metrics and enabling practices for each major theme listed above
22. F/A-22 War on Cost Update. March 26, 2002. Presentation. Handell.− Shows F/A-22 affordability process (really cost take out)− Shows 3 pillars - requirements, Lean enterprise, cost reduction investment strategy− Requirements - saved $40M production, $30M worth of ideas disapproved,
unknown value withdrawn− PIP - 144 projects 2,747M savings, 150M investment, 18.2:1 ratio
− LM Aero, Boeing Lean Rate Assembly Line− P&W WOC− BAE SYSTEMS 2C1, Carrier Elimination− TRW Backplane, IFFT, Conformal Coating Process− Raytheon Radar TR modules
23. Lean Effects on Aerospace Programs: Raytheon AMRAAM Case Study. March 27,2002. Davidz. MIT LAI Presentation− Dropped cost from $1M to $250k in 7 years, doubled deliveries in 12 months,
improved reliability to 3x requirement, mfg flow time decreased 71%, defectsdropped 48%
− Key enablers− Leadership: strong, involved enterprise leadership, great leadership at all levels,
provide motivation and support for change, key to overcoming consolidation− People: extreme pride, enthusiasm, empowered at all levels, extensive use of IPTs− Govt relationship: once contractor cost reduced, govt cost drove missile cost,
govt support office reduced from 300 to 60, TSPR, strong relationship− KEYS - strong leadership, emphasis on people, lean transformation and
continuation, strong govt team relationship24. Lean effects on aerospace programs: Atlas Case Study. March 27, 2002. Hitchings.
MIT LAI Presentation− Atlas V - EELV - major purpose improved design for manufacturability, 1st launch
May 02
_____________________________________________________________________________________
114
− 10,000 parts reduction, reduced supply chain failed inspections from 28-6%,increased payload by 2400 lbs, cut production cycle time in half (48-24 months),significant cost reduction
− Enablers: leadership, communication, information flow, factory floor initiatives,lean from the government side
− Major findings; leadership, coorporate visibility, LM21, people issues critical,employee value, supplier value, engage workforce in self reinforcing learningcycles, a significant fraction of supplier cost is determined by the customer'srequirements and business practices
25. F-16 Lean journey 1992 - 2001. A decade of continual improvement. Dr JerryGannaway, F-16 Program Integrator. Alexis Stanke, MIT Researched. LAIpresentation. March 27, 2002.
− 1991 company employment dropped 30k to 20k after A-12 cancellation− Really interesting 10 year history of 6 manufacturing metrics: annual production rate,
QARs/1000 earned hours, percent on time delivery of ac, percent USAF CFE pricevariance, zero defect ac, delta cpar performance
− Good comparison of mass to lean production chart− Final Gannaway comments: quality better, technology continues to be infused,
employees feel they have a future/purpose, suppliers are partners, cost/deliveryunder control
− Nearly constant price despite dramatic reduction in annual production rates− Enablers: new leadership, metrics including goals, core competencies, IPT, pilot
project success, IT tools, senior leadership commitment26. Remarks to Science and Technology Affordability Conference. Oct 1, 1998.
Raytheon COO Daniel Burnham− Excitement about technology advances / capability advances− Focus on Six Sigma to achieve affordability− Technology/processes - design of experiments, mistake proofing, design to cost,
design for manufacturability, SPC, process mapping, etc− Leadership - direction, customer satisfaction surveying, organizational structure
initiatives, metrics and tools, Process Capability Analysis Toolset (PCAT)− Theme is that affordability is a means to protect those who protect us by
providing the most capable equipment possible within current budgetaryconstraints (is a "better" system that the government can't afford to purchase orcan't afford to purchase in sufficient quantities to ensure that the men/women inharm's way have the new equipment).
27. DARPA funded simulation based design and advanced surface combatantprograms. Presentation.
28. Affordability Considerations for the Joint/Future Transport Rotorcraft. Dr. Schrage.Georgia Tech.− Recommends an overarching affordability metric described as benefit or value
to cost ratio (e.g. mission effectiveness / mission cost)− Affordability most influenced by requirements, concepts (design variables) and
technologies− Uses lots of math, "Joint Probability Decision Modeling" techniques to
mathematically evaluate alternatives− Recommends changes to DoD policy to focus on affordability
− Rapid acquisition with demonstrated technology
_____________________________________________________________________________________
115
− Time phased requirements and evolutionary development− Integration of acquisition and logistics− Interoperability− Cost as a requirement that drives design, procurement and support− Increased competition
− "Requirements drive initial design studies, procurement decisions, and ultimatelyoperational effectiveness and cost"
− "However, it is often the case that design processes (and designers) overlook theimpact of changes and/or ambiguity in requirements and fail to understand therelationships between requirements, technologies, and the design space"
29. Technology Transition for Affordability. A guide for S&T Program Managers. April2001. DoD Deputy Under Secretary of Defense (Science and Technology) DeloresEtter.− "the DoD must put into practice methods that lead to the best balance among
a system's performance, life cycle costs and availability"− Identifies best practices for S&T program managers seeking to transition new
technology into the acquisition community− Obtain management support to meet affordability goals− Implement IPPD− Develop and execute a training plan− Establish and track affordability metrics− Develop a transition strategy− Technology "marketing" best practices
− Block improvement/upgrade− Fill unique military need− COTS− Mature technology "in time"− Customer buy in− Industry support− Application of open systems concept− Producibility− TOC− Spiral development
− Lists activities undertaken by various government agencies to facilitate techtransition
30. Value Creation in the Product Development Process. MIT Thesis. December 2001.James Chase. Advised by Greitzer, McManus, Deyst, Velde.− Defines value as creating a desired product for the customer, continuing profit
for the shareholders, lifetime satisfaction for the employee− Four principle elements of the framework - tasks, resources, environment,
management− Figure 3.3 shows good view of the traditional cost commitment vs cost spent− Discusses three dimensional complexity in product development - product
architecture, process architecture (WBS), organizational architecture− WBS evaluation of multiple programs− WBS of programs taking place in more "lean" environments showed MORE
supporting tasks, primarily concerned with cost/schedule management thanthose taking place in more traditional environments
_____________________________________________________________________________________
116
31. Supplier management practices on the Joint Direct Attack Munitions Program. MITThesis. Malee Lucas. June 1996. Advised by Hoult, Deyst, Neufville, Wachman.− Changes implemented by govt and prime contractor show progress in the
general model for supplier relationships towards more collaborative, teamoriented approach
− Best practices: average unit production price metric, competitive acquisition,rolling evaluation and downselection process, stable multi year procurement,accelerated schedule, limited govt oversight, govt advocacy teams, opencommunications, contractor configuration control, limited project scope,establishment of "live or die" requirements, 20 yr warrantee, commercialpractices, CAIV, cost-performance trades, streamlining standards, specs, "howtos", requirements, contractor incentives, pay for performance, contractortraining, DFM/DFA and alternate dispute resolution
− Describes 4 stages of approaches to supplier management - confrontational,arm's length, goal congruence, full partnership. Lots of discussions aboutcosts/benefits of each stage
− $68k unit cost, govt requested $40k, MacDac came up with $15k - saved $2B.Good table showing programmatic data including these costs on p62
− specific examples about how they accomplished this - value engineering32. World electronic warfare equipment markets. Market analysis conducted by Frost
and Sullivan. 1998.− Overall growth rate 5.3% annual 98-05− 1998 EW market $4.78B, fighter/attach a/c EW $3.19B, other fixed wing EW 0.45B,
rotary wing EW 0.74B, shipboard EW 0.15B, ground based EW 0.25B− Fighter / attack aircraft EW drivers - perceived threat to air force capabilities,
proliferation of weapons of mass destruction, development of next generationfighter ac, proliferation of IR missiles, growing upgrade market. Restraints -decreasing platform counts, perceived air force superiority, limited air forcecapabilities
− Historically EW 5% of airborne platform cost− Need for EW self protection depreciates in UCAVs - study views UCAVs as a
major threat− P80 shows projected size of market, p81 shows percent of market in segments− P114 and on shows market forcast for EW on fighter aircraft - slightly neg growth
until 2000, 5-8% growth 2000-2005 - US is only 20% of market33. World Platform Self Protection. EW Markets. Market analysis conducted by Frost and
Sullivan.34. Kevin Reihl data take 1. R/Y/G metrics, COPQ, Baldridge Assessment.
− We are almost never red on technical - reflects culture that given enough $/timeall technical problems are solveable. Technical is the independent variable.
− Successfully argued that goal of zero red programs is probably not the rightobjective - leads to too much risk aversion, what's the point of having a metric ifyou never fail (the bar isn’t high enough if you always clear it)
− Baldrige - need more leading metrics and sharing lessons learned acrosscompany
35. The role of product development metrics for making design decisions in the defenseaerospace industry. MIT thesis. Todd Stout. Oct 1995. Advised by Hoult.
_____________________________________________________________________________________
117
− 3 common problems - failure to focus on proper metrics and measurements ofcurrent activities, failure to maintain a significant historical database to facilitatecorporate learning, use of a decision making process that often lacks theinformation necessary to make good decisions
36. Best Manufacturing Processes - LM GES Moorestown NJ. Oct 1995.− Producibility experts and design review− Defect and scrap reduction− Process improvement road map− Continuous acquisition and life cycle support systems engineering and
laboratory− Design matrices− Integrated product development concept− Part obsolescence management− Rapid prototyping of electronics modules− Sys Eng requirements management and requirements analysis
37. Best Manufacturing Processes - ITT Industries. Fort Wayne, IN. April 1998.− Integrated product development process− Supplier integrated product development− Advanced manufacturing process development− Integrated management plan− Risk management process− Technology roadmap− Design review manual− Design to cost reduction planning− Robust system design process− Manufacturing for design initiative - proactively developing manufacturing
capabilities to support future programs38. Best Manufacturing Processes - Hamilton Sundstrand, Farmington CT. Oct 1993.
− Design to cost information− Manufacturing technology insertion− Concurrent engineering− Design review for producibility− Design for manufacturability
39. Best Manufacturing Processes - LM NESSS Moorestown NJ. Aug 2001− Cost estimate process− Lean and six sigma− Technology roadmapping− Transition to production process
40. Best Manufacturing Processes - Lockheed Martin Electronics and Missiles. Orlando.April 1995.− Key characteristics and variability reduction− Design for assembly process
41. Best Manufacturing Processes - Lockheed Martin Tactical Aircraft Systems. FW Texas.Aug 95.− Cost assessment - dedicated cost team− Lean enterprise− F/A-22 Variability Reduction− Supplier integrated product development
_____________________________________________________________________________________
118
42. Robustness in Product Design. Don Clausing. Presentaion. Oct 1998.− Advocated robust design instead of build/test/fix approach to problems− Requires culture change (hard)− Requires metrics to be enforced (first pass mfg yield)
43. Cycle time reduction using design structure matrixes. Tyson Browning. Nov 1997.Presentation− Good last chart on typical schedule risk drivers
44. Product Development Team. Prod Development Schedule reduction. John Deyst.Nov 1997− Good metrics on DoD avg development times compared to some commercial
standards− Includes 6 steps to faster cycle time (constantly improve work processes, know
what adds value, flat, multifunctional team based org, pursue processdevelopment as avidly as product or service development, establish stretchgoals and publicly measure, create environment which stimulates/rewardscontinuous learning/action
45. Toyota, Termites and Zero Risk System Development. Allen Ward. Presentation. Nov1997.− Great chart (12) on difference between "Newton's intellectual universe" where
we manage programs today vs. real physical universe that Toyota recognizes inits PDP− All is knowable nothing is completely knowable− If we knew enough, we could predict all its all probabilistic anyway− Variation is minor problem dealt with later tiny input changes - big output
changes− Put smartest guys in charge, all obey logic is unpredictable, most thing too complex for computation
− Compares set based to point bases system design (p 22)46. Product development team effectiveness. Oct 95. Gerald Susman. LAI white paper.
− Follow up to study that concluded 50/50 power balance functional/programbest for high risk projects and heavy shift to program best for low risk projects
− Team leaders of successful projects form good relationships with functionalmanagers who have different backgrounds and responsibilities than they do
− Team leaders of successful projects focus more energy on resolvingtechnical/production issues with functional managers than resolvingpriority/resource issues
47. Managing subsystem commonality. Eric Rebentisch. April 2001.− Good charts (17,18) showing savings estimates of having common LRUs across
platforms or systems48. JSF presentation. Burbage
− 5 principles− strategic focus on affordability− advanced evms, subcontractor management− 10 anchor points− understand rework phenomenon− create environment for success− onboarding− wizards

_____________________________________________________________________________________
119
49. EELV Case Study Lean Implementation. Col Robert Saxer. Dec 00.− Explanation of Lean implementation on EELV from acquisition, PD, mfg points of view− Major success story− EELV was an evolution from pervious rocket50. JDAM Lean lessons learned.51. Darlene Druyun keynote speech to LAI. Dec 2001.52. BAE SYSTEMS COPQ "Why do programs go red? How do they return to green?"53. Avionics Life Cycle Forcasting Model. Stephen Czerwonka. June 2000. Advised by
Rosenfield, Deyst, Hagwood.− Exec summary of thesis (need to find thesis).− Statistical model to predict lifecycle of avionics components based on reliability,
sustainability and economics− Forecasting ability of the model is high only when there is little variation in the
measurement data sets and it increases as components approach the end oftheir life
54. JSF - Collaborative Design for Affordability. Mike Fortson, Mar 26, 2002. Presentationto LAI.− Stringent air system requirements− Engineering impact on cost− Life cycle cost requirements− Collaborative design for best value− Meeting life cycle cost requirements− Majority of cost of our products is driven by the way we design them. 70% of
LCC based on design, 20% material, 5% labor, 5% burden rates. I think he meansinfluence on the cost not the cost itself
− DTLCC allocations, Collaborative "best value" designs, affordability initiatives &harvest savings
− LCC is a design requirement− Good example in inlet duct construction trade study
55. Value Creation through Integration. Fostering innovation across aerospace suppliernetworks. Presentation to LAI. Aaron Kirtley. Jan 2002.− Investigated issues/barriers to innovation for affordability across supplier networks− Focused on F/A-22 avionics, included research conducted at BAE for EW and
some major BAE suppliers− Focus on ways to increase communication− Support suppliers through shared/joint investments (PIP program highlighted as
step in the right direction but not large enough in face of magnitude of problem)− Increase contractual incentives (recognized that aside from good will with
customer and keeping programs from getting canceled, suppliers often havenegative incentive to reduce cost/improve)
− Reduce program uncertainty− Train suppliers where appropriate− Provide insight into future technology needs/roadmaps
56. Case study of LEAN implementation - F-18 E/F. Presentation.57. JSF Manufacturing System Design highlights. Presentation.58. New directions in the aeronautical industry. Allen Haggerty. VP/GM (retired) military
aircraft and missile systems, Boeing. April 2001. Presentation.− Industry is shrinking (21 to 5 primes, fewer people)
_____________________________________________________________________________________
120
− Fewer new platform starts, more derivatives - less interesting for engineers− "affordability is the key to delivering value to the customer"− 80% of product's cost is determined by the engineering design− chart 26 has good comprehensive set of targets for affordability at the enterprise
level59. Value creation in the product development process. Jim Chase. Presentation
based on his thesis. Jan 2002.− WBS review and study, interviews on time allocation− Trying to determine how much of product development contributes to value,
how much is waste - concludes that 86% of tasks contribute to a definition ofvalue that he has developed
− Interesting finding - there is a 3 to 1 ratio of time spent communicating vs. timespent working in isolation. Conclusion is that investment should be in moreefficient communications methods / tools instead of improving work processes
− Chase thesis is #30.60. F/A-22 research on developing a "Product Delivery System" or manufacturing
system. Steve Hendricks. Presentation− PDS based on Suh's axiomatic design principles− Rigorously defines requirements and solution space and maps two together from
very high level down to detail level− Evaluates goodness of achievements of all the requirements elements
61. Manufacturing System Design. Shields. Presentation− More than the factory floor− Strategy driven, not product driven− No one size fits all− Best results when interacting with design, suppliers, marketing− Manufacturing is a competitive weapon in a maturing product industry
62. New applications for technical performance measurement in program riskmitigation. Unknown author or date− paper on integrating TPM and EVMS into a predictive diagnostics tool for
program managers to see problems in front of them instead of behind them63. 3D Concurrent Engineering - Clockspeed based principles for product, process and
supply chain development. Charles Fine. May 1998. Presentation and Jan 2001presentation.− Aircraft development has three clockspeeds - airframe (slow), engines (med)
and electronics (fast). Currently ac firms operate at airframe clockspeeds, in thefuture they will need to operate at electronics clockspeeds
− Vertical industry structure with integrated product architectures− Horizontal industry structure with modular product architectures− Argues that supply chain design is a core competency
Two files longer one has some practical frameworks for doing supply chain design64. Doing The right things. John Horton. Lockheed Martin. Presentation.
− Good charts (11-15) on management vs leadership including "the 12 dimensionsof leadership"
− Shows a graduating maturity level of those you lead/manage and how leadersrespond differently to different people (situational leadership)
− Team building charts− Keys to followership
_____________________________________________________________________________________
121
− Eight key elements of high performance work systems− Motivating people− Management is doing things right, leadership is doing the right things
65. Fostering innovation across aerospace supplier networks. Aaron Kirtley. MIT thesis.Advised by Kirk Bozdogan. June 2002.− Review of F/A-22, F-16, JSF platoforms - technology, architecture, supply chain
issues at high level− Review of F/A-22 EW, Radar and four key suppliers for each at a detailed level− Great chart (p26) showing avionics as a percentage of A/C costs increasing
over time− Indicates F/A-22's integrated avionics suite architecture caused the DMS
problem to be significantly higher than it would have been with a morefederated approach
− Lessons learned− Emphasis on affordability− JSF 28-38M vs 80M F/A-22− Good technology performance at reasonable price vs. best technology
available− Widen design margins
− Good graphic (p56) on incentives of long term contracting (supplier keeps costsavings as profit in period 1, gives them to customer in period 2)
− Has titanium as an EW innovation (says it saves weight…) has conversion toPHEMT as an innovation, digital receiver, automated diagnostics
− Specified lessons learned - design tradeoffs made at higher levels and little to nomargin specifications flowed down - practically dictating technical approach
− Modular vs integrated system architecture;− Includes questionaires used in research
66. Organizing for Product Development. Thomas Allen. Dec 2001.− Propose 4 parameters that determine appropriate org structure for R, D, Eng
organization− Compares functional , project, matrix orgnizations
67. Product Realization in the Defense Aerospace Industry. March 27, 2002. MandyVaughn, 2nd LT, USAF. LAI presentation− Chart on Augustine's law that by 2050 average unit cost of single a/c will equal
GNP− Utterback's innovation models - good example of aerospace vs auto vs
typewriter− Fine's 3D CE− Lead to manufacturing system design framework
68. Framework for achieving best lifecycle value. Alexis Stanke. April 11, 2001presentation
69. Modeling and Analyzing Cost, Schedule, and Performance in complex systemproduct development. MIT Doctoral Thesis. Tyson Browning. Dec 1998. Advised byEppinger, Deyst, Whitney.− Explores iteration in the aircraft design process− A causal framework for risk drivers in complex system product development− DSM based systems engineering, organization planning, schedule management− Shows relation to the LEM
_____________________________________________________________________________________
122
70. Best practices in user needs / requirements generation. Joe Wirthlin. MIT SDMThesis. Advised by Rebentisch. Jan 2000.− Covers process space from id of initial need/perceived need to
product/development program launch− Case study approach - 8 commercial orgs, 8 military orgs and US AF
71. The effective use of process capability databases for design. Thesis MIT. MelissaTate. Jun 1999. Advised by Anna Thorton.
Process capability databases are critical design tools but noone uses them72. Challenges in the better, faster, cheaper era of aeronautical design, engineering
and manufacturing. White paper. Murman, Walton, Rebentisch. Sept 2000.− Aeronautical industry reached dominant design and into the specific phase
focused on incremental product improvement, especially for quality andproductivitiy, process technology and technological innovations that offersuperior substitutes
− Shows graph of increasing development time for military systems over past 4decades
− Has aerospace company Utterback chart− Fig 5 best chart so far showing LCC committed vs incurred by PDP phasex− Good summary of a lot of LAI research work
73. Lean Aerospace Initiative Implementation Workshop; implementing cross functionalteams in an IPPD environment. Joel Gershenfeld. 1998.− No one size fits all best approach to IPTs− IPPD contexts vary along 5 dimensions - customers, products, IPTs, suppliers and
time.− Implementation of IPTs in IPPD environment is not a one time event - it must be
revisited, adjusted as programs move from one phase to the next or when othersignificant changes occur
− Lean requires IPTs. Its not that IPTs are better at implementing Lean, they arerequired.
− Implementing IPTs requires fundamental changes in flow of information,authority, rewards, and other enabling systems
− Rockwell lessons learned− Practices are a continuum w/o start/stops− Accept variation reduction as a way to do business.− Joint ownership of process by everyone is critical.− Expect resistance; lead your way through it.− Clearly defined roles and responsibilities are essential.− Corrective action to feedback is critical.− High robustness leads to lower costs when processes create accountability for
results.− Northrup Grummon lessons learned
− Maintain constant communication at all times.− Don’t second-guess technical experts.− Vigorously resist requirements creep.− Gain customer agreement with program management approach and
technical goals.− Have design decision authority resident within the IPT.− Streamline procurement practices.
_____________________________________________________________________________________
123
− Use rewards and recognitions to build team spirit and to give IPT members“bragging rights.”
− F/A-22 lessons learned− IPT philosophy takes leadership commitment from the top.− Need to constantly work on improving team communication/integration: the
“I” in IPT stands for integrated, not independent.− Training to function as a team is paramount.− IPT managers must have authority over personnel and budget resources.− An integrated network of communications/software tools is mandatory.− Set team goals and objectives, and then track them!− IPT leadership should become a mainstream discipline/function and a viable
management career path.74. A partitioning method for helicopter avionics systems with a focus on life cycle cost.
Leon Silva. MIT SDM thesis. Jan 01. Rebentisch advisor.75. A framework for achieving best lifecycle value in product development. Alexis
Stanke. MIT Thesis. June 01. Advised by Murman.− Complete details of thesis summarized in other shorter works listed above.
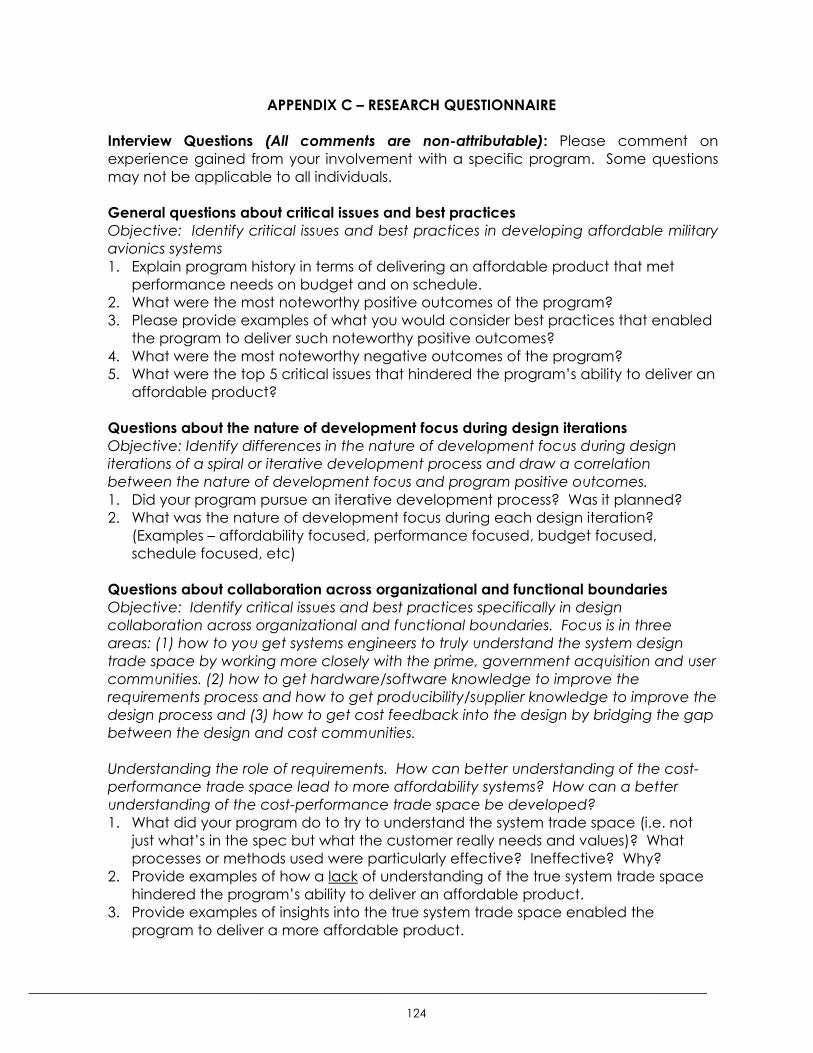
_____________________________________________________________________________________
124
APPENDIX C – RESEARCH QUESTIONNAIRE
Interview Questions (All comments are non-attributable): Please comment onexperience gained from your involvement with a specific program. Some questionsmay not be applicable to all individuals.
General questions about critical issues and best practicesObjective: Identify critical issues and best practices in developing affordable militaryavionics systems1. Explain program history in terms of delivering an affordable product that met
performance needs on budget and on schedule.2. What were the most noteworthy positive outcomes of the program?3. Please provide examples of what you would consider best practices that enabled
the program to deliver such noteworthy positive outcomes?4. What were the most noteworthy negative outcomes of the program?5. What were the top 5 critical issues that hindered the program’s ability to deliver an
affordable product?
Questions about the nature of development focus during design iterationsObjective: Identify differences in the nature of development focus during designiterations of a spiral or iterative development process and draw a correlationbetween the nature of development focus and program positive outcomes.1. Did your program pursue an iterative development process? Was it planned?2. What was the nature of development focus during each design iteration?
(Examples – affordability focused, performance focused, budget focused,schedule focused, etc)
Questions about collaboration across organizational and functional boundariesObjective: Identify critical issues and best practices specifically in designcollaboration across organizational and functional boundaries. Focus is in threeareas: (1) how to you get systems engineers to truly understand the system designtrade space by working more closely with the prime, government acquisition and usercommunities. (2) how to get hardware/software knowledge to improve therequirements process and how to get producibility/supplier knowledge to improve thedesign process and (3) how to get cost feedback into the design by bridging the gapbetween the design and cost communities.
Understanding the role of requirements. How can better understanding of the cost-performance trade space lead to more affordability systems? How can a betterunderstanding of the cost-performance trade space be developed?1. What did your program do to try to understand the system trade space (i.e. not
just what’s in the spec but what the customer really needs and values)? Whatprocesses or methods used were particularly effective? Ineffective? Why?
2. Provide examples of how a lack of understanding of the true system trade spacehindered the program’s ability to deliver an affordable product.
3. Provide examples of insights into the true system trade space enabled theprogram to deliver a more affordable product.
_____________________________________________________________________________________
125
Integrating downstream knowledge into the design process : Systems - software -hardware - manufacturing/supplier1. How was ‘downstream’ knowledge brought upstream in the design process?
(how were HW/SW engineering brought into the system design phase, how weremanufacturing/suppliers brought into the hardware design phase?)
2. What responsibility/accountability/authority was given to manufacturing/supplierin the design phases? To HW/SM engineers in the system design phases?
Cost feedback into design: Design community - cost community1. What problems existed in incorporating cost feedback into the design process?2. What techniques worked well in incorporating cost feedback into the design?3. Was affordability considered a design requirement, a management requirement
or a manufacturing requirement?
_____________________________________________________________________________________
126
REFERENCES 1 Augustine's Laws, 6th Edition by Norman R. Augustine as adopted by Mandy Vaughn inpresentation to Lean Aerospace Initiative entitled "Product Realization in the DefenseAerospace Industry" on March 27, 2002.2 Into the 21st Century - a strategy for affordability. By Dr Jacques Gansler.Undersecretary of Defense for Acquisition and Technology. January 20, 1999.3 Mastering the Dynamics of Innovation by James M. Utterback published in 1994 byHarvard Business School in Boston, Massachusetts.4 Product Realization in the Defense Aerospace Industry presentation to LeanAerospace Initiative by Mandy Vaughn on March 27, 2002.5 Mastering the Dynamics of Innovation by James M. Utterback published in 1994 byHarvard Business School in Boston, Massachusetts.6 Mastering the Dynamics of Innovation by James M. Utterback published in 1994 byHarvard Business School in Boston, Massachusetts.7 Lean Enterprise Value by Murman, Allen, Bozdogan, Cutcher-Gershenfeld, McManus,Nightingale, Rebentisch, Shields, Stahl, Walton, Warmkessel, Weiss and Widnallpublished in 2002 by PALGRAVE, New York, NY.8 New Directions in the Aeronautical Industry presentation by Allen Haggerty on April 21,2001.9 Intellectual Capital White Paper for The California Engineering Foundation, 12/07/99by Hernandez, C.10 JSF - A Winning Environment presentation by Tom Burbage.11 New Directions in the Aeronautical Industry presentation by Allen Haggerty on April21, 2001.12 Joint Advanced Strike Technology Program - Avionics Architecture DefinitionAppendices - Version 1.0, p. B-4 as adopted by Aaron Kirtley in his MIT thesis, Fosteringinnovation across aerospace supplier networks.13 The Machine that Changed the World by Womack, Jones and Roos.14 Product Development in the World Auto Industry by Kim B. Clark, Takahiro Fulimotoand W. Bruce Chew, Brooking Papers on Economic Activity, No. 3, 1987. Organizationsfor Effective Product Development by Takahiro Fulimoto, PhD Thesis, Harvard BusinessSchool, 1989, Tables 7.1, 7.4, 7.8. As adopted by Womack, Roos and Jones in TheMachine that Changed the World15 The Machine that Changed the World by Womack, Jones and Roos.16 Lean Enterprise Value by Murman, Allen, Bozdogan, Cutcher-Gershenfeld, McManus,Nightingale, Rebentisch, Shields, Stahl, Walton, Warmkessel, Weiss and Widnallpublished in 2002 by PALGRAVE, New York, NY.17 Value Creation in the Product Development Process MIT Thesis by James Chase,18 Lean Enterprise Value by Murman, Allen, Bozdogan, Cutcher-Gershenfeld, McManus,Nightingale, Rebentisch, Shields, Stahl, Walton, Warmkessel, Weiss and Widnallpublished in 2002 by PALGRAVE, New York, NY.19 "Value Creation in the Product Development Process" MIT Thesis by James Chase,December 2001.20 Space Systems Affordability. Presentation by Michael D. Griffin, Executive VicePresident and Chief Technology Officer for Orbital Sciences Corporation presented onOctober 26, 1999.
_____________________________________________________________________________________
127
21 Differences in philosophy - Design to Cost vs Cost as an Independent Variable by J.Gerald Land. March-April 1997. Program Management(?) magazine article.22 JSF – Collaborat ive Design for Affordability by Mike Fortson, Mar 26, 2002.Presentation to LAI.23 Managing Subsystem Commonality by Matthew Nuffort, MIT Thesis, February 2001.24 The Power of Product Platforms. Building Value and Cost Leadership by March Meyerand Alvin Lehnerd. Published by The Free Press in 1997.25 Design to Cost.26 Using System Dynamics to Understand Barriers to Cost Reduction. MIT Thesis. WilliamBlake author, Daniel Frey advisor. December 1999.27 Methods of Integrating Design and Cost Information to Achieve EnhancedManufacturing Cost/Performance Trade-offs by David Hoult and C. Lawrence Meador.28 Into the Black Box: The Knowledge Transformation Cycle. White paper by Paul Carlileand Eric Rebentisch, December 1, 2001.29 Product Design and Development. Karl Ulrich and Steven Eppinger. Published byIrwin McGraw-Hill in 2000.30 Managing the Design Factory. A Product Developer’s Toolkit by Donald Reinertsen.Published by The Free Press in 1997.31 Adaptive Software Development. A Collaborative Approach to Managing ComplexSystems by James Highsmith. Published by Dorset House Publishing in 2000.32 Fostering innovation across aerospace supplier networks by Aaron Kirtley. MIT thesis.Advised by Kirk Bozdogan. June 2002.33 Value Creation in the Product Development Process. MIT Thesis by James Chase,December 2001.34 Into the Black Box: The Knowledge Transformation Cycle. White paper by Paul Carlileand Eric Rebentisch, December 1, 2001.