Operating room data management: improving efficiency and ...
11
CORRESPONDENCE Open Access Operating room data management: improving efficiency and safety in a surgical block Vanni Agnoletti 1* , Matteo Buccioli 2 , Emanuele Padovani 3 , Ruggero M Corso 1 , Peter Perger 3 , Emanuele Piraccini 1 , Rebecca Levy Orelli 3 , Stefano Maitan 1 , Davide Dell’Amore 4 , Domenico Garcea 5 , Claudio Vicini 6 , Teresa Maria Montella 7 and Giorgio Gambale 1 Abstract Background: European Healthcare Systems are facing a difficult period characterized by increasing costs and spending cuts due to economic problems. There is the urgent need for new tools which sustain Hospitals decision makers work. This project aimed to develop a data recording system of the surgical process of every patient within the operating theatre. The primary goal was to create a practical and easy data processing tool to give hospital managers, anesthesiologists and surgeons the information basis to increase operating theaters efficiency and patient safety. Methods: The developed data analysis tool is embedded in an Oracle Business Intelligence Environment, which processes data to simple and understandable performance tachometers and tables. The underlying data analysis is based on scientific literature and the projects teams experience with tracked data. The system login is layered and different users have access to different data outputs depending on their professional needs. The system is divided in the tree profile types Manager, Anesthesiologist and Surgeon. Every profile includes subcategories where operators can access more detailed data analyses. The first data output screen shows general information and guides the user towards more detailed data analysis. The data recording system enabled the registration of 14.675 surgical operations performed from 2009 to 2011. Results: Raw utilization increased from 44% in 2009 to 52% in 2011. The number of high complexity surgical procedures (≥120 minutes) has increased in certain units while decreased in others. The number of unscheduled procedures performed has been reduced (from 25% in 2009 to 14% in 2011) while maintaining the same percentage of surgical procedures. The number of overtime events decreased in 2010 (23%) and in 2011 (21%) compared to 2009 (28%) and the delays expressed in minutes are almost the same (mean 78 min). The direct link found between the complexity of surgical procedures, the number of unscheduled procedures and overtime show a positive impact of the project on OR management. Despite a consistency in the complexity of procedures (19% in 2009 and 21% in 2011), surgical groups have been successful in reducing the number of unscheduled procedures (from 25% in 2009 to 14% in 2011) and overtime (from 28% in 2009 to 21% in 2011). Conclusions: The developed project gives healthcare managers, anesthesiologists and surgeons useful information to increase surgical theaters efficiency and patient safety. In difficult economic times is possible to develop something that is of some value to the patient and healthcare system too. Keywords: Operating room, Surgical path, Management, Indicators, Outcomes, Efficiency, Safety, Sustainability * Correspondence: [email protected] 1 Department of Emergency, Anesthesia and Intensive Care Unit, Morgagni-Pierantoni Hospital, Forlì, Italy Full list of author information is available at the end of the article © 2013 Agnoletti et al.; licensee BioMed Central Ltd. This is an Open Access article distributed under the terms of the Creative Commons Attribution License (http://creativecommons.org/licenses/by/2.0), which permits unrestricted use, distribution, and reproduction in any medium, provided the original work is properly cited. Agnoletti et al. BMC Surgery 2013, 13:7 http://www.biomedcentral.com/1471-2482/13/7
-
Upload
khangminh22 -
Category
Documents
-
view
0 -
download
0
Transcript of Operating room data management: improving efficiency and ...
Agnoletti et al. BMC Surgery 2013, 13:7http://www.biomedcentral.com/1471-2482/13/7
CORRESPONDENCE Open Access
Operating room data management: improvingefficiency and safety in a surgical blockVanni Agnoletti1*, Matteo Buccioli2, Emanuele Padovani3, Ruggero M Corso1, Peter Perger3, Emanuele Piraccini1,Rebecca Levy Orelli3, Stefano Maitan1, Davide Dell’Amore4, Domenico Garcea5, Claudio Vicini6,Teresa Maria Montella7 and Giorgio Gambale1
Abstract
Background: European Healthcare Systems are facing a difficult period characterized by increasing costs andspending cuts due to economic problems. There is the urgent need for new tools which sustain Hospitals decisionmakers work. This project aimed to develop a data recording system of the surgical process of every patient withinthe operating theatre. The primary goal was to create a practical and easy data processing tool to give hospitalmanagers, anesthesiologists and surgeons the information basis to increase operating theaters efficiency andpatient safety.
Methods: The developed data analysis tool is embedded in an Oracle Business Intelligence Environment, whichprocesses data to simple and understandable performance tachometers and tables. The underlying data analysis isbased on scientific literature and the projects teams experience with tracked data. The system login is layered anddifferent users have access to different data outputs depending on their professional needs. The system is dividedin the tree profile types Manager, Anesthesiologist and Surgeon. Every profile includes subcategories whereoperators can access more detailed data analyses. The first data output screen shows general information andguides the user towards more detailed data analysis. The data recording system enabled the registration of 14.675surgical operations performed from 2009 to 2011.
Results: Raw utilization increased from 44% in 2009 to 52% in 2011. The number of high complexity surgicalprocedures (≥120 minutes) has increased in certain units while decreased in others. The number of unscheduledprocedures performed has been reduced (from 25% in 2009 to 14% in 2011) while maintaining the samepercentage of surgical procedures. The number of overtime events decreased in 2010 (23%) and in 2011 (21%)compared to 2009 (28%) and the delays expressed in minutes are almost the same (mean 78 min). The direct linkfound between the complexity of surgical procedures, the number of unscheduled procedures and overtime showa positive impact of the project on OR management. Despite a consistency in the complexity of procedures (19% in2009 and 21% in 2011), surgical groups have been successful in reducing the number of unscheduled procedures(from 25% in 2009 to 14% in 2011) and overtime (from 28% in 2009 to 21% in 2011).
Conclusions: The developed project gives healthcare managers, anesthesiologists and surgeons useful informationto increase surgical theaters efficiency and patient safety. In difficult economic times is possible to developsomething that is of some value to the patient and healthcare system too.
Keywords: Operating room, Surgical path, Management, Indicators, Outcomes, Efficiency, Safety, Sustainability
* Correspondence: [email protected] of Emergency, Anesthesia and Intensive Care Unit,Morgagni-Pierantoni Hospital, Forlì, ItalyFull list of author information is available at the end of the article
© 2013 Agnoletti et al.; licensee BioMed Central Ltd. This is an Open Access article distributed under the terms of the CreativeCommons Attribution License (http://creativecommons.org/licenses/by/2.0), which permits unrestricted use, distribution, andreproduction in any medium, provided the original work is properly cited.
Agnoletti et al. BMC Surgery 2013, 13:7 Page 2 of 11http://www.biomedcentral.com/1471-2482/13/7
IntroductionThe global economic and financial crisis is having crucialimpact on European healthcare systems, while the Italianhealthcare system is one of the most affected [1]. Manycountries are facing controversial debates concerningthe limitations of medical services and treatments by thenational health care systems because of decreasinghealth care expenditure resources [2]. According to FuatS. Oduncu Germany spends 11.6% of its Gross DomesticProduct (GDP) on health care, that places it fourth inthe world after the USA (17.4%), the Netherlands (12%),and France (11.8%) in healthcare expenditure terms [2],while Italy occupies a mid-table positions among theOrganization for Economic Co-operation and Develop-ment Countries (OEDC) [3]. The mentioned economicproblems coupled with an overall cost explosion withinthe Italian Healthcare Sector has led the Italian govern-ment to reconfigure its fiscal priorities, with particularfocus on the reduction of public debt and attempts tostreamline National Health Service Costs. In view of this,health managers are under pressure to create and imple-ment increasingly efficient operating tools which alsoguarantee patient safety [4]. The introduction of in-novation is a challenge in almost all organizations, but isparticularly complicated in organizations where thechange effort must overcome the resistance of profes-sionals. Professionals often have deeply entrenched valuesthat are not necessarily consistent with - and often are indirect opposition - to the goals of the organization’s seniormanagement team. In fact, this dilemma is particularlyprevalent in healthcare sector organizations, where thereis a considerable body of evidence to suggest that physi-cians have an agenda that is often in total contrast to thatof non-clinical managers [5,6]. The development of toolsto increase efficiency and improve performance measure-ment as well as accountability for results, is on the agendaof many public sector organizations [7]. From an external-use perspective, transparency has become a widespreadindicator of “good governance” in many different contexts[8]. Moreover, the collection of information throughperformance measurement can assist these organizationsto move toward an improved allocation of resourcesthrough management control systems [9]. Indeed, im-provements catalyzed by new models of public manage-ment in countries such as the United States, UnitedKingdom, Australia and New Zealand have received exten-sive coverage in scientific literature [10]. However, there isevidence in public management literature to suggest thatsome countries have greater difficulties in successfullyimplementing such innovation, due to a traditional, oftenhypertrophic state bureaucracy and an atavistic diffidenceof innovation which is culturally viewed as a deviationfrom the safe area of status quo [11]. Italy is one suchcountry. The Italian healthcare system have undergone an
extensive process of decentralization in the 90s, devolvingorganizational and fiscal responsibility to regions. Today inItaly, each region is responsible for the healthcare needs oftheir inhabitants and are faced with the challenge of im-proving the effectiveness of health care spending wherecontainment of public spending in healthcare is an overalldeclared goal. This latter goal is particularly critical as onethird of all regions are facing large financial deficits [1].Aside from the aforementioned diffidence between profes-sionals and management, rigid regulations for workinghours of human resources pose a second challenge in Italy.National contracts for healthcare workers and nursing staff(not to mention doctors) foresee payment for a fixedamount of hours. Any extra hours which do not derivefrom overtime (hours worked immediately after the officialend of a shift) or oncall hours, go unpaid. This lack offlexibility compromises the optimization of human re-sources. Therefore, unlike in the USA or other countries,in Italy it would be impossible to ask a nurse scheduledfor an afternoon shift, to work additional hours in themorning, or to call extra staff to clean operating roomswhen scheduled staff are struggling to maintain a rapidturnover time. In Italy this flexibility stems from a lack offinancial resources (it is not possible to pay workers moreor hire extra temporary staff for a few hours every week)as well as from a probable “lacuna legis”. In 2004, theolder town public hospital Morgagni Hospital’s facilitymerged into the second town public hospital PierantoniHospital, creating a new expanded facility called theMorgagni-Pierantoni Hospital. An important aspect ofthis change was the amalgamation of all operating roomsinto a single location, the Operating Room Block (ORB),thus bringing together surgeons with a vast array of spe-cializations. This new shared workplace forced staff intoovercoming the previous fragmentation of logistics.
RationaleThe aim of this project is to render the operating roomprocess efficient and safe for patients in terms of clinicalrisk management. The operating theatre represents oneof the most critical hospital units, both in patient safetyand financial terms [12,13]. The team has chosen thetopic of operating room management because of an ur-gent need to deliver high quality care with limited re-sources and the correct management of operatingtheaters represents an important step towards achievingthis. We wanted a system able to elaborate data in linewith literature [14-16] in order to identify each phase ofpatient flow. This study represents the third phase of theprocess started in 2011. This phase started in January2009 and finished in December 2011. The project iscalled “Surgical Patient Path” (SPP) and comprises DRSand an Operating Room Management System (ORMS).

Table 1 First and second trial: timings of the surgicalpath process
Timing 1st Trial 2nd Trial
Column A Column B
1 Ward exit Ward exit
2 Entrance ORB Entrance ORB
3 Identification by nurse anesthetist
4 Entrance anesthesia room
5 Start anesthesia Start anesthesia
6 End anesthesia
7 Entrance OR Entrance OR
8 Start surgical procedure Start surgical procedure
9 End surgical procedure End surgical procedure
10 Exit OR Exit OR
11 Entrance RR
12 Exit RR
13 Identification by healthcare assistant
14 Transport ICU
15 Exit ORB
16 Ward re-entry
ORB: operating room block.OR: operating room.RR: recovery room.ICU: intensive care unit.
Agnoletti et al. BMC Surgery 2013, 13:7 Page 3 of 11http://www.biomedcentral.com/1471-2482/13/7
ORMS is a data analysis system that processes, analyzesand charts data tracked by DRS.
BackgroundThis study was developed in house by the Forlì LocalHealth Authority (Forlì, Italy) within which theMorgagni-Pierantoni Hospital operates. In 2005, in viewof the newly created operating room block, the manage-ment team of the Local Health Authority gave mandateto a multidisciplinary working group to critically evalu-ate the system in place. The working group was chairedand coordinated by the healthcare directorate and in-cluded anesthesiologists, surgeons, nurses, and engi-neers. The purpose was to improve the level of efficiencyand patient safety within the new ORB, and to ensure afair distribution of hospital resources among healthcareprofessionals. Looking at the system as a whole it wasdifficult to identify all the steps of the surgical patientpath and instruments were needed to ensure transpar-ency in data gathering and interpretation. The researchteam of the Hospital performed two main experimenta-tion periods from 2006 to 2008. The aim of the first ex-perimentation was to develop a system called ‘datarecording system’ (DRS) to render the surgical pathtransparent and intelligible by tracking timestamps alongdifferent stages of the surgical path process. Initially weset out simply to define appropriate timeframes whichwould be useful in measuring the efficiency of the Oper-ating Room Block (Table 1 column A), in line with sci-entific literature [14,17]. Personal Digital Assistants(PDA datalogic Model PSC Falcon 4220, DatalogicBlackjet - Table 1.1) were selected as hardware to sup-port data entry activity. The PDA software was entirelydeveloped by hospital engineers. The software consistedof a timer to keep track of the timestamps. Login was re-quired by using operators for access and utilization ofthe software. Upon login, operators could identify thepatient, record times and select appropriate timestampsfrom a digital list. The results of the first experimenta-tion phase showed that our surgical path trackingapproach was generally implementable; although theadditional workload for operators was acceptable, therewas potential for reducing it. PDA software required re-engineering to adapt it more effectively to ORB require-ments. It also became evident that system improvementpotential would be higher if the quantity of time trackingstamps was increased and entire tracks were registeredwithout data lacks or interruptions. With the results ofthe first experimentation in mind, the aims of the sec-ond experimentation consisted of tracking the whole 16surgical path process steps proposed by Rotondi et al.(Table 1 column B) [17] and increasing the quantity andquality (reducing incompleteness in tracking) of dataconcerning the surgical process. To overcome the data
quality problems the hospital research team introduceda series of improvements. The nurse anesthetist wasidentified as the appropriate operator to track the differ-ent surgical path timeframes: a PDA was supplied toevery nurse. The PDA software was redesigned to enablea closer alignment of time tracking with the logistic pathof the patient. The software now contains a series of pre-defined, standardized steps and prompts the operator toenter the time of each path step, and to complete aminimum number of steps before enabling the registra-tion of a path. The adapted version of the software wasaligned closer to ORB logistics and suggests followingtime registration steps to the operator. If a step is notregistered the path automatically appears as incomplete.PDA usage was extended with the introduction and de-velopment of a barcode reading system, enabling thescanning not only of patient bracelets, but also of cardswhich operators used to access software and registerroom ingress/exit. The barcode reading system was iden-tified as the simplest and fastest way to gather data usingPDA, and led to a reduction in data entry errors.
Materials and methodsORMS can be regarded as practical analysis tool embed-ded in a Oracle Business Intelligence Environment,which processes data to simple and understandable per-formance tachometers and tables. The analysis of data is
Agnoletti et al. BMC Surgery 2013, 13:7 Page 4 of 11http://www.biomedcentral.com/1471-2482/13/7
based on Macario [14] and Dexter’s studies on ORB effi-ciency [18-21] and our experience and analysis oftracked data. Data recorded by DRS is sent immediatelyvia wifi connection to a central hospital server whichfunctions as interim storage. At the end of every weekdata is sent to the ORMS system where they areprocessed and added to previous data analyses.Data is recorded by DRS as a simple output made up
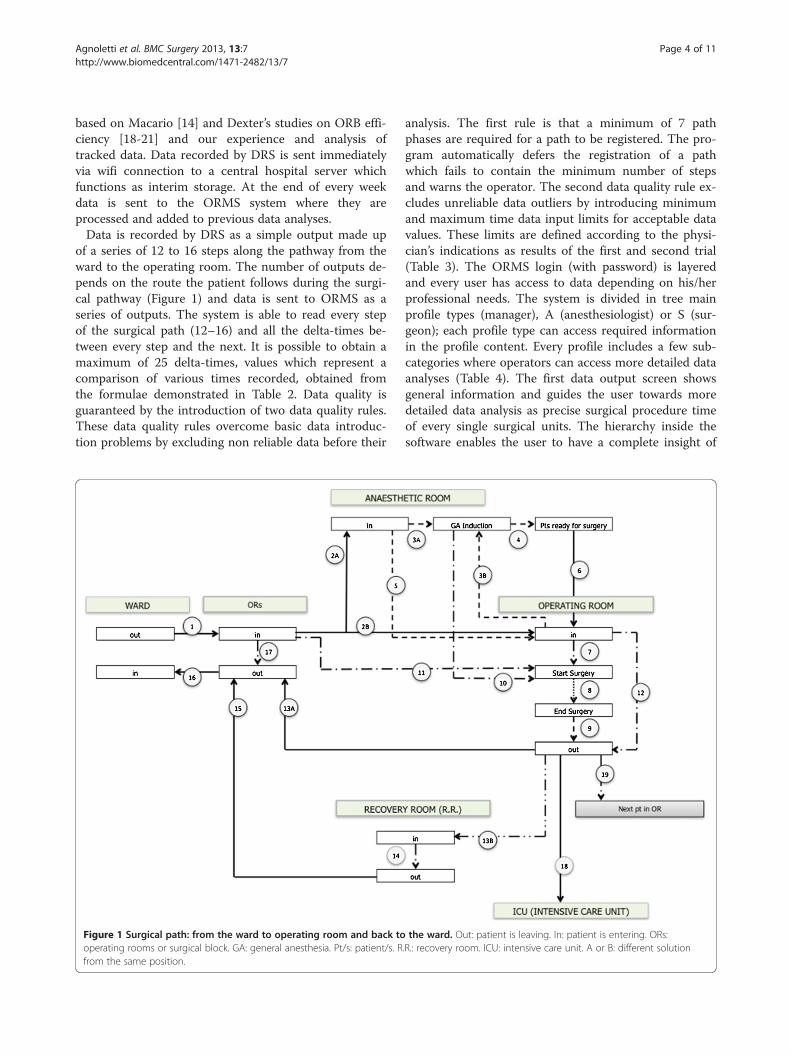
of a series of 12 to 16 steps along the pathway from theward to the operating room. The number of outputs de-pends on the route the patient follows during the surgi-cal pathway (Figure 1) and data is sent to ORMS as aseries of outputs. The system is able to read every stepof the surgical path (12–16) and all the delta-times be-tween every step and the next. It is possible to obtain amaximum of 25 delta-times, values which represent acomparison of various times recorded, obtained fromthe formulae demonstrated in Table 2. Data quality isguaranteed by the introduction of two data quality rules.These data quality rules overcome basic data introduc-tion problems by excluding non reliable data before their
Figure 1 Surgical path: from the ward to operating room and back tooperating rooms or surgical block. GA: general anesthesia. Pt/s: patient/s. Rfrom the same position.
analysis. The first rule is that a minimum of 7 pathphases are required for a path to be registered. The pro-gram automatically defers the registration of a pathwhich fails to contain the minimum number of stepsand warns the operator. The second data quality rule ex-cludes unreliable data outliers by introducing minimumand maximum time data input limits for acceptable datavalues. These limits are defined according to the physi-cian’s indications as results of the first and second trial(Table 3). The ORMS login (with password) is layeredand every user has access to data depending on his/herprofessional needs. The system is divided in tree mainprofile types (manager), A (anesthesiologist) or S (sur-geon); each profile type can access required informationin the profile content. Every profile includes a few sub-categories where operators can access more detailed dataanalyses (Table 4). The first data output screen showsgeneral information and guides the user towards moredetailed data analysis as precise surgical procedure timeof every single surgical units. The hierarchy inside thesoftware enables the user to have a complete insight of
the ward. Out: patient is leaving. In: patient is entering. ORs:.R.: recovery room. ICU: intensive care unit. A or B: different solution

Table 2 Delta times calculated by the timestamps recorded
n° of delta times and description Formula
1 Patient moving time from ward to ORB Entrance ORB – ward exit
2 Waiting time in ORB reception (AR induction) Identification by NA – entrance ORB
3 Waiting time in ORB reception (OR induction) Identification by NA – entrance ORB
4 Waiting time for anesthesia in AR Start anesthesia – entrance AR
5 Waiting time for anesthesia in OR Start anesthesia – entrance OR
6 Anesthesia time End anesthesia – start anesthesia
7 Sum of anesthesia time and transport to OR Identification by NA – entrance in OR
8 Transport time from AR to OR Entrance in OR – end anesthesia
9 Waiting time in OR Start surgical procedure – entrance in OR
10 Surgical time End surgical procedure – start surgical procedure
12 Total pre-surgery time Exit OR – end surgical procedure
11 Awakening time Start surgical procedure – identification by NA
13 Total time from admission in ORB To surgical starting time start surgical procedure – entrance ORB
14 Stay time in OR Exit OR – entrance OR
15 Waiting time to come back in ward Exit OR – exit ORB
16 Transport time from OR to RR Entrance RR – exit OR
17 Stay time in RR Exit RR – entrance RR
18 Waiting time at reception Identification by healthcare assistant – exit ORB
19 Transport time to come back in ward Ward re-entry – exit ORB
20 Stay time in ORB Exit ORB – entrance ORB
21 Out ORB - transport in ICU Transport ICU – exit ORB
22 Turnover time Entrance OR next pts – exit OR previous pts
23 Over-time Scheduled end of the daily work – exit OR last case
24 Start time tardiness Scheduled start of the daily work – start surgery 1°case
25 Under utilization Scheduled end of the daily work – exit OR last case
ORB: operating room block.AR: anesthetic room.OR: operating room.NA: nurse anesthetist.RR: recovery room.ICU: intensive care unit.pts: patients.
Agnoletti et al. BMC Surgery 2013, 13:7 Page 5 of 11http://www.biomedcentral.com/1471-2482/13/7
data regarding his/her profile in a very simple and clearway. The manager’s profile is aimed at hospital managersand presents data concerning the entity of operations.Within the surgeons profile the business intelligencesoftware works out data which is important for surgeonsand anesthesiologists alike.
Manager (M)The manager’s profile comprises 5 different data analysissubcategories.The first output screen (M1) is a global vision of the
entire surgical activity in terms of total number of proce-dures, number of scheduled / unscheduled procedures,raw utilization (total hours of cases performed ÷ totalhours of OR time allocated) [22], and a description of allsurgical units’ workload.
M2 is a comparison of the productivity of each surgi-cal unit. Variables used to describe the workload are:number of surgical procedures, number of procedurestogether with duration, and logistic pathway (inductionarea, ward, recovery room or ICU).M3 gives a view on surgical units in terms of number
of procedures, surgical time average and logistic patientflow analysis (ward, RR or ICU admission).M4 displays the efficiency indicators and expressed as
KPIs (6 dashboards with red, yellow and green colorschemes).M5 represents the Transport-Induction-Surgery-Awak-
ening (TISA) graph. This graph maps the time it takesto bring the patient from the ward to ORB, the induc-tion time, the surgery procedure time and the awakeningtime. Each time interval is referred to the surgical
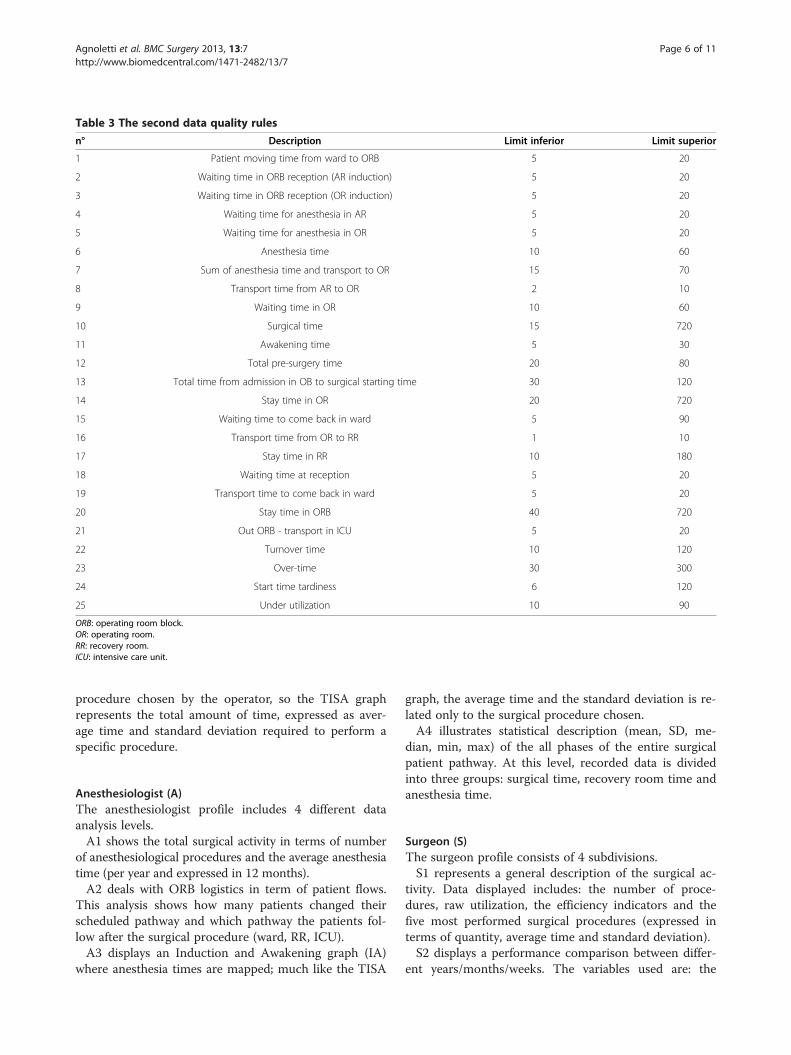
Table 3 The second data quality rules
n° Description Limit inferior Limit superior
1 Patient moving time from ward to ORB 5 20
2 Waiting time in ORB reception (AR induction) 5 20
3 Waiting time in ORB reception (OR induction) 5 20
4 Waiting time for anesthesia in AR 5 20
5 Waiting time for anesthesia in OR 5 20
6 Anesthesia time 10 60
7 Sum of anesthesia time and transport to OR 15 70
8 Transport time from AR to OR 2 10
9 Waiting time in OR 10 60
10 Surgical time 15 720
11 Awakening time 5 30
12 Total pre-surgery time 20 80
13 Total time from admission in OB to surgical starting time 30 120
14 Stay time in OR 20 720
15 Waiting time to come back in ward 5 90
16 Transport time from OR to RR 1 10
17 Stay time in RR 10 180
18 Waiting time at reception 5 20
19 Transport time to come back in ward 5 20
20 Stay time in ORB 40 720
21 Out ORB - transport in ICU 5 20
22 Turnover time 10 120
23 Over-time 30 300
24 Start time tardiness 6 120
25 Under utilization 10 90
ORB: operating room block.OR: operating room.RR: recovery room.ICU: intensive care unit.
Agnoletti et al. BMC Surgery 2013, 13:7 Page 6 of 11http://www.biomedcentral.com/1471-2482/13/7
procedure chosen by the operator, so the TISA graphrepresents the total amount of time, expressed as aver-age time and standard deviation required to perform aspecific procedure.
Anesthesiologist (A)The anesthesiologist profile includes 4 different dataanalysis levels.A1 shows the total surgical activity in terms of number
of anesthesiological procedures and the average anesthesiatime (per year and expressed in 12 months).A2 deals with ORB logistics in term of patient flows.
This analysis shows how many patients changed theirscheduled pathway and which pathway the patients fol-low after the surgical procedure (ward, RR, ICU).A3 displays an Induction and Awakening graph (IA)
where anesthesia times are mapped; much like the TISA
graph, the average time and the standard deviation is re-lated only to the surgical procedure chosen.A4 illustrates statistical description (mean, SD, me-
dian, min, max) of the all phases of the entire surgicalpatient pathway. At this level, recorded data is dividedinto three groups: surgical time, recovery room time andanesthesia time.
Surgeon (S)The surgeon profile consists of 4 subdivisions.S1 represents a general description of the surgical ac-
tivity. Data displayed includes: the number of proce-dures, raw utilization, the efficiency indicators and thefive most performed surgical procedures (expressed interms of quantity, average time and standard deviation).S2 displays a performance comparison between differ-
ent years/months/weeks. The variables used are: the
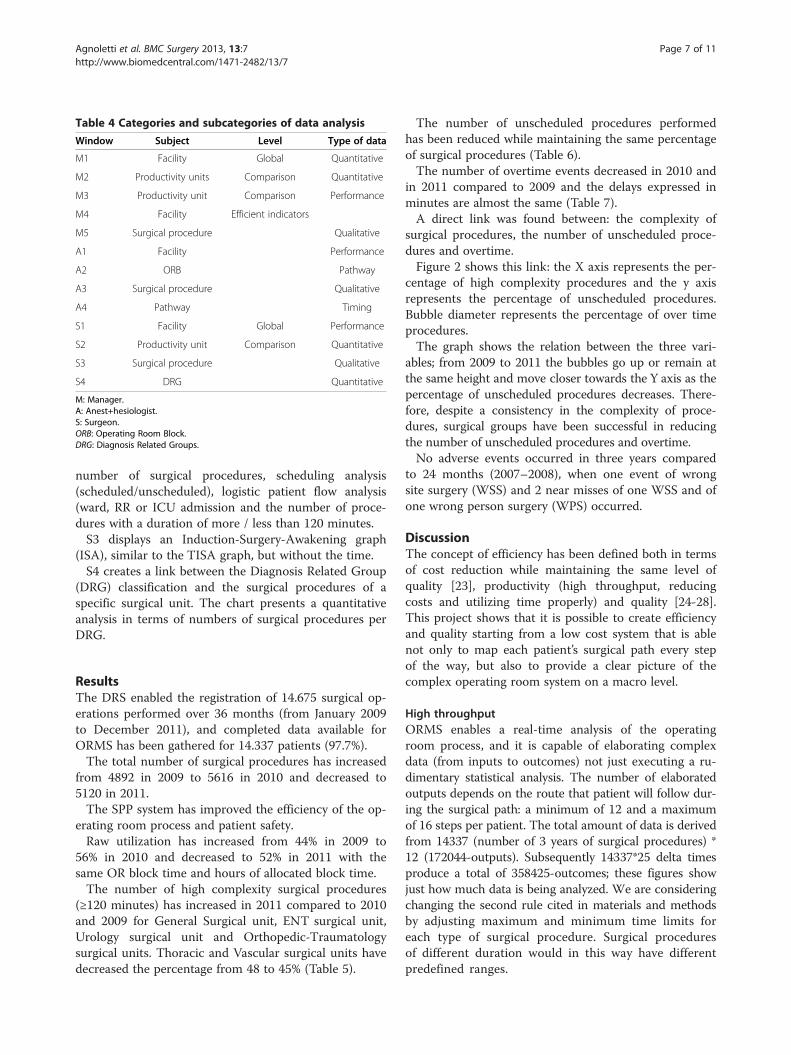
Table 4 Categories and subcategories of data analysis
Window Subject Level Type of data
M1 Facility Global Quantitative
M2 Productivity units Comparison Quantitative
M3 Productivity unit Comparison Performance
M4 Facility Efficient indicators
M5 Surgical procedure Qualitative
A1 Facility Performance
A2 ORB Pathway
A3 Surgical procedure Qualitative
A4 Pathway Timing
S1 Facility Global Performance
S2 Productivity unit Comparison Quantitative
S3 Surgical procedure Qualitative
S4 DRG Quantitative
M: Manager.A: Anest+hesiologist.S: Surgeon.ORB: Operating Room Block.DRG: Diagnosis Related Groups.
Agnoletti et al. BMC Surgery 2013, 13:7 Page 7 of 11http://www.biomedcentral.com/1471-2482/13/7
number of surgical procedures, scheduling analysis(scheduled/unscheduled), logistic patient flow analysis(ward, RR or ICU admission and the number of proce-dures with a duration of more / less than 120 minutes.S3 displays an Induction-Surgery-Awakening graph
(ISA), similar to the TISA graph, but without the time.S4 creates a link between the Diagnosis Related Group
(DRG) classification and the surgical procedures of aspecific surgical unit. The chart presents a quantitativeanalysis in terms of numbers of surgical procedures perDRG.
ResultsThe DRS enabled the registration of 14.675 surgical op-erations performed over 36 months (from January 2009to December 2011), and completed data available forORMS has been gathered for 14.337 patients (97.7%).The total number of surgical procedures has increased
from 4892 in 2009 to 5616 in 2010 and decreased to5120 in 2011.The SPP system has improved the efficiency of the op-
erating room process and patient safety.Raw utilization has increased from 44% in 2009 to
56% in 2010 and decreased to 52% in 2011 with thesame OR block time and hours of allocated block time.The number of high complexity surgical procedures
(≥120 minutes) has increased in 2011 compared to 2010and 2009 for General Surgical unit, ENT surgical unit,Urology surgical unit and Orthopedic-Traumatologysurgical units. Thoracic and Vascular surgical units havedecreased the percentage from 48 to 45% (Table 5).
The number of unscheduled procedures performedhas been reduced while maintaining the same percentageof surgical procedures (Table 6).The number of overtime events decreased in 2010 and
in 2011 compared to 2009 and the delays expressed inminutes are almost the same (Table 7).A direct link was found between: the complexity of
surgical procedures, the number of unscheduled proce-dures and overtime.Figure 2 shows this link: the X axis represents the per-
centage of high complexity procedures and the y axisrepresents the percentage of unscheduled procedures.Bubble diameter represents the percentage of over timeprocedures.The graph shows the relation between the three vari-
ables; from 2009 to 2011 the bubbles go up or remain atthe same height and move closer towards the Y axis as thepercentage of unscheduled procedures decreases. There-fore, despite a consistency in the complexity of proce-dures, surgical groups have been successful in reducingthe number of unscheduled procedures and overtime.No adverse events occurred in three years compared
to 24 months (2007–2008), when one event of wrongsite surgery (WSS) and 2 near misses of one WSS and ofone wrong person surgery (WPS) occurred.
DiscussionThe concept of efficiency has been defined both in termsof cost reduction while maintaining the same level ofquality [23], productivity (high throughput, reducingcosts and utilizing time properly) and quality [24-28].This project shows that it is possible to create efficiencyand quality starting from a low cost system that is ablenot only to map each patient’s surgical path every stepof the way, but also to provide a clear picture of thecomplex operating room system on a macro level.
High throughputORMS enables a real-time analysis of the operatingroom process, and it is capable of elaborating complexdata (from inputs to outcomes) not just executing a ru-dimentary statistical analysis. The number of elaboratedoutputs depends on the route that patient will follow dur-ing the surgical path: a minimum of 12 and a maximumof 16 steps per patient. The total amount of data is derivedfrom 14337 (number of 3 years of surgical procedures) *12 (172044-outputs). Subsequently 14337*25 delta timesproduce a total of 358425-outcomes; these figures showjust how much data is being analyzed. We are consideringchanging the second rule cited in materials and methodsby adjusting maximum and minimum time limits foreach type of surgical procedure. Surgical proceduresof different duration would in this way have differentpredefined ranges.
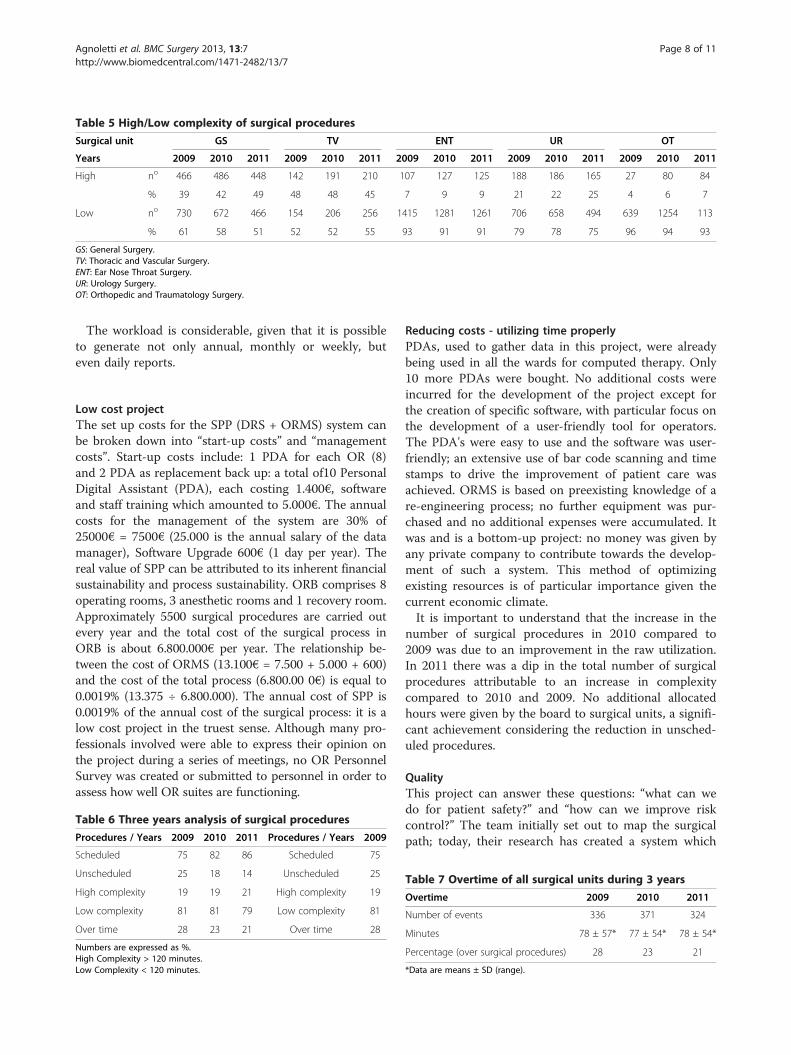
Table 5 High/Low complexity of surgical procedures
Surgical unit GS TV ENT UR OT
Years 2009 2010 2011 2009 2010 2011 2009 2010 2011 2009 2010 2011 2009 2010 2011
High no 466 486 448 142 191 210 107 127 125 188 186 165 27 80 84
% 39 42 49 48 48 45 7 9 9 21 22 25 4 6 7
Low no 730 672 466 154 206 256 1415 1281 1261 706 658 494 639 1254 113
% 61 58 51 52 52 55 93 91 91 79 78 75 96 94 93
GS: General Surgery.TV: Thoracic and Vascular Surgery.ENT: Ear Nose Throat Surgery.UR: Urology Surgery.OT: Orthopedic and Traumatology Surgery.
Agnoletti et al. BMC Surgery 2013, 13:7 Page 8 of 11http://www.biomedcentral.com/1471-2482/13/7
The workload is considerable, given that it is possibleto generate not only annual, monthly or weekly, buteven daily reports.
Low cost projectThe set up costs for the SPP (DRS + ORMS) system canbe broken down into “start-up costs” and “managementcosts”. Start-up costs include: 1 PDA for each OR (8)and 2 PDA as replacement back up: a total of10 PersonalDigital Assistant (PDA), each costing 1.400€, softwareand staff training which amounted to 5.000€. The annualcosts for the management of the system are 30% of25000€ = 7500€ (25.000 is the annual salary of the datamanager), Software Upgrade 600€ (1 day per year). Thereal value of SPP can be attributed to its inherent financialsustainability and process sustainability. ORB comprises 8operating rooms, 3 anesthetic rooms and 1 recovery room.Approximately 5500 surgical procedures are carried outevery year and the total cost of the surgical process inORB is about 6.800.000€ per year. The relationship be-tween the cost of ORMS (13.100€ = 7.500 + 5.000 + 600)and the cost of the total process (6.800.00 0€) is equal to0.0019% (13.375 ÷ 6.800.000). The annual cost of SPP is0.0019% of the annual cost of the surgical process: it is alow cost project in the truest sense. Although many pro-fessionals involved were able to express their opinion onthe project during a series of meetings, no OR PersonnelSurvey was created or submitted to personnel in order toassess how well OR suites are functioning.
Table 6 Three years analysis of surgical procedures
Procedures / Years 2009 2010 2011 Procedures / Years 2009
Scheduled 75 82 86 Scheduled 75
Unscheduled 25 18 14 Unscheduled 25
High complexity 19 19 21 High complexity 19
Low complexity 81 81 79 Low complexity 81
Over time 28 23 21 Over time 28
Numbers are expressed as %.High Complexity > 120 minutes.Low Complexity < 120 minutes.
Reducing costs - utilizing time properlyPDAs, used to gather data in this project, were alreadybeing used in all the wards for computed therapy. Only10 more PDAs were bought. No additional costs wereincurred for the development of the project except forthe creation of specific software, with particular focus onthe development of a user-friendly tool for operators.The PDA's were easy to use and the software was user-friendly; an extensive use of bar code scanning and timestamps to drive the improvement of patient care wasachieved. ORMS is based on preexisting knowledge of are-engineering process; no further equipment was pur-chased and no additional expenses were accumulated. Itwas and is a bottom-up project: no money was given byany private company to contribute towards the develop-ment of such a system. This method of optimizingexisting resources is of particular importance given thecurrent economic climate.It is important to understand that the increase in the
number of surgical procedures in 2010 compared to2009 was due to an improvement in the raw utilization.In 2011 there was a dip in the total number of surgicalprocedures attributable to an increase in complexitycompared to 2010 and 2009. No additional allocatedhours were given by the board to surgical units, a signifi-cant achievement considering the reduction in unsched-uled procedures.
QualityThis project can answer these questions: “what can wedo for patient safety?” and “how can we improve riskcontrol?” The team initially set out to map the surgicalpath; today, their research has created a system which
Table 7 Overtime of all surgical units during 3 years
Overtime 2009 2010 2011
Number of events 336 371 324
Minutes 78 ± 57* 77 ± 54* 78 ± 54*
Percentage (over surgical procedures) 28 23 21
*Data are means ± SD (range).

Figure 2 Three years correlation: complexity - unscheduled procedures - over time. Surgical Units: General Surgery, Thoracic and VascularSurgery, Ear Nose and Throat Surgery (ENT), Urology Surgery (URO), Orthopedic and Traumatology Surgery. The bubble diameter stands forpercentage of overtime.
Agnoletti et al. BMC Surgery 2013, 13:7 Page 9 of 11http://www.biomedcentral.com/1471-2482/13/7
not only maps and quantifies but also controls and in-troduces gates inside the surgical path. SPP can be de-fined as the main product of this research and it is muchlike a tree with many branches for patient quality: stepsfor patient identification (three) and steps to avoid WSSor WPS. PDA also informs doctors and nurses of typesof operation, number of operating room, site of surgery(if any), allergies (if any). The right patient is in the righttheatre with the right nurses and doctors.The workgroup is also thinking of inserting all avail-
able checklist structures onto PDA's so that a single in-strument may be used for several different applications.This project has many limitations; two surgical units de-
cided not to use the PDAs (Breast and OphthalmologyUnits) because of logistic problems (they are located farfrom the surgical block) and another limit is cultural. Ourstaff was not ready to share information regardingperformance- but the power of data and dialogue aremodifying our behavior and today we are aware of ourlimitations and we are trying to engender greater transpar-ency and safety through the use of data. We realized thatthe workgroup was not ready to share information be-cause we did not collect any feedback from the operatingroom team not only during the first part, but also duringall successive phases of the project. The workgroup was sofocused on the first step that it failed to include all staffmembers in the theoretical part of the system. The results
of this project are producing a "domino effect" not only onsurgical or anesthesiological or nursing activities, but alsoon how we understand the process as a whole. JamesHarrington [29] states that we can’t improve what wecan’t measure; we have improved and strive to improveeven further so that our daily work benefits from effi-ciency, cost reductions and work comprehension.It is our belief that a secondary effect of our system is
the forging of a new way of thinking among team mem-bers, a limitation of the project was a failure to collectfeedback from operating room teams, not only duringthe first part, but also during all successive phases of theproject. Erebouni et al. write that “different definitions ofthe concepts of efficiency and productivity in operatingdepartments may lead to confusion among team mem-bers”: the power of data and dialogue are modifying ourbehavior and today we are aware of our limitations andwe are trying to engender greater transparency and safetythrough the use of data. A next step would be to gatherdata to prove whether members of operating room teamsdo indeed have a clearer understanding of goals andresponsibilities and whether the project engendered anorganization-oriented understanding of efficiency.
ConclusionsThis project represents a successful experiment of theintroduction of managerial innovation in a public hospital
Agnoletti et al. BMC Surgery 2013, 13:7 Page 10 of 11http://www.biomedcentral.com/1471-2482/13/7
of one such country, Italy. It is interesting to note thatalthough the project was developed by healthcare profes-sionals, it aims to align managerial and professional goals.This is an important step forward, when compared tosolutions typically based on a "trade-off" between effi-ciency (managerial side) and effectiveness (professionalside). Further research might be done with the aim tocapture which were the contextual enablers of thisproject and how it could be replicated in other hospi-tals and countries.
AbbreviationsA: Anesthesiologist; DRG: Diagnosis Related Group; DRS: Data RecordingSystem; GPD: Gross Domestic Product; IA: Induction-Awakening;ICU: Intensive Care Unit; ISA: Induction-Surgery-Awakening; KPIs: KeyPerformance Indicators; M: Manager; OEDC: Economic Co-operation andDevelopment Countries; ORB: Operating Room Block; ORMS: OperatingRoom Management System; PDA: Personal Digital Assistant; RR: RecoveryRoom; S: Surgeon; SPP: Surgical Patient Path; TISA: Transport-Induction-Surgery-Awakening; USA: United States of America; WSS: Wrong Site Surgery;WPS: Wrong Person Surgery.
Competing interestsThe authors declare that they have no competing interests.
Authors’ contributionsVA: contributed to the planning, data analysis, writing manuscript, interpretation ofdata, manuscript revision. BM: contributed to the planning, data analysis, writingmanuscript, interpretation of data, manuscript revision. EP: contributed to theplanning, data analysis, writing manuscript, manuscript revision. RMC: contributedto the planning, data analysis, writing manuscript. PP: contributed to the planning,data analysis, writing manuscript, manuscript revision. EP: contributed to dataanalysis, writing manuscript, manuscript revision. RLO: contributed to the planning,data analysis, writing manuscript. SM: contributed to data analysis, writingmanuscript. DD: contributed to data analysis, writing manuscript. DG: contributedto data analysis, writing manuscript. CV: contributed to the planning, data analysis,writing manuscript. MTM: contributed to data analysis, writing manuscript,manuscript revision. GG: contributed to the planning, data analysis, writingmanuscript. All authors read and approved the final manuscript.
Authors’ informationVA Medical Doctor Specialized in Anesthesiology. BM Biomedical engineer.His particular interest in healthcare management inspired him to create anddevelop this system. PE Professor of economics. Main area of interest:management. Co-author of several healthcare management text books. CMRMedical Doctor Specialized in Anesthesiology. PP Economics student. PEMedical Doctor Specialized in Anesthesiology. OLR Professor of economics.Main area of interest: management. MS Medical Doctor Specialized inAnesthesiology. DAD Head of Thoracic Department. GD Head of GeneralSurgery Department. VC Professor of ENT Surgery and Head of ENT andCervical Facial Surgery Department. MMT Hospital Medical Director of RizzoliOrthopaedic Institute. Expert in healthcare management. GG Head ofEmergency Department.
AcknowledgementsThe authors thank Magda Djellab for her great support as language editor.The authors thank Elisa Tarroni, Raffaella Signani, Sandra Nocciolini, ValerioBianchi and Marco Camporesi for their cooperation in this study.
Author details1Department of Emergency, Anesthesia and Intensive Care Unit,Morgagni-Pierantoni Hospital, Forlì, Italy. 2Department of ComputerEngineering and Informatics, Morgagni-Pierantoni Hospital, Forlì, Italy.3Department of Management, University of Bologna, Bologna, Italy.4Department of Thoracic Surgery, Morgagni-Pierantoni Hospital, Forlì, Italy.5Department of General Surgery, Morgagni-Pierantoni Hospital, Forlì, Italy.6Department of Ear Nose and Throat and Cervical Facial Surgery,
Morgagni-Pierantoni Hospital, Forlì, Italy. 7Rizzoli Orthopaedic Institute,Bologna, Italy.
Received: 19 May 2012 Accepted: 6 March 2013Published: 11 March 2013
References1. Giulio De Belvisa A, Ferrè F, Specchia ML, et al: The financial crisis in Italy:
implications for the healthcare sector. Health Policy 2012, 106:10–16.2. Oduncu FS: Priority-setting, rationing and cost-effectiveness in the
German health care system. Med Health Care Philos 2012. Published online:Jun 13.
3. OECD (2011): Health at a Glance 2011: OECD Indicators. OECD Publishing;2011. http://dx.doi.org/10.1787/health_glance-2011-en.
4. McKee M, Karanikolos M, Belcher P, Austerity SD: A failed experiment onthe people of Europe. Clinical Medicine 2012, 12:346–350.
5. Young D, Saltman RB: The Hospital Power Equilibrium: Physician Behavior andCost Control. Baltimore: The Johns Hopkins Press; 1985.
6. Young D: Management Accounting in Health Care Organizations. New York:John Wiley & Sons; 2008.
7. Pollitt C, Bouckaert G: Public Management Reform: A Comparative Analysis-New Public Management, Governance, and the Neo-Weberian State. Oxford:Oxford University Press; 2011.
8. O’Neill O: Transparency and the ethics of communication. In Transparency:The Key to Better Governance?. Edited by Christopher H, David H. Oxford:Oxford University Press; 2006:75–90.
9. Padovani E, Young D: Managing Local Governments: Designing ManagementControl Systems That Deliver Value. Milton Park: Routledge; 2012.
10. Ongaro E: Introduction: the reform of public management in France,Greece, Italy, Portugal and Spain. The Int J Public Sec Manag 2008,21:101–117.
11. Dunleavy P, Hood C: From old public-administration to new publicmanagement. Public Money Manage 1994, 14:9–16.
12. Guerriero F, Guido R: Operational research in the management of theoperating theatre: a survey. Health Care Manag Sci 2011, 14:89–114.
13. Maryamaa RA, Kirvela OA: Who is responsible for operating roommanagement and how do we measure how well we do it? ActaAnaesthesiol Scand 2007, 7:809–814.
14. Macario A: Are Your Hospital Operating Rooms “Efficient”?: A ScoringSystem with Eight Performance Indicators. Anesthesiology 2006, 105:237–240.
15. Williams BA, DeRiso BM, Figallo CM, et al: Benchmarking the perioperativeprocess: III. Effects of regional anesthesia clinical pathway techniques onprocess efficiency and recovery profiles in ambulatory orthopedicsurgery. J Clin Anesth 1998, 7:570–8.
16. McIntosh C, Dexter F, Epstein R: The Impact of Service-Specific Staffing,Case Scheduling, Turnovers, and First-Case Starts on Anesthesia Groupand Operating Room Productivity: A Tutorial Using Data from anAustralian Hospital. Anesth Analg 2006, 103:1499–1516.
17. Rotondi AJ, Brindis C, Cantees KK, et al: Benchmarking the perioperativeprocess. I. Patient routing systems: a method for continual improvementof patient flow and resource utilization. J Clin Anesth 1997, 2:159–169.
18. Dexter EU, Dexter F, Masursky D, et al: Both bias and lack of knowledgeinfluence organizational focus on first case of the day starts. AnesthAnalg 2009, 108:1257–61.
19. Wachtel RE, Dexter F: Influence of the operating room schedule ontardiness from scheduled start times. Economics, Education, and Policy2009, 108:1889–1901.
20. Dexter F, Epstein RH, Marcon E, et al: Estimating the influence ofprolonged turnover times and delays by time of day. Anesthesiology 2005,102:1242–1248.
21. Wachtel RE, Dexter F: Reducing tardiness from scheduled start times bymaking adjustments to the operating room schedule. Anesth Analg 2009,108:1902–1909.
22. Dexter F, Traub RD: How to schedule elective surgical cases into specificoperating rooms to maximize the efficiency of use of operating roomtime. Anesth Analg 2002, 94(4):933–42.
23. Arakelian E, Gunningberg L, Larsson J: How operating room efficiency isunderstood in a surgical team: a qualitative study. Int J Qual Healthc2011, 23:100–106.
24. Walker R, Adam J: Changing time in an operating room suite. Int J NursStud 2001, 38:25–35.
Agnoletti et al. BMC Surgery 2013, 13:7 Page 11 of 11http://www.biomedcentral.com/1471-2482/13/7
25. Landor P: More for Less - But How? Productivity and Efficiency Apprehension inOfficial and Company Activities. Abo: Abo Akademi; 1990.
26. Ljunggren U: An evaluation of methods to measure productivity and efficiencyat school—applying in city of Stockholms’ elementary schools. Edsburk: EFI:Akademitryck AB; 1999.
27. Kielhorn A, Graf von der Schulenburg JM: The Health Economics Handbook.Chester: Aldis International; 2000.
28. Pandit JJ, Westbury S, Pandit M: The concept of surgical operating list‘efficiency’: a formula to describe the term. Anaesthesia 2007, 62:895–903.
29. Harrington HJ: The Improvement Process: How America's Leading CompaniesImprove Quality. New York: McGraw-Hill Education; 1987.
doi:10.1186/1471-2482-13-7Cite this article as: Agnoletti et al.: Operating room data management:improving efficiency and safety in a surgical block. BMC Surgery 201313:7.
Submit your next manuscript to BioMed Centraland take full advantage of:
• Convenient online submission
• Thorough peer review
• No space constraints or color figure charges
• Immediate publication on acceptance
• Inclusion in PubMed, CAS, Scopus and Google Scholar
• Research which is freely available for redistribution
Submit your manuscript at www.biomedcentral.com/submit