Improving the Convergence of the Backpropagation Algorithm Using Learning Rate Adaptation Methods
6
Abstract—Knowledge is the foundation for growth and development. Investment in knowledge improves new method for originate knowledge society and knowledge economy. Investment in knowledge embraces expenditure on education and R&D and software. Measuring of investment in knowledge is characteristically complicated. We examine the influence of investment in knowledge in multifactor productivity growth and numbers of patent. We analyze the annual growth of investment in knowledge and we estimate portion of each country intended for produce total investment in knowledge on the whole OECD. We determine the relative efficiency of average patent numbers with average investment in knowledge and we compare GDP growth rates and growth of knowledge investment. The main purpose in this paper is to study to evaluate different aspect, influence and output of investment in knowledge in OECD countries. Keywords—Knowledge, GDP, Multifactor productivity, Investment, efficiency. I. INTRODUCTION NVESTMENT in knowledge is defined and calculated as the sum of expenditure on R&D, on total higher education (public and private) and on software. Simple summation of the three components would lead to overestimation of the investment in knowledge owing to overlaps (R&D and software, R&D and education, software and education). Therefore, data reported here have been adjusted to exclude the overlaps between components [1]. The purpose of this paper is to analyze the impact of investment in knowledge in OECD countries. We estimate average growth of investment in knowledge and analyze this estimate. The shares of investment in knowledge of each country to total OECD knowledge investment will be calculated. Relation between multifactor productivity and patent numbers with investment in knowledge will be estimated. While luck of data we had to selected countries with available data. We use OECD data for evaluation during time period 1994-2002. II. THE KNOWLEDGE ECONOMY The managing and measurement of knowledge investment has developed into one of the most significant and confrontation matter for knowledge-based economy. Authors are with Techno-Economics & Policy Program, College of Engineering, Seoul National University, Bldg # 37, San 56-1, Shillim-dong, Kwanak-gu, Seoul 151-742, Korea (e-mails: [email protected], [email protected]). Peter Drucker, suggests that Knowledge is now becoming the one factor of production, sidelining both capital and labor [2]. The "knowledge-based economy" was defined by the OECD as an economy which is "directly based on the production, distribution and use of knowledge and information" [3]. The Asia-Pacific Economic Cooperation (APEC) Economic Committee defined knowledge based economy as "the production, distribution and use of knowledge is the main driver of growth, wealth creation and employment across all industries" [4]. The Knowledge Economy is emerging from two defining forces: the rise in knowledge intensity of economic activities, and the increasing globalization of economic affairs. The rise in knowledge intensity is being driven by the combined forces of the information technology revolution and the increasing pace of technological change. Globalization is being driven by national and international deregulation, and by the IT related communications revolution. However, it is important to note that the term ‘Knowledge Economy’ refers to the overall economic structure that is emerging, not to any one, or combination of these phenomena [5]. Investment in knowledge raises economic efficiency and economic growth will provide technology development and the grounds for higher employment. With analyze and identify the role of the knowledge investment and understand the essential of investment in knowledge as most characteristic structure for knowledge economy, we can characterize the different significant aspect of knowledge investment. III. KNOWLEDGE INVESTMENT AND PRODUCTIVITY RETURNS The United States and Japan are moving more rapidly towards a knowledge-based economy than the EU, since 1994, their investment in knowledge to GDP ratios have grown at a higher rate than that of the EU. For all the countries, except Ireland, the ratio of investment in knowledge-to-GDP was higher in 2002 than in 1994. For most countries, increases in software expenditure were the major source of increased investment in knowledge. Notable exceptions are Finland (where R&D was the main source of increase) and Greece (where higher education and software were the main sources of increase). In 2002, investment in knowledge amounted to 5.2% of GDP in the OECD area, a share that has increased over time. In 2002, the United States invested 6.6% of GDP in knowledge, Japan 5.0% and the European Union 3.8%. Like the United States, Analysis of Investment in Knowledge inside OECD Countries JunSeok Hwang, and Mohsen Gerami I World Academy of Science, Engineering and Technology 1 2007 102
Transcript of Improving the Convergence of the Backpropagation Algorithm Using Learning Rate Adaptation Methods

Abstract—Knowledge is the foundation for growth and
development. Investment in knowledge improves new method for originate knowledge society and knowledge economy. Investment in knowledge embraces expenditure on education and R&D and software. Measuring of investment in knowledge is characteristically complicated. We examine the influence of investment in knowledge in multifactor productivity growth and numbers of patent. We analyze the annual growth of investment in knowledge and we estimate portion of each country intended for produce total investment in knowledge on the whole OECD. We determine the relative efficiency of average patent numbers with average investment in knowledge and we compare GDP growth rates and growth of knowledge investment. The main purpose in this paper is to study to evaluate different aspect, influence and output of investment in knowledge in OECD countries.
Keywords—Knowledge, GDP, Multifactor productivity, Investment, efficiency.
I. INTRODUCTION NVESTMENT in knowledge is defined and calculated as the sum of expenditure on R&D, on total higher education
(public and private) and on software. Simple summation of the three components would lead to overestimation of the investment in knowledge owing to overlaps (R&D and software, R&D and education, software and education). Therefore, data reported here have been adjusted to exclude the overlaps between components [1]. The purpose of this paper is to analyze the impact of investment in knowledge in OECD countries. We estimate average growth of investment in knowledge and analyze this estimate. The shares of investment in knowledge of each country to total OECD knowledge investment will be calculated. Relation between multifactor productivity and patent numbers with investment in knowledge will be estimated. While luck of data we had to selected countries with available data. We use OECD data for evaluation during time period 1994-2002.
II. THE KNOWLEDGE ECONOMY The managing and measurement of knowledge investment
has developed into one of the most significant and confrontation matter for knowledge-based economy.
Authors are with Techno-Economics & Policy Program, College of Engineering, Seoul National University, Bldg # 37, San 56-1, Shillim-dong, Kwanak-gu, Seoul 151-742, Korea (e-mails: [email protected], [email protected]).
Peter Drucker, suggests that Knowledge is now becoming the one factor of production, sidelining both capital and labor [2].
The "knowledge-based economy" was defined by the OECD as an economy which is "directly based on the production, distribution and use of knowledge and information" [3]. The Asia-Pacific Economic Cooperation (APEC) Economic Committee defined knowledge based economy as "the production, distribution and use of knowledge is the main driver of growth, wealth creation and employment across all industries" [4].
The Knowledge Economy is emerging from two defining forces: the rise in knowledge intensity of economic activities, and the increasing globalization of economic affairs. The rise in knowledge intensity is being driven by the combined forces of the information technology revolution and the increasing pace of technological change. Globalization is being driven by national and international deregulation, and by the IT related communications revolution. However, it is important to note that the term ‘Knowledge Economy’ refers to the overall economic structure that is emerging, not to any one, or combination of these phenomena [5]. Investment in knowledge raises economic efficiency and economic growth will provide technology development and the grounds for higher employment.
With analyze and identify the role of the knowledge investment and understand the essential of investment in knowledge as most characteristic structure for knowledge economy, we can characterize the different significant aspect of knowledge investment.
III. KNOWLEDGE INVESTMENT AND PRODUCTIVITY RETURNS The United States and Japan are moving more rapidly
towards a knowledge-based economy than the EU, since 1994, their investment in knowledge to GDP ratios have grown at a higher rate than that of the EU. For all the countries, except Ireland, the ratio of investment in knowledge-to-GDP was higher in 2002 than in 1994.
For most countries, increases in software expenditure were the major source of increased investment in knowledge. Notable exceptions are Finland (where R&D was the main source of increase) and Greece (where higher education and software were the main sources of increase). In 2002, investment in knowledge amounted to 5.2% of GDP in the OECD area, a share that has increased over time. In 2002, the United States invested 6.6% of GDP in knowledge, Japan 5.0% and the European Union 3.8%. Like the United States,
Analysis of Investment in Knowledge inside OECD Countries JunSeok Hwang, and Mohsen Gerami
I
World Academy of Science, Engineering and Technology 1 2007
102

Sweden and Finland also invested more than 6% of GDP in knowledge in 2002, while less than 2% of GDP was invested in knowledge in Portugal and Greece [6].
The Lisbon agenda set the EU the goal of becoming “the most dynamic knowledge-based economy in the world”. To reach this goal greater investment in knowledge and ICT capital is required.
We consider IT investment, communications investment, R&D and higher education as different forms of “knowledge”. Whilst R&D and higher education are conventionally thought of as knowledge investments, IT (software and hardware) embodies human capital and technical change in capital goods, and communications investment facilitates the flow of information and is subject to network effects. Knowledge is also endogenous in the sense that its production should respond to incentives. If ICT investment, communications investment, R&D or higher education offer high returns then investment should increase. A lack of knowledge investment is therefore a symptom of low returns to knowledge in an economy, or barriers to knowledge acquisition, which may have their roots in policy constraints [7].
IV. MEASURING THE GROWTH OF KNOWLEDGE INVESTMENT Managing growth of knowledge investment is an important
mission for each country. Well planned managing growth of knowledge investment produces a comprehensive picture of intangible assets.
We determine the annual growth of knowledge investment in selected OECD countries (because of lack of data) during 1994-2002. The annual growth of investment in knowledge as percentage of GDP is not all the time positive in every country. As we see in table below except Germany, Japan and Spain, at least one time was investment undersized than previous year and in some countries like Ireland and United Kingdom it happened 5 times during 9 years. It means increasing investment in knowledge is critical in OECD countries and it did not find the acceptable state in each country.
TABLE I GROWTH OF INVESTMENT IN KNOWLEDGE AS A PERCENTAGE OF GDP
If we analyze the growth of investment in knowledge in
more detail, we see in table below, maximum and minimum growth investment in knowledge during 1994-2002. The Denmark had in 3 period maximum growth investments between selected OECD countries. The Canada, United States and Austria each one 2 period had minimum growth investment. The Austria and Denmark had maximum growth percent of GDP investment with %0.71 and the United States with %-0.35 and Canada and United Kingdom with %-0.20 had minimum growth percent of GDP investment.
TABLE II MAXIMUM AND MINIMUM OF ANNUAL GROWTH INVESTMENT IN KNOWLEDGE
%GDP
In table below shows the Nordic countries (Denmark, Sweden and Finland) and United States had maximum average annual growth investment and Austria, United Kingdom; Canada and Ireland had minimum average of annual growth investment. The United States and Nordic countries (Sweden, Finland and Denmark) plus Korea had maximum average annual investment and Italy, Portugal and Greece had minimum average of annual investment. In both table the United States and Nordic countries (Sweden, Finland and Denmark) plus Japan and Korea are in the top of tables. It
World Academy of Science, Engineering and Technology 1 2007
103

means investment in knowledge in these countries is well programmed and there exit a parallel relationship between average annual growth and average annual investment. In other hand we see Canada is in one table between bottom countries of table (average of annual growth investment) and in other table (average of annual investment) Canada is between top countries of table. It shows that government and public sector in Canada have not a specific program for investment in knowledge and many uncertain variables decides for this investment.
TABLE III AVERAGE OF ANNUAL INVESTMENT IN KNOWLEDGE AS A PERCENTAGE OF
GDP
V. THE SHARE OF INVESTMENT IN KNOWLEDGE IN TOTAL OECD
When we examine region investment in knowledge development on a timeline we can see the portion of every country in create total investment in knowledge in this region. There are a big variety of policy instruments that can affect the share of investment in knowledge. Well designed knowledge investment policies improve the share of country in whole of region.
In table blew we can see influence of each country in total investment in knowledge during our selected time period in this region (selected OECD countries).
TABLE IV THE SHARE OF INVESTMENT IN KNOWLEDGE IN TOTAL OECD
During 1994-2000 the United States and Sweden and in
2001-2002 Sweden and United States had maximum portion of investment in knowledge in this region and during this time period Italy and Portugal and Greece take smallest portion of investment in this region.
VI. INVESTMENT IN KNOWLEDGE AND REAL GDP GROWTH RATE
Gross domestic product (GDP) is a broad measure of economic activity. Growth of real GDP, i.e. ignoring price changes, is widely used to assess governments’ performance in managing their economies.
Real growth rates are obtained by converting GDP to constant prices and calculating the change from year to year.
Ireland and Korea substantially outperformed the average with annual growth of over 5%. Growth rates in Ireland were particularly impressive between 1995 and 2000 - the so-called Celtic Tiger period. Korea’s growth was badly affected by the financial crisis in Asia; real GDP fell by nearly 7% in 1998 but Korea has since returned to high rates of growth [8].
We consider knowledge investment as input and real GDP growth as output. It demonstrates in table below the average of investment in knowledge and average of real GDP growth in each country during 1994-2002. We determine relative efficiency for supply GDP growth rates.
World Academy of Science, Engineering and Technology 1 2007
104

TABLE V AVERAGE OF GDP GROWTH RATES WITH AVERAGE INVESTMENT IN
KNOWLEDGE AND RELATIVE EFFICIENCY
In figure below we can see the relative efficiency of
average GDP growth rates with average investment in knowledge during 1994-2002 in selected OECD countries. Ireland and Greece and Portugal have the maximum relative efficiency. It means Ireland, Greece and Portugal have with minimum investment in knowledge become maximum GDP growth rates. At the other end of graph, the largest OECD economies – United States, Germany, and Japan – recorded lowest efficiency over the period.
Fig. 1 Relative efficiency of average GDP growth rates with average
Investment in knowledge as %GDP (1994-2002)
VII. INVESTMENT IN KNOWLEDGE AND MULTI-FACTOR PRODUCTIVITY
Multi-factor productivity (MFP) measures output to a combined set of two or more factor inputs, usually labour and capital. A change in MFP measures the change in output that cannot be accounted for by the change in combined inputs. As a result, MFP measures reflect the combined effects of factors such as technical progress, improvements in management practices, better organisation of the shop floor, and the diffusion of technology across firms.
The economics literature has generally referred to MFP as total factor productivity (or TFP). However, term TFP suggests that all factors of production are accounted for in the measurement of productivity or economic efficiency. In practice, however, statistical estimates of overall economic efficiency are computed on the basis of the two main factors of production, ie labour and capital [9].
The growing role of knowledge is reflected in economic performance. Trade in high-technology goods, such as aircraft, computers, pharmaceuticals and scientific instruments, accounted for over 25% of total trade in 2000 and 2001, up from less than 20% in the early 1990s. Stronger growth in some OECD countries over the 1990s is due to several factors, including higher labour utilisation, capital deepening, notably in ICT, and more rapid multi-factor productivity growth. Investment in ICT accounted for between 0.35 and 0.8 percentage points of growth in GDP over 1995-2001.
Some OECD economies have performed better than others. In Australia, Canada, Finland, Ireland and the United States, the overall efficiency of capital and labour – multi-factor productivity (MFP) – increased considerably over the 1990s, partly thanks to rapid technological progress and the effective use of ICT [10].
Investment in knowledge is a significant factor for promotion productivity growth. The chart below illustrates the strong correlation between average annual growth in multifactor productivity and average annual investment in knowledge as %GDP during 1994-2002 in selected OECD countries.
Fig. 2 Average annual growth MFP & Average annual Investment
in knowledge as %GDP (1994-2002)
World Academy of Science, Engineering and Technology 1 2007
105
VIII. PATENTING, WHICH IS A MEASURE OF INNOVATION OECD data on patent families (a set of patents filed in
various countries to protect a single invention) show the existence of more than 40 000 patent families in 1998 in the OECD area, a 32% increase from 1991. The United States accounted for around 36%, followed by the European Union (33%) and Japan (25%). Biotechnology and ICT have been among the main growth areas. On average, biotechnology patents filed at the European Patent Office (EPO) increased about 9.9% a year compared to 6.7% for total patents. ICT-related patent applications grew by 8.9% a year over the same period.
Over the 1990s the European Union‘s share of patent families converged towards that of the United States, while that of Japan declined by 4 percentage points. Korea had the highest annual growth in patent families at more than 20%. When population is taken into account, Switzerland and Sweden had the highest propensity to patent among OECD countries [10].
A central element of the Lisbon strategy is to promote innovation and knowledge, which are decisive factors for the European economy’s long-term success. To make Europe even more attractive for researchers, scientists and industry, a raft of measures has been adopted with the aim of boosting research and development. Firms must innovate to compete effectively and capture new markets. That makes knowledge – the prerequisite for innovation – also a decisive factor for the future of Europe. Increase the store of practical knowledge and you prompt innovation, and so add value for society [11].
Triadic patent families are a set of patents taken at all three of these major patent offices – the European Patent Office (EPO), the Japanese Patent Office (JPO) and the United States Patent and Trademark Office (USPTO) [1]. We use the number of triadic patent families in OECD countries during 1994-2002 for our estimate.
Knowledge is a key driver of innovation. Investment in knowledge improves authority of intangible asses and creates novelty. The Patent protects intellectual property and therefore gives it commercial value. We consider knowledge investment as input for innovation and numbers of patent as output. It demonstrates in table below the average of investment in knowledge and average of patent numbers in each country during 1994-2002. We determine relative efficiency for provided numbers of patent.
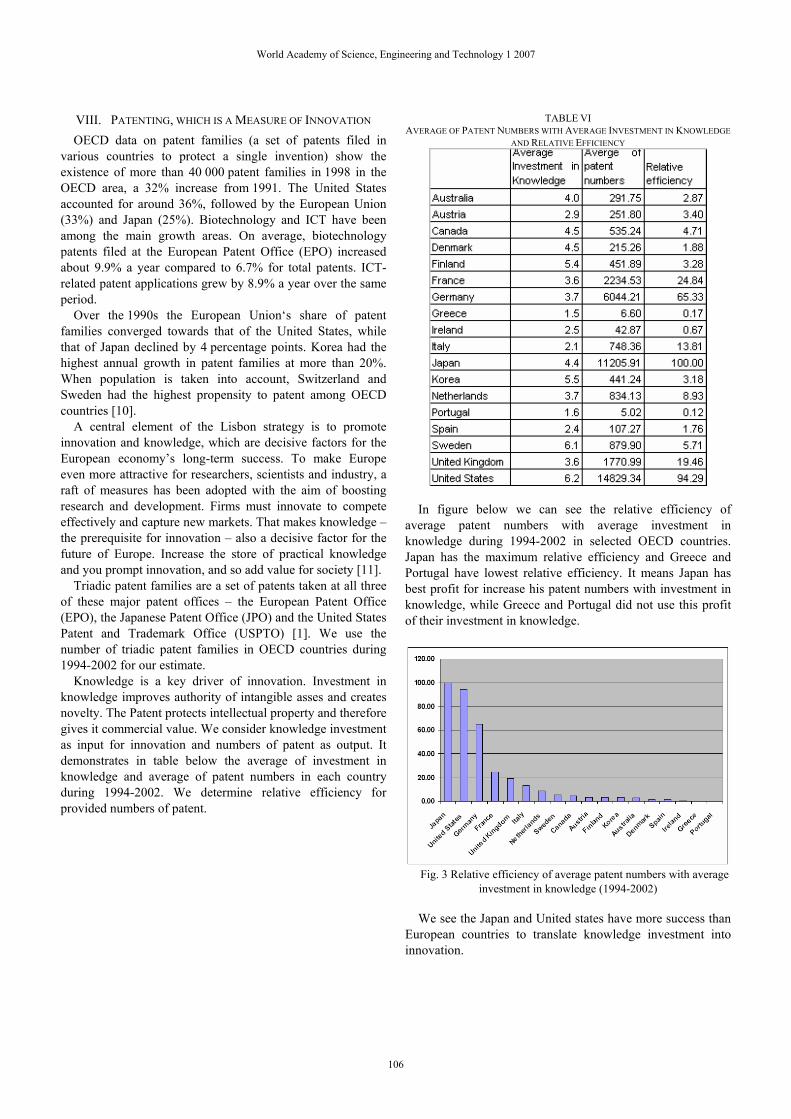
TABLE VI AVERAGE OF PATENT NUMBERS WITH AVERAGE INVESTMENT IN KNOWLEDGE
AND RELATIVE EFFICIENCY
In figure below we can see the relative efficiency of average patent numbers with average investment in knowledge during 1994-2002 in selected OECD countries. Japan has the maximum relative efficiency and Greece and Portugal have lowest relative efficiency. It means Japan has best profit for increase his patent numbers with investment in knowledge, while Greece and Portugal did not use this profit of their investment in knowledge.
Fig. 3 Relative efficiency of average patent numbers with average
investment in knowledge (1994-2002)
We see the Japan and United states have more success than European countries to translate knowledge investment into innovation.
World Academy of Science, Engineering and Technology 1 2007
106

IX. CONCLUSION Appropriate targets of investment in knowledge in each
country raise efficiency of multi factor productivity and innovation process.
A statistical analysis of the investment in knowledge during 1994-2002, shows that United States has the higher average investment in knowledge than European countries.
This study also indicates that investment in knowledge has a well-built relation with multifactor productivity and patent numbers. Positive annual growth of knowledge investment has an impact on other knowledge economy’s factors.
REFERENCES [1] OECD, 2005, OECD Science, Technology and Industry Scoreboard,
OECD, Paris. [2] P. Drucker, 'From capitalism to knowledge society' in D. Neef (ed.) The
Knowledge Economy, (Woburn MA: Butterworth) 1998, p.15 [3] OECD 1996, The Knowledge-based Economy, Paris [4] APEC Economic Committee 2000, Towards Knowledge-based
Economies in APEC, [5] P. Sheehan, and G. Tegart, (Eds.) 1998, Working for the Future:
Technology and Employment in the Global Knowledge Economy, Victoria University Press.
[6] Science and technology, research and development, 2006, OECD, [7] Restoring European economic and social progress: unleashing the
potential of ICT, 2006, Indepen January 2006 [8] OECD 2005, National Accounts of OECD Countries, OECD, Paris [9] Multi- (or Total) factor productivity trends, 1980-1998, 2002, Wong ST,
B Sim - Statistics Singapore Newsletter, Papers & Analyses- singstat.gov.sg
[10] OECD Science, Technology and Industry Scoreboard 2003 - Towards a knowledge-based economy
[11] European Patent Office, 2005, Innovation-Patent-Idea, EPO Information Day at the European Parliament Brussels, events.european-patent-office.org/2005/0330/_pdf/epo_informationday_brochure_20050330.pdf
World Academy of Science, Engineering and Technology 1 2007
107