optimation parameters of cnc milling programming machine ...
Upload
independentCategory
view
3download
0
This article was downloaded by: [Indian Institute of Technology -Kharagpur]On: 16 October 2012, At: 21:45Publisher: Taylor & FrancisInforma Ltd Registered in England and Wales Registered Number:1072954 Registered office: Mortimer House, 37-41 Mortimer Street,London W1T 3JH, UK
International Journal ofProduction ResearchPublication details, including instructions forauthors and subscription information:http://www.tandfonline.com/loi/tprs20
Fuzzy controlledbackpropagation neuralnetwork for tool conditionmonitoring in face millingR. K. Dutta, S. Paul & A.B. Chattopadhyay
Version of record first published: 14 Nov 2010.
To cite this article: R. K. Dutta, S. Paul & A.B. Chattopadhyay (2000): Fuzzycontrolled backpropagation neural network for tool condition monitoring in facemilling, International Journal of Production Research, 38:13, 2989-3010
To link to this article: http://dx.doi.org/10.1080/00207540050117404
PLEASE SCROLL DOWN FOR ARTICLE
Full terms and conditions of use: http://www.tandfonline.com/page/terms-and-conditions
This article may be used for research, teaching, and private studypurposes. Any substantial or systematic reproduction, redistribution,reselling, loan, sub-licensing, systematic supply, or distribution in anyform to anyone is expressly forbidden.
The publisher does not give any warranty express or implied or makeany representation that the contents will be complete or accurateor up to date. The accuracy of any instructions, formulae, and drugdoses should be independently verified with primary sources. Thepublisher shall not be liable for any loss, actions, claims, proceedings,demand, or costs or damages whatsoever or howsoever caused arising

directly or indirectly in connection with or arising out of the use of thismaterial.
Dow
nloa
ded
by [
Indi
an I
nstit
ute
of T
echn
olog
y -
Kha
ragp
ur]
at 2
1:45
16
Oct
ober
201
2
INT. J. PROD. RES., 2000, VOL. 38, NO. 13, 2989 ± 3010
Fuzzy controlled backpropagation neural network for tool conditionmonitoring in face milling
R. K. DUTTAy, S. PAULz* and A. B. CHATTOPADHYAY{
The performance of a fuzzy controlled backpropagation neural network has beenstudied to predict the tool wear in a face milling process based on simple processparameters and sensor signal features. The results show the potentiality of themethod in comparison to the standard backpropagation neural network and oneof its variants. The speed of convergence, accuracy of prediction and total time ofsystem development make fuzzy controlled backpropagation an attractive tech-nique amenable for online tool condition monitoring.
1. IntroductionIn view of the developments in automated manufacturing processes and advance-
ments in the design and technology of cutting tools, much emphasis has been givento tool condition monitoring (TCM) for enhanced productivity to eliminate down-time and improve the quality and reliability of the manufactured products. A litera-ture survey reveals that much of the work on TCM is being done in the ® eld ofturning, drilling and milling including abrasive processes like grinding (Byrne et al.1995, Dimla et al. 1997). Face milling is an intermittent cutting process and needsspecial attention. Usually tungsten carbide inserts are used in face milling of steel.Carbide tools are brittle in nature. Gradual wear at the ¯ ank, face and cutting edgejunctions are accompanied by chipping, mechanical and thermal fatigue cracks aswell as by catastrophic failures due to entry impact and foot formation at the exit(Pekelhering 1984, van Luttervelt et al. 1984, Lee et al. 1984, Ramaraj et al. 1988).Thus, prediction of the tool life of face milling inserts is di� cult as the scatter in toollife is considerably high. For this reason, conventional methods for predicting toollife in face milling have limited accuracy, and so robust decision systems based onintelligent learning paradigms are plausible alternatives.
Current research in TCM is directed towards the development of online TCMpolicies. Indirect sensing of machining responses and process parameters sensitive totool failure is becoming a common practice, although direct measurement of toolfailures is also possible. However, generally direct measurements are avoidedbecause of di� culty of online measurements. For indirect methods of TCM, thefollowing steps are followed in general:
(a) use of single or multiple sensors to capture process information;
International Journal of Production Research ISSN 0020± 7543 print/ISSN 1366± 588X online # 2000 Taylor & Francis Ltdhttp://www.tandf.co.uk/journals
Revision received December 1999.{ Department of Mechanical Engineering, Assam Engineering College, Guwahati 781 013,
Assam, India.{ Department of Mechanical Engineering, IIT Kharagpur, West Bengal 721 302, India.* To whom correspondence should be addressed. e-mail: [email protected]
Dow
nloa
ded
by [
Indi
an I
nstit
ute
of T
echn
olog
y -
Kha
ragp
ur]
at 2
1:45
16
Oct
ober
201
2
(b) use of signal processing methods to extract features from the sensor infor-mation ;
(c) use of decision-making strategy to utilise extracted features for prediction oftool failure.
A variety of sensors are employed, among which cutting forces, vibration and acous-tic emission (AE) sensors have been reported for frequent use. Force sensors are usedto observe the cutting forces in one or more of the three orthogonal directions asreported for turning (Gong et al. 1997, Lee et al. 1998, Puroshothaman and Srinivasa1998) , drilling (Noori-Khajavi et al. 1995 a, b), face milling (Ko et al. 1995, Ko andCho 1994, Lin and Lin 1996, Lin and Yang 1995, Tarng et al. 1994), etc. Vibrationsensors are used to monitor the signal characteristics due to built-up edge formation,chip breaking, increased rubbing at tool ¯ ank, etc. (El Wardany et al. 1996, Ko andCho 1994, Tansel 1994) . AE sensors enable accurate detection of tool fracture,chipping and chip formation mode as reported in a number of cases (Azoui andGuillot 1997, Jemielniek and Otman 1998) . Sensors for detecting torque/current/power/strain (Noori-Khajavi et al. 1995 a, b), temperature (Chryssolouris et al.1992) and tool de¯ ection (Azoui and Guillot 1997) are also used. Moreover, variousprocess parameters such as speed/cutting velocity, feed, depth of cut, roughness, chipcharacteristics, tool/job dimensions and tool image data have been considered asfeatures of TCM strategies.
The recent trend in TCM is multisensory approach which is termed as sensorfusion/sensor integration/sensor synthesis etc. in literature (Byrne et al. 1995). Theidea behind sensor fusion is to gather information from several sensors to make acomprehensive estimate of the observed parameter with the notion that failure of asensor to capture any phenomenon related to tool wear would be captured or sup-plemented by the rest. Sensor fusion calls for signal processing techniques as wellas for a medium to merge the processed informations for estimating the observedparameter.
Analysis of sensor signals to extract features and subsequent decision making aredone by a variety of methods such as statistical methods (Jemielniek and Otman1998, Puroshothaman and Srinivasa 1994) , spectral analysis (Noori-Khajavi 1995 a),statistical model based approaches such as regression and group method of datahandling (Kuo and Kohen 1999, Youn et al. 1994) , time series analysis (Ko and Cho1994, Lee et al. 1995) , wavelet transformation (Gong et al. 1997, Hong et al. 1996,Tansel et al. 1995), process models (Chryssolouris et al. 1992), fuzzy set theory (Duet al. 1992) , pattern classi® ers (Kumar et al. 1997) , etc.
1.1. Problem de® nitionIn the present study, the application of fuzzy controlled backpropagation
(FBPNN) for predicting the wear of tungsten carbide inserts in the face milling ofsteel has been proposed by multi-sensory approach.
For this purpose, a typical TCM system is schematically shown in ® gure 1, wherethe sensors are used to collect the signals during machining through a data acquisi-tion system. The signal processing module analyses the machining signals for extract-ing relevant features sensitive to tool wear. The features, along with the processparameters, constitute the data sets to be used as input to the decision system.The main purpose of the decision system is to map the input features to the currentstate of tool, i.e. the amount of tool wear.
2990 R. K. Dutta et al.
Dow
nloa
ded
by [
Indi
an I
nstit
ute
of T
echn
olog
y -
Kha
ragp
ur]
at 2
1:45
16
Oct
ober
201
2
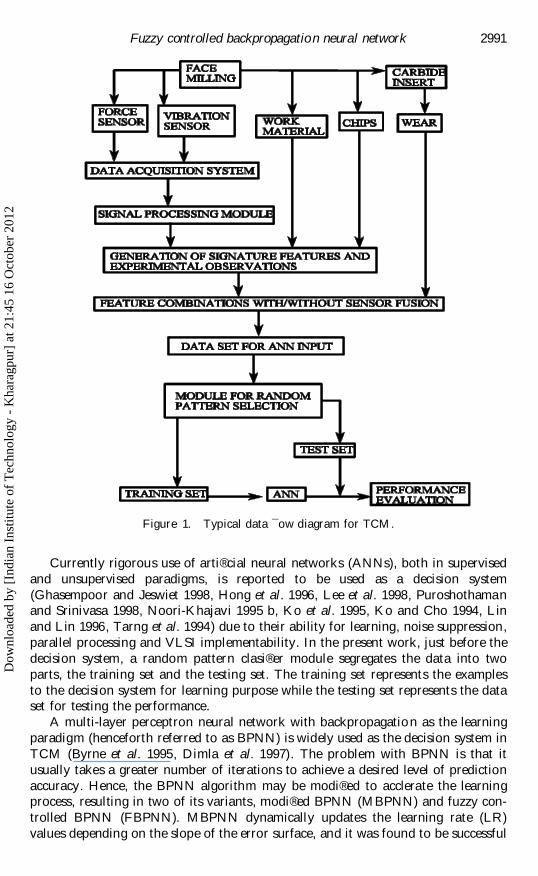
Currently rigorous use of arti® cial neural networks (ANNs), both in supervisedand unsupervised paradigms, is reported to be used as a decision system(Ghasempoor and Jeswiet 1998, Hong et al. 1996, Lee et al. 1998, Puroshothamanand Srinivasa 1998, Noori-Khajavi 1995 b, Ko et al. 1995, Ko and Cho 1994, Linand Lin 1996, Tarng et al. 1994) due to their ability for learning, noise suppression,parallel processing and VLSI implementability. In the present work, just before thedecision system, a random pattern clasi® er module segregates the data into twoparts, the training set and the testing set. The training set represents the examplesto the decision system for learning purpose while the testing set represents the dataset for testing the performance.
A multi-layer perceptron neural network with backpropagation as the learningparadigm (henceforth referred to as BPNN) is widely used as the decision system inTCM (Byrne et al. 1995, Dimla et al. 1997) . The problem with BPNN is that itusually takes a greater number of iterations to achieve a desired level of predictionaccuracy. Hence, the BPNN algorithm may be modi® ed to acclerate the learningprocess, resulting in two of its variants, modi® ed BPNN (MBPNN) and fuzzy con-trolled BPNN (FBPNN). MBPNN dynamically updates the learning rate (LR)values depending on the slope of the error surface, and it was found to be successful
2991Fuzzy controlled backpropagation neural network
Figure 1. Typical data ¯ ow diagram for TCM.
Dow
nloa
ded
by [
Indi
an I
nstit
ute
of T
echn
olog
y -
Kha
ragp
ur]
at 2
1:45
16
Oct
ober
201
2
in reducing the number of iterations (Dutta et al. 1998) . In FBPNN, changes in boththe LR and MP values are dictated by a fuzzy logic controller where they arechanged with respect to the change of error representing the slope of the error sur-face and change in the change of error representing the accleration of convergence(Haykin 1998) . The present work proposes to test the e� cacy of the FBPNN algor-ithm as a faster learning scheme applicable to on-line TCM in face milling operation.
2. Objective of the present work
The objectives of the present study are:
(a) development of fuzzy controlled backpropagation neural network (FBPNN)(b) study of the performance of (FBPNN) for TCM in face milling in
comparison to(i) standard backpropagation neural network (BPNN)(ii) modi® ed backpropagation neural network (MBPNN).
3. Theory of fuzzy controlled backpropagatio n (FBPNN)
FBPNN is basically the implementation of the BPNN algorithm through a fuzzylogic controlled rule base which determines the learning rate (LR) and momentumparameter (MP) to accelerate the convergence in the learning process (Haykin 1998) .Fuzzy set theory is a mathematical tool which deals with linguistic variables. A fuzzyset does not contain its values within sharp boundaries. If X is a universal set wherethe elements are denoted by x, then a fuzzy set A is characterised by membershipfunction mA (x) which maps the universal set X into the real interval (0, 1). The closermA (x) is to unity, the more x belongs to A showing the degree of compatibility. Theoperators of union ([), intersection (\) and complement for fuzzy sets are wellde® ned. For example, for two fuzzy sets A and B with membership functionsmA (x) and mB (x), the following relations hold:
mA[B…x† ˆ Max…mA…x†; mB…x†† …1†
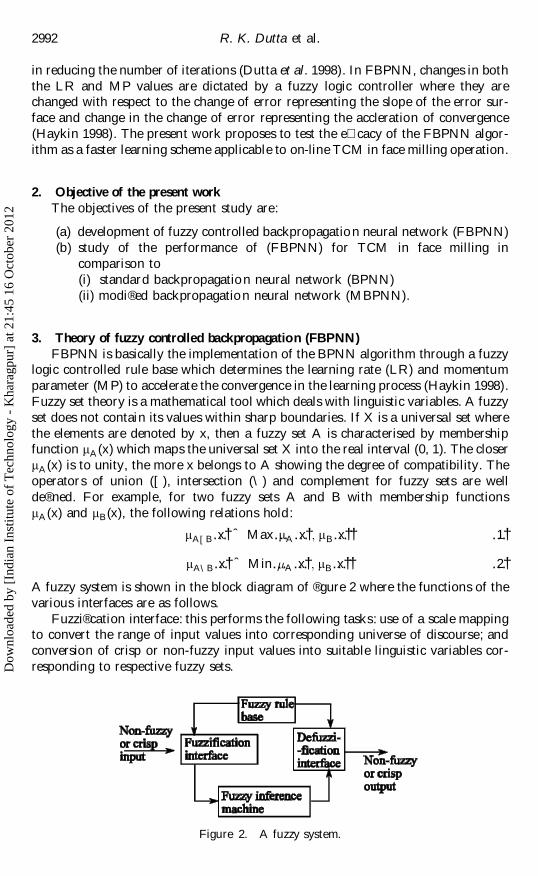
mA\B…x† ˆ Min…·A…x†; mB…x†† …2†A fuzzy system is shown in the block diagram of ® gure 2 where the functions of thevarious interfaces are as follows.
Fuzzi® cation interface: this performs the following tasks: use of a scale mappingto convert the range of input values into corresponding universe of discourse; andconversion of crisp or non-fuzzy input values into suitable linguistic variables cor-responding to respective fuzzy sets.
2992 R. K. Dutta et al.
Figure 2. A fuzzy system.
Dow
nloa
ded
by [
Indi
an I
nstit
ute
of T
echn
olog
y -
Kha
ragp
ur]
at 2
1:45
16
Oct
ober
201
2
Fuzzy rule base : this consists of a set of linguistic rules for controlling the con-sequences of an event depending upon certain antecedents. A typical control rule isas follows: If a set of conditions are satis® ed, then a set of consequences may beinferred’ .
Fuzzy inference machine: this contains the decision-making logic and uses thecontrol rules of the fuzzy rule base in response to fuzzi® ed inputs.
Defuzzi® cation interface: the functions are: the use of a scale mapping to convertrange of output values into corresponding universe of discourse; and performing theoperation of defuzzi® cation to produce a non-fuzzy output with respect to aninferred control action.
A commonly used defuzzi® cation process is by the use of the Centroid method,where the crisp output is calculated on the basis of the centre of gravity of thedistribution of possible actions (Kosko 1992) .
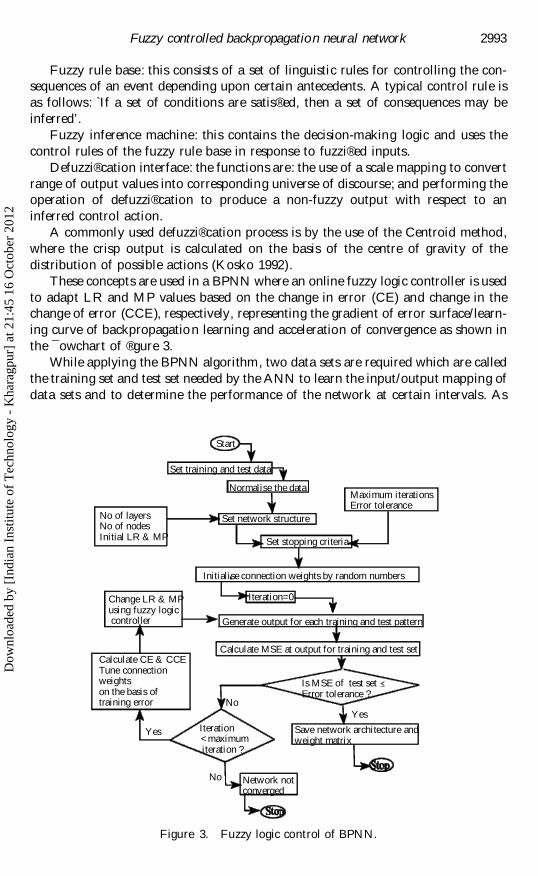
These concepts are used in a BPNN where an online fuzzy logic controller is usedto adapt LR and MP values based on the change in error (CE) and change in thechange of error (CCE), respectively, representing the gradient of error surface/learn-ing curve of backpropagation learning and acceleration of convergence as shown inthe ¯ owchart of ® gure 3.
While applying the BPNN algorithm, two data sets are required which are calledthe training set and test set needed by the ANN to learn the input/output mapping ofdata sets and to determine the performance of the network at certain intervals. As
2993Fuzzy controlled backpropagation neural network
Start
Set training and test data
Normalise the data
Set network structure
Set stopping criteria
Initialise connection weights by random numbers
Iteration=0
Generate output for each training and test pattern
Calculate MSE at output for training and test set
Is MSE of test set Error tolerance ?
Yes
Save network architecture andweight matrix
No
Iteration < maximum iteration ?
Yes
No Network notconverged
Maximum iterationsError tolerance
Change LR & MPusing fuzzy logic controller
Calculate CE & CCETune connectionweightson the basis oftraining error
No of layersNo of nodesInitial LR & MP
Figure 3. Fuzzy logic control of BPNN.
Dow
nloa
ded
by [
Indi
an I
nstit
ute
of T
echn
olog
y -
Kha
ragp
ur]
at 2
1:45
16
Oct
ober
201
2
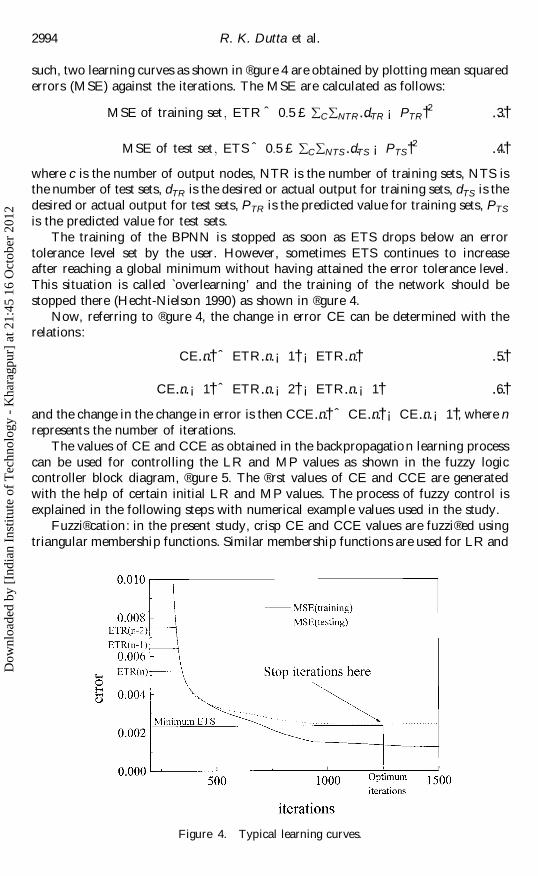
such, two learning curves as shown in ® gure 4 are obtained by plotting mean squarederrors (MSE) against the iterations. The MSE are calculated as follows:
MSE of training set ; ETR ˆ 0:5 £ å C å NT R…dTR ¡ PTR†2 …3†
MSE of test set ; ETS ˆ 0:5 £ å C å NTS…dTS ¡ PTS†2 …4†where c is the number of output nodes, NTR is the number of training sets, NTS isthe number of test sets, dTR is the desired or actual output for training sets, dTS is thedesired or actual output for test sets, PTR is the predicted value for training sets, PTSis the predicted value for test sets.
The training of the BPNN is stopped as soon as ETS drops below an errortolerance level set by the user. However, sometimes ETS continues to increaseafter reaching a global minimum without having attained the error tolerance level.This situation is called `overlearning’ and the training of the network should bestopped there (Hecht-Nielson 1990) as shown in ® gure 4.
Now, referring to ® gure 4, the change in error CE can be determined with therelations :
CE…n† ˆ ETR…n ¡ 1† ¡ ETR…n† …5†
CE…n ¡ 1† ˆ ETR…n ¡ 2† ¡ ETR…n ¡ 1† …6†and the change in the change in error is then CCE…n† ˆ CE…n† ¡ CE…n ¡ 1†, where nrepresents the number of iterations.
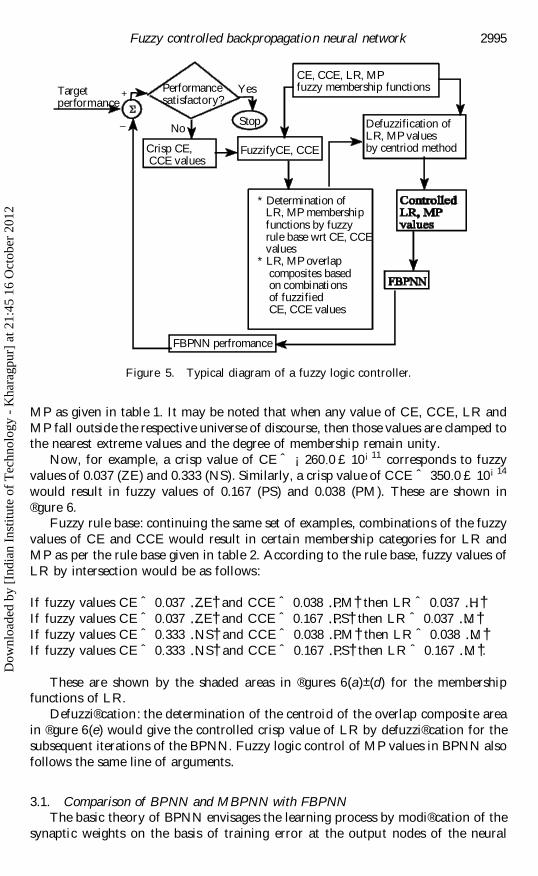
The values of CE and CCE as obtained in the backpropagation learning processcan be used for controlling the LR and MP values as shown in the fuzzy logiccontroller block diagram, ® gure 5. The ® rst values of CE and CCE are generatedwith the help of certain initial LR and MP values. The process of fuzzy control isexplained in the following steps with numerical example values used in the study.
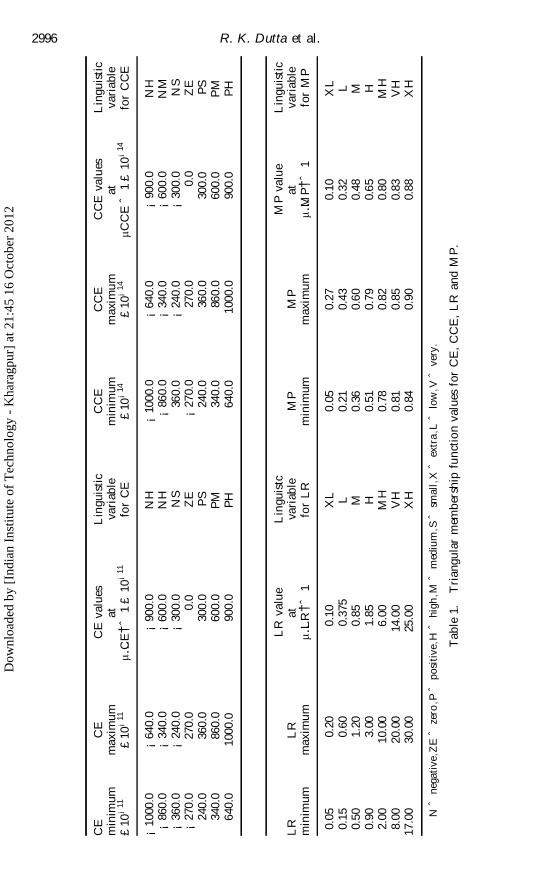
Fuzzi® cation: in the present study, crisp CE and CCE values are fuzzi® ed usingtriangular membership functions. Similar membership functions are used for LR and
2994 R. K. Dutta et al.
Figure 4. Typical learning curves.
Dow
nloa
ded
by [
Indi
an I
nstit
ute
of T
echn
olog
y -
Kha
ragp
ur]
at 2
1:45
16
Oct
ober
201
2
MP as given in table 1. It may be noted that when any value of CE, CCE, LR andMP fall outside the respective universe of discourse, then those values are clamped tothe nearest extreme values and the degree of membership remain unity.
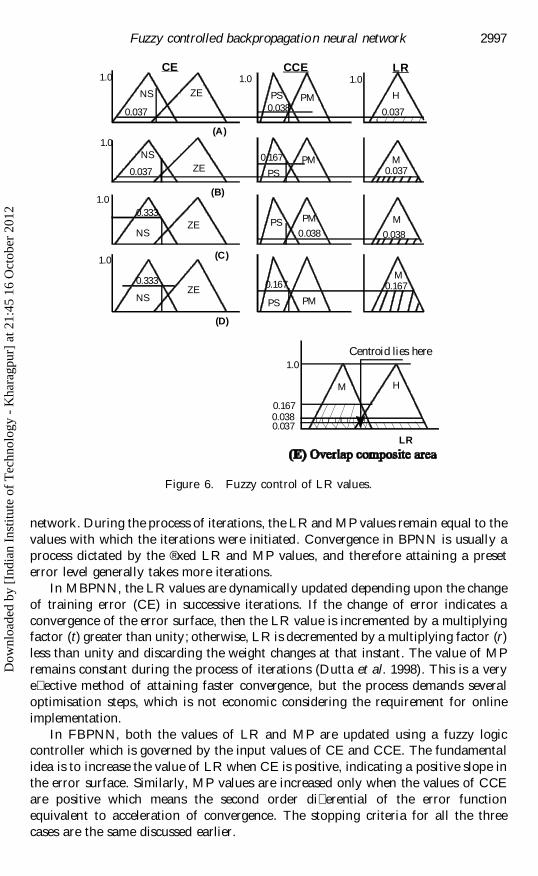
Now, for example, a crisp value of CE ˆ ¡260:0 £ 10¡11 corresponds to fuzzyvalues of 0.037 (ZE) and 0.333 (NS). Similarly, a crisp value of CCE ˆ 350:0 £ 10¡14
would result in fuzzy values of 0.167 (PS) and 0.038 (PM). These are shown in® gure 6.
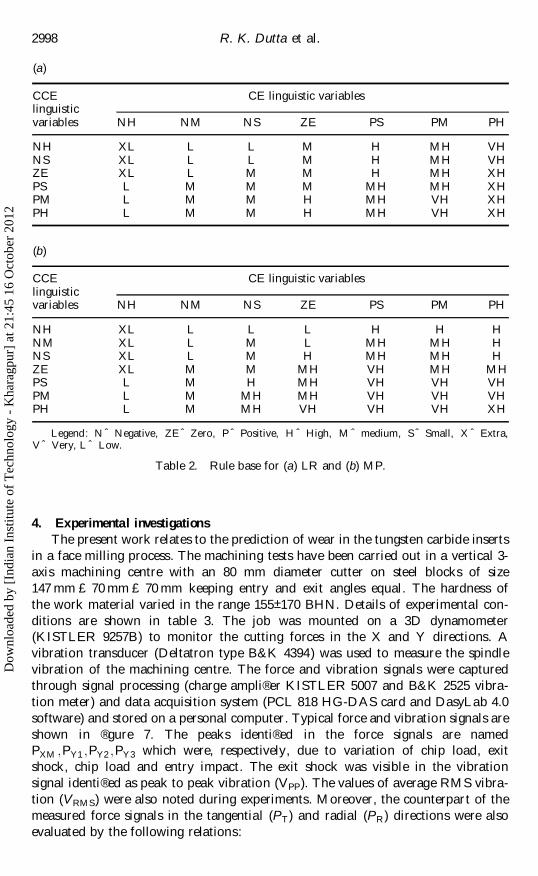
Fuzzy rule base: continuing the same set of examples, combinations of the fuzzyvalues of CE and CCE would result in certain membership categories for LR andMP as per the rule base given in table 2. According to the rule base, fuzzy values ofLR by intersection would be as follows:
If fuzzy values CE ˆ 0:037 …ZE† and CCE ˆ 0:038 …PM† then LR ˆ 0:037 …H†If fuzzy values CE ˆ 0:037 …ZE† and CCE ˆ 0:167 …PS† then LR ˆ 0:037 …M†If fuzzy values CE ˆ 0:333 …NS† and CCE ˆ 0:038 …PM† then LR ˆ 0:038 …M†If fuzzy values CE ˆ 0:333 …NS† and CCE ˆ 0:167 …PS† then LR ˆ 0:167 …M†.
These are shown by the shaded areas in ® gures 6(a) ± (d) for the membershipfunctions of LR.
Defuzzi® cation: the determination of the centroid of the overlap composite areain ® gure 6(e) would give the controlled crisp value of LR by defuzzi® cation for thesubsequent iterations of the BPNN. Fuzzy logic control of MP values in BPNN alsofollows the same line of arguments.
3.1. Comparison of BPNN and MBPNN with FBPNNThe basic theory of BPNN envisages the learning process by modi® cation of the
synaptic weights on the basis of training error at the output nodes of the neural
2995Fuzzy controlled backpropagation neural network
CE, CCE, LR, MPfuzzy membership functionsTarget
performance
Crisp CE, CCE values
FuzzifyCE, CCE
* Determination of LR, MP membership functions by fuzzy rule base wrt CE, CCE values* LR, MP overlap composites based
on combinationsof fuzzifiedCE, CCE values
Defuzzification ofLR, MP valuesby centriod method
FBPNN perfromance
_
+ Performancesatisfactory?
StopNo
Yes
Figure 5. Typical diagram of a fuzzy logic controller.
Dow
nloa
ded
by [
Indi
an I
nstit
ute
of T
echn
olog
y -
Kha
ragp
ur]
at 2
1:45
16
Oct
ober
201
2
2996 R. K. Dutta et al.
CE
CE
CE
valu
esL
ingu
isti
cC
CE
CC
EC
CE
valu
esL
ingu
isti
cm
inim
umm
axim
umat
vari
able
min
imum
max
imum
atva
riab
le£
10¡
11£
10¡
11m …
CE†ˆ
1£
10¡
11fo
rC
E£
10¡
14£
10¡
14m C
CE
ˆ1
£10
¡14
for
CC
E
¡10
00:0
¡64
0:0
¡90
0:0
NH
¡10
00:0
¡64
0:0
¡90
0:0
NH
¡86
0:0
¡34
0:0
¡60
0:0
NH
¡86
0:0
¡34
0:0
¡60
0:0
NM
¡36
0:0
¡24
0:0
¡30
0:0
NS
360:
0¡
240:
0¡
300:
0N
S¡
270:
027
0.0
0.0
ZE
¡27
0:0
270.
00.
0Z
E24
0.0
360.
030
0.0
PS
240.
036
0.0
300.
0P
S34
0.0
860.
060
0.0
PM
340.
086
0.0
600.
0P
M64
0.0
1000
.090
0.0
PH
640.
010
00.0
900.
0P
H
LR
valu
eL
ingu
istc
MP
valu
eL
ingu
isti
cL
RL
Rat
vari
able
MP
MP
atva
riab
lem
inim
umm
axim
umm …
LR
†ˆ1
for
LR
min
imum
max
imum
m …M
P†ˆ
1fo
rM
P
0.05
0.20
0.10
XL
0.05
0.27
0.10
XL
0.15
0.60
0.37
5L
0.21
0.43
0.32
L0.
501.
200.
85M
0.36
0.60
0.48
M0.
903.
001.
85H
0.51
0.79
0.65
H2.
0010
.00
6.00
MH
0.78
0.82
0.80
MH
8.00
20.0
014
.00
VH
0.81
0.85
0.83
VH
17.0
030
.00
25.0
0X
H0.
840.
900.
88X
H
Nˆ
nega
tive
;ZE
ˆze
ro;P
ˆpo
siti
ve;H
ˆhi
gh;M
ˆm
ediu
m;S
ˆsm
all;
Xˆ
extr
a;L
ˆlo
w;V
ˆve
ry.
Tab
le1.
Tri
angu
lar
mem
bers
hip
func
tion
valu
esfo
rC
E,
CC
E,
LR
and
MP
.
Dow
nloa
ded
by [
Indi
an I
nstit
ute
of T
echn
olog
y -
Kha
ragp
ur]
at 2
1:45
16
Oct
ober
201
2
network. During the process of iterations, the LR and MP values remain equal to thevalues with which the iterations were initiated. Convergence in BPNN is usually aprocess dictated by the ® xed LR and MP values, and therefore attaining a preseterror level generally takes more iterations.
In MBPNN, the LR values are dynamically updated depending upon the changeof training error (CE) in successive iterations. If the change of error indicates aconvergence of the error surface, then the LR value is incremented by a multiplyingfactor (t) greater than unity; otherwise, LR is decremented by a multiplying factor (r)less than unity and discarding the weight changes at that instant. The value of MPremains constant during the process of iterations (Dutta et al. 1998) . This is a verye� ective method of attaining faster convergence, but the process demands severaloptimisation steps, which is not economic considering the requirement for onlineimplementation.
In FBPNN, both the values of LR and MP are updated using a fuzzy logiccontroller which is governed by the input values of CE and CCE. The fundamentalidea is to increase the value of LR when CE is positive, indicating a positive slope inthe error surface. Similarly, MP values are increased only when the values of CCEare positive which means the second order di� erential of the error functionequivalent to acceleration of convergence. The stopping criteria for all the threecases are the same discussed earlier.
2997Fuzzy controlled backpropagation neural network
0.037 0.038
1.0 1.0 1.0
0.037
NS ZE PS PM H
0.1670.037
NSZE PS
PM M0.037
LRCE CCE
0.333
0.038 0.038
MPS PM
NSZE
0.1670.333
NSZE
PS PM
M0.167
(A)
(B)
(C)
(D)
0.1670.0380.037
M H
LR
1.0Centroid lies here
1.0
1.0
1.0
Figure 6. Fuzzy control of LR values.
Dow
nloa
ded
by [
Indi
an I
nstit
ute
of T
echn
olog
y -
Kha
ragp
ur]
at 2
1:45
16
Oct
ober
201
2
4. Experimental investigations
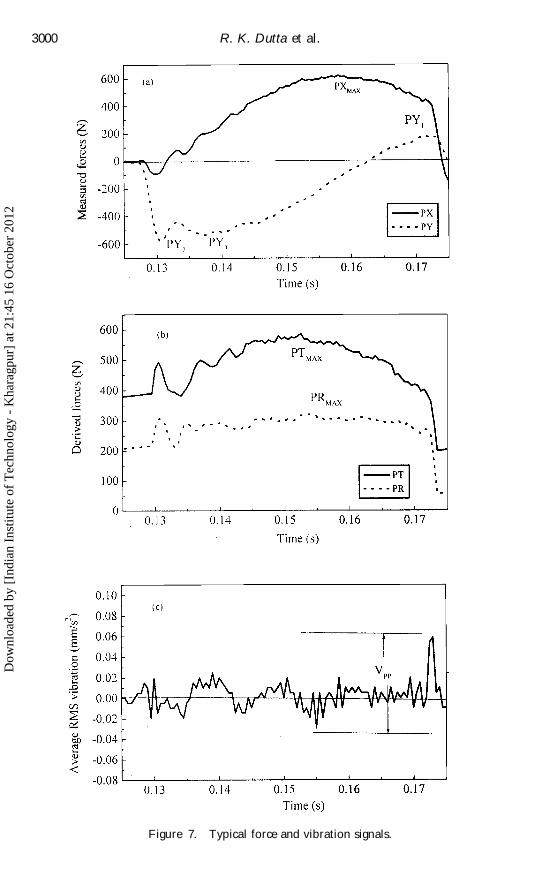
The present work relates to the prediction of wear in the tungsten carbide insertsin a face milling process. The machining tests have been carried out in a vertical 3-axis machining centre with an 80 mm diameter cutter on steel blocks of size147 mm £ 70 mm £ 70 mm keeping entry and exit angles equal. The hardness ofthe work material varied in the range 155± 170 BHN. Details of experimental con-ditions are shown in table 3. The job was mounted on a 3D dynamometer(KISTLER 9257B) to monitor the cutting forces in the X and Y directions. Avibration transducer (Deltatron type B&K 4394) was used to measure the spindlevibration of the machining centre. The force and vibration signals were capturedthrough signal processing (charge ampli® er KISTLER 5007 and B&K 2525 vibra-tion meter) and data acquisition system (PCL 818 HG-DAS card and DasyLab 4.0software) and stored on a personal computer. Typical force and vibration signals areshown in ® gure 7. The peaks identi® ed in the force signals are namedPXM ;PY1 ;PY2 ;PY3 which were, respectively, due to variation of chip load, exitshock, chip load and entry impact. The exit shock was visible in the vibrationsignal identi® ed as peak to peak vibration (VPP). The values of average RMS vibra-tion (V RMS) were also noted during experiments. Moreover, the counterpart of themeasured force signals in the tangential (PT) and radial (PR ) directions were alsoevaluated by the following relations:
2998 R. K. Dutta et al.
(a)
CCE CE linguistic variableslinguisticvariables NH NM NS ZE PS PM PH
NH XL L L M H MH VHNS XL L L M H MH VHZE XL L M M H MH XHPS L M M M MH MH XHPM L M M H MH VH XHPH L M M H MH VH XH
(b)
CCE CE linguistic variableslinguisticvariables NH NM NS ZE PS PM PH
NH XL L L L H H HNM XL L M L MH MH HNS XL L M H MH MH HZE XL M M MH VH MH MHPS L M H MH VH VH VHPM L M MH MH VH VH VHPH L M MH VH VH VH XH
Legend: N ˆ Negative, ZE ˆ Zero, Pˆ Positive, H ˆ High, M ˆ medium, S ˆ Small, X ˆ Extra,V ˆ Very, L ˆ Low.
Table 2. Rule base for (a) LR and (b) MP.
Dow
nloa
ded
by [
Indi
an I
nstit
ute
of T
echn
olog
y -
Kha
ragp
ur]
at 2
1:45
16
Oct
ober
201
2
PT ˆ PX cos ¿ ¡ PY sin ¿ …7†
PR ˆ ¡…PX sin ¿ ‡ PY cos ¿† …8†where ¿ is the instantaneous angle of engagement made by the cutting edge with theY direction and ¡61:058 µ 61:058.
The patterns of PT and PR are also shown in ® gure 7, where the peaks wereidenti® ed as PTM and PRM.
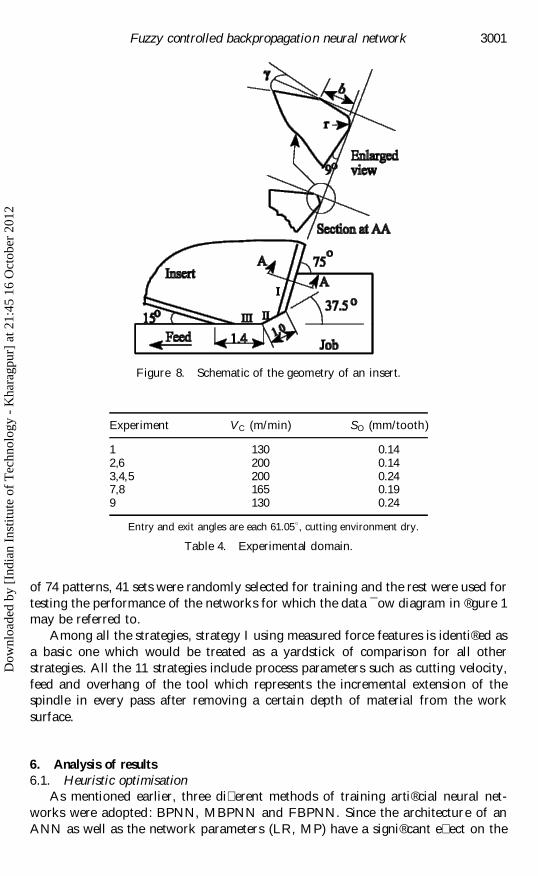
The tips of the uncoated tungsten carbide inserts being used for the face millingexperiment comprised three cutting edges, main, intermediate and planishing edgewith the main cutting edge bevelled and rounded for edge strength and better heatdissipation, as shown in ® gure 8. The wear at ¯ anks of all three cutting edges weremeasured at intervals during machining by a microscope (Olympus OSM 217437)having least count of 1 mm.
The experiments consisted of nine machining trials, details given in table 4, untilthe wear at the main cutting edge reached 300 mm. The planishing edge with a verysmall clearance angle attained apparently much wider ¯ ank wear due to rubbing withthe ® nished surface. Detailed study of the face milling inserts indicates similar obser-vations, and it was found that under the process of gradual wear, failure of the insertcan be declared on the basis of the limiting wear on the main cutting edge (Sikdar1993).
During all the trials, chip characteristics such as shape and colour were alsonoted and found to vary. Subjective ratings have been assigned to the chip charac-teristics in codi® ed form between 0 and 1.
5. Tool condition monitoring strategies
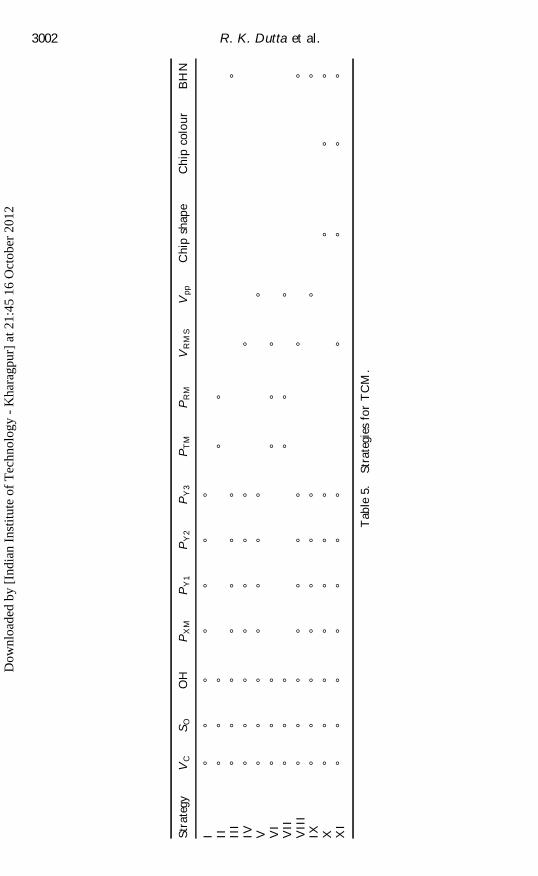
The present work, using a multisensory approach for TCM, aims at the identi-® cation of 11 strategies comprising sensor information and process parameters forthe prediction of wear of the face milling inserts. The strategies are presented in table5. The nine machining trials yielded 74 patterns of data sets for all the strategies. Out
2999Fuzzy controlled backpropagation neural network
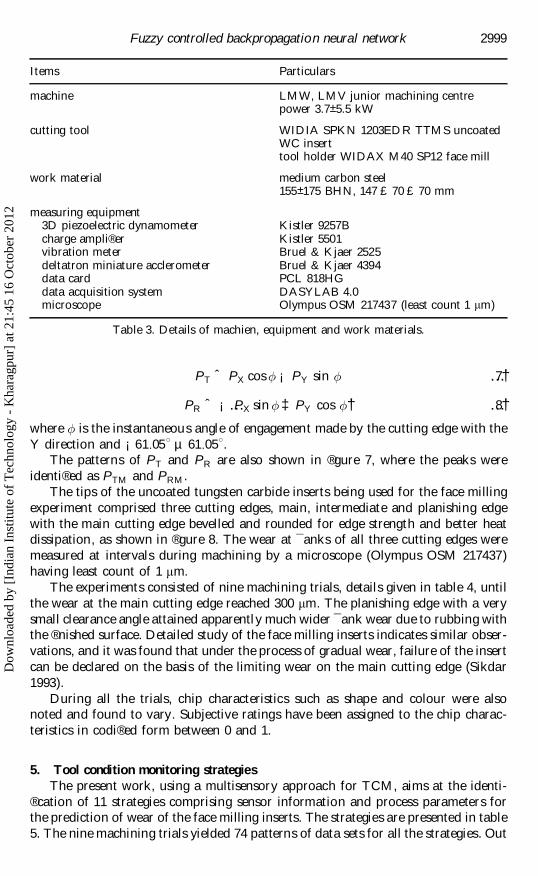
Items Particulars
machine LMW, LMV junior machining centrepower 3.7± 5.5 kW
cutting tool WIDIA SPKN 1203EDR TTMS uncoatedWC inserttool holder WIDAX M40 SP12 face mill
work material medium carbon steel155± 175 BHN, 147 £ 70 £ 70 mm
measuring equipment3D piezoelectric dynamometer Kistler 9257Bcharge ampli® er Kistler 5501vibration meter Bruel & Kjaer 2525deltatron miniature acclerometer Bruel & Kjaer 4394data card PCL 818HGdata acquisition system DASYLAB 4.0microscope Olympus OSM 217437 (least count 1 mm)
Table 3. Details of machien, equipment and work materials.
Dow
nloa
ded
by [
Indi
an I
nstit
ute
of T
echn
olog
y -
Kha
ragp
ur]
at 2
1:45
16
Oct
ober
201
2
3000 R. K. Dutta et al.
Figure 7. Typical force and vibration signals.
Dow
nloa
ded
by [
Indi
an I
nstit
ute
of T
echn
olog
y -
Kha
ragp
ur]
at 2
1:45
16
Oct
ober
201
2
of 74 patterns, 41 sets were randomly selected for training and the rest were used fortesting the performance of the networks for which the data ¯ ow diagram in ® gure 1may be referred to.
Among all the strategies, strategy I using measured force features is identi® ed asa basic one which would be treated as a yardstick of comparison for all otherstrategies. All the 11 strategies include process parameters such as cutting velocity,feed and overhang of the tool which represents the incremental extension of thespindle in every pass after removing a certain depth of material from the worksurface.
6. Analysis of results
6.1. Heuristic optimisationAs mentioned earlier, three di� erent methods of training arti® cial neural net-
works were adopted: BPNN, MBPNN and FBPNN. Since the architecture of anANN as well as the network parameters (LR, MP) have a signi® cant e� ect on the
3001Fuzzy controlled backpropagation neural network
Figure 8. Schematic of the geometry of an insert.
Experiment V C (m/min) SO (mm/tooth)
1 130 0.142,6 200 0.143,4,5 200 0.247,8 165 0.199 130 0.24
Entry and exit angles are each 61.058, cutting environment dry.
Table 4. Experimental domain.
Dow
nloa
ded
by [
Indi
an I
nstit
ute
of T
echn
olog
y -
Kha
ragp
ur]
at 2
1:45
16
Oct
ober
201
2
3002 R. K. Dutta et al.
Stra
tegy
VC
SO
OH
PX
MP
Y1
PY
2P
Y3
PT
MP
RM
VR
MS
Vpp
Chi
psh
ape
Chi
pco
lour
BH
N
I°
°°
°°
°°
II°
°°
°°
III
°°
°°
°°
°°
IV°
°°
°°
°°
°V
°°
°°
°°
°°
VI
°°
°°
°°
VII
°°
°°
°°
VII
I°
°°
°°
°°
°°
IX°
°°
°°
°°
°°
X°
°°
°°
°°
°°
°X
I°
°°
°°
°°
°°
°°
Tab
le5.
Stra
tegi
esfo
rT
CM
.
Dow
nloa
ded
by [
Indi
an I
nstit
ute
of T
echn
olog
y -
Kha
ragp
ur]
at 2
1:45
16
Oct
ober
201
2
3003Fuzzy controlled backpropagation neural networkT
able
6.
RM
S(%
)A
NN
Stra
tegy
Arc
hite
ctur
eL
RM
Pt
rE
TR
£10
¡3
ET
S£
10¡
3It
erat
ion
erro
r
(a)
BP
NN
I7-
7-1
1.50
0.90
ÐÐ
1.11
21.
6328
255.
709
II5-
9-1
2.20
0.90
ÐÐ
0.81
51.
6382
505.
708
III
8-17
-11.
100.
90Ð
Ð0.
991.
6346
155.
71
MP
PN
NI
7-7-
11.
100.
901.
010.
501.
145
1.62
656
55.
702
II5-
9-1
2.20
0.90
1.01
0.90
0.07
1.62
933
155.
078
III
8-17
-11.
150.
901.
000.
501.
144
1.63
3300
5.71
0
FB
PN
NI
7-6-
10.
300.
70Ð
Ð1.
102
1.62
992
05.
709
II5-
4-1
0.70
0.70
ÐÐ
0.08
21.
6363
155.
709
III
8-7-
10.
300.
90Ð
Ð0.
886
1.62
437
605.
7
(b)
BP
NN
IV8-
17-1
1.10
0.90
ÐÐ
1.28
21.
629
3115
5.70
9V
8-18
-11.
100.
90Ð
Ð1.
171
1.63
2785
5.70
9V
I6-
11-1
0.30
0.90
ÐÐ
1.14
2.36
415
000
6.87
6V
II6-
17-1
1.10
0.50
ÐÐ
1.35
12.
401
1500
06.
93
MB
PN
NIV
8-17
-10.
700.
901.
010.
901.
266
1.62
896
55.
705
V8-
18-1
1.12
0.90
1.01
0.80
1.30
31.
629
610
5.70
8V
I6-
11-1
0.90
0.90
1.04
0.70
0.46
21.
626
3660
5.70
3V
II6-
17-1
1.50
0.90
1.01
0.50
1.34
82.
424
1025
6.96
3
FB
PN
NIV
8-4-
10.
500.
90Ð
Ð1.
319
1.62
639
55.
702
V8-
3-1
0.05
0.70
ÐÐ
1.06
91.
738
415
5.89
6V
I6-
8-1
0.30
0.70
ÐÐ
0.19
52.
068
710
6.43
1V
II6-
6-1
0.05
0.70
ÐÐ
0.77
72.
021
755
6.35
8
(con
tinu
ed)
Dow
nloa
ded
by [
Indi
an I
nstit
ute
of T
echn
olog
y -
Kha
ragp
ur]
at 2
1:45
16
Oct
ober
201
2
3004 R. K. Dutta et al.R
MS
(%)
AN
NSt
rate
gyA
rchi
tect
ure
LR
MP
tr
ET
R£
10¡
3E
TS
£10
¡3
Iter
atio
ner
ror
(c)
BP
NN
VII
I9-
12-1
1.10
ÐÐ
1.12
1.81
41.
814
9090
6.02
3IX
9-12
-11.
100.
50Ð
Ð1.
248
1.74
992
355.
914
MB
NN
VII
I9-
12-1
0.99
0.90
1.01
0.80
1.15
61.
819
570
6.03
2IX
9-12
-11.
300.
901.
010.
801.
261.
7551
55.
916
FB
PN
NV
III
9-5-
10.
700.
10Ð
Ð1.
151
1.61
923
05.
689
IX9-
4-1
0.30
0.05
ÐÐ
1.20
71.
649
310
5.74
3
(d)
BP
NN
X10
-15-
11.
500.
70Ð
Ð1.
471.
629
2775
5.70
8X
I11
-20-
11.
300.
90Ð
Ð1.
009
1.62
921
605.
708
MB
PN
NX
10-1
5-1
1.10
0.70
1.05
0.30
1.48
41.
625
1015
5.70
2X
I11
-20-
11.
300.
901.
010.
801.
021
1.63
790
5.70
9
FB
PN
NX
10-4
-10.
100.
10Ð
Ð1.
128
1.62
418
05.
698
XI
11-7
-10.
050.
50Ð
Ð0.
897
1.62
350
05.
69
Tab
le6
(con
clud
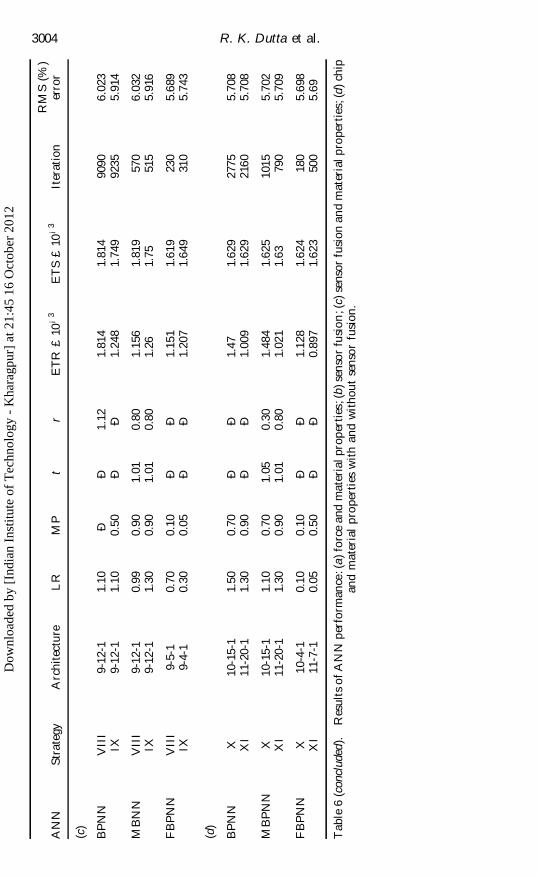
ed).
Res
ults
ofA
NN
perf
orm
ance
:(a)
forc
ean
dm
ater
ialp
rope
rtie
s;(b
)sen
sor
fusi
on;(
c)se
nsor
fusi
onan
dm
ater
ialp
rope
rtie
s;(d
)chi
pan
dm
ater
ial
prop
erti
esw
ith
and
wit
hout
sens
orfu
sion
.
Dow
nloa
ded
by [
Indi
an I
nstit
ute
of T
echn
olog
y -
Kha
ragp
ur]
at 2
1:45
16
Oct
ober
201
2

output, therefore the following steps were required to heuristically optimise thenetwork performance (Dutta et al. 1998).
The ® rst step consisted of determining a suitable architecture of the ANN. Forthis, with an initial LR ˆ 0:3 and MP ˆ 0:7, single hidden layer networks were testedfor all the three cases by varying the hidden layer nodes. The selection of a particulararchitecture was made on the basis of the minimum MSE of the test set. The nextand ® nal step for BPNN and FBPNN was to optimise a pair of LR and MP values.The values of LR was varied between 0.05 to 3.0 for BPNN with MP varying in therange 0.05± 0.9. For FBPNN, both LR and MP varied in the range 0.05± 0.9.
MBPNN is a continuation of BPNN where the LR values were updated by thefactors t (in the range 1.001± 1.5) and r (in the range 0.05± 0.9) as the third step. The® nal or fourth step of optimisation in MBPNN is a review of the initial LR and MPvalues by varying them at ® ner intervals, respectively, in the ranges of 0.05± 3.0 and0.05± 0.9.
In all the trials, the maximum number of iterations was ® xed at 15 000. Since theobjective of the present study was to predict ¯ ank wear, an experimental error of§10 mm was adopted to represent the RMS test error of prediction (ETS) which isequivalent to 1:63 £ 10¡3 in coded form.
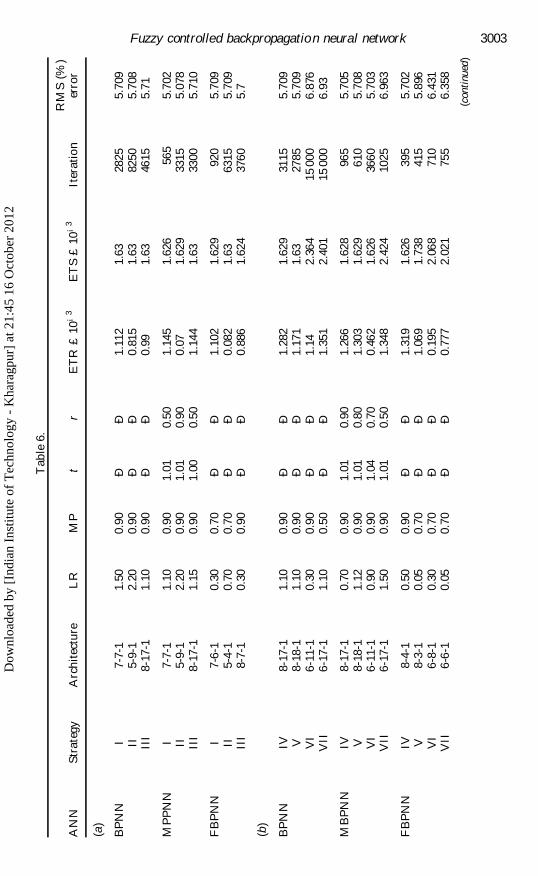
6.2. Prediction of ¯ ank wearThe results of the above exercises using the 11 strategies of TCM are presented in
table 6, which shows grouping of the strategies into certain categories to help e� ec-tive comparison.
6.2.1. E� ect of forces and inclusion of material propertyStrategy I, comprising the measured force features along with process par-
ameters, shows a very fast convergence in predicting the ¯ ank wear in only 920iterations when FBPNN had been used. Strategy II using the derived force featuresin terms of tangential and radial forces is the slowest to attain a prediction error levelof 1:63 £ 10¡3 equivalent to §10 mm since the number of iterations is 6315 in thiscase.
Strategy III which incorporates measured forces with the BHN of the blanksrepresenting the material property performed comparatively better than the strategyII, as the former required 3760 iterations to reach a prediction error of §10 mm.
The above results are also re¯ ected in the BPNN and MBPNN systems. All thestrategies attained §10 mm level of error, and as such the only alternative for com-parison left out is the number of iterations showing the speed of convergence.MBPNN is naturally faster than BPNN because of the continuous changes in LR.In this case also, measured force is the best indicator of tool wear, as strategy I wasseen to converge at 565 iterations while strategy II and III, respectively, needed 3315and 3300 iterations. BPNN produced the same results at 2825, 8250 and 4615 itera-tions for strategies I, II, III, respectively.
Therefore, measured forces are to be preferred as a matter of choice in TCM,while BHN seems to delay the process of prediction or may result in a higher level oferror by overlearning.
6.2.2. E� ect of sensor fusionFour cases of sensor fusion were studied using the three decision systems, which
are namely strategies IV, V, VI and VII. The ® rst two used measured forces with
3005Fuzzy controlled backpropagation neural network
Dow
nloa
ded
by [
Indi
an I
nstit
ute
of T
echn
olog
y -
Kha
ragp
ur]
at 2
1:45
16
Oct
ober
201
2

average RMS (V RMS) and peak to peak (V PP) vibration signal features. The othertwo, strategy VI and VII, used derived forces with V RMS and V PP, respectively.Considering the prediction results given by the FBPNN, it is observed that onlyV RMS is successful for sensor fusion with measured forces at 755 iterations, as theother three strategies failed to achieve a prediction error level of1:63 £ 10¡3…§10 mm) due to overlearning.
Under the BPNN and MBPNN schemes, only those instances proved successfulwhere V RMS and V PP were used for sensor fusion, particularly with measured forcefeatures. The exception was that of strategy VI using MBPNN converging at a levelof 3660 iterations, which is not comparable with the performance of measuredforces. It had been seen that V PP produces faster convergence as seen from theobservations of 610 and 2785 iterations in BPNN and MBPNN. Of course, theperformance with the inclusion of V RMS is comparable to that of V PP, as the con-vergence took place at 965 and 3115 iterations.
Hence, sensor fusion can be successfully achieved in TCM incorporating forceand vibration sensors. There is the possibility for faster convergence by using theFBPNN system, where V RMS is the preferable option with measured force features.It may be noted that these strategies could excel the basic strategy I in terms of speedof convergence.
6.2.3. E� ect of sensor fusion with inclusion of material propertyStrategies VIII and IX include measured forces with V RMS and V PP, respectively,
and BHN of the work material. From the results, it can be seen that FBPNN is theonly alternative that reached the desired level of prediction accuracy at a consider-ably lower iteration of 230 for V RMS . V PP narrowly missed the target at 310 itera-tions.
The performances of BPNN and MBPNN were not satisfactory as overlearningtook place at a higher level of error. Thus, it seems that BHN produces a hindranceon lowering of the prediction error as has been observed earlier. This might beattributed to comparatively lower variation of BHN in comparison to other inputsto the decision systes and its less signi® cant e� ect on the output of the decisionsystems.
6.2.4. E� ect of chip characteristics and BHN with/without sensor fusionStrategy X comprises measured forces, BHN and chip characteristics (shape and
colour). Strategy XI includes sensor fusion by measured forces and V RMS with BHNand chip characteristics. It has been observed that the inclusion of chip shape andcolour in the TCM strategies produced outstanding results. FBPNN proved to be thefastest scheme for prediction at 180 iterations for strategy X, while that for strategyXI was 500 iterations. As such, both the strategies could surpass the convergencespeed of the basic strategy I or any other strategy while attaining a test error level of1:63 £ 10¡3.
The results of BPNN and MBPNN are also satisfactory for strategy X at the seterror level of 1:63 £ 10¡3. MBPNN is clearly faster than BPNN to achieve thetargeted prediction error level at 1015 and 790 iterations as the latter returns thesame at 2775 and 2160 iterations, respectively, for strategy X and strategy XI.
3006 R. K. Dutta et al.
Dow
nloa
ded
by [
Indi
an I
nstit
ute
of T
echn
olog
y -
Kha
ragp
ur]
at 2
1:45
16
Oct
ober
201
2
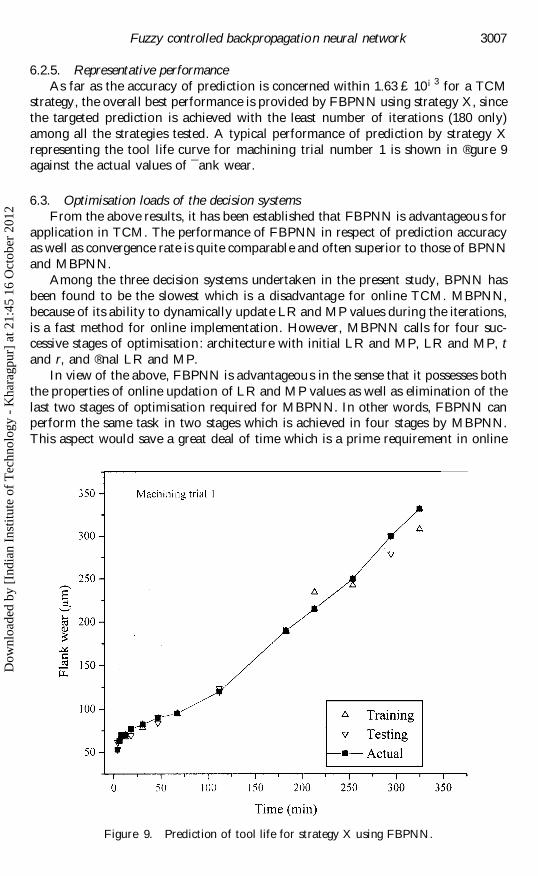
6.2.5. Representative performanceAs far as the accuracy of prediction is concerned within 1:63 £ 10¡3 for a TCM
strategy, the overall best performance is provided by FBPNN using strategy X, sincethe targeted prediction is achieved with the least number of iterations (180 only)among all the strategies tested. A typical performance of prediction by strategy Xrepresenting the tool life curve for machining trial number 1 is shown in ® gure 9against the actual values of ¯ ank wear.
6.3. Optimisation loads of the decision systemsFrom the above results, it has been established that FBPNN is advantageous for
application in TCM. The performance of FBPNN in respect of prediction accuracyas well as convergence rate is quite comparable and often superior to those of BPNNand MBPNN.
Among the three decision systems undertaken in the present study, BPNN hasbeen found to be the slowest which is a disadvantage for online TCM. MBPNN,because of its ability to dynamically update LR and MP values during the iterations,is a fast method for online implementation. However, MBPNN calls for four suc-cessive stages of optimisation: architecture with initial LR and MP, LR and MP, tand r, and ® nal LR and MP.
In view of the above, FBPNN is advantageous in the sense that it possesses boththe properties of online updation of LR and MP values as well as elimination of thelast two stages of optimisation required for MBPNN. In other words, FBPNN canperform the same task in two stages which is achieved in four stages by MBPNN.This aspect would save a great deal of time which is a prime requirement in online
3007Fuzzy controlled backpropagation neural network
Figure 9. Prediction of tool life for strategy X using FBPNN.
Dow
nloa
ded
by [
Indi
an I
nstit
ute
of T
echn
olog
y -
Kha
ragp
ur]
at 2
1:45
16
Oct
ober
201
2
TCM. Once the universe of discourse for the fuzzy variables are de® ned and a rulebase is framed for controlling the LR and MP values, the FBPNN can provide fasterconvergence.
In the above computations by using FBPNN, the fuzzy rule base usually pro-vided high LR and MP values depending on CE and CCE. It has been observed thatsimpler ANN architectures resulted during its heuristic optimisation. Due to thisreason, FBPNN produced still faster convergence as less synaptic connections wereneeded in such networks.
7. ConclusionIn the present study, the advantages of using fuzzy controlled backpropagation havebeen investigated, in comparison with standard and modi® ed backpropagationneural networks. The results show that FBPNN is clearly advantageous for dynamicupdation of LR and MP values in only two stages of heuristic optimisation ascompared to MBPNN, which requires four such stages, giving the latter a greaterwork load which is not economical from the standpoint of online TCM. Moreover,prediction accuracy for FBPNN is comparable, if not more, to the other two deci-sion systems. Being a data-dependent system, FBPNN gains the strategic advantageof producing results of low error level and faster convergence by proper tuning of thefuzzy logic controller. In the above context, BPNN is not on a par with the other twodecision systems due to its slow nature of convergence.
While considering the e� cacy of signature features and experimental observa-tions, sensor fusion plays a vital role in the development of a TCM system. Forceand vibration are two measures which can be successfully utilised in the prediction oftool wear. The proposition for inclusion of chip shape and chip colour, alongwithprocess parameters in a sensor fusion strategy, seems to be an e� ective measure forobtaining accuracy and faster prediction.
In an induatrial situation involving automated manufacturing, fast detection oftool failure is of vital importance. From the study undertaken above, it has beenlearnt that FBPNN is an e� ective method applicable to on-line TCM which has theright potential for fast learning in a small number of computational steps. This meritmay be extended to multi-tooth face milling keeping in view the industrial require-ments where the wear developed in each of the inserts may be predicted by takinginto account respective sensory features and process parameters. Thus a cutter withmultiple inserts may be declared to have failed when the predicted wear of an insert ismore than the permissible level and hence calling for a tool change.
References
AZOUI,R. and GUILLOT,M.,1997, Online prediction of surface ® nish and dimension deviationusing neural network based sensor fusion. International Journal of Machine Tools andManufacture , 37, 1201± 1217.
BYRNE, G., DORNF ELD, D., INASAKI, I., KETTLER, G., KONIG, W. and TETI, R., 1995, Toolcondition monitoring(TCM) ± the status of research and industrial application. Annalsof the CIRP, 44 541± 567.
CHR YSSOLOUR IS, G., DOMROESE, M. and BEAULIEU, P., 1992, Sensor synthesis for control ofmanufacturing processes. Journal of Engineering for Industry, 114, 158± 174.
D IMLA JR, D. E., LISTER, P. M . and LEIGHTON, N. J., 1997, Neural network solutions to thetool condition monitoring problems in metal cutting ± a critical review of methods.International Journal of Machine Tools and Manufacture, 37, 1219± 1241.
3008 R. K. Dutta et al.
Dow
nloa
ded
by [
Indi
an I
nstit
ute
of T
echn
olog
y -
Kha
ragp
ur]
at 2
1:45
16
Oct
ober
201
2
DUTTA, R. K., PAUL, S. and CHATTOPADHYAY, A. B., 2000, Applicability of modi® ed back-propagation algorithm in tool condition monitoring for faster convergence. Journal ofMaterials Processing Technology, 98, 299± 309.
EL-WARDANY, GAO, D. and ELBESTAWI, M .A., 1996, Tool condition monitoring in drillingusing vibration signature analysis. International Journal of Machine Tools andManufacture, 36, 687± 711.
GHASEMPOOR, A. and JESWIET, J., 1998, On line wear estimation using neural network.Proceedings of the Institution of Mechanical Engineers, part B, 262, 105± 111.
GONG, W., OBIKAWA, T. and SHIRAKASHI, T., 1997, Monitoring tool wear states in turningbased on wavelet analysis. JSME International Journal, series C, 40, 447± 453.
HAYKIN, S., 1998, Neural Networks (New York: McMillan).HECHT-N IELSON, R., 1990, Neuro Computing (New York: Addison Wesley).HONG, G. S., RAHMAN, M. and ZHOU, Q., 1996, Using neural network for tool condition
monitoring based on wavelet decomposition. International Journal of Machine Tools andManufacture, 36, 551± 566.
KHAJAVI,A. N. and KOMANDURI, R.,1995 a, Frequency and time domain analysis of sensorsignals in drilling ± I, Correlation with drill wear. International Journal of Machine Toolsand Manufacture, 35, 775± 793; 1995 b, Frequency and time domain analysis of sensorsignals in drilling ± II, Investigation on some problems associated with sensor integra-tion. Ibid., 35, 795± 851.
JEMIELNIEK, K. and OTMAN, O., 1998, Catastrophic tool failure detection based on acousticemission signal analysis. Annals of the CIRP, 47, 31± 34.
KO, T. J. and CHO, D. W., 1994, Cutting state monitoring in milling by a neural network.International Journal of Machine Tools and Manufacture, 34, 659± 676.
KO, K. J., CHO, D. W. and JUNG, M.Y., 1995, On line monitoring of tool breakage in facemilling using self organising neural network. Journal of Manufacturing Systems, 14, 80±90.
KOSKO, B., 1992, Neural Networks and Fuzzy Systems (Englewood Cli� s, NJ: Prentice Hall).KUMAR,S.A.,RAVINDRA,H.V. and SR INIVASA,Y.G.,1997, In process tool wear monitoring
through time series modelling and pattern recognition. International Journal ofProduction Research, 35, 739± 752.
KUO,R. J. and KOHEN, P.H.,1999, Multi sensor integration for online tool wear estimationthrough radial basis function networks and fuzzy neural networks. Neural Networks, 12,355± 370.
LEE, Y. M., SAMPATH, W. S. and SHAW, M . C., 1984, Tool fracture probability of cuttingtools under di� erent exiting conditions. Journal of Engineering for Industry, 106, 168±170.
LEE, J. M., CHOI, D. K. and CHU, C. N., 1995, Real time tool breakage monitoring for NCmilling processes. Annals of the CIRP, 44, 59± 62.
LEE, J.H.,K IM,D.E. and LEE,S. J.,1998, Statistical analysis of cutting force ratios for ¯ ankwear monitoring. Journal of Material Processing Technology, 74, 104± 114.
LIN, S. C. and LIN, R. J., 1996, Tool wear monitoring in face milling using force signals.W ear, 198, 136 ± 142.
LIN,S.C. and YANG,R.J.,1995, Force based model for tool wear monitoring in face milling.International Journal of Machine Tools and Manufacture, 35, 1201± 1211.
PEKELHERING, A. J., 1984, The exit failure of cemented carbide face milling cutters Part I ±Fundamentals and phenomena. Annals of the CIRP, 33, 47± 51.
PUROSHOTHAMAN, S. and SRINIVASA, Y. G., 1994, A backpropagation algorithm applied totool wear monitoring. International Journal of Machine Tools and Manufacture, 34, 625±631; 1998, A procedure for training an arti® cial neural network with application to toolwear monitoring. International Journal of Production Research, 36, 635± 651.
RAMARAJ,T. C., SANTHANAM, S. and SHAW,M .C.,1988, Tool fracture at the end of a cut ±Part 1: Foot formation. Journal of Engineering for Industry, 110, 333± 338.
SIKDAR, C., 1993, E� ect of cutting edge modi® cation on machining characteristics and per-formance of coated carbide face milling inserts. PhD dissertation, IIT Kharagpur.
TANSEL, I. N., 1994, Identi® cation of the pre-failure stage in micro-drilling operations usingmultiple sensors. International Journal of Machine Tools and Manufacture, 34, 351± 364.
3009Fuzzy controlled backpropagation neural network
Dow
nloa
ded
by [
Indi
an I
nstit
ute
of T
echn
olog
y -
Kha
ragp
ur]
at 2
1:45
16
Oct
ober
201
2

TANSEL, I. N., MEKDECI, C. and MCLAUGHLIN, C., 1995, Detection of tool failure in endmilling with wavelet transformations and neural network (WT-NN). InternationalJournal of Machine Tools and Manufacture, 35, 1137± 1147.
TARNG, Y. S., HSEIH, Y. W. and HWANG, S. T., 1994, Sensing tool breakage in face millingwith neural network. International Journal of Machine Tools and Manufacture, 34, 341±350.
VAN LUTTERVELT,C. A., WILLEMSE, H. R. and PEKELHERING, A. J., 1984, The exit failure ofcemented carbide face milling cutters ± Part II ± Testing of commercial cutters. Annalsof the CIRP, 33, 51± 55.
YOUN, J.W.,YANG,M.Y. and PARK,H.Y.,1994, Detection of cutting tool fracture by dualsignal measurements. International Journal of Machine Tools and Manufacture, 34, 507±525.
3010 Fuzzy controlled backpropagation neural network
Dow
nloa
ded
by [
Indi
an I
nstit
ute
of T
echn
olog
y -
Kha
ragp
ur]
at 2
1:45
16
Oct
ober
201
2
Copyright © 2022 FDOKUMEN