Improving Failure Mode and Effects Analysis as a Cognitive Simulation
8
Proceedings of ASME 2012 International Design Engineering Technical Conferences & Computers and Information in Engineering Conference IDETC/CIE 2012 August 12-15, 2012, Chicago, Illinois, USA DETC2012-70532 IMPROVING FAILURE MODE AND EFFECTS ANALYSIS AS A COGNITIVE SIMULATION Chad R Foster Cummins Turbo Technologies Cummins Inc. 500 Central Ave M/C 14010 Columbus, Indiana 47201 Email: [email protected] ABSTRACT In this paper the failure mode and effects analysis (FMEA) process is studied as a human simulation. The cognitive chal- lenges of availability bias, probability inconsistency, and expe- rience weighting are reviewed against a large number of actual FMEAs. The challenges are outlined and improvements to the process presented including pooled scoring and the use of the criticality index. NOMENCLATURE AIAG Automotive Industry Action Group: An American auto- motive company cooperative group aimed it improving competitiveness Cognitive Simulation The use of human thought to predict an outcome Criticality Estimated failure impact multiplying an estimated severity (1-10) by the occurrence (1-10) Evaluator The person making the assessment of the severity, occurrence, and detection for the failure modes Failure Mode A physics based designation of how the system fails such as fretting Failure Effect The worst case system level result of the failure such as machine inoperable FMEA Failure Mode and Effects Analysis: A procedure used in a group to predict and address potential reliability issues RPN Risk Priority Number: A relative score between different failure modes multiplying specific scores of severity (1- 10), occurrence (1-10), and detection (1-10) INTRODUCTION In this research the accuracy of human cognition as it applies to this simulation is tested against potential issues and failures. Two major cognition concerns are presented here, the availability bias and inadequate meta-cognitive insight. These influences are subtle, not obvious, and affect the outcome in both the accuracy as well as the confidence of the result. To demonstrate the applicability of the cognitive simula- tion framework, or the use of humans as predictive agents, over two dozen FMEAs are reviewed within the mechanical and fluid dynamics disciplines this includes 7900 individual predictions made by twenty people. These predictions are compared for con- sistency, correlation, and accuracy; then tested for the two human cognition issues investigated here. Two improvements to the standard FMEA are proposed; in- dividual pooled scoring and a returned use of the criticality index. These additions account for the cognitive concerns and improve upon the current practices of group consensus and risk priority number (RPN) scoring thresholds. The FMEA is an effective cognitive simulation that can be improved by considering the strength of the human to assist engineering teams in delivering a more reliable product. A single component long term study is 1 Copyright c 2012 by ASME
-
Upload
independent -
Category
Documents
-
view
0 -
download
0
Transcript of Improving Failure Mode and Effects Analysis as a Cognitive Simulation

Proceedings of ASME 2012 International Design Engineering Technical Conferences &Computers and Information in Engineering Conference
IDETC/CIE 2012August 12-15, 2012, Chicago, Illinois, USA
DETC2012-70532
IMPROVING FAILURE MODE AND EFFECTS ANALYSIS AS A COGNITIVESIMULATION
Chad R FosterCummins Turbo Technologies
Cummins Inc.500 Central Ave M/C 14010Columbus, Indiana 47201
Email: [email protected]
ABSTRACTIn this paper the failure mode and effects analysis (FMEA)
process is studied as a human simulation. The cognitive chal-lenges of availability bias, probability inconsistency, and expe-rience weighting are reviewed against a large number of actualFMEAs. The challenges are outlined and improvements to theprocess presented including pooled scoring and the use of thecriticality index.
NOMENCLATUREAIAG Automotive Industry Action Group: An American auto-
motive company cooperative group aimed it improvingcompetitiveness
Cognitive Simulation The use of human thought to predict anoutcome
Criticality Estimated failure impact multiplying an estimatedseverity (1-10) by the occurrence (1-10)
Evaluator The person making the assessment of the severity,occurrence, and detection for the failure modes
Failure Mode A physics based designation of how the systemfails such as fretting
Failure Effect The worst case system level result of the failuresuch as machine inoperable
FMEA Failure Mode and Effects Analysis: A procedure usedin a group to predict and address potential reliabilityissues
RPN Risk Priority Number: A relative score between differentfailure modes multiplying specific scores of severity (1-10), occurrence (1-10), and detection (1-10)
INTRODUCTIONIn this research the accuracy of human cognition as it applies
to this simulation is tested against potential issues and failures.Two major cognition concerns are presented here, the availabilitybias and inadequate meta-cognitive insight. These influences aresubtle, not obvious, and affect the outcome in both the accuracyas well as the confidence of the result.
To demonstrate the applicability of the cognitive simula-tion framework, or the use of humans as predictive agents, overtwo dozen FMEAs are reviewed within the mechanical and fluiddynamics disciplines this includes 7900 individual predictionsmade by twenty people. These predictions are compared for con-sistency, correlation, and accuracy; then tested for the two humancognition issues investigated here.
Two improvements to the standard FMEA are proposed; in-dividual pooled scoring and a returned use of the criticality index.These additions account for the cognitive concerns and improveupon the current practices of group consensus and risk prioritynumber (RPN) scoring thresholds. The FMEA is an effectivecognitive simulation that can be improved by considering thestrength of the human to assist engineering teams in deliveringa more reliable product. A single component long term study is
1 Copyright c© 2012 by ASME
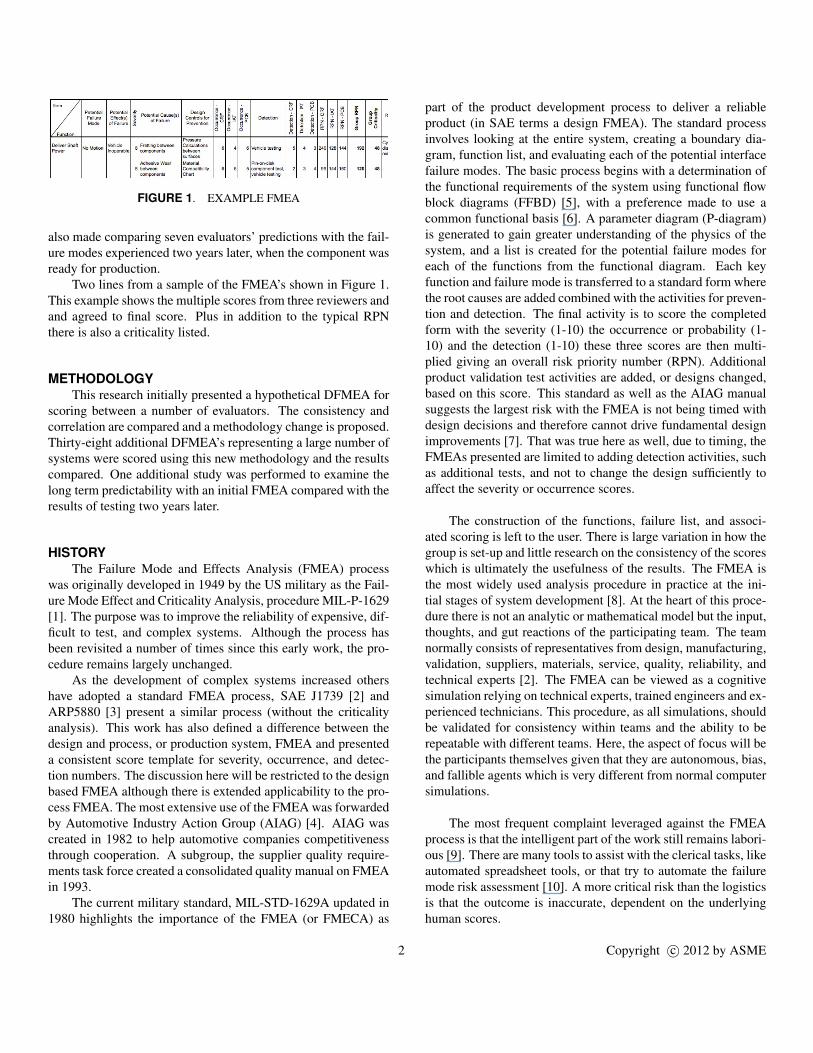
FIGURE 1. EXAMPLE FMEA
also made comparing seven evaluators’ predictions with the fail-ure modes experienced two years later, when the component wasready for production.
Two lines from a sample of the FMEA’s shown in Figure 1.This example shows the multiple scores from three reviewers andand agreed to final score. Plus in addition to the typical RPNthere is also a criticality listed.
METHODOLOGYThis research initially presented a hypothetical DFMEA for
scoring between a number of evaluators. The consistency andcorrelation are compared and a methodology change is proposed.Thirty-eight additional DFMEA’s representing a large number ofsystems were scored using this new methodology and the resultscompared. One additional study was performed to examine thelong term predictability with an initial FMEA compared with theresults of testing two years later.
HISTORYThe Failure Mode and Effects Analysis (FMEA) process
was originally developed in 1949 by the US military as the Fail-ure Mode Effect and Criticality Analysis, procedure MIL-P-1629[1]. The purpose was to improve the reliability of expensive, dif-ficult to test, and complex systems. Although the process hasbeen revisited a number of times since this early work, the pro-cedure remains largely unchanged.
As the development of complex systems increased othershave adopted a standard FMEA process, SAE J1739 [2] andARP5880 [3] present a similar process (without the criticalityanalysis). This work has also defined a difference between thedesign and process, or production system, FMEA and presenteda consistent score template for severity, occurrence, and detec-tion numbers. The discussion here will be restricted to the designbased FMEA although there is extended applicability to the pro-cess FMEA. The most extensive use of the FMEA was forwardedby Automotive Industry Action Group (AIAG) [4]. AIAG wascreated in 1982 to help automotive companies competitivenessthrough cooperation. A subgroup, the supplier quality require-ments task force created a consolidated quality manual on FMEAin 1993.
The current military standard, MIL-STD-1629A updated in1980 highlights the importance of the FMEA (or FMECA) as
part of the product development process to deliver a reliableproduct (in SAE terms a design FMEA). The standard processinvolves looking at the entire system, creating a boundary dia-gram, function list, and evaluating each of the potential interfacefailure modes. The basic process begins with a determination ofthe functional requirements of the system using functional flowblock diagrams (FFBD) [5], with a preference made to use acommon functional basis [6]. A parameter diagram (P-diagram)is generated to gain greater understanding of the physics of thesystem, and a list is created for the potential failure modes foreach of the functions from the functional diagram. Each keyfunction and failure mode is transferred to a standard form wherethe root causes are added combined with the activities for preven-tion and detection. The final activity is to score the completedform with the severity (1-10) the occurrence or probability (1-10) and the detection (1-10) these three scores are then multi-plied giving an overall risk priority number (RPN). Additionalproduct validation test activities are added, or designs changed,based on this score. This standard as well as the AIAG manualsuggests the largest risk with the FMEA is not being timed withdesign decisions and therefore cannot drive fundamental designimprovements [7]. That was true here as well, due to timing, theFMEAs presented are limited to adding detection activities, suchas additional tests, and not to change the design sufficiently toaffect the severity or occurrence scores.
The construction of the functions, failure list, and associ-ated scoring is left to the user. There is large variation in how thegroup is set-up and little research on the consistency of the scoreswhich is ultimately the usefulness of the results. The FMEA isthe most widely used analysis procedure in practice at the ini-tial stages of system development [8]. At the heart of this proce-dure there is not an analytic or mathematical model but the input,thoughts, and gut reactions of the participating team. The teamnormally consists of representatives from design, manufacturing,validation, suppliers, materials, service, quality, reliability, andtechnical experts [2]. The FMEA can be viewed as a cognitivesimulation relying on technical experts, trained engineers and ex-perienced technicians. This procedure, as all simulations, shouldbe validated for consistency within teams and the ability to berepeatable with different teams. Here, the aspect of focus will bethe participants themselves given that they are autonomous, bias,and fallible agents which is very different from normal computersimulations.
The most frequent complaint leveraged against the FMEAprocess is that the intelligent part of the work still remains labori-ous [9]. There are many tools to assist with the clerical tasks, likeautomated spreadsheet tools, or that try to automate the failuremode risk assessment [10]. A more critical risk than the logisticsis that the outcome is inaccurate, dependent on the underlyinghuman scores.
2 Copyright c© 2012 by ASME
BIAS AND METACOGNITIONThe simplicity of the procedural instructions belies the over-
all complexity of creating an accurate estimate. The instruc-tions will normally state something similar to “Identify the fail-ure modes associated with the functions.” The instruction mayadditionally include a validation by checking previous failures,or ‘brainstorming’. This group then determines a score that willset the design and testing validation direction, and determine ifany additional testing is required. The effectiveness of this pro-cedure can be checked by the consistency of the score and areasof concern. If a group (or different groups) were to run the pro-cedure multiple times they should come up with the same risksand similar tests. The overall FMEA goal is to predict failuresfor the system under investigation, the reality will be evident af-ter a couple of years of testing. Thus this is a prediction that canbe measured for consistency as well as accuracy.
A hypothetical application was studied for a turbochargersystem on an engine. A test plan was generated along with theboundary diagram, functional analysis and initial FMEA form.This was presented to an experienced team to add failure modes,score and determine the biggest risks, and add additional tasksthat should be performed. The additional tasks were mostly fo-cused on detection activities as an initial turbocharger design wassaid to exist.
The group had six members that ranged in experiences from10-20 years on the job and variety of areas in analysis, design,service, manufacturing, program management, and product de-velopment. The meeting was structured according to the AIAGguidelines where each line was discussed and scored and if thescores were in the top percent, additional action items wereadded to bring the score down. During the meeting it was ob-served that there was unequal participation from the members,some were distracted by laptops or cell phones, others had moreurgent problems. This was a frequent occurrence and concerningas the quality of the outcome is dependent on the participationof everyone. To validate the outcome an additional six memberswere solicited to score the FMEA individually. While an exactmatch was not anticipated it was expected that there would besome correlation between the scores this was not the case. Ta-ble 1 show the correlation table between the individuals and thegroup score. It was surprising that most correlations are so low,few individuals were aligned with the group, and the variancebetween everyone was high. The group was not amplifying theindividual but creating an entirely different outcome.
With so little correlation between the evaluators, which ismore accurate? The observation is that the engagement at themeetings was not uniform, everyone did not participate at thesame level. A couple of members dominated the discussion andthe overall scores. Each of the six evaluators is compared witheach other and their error to the group score is presented in Fig-ure 2. Given the value in Figure 2 is the scoring error, a smallcluster near zero indicates good alignment with the group. A
TABLE 1. CORRELATION BETWEEN EVALUATORS
Name Correlation
Evaluator 1 0.114
Evaluator 2 -0.013
Evaluator 3 0.005
Evaluator 4 0.070
Evaluator 5 0.063
Evaluator 6 0.060
FIGURE 2. RPN COMPARISON OF EVALUATORS
straight 45 degree line indicates perfect correlation between twoevaluators, but little with the group score. It is easy to see thatsome evaluators are agreeing with each other and not with thegroup. Evaluator 1, and Evaluator 2 and Evaluator 6 have highlycorrelated errors so they agreed with each other compared withthe group. One interpretation is that they are seeing a differentreality compared with the group and estimate different failuremodes. It was anticipated that a handful of evaluators wouldagree with the group, this was not the case; when asked individ-ually the evaluators reached a correlated and different outcomecompared to a single group.
A well known issue and cognitive hindrance, is availabilitybias [11]; there are two concerns for its applicability here, cogni-tive distance and anchoring. First when asked to score probabil-ity it is easier to recall certain aspects, those aspects are deemedmore probable. Thus when asked about the probability of a fail-ure mode it is easier to recall the most recent set of failures, andthose become more probable. The highest scoring failure modeshave the shortest cognitive distance; these are the failures that the
3 Copyright c© 2012 by ASME
evaluator had most recently, or are pivotal in their memory [11].During the course of a development program it was noticed thatthere was a failure due to insufficient restriction in a valve. Dur-ing the subsequent scoring of the next program the FMEA wasscored 20 points higher, even though a highly effective solutionwas found. Instead of judging the risk of the new product tosurvive its operating environment, it is easier to recall the previ-ous failure and therefore expect it must be more probable. It israrely apparent to the engineer that they are making this mentalconnection, when asked for the occurrence of a failure mode thismental calculation happens automatically. This is a challengingbias to avoid, specific previous failure modes are highlighted dur-ing the discussion to help make it a conscientious choice of theevaluator. The greater diversity of the group the more these dif-ferences become apparent during the discussion highlighting thedifferent experiences and cognitive distance to failures. Each in-dividual is more neutral on some aspects of a failure mode andprovides an input less tied to immediate recall and has a longer,and less emotional, history. While the accuracy of the longer re-call is questionable it reduces the availability of recent failuresand allows for more abstract thinking about the problem across anumber of previous programs and situations.
When thinking about failure modes the estimated occurrenceprobability is inconsistent. One example of this inconsistencyis that probabilities of combined events - the device wore andfractured, is deemed more probable than wearing or fracturingalone. It is more likely to see either of these failure modes sepa-rately, but the salient failure is the one that is worn and fractured,and easier to recall. This is a well studied phenomena found inweather [12] and diagnoses [13,14]. To maximize the history andexperience of the evaluator each failure mode should be a singlephysics based failure phenomena. To facilitate this, a list of po-tential failure modes is frequently used, this could be a historiccompany list or a more complete taxonomy of physical failuremodes as recently suggested by Tumer [15].
Cognitive distance errors are apparent in occurrence esti-mates when the description is either vague or overly complex.When asked about the probability of “wear” or “microscopic ad-hesion based particulate wear” there is a difference in the abilityof the evaluator to ground their score and provide consistent con-fidence. Many evaluators select the more complex physical phe-nomena, even though one is the subset of the other. This well re-searched limitation [16] is evident in the confidence of the scoresprovided and salient during the discussions. Even novice teammembers have great confidence in their scores with little justi-fication. More accurate predictions are made when a straight-forward baseline, and probing questions are used to ground thepredictions. These calibration or grounding questions [17] ques-tions such as “how many times have you personally seen thisfailure mode”, or asking for historic confidence limits helps toreduce the impact of the cognitive distance and extend the men-tal time horizon. This technique was tried with some success.
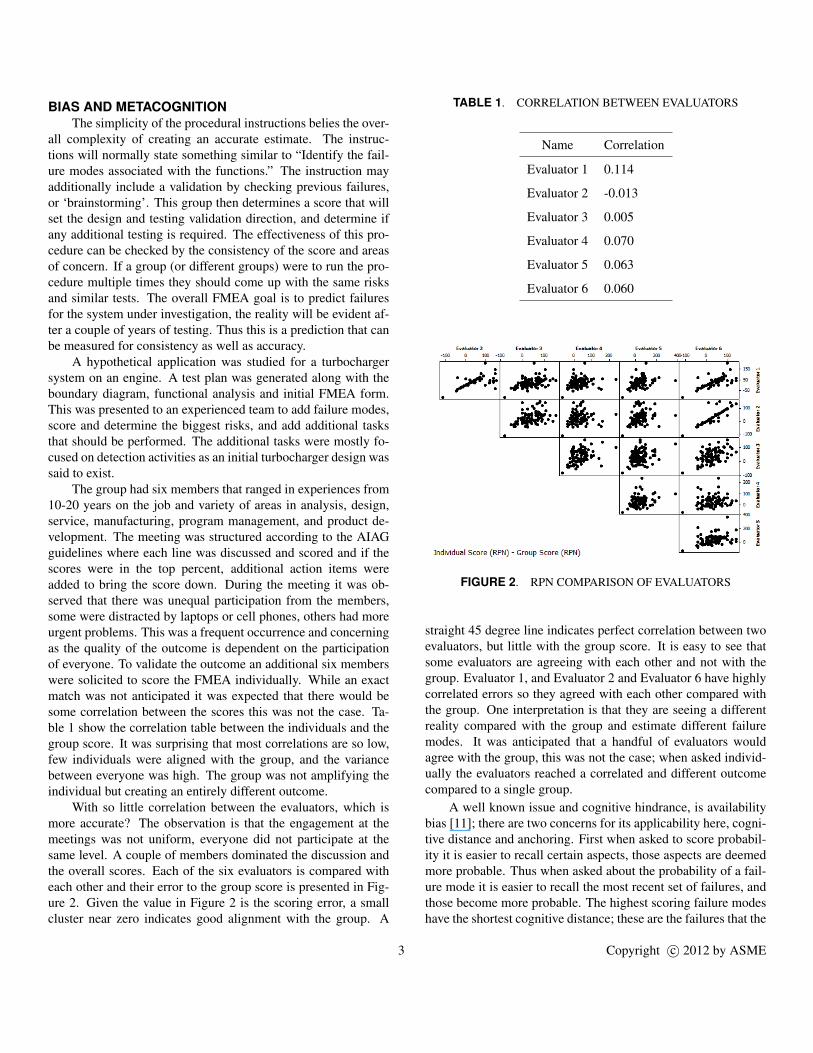
FIGURE 3. MARGINAL PLOT OF SKILLED EVALUATOR
The biggest advantage was changing the mode of thought to bein a critical reasoning framework to make accurate estimates, thisis consistent with previous research [18]. It is too easy to remainin a passive state during the evaluations. These grounding ques-tions were incorporated into the FMEA training module to helpevaluators think outside of their immediate history.
In addition to the combined events and increased complexitythe impact of the cognitive distance is also evident in experienceof the evaluator. The less experienced evaluator had criticalityscores less correlated and with less range compared with the theaverage criticality score and range of the other evaluators. Fig-ures 3 and 4 are marginal plots that show the difference betweentwo individuals, one with a dozen years engineering experiencethe other with only two. The horizontal axis is the agreed finalcriticality score (severity*detection) and the vertical axis is thedifference to that evaluator. The experienced evaluator in Fig-ure 3 shows little correlation to criticality value with high andlow errors throughout the range. The unskilled evaluator in Fig-ure 4 shows a negative correlation where the evaluator was con-sistently under-evaluating higher criticality items. As a followupeach evaluator was asked about their confidence in their scores.There was no correlation between their confidence and the cor-relation to the criticality. Evaluators do not recognize that expe-rience level would lead to more accurate scores.
Having a vocal and inexperienced evaluator combined withquieter, more experienced evaluators leads to scores that do notreflect the groups insight. A single loquacious individual candrive a group to start with their personal experience, this is re-ferred to as anchoring. To avoid this issue each individual evalu-ator was requested to fill out the scores before the group scoringsession. This creates a different anchor for each participant todiscuss and helps the group understand the background for eachof the participants. All scores are combined on a single sheet andthen line items are only discussed for two reasons, first every-
4 Copyright c© 2012 by ASME

FIGURE 4. MARGINAL PLOT OF UNSKILLED EVALUATOR
one agrees that it is a very high risk and needs additional actionsor second, the scores have a significant range and there is un-certainty of the failure mode. In addition to providing a physicsbased failure list and referring back to personal experience thisindividual anchoring significantly improved the FMEA. The useof anchoring in this way has been described previously [19] andthis individual reflection is a good method to reduce the impactto the team. During the review meeting each evaluator starts withtheir own score and then considers the evidence to change theirscore to reflect those around them, until agreement is reached.Everyone in the scoring meeting provides their individual scoresand assessment of risk. All of the individual scores were com-piled for approximately twelve different FMEAs conducted bydifferent teams over the course of six-months. Each reviewer didnot have to score every failure mode but only those they felt thatthey had confidence in evaluating. Every individual was trainedon the confidence level method for their individual scores.
The premise of the group evaluation is that each individualreviewer should be relatively correct compared with their over-all scoring. Each reviewer provides some knowledge to the sys-tem thus improving the group score. It was surprising to findsuch variation in the individual scores with a large range for eachscore, with the range increasing for higher average scores. Thiswas consistent for the overall RPN (Fig. 7) as well as the in-dividual detection (Fig. 6) and occurrence (Fig. 5) scores. Theseverity score is not included here as it showed little variationand was later decided to score when the FMEA was created.
The occurrence and severity scores had the least range withthe detection scores having the greatest range. This result chal-lenges the basic premise of the FMEA, and it appears that thereis little correlation between the individual result and the groupdecision. It does reflect a level of difference between the scoresthat is not often apparent in the deliberation sessions. Duringmost sessions there are relatively few items of discussion and
FIGURE 5. DFMEA OCCURRENCE SCORE CORRELATION
FIGURE 6. DETECTION CORRELATIONS
they are normally peppered throughout the FMEA. The knowl-edge of what are the most controversial areas of discussion canbe used to lay out the discussion and maximize the participa-tion. As seen in Figs. 5-7 with a large range of high scores itis challenging to select the most salient topics. Combined withthe information on years of experience, sufficient information isavailable to select the highest scored topics as well as those withthe most uncertainty among experienced evaluators. One easyway to select the highest score is to use a weighted sum of thetotal scores multiplied by the logarithm of experience. To selectthe greatest uncertainty the range of scores is as effective as thestandard deviation.
5 Copyright c© 2012 by ASME

FIGURE 7. RPN CORRELATIONS
COMPARISON TO OUTCOMESA FMEA was conducted using the multiple scoring method
above. There were seven evaluators, although all evaluators didnot evaluate all failure modes. This FMEA was conducted duringthe initial design phase, which is recommended by [7] and [20]as one of the frequent misses of the process. Additional actionitems were added to the test plan based on the high RPN scoresand the detection score was re-evaluated. The use of the FMEAat this point added tests for failure mode detection but was notused to change the design as the design had historic precedent.After two years of testing and development the FMEA was com-pared against the actual failure modes that occurred during thedevelopment process. There were 17 failures from the 87 lineson the FMEA.
Figure 8 shows no correlation between the RPN score andthe failures. This is surprising as the primary methodology isto use the RPN to predict the system failure and add additionaldetection actions based on this score. Those additional items didnot discover the targeted failures.
The individual severity, occurrence, and detection scoresshown in Figure 9 highlight the different relationships. For boththe severity and detection their is insufficient evidence of a cor-relation. The occurrence shows a significant difference with a95% confidence interval on a t-test of a score difference between0.563 and 1.183.
A suggestion made by AIAG [4] is to also use a criticalityscore in judging the failures. This is the multiplication of theseverity with the occurrence. The criticality is equivalent to aprobabilistic loss value. If the severity is the monetary loss forthe failure and the occurrence is the probability of occurrence theexpected loss is the criticality.
The criticality shows a significant difference with a 95%confidence interval on a t-test of a score difference between 4.99and 10.47. The inclusion of the detection score in the estimate
FIGURE 8. FMEA RPN ACCURACY BOX-PLOT
FIGURE 9. FMEA ACCURACY BOX-PLOT
decreases the predictive ability of the procedure. One hypothe-sis for this is there are normally thresholds for additional actions(and additional work), the detection score is created last and isconsciously or subconsciously provided to ensure one is underthe threshold. The other reason often provided is the detectionscore is the least separable score as it reflects the ability for oneto detect a failure, which is tied to the occurrence of that failuremode in the system. If the occurrence score is low then the de-tection score is often high because the amount of testing to detectthe failure is higher.
CONCLUSIONS AND SUGGESTIONSAs has been pointed out by other authors [21] the value of
an RPN to assess overall risk is confusing and can be mislead-ing. There are also a number of potential improvements with the
6 Copyright c© 2012 by ASME

FIGURE 10. FMEA CRITICALITY ACCURACY BOX-PLOT
overall procedure in creating and ranking the failure modes in aconsistent and clear manner.
The direction in this paper is to approach the FMEA as a hu-man simulation and look at the opportunities within that frame-work. Little correlation was found in the prediction accuracy,potentially due to availability bias in anchoring and cognitivedistance. The suggestions are to have a large, diverse and ex-perienced group score the FMEA individually using predefinedfailure modes and grounding questions and then discuss the high-est scores as well as those with the biggest difference. While notdirectly tested in this paper these approaches help to mitigate therisk for the issues of the human cognition [14, 22, 23]. The sec-ond suggestion is to use the criticality score versus the RPN topredict the future failure modes of the system. The recommen-dation after determining the highest risk is to add more testing toimprove the time to detection (especially rig tests) or start work-ing on the failure as if it already happened looking for design orsystem changes for prevention.
One suggestion to increase the cognitive distance and im-prove the overall outlook is to take a future view looking back atwhat could have gone wrong. This procedure, applied to programmanagement is called a premortem by Klein [24]. The procedureis that you conduct a final mental simulation for the high critical-ity scores asking “assume this is the largest warranty issue afterthe first year of launch, what could have been done to detect itand prevent it now”.
Future studies will evaluate the accuracy of these modifica-tions in long term predictions versus this retrospective. Thereare also research opportunities outside of the FMEA to includecognitive aspects in designed experiments and even more broadbusiness decisions. The FMEA is an effective cognitive simu-lation that can be improved by considering the strength of thehuman to assist engineering teams in delivering a more reliableproduct.
ACKNOWLEDGMENTThanks to all the patient evaluators who scored so many
FMEAs, and the support from the leadership team for this longterm study. Thanks to the reviewers for their insight and valuablesuggestions that improved and clarified the paper.
REFERENCES[1] DEPARTMENT OF DEFENSE, 1980. MIL-STD-1629A Pro-
cedures for Performing A Failure Mode, Effects and Criti-cality Analysis. Washington, DC 20301, November.
[2] SAE INTERNATIONAL. J1739 Potential Failure Mode andEffects Analysis in Design (Design FMEA), Potential Fail-ure Mode and Effects Analysis in Manufacturing and As-sembly Processes (Process FMEA). 400 CommonwealthDrive, Warrendale, PA 15096.
[3] SAE INTERNATIONAL, 2001. ARP5880 RecommendedFailure Modes and Effects Analysis (FMEA) Practices forNon-Automobile Applications, (replaces mil-std-1629a) ed.400 Commonwealth Drive, Warrendale, PA 15096, July.
[4] Chrysler LLC, Ford Motor Company, G. M. C., 2008. Po-tential failure Mode and Effects Analysis (FMEA) referenceManual, 4th ed. AIAG, 26200 Lahser Road, Suite 200,Southfield , MI 48034, June.
[5] Weilkiens, T., 2008. Systems engineering withSysML/UML: modeling, analysis, design. MorganKaufmann.
[6] Stone, R. B., and Wood, K. L., 2000. “Development of afunctional basis for design”. Journal of Mechanical Design,122, pp. 359–370.
[7] McKinney, B. T., 1991. “Fmeca the right way”. In Pro-ceedings of Reliabiliy and maintainability Symposium.
[8] Reliability, N., and Committee, M. S., 1991. Nasa-tm-4322. nasa reliability preferred practices for design and test.Tech. rep., NASA Office of Safety and Mission Quality,Washington, DC.
[9] Hawkins, P. G., and Woollons, D. J., 1998. “Failure modesand effects analysis of complex engineering systems usingfunctional models”. Artificial Intelligence in Engineering,12, pp. 375–397.
[10] Papadopolulos, Y., Parker, D., and Grante, C., 2004. “Amethod and tool support for model-based semi-automatedfailure modes and effects analysis of engineering designs”.In SCS ’04 Proceedings of the 9th Australian workshop onSafety critical systems and software - Volume 47.
[11] Tversky, A., and Kahneman, D., 1973. “Availability: aheuristic for judging frequency and probability”. CognitivePsychology, 5, pp. 207–232.
[12] Ward, W. C., and Jenkins, H. M., 1965. “The display ofinformation and the judgment of contigency”. CanadianJournal of Psychology, 19, pp. 231–241.
7 Copyright c© 2012 by ASME

[13] Smedslund, J., 1963. “The concept of correlation in adults”.Scandinavian Journal of Psychology, 4, pp. 165–173.
[14] Vallee-Tourangeau, F., Hollingsworth, L., and Murphy,R. A., 1998. “’attentional bias’ in correlation judgments?smedslund (1963) revisited”. Scandinavian Journal of Psy-chology, 39, pp. 221–233.
[15] Tumer, I. Y., Stone, R. B., and Bell, D. G., 2003. “Require-ments for a failure mode taxonomy for use in conceptualdesign”. In International Conference On Engineering De-sign ICED 03 Stockholm.
[16] Kruger, J., and Dunning, D., 1999. “Unskilled and unawareof it: How difficulties in recognizing one’s own incompe-tence lead to inflated self-assessments”. Journal of Person-ality and Social Psycholgy Bulletin, 77, pp. 1121–1134.
[17] Hubbard, D. W., 2010. How to Measure Anything. Wiley.[18] Kahneman, D., 2011. Thinking, Fast and Slow. Farrar,
Straus and Giroux.[19] Tversky, A., and Kahneman, D., 1974. “Judgments un-
der uncertainty: Heuristics and biases”. Science, 185,pp. 1124–1131.
[20] Stamatis, D. H., 2003. Failure mode and effect analysis:FMEA from theory to execution. ASQ Quality Press.
[21] Kmenta, S., and Ishii, K., 2998. “Advanced fmea usingmeta behavior modeling for concurrent design of praductsand controls”. In Proceedings of DETC ’98, 1998 ASMEDesign Engineering Technical Conference.
[22] Lord, C. G., Ross, L., and Lepper, M. R., 1979. “Biasedassimilation and attitude polarization: The effects of priortheories on subsequently considered evidence”. Journal ofPersonality and Social Psychology (American Psychologi-cal Association), 37, pp. 2098–2109.
[23] Campbell, D. T., 1993. Systematic erros to be expected ofthe social scientist on the biasis of a general psychology ofcognitive bias. Cambridge University Press, pp. 25–41.
[24] Klein, G. A., 2008. “Performing a project premortem”. En-gineering Management Review, 36, pp. 103–104.
8 Copyright c© 2012 by ASME


![kkt_6_dan_7_pemupukan_2014 [Compatibility Mode]](https://static.fdokumen.com/doc/165x107/6322b43c28c445989105e2db/kkt6dan7pemupukan2014-compatibility-mode.jpg)


![Stephen Briggs [Compatibility Mode]](https://static.fdokumen.com/doc/165x107/6324c3005c2c3bbfa802dd10/stephen-briggs-compatibility-mode.jpg)