Strategies for Improving Reproductive Efficiency of Beef Cattle ...
Upload
khangminh22Category
view
0download
0
Department of Public Health and Clinical MedicineEpidemiology and Global Health Umeå University, Sweden 2012
1
Improving efficiency, access to and quality
of the rural Health Extension Programme
in Tigray, Ethiopia: the case of malaria
diagnosis and treatment
Photo by Hailemariam Lemma: Health post to reach the inaccessible (Beiru, Kukufto, Raya-Azebo, Tigray, Ethiopia),
Improving efficiency, access to and quality of the rural Health Extension Programme
in Tigray, Ethiopia: the case of malaria diagnosis and treatment
Hailemariam Lemma Reda

i
��������� ����������������������������� � �����������������������������������
����������������������������� ��������� �������������������
Hailemariam Lemma Reda
Umeå 2012
!��"�!���������#�������$�����������%�&�'������%��()*+���''%�,-)./..(3���'4%�*+5/*(/+)6*/)(5/5
$���������� ���7��������������8�������#���������������������9��7���������
!��"�!����������'�/*,(�5+�!��"��'&���
Department of Public Health and Clinical Medicine Epidemiology and Global HealthUmeå University, Swedenwww.umu.se
ii
Department of Public Health and Clinical MedicineEpidemiology and Global HealthUmeå UniversitySE-901 87 Umeå, Sweden
© Hailemariam Lemma Reda 2012Photo by Hailemariam Lemma Reda: Health post to reach the inaccessible (Beiru, Kukufto, Raya-Azebo, Tigray, Ethiopia).
Printed by Print & Media, Umeå University, Umeå, Sweden 2012: 01884

iii
Dedicated to our late parents
My mother Tiberh Gebrehiwot and my father Lemma Reda

iv

v
Abstract ............................................................................................................................ iOriginal papers ............................................................................................................... ivAbbreviations and acronyms ...................................................................................... v
1. INTRODUCTION.......................................................................................................... 1
1.1. Global malaria burden .................................................................................... 1 1.2. Malaria control initiatives ............................................................................. 2 1.3. Recent global progress in malaria control ................................................ 5
2. BACKGROUND ............................................................................................................ 7
2.1. Country profile .................................................................................................. 7 2.1.1. History and geography ...................................................................................... 7 2.1.2. Socio-economic situation.................................................................................... 8 2.1.3. Health status ....................................................................................................... 9 2.1.4. The heath system and the health extension programme (HEP) ....................... 11
2.2. Malaria in Ethiopia .......................................................................................... 14 2.2.1. Malaria epidemiology ........................................................................................ 14 2.2.2. Trends in malaria burden.................................................................................. 16 2.2.3. The national malaria control programme ....................................................... 17 2.2.4. Early diagnosis and rapid treatment of malaria under the HEP ................... 19
2.3. Tigray region ..................................................................................................... 20 2.3.1. Regional context ................................................................................................. 20 2.3.2. Health status and health care delivery system ................................................. 22 2.3.3. Malaria situation of the region ......................................................................... 23
3. RATIONALE OF THE STUDY...................................................................................... 25
4. AIM OF THE THESIS ................................................................................................... 27
4.1. Overall aim ......................................................................................................... 27 4.2. Specific objectives ............................................................................................ 27
5. THE CONCEPTUAL FRAMEWORK: ACCESS TO QUALITY HEALTH CARE ........................................................................................... 29
5.1. Linking the HEP and the research questions to the framework .......... 32
Contents

6. METHODS .................................................................................................................... 35
6.1. Study area ........................................................................................................... 35 6.2. Study design, sampling, data collection and analysis ............................ 36 6.2.1. Efficiency of the HEP and its determining factors (Paper I) ............................ 38 6.2.2. Cost-effectiveness of the three malaria diagnostic and treatment strategies (Paper II) ............................................................................ 40 6.2.3. Adherence to six-dose AL among uncomplicated P.falciparum patients and its determining factors (Paper III) ................................. 42 6.2.4. Feasibility and impact of deploying AL in combination with RDT at community level (Paper IV) ................................................................... 44
7. MAJOR FINDINGS ...................................................................................................... 47
7.1. Efficiency of the HEP (Paper I) ..................................................................... 48 7.2. Cost-effectiveness of malaria diagnosis and treatment strategies (Paper II) ............................................................................ 49 7.2.1. Characteristics of the subjects and microscope results ..................................... 49 7.2.2. Cost analysis and effectiveness indicator ......................................................... 49 7.2.3. Cost-effectiveness analysis (ACER and ICER) .................................................. 49
7.3. Adherence to the six-dose artemether-lumefantrine (Paper III) ....... 50 7.3.1. Characteristics of the patients ............................................................................ 50 7.3.2. Adherence level ................................................................................................... 51 7.3.3. Risk factors for adherence ................................................................................. 52
7.4. The use of AL with RDT at community level (Paper IV) ........................ 53 7.4.1. Impact on malaria morbidity (outpatient and inpatient) ................................ 53 7.4.2. Impact on malaria transmission ....................................................................... 54 7.4.3. Impact on malaria specific mortality ................................................................ 55 7.4.4. Impact on health care resource utilization ....................................................... 55
8. DISCUSSION ................................................................................................................ 57
8.1. The efficiency of the health extension programme ................................. 57 8.2. The cost-effectiveness of the current malaria diagnosis and treatment strategies ........................................................................................ 59 8.3. Provision of effective treatment is not sufficient: Adherence to the treatment regimen matters ....................................................................... 61 8.4. Improving access to manage malaria: Deploying AL with RDT at community level ......................................................................................... 63
9. METHODOLOGICAL CONSIDERATIONS ................................................................. 67
10. CONCLUSION AND RECOMMENDATIONS ............................................................. 69
ACKNOWLEDGEMENTS .................................................................................................. 71
REFERENCES .................................................................................................................... 75
PAPER I–IV ........................................................................................................................ 85

Abstract
Introduction: Ensuring universal access to primary health care (PHC) is a key component of the Ethiopian national health policy. The policy also emphasises promoting and enhancing national self-reliance in health development by mo-bilizing and efficiently utilizing resources including community participation. To this end, the government introduced the accelerated expansion of the PHC strat-egy through a comprehensive health extension programme (HEP). HEP is a family and community-based health care delivery system institutionalised at health post level which combines carefully selected high impact promotive, pre-ventive and basic curative interventions. All HEP interventions are promotive and preventive except the malaria intervention which, in addition, incorporates a curative service. In the country, malaria is a leading disease. Unlike most Sub-Saharan African countries where P. falciparum accounts for almost all malaria infections, in Ethiopia both P. falciparum and P. vivax are co-dominant. Con-sidering this peculiar epidemiological nature, the national guideline recommends alternative diagnosis and treatment strategies.
Rationale: The lack of adequate resources and the efficiency with which avail-able resources are being utilised are the main challenges in any health care setting. Therefore, if the HEP which consumes consideral amount of resource desires to reach its intended goal, monitoring and improving its efficiency is of great pub-lic heath importance. HEP has been successful in improving access to PHC in-cluding the malaria diagnosis and treatment service. Though this is a crucial measure, its quality ought to be considered. For the malaria curative service, studying the cost-effectiveness of the available strategy and patients’ adherence to the treatment regimen can be considered as proxy measures of quality for which local evidence is lacking. However, none of the existing studies in this field of research has addressed the Ethiopian malaria epidemiological context and its diagnosis and treatment guideline. In Tigray, for more than two decades, access to malaria early diagnosis and prompt treatment was facilitated by volunteer community health workers (CHWs). However, with the introduction of ar-temether-lumefantrine (AL) the service was compromised mainly for reasons of cost, safety and logistic. Therefore, it was important to explore the feasibility and the impact of community deployment of AL with rapid diagnostic tests (RDTs).
The aim: to explore the overall performance of HEP and particularly the access to and quality of malaria early diagnosis and prompt treatment in the Tigray region of Ethiopia.
Methods: Different study designs and populations were used for each of the four specific objectives. Data envelop analysis (DEA) was applied to assess the

HEP efficiency. For this, register data for the output variables and primary data for the input and the environmental factors were collected. A health provider perspective cost-effectiveness analysis was used to determine which among the currently available diagnostic and treatment strategies is best for the country. Effectiveness data were generated from a stratified cross-sectional survey and secondary data were used to calculate the cost. For measuring adherence to the six-dose AL regimen, an assessment questionnaire and pill count was employed at patients´ home. To determine whether deploying AL with RDT at community level was feasible and effective, a number of designs were used: longitudinal follow-up, cross-sectional surveys, cost analysis, verbal autopsy questionnaires and focal group discussions.
Main findings: More than three-quarters of the health posts were found to be technically inefficient with an average score of 42%, which implies potentially they could improve their efficiency by 58%. Scale of operation was not a cause of inefficiency. None of the considered environmental factors was associated with efficiency. The Parascreen-based strategy (multispecies RDT-BS) was found to be the most cost-effective strategy, which allowed treating correctly an addi-tional 65% of patients with less cost than the paracheck-BS. Presumptive-BS was highly dominated. Among P. falciparum positive patients to whom AL was pre-scribed, more than a quarter did not finish their treatment. The main reasons for interrupting the dose were ‘too many tablets’ and ‘felt better before finishing the dose’. The ownership of a radio, the belief that malaria cannot be treated tradi-tionally and a delay of more than one day in seeking treatment after the onset of fever were significantly associated with being adherent. Deploying AL with RDT at community level was demonstrated to be effective and feasible. In the inter-vention district, almost 60% of suspected cases were managed by CHWs. Ma-laria transmission was lower at least threefold and malaria mortality risk by around 40% compared to the control district. The use of RDTs reduced cost and possibly the risk of drug resistance development.
Conclusion: Though improving access to health care is important, it should be considered a means, not an end. The more accessible a system is the more people could utilise it to improve their health. Thus, ensuring the access obtained through HEP is maintained, its quality is improved and efficiently utilised to its optimal productivity level is a necessary task. The DEA study revealed a high level of inefficiency where majority of the health posts needed improvement. This thesis also found parascreen-BS to be the most cost-effective strategy and that there is no epidemiological and economical contextual justification to keep both, the presumptive-BS and the RDT-BS specific only to P.falciparum. The high poor adherence levels raises great concern as it leads to recurrent malaria attacks of the patient, speed up the development and spread of drug resistance strains and

reduces the effect of the drug on the transmission. Therefore, providing effective drug alone is not sufficient; assessing and monitoring adherence to the treatment is by far essential. Deployment of AL with RDT through a community-based service has shown an enormous impact in terms of cost, transmission, morbid-ity and mortality. However, it is worth noting that this results came from an area where a community-based service has been involved in the PHC system for more than three decades.
Key words: Health extension programme, Malaria, Rapid diagnostic test, Acess health care, Efficiency, Cost-effectiveness, Adherence, Community health worker.

Original papers
This thesis is based on the following four publications which will be referred to by their Roman numerals (I–IV) in the text.
I. Sebastian MS, Lemma H: Efficiency of the health extension pro-gramme in Tigray, Ethiopia: a data envelopment analysis. BMC Int Health Hum Rights 2010, 10:16.
II. Lemma H, San Sebastian M, Löfgren C, Barnabas G: Cost-effectiveness of three malaria treatment strategies in rural Tigray, Ethiopia where both Plasmodium falciparum and Plasmodium vivax co-dominate. Cost Eff Resour Alloc 2011, 9:2.
III. Lemma H, Löfgren C, San Sebastian M: Adherence to a six-dose regi-men of artemether-lumefantrine among uncomplicated Plasmo-dium falciparum patients in the Tigray Region, Ethiopia. Malar J 2011, 10:349.
IV. Lemma H, Byass P, Desta A, Bosman A, Costanzo G, Toma L, Fottrell E, Marrast AC, Ambachew Y, Getachew A, Mulure N, Morrone A, Bianchi A, Barnabas GA: Deploying artemether-lumefantrine with rapid test-ing in Ethiopian communities: impact on malaria morbidity, mortality and health care resources. Trop Med Int Health 2010, 15(2):241-50*.
* The original paper has been reprinted with the permission from the publisher. (License Number: 2827041463573). Others are open accessed journals.

Abbreviations and acronyms
ACER Average cost-effectiveness ratioACT Artemisinin-based combination therapyAL Artemether lumefantrineaOR Adjusted odds ratioCBMCP Community-Based Malaria Control ProgrammeCHW Community health workerCQ ChloroquineCRS Constant return to scaleCSA Central statistics agency CTC Correctly treated casesDALYs Disability Adjusted Life YearsDEA Data envelopment analysisDMU Decision-making unitsDNA Definitely Non-adherentDRS Decreasing return to scaleEDHS Ethiopia demographic and health surveyFMoH Federal Ministry of HealthGMEP Global Malaria Eradication programmeHEP Health Extension ProgrammeHEW Health Extension WorkerHMM Home-based management of malaria HSDP Health Sector Development ProgrammeICER Incremental cost- effectiveness ratioInterVA Interpreting Verbal AutopsyIRR Incidence rate ratiosIRHS Indoor residual house sprayingIRS Increasing return to scaleITNs Insecticide-treated netsLLIN Long lasting insecticidal treated netMasl Meters above sea levelMbsl Meter below sea levelMCP Malaria Control Programme

MDGs Millennium Development GoalsP. falciparum Plasmodium falciparumP. vivax Plasmodium vivaxPA Probably adherentPHC Primary Health CarePHCU Primary Health Care UnitPNA Probably non-adherentPPP Purchasing Power ParityRBM Roll Back MalariaRDT Rapid diagnostic testRHB Regional Health BureauSE Scale efficiencySP Sulphadoxine-pyrimethamineSPR Slide positivity rateSSA Sub-Saharan AfricaTE Technical efficiencyTHB Tigray Health BureauUNDP United Nations Development ProgrammeUNFPA United Nations Population Fund UNICEF United Nations Children’s FundVA Verbal autopsyVCHWs Volunteer community health workersVRS Variable return to scaleWHA World Health AssemblyWHO World Health Organization

INTRODUCTION
1
1. INTRODUCTION
1.1. Global malaria burdenMalaria is a global public health problem with approximately 40% of the world population at risk of the disease. It has been consistently reported about 300-500 million malaria cases each year globally [1-2]. In the last decade, as the result of an increased coverage of malaria control interventions, substantial reductions in the disease burden have been registered. However, the disease still continues to challenge our 21st century civilization. The recent global estimate from the World Health Organization (WHO) indicated that there were 225 million ma-laria cases with more than 780,000 deaths world-wide in 2009. Almost half of the malarious countries are located and about 90% of the global malaria incidence and death, mostly in children, are occurring in Sub-Saharan Africa (SSA) with the remaining in Southeast Asia [3] (Map 1).
Though malaria is a curable and preventable disease, the human impact is tragic, and the social and economic effects are tremendous. These include both direct costs for treatment and prevention at household and health service level, as well as indirect costs such as productivity lost from morbidity and mortality, diversion of household resources to the care of patients, and reduced school at-tendance and impaired learning [4]. In endemic countries, the disease has been accounted for as high as 25-40% of hospital admissions, up to 20-50% of outpa-tient visits and consumes up to 40% of the total government spending on public health and 25% of household incomes [5-6].
Malaria is commonly recognized as a disease of poverty which disproportion-ately exerts its toll on the poorest and most marginalized populations [7,8]. On the basis of country-level data, Gwatkin and Guillot estimated that 58% of all deaths from malaria in the world in 1990’s occurred among the poorest 20% of the world’s population [7]. A growing body of evidence suggests that a dual causa-tion runs in both directions: poverty sustains the conditions where malaria thrives, and malaria impedes economic growth and keeps communities in poverty; thus, these households are trapped in vicious cycles [8]. As a consequence, the disease hinders the economic development of dozens of poor nations. Overall, the total economic burden in SSA is estimated to be at US$ 12 billion annually leading to slow down the economic growth by 1.3% per year [8-11]. Globally, without count-ing the burden due to morbidity, the Disability Adjusted Life Years (DALYs) lost due to malaria mortality alone is almost 3%, more than 10% in Africa [12].

INTRODUCTION
2
2
in the world in 1990’s occurred among the poorest 20% of the world’s population [7].
A growing body of evidence suggests that a dual causation runs in both directions:
poverty sustains the conditions where malaria thrives, and malaria impedes economic
growth and keeps communities in poverty; thus, these households are trapped in
vicious cycles [8]. As a consequence, the disease hinders the economic development
of dozens of poor nations. Overall, the total economic burden in SSA is estimated to
be at US$ 12 billion annually leading to slow down the economic growth by 1.3% per
year [8-11]. Globally, without counting the burden due to morbidity, the Disability
Adjusted Life Years (DALYs) due to malaria mortality alone is almost 3%, more than
10% in Africa [12].
Map 1. Global distribution of malaria transmission risk (Source: Shrinking the malaria map: a prospectus on malaria elimination, 2009).
1.2. Malaria control initiativesCognizant its devastating effect, several global and national efforts, initiatives and approaches have been made in fighting against this deadly disease over the years. In the 1950s, the 8th World Health Assembly (WHA) launched the Global Ma-laria Eradication programme (GMEP) (1955-1968) in all malarious countries in the Americas and Europe, and in the majority of countries of Asia and Oceania [13-14]. While its ambitious goal was never met, the GMEP achieved to eliminate malaria from 37 of the 143 malaria-endemic countries, and from two continents: Europe and Oceania [15]. Main reasons for failure were unmet social, administra-tive and political conditions including financial crisis, limited experience, and lack of scientific resources to adapt to the great epidemiological variety.
The re-examination of this strategy led to the 22th WHA Boston resolution (1969-1977) where it was decided that malaria control with the available means should be the approach for countries where the eradication campaign did not appear to be feasible while reaffirmed eradication as the ultimate goal. Socio-economic constraints (poor access to health care, limited financial and human resources,
Map 1. Global distribution of malaria transmission risk(Source: Shrinking the malaria map: a prospectus on malaria elimination, 2009).

INTRODUCTION
3
refusal and poor structure for indoor residual spraying and replastering of sprayed wall), the biological changes (the emergence of vector and parasite resistances), and the ecological diversity (climatic and environmental changes including un-controlled development of irrigation and deforestation) led to the 31st WHA resolution in 1978 on malaria control to align it with the Alma-Ata declaration on Primary Health Care (PHC).
The fundamental element of this adoption was the recognition of the variability of the epidemiological situations, the feasibility of their modification and the availability of resources, and therefore the need to adapt malaria control planning to local contexts. Further, the continued monitoring of the strategies showed a general deterioration of the global malaria situation (trigged by parasite and vector resistance, conflict, displaced population, agricultural development and resource exploitation in the forest) and a great focalization of malaria in SSA and other areas with limited socio-economic development. In continuation of the effort (1992- ), the current working revised Global Strategy for Malaria Control programme (MCP) was adopted by the Ministerial Conference on Malaria Control in Amsterdam in 1992.
The objective of the strategy was to prevent mortality and reduce morbidity and socioeconomic loss using the following four basic strategic elements:• To provide access to early diagnosis and prompt treatment; • To plan and implement selective and sustainable preventive measures
including vector control;• To early detect, contain or prevent epidemics; and• To strengthen the local health systems capacity.
The strategy recognized that there is no single prescription applicable to all situ-ations and that, therefore, interventions should be adapted to local conditions. The selection of the specific intervention in any area should be guided by the progressive understanding of the ecological, epidemiological and socioeconom-ic context, and the level of development of the health service on which the ef-fectiveness and feasibility of its application would depend. Based on decades of practical lessons from previous efforts, the strategy was firmly rooted in the PHC approach. For effective implementation, the strategy called for sustained politi-cal commitment at all levels, integration with the health system, coordination with other non-health sectors, full community participation and adequate human and financial resources [13, 16].
As malaria continued to make its highest strike in Africa, in 1997 African Heads of State made a call (Harare Declaration on malaria control) for international support to counter the intolerable tragedy from this disease [17]. In response to

INTRODUCTION
4
this call, a joint force among the WHO, the United Nations Children’s Fund (UNICEF), the United Nations Development Programme (UNDP), and the World Bank launched the Roll Back Malaria (RBM) Partnership in 1998 with the aim of mobilizing and coordinating a broad-based and comprehensive effort against the disease. The emphasis was to ensure that people at risk of malaria could have access to and use of effective malaria control tools. In 2010, the partnership had increased to more than 500 members, including malaria endemic countries, their bilateral and multilateral development partners, the private sector, non-govern-mental and community-based organizations, foundations, and research and academic institutions that bring a massive assembly of expertise, infrastructure and funds into the fight against the disease [18].
The Roll Back Malaria strategies, which are built on the WHO global malaria control strategy, have the following six elements: i) early diagnosis and rapid treatment of those who are ill; ii) multiple and cost-effective means of preventing infection; iii) evidence based decisions; iv) focussed research to develop and test, and introduce new products; v) a well coordinated action through stronger capac-ity to health sector and community-level effort; and vi) a dynamic global partner-ship working within a common approach [19]. RBM is committed to halve the number of malaria cases and deaths recorded in 2000 by 2010 and again by 2015.
Current key RBM interventions to implement the global strategies include: i) the protection of people at risk from malaria using locally appropriate vector control methods such as insecticide-treated nets (ITNs) and indoor residual house spray-ing (IRHS), and ii) the treatment of malaria patients with effective antimalarial medicines, e.g. artemisinin-based combination therapy (ACT) within one day of the onset of illness [20]. Welcoming the RBM initiatives, in the Abuja Summit, April 2000, African leaders committed to ensure the principal interventions with at least 60% coverage each, by the end of 2005 so as to convene the global move-ment [21]. Again, in 2006, in the Abuja Call, African Union governments renewed their commitment to the goals of the Abuja Summit, calling for accelerated action toward universal access to malaria interventions [22]. RBM in its latest Global Malaria Action Plan (2008) is committed to reduce global malaria deaths to near zero ‘preventable deaths’ in 2015. To achieve the above goals, it has intended to reach an universal coverage of ≥ 80% of the population at risk with the key ma-laria interventions by the end of 2010 [20, 23].
Malaria has been also recognized as a major impediment factor of development by the United Nations’ Millennium Development Goals (MDGs) summit which aimed in its goal number six to halt and reverse its incidence by 2015 [24]. The MDG initiative recognizes that the reduction of malaria will have a significant role on achieving the other MDGs. Malaria contributes to keep poor people poor (to

INTRODUCTION
5
eradicate extreme poverty and hunger, MDG 1), causes school absenteeism and neurological and cognitive damage in children (to achieve universal primary edu-cation, MDG 2), accounts for 20% of all child deaths in Africa (to reduce child mortality, MGD4), strikes pregnant women four times higher than other adults (to reduce maternal mortality, MDG 5), and predispose people living with HIV/AIDS of contracting the infection (to combat HIV/AIDs, malaria and other dis-eases, MDG 6) [25].
1.3. Recent global progress in malaria controlOver the past few years there have been improvements in the coverage of the malaria control interventions. In its recent World Malaria Report 2010, the WHO estimated that by the end of that year, 76% of population at risk of malaria in SSA would be covered by ITNs or long lasting insecticidal nets (LLINs). Surveys carried out between 2007 and 2009 in some endemic countries indicated that household ITN ownership rate had reached more than 50% with a median per-centage of 45% of the children < 5 years of age sleeping under an ITN. IRHS programmes have also expanded considerably in recent years, corresponding to protect for approximately 10% of the population at risk in 2009 [3]. In 2008, most endemic countries (88 out of 106) reported having a policy of parasito-logical testing of suspected malaria cases in persons of all ages before treatment was started. The percentage of suspected cases receiving a parasitological diag-nosis in SSA has been estimated to increase from 5% at the beginning of the decade to 35% in 2009. In 2010, the number of countries which reported a policy of treatment with an artemisinin-based combination therapy for Plasmo-dium falciparum (P. falciparum) malaria reached 77 (of 86 countries endemic for P. falciparum) while 25 countries are still allowing the monotherapy despite the WHO recommendation of combination therapy [3].
Coinciding with this expanding coverage of anti-malarial interventions, in the last decade the burden of the disease has started to declined substantially [26]. According to the above report global malaria deaths have been estimated to reduce by 21%. In eleven African countries, an estimated reduction of more than 50% in either confirmed malaria cases or malaria admissions and deaths has been observed. Malaria control measures saved an estimated 1.1 million lives in SSA. In more than half (55%) of the non African malaria-endemic countries (32 out of 56 countries), an estimated decrease of more than 50% in the number of con-firmed malaria cases was observed [3, 27].
These achievements and experiences of the past few years have inspired many governments of malaria-endemic countries and major international donors to move from control to elimination . According to the WHO, thirty-nine countries

INTRODUCTION
6
1 Malaria control: reducing the disease burden to a level at which it is no longer a public health problem.2 Malaria elimination: interrupting local mosquito-borne malaria transmission in a defined geographical
area, i.e. zero incidence of locally contracted cases, although imported cases will continue to occur. Continued intervention measures are required.
with low-intensity malaria transmission are making progress from control to elimination, either nationwide or through spatially progressive elimination [28].
Despite these all good achievements, to pursue the malaria elimination in SSA where the disease accounts for more than 90% of the disease burden requires more resource and effort than ever. In some SSA countries (Rwanda, Sao Tome and Principe, and Zambia) which had progressed well in the past years, failure to sustain malaria control has resulted in the resurgence of malaria [3]. This indicates that the fragility of malaria control in poor setting requires additional, novel control tools. Until the disease reaches a level where it will not be a major public health problem, miserably it will continue biting the life and the economy of poor people in poor countries.

7
BACKGROUND
2. BACKGROUND
2.1. Country profile 2.1.1. History and geographyEthiopia (ancient name ”Abyssinia”) is one of the world’s ancient civilizations. The country is known as the earliest home of humankind, where the famous Australopithecus afarensis, a 3.2 million years old fossil was found [29]. It is also one among the oldest states. The Axumite Empire, the first Ethiopian king-dom which achieved prominence by the 1st century AD was based on the northern part of Ethiopia, the present Tigray region. Axsum, during the 4th century, became the first major empire to convert to Christianity and was one of the four great powers of its time along with Persia, Rome, and China. The country is alleged the resting place of the Ark of the Covenant and the purported home of the Queen of Sheba. Axum is also known in Islamic history as the place for the First Hijra and the oldest Muslim settlement in Africa at Negash (Tigray) [30].
The country is also known for its unique calendar and script. Ethiopia uses the Julian calendar which divides the year in 12 months of thirty days each, with the remaining five (or six) days constituting the short 13th month of Pagume. The calendar is about eight years behind the Gregorian calendar [31]. Ethiopia is among few countries which have their own script, the Ge’ez script, dated from 5th-6th BC to the present [32]. Ethiopia is the only African country that retained its independence even during the colonial era and one of the only four African members of the League of Nations.
Ethiopia, located in East Africa (horn of Africa), lies between 30 and 150 north latitude and 330 and 480 east longitude (Map 2). With an estimated total area of 1.1 million square kilometres, it is the tenth-largest country in the continent. It is a country with a great topographic, geographic and climatic diversity. Its topo-graphic features range from the highest peak of Ras Dashen, 4,620 meters above sea level (masl), down to the Danakil depression, 110 meter below sea level (mbsl).
Altitude-induced climatic conditions is the basis for the three broad ecological zones in the country —hot, temperate, and cool— which have been known to Ethiopians since antiquity as the ‘Qolla’, the ‘Woyena Dega’ and the ‘Dega’, respec-tively. The ‘Qolla’ (including ‘Bereha’—extreme form of ‘Qolla’) refers to lowlands below 1,500 masl, the ‘Dega’ (including ‘Wurch’ and ‘Kur’—extreme cool) to high-lands above 2,300 masl and the ‘Woyena Dega’comes in between (Map 2) [33-35].

8
BACKGROUND
Two rainy seasons are known in the country: the big rain occurring roughly from June to August (‘Kiremt’) with most rains falling in June-July and the small rain occurring from March to May (‘Belg’). Most areas in the country experience the ‘Kiremt’ rain while the ‘Belg’ rain covers less area. Some areas in the northwest have more rainy seasons [35]. Irregularity of rainfall is a characteristic of Ethiopia´s climate and the country is prone to recurrent droughts and famines.
2.1.2. Socio-economic situation The current political structure of the country is formulated based on the 1991 constitution. The constitution established a federal system of government with nine regional states and two city administrative councils. The regional states as well as the two city councils are divided into districts (woredas) and districts into sub-districts (named as tabia in Tigray and kebele in other regions). Tabias are further divided into kushets in rural areas or ketenas in towns. The role of the federal government is limited to directing the country’s fiscal, defence, and foreign affairs and articulating the economic and social policies. The national regional states have responsibilities for the legislative and administrative functions [36].
10
great topographic, geographic and climatic diversity. Its topographic features range
from the highest peak of Ras Dashen, 4,620 meters above sea level (masl), down to
the Danakil depression, 110 meter below sea level (mbsl).
Altitude-induced climatic conditions is the basis for the three broad ecological zones
in the country —hot, temperate, and cool— which have been known to Ethiopians
since antiquity as the ‘Qolla’, the ‘Woyena Dega’ and the ‘Dega’, respectively. The
‘Qolla’ (including ‘Bereha’—extreme form of ‘Qolla’) refers to lowlands below 1,500
masl, the ‘Dega’ (including ‘Wurch’ and ‘Kur’—extreme cool) to highlands above
2,300 masl and the ‘Woyena Dega’comes in between (Map 2) [33-35].
Map 2. Map of Ethiopia showing the topography and climate of the country (Source: Atlas of the Ethiopian Rural Economy, 2006, International Food Policy Research Institute, Washington, DC, USA and the Central Statistical Agency, Addis Ababa, Ethiopia).
Two rainy seasons are known in the country: the big rain occurring roughly from June
to August (‘Kiremt’) with most rains falling in June-July and the small rain occurring
from March to May (‘Belg’). Most areas in the country experience the ‘Kiremt’ rain
Map 2. Map of Ethiopia showing the topography and climate of the country (Source: Atlas of the Ethiopian Rural Economy, 2006, International Food Policy Research Institute, Washington, DC, USA and the Central Statistical Agency, Addis Ababa, Ethiopia).

9
BACKGROUND
Public service delivery, including health care has, to a large extent, fallen under the jurisdiction of the regions. Further, decision making power is decentralized to woredas which are the basic units of planning and political administration [34].
Based on projections from the 2007 census (1999 Ethiopian calendar), the total population of Ethiopia was estimated to reach 82.4 million by July 2011. This makes the country the second most populous in the continent after Nigeria. A very large proportion of the population (84%) lives in the rural areas making Ethiopia one of the least urbanized countries in the world. The proportion of male/female population is almost equal (50.5/49.5). The population age-sex structure is typical of developing countries. About 45% is comprised by those under the age of 15 years, 52% between the age of 15 and 64 years and 3% are aged 65 years and above. The population grew at an average annual rate of 2.6% between 1994 and 2007—a decrease of 0.2% from the preceding census (1984-1994) [37].
The country has remained backward in socio-economic and political develop-ment, as well as in technological advances. Nonetheless, in recent years, it has started to show a promising progress. The UNDP Human Development Report 2010 classified the country among the top mover countries that have made the greatest progress in improving the Human Development Index. This index com-bining income, schooling and life expectancy, reached 0.328 compared to 0.250 in 2000 [38]. The country’s estimated annual gross national income per capita improved to US$390 (PPP $, 1,030) in 2010, though it is still much lower than the low-income countries average (US$ 512, Atlas method) [39]. The primary school (grades 1-8) gross enrolment rate reached 95.9% by 2009/2010. Accord-ing to the World Health Statistics 2010 report, the average life expectancy at birth has been improving from 48 years in 1990 to 58 (57 and 60 years for males and females, respectively) in 2008 with a healthy life expectancy at birth of 50 years [40]. Overall, in the last seven consecutive years (2003/04-2009/10), Ethiopia´s economy grew on an average of 11% which is well above the 7% growth rate es-timate required to achieve the goal of halving poverty by the year 2015 [41].
2.1.3. Health status Despite some improvements, the country has still one of the poorest health sta-tuses among the low-income countries. Conventional health parameters such as infant, child and maternal morbidity and mortality from communicable dis-eases (diarrhoea, acute respiratory infections, neonatal problems HIV, TB and malaria) and malnutrition or combination of these, place Ethiopia among the least privileged nations in the world [42]. Widespread poverty, inadequate access to clean water and sanitation facilities, insufficient health care services, pervasive

10
BACKGROUND
illiteracy, inadequacy of essential drugs and supplies, low health service utiliza-tion and harmful traditional practices are major contributors to the high burden of ill-health in the country [34].
According to the WHO, UNICEF, UNFPA, and World Bank estimation, in 2008 the maternal mortality ratio was 470/100,000 live births which is among the world’s highest [43]. The most recent Ethiopia demographic and health survey (EDHS, 2010) and other reports have estimated the under-five mortality rate at 88/1,000 live births while the infant mortality rate at 59/1,000 live births [41, 44]. Two-thirds of all deaths in children under-five took place before a child’s first birthday. Malnutrition, which is widespread across the country, remains highly prevalent particularly among children and mothers. According to the same report, of all children under age five, 44.4% were stunted (height-for age) and 28.7% were underweight (weight-for-age) [44].
Tuberculosis in Ethiopia is a major health problem and the country ranks 7th among the top twenty-two TB high burden countries in the world and one of the top three in Africa with regard to the estimated incident cases. The incidence rate of all forms of TB was estimated at 261/100,000 population and its preva-lence at 394/100,000, with a mortality rate of 35/100,000. Despite the encour-aging progress on HIV/AIDS prevention the disease is continue to challenge the nation. The adult (15-49 years old) HIV incidence was estimated to be lowered to 0.28% in 2009/2010 compared to 0.68% in 2005/06 and the single point HIV prevalence estimate has been reduced from 3.5% to 2.1% in the same period, which is below the SSA average of 4.9% [41, 45].
The country’s health allocation and expenditure remains low. In 2009/10, the total health expenditure (the sum of public and private health expenditure) as percentage of the gross domestic product reached 4.5%, which is closer to the WHO bottom line of 5%. In the same year, the percentage share of the health budget from total government budget was 10.4 %, which is slightly higher than both, the African region (9.6%) and the low-income countries (8.7%). Though, the per capita national health expenditure (health spending) grew to US$16.1 in 2007/08, it is still too far from the US$34 recommended by the WHO Commis-sion for Macroeconomics and Health [45-46].
Realizing the low health status and recognizing that health is not only a priority in its own right, but also a central input into economic development and pov-erty reduction, in 2004 the Ethiopia government decided to strengthen its pri-mary health care system with the implementation of an innovative strategy known as the Health Extension Programme (HEP) [47]. This innovative programme is believed to play a massive role in achieving the current progress.

11
BACKGROUND
2.1.4. The heath system and the health extension programmeThe health care delivery system in Ethiopia has been traditionally highly central-ized, with most service delivery taking place in urban centers while the most in need, the rural majority, having limited access. The National Health Policy en-dorsed in 1993 committed to fulfil the needs of the less-privileged majority rural population focusing on the development of effective preventive, promotive and curative services of health care. It also emphasized on the democratization and decentralization of the health system, ensuring access of health care to all the population, promoting and enhancing national self-reliance in health develop-ment by mobilizing and efficiently utilizing internal and external resources in-cluding community participation [34, 48].
To guide the implementation of the National Health Policy, the government has developed a twenty-year Health Sector Development Programme (HSDP) since 1997/98, following a set of rolling five-year plans. HSDP serves as a comprehen-sive national plan and as a guiding framework for further regional and district detailed planning and implementation activities. To achieve the policy objectives, a four-tier system (changed to a three-tier since 2011) was found to be appropri-ate to the nature, magnitude and root causes of the existing health problems in the country. The system included a Primary Health Care Unit (PHCU), a district (primary) hospital, a zonal (general) hospital and a specialized (referral) hospi-tal. A PHCU is the grass-root level, which gives essential promotive, preventive and basic curative health services; it comprises one health center and five satel-lite health posts. A health post is planned to serve to 5,000 people, a health center to 25,000, a district hospital to 100,000, a zonal hospital to 1,000,000 and a specialized hospital to 5,000,000 people [34, 49].
Decentralization of the health care system is one basic strategic element of the policy; thus, fundamental steps have been taken in regard to power sharing and division of responsibilities. The main role of the Federal Ministry of Health (FMoH) is directed to function more on policy and guideline matters, resource mobilization, capacity development, monitoring and evaluation and technical support. Regional Health Bureaus (RHBs) are responsible to adapt policies and guidelines to the local situation, to plan, monitor and evaluate the performance of the health system, to conduct operational research and to provide technical assistance to the districts. Districts are the main implementers. Decision making processes are shared between the FMoH and the RHBs and between the RHB and the Districts Health Offices [34, 49].
A key component of the national policy is ensuring universal access to PHC and equity of essential health care to all segments of the population [48]. Cognizant

12
BACKGROUND
17
local health system [50]. All HEP interventions are promotive and preventive except
the malaria intervention which, in addition, incorporates diagnosis and treatment [51-
52].
Box 1. Components of the Health Extension Package (the agrarian package)
At the core of the HEP, there are cadres of female Health Extension Workers
(HEWs), originally coming from the community where they are working. In the urban
areas, these are former nurses additionally trained for three months on the HEP
packages while in rural areas, they are high school graduates with one year training.
Pastoralist HEWs are employed regardless of their educational level.
HEWs main task is to transfer knowledge and skill to the families using three
approaches: model families, community-based health packages and health posts. In
the first approach, HEWs identify and train model families that have been involved in
other development work, and /or that have the acceptance and credibility of the
Disease Prevention and Control • HIV/AIDS and other sexually transmitted infections (STIs) and TB
prevention and control • Malaria prevention and control • First Aid emergency measures
Family Health • Maternal and child health • Family planning • Immunization • Nutrition • Adolescent reproductive health
Hygiene and Environmental Sanitation • Excreta disposal • Solid and liquid waste disposal • Water supply and safety measures • Food hygiene and safety measures • Healthy home environment • Control of insects and rodents • Personal hygiene
Health Education and Communication
Box 1. Components of the Health Extension Package (the agrarian package).
this policy vow, in 2004 the government introduced, the accelerated expansion of the PHC strategy through a comprehensive HEP and the expansion of health centers. HEP is a family and community-based health care delivery system in-stitutionalized at health posts combines carefully selected high impact promotive, preventive and basic curative interventions. It is designed to be implemented with full involvement of the households and communities, using local technolo-gies and the communities’ skills and wisdom. The philosophy of the HEP is that if the right knowledge and skills are transferred to the communities and house-holds, they can produce and maintaining their own health in a way that is simi-lar to their experience in producing agricultural goods or products [50]. This programme is considered, not only as a key measure for ensuring basic health care coverage and equity, but also in achieving the health–related MDGs, par-ticularly MDGs 4, 5 and 6.
The HEP, which was originally designed for the agrarian community, is now tuned to fit the needs, demands and expectations of the urban and pastoralist communities. The agrarian programme is a package of sixteen interventions while the urban is a package of fifteen which are categorized into four thematic

13
BACKGROUND
areas. The rural thematic areas include disease prevention and control, family health, hygiene and environmental sanitation and health education and com-munication (Box 1). In urban areas, the last theme is substituted by accident prevention, first aid and referral. The pastoralist package is minimized in accord-ance to the level of the performance capacity of the local health system [50]. All HEP interventions are promotive and preventive except the malaria intervention which, in addition, incorporates diagnosis and treatment [51-52].
At the core of the HEP, there are cadres of female Health Extension Workers (HEWs), originally coming from the community where they are working. In the urban areas, these are former nurses additionally trained for three months on the HEP packages while in rural areas, they are high school graduates with one year training. Pastoralist HEWs are employed regardless of their educational level.
HEWs main task is to transfer knowledge and skill to the families using three approaches: model families, community-based health packages and health posts. In the first approach, HEWs identify and train model families that have been involved in other development work, and /or that have the acceptance and cred-ibility of the community, as early adopters of desirable health practices to become role models. Model families help diffuse health messages leading to the adoption
Figure 1. Trends in the cumulative number of health post constructed and number of HEWs trained and deployed, Ethiopia, 2005/06-2009/10 (Source: Constructed from the data FMoH 2009/10 annual report).

14
BACKGROUND
of the desired practices and behaviours by the community. In the second ap-proach, HEWs communicate health messages by involving the community from the planning stage all the way till the evaluation. In the third approach, HEWs provide antenatal care, delivery, immunization, growth monitoring, nutritional advice, family planning, malaria treatment and referral services [50]. To accom-plish these activities, HEWs work closely with the community health agents and traditional birth attendants.
The HEP has been well implemented throughout the country. All over the coun-try, the cumulative number of rural HEWs (not including urban and pastoral HEWs) trained and deployed increased from 9,900 in 2005/06 to 34,382 in 2009/10 (accounting for 98.07% of the total rural requirement). The cumulative number of health posts constructed also increased from 6,191 in 2005/06 to 14,192 in 2009/10 (Figure 1) [45].
2.2. Malaria in Ethiopia2.2.1. Malaria epidemiology Despite the long history of malaria eradication and control since the 1950s, ma-laria is still a major public health problem in the country. An estimated three-fourth of the landmass is potentially malarious and more than two third (68%) of the population is residing in this area [33, 53-54].
Malaria transmission in the majority of the country is seasonal and predomi-nantly unstable and hypoendemic to mesoendemic. The transmission and inten-sity vary with altitude, rainfall and population movement. Following the broad ecological zones in the country (see section 2.1); there are four major eco-epide-miological malaria strata. These are: malaria-free highlands where no local transmission exist (above 2,500 masl), epidemic-affected highland-fringe areas (between 1,500 and 2,500 masl), seasonal-transmission areas (lowland areas below 1,500 masl), and malaria-stable areas (limited to the western lowlands and river basins) (Map 3) [55]. Malaria transmission in the country is usually limited to areas below 2000 masl. During epidemic years, it climbs to ‘Dega’ areas up to 2500 masl; otherwise this stratum is too cool to support (mean temperature below 160C) the parasite survival and the development of the vector [54].
In the country, there are two malaria transmission seasons (bimodal pattern of transmission) which follows the temperature and relative humidity after the rainy seasons for the development of both the vector and the extrinsic parasite. From September to November is the major transmission season following the main rains of ‘Kiremt’. A second minor transmission season occurs from April to May

15
BACKGROUND
which is limited and restricted to areas receiving the short ‘Belg’ rains. In the Western part of the country and in specific areas with permanent water bodies, the transmission may last more than six months [33]. The malaria epidemiology in Ethiopia is peculiar and different from large parts of SSA. Firstly, the unstable nature of the transmission makes the population non-immune and prone to focal outbreaks and cyclic epidemics. This unstable nature also accounts to the fact that all age groups are at risk of the disease and all malaria infections even with low-level parasitaemia are associated with clinical illness. Secondly, unlike most SSA countries where P. falciparum accounts for almost all malaria infections, in Ethiopia both P. falciparum and P. vivax are co-dominant, where the former accounts for approximately 60% of all cases. In the low transmission season, P. vivax increases its proportion due to its relapsing nature and the seasonal drop in P. falciparum infection. The majority of ma-laria admissions and deaths occur due to P. falciparum infections, being also the species triggering the epidemics.
Map 3. Malaria stratification in Ethiopia (Source: National strategic plan for Malaria prevention, control and elimination in Ethiopia, 2010-2015, FMoH, Addis Ababa, 2009).
20
the country and in specific areas with permanent water bodies, the transmission may
last more than six months [33].
Map 3. Malaria stratification in Ethiopia (Source: National strategic plan for Malaria prevention, control and elimination in Ethiopia, 2010-2015, FMoH, Addis Ababa, 2009).
The malaria epidemiology in Ethiopia is peculiar and different from large parts of
SSA. Firstly, the unstable nature of the transmission makes the population non-
immune and prone to focal outbreaks and cyclic epidemics. This unstable nature also
accounts to the fact that all age groups are at risk of the disease and all malaria
infections even with low-level parasitaemia are associated with clinical illness.
Secondly, unlike most SSA countries where P. falciparum accounts for almost all
malaria infections, in Ethiopia both P. falciparum and P. vivax are co-dominant,
where the former accounts for approximately 60% of all cases. In the low
transmission season, P. vivax increases its proportion due to its relapsing nature and
the seasonal drop in P. falciparum infection. The majority of malaria admissions and

16
BACKGROUND
2.2.2. Trends in malaria burden Malaria is a leading disease in Ethiopia. During the period 2001-2005, the disease was consistently reported as the first leading cause of outpatient visits, admis-sions and deaths. During this period, the annual average number of malaria cases reported was 9.4 million (range 8.4-11.5 million) while the annual average number of confirmed cases were around half a million (range 400,000-600,000). In the year 2005, where a slight reduction was observed, the disease was still the first leading health problem accounting for 48% of outpatient consultations, 20% of admissions and 25% of inpatient deaths [55].
The country has experienced recurrent outbreaks and nation-wide epidemics which have been usually associated with cyclical climatic variations (coinciding with El- Niño years). Several nation-wide epidemics (published and unpublished data) have been occurring since 1953 at irregular intervals of 5–8 years which have lead to immense morbidity, mortality and socio economics disasters [33, 56]. In the latest nation-wide epidemic in 2003/2004, despite the fact that most cases and deaths were managed at home and thus not documented, approxi-mately more than 2 million clinical malaria cases and 3,000 deaths were re-
Figure 2. Proportion of malaria admissions; all age and children <5 years old; a proxy indicator of improved access to early treatment (Source; WHO, Global Malaria Programme, World Malaria Report, 2010).
22
Recently, as consequence of intense interventions and the effort through HEP,
evidence has indicated certain decline in the disease has registered (Figure 2).
Figure 2. Proportion of malaria admissions; all age and children <5 years old; a proxy indicator of improved access to early treatment (Source; WHO, Global Malaria Programme, World Malaria Report, 2010).
A WHO rapid impact assessment of 44 hospitals at altitudes < 2000 masl for the years
2002–2009 showed that the annual numbers of malaria admissions and hospital deaths
for 2007–2009 were lowered by 31% and 50% compared to 2002-2004. Major
malaria epidemics have been also avoided in the last seven years [3]. Another study
(2007) conducted after the nationwide implementation of LLIN and ACT in eight
stratified conveniently selected districts showed a decline of 73% and 62% in in-
patient malaria cases and hospital deaths in under five children compared to the
period 2001–2005/6 [58].
2.2.3. The national malaria control programme
Ethiopia is one of the few African countries with a history of malaria control for more
than five decades. One year after the devastating malaria epidemic which caused three

17
BACKGROUND
ported from 3,368 affected villages in 211 districts [1, 33, 55-56]. Other sources estimated that the toll of this epidemic was over 16 million cases with a variation of 45,000 to 114,000 deaths [54, 57]. The epidemic nature of the disease is a significant impediment to the social and economic development of the country, striking during the planting and harvesting seasons, at a time when the need for agricultural work is greatest.
Recently, as consequence of intense interventions and the effort through HEP, evidence has indicated certain decline in the disease has registered (Figure 2). A WHO rapid impact assessment of 44 hospitals at altitudes < 2000 masl for the years 2002–2009 showed that the annual numbers of malaria admissions and hospital deaths for 2007–2009 were lowered by 31% and 50% compared to 2002-2004. Major malaria epidemics have been also avoided in the last seven years [3]. Another study (2007) conducted after the nationwide implementation of LLIN and ACT in eight stratified conveniently selected districts showed a decline of 73% and 62% in in-patient malaria cases and hospital deaths in under five children compared to the period 2001–2005/6 [58].
2.2.3. The national malaria control programme Ethiopia is one of the few African countries with a history of malaria control for more than five decades. One year after the devastating malaria epidemic which caused three million cases and 150,000 deaths, the Malaria Eradication Service was established in 1959. Later, in 1971 shifted to a vertical institution called the National Organization of the Control of Malaria and Other Vector-borne Dis-eases. The eradication service was successful in reducing the prevalence and the level of transmission in many areas, opening up the fertile arable lowlands and major river valleys for expanded agriculture and settlement, the rapid growth of many urban centers and the overall population. After the adoption of the new health policy in 1991, the vertical programme was integrated and decentralized within the general heath service [59-60].
Since 1997/98, the fight against malaria is governed by a rolling five-year na-tional malaria control programme (MCP) strategic plan in line with the HSDP. The plan focuses on the three major strategies as advocated by the RBM and WHO: i) early diagnosis and prompt treatment; ii) selective vector control; and iii) epidemic prevention and control. These core strategic components are backed by a pronged ‘system strengthening and capacity building’ strategy, focusing on: i) human resource development; ii) information, education and communication; iii) targeted operational research; and, iv) monitoring and evaluation including health management information system.

18
BACKGROUND
The diagnosis and treatment strategy focuses on the provision of prompt effective treatment within the 24 hours onset of fever. Nowadays, through the HEP, the delivery of this strategy in terms of the formal health service gets closer than ever to the patients. At this level, the diagnosis of the disease is based on clinical or/and rapid diagnostic test (RDT). Treatment is either by artemether-lumefantrine, chloroquine or referral based on the type of diagnosis employed and its findings [61].
The selective vector control strategy includes the distribution and utilization of ITNs/LLINs, IRHS, and the social mobilization for source reduction of mos-quito breeding sites. In the period 2005/06-2009/10, 35.2 million mosquito nets (largely LLIN) had been distributed (Figure 3). With the assumption of 3-year life span of a net [3], the amount of nets distributed in 2007/08-2009/10 (more than 17 millions) is assumed to cover approximately 70% of the households at risk of malaria with an average of two LLINs each. In the 2009/2010 transmis-sion season, in selected areas at risk of malaria, a total of 5.2 million households (86% out of the total at risk with sprayable housing units) have been sprayed using Delthametrine [45].
Figure 3. LLINs/ITNs distribution in Millions (Source; 2009/10, FMoH annual report).
24
The selective vector control strategy includes the distribution and utilization of
ITNs/LLINs, IRS, and the social mobilization for source reduction of mosquito
breeding sites. In the period 2005/06-2009/10, 35.2 million mosquito nets (largely
LLIN) had been distributed (Figure 3). With the assumption of 3-year life span of a
net [3], the amount of nets distributed in 2007/08-2009/10 (more than 17 millions) is
assumed to cover approximately 70% of the households at risk of malaria with an
average of two LLINs each. In the 2009/2010 transmission season, in selected areas at
risk of malaria, a total of 5.2 million households (86% out of the total at risk with
sprayable housing units) have been sprayed using Delthametrine [45].
Figure 3. LLINs/ITNs distribution (Source; 2009/10, FMoH annual report).
The malaria epidemic prevention and control strategy includes forecasting,
preparedness, early detection, prevention and control approaches. The forecasting
system alerts global and local potential climatic and weather changes (rainfall,
temperature, and relative humidity) using meteorological data. The early detection
10
35
-‐
5
10
15
20
25
30
35
40
2005/6 2006/7 2007/8 2008/9 2009/10
Num
ber of m
osqu
itone
ts(largely LLIN) d
istrub
ted
Ethiopian fisical Year
CummulaEve LLINs distributed in Millions

19
BACKGROUND
The malaria epidemic prevention and control strategy includes forecasting, pre-paredness, early detection, prevention and control approaches. The forecasting system alerts global and local potential climatic and weather changes (rainfall, temperature, and relative humidity) using meteorological data. The early detec-tion system is based on week to week comparison of the malaria cases or the norm chart (the third quartile method) at health facility level where the cases are treated. IRHS is the most important epidemic preventive measure which is done every year before the cessation of the rain. Once an epidemic occurs, suggested control measures include mass or fever treatment, IRHS, ITNs and larvacidal activities. The preparedness with respect to trained human resources, antima-larial drugs and insecticides is part of the epidemic prevention and control. The guideline suggests to keep operational funds and an additional 25% of the an-nual drug and insecticides requirement as contingency (preparedness) for ma-laria epidemic control in all epidemic-prone areas [62]. However, this is usually impractical as it enquires keeping resource for events that might or not occur.
2.2.4. Early diagnosis and rapid treatment of malaria under the HEPIn fighting against this deadly disease, early diagnosis and prompt treatment is one of the most basic and effective global strategies [63-64]. The effectiveness of this strategy is highly dependent on the national policy of providing effective diagnosis and first-line antimalarial drugs, and in the channel of the health care delivery system. To this end , in 2004, after the failure of sulphadoxine-pyrimeth-amine (SP) to treat P. falciparum, a policy change was made in both diagnosis and treatment [61].Treatment of uncomplicated P. falciparum was shifted from monotherapy SP to ACT, namely artemether-lumefantrine (AL), while keeping chloroquine (CQ) for treating P. vivax at a dose of 25 mg/kg. Artemether-lume-fantrine (20 mg artemether plus 120 mg lumefantrine, Coartem®, Novartis Pharma AG, Basel, Switzerland), presented in an illustrated blister pack accord-ing to four age groups, is a six-dose regimen administered twice a day for three successive days. The blister is divided into six compartments, one for each dose. AL is administered: (i) one tablet (artemether 20 mg/lumefantrine 120 mg) per dose for children from two months to two years old; (ii) two tablets per dose for children three to seven years old; (iii) three tablets per dose for children eight to ten years old and; (iv) four tablets per dose for those over ten years of age. Though AL is highly efficacious, at the time it was introduced, it was also more than ten times as expensive as SP and many folds to CQ.
In areas of the country where microscope is not feasible, confirmatory diagnosis using RDTs replaced presumptive diagnosis (clinical diagnosis), while maintain-ing the latter approach where the RDTs are unavailable (Figure 4). A presumptive

20
BACKGROUND
malaria case, based on the signs and symptoms, is a patient from a malarious or a non-malarious area with history of travel to a malarious area, who exhibits fever or history of fever within the past two days in the absence of clear symptoms indicating alternative causes of fever [64].
RDTs are immunochromatographic methods to capture malaria parasites antigens in lysed blood to antibodies fixed to a strip of filter paper in a plastic cassette, card or dipstick format. The tests are of three different antibodies to detect the following antigen from the parasite in the whole blood: i) histidine-rich protein II (HRPII) specific to P. falciparum; ii) Plasmodium lactate dehydrogenase (pLDH) specific either to P. falciparum, P. vivax or pan-specific; and iii) aldo-lase which is only pan-specific. The WHO recommendation for areas like Ethio-pia where P. falciparum co-exists with non-falciparum infections is a test detect-ing P. falciparum and non-P. falciparum; i.e. multispecies RDT [65-66].
At health post, the entire malaria diagnosis and treatment service is free of charge. At this level, the national malaria diagnosis and treatment guideline recommends three different diagnosis and treatment strategies: i) if malaria is diagnosed with multispecies RDT (P. falciparum-specific and pan-specific device), treat P.falciparum and mix cases with AL, the pan-specifics excluding P.falciparum (in our context it is P.vivax) with CQ and refer negatives to a higher level; ii) if malaria is diagnosed with P.falciparum specific RDT, treat positive cases with AL and all the negatives with CQ (assuming they are P.vivax); and iii) if malaria is diagnosed presumptively treat all suspected cases with AL [64]. P.falciparum positive patients for whom AL is contraindicated should be treated with quinine. Patients with one or more sign and symptoms of severity should be referred im-mediately to the nearest higher health facility while giving a first dose of oral quinine providing the patient is able to take oral treatment. When a P. falciparum-specific RDT device is used, patients with negative results who are prescribed with CQ should be referred in case the illness is due to other causes of fever (Figure 4).
2.3. Tigray region2.3.1. Regional context Tigray is the northern most regional state of Ethiopia (Map 4). It is divided into north-western and southern lowlands (700-2000 masl) and central, eastern and southern highlands (1500-3000 masl). The topography is complex, which ranges from high-altitude plateaux and mountainous terrain to deeply incised river valleys and canyons [56, 67]. It extends from the lowest place with 170 masl in Erob to the highest mountains of Kisad-Gudo with 3,923 masl in Alaje. The region covers 41,409 square kilometres. Administratively, it is divided into

21
BACKGROUND
seven zones including the capital city Mekelle, which are further divided into 47 districts, out of which 35 are rural.
In 2007, the population was 4.3 million which represents 5.8% of the national population. The proportion of male to female population (49.2%) is lower than in any other region of the country. Of the total population, 43.7% are under 15 year children, 51.9% are between 15 and 64 year old and 4.3% are 65 and above years old. The average household size is 4.4 person per family (3.48 urban and 4.63 rural) which is slightly lower than the national 4.7 person/family. Total fertility rate is 4.4 children per women which is less than the national 5.2 children per women. Tigray population grows (2.5%) slower than the national figure. Likewise the rest of the country, 80.5% of the Tigray population lives in rural areas practising subsistence agriculture [37].
Figure 4. Flow chart for diagnosis and treatment of malaria (Source: FMoH; Malaria diagnosis and treatment guidelines for health workers in Ethiopia, 2004).
27
and mix cases with AL, the pan-specifics excluding P.falciparum (in our context it is
P.vivax) with CQ and refer negatives to a higher level; ii) if malaria is diagnosed with
P.falciparum specific RDT, treat positive cases with AL and all the negatives with
CQ (assuming they are P.vivax); and iii) if malaria is diagnosed presumptively treat
all suspected cases with AL [64]. P.falciparum positive patients for whom AL is
contraindicated should be treated with quinine. Patients with one or more sign and
symptoms of severity should be referred immediately to the nearest higher health
facility while giving a first dose of oral quinine providing the patient is able to take
oral treatment. When a P. falciparum-specific RDT device is used, patients with
negative results who are prescribed with CQ should be referred in case the illness is
due to other causes of fever (Figure 4).
Figure 4. Flow chart for diagnosis and treatment of malaria (Source: FMoH; Malaria diagnosis and treatment guidelines for health workers in Ethiopia, 2004).

22
BACKGROUND
Tigray’s agriculture is totally dependent on rainfall. Famine and drought had been regular occurrences in the region. The rainy season follows a pattern simi-lar to the rest of the country, with most rains falling in June and July. In south Tigray, the ‘Belg’ rain provides sufficient moisture for both, the second harvest and the minor malaria transmission.
2.3.2. Health status and health care delivery systemThe leading diseases in the country are also prevalent in the region. Communi-cable diseases such as malaria, tuberculosis, acute respiratory tract infection, diarrhoeal diseases, HIV/AIDS and malnutrition account for the majority of the health problems. The principal objectives and activities of the health system in Tigray are in accordance to the national policy. Maternal and child health, health promotion, environmental sanitation, epidemic control, improving health service quality and coverage, rehabilitation and expansion of health facilities, and human resource development are among the major priority interventions [68].
Map 4. Tigray state and the districts (Source: Tigray health profile, HMIS division, Tigray Health Bureau. Mekelle, Ethiopia).
28
2.3. Tigray region
2.3.1. Regional context
Tigray is the northern most regional state of Ethiopia (Map 4). It is divided into north-
western and southern lowlands (700-2000 masl) and central, eastern and southern
highlands (1500-3000 masl). The topography is complex, which ranges from high-
altitude plateaux and mountainous terrain to deeply incised river valleys and canyons
[56, 67]. It extends from the lowest place with 170 masl in Erob to the highest
mountains of Kisad-Gudo with 3,923 masl in Alaje. The region covers 41,409 square
kilometres. Administratively, it is divided into seven zones including the capital city
Mekelle, which are further divided into 47 districts, out of which 35 are rural.
Map 4. Tigray state and the districts (Source: Tigray health profile, HMIS division, Tigray Health Bureau. Mekelle, Ethiopia).

23
BACKGROUND
The health system structure in Tigray is essentially the same as in the rest of Ethiopia. In 2009/10, the region had one specialized, six zonal and seven districts hospitals and 209 health centers. In the same year, the coverage of rural HEWs trained and deployed was 89% (1442/1620) and the health post coverage reached 68.1% (552/810). Tigray health utilization rate (0.53), as outpatient department attendance per capita, is more than twice of the national figure (0.29). The regions’ health expenditure as percentage of total budget (9%) is below the national aver-age (10.4%) but the public expenditure per capita allocation is slightly higher [45].
The peculiar nature of the health service in Tigray is the role of the community in expanding and strengthening its delivery. The community participates in almost all health activities including identification of health problems, implementation of health interventions, and participation in the construction of health facilities either by contributing either money or/and labour. The community health work-ers (CHWs), trained and traditional birth attendants and community-based re-productive health agents are key partners in the health development. These volunteers are working at kushet level and they are serving their community without any incentive in cash or in kind. In 2006, the Tigray Health Bureau (THB) was boasted of having 7,000 to 8,000 active community volunteers which dem-onstrates the strong community involvement in the region[68]. Recently rear-rangements have been made to avoid duplication and confusion of roles and names, putting all under the name of volunteer community health workers (VCHWs). Under this arrangement, one VCHW is due for 25-30 households.
2.3.3. Malaria situation of the regionAlmost 75% of Tigray’s land is malarious, and about two thirds of the population residing in these areas are at risk for the disease. Malaria epidemiology in Tigray follows the country´s pattern. The type of vector, the P. falciparum to P. vivax proportion, the transmission mode and seasonality, the occurrence of epidemic and its consequences and the factors governing transmission including the con-trol strategies are alike to the most part of the country [67]. According to the regions’ health profiles of the consecutive years, during the period 2000-2010, malaria has been consistently reported as the leading cause of outpatient visits, admissions and deaths [69].
Malaria control activities in Tigray have been very active and prominent. During the 1990s and the early 2000s, Tigray malaria control was well known for its well established Community-Based Malaria Control Programme (CBMCP). This ini-tiative included all components of the malaria control strategy. The high coverage of early diagnosis and prompt treatment to the unprivileged majority rural

24
BACKGROUND
population close to patients’ homes using CHWs was a successful example. Before the introduction of AL and the HEP—when the first-line treatment was CQ and then SP–most febrile malaria patients (60-65%) were treated by CHWs at village level [67] (Figure 5). However, the introduction of a relatively expensive anti-malaria drug and the shifting of the diagnosis to RDTs, have turned out the suc-cess stories of the CHWs malaria case management. Early diagnosis and prompt treatment service of malaria is now retreated one step back from the villages.
32
Figure 5. Treatment of malaria at different tire of the health system including the phased out community-based treatment and diagnosis of malaria, Tigray, Ethiopia, 2001-2006.
Figure 5. Treatment of malaria at different tire of the health system including the phased out community-based treatment and diagnosis of malaria, Tigray, Ethiopia, 2001-2006.

25
RATIONALE OF THE STUDY
32
Figure 5. Treatment of malaria at different tire of the health system including the phased out community-based treatment and diagnosis of malaria, Tigray, Ethiopia, 2001-2006.
3. RATIONALE OF THE STUDY
The expansion of the primary health care system in Ethiopia since 2004 through the HEP is an important measure to achieve universal access to PHC. This ini-tiative is an imperative breakthrough; however it has required extensive human and infrastructure resources. It needs to train, deploy, supervise and refresh tens of thousands of HEWs (reaching 34,380 by 2009/2010) and to construct and equipped numerous heath post (reaching 14,200 by the same above year). Further it demands many other inputs to implement the package of the sixteen interven-tions. While the scaling up of the HEP is a fundamental action to achieve the aim of universal access to PHC, decision-makers and programme managers need to ensure that the programme is providing efficient services. It has been docu-mented in many studies that the lack of adequate resources presents the most important constraints in any health care, while the efficiency with which avail-able resources are being utilised is another challenge that cannot be overlooked [70-72]. To date no evidence is available in the country on how the HEP is mak-ing the best use of the resources devoted to it.
In the year 2007, at the health post level, on top of the presumptive-based strat-egy, two types of RDT-based malaria diagnosis and treatment strategies were available: parascreen pan/pf-Zephyr Biomedical, Goa, India (parascreen-based strategy) and paracheck pf-Orchid Biomedical Systems, Goa, India (paracheck-based strategy); the former is able to identify both P. falciparum and non-P. falciparum malaria (P. vivax) while the latter targets only P. falciparum. How-ever, no evidence is available on cost-effectiveness comparing these three strat-egies. Previous studies, almost all, were comparing either among multispecies RDTs or among RDTs detecting P. falciparum alone [73-78]. Also, none of them addressed the Ethiopian malaria epidemiological context (co-species dominated with seasonal variation and unstable transmission) and its diagnosis and treat-ment guideline. Therefore, there was an urgent need to assess which strategy among the available (Figure 4) could be the most cost-effective for the country.
The provision of accurate diagnosis and treatment using a highly efficacious and safe antimalarial drug alone are not sufficient to achieve the desired therapeutic outcome [79]. Patients must take the prescribed antimalarial drug at the correct dose and time interval. Otherwise, poor adherence results in sub-therapeutic drug concentrations which fail to provide a successful cure. Furthermore, the sub-curative concentration of antimalarial drug in the blood allows those strains that are less sensitive to survive [80]. This may contribute to the spread of drug

26
RATIONALE OF THE STUDY
resistant mutant strains of the malaria parasite complicating the treatment sce-nario [81-83]. Thus, understanding the patient adherence level to the six-dose regimen AL for the treatment of P. falciparum and identifying its possible de-terminant factors is crucial in the provision of effective malaria treatment. How-ever, despite the fact that AL is the most widely deployed antimalarial [84], studies on this treatment regimen are limited, and even the available studies not only demonstrated different levels of adherence, but also account for different risk factors [85-87] depending on the local setting [88]. These variations highlight the need for local evidence on the level and its determinant factors which are practically lacking in the Ethiopian context.
Before the introduction of HEP, in Tigray, where poverty remains a major im-pediment to the expansion and use of adequate health services, access to ma-laria early diagnosis and prompt treatment was facilitated by a well established CBMCP using volunteer CHWs [59, 89]. Since the introduction of AL, this service was shifted from the CBMCP and its dedicated CHWs to the HEP and its cadres HEWs, mainly because of cost, safety and logistic reasons. However, field expe-rience and some reports have shown that HEWs in vast catchment areas (two female HEWs for a tabia with more than five thousand people) and with multiple responsibilities (implementing the sixteen HEP packages) are work loaded [90]. Furthermore, with tabia as catchment area, HEWs are less close to patients to provide early malaria diagnosis and prompt treatment than CHWs whose catch-ment area is the kushet. Therefore, it was important to explore the feasibility and impact of bringing back the diagnosis and treatment of malaria (AL combined with RDT) to the community level by the use of CHWs while maintaining the required quality.

27
AIM OF THESIS
4. AIM OF THE THESIS
4.1. Overall aimThe overall aim of this thesis is to improve the overall performance of HEP and the access to and quality of the malaria diagnosis and treatment in the Tigray region, Ethiopia.
4.2. Specific objectives• To estimate the technical efficiency of the health extension programme and to
identify factors which might be explaining the efficiency (Paper I).
• To assess the cost-effectiveness of the nationally recommended three malaria diagnosis and treatment strategies (Paper II).
• To explore adherence and risk factors to the six-dose regimen artemether-lumefantrine among uncomplicated P. falciparum patients (Paper III).
• To assess the feasibility and impact of deploying artemether-lumefantrine combined with phased introduction of rapid diagnostic tests (RDTs) at com-munity level, on malaria transmission, morbidity and mortality (Paper IV).


29
THE CONCEPTUAL FRAMEWORK: ACCESS TO QUALITY HEALTH CARE
5. THE CONCEPTUAL FRAMEWORK: ACCESS TO QUALITY HEALTH CARE
The WHO “Framework for Action” on strengthening health systemfor (World Health Report 2000) defined the overall outcomes/goals of a health system as: improving people’s health and health equity, in ways that are responsive, finan-cially fair and make the best, or most, efficient use of the available resources. There are also important intermediate goals in this process; the route from inputs to health outcomes is through achieving a greater access to health care and cov-erage for effective health interventions without compromising quality and safety [91].
As the principal objective of a health system is to improve people’s health, one of the chief functions the system needs to perform is to deliver health services. While the scarcity of resources in the health systems, both human and financial, is a well acknowledged problems to deliver effective health service, there is also a growing recognition that inefficiencies within the health care system abound [92]. Solving this lack of efficiency in the delivery of health services is not only an issue related to the sustainability of the health care system, but an immense responsibility of decision-makers to ensure that health delivery works best with the available resources.
In the delivery of health care, access is considered to be a human right and gov-ernments have an obligation to realise progressively this right [93]. Efforts from the Ethiopian government and the Tigray Health Bureau are pointed towards this objective through the implementation of the PHC, where HEP is the central part. Nevertheless, no overriding consensus on the concept of access and how it should be measured exist [94].
Penchansky and Thomas (1981) defined access as a concept representing the degree of ‘fit’ between the patient and the system. They elaborated the concept in terms of the interaction between the patient (demand side) and the health care system (supply side) using five dimensions: (i) availability, the relationship of the volume and type of existing services and resources to the user’s volume and types of needs; (ii) accessibility, the relationship between the location of supply and users; (iii) affordability, the relationship between prices of services and us-ers’ income, ability to pay; (iv) accommodation/adequacy, the relationship be-tween the ways in which the service is organized to accept users and the users’ ability to accommodate these factors, and their perceptions of their appropriate-ness; and (v) acceptability, the relationship of the users’ attitudes towards per-

30
THE CONCEPTUAL FRAMEWORK: ACCESS TO QUALITY HEALTH CARE
sonal and technical characteristics of the providers and providers’ attitudes about acceptable personal characteristics of patients [95].
Based on these dimensions, Obrist et al. recently proposed a framework for analysis and action to explore how to improve the access to health care in low-income countries (Figure 6) [96]. The framework brings together three approach-es: health-seeking studies, health service studies and livelihood approaches. Ac-cording to the framework, what degree of access is reached along the five dimen-sions depends on the interplay between (i) the health care services and the broader policies, institutions, organizations and processes that govern the ser-vices and (ii) the livelihood assets (resources) people can mobilize in particular vulnerability contexts or during illness. However, gain in access alone is not suf-ficient to reach the ultimate goal of the health care. Improved access have to be combined with health care utilization, high quality of care and efficient utilization of resource (not explicit in the model) to reach positive outcomes.
Health care utilisation, to a large extent, is attributed to the presence or absence of needed health care services including staff and drugs (availability), degree to which a service meets the cultural needs and standards of a community (accept-ance) and shorter waiting time–longer or flexible opening hours (accommoda-tion). The cost (affordability) either of medicines, consultations or travel is also acting as a deterrent to health service utilisation. Physical distance (accessibility) from the facility and the time taken to reach it increases the cost, which cer-tainly influences the health services utilisation.
Health service utilization is not only subject to the degree of access to health care attained, but also to the quality of the service. Technical quality of care includes such as provider’s compliance to the available guideline, diagnostic accuracy and safety of the products and patient’s adherence to the treatment regimen. In turn, the degree of access attained is a precursor for the quality of the service. For instance; the provision of guidelines, equipment, human resource and regulations are the availability dimension influencing the quality of care. Patient’s compli-ance with the therapy is affected by whether the health care service is available when needed (availability), or it is close to the patient (accessibility), or its cost does not harm (affordability) or its organization setup (accommodation) allows the patients to get service. Acceptability is highly coupled with whether well understood instruction is given on how to take the drug as well as with aspects of quality of care. These shortcomings might otherwise lead the patient to keep the treatment for the next episodes.
As shown above, both health service utilisation and quality of care are consider-ably dependent on the level of access. Likewise, patient’s livelihood characteristic

31
THE CONCEPTUAL FRAMEWORK: ACCESS TO QUALITY HEALTH CARE
and the perceived quality of the services influence the utilisation of the attained access for reaching the intended health outcome. Finally, the outcomes can be measured in terms of health status, patient satisfaction and equity (Figure 6, The Health Access Livelihood Framework) [96]. Though it is not stated explicitly in the framework, a well-performing health care system should not be just only concerned with being effective (to improve population health status), of high quality and equitable. There is also a need that the sizeable proportion of re-sources devoted to improve the access and quality of the health care ought to be used efficiently.
This thesis will focus on the efficiency (utilization), access to and quality of care components of the framework applied to the case of malaria diagnosis and treat-ment in rural Tigray.
Figure 6. The access framework (Obrist et al, 2007)
The extent to which the HEP is utilised, for instance, the malaria diagnosis and treatment
service, concerns the level of access and quality of the service. Thus, whether a patient is
motivated to utilise the diagnosis and treatment service of malaria and to comply with the
treatment regimen is influenced by the accessibility, availability and affordability of the
service, and adequacy and acceptability in terms of people´s judgement of the quality of care.
The research questions of this thesis linked to the framework are presented in Table 1.
The objective of determining the efficiency of the HEP programme (Paper I) encompasses
the entire health care service, and considers whether the attained level of access and quality is
efficiently utilised (health service utilisation) to reach the intended outcomes. The assessment
Figure 6. The access framework (Obrist et al, 2007)

32
THE CONCEPTUAL FRAMEWORK: ACCESS TO QUALITY HEALTH CARE
5.1. Linking the HEP and the research questions to the frameworkThe HEP, through which the health policy is applied, represents the health care service in Figure 6. It implements all the sixteen components of the package aim-ing at attaining all dimensions of access. As regards one of the HEP components, the malaria diagnosis and treatment service, provided at health post and/or home to home (within tabia) entails both the accessibility and the accommodation dimension of the service. The presence of guideline, medicines, diagnostic equip-ment and trained HEWs represents the availability. Under HEP, diagnosis and treatment of malaria is provided free of charge near a patient’s home (affordabil-ity). The organizational set up and arrangement of the HEP (health post and home to home) to meet malaria patient expectations refer to the accommodation dimen-sion of the service. Trained HEWs who were born and raised in the tabia and currently live there encompass the acceptability dimension.
The technical quality care in malaria diagnosis and treatment at this level include: applying correct diagnosis (presumptive or RDT), compliance of health workers (HEWs) with the diagnosis and treatment guideline, prescribing efficacious and safe antimalarial drugs (AL, CQ and referral) and providing appropriate instruction to patients on treatment dosing and patients adherence to the treatment regimen.
The extent to which a HEP component is utilised, for instance, the malaria diag-nosis and treatment service, concerns the level of access and quality of the service and the livelihood status of the population. Thus, whether a patient is motivated to utilise the diagnosis and treatment service of malaria and to comply with the treatment regimen is influenced by the accessibility, availability, affordability, adequacy and acceptability of the service and by its judgement of the quality of care. The livelihood status plays a decisive role whether a patient is recognized illness and initiated seeking treatment.
The research question of this thesis linked to the framwork are presented in Table 1.
The objective of determining the efficiency of the HEP (Paper I) encompasses the entire health care service, and considers whether the attained level of access and quality is efficiently utilised (health service utilisation) to reach the intend-ed outcomes. The assessment of which malaria diagnosis and treatment strategy

33
THE CONCEPTUAL FRAMEWORK: ACCESS TO QUALITY HEALTH CARE
Table 1. Study objectives, research questions and the focus within the framework to access to health care.
43
Table 1. Study objectives, research questions and the focus within the framework to access to health care.
Study objectives
Research questions
Framework of access to
health care Efficiency of the HEP and its determining factors (Paper I)
How efficient is the healthcare (health posts) service? Does the health output correspond to its inputs? What factors influence the efficiency?
-Access -HEP service utilization
Cost-effectiveness of the three available malaria diagnosis and treatment strategies at health post (Paper II)
What is the effectiveness of each diagnosis and treatment strategy? Which is the most cost-effective strategy?
-Accessibility -Availability -Affordability -Quality of care
Adherence to six-dose AL in uncomplicated p.falciparum patients and its determining factors (Paper III)
Providing that accurate diagnosis and efficacious antimalarial is available and affordable, what is the level of adherence to the six-dose regimen AL? What risk factors influence the level of adherence?
-Availability -Accessibility -Acceptability -Affordability -Quality of care
Feasibility and impact of deploying AL in combination with RDT at community level (Paper IV)
Can the access to malaria diagnosis and treatment improved by using CHWs? What is the health impact of deploying AL with RDTs using CHWs?
-Accessibility -Acceptability -Accommodation -Health status
is cost-effective at health post level (Paper II) is mainly concerned with the ac-cessibility, availability and affordability dimensions of access and quality of the service (diagnostic accuracy and health workers compliance with the guideline). Measuring adherence to treatment regimens (Paper III) encompasses the avail-ability, accessibility, acceptability and affordability dimensions of access and the quality of care. Finally, improving accessibility of the delivery of malaria diagnosis and treatment using CHWs, while keeping the availability and afford-ability dimensions and quality of care unchanged, is the focus of Paper IV. Health status was also measured in this study.


METHODS
35
6. METHODS
6.1. Study areaDifferent malarious districts were employed for the different objectives of this research (Table 2). Districts were selected purposely from different administra-tive zones and different malaria strata. Three malaria epidemiological strata located below 2000 masl were included: stratum I (<1000 masl), stratum II (1001-1500 masl) and stratum III (1501-2000 masl). Seven districts were se-lected for specific objective I: Kafta-Humera (from the Western-zone), Tanqua-Abergle, Qolla-tembien and Werie-leke (from the Central zone), Hitalo-Wajerat (South-eastern zone) and Kilte-awlaelo and Hawzien (from the Eastern zone). For the specific objective II, the following districts were included: Kafta-Humera (from the Western-zone), Mereb-leke (central-zone), Tahtay-adiabo (from north-ern zone), both from stratum II) and Raya-Azebo (from southern zone and stratum III). Mere-leke, Raya-Azebo and Tahtay-adiabo districts were chosen for the specific objective III. For the last specific objective IV, Raya-Azebo and Alamata rural districts, both from the southern zone and stratum III; were se-lected.
The districts covered an area that ranged from 1,892 square km of Hawzien to 4,542 of Kafta-Humera. For 2007, the average population ranged from 85,359 of Alamata (rural) to 152,219 of Hitalo-Wajerat (CSA, census 2007). Districts from the central, eastern and south-eastern zones are commonly affected by famine. Landscape is dry and highly eroded. Rain is sometimes heavy but erratic and
44
6. METHODS
6.1. Study area
Different malarious districts were employed for the different objectives of this
research (Table 2). Districts were selected purposely from different administrative
zones and different malaria strata. Three malaria epidemiological strata located below
2000 masl were included: stratum I (<1000 masl), stratum II (1001-1500 masl) and
stratum III (1501-2000 masl). Seven districts were selected for specific objective I:
Kafta-Humera (from the Western-zone), Tanqua-Abergle, Qolla-tembien and Werie-
leke (from the Central zone), Hitalo-Wajerat (South-eastern zone) and Kilte-awlaelo
and Hawzien (from the Eastern zone). All were from stratum III except Kafta-Humera
which was from stratum I. For the specific objective II, the following districts were
included: Kafta-Humera, Mereb-leke, Tahtay-adiabo (from northern zone and stratum
II) and Raya-Azebo (from southern zone and stratum III). Mere-leke, Raya-Azebo
and Tahtay-adiabo districts were chosen for the specific objective III. For the final
specific objective IV, Raya-Azebo and Alamata rural districts, both from the southern
zone and stratum III; were selected.
Table 2. Study districts included in each of the specific objectives.
Zone District Objective
Western, Central South-eastern, Eastern
Kafta-Humera, Tanqua-Abergle, Qolla-tembien, Werie-leke, Hitalo-Wajerat, Kilte-awlaelo, Hawzien
I
Western, Central, North-western, Southern
Kafta-Humera, Mereb-leke, Tahtay-adiabo and Raya-Azebo
II
Southern, Central and North-western
Mere-leke, Raya-Azebo and Tahtay-adiabo III
Southern Raya-Azebo and Alamata rural IV
Table 2. Study districts included in each of the specific objectives.

METHODS
36
shorter. Members of these economically poor populations migrate for seasonal agricultural work to more fertile but also more malarious lowlands. The forth and back population movement to and from these malarious area enforces the malaria transmission in these and their adjacent districts.
The other districts are fertile and their terrain is plane. Kafta-Humera is practic-ing a semi-mechanized agriculture and is the most malarious district in the region. Hundreds of thousands of migrant labourers influx from other parts of Tigray and other regions in the country to the district during the harvesting period, which is also the peak malaria transmission season. These highlanders are not only very vulnerable to malaria but also with limited access to prevention and treatment service. This circumstance worsens not only the malaria situation of the district but also of the highlands. After harvesting, returnees may carry ga-metocytes to their original place that cause transmission and some time trigger epidemics.
Alamata and Raya-Azebo districts usually experience the ‘Belg’ rain. Dwellers in both districts are also known for their traditional practice of water conservation schemes at community and household level for agriculture, household use and for their cattle. Both, the water conservation and the ‘Belg’ rain, provide suitable conditions for the second minor malaria transmission which amplifies the burden of the disease. Tahtay-Adiabo is with sufficient ‘Kermit’ rain to support the agri-culture and malaria transmission. In this district, the minority indigenous group ‘Kunama’ are usually dependent on live stock and practicing outdoor sleeping which exacerbate the malaria transmission.
In all the study districts, malaria is not only the leading cause of morbidity and mortality but also constitutes a large part of the disease burden (THB, 2003-2008 profiles). In all the districts, in 2007 approximately one third of the cases in the outpatient service were due to malaria [97].
6.2. Study design, sampling, data collection and analysisThe research consists of different study designs and populations for each one of the four objectives. The study on the HEP efficiency (Paper I) used register data for the output variables whereas primary data for the input variables and envi-ronmental factors were collected from a survey. For paper II, a stratified cross-sectional survey was conducted to generate the effectiveness data while cost was obtained from a secondary data. To assess how patients are complying with the prescribed antimalarial drug (Paper III), an assessment questionnaire and pill count was employed at patients´ home. In paper IV, where feasibility and effec-

METHODS
37
tiveness of using AL with RDT by CHWs was explored, a number of designs were used: longitudinal follow-up, cross-sectional surveys, verbal autopsy question-naires, cost analysis and focal group discussions. The various components of methods for the different studies are described in Table 3.
Table 3. Study designs, sampling and data sources of the different research objectives.
47
Table 3. Study designs, sampling and data sources of the different research objectives.
Paper Problem addressed
Study Design
Sampling and data source
Study period
I Efficiency of HEP and factors determining efficiency
Register data
Cross sectional auditing to collect inputs and environmental factors
HIMS unit of THB
120 HEWs from 60 health posts in seven districts
Dec-Jan
2008
II
Cost effectiveness of the current malaria diagnosis and treatment strategy
Cross sectional to collect blood films
Microscope as gold standard
Cost from the provider prospective
2422 febrile patients from four districts who sought treatment in 35 health posts
Sept-Dec
2007
III
Patients adherence to the six dose regimen of AL
Patient follow-up/home visit using semi-structured questionnaire
155 RDT P.falciparum positive cases from three districts
Sept-Dec
2008
IV
Feasibility and impact of deploying AL with RDT at community level in the context of the national guideline
Interventional study in two approximately homogenous districts
Cross sectional malaria prevalence survey
Longitudinal follow up of outpatient, admission & death
Verbal autopsy to enumerate deaths and identify their causes
Cost analysis(cost minimization)
Group discussion
Two districts: intervention and control districts
30 Kushet from each district for prevalence
Over 207,000 people from two districts
33 CHWs use AL and RDT at Kushet level
Representatives
May 2005 to
April 2007
6.2.1. Efficiency of the HEP and its determining factors (Paper I)
To measure the efficiency of the selected health posts, the widely used methodology
in measuring health care efficiency, data envelopment analysis (DEA), was chosen. It
has been pointed out the better suitability of the DEA compared to other methods for

METHODS
38
6.2.1. Efficiency of the HEP and its determining factors (Paper I)To measure the efficiency of the selected health posts, the widely used methodol-ogy in measuring health care efficiency, data envelopment analysis (DEA), was chosen. It has been pointed out the better suitability of the DEA compared to other methods for contexts like ours where there is insufficient health informa-tion and particularly when the economic data is missing [98-104].
DEA method estimates (sketches) a production possibilities frontier (efficiency frontier) by enveloping multiple input-output data among a set of fairly homo-geneous decision-making units (DMU), e.g., health centers, health post [99-100, 104-105]. The efficiency score of one (100%) indicates that a DMU (health post) is efficient compared to its peers, otherwise it is inefficient [104]. In DEA, inef-ficient DMUs are enveloped by the efficiency frontier. Their score is measured in terms of their distance from the ‘best’ practice frontier and are assigned a score between one and zero. The larger the score, the more efficient a DMU (health post) is, and the vice-versa [99, 107-108].
Though total efficiency is a combination of technical efficiency (TE) and allocative efficiency, only the former was considered since economic information was lack-ing. Technical efficiency, which implies the maximum possible output from a given set of inputs [100], is attained either due to the efficient implementation of the production plan in converting inputs to outputs (pure technical efficiency) and/or due to the convergence of the DMUs with the most productive scale size (scale efficiency) [109]. Scale inefficiency occurs if either the DMU is too large or too small to the best productive scale size.
In DEA we can examine the efficiency of DMUs using either an input or an output orientation. Input orientation is aiming at reducing input quantities used for a given level of outputs while output orientation is focusing on expanding output quantities with a fix amount of inputs. The choice of the approach is based on which side of the orientation (input or outputs) the decision-making units have more control over [100, 110]. Furthermore, DEA assumes one of the following two models: constant return to scale (CRS) or variable return to scale (VRS). If one assumes that the scale of economies do not change as the scale of the opera-tion (size of the service facility) changes, then CRS type DEA models is an ap-propriate choice. On the other hand, variable returns-to-scale (VRS) model is appropriate if one assume that scale of economies do change as scale of operation (size of the service facility) do [111]. Under VRS model, the technical efficiency is decomposed into pure technical efficiency and scale efficiency. Scale efficiency (SE) has three forms: constant return to scale (CRS), increasing return to scale (IRS) and decreasing return to scale (DRS). CRS is present when the change in input proportionate to the change in output; otherwise it yields less than propor-

METHODS
39
tionally (DRS) or more than proportionally (IRS) with the increase in the inputs [99, 107]. In order to operate at the most productive scale size, a DMU exhibiting DRS should scale down its scale of operation whereas a DMU exhibiting IRS should expand it. A health facility that is scale-efficient is said to operate under constant returns to scale [100, 102].
In our study, since the decision-makers at the health posts have better control on the outputs than the inputs and our interest is on the extent to which the scale of operation affects the efficiency (when all DMU are not operating at an optimal scale), an output-orientated TE assuming VRS was applied.
The data used in this study are for the Ethiopian fiscal year 2000 (July 2007-June 2008). Sixty health posts from seven districts were purposely chosen for reasons related to the quality of data and the accessibility to the environmental variables. Input and output information was collected from the database of the THB. A total of ten variables were incorporated to the model: two inputs (factors of pro-duction) and eight outputs (health services) (Figure 7). The two inputs were: i) number of health extension workers and ii) number of VCHWs (traditional birth attendants, community health workers). The eight outputs for each individual health post included: i) number of health education sessions given by HEWs; ii) number of completed (three) antenatal care visits; iii) number of child deliveries; iv) number of persons that repeatedly visit the family planning service; v) num-ber of diarrheal cases treated in children under-five; vi) number of visits carried out by the community health workers; vii) number of total new patients at-tended; and viii) number of malaria cases treated.
The choice of inputs and outputs was guided by the components of the HEP and data availability. The information on environmental factors (that might influence the efficiency outcomes) including personal characteristics of the HEWs (marital status, pregnancy in the previous year, number of children and being born in the same tabia), structural factors and the political support (the population of the tabia, the distance to the health centre, and the political support from the tabia’s chief) were collected through a structured questionnaire from the correspondent district health officers.
The output oriented technical efficiency score with VRS were computed using the open-access Data Envelopment Analysis Programme, Version 2.1 (DEAP 2.1) designed by Coelli [112]. In order to use the less possible number of variables, a correlation analysis was conducted among the output variables. To identify factors associated with the efficiency, the estimated technical efficiency scores obtained from the DEA were considered as the dependent variable and regressed against the set of environmental variables using a Tobit analysis [100, 113] (Figure 7).

METHODS
40
6.2.2. Cost-effectiveness of the three malaria diagnostic and treatment strategies (Paper II)This study was conducted under a routine HEP service following the national malaria diagnosis and treatment guideline during the main transmission months of 2007. Half of the health posts (n=7-8) in each of the four districts were ran-domly selected.
Subjects suspected of suffering from malaria, who presented themselves to a HEW either at a village or health post during the period of data collection, were included in the study. Following the national malaria guideline [61], patients
Figure 7. Steps of the two-stage analysis (DEA and Tobit regression) for assessing HEP efficiency.
Figure 7. Steps of the two-stage analysis (DEA and Tobit regression) for assessing HEP efficiency.
Inputs -HEWs -Volunteer CHWs
Outputs -Health education sessions -Completed Antenatal care -Child deliveries -Family planning service -Diarrheal cases treated in <5 -Home visit made by CHWs -Total outpatient attended -Treated malaria cases
DEA Technical efficiency (Output oriented and
VRS assumed)
Production unit (HEP/Health post)
Health post characteristic -Political support -Tabia population -Distance to health center
HEW characteristics -Marital status -Pregnancy previous year -No children -Born in same tabia
Tobit regression results on factors influencing efficiency
Stage 1: Operational productivity and efficiency measured by DEA
Stage 2: Explanatory Tobit analysis of TE with environmental factors
Second stage (Tobit model) First stage (DEA)

METHODS
41
were excluded if they: i) exhibited signs and symptoms of severe malaria or any other severe disease; ii) had taken antimalarial drugs (AL or quinine) within the previous two weeks; and iii) were infants under three-months-old or were preg-nant mothers during their first trimester for whom AL is contraindicated.
Sample size, calculated for the anticipated 30% slide positivity rate (SPR) with a confidence level of 95% and absolute precision of five percentage points (25% to 35%) considering a design effect of two gave a total of 646 patients for each stratum.
A finger-pricked blood sample from each subject was taken for the two types of RDT-based strategies and a blood film (thick and thin) for the microscope ex-amination from the same prick. Performance of the parascreen-based, paracheck-based and presumptive-based strategies was calculated vis-à-vis the light mi-croscopy. Blood films were examined by two independent microscopists. If dis-cordant, a third, senior microscopist decided. The first and the second micros-copists were unaware of the RDT results and the third reader was blind to the results of both the RDTs and the preceding microscopists.
Costing was undertaken from the provider’s perspective (government) and con-sidered only diagnosis and antimalarial drugs. RDT costing was calculated as the total number of presumptive patients multiplied by the unit price of each type of RDT kit. Antimalarial drug cost was calculated following the malaria diagnosis and treatment guideline at the health post level. Being age dependent, the num-ber of cases in each treatment regimen was multiplied by the cost of the respec-tive treatment course of either AL or CQ.
We selected the number of correctly treated cases (CTC) as the measure of ef-fectiveness on the basis of the malaria diagnosis and treatment strategies. This indicator accommodates both concerns: detecting the malaria cases (sensitivity) and excluding the non-malaria cases (specificity); supporting the public health goal of properly managing all causes of illness. A non-malaria case identified by the parascreen-based strategy was referred to a higher health facility level, mean-ing that this patient was correctly treated. It was assumed that the weight of either correctly treated or missed cases of any disease including malaria was equal. The number of correctly treated cases was then calculated as the number of true malaria (positives) plus the number of true non malaria (negative) cases.
Cost-effectiveness was calculated for the three type strategies: i) the parascreen-based strategy (parascreen-BS), to treat with AL, CQ or referral if the patient was diagnosed with P. falciparum, non-P. falciparum malaria (P. vivax) or no ma-laria, respectively; ii) the paracheck-based strategy (paracheck-BS), to provide

METHODS
42
AL for P. falciparum cases and CQ for the rest, and iii) the presumptive-based strategy (presumptive-BS) that uses AL for all suspected malaria cases.
Average cost-effectiveness ratio (ACER) was estimated by dividing the cost of diagnosis and treatment of each strategy to the number of CTCs. To find out if an extra cost in a strategy produced an extra effect (health benefit), an incremen-tal cost- effectiveness ratio (ICER) analysis was conducted where the strategies were ranked by increasing cost and then the additional cost in one strategy was divided by the additional CTCs [114].
Sensitivity analysis for selected parameters for which the cost-effectiveness is more sensitive was conducted. To allow for this, a one-way sensitivity analysis was carried out on changes in the SPR and AL cost. As SPR varies with seasons, we considered a minor transmission season (the point estimate was the major season), whilst assuming that the diagnostic performance remained same to the base case. AL price was also considered as it has been constantly decreasing throughout the previous years. A two-way sensitivity analysis was also carried out considering both changes.
Data processing was done using Microsoft Excel version8. Epi Info™ version 3.5 [115] software was used to calculate effectiveness, and Microsoft Excel 8 for the cost and cost-effectiveness.
6.2.3. Adherence to six-dose AL among uncomplicated P.falciparum patients and its determining factors (Paper III) This study was conducted during the major malaria transmission season of 2008 under routine health service delivery. Participants were patients who sought treatment from the HEWs at health post or village. They were included if they were: i) positive for the paracheck-pf test (P. falciparum-specific RDT device); ii) residents of the catchment area of the health post; and iii) older than two months of age. Patients were excluded if: i) they exhibited signs and symptoms of sever disease; ii) there was already a household member enrolled in the study (no family was interviewed twice); iii) they were pregnant mothers in their first trimester and were infants less than three months of old; and iv) they had taken AL within the past two weeks.
Sample size was calculated based on the assumption of 25% non-adherence with a precision of 10% and a design effect of two at a 95% confidence interval (CI). After accounting for the 20% drop-out rate (including non-replaced immediate spitting and/or a vomited dose), a total of 175 participants was required.
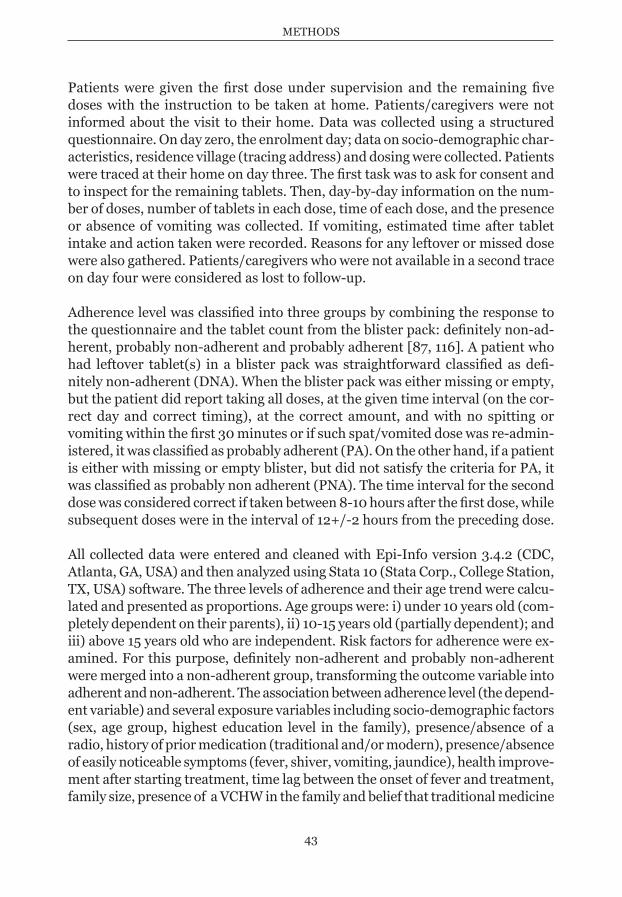
METHODS
43
Patients were given the first dose under supervision and the remaining five doses with the instruction to be taken at home. Patients/caregivers were not informed about the visit to their home. Data was collected using a structured questionnaire. On day zero, the enrolment day; data on socio-demographic char-acteristics, residence village (tracing address) and dosing were collected. Patients were traced at their home on day three. The first task was to ask for consent and to inspect for the remaining tablets. Then, day-by-day information on the num-ber of doses, number of tablets in each dose, time of each dose, and the presence or absence of vomiting was collected. If vomiting, estimated time after tablet intake and action taken were recorded. Reasons for any leftover or missed dose were also gathered. Patients/caregivers who were not available in a second trace on day four were considered as lost to follow-up.
Adherence level was classified into three groups by combining the response to the questionnaire and the tablet count from the blister pack: definitely non-ad-herent, probably non-adherent and probably adherent [87, 116]. A patient who had leftover tablet(s) in a blister pack was straightforward classified as defi-nitely non-adherent (DNA). When the blister pack was either missing or empty, but the patient did report taking all doses, at the given time interval (on the cor-rect day and correct timing), at the correct amount, and with no spitting or vomiting within the first 30 minutes or if such spat/vomited dose was re-admin-istered, it was classified as probably adherent (PA). On the other hand, if a patient is either with missing or empty blister, but did not satisfy the criteria for PA, it was classified as probably non adherent (PNA). The time interval for the second dose was considered correct if taken between 8-10 hours after the first dose, while subsequent doses were in the interval of 12+/-2 hours from the preceding dose.
All collected data were entered and cleaned with Epi-Info version 3.4.2 (CDC, Atlanta, GA, USA) and then analyzed using Stata 10 (Stata Corp., College Station, TX, USA) software. The three levels of adherence and their age trend were calcu-lated and presented as proportions. Age groups were: i) under 10 years old (com-pletely dependent on their parents), ii) 10-15 years old (partially dependent); and iii) above 15 years old who are independent. Risk factors for adherence were ex-amined. For this purpose, definitely non-adherent and probably non-adherent were merged into a non-adherent group, transforming the outcome variable into adherent and non-adherent. The association between adherence level (the depend-ent variable) and several exposure variables including socio-demographic factors (sex, age group, highest education level in the family), presence/absence of a radio, history of prior medication (traditional and/or modern), presence/absence of easily noticeable symptoms (fever, shiver, vomiting, jaundice), health improve-ment after starting treatment, time lag between the onset of fever and treatment, family size, presence of a VCHW in the family and belief that traditional medicine

METHODS
44
cures malaria were first analyzed. In a second step, variables found significantly associated (p<0.05) with the adherence level on the univariate analysis were fitted into a multivariate logistic regression model.
6.2.4. Feasibility and impact of deploying AL in combination with RDT at community level (Paper IV)A two-year pilot study was performed from May 2005 to June 2007 in two ma-laria homogenous districts in the Raya valley of southern Tigray. The districts were chosen for two reasons; firstly, they were more malarious and secondly, they were more homogenous for comparison [117]. Alamata district was ran-domly assigned for the intervention and Raya-Azebo for the control.
The study was conducted in two phases: Year I (May 2005–April 2006) and Year II (May 2006–June 2007) (Figure 8). Throughout the study, AL was dispensed at health facilities in both districts after clinical assessment or/and confirma-tory diagnosis. In the intervention district, during Year I, thirty-three CHWs
57
homogenous for comparison [117]. Alamata district was randomly assigned for the
intervention and Raya-Azebo for the control.
The study was conducted in two phases: Year I (May 2005–April 2006) and Year II
(May 2006–June 2007) (Figure 8). Throughout the study, AL was dispensed at health
facilities in both districts after clinical assessment or/and confirmatory diagnosis. In
the intervention district, during Year I, thirty-three CHWs dispensed AL at kushet
level for suspected malaria cases. During Year II, 50% (n=16) of the CHWs in the
intervention district were equipped with RDTs to dispense AL only to RDT-positive
patients. All patients testing negative on RDT received chloroquine for possible P.
vivax infection [61]. The remaining seventeen CHWs continued to treat all suspected
malaria patients with AL based on clinical diagnosis alone.
Figure 8. Study design for assessing the feasibility and impact of AL with RDT at community level.
Figure 8. Study design for assessing the feasibility and impact of AL with RDT at community level.

METHODS
45
dispensed AL at kushet level for suspected malaria cases. During Year II, 50% (n=16) of the CHWs in the intervention district were equipped with RDTs to dispense AL only to RDT-positive patients. All patients testing negative on RDT received chloroquine for possible P. vivax infection [61]. The remaining seventeen CHWs continued to treat all suspected malaria patients with AL based on clinical diagnosis alone.
Data from CHWs on diagnosis and treatment were collected on weekly basis. In both districts, health facility data on total and malaria cases of outpatient visits, admissions, deaths and laboratory results were collected on monthly basis. Serial malaria parasite prevalence surveys to establish the effect of the interven-tion on malaria transmission were undertaken during the low and high transmis-sion seasons. Cluster sampling was used, and 30 kushets from each district were selected by population proportional to size sampling. The sample size was cal-culated using the single point estimation method [118] for an anticipated in-fected population proportion of 5%, a confidence level of 95%, and an absolute precision of 2 percentage points (3%-7%). After multiplying by a design effect of three to correct the effect of clustering, it ended up in a total of 1,368 persons which was approximately 330 households per district. Blood films were examined by two independent microscopists blind to each other, and discordant findings were cross-checked by a senior expert who was also blind to the results of the preceding microscopists.
A geo-referenced household enumeration and mortality census using a verbal autopsy (VA) questionnaire was carried out to collect data on all deaths during the specified year in both districts and documented the sequence of events lead-ing to death (primarily the signs and symptoms of the illness preceding death). The VA data were interpreted using the InterVA model (http://www.interva.net/) to determine up to three most likely causes of death with corresponding likelihoods for each case. Cause-specific mortality fractions were derived from the likelihoods of specific causes from the InterVA model. Poisson multivariate regression models were constructed to determine the incidence rate ratios (IRR) for mortality from all-causes and from malaria specific causes.


47
MAJOR FINDINGS
7. MAJOR FINDINGS
This thesis which included a number of interrelated studies provided important findings that help to broaden our understanding of the HEP efficiency and to comprehend and improve the access to and quality of the malaria diagnosis and treatment. Here below are the major findings summarized in Table 4 and detailed subsequently. The comprehensive findings from each study are presented in the original publications appended at the end of this thesis.
Table 4. Major findings of the different studies of the thesis.
59
7. MAJOR FINDINGS This thesis which included a number of interrelated studies provided important
findings that help to broaden our understanding of the HEP efficiency and to
comprehend and improve the access to and quality of the malaria diagnosis and
treatment. Here below are the major findings summarized in Table 4 and detailed
subsequently. The comprehensive findings from each study are presented in the
original publications appended at the end of this thesis.
Table 4. Major findings of the different studies of the thesis.
Paper Objective
Major findings
I
Efficiency of HEP and its determinant factors
• More than three quarter of the health post were technical inefficient
• If the inefficient health posts performed as their efficient peers, they could improve their efficiency by 58%
• Scale of operation (too big or too small) was not major reason for inefficiency
• Environmental factors that can cause inefficiency could not be established
II
Cost effectiveness of the current malaria diagnosis and treatment strategy
• Parascreen-BS was the most cost-effective strategy
• Parascreen-BS allowed to treat 65% more patients with less cost than the paracheck-BS
• Parascreen-BS increases its cost-effectiveness in minor transmission season
III
Patients adherence to the six dose regimen of AL
• More than a quarter of the patients did not finish their treatment
• Main reason for interrupting dose were ’too many tablets’ and ‘felt before finished the dose’
• The presence of radio was found an important factor for improved adherence
IV
Feasibility and impact of deploying AL with RDT at community level in the context of the national guideline
In the intervention district compared to the control: • Almost 60% of suspected cases were managed by
CHWs • Malaria transmission was lower at least by 3-fold • Malaria mortality risk was lower by ~40% • Use of RDTs reduced cost and possibly the risk
of drug resistance development
Paper Objective Major findings

48
MAJOR FINDINGS
7.1. Efficiency of the HEP (Paper I)From the initial total of 87 health posts from seven districts, 60 (70.0 %) pro-vided sufficient information for the analysis. Out of these, 15 (25.0%) were found to be technically efficient constituting the best practice frontier. Overall, the mean score of TE and SE were 0.57 (SD = 0.32) and 0.95 (SD = 0.11), respectively. The inefficient health post demonstrated an average TE score of 42% (SD = 0.23) where only 13% of them scored equal or above 75%. Of the total health posts in the data set, 38 (63.3%) exhibited constant returns to scale and therefore they were scale efficient. The rest was considered as scale inefficient though most of them were close to the optimal size (85.0% of them had a score higher than 0.90) with an average SE score of 90% (SD = 0.11). Among the scale inefficient health post, half manifested increasing returns to scale and the remaining decreasing returns to scale (Figure 9).
The Tobit model examining determinants of efficiency showed that none of the variables was found to affect significantly the technical efficiency of the health posts. The individual variables being born in the tabia, marital status and preg-nancy status were negatively associated with efficiency. Against our expectations, this means that a better efficiency was found in health posts where the HEWs were not locally born and had been pregnant last year. Lower efficiency scores corresponded to high number of children, less population, little support from the tabias’ chief and less distance to the health center.
Figure 9. Distribution of technical and scale efficiency score of the sampled health post, Tigray (July 2007-June2008).
61
Figure 9. Distribution of technical and scale efficiency score of the sampled health post, Tigray (July 2007-June2008). 7.2. Cost-effectiveness of malaria diagnosis and treatment strategies
(Paper II) 7.2.1. Characteristics of the subjects and microscope results
Among the total subjects enrolled, 26.63% (n=645), 28.0% (n=677) and 45.42%
(n=1,100) were from strata I, II and III, respectively. Most of the patients (86.21%)
appeared with fever and the remaining with a history of fever. Eighteen percent
sought treatment within one day since the onset of illness. The microscope
examination of thick blood smear showed a crude (all species and all stages) SPR of
27.29% (n=661) with 68.53% (n=453) being P. falciparum (+/-gametocytes,
gametocyte alone and mixed) and 31.47% (n=208) P. vivax (+/- gametocytes). The
stratified result showed a variation in malaria transmission with a SPR of 46.51%,
26.88% and 16.27% decreasing upward strata with similar proportions of P.
falciparum (68-70%) across the strata.
0
10
20
30
40
50
60
70
<50 50-‐74 75-‐99 100
45
20
10
25
0 5
32
63
percen
rt of h
ealth po
st
Efficiency score Technical efficency Scale efficency

49
MAJOR FINDINGS
7.2. Cost-effectiveness of malaria diagnosis andtreatment strategies (Paper II)
7.2.1. Characteristics of the subjects and microscope resultsAmong the total subjects enrolled, 26.63% (n=645), 28.0% (n=677) and 45.42% (n=1,100) were from strata I, II and III, respectively. Most of the patients (86.21%) appeared with fever and the remaining with a history of fever. Eighteen percent sought treatment within one day since the onset of illness. The microscope ex-amination of thick blood smear showed a crude (all species and all stages) SPR of 27.29% (n=661) with 68.53% (n=453) being P. falciparum (+/-gametocytes, gametocyte alone and mixed) and 31.47% (n=208) P. vivax (+/- gametocytes). The stratified result showed a variation in malaria transmission with a SPR of 46.51%, 26.88% and 16.27% decreasing upward strata with similar proportions of P. falciparum (68-70%) across the strata.
7.2.2. Cost analysis and effectiveness indicatorBased on the unit cost obtained from THB, the cost analysis indicated that the presumptive-BS cost was higher by 27.69% and 46.1% than the cost of the par-ascreen-BS and paracheck-BS, respectively. In the RDT-BS, the tests cost seized majority of the expenditure; 72.08% in parascreen-BS and 55.52% in paracheck-BS. AL cost comprised 27.65% , 41% and 100% of the total cost of parascreen-BS, paracheck-BS and presumptive-BS, respectively.
Out of the 661 malaria and 1761 non-malaria cases, parascreen-BS correctly treated 88.48% cases (true positive and true negative). However, it failed to identify 11.52% of the patients; 5.33% malaria cases (false negatives) who were left untreated and 6.19% of non- malaria cases (false positives) who were incor-rectly given antimalarial drugs. On other hand, paracheck-BS correctly treated only 23.95% cases (only true malaria) and mislabelled the remaining 76.05%; out of which 3.34% were malaria (false negative) and 72.70% were non-malaria cases (false positive). The presumptive-BS blindly captured all the P. falciparum, (18.7%, n = 453) while mislabelled all the P. vivax and non-malaria cases as P. falciparum.
7.2.3. Cost-effectiveness analysis (ACER and ICER)The CE analysis showed that the parascreen-BS was the most cost-effective with ACER US$ 1.69/CTC followed by paracheck-BS with US$ 4.66/CTC and pre-sumptive-BS with US$11.08/CTC. The ICER analysis, to find out whether the additional cost was worth paying to get the added effect, indicated that the pre-

50
MAJOR FINDINGS
sumptive-BS was highly dominated (less effect for more money) by parascreen-BS. Therefore, the ICER computation was between parascreen-BS and paracheck-BS which showed that an extra cost on the former would be able to treat cor-rectly an additional 64.5% (n=1563) patients with an incremental cost of US$ 0.59/patient (Table 5). Both one way and two sensitivity analysis at reduction of AL cost and SPR at minor transmission seasons also showed a consistent finding, supporting parascreen-BS as the most cost-effective.
Table 5. Average and incremental cost-effectiveness ratios among the three diagnosis strategies, Tigray, Ethiopia, 2007(n=2422)
7.3. Adherence to the six-dose artemether- lumefantrine (Paper III)7.3.1. Characteristics of the patientsA total of 180 patients were enrolled; out of them, 86.1% (n=155) completed the follow-up. There were no refusals but some were excluded from the analysis for reasons such as lost to follow-up (5.6 %), spitting/vomiting a dose within 30 minutes with no replacement (5.0%) and protocol violation (2.0%) (Figure 10). Nearly all the patients (93.0%) had a history of fever and 31.6% had an axillary temperature >38.5°C on the day of diagnosis. More than half of the patients (53.5%) sought treatment within two days after recognising the symptoms. Pa-tients reporting prior uptake of either modern medication (other than AL) or traditional medicine for the current episodes were 6.5% and 2%, respectively. Eighteen (12.8%) patients believed that malaria could be treated traditionally. In most households (n=127, 81.9 %), either the patient or his/her parents were illiterate or below grade five with the remaining having attended medium school (grades 5-8). Households who owned radio were 52.3% of the total and only 6.5% had a VCHW family member. Ninety-six percent felt better in response to the current treatment.
63
additional 64.5% (n=1563) patients with an incremental cost of US$ 0.59/patient
(Table 5). Both one way and two sensitivity analysis at reduction of AL cost and SPR
at minor transmission seasons also showed a consistent finding, supporting
parascreen-BS as the most cost-effective.
Table 5. Average and incremental cost-effectiveness ratios among the three diagnosis strategies, Tigray, Ethiopia, 2007(n=2422)
7.3. Adherence to the six-dose artemether-lumefantrine (Paper III)
7.3.1. Characteristics of the patients
A total of 180 patients were enrolled; out of them, 86.1% (n=155) completed the
follow-up. There were no refusals but some were excluded from the analysis for
reasons such as lost to follow-up (5.6 %), spitting/vomiting a dose within 30 minutes
with no replacement (5.0%) and protocol violation (2.0%) (Figure 10). Nearly all the
patients (93.0%) had a history of fever and 31.6% had an axillary temperature
>38.5°C on the day of diagnosis. More than half of the patients (53.5%) sought
treatment within two days after recognising the symptoms. Patients reporting prior
uptake of either modern medication (other than AL) or traditional medicine for the
current episodes were 6.5% and 2%, respectively. Eighteen (12.8%) patients believed
that malaria could be treated traditionally. In most households (n=127, 81.9 %), either
the patient or his/her parents were illiterate or below grade five with the remaining
having attended medium school (grades 5-8). Households who owned radio were
Diagnostic based
strategy
Cost
Correctly treated cases
ACER
Incremental Cost
Incremental Effect
ICER
Remark
Paracheck 2704.5 580 4.66 - - - Parascreen 3628.8 2143 1.69 924.27 1563 0.59 Presumptive 5017.2 453 11.08 1388.44 -1690 -0.82 Dominated
US$

51
MAJOR FINDINGS
Figure 10. Flow diagram showing enrolment, follow-up and adherence level.
64
52.3% of the total and only 6.5% had a VCHW family member. Ninety-six percent
felt better in response to the current treatment.
Figure 10. Flow diagram showing enrolment, follow-up and adherence level.
7.3.2. Adherence level
Out of the total followed-up participants, 94.2% were traced on day three and the rest
on day four. Nearly three quarter (73.5%) of the traced patients, reported to have
completed the treatment. Out of these, 54 cases did not correctly report the dose or the
time interval and were classified as probably non-adherent; the rest (n= 60) were
classified as probably adherent (Figure 10). The remaining forty-one patients (26.5%)
7.3.2. Adherence levelOut of the total followed-up participants, 94.2% were traced on day three and the rest on day four. Nearly three quarter (73.5%) of the traced patients, re-ported to have completed the treatment. Out of these, 54 cases did not correctly report the dose or the time interval and were classified as probably non-adherent;

52
MAJOR FINDINGS
the rest (n= 60) were classified as probably adherent (Figure 10). The remaining forty-one patients (26.5%) were found with tablets in the blister and thus were classified as definitely non-adherent.
Age stratified analysis of three groups; less than 10 years, 10-15 years and above 15 years old, showed that the oldest age group was mainly PA (40.0%) and PNA (43.8%) while the majority from the middle age group were PA (43.5%) and DNA (39.1%). This implied, member of the latter age group were most prevalent to interrupt the treatment course. In the contrary, the youngest age group exhib-ited almost equal frequency in the three adherence levels.
Among the total doses (155*6), 75 were missed. A trend of missing doses with time was observed trough the treatment course: the sixth doses were frequently missed (38 cases), followed by the fifth (20 cases), fourth (10 cases), third (5 cases) and second (2 cases). It is worthwhile to note that, the number of missed doses doesn’t mean to be equal to the number of cases who missed doses. A subject could miss more than one dose.
Definitely non-adherents gave one or more reasons for not taking properly the doses. The most common reasons were “too many tablets” (37.3 %) and to “felt better before finished the treatment course” (25.5 %). Refusal to take the tablets (7.8%) and “tablets too big to swallow” (3.9%) were also other explanations. Only one patient/caregiver (2.4%) claimed not to understand the instructions. Six patients neither reported finishing the doses nor showed leftover tablets. When asked, the reasons they gave were that “they shared with others” (n=4) or “kept for future episodes” (n=2). Among five patients reported re-administer a dose after immediate spitting or vomiting, two of them borrowed from their neighbour despite the possibility of replenishing it from the health post.
7.3.3. Risk factors for adherenceThe univariate logistic regression analysis showed only four variables to be sig-nificantly associated with being adherent: the ownership of a radio, the belief that malaria can not be treated traditionally, a delay of more than one day in seeking treatment after the onset of fever and literacy. When these variables were fitted into the multivariate logistic regression model, the ownership of a radio (adjusted odd ratio, aOR: 3.8; 95% CI: 1.66-8.75), the belief that malaria can be treated traditionally (aOR: 0.09; 95% CI: 0.01-0.78) and a delay of more than one day in seeking treatment after the onset of fever (aOR: 5.39; 95% CI: 1.83-15.88) remained significant, but not education.

53
MAJOR FINDINGS
7.4. The use of AL with RDT at community level (Paper IV)The two year operational study to assess the feasibility and impact of AL deploy-ment at community level, combined with a phased introduction of RDTs showed remarkable results in favour of the intervention.
7.4.1. Impact on malaria morbidity (outpatient and inpatient)During the two year study period, the CHWs service treated approximately 60% (n=75,654) of all the suspected and confirmed malaria cases in the intervention district. As a consequence, the number of patients treated for malaria in health facilities in the intervention (n=54,774) were less compared to the control (n=100,535) district. The CHWs service also indicated a reduction in the ma-laria inpatients; where the proportion in the intervention district was lower (42%) than in the control district (79%) (Figure 11).
Figure 11. Quarterly total and malaria inpatients and percentage of malaria inpatients showing that malaria was lower in intervention district even during the 2005 epidemic.
67
Figure 11. Quarterly total and malaria inpatients and percentage of malaria inpatients showing that malaria was lower in intervention district even during the 2005 epidemic.
7.4.2. Impact on malaria transmission
The serial malaria prevalence surveys also indicated the positive impact of the CHW
intervention (Figure 12). At the baseline in April 2005, by all measurements the
prevalence was higher in the intervention district compared to the control. After the
launch of the CHWs service, during the high transmission month of September, the
rate was inverted: lowered in the intervention while increased in the control by all
parameters. The crude parasite prevalence (for all species sexual and asexual stages)
was threefold lower in the intervention district compare to the control; i.e. (7.4%
[95% CI: 6.1-8.9] vs. 20.8% [95% CI: 18.6-23.0]). P. falciparum prevalence (P.
falciparum and Pf. gametocytes rate) remained unchanged in the intervention while
there was a seven fold increase in the control district. Most importantly, the P.
falciparum gametocyte prevalence decreased by 7% in the intervention district but
increased by tenfold in the control (1.4% [95% CI: 0.9-2.1] vs. 7.0% [95% CI: 5.7-

54
MAJOR FINDINGS
7.4.2. Impact on malaria transmission The serial malaria prevalence surveys also indicated the positive impact of the CHW intervention (Figure 12). At the baseline in April 2005, by all measurements the prevalence was higher in the intervention district compared to the control. After the launch of the CHWs service, during the high transmission month of September, the rate was inverted: lowered in the intervention while increased in the control by all parameters. The crude parasite prevalence (for all species sexual and asexual stages) was threefold lower in the intervention district compare to the control; i.e. (7.4% [95% CI: 6.1-8.9] vs. 20.8% [95% CI: 18.6-23.0]). P. falciparum prevalence (P. falciparum and Pf. gametocytes rate) remained un-changed in the intervention while there was a seven fold increase in the control district. Most importantly, the P. falciparum gametocyte prevalence decreased by 7% in the intervention district but increased by tenfold in the control (1.4% [95% CI: 0.9-2.1] vs. 7.0% [95% CI: 5.7-8.4]) (Figure 12). This finding was also
Figure 12. Serial prevalence survey showing parasite reservoir was 3-fold lower in the intervention district in 2005 high transmission month.
68
8.4]) (Figure 12). This finding was also supported by data from the routine services.
The proportion of confirmed P. falciparum cases from laboratories over the two year
study period was lower in the intervention district (48% out of 4,778 blood films) than
the control district (64% out of 6,778 blood films).
Figure 12. Serial prevalence survey showing parasite reservoir was 3-fold lower in the intervention district in 2005 high transmission month.
7.4.3. Impact on malaria specific mortality
Based on the VA interviews, the crude overall mortality rate was 11.1/1000 in the
intervention district and 9.3/1000 in the control. The interviews yielded sufficient
information for 95.5% deaths to determine the causes. The InterVA model estimated
the probable cause of death due to malaria (malaria specific mortality rates) at
0.27/1000 and 0.45/1000 for the intervention and control districts, respectively.
Poisson multivariate regression modelling (Table 6 ) indicated no significant
3.4
20.8
4.9 7.4
0 5 10 15 20 25 Crude parasite rate
2.4
14.2
4.3 4.9
0 3 6 9 12 15 P. falciparum parasite rate
0.8
7.0
1.5 1.4
0
2
4
6
8
Control Intreven9on
P. falciparum gametocyte rate
Low transmission High transmission

55
MAJOR FINDINGS
supported by data from the routine services. The proportion of confirmed P. falciparum cases from laboratories over the two year study period was lower in the intervention district (48%, n=4,684 blood films) than the control district (64%, n= 6,581 blood films).
7.4.3. Impact on malaria specific mortalityBased on the VA interviews, the crude overall mortality rate was 11.1/1000 in the intervention district and 9.3/1000 in the control. The interviews yielded sufficient information for 95.5% deaths to determine the causes. The InterVA model esti-mated the probable cause of death due to malaria (malaria specific mortality rates) at 0.27/1000 and 0.45/1000 for the intervention and control districts, respectively. Poisson multivariate regression modelling (Table 6 ) indicated no significant difference in the rate of all-cause mortality between the two districts (adjusted IRR 1.03, 95% CI 0.87–1.21, p=0.751), adjusted for age, sex, urban ⁄ rural residence, net ownership, altitude and distance to health facility). How-ever, the similarly adjusted rate for malaria specific mortality was significantly lower in the intervention district (aIRR 0.60, 95% CI 0.40–0.90, p=0.013) show-ing a 40% reduction in risk of death. This finding was also reinforced by data from the health facilities. During the study period, 89.5% (n=34/37) of the inpa-tient deaths in the control district were attributed to malaria while it was 34.3% (n=12/35) in the intervention district, i.e., 2.6-fold lower than in the control district.
7.4.4. Impact on health care resource utilizationEquipping CHWs with RDTs has shown remarkable improvements in targeting AL to those who really need it by excluding non P. falciparum infections in almost 90% of the cases who otherwise might have been inappropriately treated with AL. The theoretical saving made by equipping CHWs with RDTs, i.e.; just only from AL that would have been unnecessarily prescribed without accounting further avoidable cost of false malaria cases, was calculated to be US$ 1.41 per patient examined (based on the public sector price of AL in 2001-2006).

56
MAJOR FINDINGS
Table 6. Poisson regression models of incidence rate ratios (IRRs) for all-causes and malaria-specific mortality, allowing for clustering effects at village level.
70
Table 6. Poisson regression models of incidence rate ratios (IRRs) for all-causes and malaria-specific mortality, allowing for clustering effects at village level.

57
DISCUSSION
8. DISCUSSION
The discussion is centred on the major findings of the research, relating them to the conceptual framework on access to quality health care. The different sections below highlight the urgent need to improve the efficiency of the HEP and the access to and quality of the malaria diagnosis and treatment in Tigray region.
8.1. The efficiency of the health extension programmeAssessing how well a health system does its job requires dealing with two large questions. The first is measuring the outcomes of interest, in order to determine what is achieved with respect to the health status (attainment). The second is comparing those attainments with what the system should be able to accomplish – that is, the best that could be achieved with the same resources (efficiency) [72]. The latter, which is a critical measure of a health system’s performance, is our focus.
HEP, according to many reports [45], has largely contributed to ensuring the universal access to PHC and to the current progress in the health status of the country. However, this attainment has not come cheaply. A considerable amount of the country’s limited resources and partners’ investment (training, salary, refreshing and supervision cost, construction and equipment of health posts) has been devoted to this programme. For instance, in HSDP IV, over 45% of the total budget of health is aimed at sustaining and strengthening the HEP [42]. Thus, improving its efficiency should not be optional but mandatory and this has to start by recognising its level and identifying the underlying factors.
Considering this apprehension, our study, the first of its kind in the country, has indicated that health posts were performing at very different levels of (pure) technical efficiency ranging from 4.5% to 100% score, with an average score of 57% (SD=0.07). Most (75.0%) of the sampled health posts were falling far short of their potential compared with their efficient peers given that they have the same inputs. The average TE score of 42% (SD=0.23) of the inefficient health posts implied that these facilities could potentially produce 58% more outputs using their current input endowment if they were operating as their efficient peers.
On the other hand, the study demonstrated that scale of operation/production unit (size health post) with a mean score of SE of 0.95 (SD = 0.11) was not a major impediment for efficiency. This implied that most of the health posts were

58
DISCUSSION
operating at their most productive scale sizes (CRS) for the outputs produced, which suggests that the human resources allocated to the health posts (two HEWs and an average of 13 VHWs) might be enough at this stage. Nonetheless, there was some room for improvement; if the scale inefficient health posts had had an optimal production scale size, their output would have increased by 10% without any change in the inputs.
While it is well known that the lack of efficiency impedes health care services from reaching their intended targets, measuring its level, especially in Africa, has not been well recognised. In recent years, a number of studies measuring effi-ciency using DEA have been conducted, but only a few have focused at the pri-mary health care level. Regardless of their scarcity, the existing studies have shown overall a high level of inefficiency. In Kenya, a study found 56% of the health centres to be technically inefficient and 70% scale inefficient [119]. In rural South Africa 70% of primary health care clinics were technically inefficient and 84% scale inefficient [120].
Another study in Sierra Leone, which is more comparable with ours in terms of its DMUs and input and output variables, reported that 59% of the peripheral health units were technically inefficient and 65% were scale inefficient [99]. Recently, two studies from Ghana and Seychelles based on health centres con-firmed that overall health care services are performing inefficiently. These stud-ies showed that 65% and 79% of health centres in Ghana and 41% and 59% in Seychelles were technically and scale inefficient, respectively [102, 121].
When comparing the finding of this study with others, the types of input and output variables, the level of production unit, the degree of access attained and the quality of service must be taken into consideration. In the current study, the production unit was a community-based health care service delivery site (health post), while most other studies considered DMU above this level (clinics, health centres and hospitals). The input variables were also specific to this particular programme and the outputs corresponded to its interventions. Furthermore, it should be noted that the methodology of measuring efficiency using DEA only provides a production possibility frontier depicting a locus of the potentially technically efficient output combination that a DMU is capable of producing at a point of time [122] . Therefore, comparison among results of different studies, even those with similar DMUs, is not straightforward; rather, it is context-de-pendent and only among the peers in a given period.
Health posts are operating within broad environmental characteristics that can affect their efficiency positively or negatively. The second stage of analysis, which aimed at identifying these, did not suggest any potential factor that could explain

59
DISCUSSION
the variability in efficiency. This might have been due to the relatively small sample size hiding some statistically significant relationship between the envi-ronmental factors and the efficiency scores. Some of the selected variables could have been also less related to the considered output variables. For instance, ‘the support from the tabia chief’ has more to do with activities requiring commu-nity mobilization such as hygiene and environmental sanitation theme (latrine construction) than family health service or disease management.
Studies from Ethiopia have suggested some potential factors affecting the HEP efficiency. A study conducted at the initial stages of the HEP in the country pointed out factors such as the harmonisation of the staff patterning at the health post level, and the lack of clear guidelines on relationship with other workers at the community level, on career structure, transfer and leave of absences, as af-fecting its efficiency [90]. Another unpublished recent study (Tigray was not included) also suggested different promoting or limiting factors including those variables hypothesised in our study as affecting the HEWs’ efficiency. Promoting factors included were: HEWs assigned in their community, highly involved VCHWs, HEWs appointed in kebele cabinet and kebele administrations taking the lead of coordination and health posts located within walking distance (acces-sibility). The inhibiting factors mentioned were: inadequate knowledge and skills on specific tasks, lack of supplies and equipment, inadequate supervision, weak technical and administrative support and community over expectation from the programme [123].
8.2. The cost-effectiveness of the current malaria diagnosis and treatment strategiesA number of studies have been carried out in Ethiopia to assess the performance of malaria diagnosis methods to recommend for the routine use at health post level [57, 124-127]. These studies compared different RDTs and found mixed results. When comparing CareStartTM Malaria Pf/Pv Combo test with other RDTs, the former (CareStarTM) appeared to be the most appropriate option [57, 126-127]. In other studies comparing parascreen pan/pf with other RDTs, par-ascreen pan/pf was found preferable [124] except in one [125]. None of these studies recommended paracheck pf tests for the Ethiopian context.
While these efforts were important, performance assessment is not sufficient to decide which strategy to follow, because some diagnostic methods may come with other consequences. For instance, RDTs might result in additional ex-penditure (due to the cost of testing) or significant savings (due to reduced use of expensive ACT drugs), which makes cost-effectiveness studies mandatory. Considering this notation, several studies have been conducted in many en-

60
DISCUSSION
demic countries to determine the cost-effectiveness of RDTs-based malaria di-agnosis and treatment strategies [73-78, 128-129]. However, the focus of all these studies has been comparing between either P. falciparum specific RDTs [74-75, 78] or between multispecies RDTs [73, 77] or comparing these to presumptive or/and microscope [130]. None of them compared multispecies RDTs with P. falciparum specific RDTs which is the scenario in our context.
The current study comparing the cost-effectiveness of three potentially different strategies corroborating many other studies [78, 129, 131], revealed that in the era of ACT the shift from presumptive-BS to RDT-BS is clearly of a significant benefit. This is even more relevant to our context where the malaria transmission is low–the likelihood that a fever episode is due to malaria even during the major transmission season is on average around 30%. Moreover, approximately one-third of these cases corresponded to P. vivax (CQ is sensitive), which is believed to increase to two-thirds during the minor transmission season. Therefore, low prevalence and the co-existence of both species challenge the presumptive-BS where AL is prescribed to all suspected malaria cases.
It is well documented that the presumptive-BS has numerous serious disadvan-tages. It leads to inappropriate treatment of non-malarial febrile illnesses, which delays the right therapy and thus prolongs and worsens illness, resulting in loss of productivity and even life. It increases drug costs, repeated visits to health providers and loss of trust in health services among people who turn to tradi-tional healers. Presumptive-BS also induces unnecessary side-effects to the patient and increases drug pressure on the parasite by exposing new infections to sub-therapeutic drug levels. Moreover, it leads to the under-reporting of the diseases that mimic malaria symptoms and the over-reporting of malaria. As a result, the reality of the disease of burden cannot be discerned [132-135].
Comparison of the remaining RDT-based alternative strategies revealed that parascreen-BS was more cost-effective (low cost-effectiveness ratio). The ICER also showed that the use of parascreen-BS instead of paracheck-BS was highly beneficial; it allowed two-thirds of additional cases to receive proper treatment. The inherent nature of paracheck pf to detect only P. falciparum is the main weak-ness that made the paracheck-BS less cost-effective because it considered many non-malaria illnesses as P. vivax cases when they were not. Though this strategy could relatively reduce the concern of cost and drug pressure (in terms of AL, not CQ), it still shares many of the disadvantages of the presumptive-BS.
The one-way and two-way sensitivity analysis on changes of AL cost and malaria transmission intensity also confirmed parascreen-BS as the most cost-effective. With the AL price drop, all the alternatives improved their cost-effectiveness.

61
DISCUSSION
However, in the low-transmission season, both the paracheck-BS and the pre-sumptive-BS suffered, while the parascreen-BS still improved. This showed that parascreen-BS remains cost-effective with reduced AL cost and even becomes more cost-effective during the low-transmission season, which is the longest period of the year (December-August).
While interpreting the finding, we were well aware that the higher cost-effective-ness of both RDT-BS over presumptive-BS was occurred partially at the expense of some missed P. falciparum cases, as the RDTs are less sensitive than the presumptive-BS in capturing P. falciparum. Still, if the comparison had been based solely on correctly treated malaria cases, the paracheck-BS (higher sensi-tivity) would have been the most cost-effective. However, the health gain with the parascreen-BS (less sensitivity, but better specificity) is higher as more non-malaria cases receive appropriate treatment compared with the ‘few’ missed malaria cases and the saving is greater at least by avoiding over prescription. This means that in a low malaria prevalence context, where the majority of the febrile cases are non-malaria such as ours, the cost-effectiveness should not be measured only in terms of malaria cases correctly treated or cured. In such a scenario, equal weight must be given to the non-malaria cases and, therefore, the effectiveness indicator should accommodate this requirement.
8.3. Provision of effective treatment is not sufficient: Adherence to the treatment regimen mattersDespite the fact AL is widely used in most endemic courtiers [84] and adherence to treatment regimen is context-dependent [88], the dearth of studies on this issue is surprising. This present research has shown a high non-adherence level (26.5% were definitely non-adherers) compared with previous limited studies [87, 136-139. While this enormous gap between these studies and ours could be real, several issues need to be taken into account that might partly explain the discrepancies.
The first issue relates to the type of context where the studies were carried out. For instance, in a Ugandan study [87], the sample was an educated semi-urban population living in a highly endemic malaria area, whereas our study was con-ducted in a rural setting with a predominantly illiterate population living in a low transmission setting. Populations in high endemic areas are more aware of ma-laria and its consequences [140], and semi-urban populations are also more likely to have better access to health information than in rural settlements.
A second issue to consider is the design of the study. In a study conducted in Tanzania, patients and caregivers were informed that there would be a follow-up

62
DISCUSSION
visit, which could influence patient/caregiver behaviour. In another study from Ghana, patient follow-up took place between 4 and 14 days after the initial dose. In such cases, blister pack inspection for leftover tablets with such lag of time and interviwed informed patients might not show the real adherence [138]. The rate of refusal could also have contributed to the discrepancy as the reasons for this could be the interruption of treatment regimen (patients are afraid of being blamed). In most of the former studies the rate of refusal was either not pre-sented [87, 137-139] or high [136, 141], which could overestimate the adherent and underestimate the non-adherent rate. In the current study, patients were blind of the follow-up and were traced after 3-4 days. There were also no refusals which meant that non-adherent cases were not missed on the name of refusals which might contribute to the high figure of non-adherents in this study.
A third aspect relates to the definition of adherence. In this study, a very strict definition was used, including if patients reported taking all doses at the given time interval (on the correct day and correct timing), at the correct amount and with no spitting or vomiting within the first 30 minutes, or if such spat/vomited dose was re-administered and when. In some previous studies, the inter-dose time was either not clearly described [87, 136-137, 141] or very broadly defined [139]. For instance, in the study from Ghana (adherence level 92.5%), adherence was based on the description of how AL was given by the caregivers, but no specific information about the time interval was reported [138]. In the Tanzania study [139], the inter-dose timing (+/-4 hours) was wide compared with ours (+/-2 hours), possibly increasing the number of probably adhering patients.
Several reasons were presented by patients/caregivers on why they did not finish the treatment course. The most common reason was “too many tablets” (37.3 %). The majority of these were parents/caregivers of children less than 15 years old, which might indicate that parents/caregivers were fearful of giving as many tablets to their small children as they themselves took. Thus, they might have modified either the dosing or the timing or both and were ultimately found to be non-adherent. “Felt better before finishing the regimen” (i.e., clinical recovery) was reported as a second major reason (25.5%). Nevertheless, the effect of rapid fever clearance and clinical recovery on adherence remains controversial. It could either encourage patients to finish their treatment course or to interrupt it [87, 138-139]. The study also pointed out interruption of dose increases with course; more frequently the last dose was missed followed by the fifth, fourth, third and second, which might indicate that as patients get relief in the course, they tend to interrupt the treatment.
In our study, misunderstanding of the instructions (2.4%) was not a setback in contrast to other previous studies [116, 142]. One explanation of this could be

63
DISCUSSION
the fact that HEWs are native residents (socially close) of the area, which could possibly have increased patients’ understanding of the instructions. The pictogram and clustering of the doses within the blister pack might have also helped patients to understand easily dosing. However, these explanations did not contribute to improve adherence. On the other hand, given that HEWs were both service pro-viders and data collectors at the same time, patients might have been reluctant to report misunderstanding to someone who gave them the instruction.
Three risk factors were strongly associated with being adherent: owning a radio, the belief that malaria cannot be treated traditionally and a delay in treatment seeking. Radio possession has been shown in a previous study from the region to increase the knowledge about malaria and the practice of prevention measures such as the use of LLIN [140]. The belief that malaria can be treated tradition-ally supported the possibility of interrupting AL treatment in favour of tradi-tional medicine. The possible reason why delays in treatment seeking promote adherence could be that the longer the period of illness, the more likely is the patient to get worse and the greater the desire to recover [143-144]. Even though the delay in treatment seeking was found to influence adherence positively, it is not a desirable behaviour, and, therefore, it should be discouraged.
8.4. Improving access to manage malaria: Deploying AL with RDT at community levelWHO has promoted home-based management of malaria (HMM) in order to ensure early diagnosis and prompt effective treatment for people living in areas with limited access to health care. This strategy involves the training of CHWs to manage febrile/malarial illness, making available effective user friendly anti-malarial medicines in villages and educating the community on behavioural change including malaria symptoms, prompt care-seeking and the need to adhere to the correct treatment schedule. The HMM strategy does not imply keeping antimalarial medicines at home, rather, ‘home’ means ‘close to home’, underlying the concept that antimalarial medicines must be available in the close vicinity in the home of the community members, to avoid delay in treatment [145-146]; i.e., community-based diagnosis and treatment of malaria.
In the CQ era many studies, including those from Tigray, reported that HMM was a feasible strategy to improve the access to early diagnosis and treatment of malaria and, thereby, to reduce malaria morbidity [117, 147-150], progression to severity [147, 150] and mortality [117]. However, several concerns were raised whether this strategy could remain feasible, cost-effective and with high impact in the era of ACT [145-146]. The current study, which was aimed at filling this knowledge gap, has shown promising results.

64
DISCUSSION
The first important finding is that most of the malaria cases (approximately 60% of all clinical malaria) in the intervention district were diagnosed and treated near their home by CHWs. This finding is congruent with results of the previous CBMCP in the region and with what recently was reported by others from other countries. A study from Burkina Faso, where CHWs in the intervention area treated clinical malaria patients using AL, found that most (93%) of the malaria cases were managed at this level [151]. Studies from Ghana [138] and four other African sites [137] found that more than half of the total febrile cases were treated by CHWs with almost three-fourth of them receiving prompt treatment with the correct dose. However, the study from Ghana, though it confirmed high acceptance of the strategy, it dismissed the feasibility of the strategy by conclud-ing that if CHWs are not paid, the intervention would not be sustainable. This is contrary to the experience in Tigray where it has been possible to sustain such a programme for more than two decades.
In spite of such encouraging findings, the high service utilisation observed in the previous studies, which were from an area with limited access to health care, might not be surprising compared with the present one. In the current study, patient flow towards CHWs was under a better access to malaria treatment through the HEP (health posts), which implied the existence of other reasons for the community preference for CHWs service. In interviews and focus group discussions with the community members, participants expressed their satisfac-tion that the CHW service was available at any time (accommodation) near their home (accessibility), CHWs were more respectful than the health workers, they took care of the patients as their own family (acceptance) and they also provided a high quality service. One man in the FGD stated:
I took my child to the community health worker, who gave him a referral paper to the higher health facility since his disease was not malaria. Finally, my son was diagnosed with TB in the hospital [56].
Other studies have reported community trust and appreciation of the strategy as main reasons to improve service utilisation and patient’s treatment-seeking behaviour [152-153].
The high proportion of CHWs treatment in the intervention district as a result of improved access reduced the HEWs’ workload, which allowed them to focus on other pressing health problems and on the multifaceted activities of the HEP packages. This finding concurred with previous studies [151, 153]. Furthermore, CHWs play the role of ‘triage’ for health facilities by treating the malaria cases

65
DISCUSSION
and referring those who are not [151]. This role of the CHWs might explain why health facilities in the intervention district treated more than two-fold non-malaria cases than in the control (76,350 vs.32, 873 cases).Evidence on the health impact of community-based malaria treatment on mor-bidity (incidence, severity, parasite rates) and/or mortality are still scarce. In a literature review, Hopkins et al. [154] identified only six studies in this regard in Africa over 18 years from the chloroquine era, but none for ACT. The current study indicated that providing early treatment is not only helping to cure the individual malaria patient, and prevent progression to severity and death, it also reduced the transmission intensity that is of great public health importance.
It has been well documented that in non-immune populations and children the progression of the disease to severe stage is always rapid. This is the main reason why time, represented by the early diagnosis and prompt treatment strategy, is acknowledged as a critical element in reducing malaria severity and its conse-quences including death [146]. In the presence of the CHWs’ service, malaria inpatients (resulting from delay in treatment) were lowers by twofold in the in-tervention (42%) district compared with the control (79%). This is attributable to lower malaria-specific deaths in the intervention compared with the control district with no detectable difference in all-cause mortality between them. This suggested that the difference in malaria mortality was quite specific. The deaths attributed to malaria followed the variations by age, sex and the presence of ITNS as expected, which increases the credibility of the finding. Heath facility malaria mortality data also strengthened this finding; it was shown to be 2.7 times lower in the intervention compared with the control district. The intervention was not only effective in curing patients, but also in providing prevention by clearing the parasite stage (gametocyte stage) accounted for transmission. Compared with the control, the threefold reduction in prevalence and the sevenfold in the game-tocyte are important health gain.
The argument that HMM is boosting success at the expense of over-treatment and the fear of cost and drug selection pressure on resistant parasite strain [155-157] is reasonable, that can be resolved using RDTs. The current study showed that equipping CHWs with RDTs allowed, theoretically, the targeting of AL by excluding non P. falciparum and non-malaria infections in almost nine out of ten cases. Such community-based use of RDTs has also proved to be reliable in other malaria endemic countries [153]. However, RDT can still raise a debate regarding the safety and skills of CHWs using it and the compliance of both the CHWs and the patients with negative results [152-153]. However, this is a uni-versal challenge not only facing the CHWs, but also the formal health workers [158-161], which requires further work.

66
DISCUSSION
Our study demonstrated that the safety and skills of CHWs performing the test and the performance of the test in the hands of the CWHs was close to that of the HEWs. The CHWs RDT performance showed 96.4% sensitivity, 76.0% specificity, 60.0% PPV and 98.3% NPV with a corresponding value of 94.2%, 87.0%, 97.0% and 97.0% for the HEWs. They also demonstrated a high level of competence in most of the critical procedures of conducting the test as regards safety and quality [56].
This study ascertained that access needed to be attained in its fullest dimensions, including quality, and efficiently utilised to reach its aim of providing a better health care and improving the health status of the people. As shown, the inter-vention also helped to improve the entire health system improving access to health care. The lessons learnt from this study are useful for other parts of the country and other malaria endemic countries in SSA. However, it is worth noting that the results of this study came from an area where a community-based service has been involved in the primary health care system for more than three decades. The community participation in Tigray is exceptional and hardly comparable with others. Therefore, the results of the current study should be interpreted with caution when considering the implementation of a similar strategy. It should be emphasised that one size does not fit all, and, therefore, context-dependent stud-ies on operational feasibility, effectiveness and sustainability are decisive pre-requisites.

67
METHODOLOGICAL CONSIDERATIONS
9. METHODOLOGICAL CONSIDERATIONS
Before considering the implications of the findings from this thesis, it is important to note a number of constraints related to the interpretation. In study I, output data were collected in such a way that they represented the broad range of ac-tivities of the HEWs. However, it should be noted that the selection of other outputs might have produced different efficiency outcomes. The information on input prices could not be collected and thus the allocative efficiency was not es-timated. Perhaps most importantly, one year data might not be sufficient to measure the efficiency of the HEP. Additionally, the relatively small sample size and sampling procedure do not allow generalisation to the regional and country level. This could also have hidden some statistically significant association between the environmental factors and the efficiency scores. Possible respondent bias on some of the environmental factors such as ‘the support from tabia chief’ might also have been overstated, and hidden the true difference.
There are also some considerations to take into account which can potentially affect the findings of study II. Firstly, our study was limited to the health-provid-er perspective at the rural health post level instead of the societal perspective. Another limitation was that the study design did not allow us to capture wheth-er HEWs and patients complied with the negative test results. It has been docu-mented that health workers are prescribing antimalarial drugs regardless of negative test results [78, 158-163] and patients do not trust negative results [152-153]. As it was extremely difficult to calculate, cost did not include RDT wastage, which could arise as a result of poor transport and storage conditions, due to expiry and inappropriate use.
Study III might have been subject to information bias, as the self-reported meth-od is open to good-will bias as patients are more likely unwilling to report missed doses. The enumerators, who were the prescribers, might also have been resistant to collect negative responses as they were afraid that poor results might indicate their performance. These could lead to a lower estimation of the true level of non-adherence [164-166]. However, against this expectation, the low level of adherence in our study did not seem to hold these concerns. Evidently, given the poor and rural context of the study setting, information on dose timing could not be col-lected accurately, which could have influenced the classification of patients.
A potential weakness of study IV is that its design did not permit inference of cau-sality. While a randomised controlled trial using the smallest possible population

68
METHODOLOGICAL CONSIDERATIONS
groups (e.g. villages) as study unit would be the most robust design, this was not considered to be ethical, or indeed feasible because of the risk of cross-contam-ination if patients allocated to the control arm sought access to AL at the inter-vention neighbouring village. Thus, large geographical districts with similar malaria eco-epidemiological conditions and operational convenience were se-lected as the study units. Still, contamination along the border of the two districts was unavoidable. However, given the very large sample size (more than 200,000 people) in this study, the effect of contamination is expected to be minor.
69
CONCLUSIONS AND RECOMMENDATIONS
10. CONCLUSION AND RECOMMENDATIONS
Health systems are required to be affordable, accessible, available, acceptable, adequate and of good quality. However, these are only a means to an end; they are instrumental rather than final goals. The more accessible a system is the more people can utilise it to improve their health. With regard to this, the current study showed most (75%) of the health posts were performing inefficiently indicted that they are underutilized. Therefore, ensuring the attained access through the HEP is efficiently utilised to its optimal productivity level is an unavoidable task [72]. If the HEP, which consumes an important amount of resources, is to reach its in-tended goal of improving the health status of the population and ensuring an eq-uitable distribution of health care resources, research aimed at improving its ef-ficiency and identifying factors affecting it is of great public heath importance. DEA has been shown to be an easy, affordable and accessible tool that could support this effort.
This research confirmed that parascreen-BS (multispecies RDT-BS) is the most cost-effective for the region (Tigray); and this could be generalised to most parts of the country. However, contrary to the suggestions of many local studies (i.e. performance studies) to replace P. falciparum specific RDT strategies (paracheck-BS) with multispecies RDT-BS, the former has been the most commonly used at health posts level in the country since 2004. Presumptive-BS has also been ex-tensively used as paracheck-BS supply was insufficient and frequently inter-rupted [57, 124, 126-127]. As this study has revealed, there is no epidemiological, and economical contextual justification to keep both presumptive-BS and the P. falciparum specific RDT-BS.
It is important to note that the current study has shown parascreen-BS as the most cost-effective only in contrast to its comparators. As there is advancement in technology and change in price in both the antimalarial drugs and the multi-species RDTs, search for the best cost-effective strategy should be continuous. The effort must include RDT’s ease of use, patent friendly and clarity of instruc-tions for end users, shelf life and stability in various conditions including the use by CHWs. The assessment of health workers’ and patients’ compliance with negative test results should also be part of future research work. Future studies on cost-effectiveness should not be limited to the health-provider perspective, but include the societal perspective too.

70
CONCLUSIONS AND RECOMMENDATIONS
The poor adherence level obtained in the current study population raises great concern. The benefit of ensuring compliance with the treatment regimen goes beyond the cure of the patient to preventing transmission and delaying the pos-sible development and spread of drug resistance strains [81, 83, 141]. The major-ity of the non-adherents are being children with the main reason of ‘too many tablets’ calls for the urgent introduction of the dispersible paediatric formulation of AL. The importance of radio as an information outlet should be promoted. The poor adherence in this study should not be attributed only to the patient, but also the failure of HEWs to instruct patients adequately on correct AL use and the need to complete the regimen. Therefore, education should also include health care providers in the form of refresher training and supervision. Further research which prevail information bias from the self-reported data may be required. Studies applying methods of either automatic pill count or/and qualitative meas-urement of blood and urine level of lumefantrine may help.
AL deployment with RDT through a community based service in Tigray rural population is feasible and it has high impact if CHWs are appropriately trained, well equipped and supported through frequent supervision. As described by Pagnoni, of the five dimensions of access, community-based malaria management (HMM) in our context seems to have the potential to surpass facility-based ser-vices in three of them, with only availability and affordability of the commodities facing similar challenges [145]. Therefore, restricting malaria diagnosis and treatment of malaria to HEWs would only be a reasonable compromise, not a substitute for the native insider community health workers. The community-based service is also only complementing the HEWs’ task (formal health facility service), but never replacing it. In spite of the fact this study showed good safety and technique of using RDT by CHWs, the blood contamination is a reasonable con-cern. Therefore, further operational studies are required to understand thor-oughly the safety of collecting blood and storing of RDTs (sensitive to temperature and humidity) in the weak huts of the CHWs.
In summary, this thesis has explored the efficiency of the HEP, the access to and quality of the diagnosis and treatment of malaria with the aim of improving the overall health system performance. It has highlighted the importance of assess-ing and monitoring HEP efficiency. The guideline of the malaria diagnosis and treatment strategy should be revised and a strong intervention regarding adher-ence to the malaria treatment should be urgently established.

71
ACKNOWLEDGEMENT
ACKNOWLEDGEMENTS
This PhD thesis would have been impossible without the support and contribu-tion of many people and organizations to whom I am deeply indebted. First and foremost I would like to express my deep respect and gratitude to the participants in the research project: all the patients, community health workers, health exten-sion workers, enumerators and malaria district officers.
I also acknowledge the Tigray Health Bureau for the acquiescence to conduct this research and for the repeated leave granted to me to come to Umea. I would like to express my gratitude to the various funding organizations that covered the expenses of this research project: the Centre for Global Health at Umea Univer-sity with support from the Swedish Council for Working Life and Social Research (FAS); the Swedish Centre Party Donation for the Global Research Collaboration and the Swedish Research School for Global Health. I am also thankful to the Italian Ministry of Labour, Health and Social Policies and Novartis Farma SPA (Italy), for their partial funding of the project. The technical support from WHO is also appreciated.
I will forever remain greatly indebted to my tutors. To my main mentor Miguel San Sebastián, for your unreserved and tireless support from the inception of the research project. I have had the privilege to learn much over the years since my Master studies, and benefited to great extent from each discussion and every email exchanges we had had. Your guidance has been showing me the direction to deal with problems while leaving the decision up to myself. This process has really helped me to build up my critical and analytical thinking and to grow as independent researcher. Your proficiency of simplifying and precising difficulties is a great lesson learned that I will keep. For me, it has been a pleasure and a privilege to be supervised by such a dynamic and innovative tutor. I am also grateful to my co-supervisor Curt Löfgren without whom this work had been impossible. Thank you so much for sacrificing your valuable time, continuous encouragement and support. I will always remember and admire your great kindness and hospitality.
I would also like to thank the co-authors and peer-reviewers of my papers who have provided invaluable expertise that has ultimately shaped this work. I am grateful to Lars Lindholm for accepting to be my examiner and subsequently for your inputs. To Anders Emmelin, Clas Ahlm and Klas-Göran Sahlen to your

72
ACKNOWLEDGEMENT
valuable comments, suggestions and criticisms during the midterm seminar which contributed to improve the work.
I owe much gratitude to the Division of Epidemiology and Global Health for pro-viding me the great opportunity to develop my PhD studies. I will always be grate-ful to all the staff members, whom I cannot include all here, for their excellent hospitality that made me to feel always at home and to love Umea. Special ap-preciation goes to Lars Weinehall, the head of Unit for providing a very conducive environment to study and for interacting with all the faculty members. I would like to thank Anna Karin Hurtig for her excellent coordination of the research programme; I am also indebted for your understanding and the help you pro-vided me during the times when I was in bad health. Karin Johansson, I appreci-ate your wonderful administration. You door has always been open when I have needed help.
Dear Birgitta Åström! I completely share all those wonderful acknowledgements and appreciations given to you over the years from the previous graduates. You have always made everyone of us feel at home. The way you accustom yourself to several needs, different cultures and many personalities is really amazing! You have been along the years not just a research administrator but also a friend. The time I got sick and felt alone, you provided me the necessary support and en-couragement. You would never know how much your kind personality influenced me. My gratitude is not only mine but also of all my family. Your kind support and good humour always will remain in my heart.
To all my PhD student colleagues and friends with whom we have shared know-ledge and experiences: Barnabas Njozing, Lorena Ruano, Fredrik Norström, Felix Kisanga, Stephen Maluka, Gasto Frumence, Rose Laisser, Alison Hernandez and Yien Ling. We had a wonderful time which will never fade from my mind. Special appreciation goes to Tesfaye G/ezgiabiher for being a good friend anytime and everywhere.
I greatly acknowledge all the wonderful colleagues and friends I have made during my career and research work in the Malaria Department, Tigray Health Bureau: Asefaw, Berhane, Teame, Goitom, Alem, G/medhin, Atakalti and Hareya. It has been a pleasure and an asset to work with and to learn from such a wonderful team. I would like to express my sincerest thanks to my neighbourhoods: Haile and Fotien with all their families, G/ezgiabiher (Shago), Samuel and Aregawi (Shumbahri). Thank so much all friends in Mekelle and elsewhere for the sig-nificant support and encouragement to myself and my family. Long time friends; Desalegn, Tafere and Mustafa, this is the right opportunity to appreciate your support and understanding. I want to thank too much to Yalem and Abrah Tsegay

73
ACKNOWLEDGEMENT
for the wonderful time we had at home and in Umea. My thanks are extended to the Umea resident Ethiopian friends (Adane, Fitsum, Haile, Ma-asho, Moham-mod, Tekele and Hailemicheal) for always welcoming me.
I owe the greatest debt to all the staff members of Nephrology department of Norrlands Univeritetssjukhus. Special thanks to Dr. Nils Sundvall for your high dedication to see me any time.
I would like to pass my heartfelt gratitude and appreciation to my family: My dearest wife Misrak, and children (KaleAb, BereketAb and the little daughter Blien) for the love, understanding and encouragement you have been given me over the years. And, I want you to know how much I appreciate your dedication and concerns for my life and career; you must share equally any success I have had. I am highly indebted to the care and support from all my siblings. Too many thanks go to my big sister Mitlal Lemma. Had it not been for your existence, I would have not been who I am today. I will always appreciate and be indebted to my nieces and cousins Elline, Mulugeta, Zewdie and H/melokt for your support. Obviously, including some risks leaving some out, and therefore it is worth to conclude with an all-encompassing the warmest and deepest thanks to all of you who have contributed to bring this work to an successful end!


75
REFERENCES
REFERENCES
1. WHO, UNICEF: World Malaria Report 2005. WHO/HTM/MAL/20051102. Geneva: World Health Organization and UNICEF; 2005:294.
2. Feachem RGA, Phillips AA, Targett GA: Shrinking the Malaria Map. A Prospectus on Malaria Elimination. San Francisco: The Global Health Group, Global Health Sciences.University of California, San Francisco; 2009: 206.
3. WHO: World Malaria Report 2010. Geneva: World Health Organization 2011: 220.
4. Teklehaimanot A, Mejia P: Malaria and poverty. Ann N Y Acad Sci 2008, 1136:32-37.
5. WHO: Malaria control today, current WHO recommendations, working document. Geneva: Roll Back Malaria department, World Health Organization ; 2005:75.
6. Counting Malaria Out [www.rbm.who.int/multimedia/rbminfosheets.html] [Accessed September 27,2011]
7. Gwatkin DR, Guillot M: The Burden of Disease among the Global Poor: Current Situa-tion, Future Trends, and Implications for Strategy. Global Forum for Health Research Publications. Washington, D.C: The World Bank; 2000: 52.
8. Sachs J, Malaney P: The economic and social burden of malaria. Nature 2002 415(6872):680-85
9. RBM/WHO/UNICEF: World malaria report, 2005. WHO/HTM/MAL/2005.1102. Geneva: World Health Organization/UNICEF; 2005.
10. Key Malaria facts [www.rbm.who.int/keyfacts.html] [Accessed September 27,2011]
11. Gallup JL, Sachs JD: The economic burden of malaria. Am J Trop Med Hyg 2001, 64(1-2 Suppl):85-96.
12. Breman J, Alilio M, Mills A: Conquering the intolerable burden of malaria: what’s new, what’s needed: a summary. Am J Trop Med Hyg 2004, 71(2):1-15.
13. J.A.Najera: Malaria Control, Problems and Strategy. WHO/CDS/RBM/99.10. Geneva: The World Health Organization; 1999: 135.
14. Kager PA: Malaria control: constraints and opportunities. Trop Med Int Health 2002, 7(12):1042-1046.
15. WHO: Eliminating Malaria:Learning From the Past, Looking Ahead. Progress & impact series. vol. 8. Geneva: Roll Back Malaria Partnership Secretariat; 2011: 86.
16. WHO: A Global Strategy for Malaria Control. Geneva: The World Health Organization; 1993: 40.
17. Harare Declaration on Malaria Prevention and Control in the context of African Eco-nomic Recovery and Development [(http://www.africa-union.org/official_documents/Heads%20of%20State%20Summits/hog/7HoGAssembly1997.pdf)] [Accessed Septem-ber 5,2011]
18. RBM Mandate [http://www.rbm.who.int/rbmmandate.html] [Accessed September 5, 2011]

76
REFERENCES
19. Six elements of the RBM startegy [(http://www.who.int/rbm/Presentations/us-canada/canhc/sld014.htm)] [Accessed September 7,2011]
20. RBM: Global Strategic Plan 2005-2015. Geneva: Roll Back Malaria Partnership; 2008: 52.
21. RBM/WHO: The Abuja Declaration and the Plan of Action. WHO/CDS/RBM/2003.46. Geneva: Roll Back Malaria/World Health Organization; 2003: 11.
22. Abuja call for accelerated action towards universal access to HIV and AIDS, tuberculo-sis and malaria services in Africa [http://www.africa-union.org/root/au/conferences/past/2006/may/summit/doc/en/ABUJA_CALL.pdf] [Accessed October 3, 2011]
23. RBM: The Global Malaria Action Plan for a malaria free world. Geneva: Roll Back Malaria Partnership; 2008: 274.
24. United Nations Millennium Declaration [http://www.beta.undp.org/undp/en/home/mdgoverview.html] [Accessed Septmeber 20,2011]
25. Roll Back Malaria to achieve the Millennium Development Goals (MDGs) [www.rbm.who.int/.../docs/mdg_bookmark.pdf ] [Accessed October 15,2011]
26. O’Meara, J.N. Mangeni, Steketee R, B. Greenwood: Changes in the burden of malaria in sub-Saharan Africa Lancet Infect Dis 2010, 10(8):545-55
27. WHO: A Decade of Partnership and Results. Progress & Impa ct Series. Geneva: World Health Organization; 2011: 139.
28. WHO: Global Malaria control and elimination: report of a technical review. Geneva: 2008 World Health Organization; 2008.
29. Australopithecus afarensis [http://en.wikipedia.org/wiki/Australopithecus_afarensis] [Ac-cessed June 10,2011 ]
30. Aksumite Empire [http://en.wikipedia.org/wiki/Aksumite_Empire] [Accessed June 10,2011]
31. Ethiopian calendar [http://en.wikipedia.org/wiki/Ethiopian_calendar] [Accessed June 10,2011]
32. Ge’ez script [http://en.wikipedia.org/wiki/Ge%27ez_script] [Accessed June 11, 2011]
33. FMoH: National strategic plan for malaria prevention, control and elimination in Ethi-opia, 2010-2015. Addis Aabab: Federal Democratic Republic of Ethiopia Ministry of Health; 2009: 83.
34. FMoH: Health Sector Strategic Plan (HSDP-III) 2005/6-2009/10. Addis Ababa Federal Democratic Republic of Ethiopia Ministry of Health; 2005: 164.
35. IFPRI, CSA: Atlas of the Ethiopian Rural Economy: International Food Policy Research Institute, Washington, DC, USA, and the Central Statistical Agency, Addis Ababa, Ethio-pia.; 2006: 108.
36. Ethiopian Constitution [http://www.wipo.int/wipolex/en/details.jsp?id=7438] [Accessed Novomber 3,2011]
37. Population Census Commission: Summary and statistical report of the 2007 population and housing census. Addis Ababa: Federal Democratic Republic of Ethiopia Population Census Commission; 2008
38. UNDP: Human Development Report 2010. 20th Anniversary Edition. New York: United Nations Development Programme; 2010: 238.

77
REFERENCES
39. Indicators [http://data.worldbank.org/indicator] [Accessed August 10, 2011]
40. WHO: World Health Statistics 2010. Geneva: The World Health Organization; 2010: 177.
41. MoFED: Ethiopia:2010 MDGs Report;Trends and prospects for meeting MDGs by 2015. Addis Ababa: Ministry of Finance and Economic Development; 2010: 60.
42. FMoH: Health Sector Strategic Plan (HSDP-IV) 2010/11-2014/15. Addis Ababa: Federal Democratic Republic of Ethiopia Ministry of Health; 2010: 128.
43. WHO: Trends in Maternal Mortality:1990 to 2008. World Health Organization; 2010.
44. CSA: Ethiopia Demographic and Health Survey 2011 Preliminary Report. Addis Ababa: Central Statistical Agency; 2011.
45. FMoH: Health sector development programme III, Annual performance report 2009/10. Addis Ababa: Federal Democratic Republic of Ethiopia Ministry of Health; 2010: 135.
46. WHO: Macroeconomics and Health:Investing in Health for Economic Development: Geneva: World Health Organization; 2001: 210.
47. MoFED: Ethiopia: Building on Progress A Plan for Accelerated and Sustained Develop-ment to End Poverty (PASDEP):2005/06-2009/10. Addis Ababa: Ministry of Finance and Economic Development; 2006.
48. MoHTGE: Health Policy of the Transitional Government of Ethiopia. Addis Ababa: Minstry of Health of the Transitional Government of Ethiopia 1993:11.
49. Sebastian MS, Lemma H: Efficiency of the health extension programme in Tigray, Ethiopia: a data envelopment analysis. BMC Int Health Hum Rights 2010, 10:16.
50. FMoH: Health Extension Program in Ethiopia profile. Addis Ababa; Health Extension and Education Center, Federal Democratic Republic of Ethiopia Ministry of Health; 2007.
51. Lemma H, M.S.Sebastian, Löfgren C, Barnabas G: Cost-effectiveness of three malaria treatment strategies in rural Tigray, Ethiopia where both Plasmodium falciparum and Plasmodium vivax co-dominate. Cost Eff Resour Alloc 2011, 9:2.
52. Health Extension Programme-Major training packages [http://cnhde.ei.columbia.edu/training/index.html]
53. Gebremariam N, Abdulahi Y, Mebrate A: The Ecology of Health and Disease in Ethiopia. First edn. Addis Ababa. Ministry of Heath; 1988
54. Negash K, Kebede A, Medhin A, Argaw D, Babaniyi O, Guintran JO, Delacollette C: Ma-laria epidemics in the highlands of Ethiopia. East Afr Med J 2005, 82(4):186-92.
55. FMOH: National five-year strategic plan for Malaria prevention & control in Ethiopia 2006-2010. Addis Ababa: Federal Democratic Republic of Ethiopia Ministry of Health; 2006: 46.
56. WHO: Deployment of artemetherlumefantrine with rapid diagnostic tests at community level, Raya Valley, Tigray, Ethiopia. World Health Organization and Tigray Health Bu-reau, Ethiopia; 2009: 93.
57. Mekonnen Z, Ali S, Belay G, Suleman S, Chatterjee S: Evaluation of the performance of CareStart Malaria Pf/Pv Combo rapid diagnostic test for the diagnosis of malaria in Jimma, southwestern Ethiopia. Acta Trop 2010, 113(3):285-88.
58. Otten M, Aregawi M, Were W, Karema C, Medin A, Bekele W, Jima D, Gausi K, Komatsu R, Korenromp E et al: Initial evidence of reduction of malaria cases and deaths in Rwanda and Ethiopia due to rapid scale-up of malaria prevention and treatment. Malaria J 2009, 8:14.

78
REFERENCES
59. Ghebreyesus TA, Alemayehu T, Bosman A, Witten KH, Teklehaimanot A: Community participation in malaria control in Tigray region Ethiopia. Acta Trop 1996, 61(2):145-56.
60. Friends of the Global Fund Afica: Ethiopia is turning the tide against malaria with global fund. Lagos: Friends of the Global Fund Afica; 2008.
61. FMoH: Malaria diagnosis and treatment guideline for health workers in Ethiopia. 2nd edn. Addis Ababa: Federal Democratic Republic of Ethiopia Ministry of Health; 2004: 62.
62. FMoH: Guidelines for malaria epidemic prevention and control in Ethiopia. Addis Ababa: Federal Democratic Republic of Ethiopia Ministry of Health; 1999
63. WHO: Antimalarial drug combination therapy. Geneva: The World Health Organization; 2001.
64. FMoH: Malaria diagnosis and treatment guideline for health workers in Ethiopia. 2nd edn. Addis Ababa: Federal Democratic Republic of Ethiopia Ministry of Health; 2004.
65. WHO/AFRO/WPRO: Interim notes on selection of type of malaria rapid diagnostic test in relation to the occurrence of different parasite species.Guidance for national malaria control programmes. Geneva: World Health Organization / Roll Back malaria; 2005
66. WHO: Guidelines for the treatment of malaria. 2nd. Geneva: World Health Organization; 2010: 207.
67. WHO/RBM: The community-based malaria control programme in Tigray, northern Ethiopia: A review of programme set-up, activities, outcomes and impact. WHO/CDS/RBM/99.12.1999. Geneva: World Health Organization /Roll Back Malaria; 1999.
68. THB: Five year strategic Health plan for Tigray 2006-2010. Mekelle: Tigray Health Bu-reau; 2006.
69. THB: Tigray Health Profile: Consecutive annual Health Profiles from 2000-2010. Mekelle: Tigray Health Bureau; 2000-2010,.
70. Hollingsworth B, Wildman J: The efficiency of health production: re-estimating the WHO panel data using parametric and non-parametric approaches to provide additional infor-mation. Health Econ 2003, 12(6):493-504.
71. Worthington AC: Frontier efficiency measurement in health care: a review of empirical techniques and selected applications. Med Care Res Rev 2004, 61(2):135-170.
72. WHO: The World Health Report 2000: Health Systems:Improving Performance. Geneva: World health Orgnaization; 2000.
73. de Oliveira MR, de Castro Gomes A, Toscano CM: Cost effectiveness of OptiMal(R) rapid diagnostic test for malaria in remote areas of the Amazon Region, Brazil. Malar J 2010, 9:277.
74. Rolland E, Checchi F, Pinoges L, Balkan S, Guthmann JP, Guerin PJ: Operational re-sponse to malaria epidemics: are rapid diagnostic tests cost-effective? Trop Med Int Health 2006, 11(4):398-408.
75. Lubell Y, Reyburn H, Mbakilwa H, Mwangi R, Chonya K, Whitty CJ, Mills A: The cost-effectiveness of parasitologic diagnosis for malaria-suspected patients in an era of combi-nation therapy. Am J Trop Med Hyg 2007, 77(6 Suppl):128-32.
76. Wiseman V, Kim M, Mutabingwa TK, CJM. W: Cost-effectiveness study of three antima-larial drug combinations in Tanzania. PLoS Medicine 2006,3(10):e373

79
REFERENCES
77. Bualombai P, Prajakwong S, Aussawatheerakul N, Congpoung K, Sudathip S, Thimasarn K, Sirichaisinthop J, Indaratna K, Kidson C, M S: Determining cost-effectivness and cost component of three malaria diagnostic modules being used in remote non-micrscope areas. South Asian J Trop Med Public Health 2003, 34(2):322-33
78. Chanda P, Castillo-Riquelme M, Masiye F: Cost-effectiveness analysis of the available strategies for diagnosing malaria in outpatient clinics in Zambia. Cost Eff Resour Allo 2009, 7:5.
79. Kremsner, P. G.Krishna,S.Antimalarial combinations. Lancet 2004, 364(9430):285- 94.
80. Wernsdorfer WH, Landgraf B, Wiedermann G, . KH: Chloroquine resistance of Plasmo-dium falciparum: a biological advantage? Trans R Soc Trop Med Hyg 1995, 89(1):90-91
81. Peter B. Bloland, Mary Ettling, Meek S: Combination therapy for malaria in Africa: hype or hope? Bull World Health Organ 2000, 78(12):1378-88
82. Wernsdorfer WH: Epidemiology of drug resistance in malaria. Acta Trop 1994, 56(2-3):143-56.
83. White NJ, Olliaro PL: Strategies for the prevention of antimalarial drug resistance: ratio-nale for combination chemotherapy for malaria. Parasitol Today 1996, 12(10):399-401.
84. WHO: World Malaria Report 2009. Geneva: The World Health Organization; 2009.
85. Piola P, Fogg C, Bajunirwe F, Biraro S, Grandesso F, Ruzagira E, Babigumira J, Kigozi I, Kiguli J, Kyomuhendo J et al: Supervised versus unsupervised intake of six-dose arte-mether-lumefantrine for treatment of acute, uncomplicated Plasmodium falciparum ma-laria in Mbarara, Uganda: a randomised trial. Lancet 2005, 365(9469):1467-73.
86. E. Depoortere, E.T.C.Salvador, Z.Bisoff, Guthman. JP: Adherence to combination of arte-mether and lumefantrine(Coartem) in Kajo Keji,Southern Sudan. Ann Trop Med Parasi-tol. 2004, 98(6):635-37.
87. Fogg C., Bajunirwe F, Piola P., Biraro S., Checchi F., Kiguli J, Namiiro P., Musabe J., Kyo-mugisha A., Guthmann J.: Adherence to a six-dose regimen of artemether-lumefantrine for treatment of uncomplicated plasmodium falciparum malaria In Uganda. Am J Trop Med Hyg 2004, 71(5):525-30.
88. Yeung S, White NJ: How do patients use antimalarial drugs? A review of the evidence. Trop Med Int Health 2005, 10(2):121-138.
89. Ghebreyesus TA, Witten KH, Getachew A, Yohannes AM, Tesfay W, Minass M, Bosman A, Teklehaimanot A: The community-based malaria control programme in Tigray, north-ern Ethiopia. A review of programme set-up, activities, outcomes and impact. Parassito-logia 2000, 42(3-4):255-90.
90. Teklehaimanot A, Kitaw Y, G/Yohannes A, Girma S, Seyoum S, Desta S, Ye-Ebiyo Y: Study of the Working Conditions of Health Extension Workers in Ethiopia. Ethiop J Health Dev 2007, 21(3):246-59.
91. WHO: Everybody business: strengthening health systems to improve health outcomes: WHO’s framework for action. Geneva; the World Health Organization 2007:56
92. Kirigia JM, Preker A, Carrin G, Mwikisa C, Diarra-Nama AJ: An overview of health financ-ing patterns and the way forward in the WHO Africa Region. East Afr Med J 2006, 83(9 Suppl):S1-S28.
93. Gruskin S, Mills EJ, D. T: History, principles and practice of health and human rights. Lancet 2007, 370(9585):449-55.

80
REFERENCES
94. Gulliford M, Figueroa-Muñoz J, Morgan M HD, Gibson B BR, M. H: What does ’access to health care’ mean? J Health Serv Res Policy 2002, 7(3):86-8.
95. Penchansky R, Thomas JW: The concept of access: definition and relationship to con-sumer satisfaction. Med Care 1981, 19(2):127-140.
96. Obrist B, Iteba N, Lengeler C, Makemba A, Mshana C, Nathan R, Alba S, Dillip A, Hetzel MW, Mayumana I et al: Access to health care in contexts of livelihood insecurity: a frame-work for analysis and action. PLoS Med 2007, 4(10):1584-88.
97. THB: The Tigray Health Bureau Profile of 2010. Mekelle: Tigray Health Bureau; 2010: 134.
98. Masiye F: Investigating health system performance: an application of data envelopment analysis to Zambian hospitals. BMC Health Serv Res 2007, 7(58).
99. Renner A, Kirigia JM, Zere EA, Barry SP, Kirigia DG, Kamara C, Muthuri LH: Technical efficiency of peripheral health units in Pujehun district of Sierra Leone: a DEA applica-tion. BMC Health Serv Res 2005, 5:77.
100. Rowena Jacobs, Peter C. Smith, Andrew Street: Measuring Efficiency in Health Care:analytic techniques and health policy, First edn. New York: Cambridge University Press; 2006.
101. Zere E, Mbeeli T, Shangula K, Mandlhate C, Mutirua K, Tjivambi B, W. K: Technical ef-ficiency of district hospitals: Evidence from Namibia using Data Envelopment Analysis. Cost Eff Resour Allo 2006, 4:5.
102. Akazili J, Adjuik M, Jehu-Appiah C, E. Z: Using data envelopment analysis to measure the extent of technical efficiency of public health centres in Ghana. BMC Int Health Hum Rights 2008, 8:11.
103. Akazili J, Adjuik M, Chatio S, Kanyomse E, Hodgson A, Aikins M, J. G: What are the Technical and Allocative Efficiencies of Public Health Centres in Ghana? Ghana Med J 2008, 42(.4):149-55.
104. Salinas-Jimdnez J, Smith P: Data envelopment analysis applied to quality in primary health care. Annals of Operations Research 1994, 67(I 996):141-161.
105. Hollingsworth B, Parkin D: The efficiency of the delivery of neonatal care in the UK. J Public Health Med 2001, 23(1):47-50.
106. Chia-Chi Lee: Analysis of overall technical efficiency, pure technical efficiency and scale efficiency in the medium-sized audit firms. Expert Systems with Applications (2009) 36 (2009):11156-71.
107. Osei D, d’Almeida S, George MO, Kirigia JM, Mensah AO, Kainyu LH: Technical efficien-cy of public district hospitals and health centres in Ghana: a pilot study. Cost Eff Resour Alloc 2005, 3:9.
108. Chang H-H: Determinants of hospital effciency: the case of central government-owned hospital in Taiwan. Omega Int J Mgmt Sci 1998, 26(2):307-317.
109. I. M. Garcı´a Sa´nchezm: Technical and Scale Efficiency in Spanish Urban Transport: Estimating with Data Envelopment Analysis. Advances in Operations Research 2009, 2009:15
110. Coelli TJ, Rao DS, GE: B: An introduction to efficiency and productivity analysis. London: Kluwer Academic Publishers; 2005.

81
REFERENCES
111. Yasar A. Ozcan: Health care benchmarking and performance evaluation: an assessment using data envelop analysis: Springer Science+Business Media, LLC; 2008.
112. Coelli TJ: A guide to DEAP version 2.1: a data envelopment analysis (computer) program. Australia: CEPA working papers Armidale, Department of econometrics, University of New England; 1996.
113. Guven-Uslu P, Linh PT: Effects of changes in public policy on efficiency and productivity of general hospitals in Vietnam. Paper No 08-30: ESRC Centre for Competition Policy Working; 2008.
114. Drummond ME, O’Brien B, L.Stoddart G, W.torrance G: Methods for Economic Evalu-tion of Health Care Programmes, 2nd edn. Oxford: Oxford University Press; 1997.
115. CDC: Epi Info™ version 3.5.1. In., Epi Info™ version 3.5.1 edn. Atlanta, USA: Centers for Disease Control and Prevention; 2008.
116. Depoortere E, Guthmann J. P, Sipilanyambe N, Nkandu E, Fermon F, Balkan S, Legros D: Adherence to the combination of sulphadoxine-pyrimethamine and artesunate in the Maheba refugee settlement, Zambia. Trop Med Int Health 2004, 9(1):62-7.
117. Kidane G, Morrow RH: Teaching mothers to provide home treatment of malaria in Tigray, Ethiopia: a randomised trial. Lancet 2000, 356(9229):550-555.
118. Lwanga SK, S L: Sample Size Determination in Health Studies. A Practical Manual. Geneva: WHO; 1991.
119. Kirigia JM, Emrouznejad A, Sambo LG, Munguti N, Liambila W: Using data envelopment analysis to measure the technical efficiency of public health centers in Kenya. J Med Syst 2004, 28(2):155-66.
120. Kirigia JM, Sambo LG, Scheel H: Technical efficiency of public clinics in Kwazulu-Natal Province of South Africa. East Afr Med J 2001, 78(3 Suppl):S1-13.
121. Kirigia JM, Emrouznejad A, Gama Vaz R, Bastiene H, J P: A comparative assessment of performance and productivity of health centres in Seychelles. Int J Productivity Perfor-mance Management 2008, 57(1):72-92.
122. Hollingsworth B, Dawson PJ, Maniadakis N: Efficiency measurement of health care: a review of non-parametric methods and applications. Health Care Manag Sci 1999, 2(3):161-172
123. Health Extension and Education Center: Report on the Assessment of Factors Contributing to and Affecting Performance of Health Extension Workers in Selected Woredas of Amhara National Regional State and Southern Nation, Nationalities and People’s Region. Addis Ababa: Federal Democratic Republic of Ethiopia Federal Ministry of Health; 2008: 85.
124. Endeshaw T, Graves PM, Shargie EB, Gebre T, Ayele B, Yohannes G, Zerihun M, Genet A, Melak B, Kebede A et al: Comparison of Parascreen Pan/Pf, Paracheck Pf and light microscopy for detection of malaria among febrile patients, Northwest Ethiopia. Trans R Soc Trop Med Hyg 2010, 104(7):467-74.
125. Endeshaw T, Gebre T, Ngondi J, Graves PM, Shargie EB, Ejigsemahu Y, Ayele B, Yo-hannes G, Teferi T, Messele A et al: Evaluation of light microscopy and rapid diagnostic test for the detection of malaria under operational field conditions: a household survey in Ethiopia. Malar J 2008, 7:118.
126. Ashton RA, Kefyalew T, Tesfaye G, Counihan H, Yadeta D, Cundill B, Reithinger R, Kolac-zinski JH: Performance of three multi-species rapid diagnostic tests for diagnosis of Plas-modium falciparum and Plasmodium vivax malaria in Oromia Regional State, Ethiopia. Malar J 2010, 9:297.

82
REFERENCES
127. Sharew B, Legesse M, Animut A, Jima D, Medhin G, Erko B: Evaluation of the perfor-mance of CareStart Malaria Pf/Pv Combo and Paracheck Pf tests for the diagnosis of malaria in Wondo Genet, southern Ethiopia. Acta Trop 2009, 111(3):321-24.
128. Lubell Y, Hopkins H, Whitty CJM, Staedke SG, Mills A: An interactive model for the assessment of the economic costs and benefits of different rapid diagnostic tests for ma-laria. Malar J 2008, 7:21.
129. Shillcutt S, Morel C, Goodman C, Coleman P, Bell D, Whitty CJM, Mills A: Cost-effec-tiveness of malaria diagnostic methods in sub-Saharan Africa in an era of combination therapy. Bulletin of the World Health Organization 2008, 86(2):101-10.
130. Batwala V, Magnussen P, Hansen KS, Nuwaha F: Cost-effectiveness of malaria micros-copy and rapid diagnostic tests versus presumptive diagnosis: implications for malaria control in Uganda. Malar J 2011, 10(1):372.
131. Uzochukwu BS, Obikeze EN, Onwujekwe OE, Onoka CA, Griffiths UK: Cost-effectiveness analysis of rapid diagnostic test,microscopy and syndromic approach in the diagnosis of malaria in Nigeria: implications for scaling-up deployment of ACT. Malar J 2009, 8:265.
132. Amexo M, Tolhurst R, Barnish G, Bates I: Malaria misdiagnosis: effects on the poor and vulnerable. Lancet 2004, 364(9448):1896-98.
133. Chandramohan D, Jaffar S, Greenwood B: Use of clinical algorithms for diagnosing ma-laria. Trop Med Int Health 2002, 7(1):45-52.
134. Olivar M, Develoux M, Chegou Abari A, Loutan L: Presumptive diagnosis of malaria re-sults in a significant risk of mistreatment of children in urban Sahel. Trans R Soc Trop Med Hyg 1991, 85(6):729-730.
135. Luxemburger C, Nosten F, Kyle DE, Kiricharoen L, Chongsuphajaisiddhi T, White NJ: Clinical features cannot predict a diagnosis of malaria or differentiate the infecting spe-cies in children living in an area of low transmission. Trans R Soc Trop Med Hyg 1998, 92(1):45-9.
136. Bell DJ, Wootton D, Mukaka M, Montgomery J, Kayange N, Chimpeni P, Hughes DA, Molyneux ME, Ward SA, Winstanley PA et al: Measurement of adherence, drug concen-trations and the effectiveness of artemether-lumefantrine, chlorproguanil-dapsone or sulphadoxine-pyrimethamine in the treatment of uncomplicated malaria in Malawi. Ma-lar J 2009, 8:204.
137. Ajayi IO, Browne EN, Garshong B, Bateganya F, Yusuf B, Agyei-Baffour P, Doamekpor L, Balyeku A, Munguti K, Cousens S et al: Feasibility and acceptability of artemisinin-based combination therapy for the home management of malaria in four African sites. Malar J 2008, 7:6.
138. Chinbuah AM, Gyapong JO, Pagnoni F, Wellington EK, Gyapong M: Feasibility and ac-ceptability of the use of artemether-lumefantrine in the home management of uncom-plicated malaria in children 6-59 months old in Ghana. Trop Med Int Health 2006, 11(7):1003-16.
139. Kabanywanyi AM, Lengeler C, Kasim P, King’eng’ena S, Schlienger R, Mulure N, Genton B: Adherence to and acceptability of artemether-lumefantrine as first-line anti-malarial treatment: evidence from a rural community in Tanzania. Malar J 2010, 9:48.
140. Paulander J, Olsson H, Lemma H, Getachew A, San Sebastian M: Knowledge, attitudes and practice about malaria in rural Tigray, Ethiopia. Glob Health Action 2009, 2.

83
REFERENCES
141. Rahman MM, Dondorp AM, Day NPJ, Lindegardh N, Imwong M, Faiz MA, Bangali AM, Kamal ATMM, Karim J, Kaewkungwal J et al: Adherence and efficacy of supervised ver-sus non-supervised treatment with artemether/lumefantrine for the treatment of uncom-plicated Plasmodium falciparum malaria in Bangladesh: a randomised controlled trial. T Roy Soc Trop Med H 2008, 102(9):861-67.
142. Lesong Conteh, Stevens W, Wiseman V: The role of communication between clients and health care providers: implications for adherence to malaria treatment in rural Gambia. Trop Med Int Health 2007, 12 (3):382-391.
143. Nyamongo IK: Health care switching behaviour of malaria patients in a Kenyan rural community. Soc Sci Med 2002, 54(3):377-386.
144. DiMatteo MR, Haskard KB, Williams SL: Health beliefs, disease severity, and patient adherence: a meta-analysis. Med Care 2007, 45(6):521-528.
145. Pagnoni F: Malaria treatment: no place like home. Trends Parasitol 2009, 25(3):115-119.
146. RBM/WHO: The Roll Back Malaria strategy for improving access to treatment through home management of malaria. WHO/HTM/MAL/2005.1101. Geneva: Roll Back Malaria Department of the World Health Organization 2005: 54.
147. Pagnoni F, Convelbo N, Tiendrebeogo J, Cousens S, Esposito F: A community-based pro-gramme to provide prompt and adequate treatment of presumptive malaria in children. Trans R Soc Trop Med Hyg 1997, 91(5):512-517.
148. Okanurak K, Ruebush TK: Village-based diagnosis and treatment of malaria. Acta Trop 1996, 61(1996):157-167.
149. Delacollette C, Van der Stuyft P, Molima K: Using community health workers for malaria control: experience in Zaire. Bull World Health Organ 1996, 74(4):423-430.
150. Sirima SB, Konate A, Tiono AB, Convelbo N, Cousens S, Pagnoni F: Early treatment of childhood fevers with pre-packaged antimalarial drugs in the home reduces severe ma-laria morbidity in Burkina Faso. Trop Med Int Health 2003, 8(2):133-139.
151. Tiono AB, Kabore Y, Traore A, Convelbo N, Pagnoni F, Sirima SB: Implementation of Home based management of malaria in children reduces the work load for peripheral health facilities in a rural district of Burkina Faso. Malar J 2008, 7:201.
152. Elmardi KA, Malik EM, Abdelgadir T, Ali SH, Elsyed AH, Mudather MA, Elhassan AH, Adam I: Feasibility and acceptability of home-based management of malaria strategy adapted to Sudan’s conditions using artemisinin-based combination therapy and rapid diagnostic test. Malar J 2009, 8:39.
153. Mukanga D, Tibenderana JK, Kiguli J, Pariyo GW, Waiswa P, Bajunirwe F, Mutamba B, Counihan H, Ojiambo G, Kallander K: Community acceptability of use of rapid diagnostic tests for malaria by community health workers in Uganda. Malar J 2010, 9:203.
154. Heidi Hopkins H, Talisuna A, Whitty CJ, Staedke SG: Impact of homebased management of malaria on health outcomes in Africa: a systematic review of the evidence. Malar J. 2007, 6(1):134
155. D’Alessandro U, Talisuna A, Boelaert M: Editorial: Should artemisinin-based combina-tion treatment be used in the home-based management of malaria? Trop Med Int Health 2005, 10(1):1-2.
156. Charlwood D: The paradox of home management of malaria with artemisinin combina-tions. Trends Parasitol 2004, 20(9):405-406.

84
REFERENCES
157. Pagnoni F, Kengeya-Kayondo J, Ridley R, Were W, Nafo-Traore F, Namboze J, Sirima S: Artemisinin-based combination treatment in home-based management of malaria. Trop Med Int Health 2005, 10(6):621-622.
158. Lubell Y, Reyburn H, Mbakilwa H, Mwangi R, Chonya S, Whitty CJM, Mills A: The impact of response to the results of diagnostic tests for malaria: cost-benefit analysis. Brit Med J 2008, 336(7637):202-205.
159. Bisoffi Z, Gobbi F, Angheben A, Van den Ende J: The role of rapid diagnostic tests in managing malaria. PLoS Med 2009, 6(4):e1000063.
160. Hamer DH, Ndhlovu M, Zurovac D, Fox M, Yeboah-Antwi K, Chanda P, Sipilinyambe N, Simon JL, Snow RW: Improved diagnostic testing and malaria treatment practices in Zambia. JAMA 2007, 297(20):2227-2231.
161. Msellem MI, Martensson A, Rotllant G, Bhattarai A, Stromberg J, Kahigwa E, Garcia M, Petzold M, Olumese P, Ali A et al: Influence of Rapid Malaria Diagnostic Tests on Treat-ment and Health Outcome in Fever Patients, Zanzibar-A Crossover Validation Study. PLoS Medicine 2009, 6(4).
162. Reyburn H, Mbakilwa H, Mwangi R, Mwerinde M, Olomi R, Drakeley C, CJM: W: Rapid diagnostic tests compared with malaria microscopy for guiding outpatient treatment of febrile illness in Tanzania: randomised trial. BMJ 2007, 334:403-406A.
163. Bisoffi Z, Sirima BS, Angheben A, Lodesani C, Gobbi F, Tinto H Vd, J: E: Rapid malaria diagnostic tests vs. clinical management of malaria in rural Burkina Faso: safety and ef-fect on clinical decisions:A randomized trial. Trop Med Int Health 2009, 14(5):491-498.
164. Depoortere E, Salvador E.T.C, Bisoff Z, Guthman J.P: Adherence to combination of arte-mether and lumefantrine(Coartem) in Kajo Keji,Southern Sudan. Ann Trop Med Parasi-tol 2004, 98(6):635-637.
165. Aurélia S, Patricia M, Sophie S, Marie-Paule C, Richard L, J-Y LH: Self-reported data: a major tool to assess compliance with anti-malarial combination therapy among children in Senegal. Malar J 2009 8:257.
166. Omari AAA, Gamble C, P. G: Artemether-lumefantrine (six-dose regimen) for treating uncomplicated falciparum malaria (Review). The Cochrane Library 2006, (1).

Department of Public Health and Clinical Medicine Epidemiology and Global HealthUmeå University, SE-901 87 Umeå, Swedenwww.phmed.umu.se
New Series No 1497ISSN 0346-6612
ISBN 978-91-7459-418-8
Copyright © 2022 FDOKUMEN