Improved outdoor measurements for Very High Efficiency Solar Cell sub-modules
6
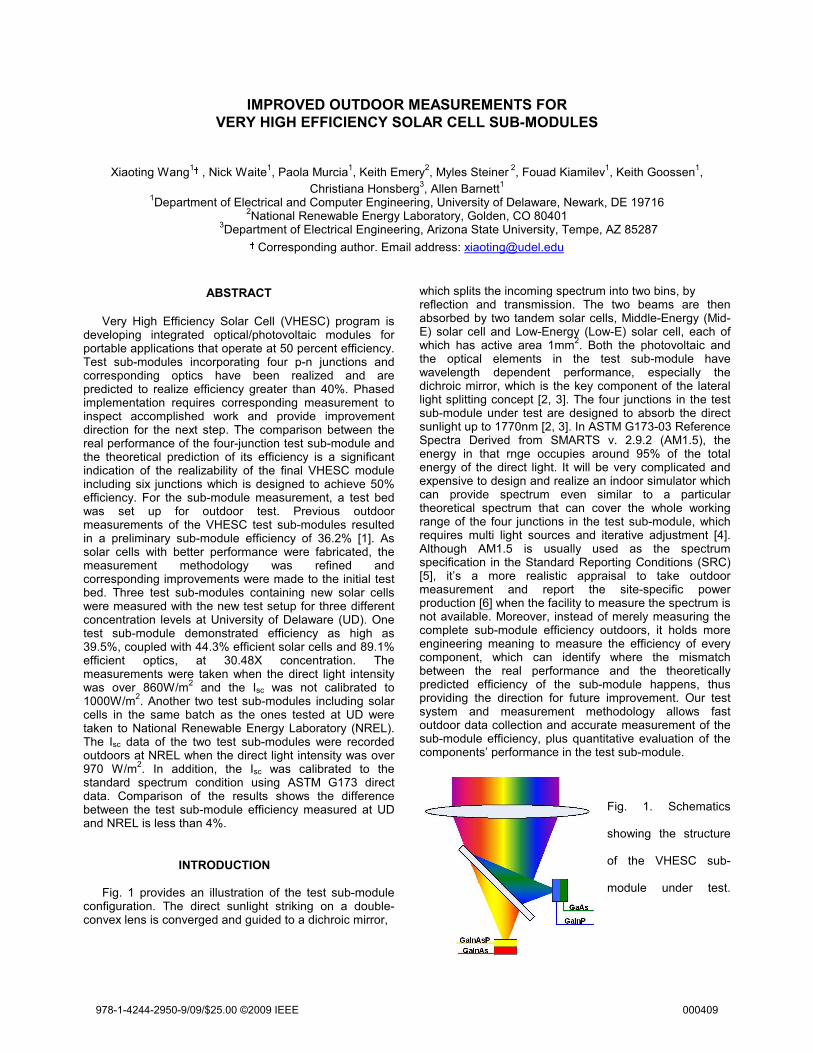
IMPROVED OUTDOOR MEASUREMENTS FOR VERY HIGH EFFICIENCY SOLAR CELL SUB-MODULES Xiaoting Wang 1 , Nick Waite 1 , Paola Murcia 1 , Keith Emery 2 , Myles Steiner 2 , Fouad Kiamilev 1 , Keith Goossen 1 , Christiana Honsberg 3 , Allen Barnett 1 1 Department of Electrical and Computer Engineering, University of Delaware, Newark, DE 19716 2 National Renewable Energy Laboratory, Golden, CO 80401 3 Department of Electrical Engineering, Arizona State University, Tempe, AZ 85287 Corresponding author. Email address: [email protected] ABSTRACT Very High Efficiency Solar Cell (VHESC) program is developing integrated optical/photovoltaic modules for portable applications that operate at 50 percent efficiency. Test sub-modules incorporating four p-n junctions and corresponding optics have been realized and are predicted to realize efficiency greater than 40%. Phased implementation requires corresponding measurement to inspect accomplished work and provide improvement direction for the next step. The comparison between the real performance of the four-junction test sub-module and the theoretical prediction of its efficiency is a significant indication of the realizability of the final VHESC module including six junctions which is designed to achieve 50% efficiency. For the sub-module measurement, a test bed was set up for outdoor test. Previous outdoor measurements of the VHESC test sub-modules resulted in a preliminary sub-module efficiency of 36.2% [1]. As solar cells with better performance were fabricated, the measurement methodology was refined and corresponding improvements were made to the initial test bed. Three test sub-modules containing new solar cells were measured with the new test setup for three different concentration levels at University of Delaware (UD). One test sub-module demonstrated efficiency as high as 39.5%, coupled with 44.3% efficient solar cells and 89.1% efficient optics, at 30.48X concentration. The measurements were taken when the direct light intensity was over 860W/m 2 and the Isc was not calibrated to 1000W/m 2 . Another two test sub-modules including solar cells in the same batch as the ones tested at UD were taken to National Renewable Energy Laboratory (NREL). The Isc data of the two test sub-modules were recorded outdoors at NREL when the direct light intensity was over 970 W/m 2 . In addition, the Isc was calibrated to the standard spectrum condition using ASTM G173 direct data. Comparison of the results shows the difference between the test sub-module efficiency measured at UD and NREL is less than 4%. INTRODUCTION Fig. 1 provides an illustration of the test sub-module configuration. The direct sunlight striking on a double- convex lens is converged and guided to a dichroic mirror, which splits the incoming spectrum into two bins, by reflection and transmission. The two beams are then absorbed by two tandem solar cells, Middle-Energy (Mid- E) solar cell and Low-Energy (Low-E) solar cell, each of which has active area 1mm 2 . Both the photovoltaic and the optical elements in the test sub-module have wavelength dependent performance, especially the dichroic mirror, which is the key component of the lateral light splitting concept [2, 3]. The four junctions in the test sub-module under test are designed to absorb the direct sunlight up to 1770nm [2, 3]. In ASTM G173-03 Reference Spectra Derived from SMARTS v. 2.9.2 (AM1.5), the energy in that rnge occupies around 95% of the total energy of the direct light. It will be very complicated and expensive to design and realize an indoor simulator which can provide spectrum even similar to a particular theoretical spectrum that can cover the whole working range of the four junctions in the test sub-module, which requires multi light sources and iterative adjustment [4]. Although AM1.5 is usually used as the spectrum specification in the Standard Reporting Conditions (SRC) [5], it’s a more realistic appraisal to take outdoor measurement and report the site-specific power production [6] when the facility to measure the spectrum is not available. Moreover, instead of merely measuring the complete sub-module efficiency outdoors, it holds more engineering meaning to measure the efficiency of every component, which can identify where the mismatch between the real performance and the theoretically predicted efficiency of the sub-module happens, thus providing the direction for future improvement. Our test system and measurement methodology allows fast outdoor data collection and accurate measurement of the sub-module efficiency, plus quantitative evaluation of the components’ performance in the test sub-module. Fig. 1. Schematics showing the structure of the VHESC sub- module under test. 978-1-4244-2950-9/09/$25.00 ©2009 IEEE 000409
-
Upload
independent -
Category
Documents
-
view
4 -
download
0
Transcript of Improved outdoor measurements for Very High Efficiency Solar Cell sub-modules
IMPROVED OUTDOOR MEASUREMENTS FOR
VERY HIGH EFFICIENCY SOLAR CELL SUB-MODULES
Xiaoting Wang1† , Nick Waite
1, Paola Murcia
1, Keith Emery
2, Myles Steiner
2, Fouad Kiamilev
1, Keith Goossen
1,
Christiana Honsberg3, Allen Barnett
1
1Department of Electrical and Computer Engineering, University of Delaware, Newark, DE 19716
2National Renewable Energy Laboratory, Golden, CO 80401
3Department of Electrical Engineering, Arizona State University, Tempe, AZ 85287 † Corresponding author. Email address: [email protected]
ABSTRACT
Very High Efficiency Solar Cell (VHESC) program is developing integrated optical/photovoltaic modules for portable applications that operate at 50 percent efficiency. Test sub-modules incorporating four p-n junctions and corresponding optics have been realized and are predicted to realize efficiency greater than 40%. Phased implementation requires corresponding measurement to inspect accomplished work and provide improvement direction for the next step. The comparison between the real performance of the four-junction test sub-module and the theoretical prediction of its efficiency is a significant indication of the realizability of the final VHESC module including six junctions which is designed to achieve 50% efficiency. For the sub-module measurement, a test bed was set up for outdoor test. Previous outdoor measurements of the VHESC test sub-modules resulted in a preliminary sub-module efficiency of 36.2% [1]. As solar cells with better performance were fabricated, the measurement methodology was refined and corresponding improvements were made to the initial test bed. Three test sub-modules containing new solar cells were measured with the new test setup for three different concentration levels at University of Delaware (UD). One test sub-module demonstrated efficiency as high as 39.5%, coupled with 44.3% efficient solar cells and 89.1% efficient optics, at 30.48X concentration. The measurements were taken when the direct light intensity was over 860W/m
2 and the Isc was not calibrated to
1000W/m2. Another two test sub-modules including solar
cells in the same batch as the ones tested at UD were taken to National Renewable Energy Laboratory (NREL). The Isc data of the two test sub-modules were recorded outdoors at NREL when the direct light intensity was over 970 W/m
2. In addition, the Isc was calibrated to the
standard spectrum condition using ASTM G173 direct data. Comparison of the results shows the difference between the test sub-module efficiency measured at UD and NREL is less than 4%.
INTRODUCTION Fig. 1 provides an illustration of the test sub-module configuration. The direct sunlight striking on a double-convex lens is converged and guided to a dichroic mirror,
which splits the incoming spectrum into two bins, by reflection and transmission. The two beams are then absorbed by two tandem solar cells, Middle-Energy (Mid-E) solar cell and Low-Energy (Low-E) solar cell, each of which has active area 1mm
2. Both the photovoltaic and
the optical elements in the test sub-module have wavelength dependent performance, especially the dichroic mirror, which is the key component of the lateral light splitting concept [2, 3]. The four junctions in the test sub-module under test are designed to absorb the direct sunlight up to 1770nm [2, 3]. In ASTM G173-03 Reference Spectra Derived from SMARTS v. 2.9.2 (AM1.5), the energy in that rnge occupies around 95% of the total energy of the direct light. It will be very complicated and expensive to design and realize an indoor simulator which can provide spectrum even similar to a particular theoretical spectrum that can cover the whole working range of the four junctions in the test sub-module, which requires multi light sources and iterative adjustment [4]. Although AM1.5 is usually used as the spectrum specification in the Standard Reporting Conditions (SRC) [5], it’s a more realistic appraisal to take outdoor measurement and report the site-specific power production [6] when the facility to measure the spectrum is not available. Moreover, instead of merely measuring the complete sub-module efficiency outdoors, it holds more engineering meaning to measure the efficiency of every component, which can identify where the mismatch between the real performance and the theoretically predicted efficiency of the sub-module happens, thus providing the direction for future improvement. Our test system and measurement methodology allows fast outdoor data collection and accurate measurement of the sub-module efficiency, plus quantitative evaluation of the components’ performance in the test sub-module.
Fig. 1. Schematics
showing the structure
of the VHESC sub-
module under test.
978-1-4244-2950-9/09/$25.00 ©2009 IEEE 000409

MEASUREMENT SYSTEM
The measurement system comprises: (1) the electrical measuring instruments, from which the data of the solar cells is read out; (2) the test bed, which provides adjustable mechanical support for the test sub-module components under test and electrical connection between the solar cells and the measuring instruments; (3) the Sun Tracker, on which the test bed is mounted such that the test sub-module is always orientated towards the sun; and (4) the Pyrheliometer, which is also mounted on the Sun Tracker and measures the irradiance of the direct sunlight.
Electrical Measuring Instruments
The output data from the solar cells, including short-circuit current (Isc), open-circuit voltage (Voc), and the I-V sweep from which the Maximum Power Point (PMPP) is determined are all read from Keithley Source Meter.
Test Bed
The test bed is designed to provide adjustable mechanical support for the test sub-module components—including the lens, the solar cells and the dichroic mirror—required by alignment, and electrical connection between the solar cells and the measuring instruments. A standard 8”X10” optical plate is used as the base of the test bed.
Lens Holder
The converging lens with an aperture on top is mounted by three posts and two right angle post clamps. The structure of the lens holder allows parallel and rotational motion for the lens in all directions while occupying small space.
Solar Cell Carrier Board and Board Holder
The electrical connection between the solar cells and the electrical measuring instruments is realized by the wire bonding and custom-designed boards. Fig. 2 shows the designed solar cell carrier board and its accompanying socket board, which together realize easy electrical connection and repeatable self-alignment.
Fig. 2. Solar cell carrier board and socket board. 1. Handle and ID # surface. 2. SIM card contacts. 3. Alignment faces. 4. Wire bond pad. 5. Solar cell. 6. Connection pins.
One solar cell is mounted with epoxy on the small end of one carrier board, which is designed as small as possible to avoid confliction with the other components in the test sub-module. The contacts of the solar cell are connected with the pad via wire bond. There are SIM card contacts on the back side of the carrier board, whose counterpart are on the socket board. When the carrier board with mounted solar cell is slid into the socket, the solar cell is electrically connected with the pins on the socket board, which can be easily connected with the measuring instruments via a cable belt. Alignment faces on both carrier board and socket board guarantee repeatable relative position between the two boards. Solar cells are mounted at slightly different positions on the different carrier boards, so only minor position adjustment is required to achieve the focus point for different samples. The position adjustment of the solar cells is realized by the 3-axis micro-positioning stages, which has 0.5 inch travel range in all three directions. The socket board is fixed on the micro-positioning stage.
Dichroic Mirror Holder
The triangular-prism-shape dichroic mirror is glued with a mirror carrier board at its two ends. The mirror carrier board is of similar shape as the solar cell carrier board, except that a concave part is designed such that the light passing through the dichroic mirror can strike on the Low-E solar cell beneath it. There are three holes on the solar cell carrier board for the three pins which pass through the mirror carrier board, so the mirror can be held on top of the Low-E solar cell steadily and it’s easy to remove. The dichroic mirror and its carrier board are shown in Fig. 3.
Fig. 3. The dichroic mirror and the mirror carrier board. The dichroic mirror and the two solar cells are positioned in the test sub-module configuration, in which the solar cells are at the focus points of the two converged beams.
The Whole Set
In the test sub-module configuration, the Mid-E and the Low-E solar cells are mounted on two solar cell carrier boards, which are slid into two socket boards, one horizontally and the other vertically screwed to two micro-positioning stages, with the dichroic mirror being glued on a mirror carrier board, which is strung together with the Low-E solar cell carrier board using three pins. The lens is held by the designed lens holder. Besides the sub-module configuration, a separate set of structure is also set on the test bed to measure the performance of the solar cell without any optics, which is required in the measurement of component efficiency in the test sub-module. The holder of the solar cell is the same as in the sub-module
978-1-4244-2950-9/09/$25.00 ©2009 IEEE 000410

configuration. Additional collimator with an aperture is put on top of the solar cell to make sure the Field of View (FOV) in the non-optics configuration is the same as in the sub-module configuration. Finally a post is screwed at the test bed base perpendicularly to indicate the light is normal to the base when no shadow of the post can be observed. Fig. 4 gives a full view of the test bed.
Fig. 4. The test bed. 1. Measurement structure for configurations including optics and photovoltaics. 2. Measurement structure for non-optics configuration. 3. Post to indicate the right orientation.
Sun Tracker
The outdoor test includes measurement of the test sub-module and its components in different configurations. In the whole process, it must be ensured that the sub-module or the individual component under test is normal to the incident direct light, or, sun tracking function should be realized. The test bed is mounted on the EKO Sun Tracker STR-22, whose motion is controlled by step motors, using the received irradiance signal from the detector.
Pyrheliometer
The converging lens is collecting direct light plus circumsolar light with a Filed of View (FOV), which is depicted more in the efficiency definition part. The power density of the incident direct light and 5º circumsolar light can be measured by the EKO Pyrheliometer MS-54, which is also mounted on the Sun Tracker.
MEASUREMENT METHODOLOGY
No standard definitions exist for the integrated optical/photovoltaic system before this paper, although tentative efficiency definitions are proposed to explore the design trade-offs in the system [7]. A set of definitions for the efficiency items of the individual components and the complete sub-module is specified, based on which a set of diagnostic testing procedure is designed. In this paper, only detailed description of the measurement methodology for the test sub-module efficiency is given.
Definition of Sub-Module Efficiency
The sub-module efficiency (ηsub-module) is defined in terms of power. It’s defined as the ratio of the output power summation of the four junctions when they are set at the Maximum Power Point (MPP) to the input power on the first component in the test sub-module, the converging
lens. The converging lens is always receiving direct light plus some circumsolar light, whose FOV is decided by the ratio of the dimension of the solar cell to the focal length of the converging lens, as shown in Fig. 5.
Fig. 5. FOV of the lens/solar-cell configuration. Fig. 5 is a brief illustration of using classic optics to decide the FOV of the configuration comprising a lens and a solar cell. The two rays displayed by the blue line and the orange line that pass through the optic center of the lens arrive at the two edges of the solar cell active area (in one dimension). All the rays passing through the optic center of the lens will not change the direction of propagation, so the angle θ can be decided by the ratio of the solar cell active area dimension a to the lens focal length f:
f
a
2)2
tan( =θ
(1) Meanwhile, parallel rays striking on the lens will arrive at the same point on the focal plane, so all the rays with the same direction as the blue lines will meet at the left edge of the solar cell active area and all the rays with the same direction as the orange lines will meet at the right edge. For every point on the first face of the lens, all the rays striking on the lens within the angle θ can arrive at the solar cell active area, while all the rays out of the angle θ will arrive beyond the active area. Thus, the FOV of the configuration shown in Fig. 5 is θ. In the sub-module configuration (Fig. 1), the converged beam is split into two sub-beams by the dichroic mirror. However, the converging angle of the two beams in air after being reflected or transmitted by the dichroic mirror will not be changed. That means the FOV will not be different for the sub-module configuration and the configuration shown in Fig. 5. All the solar cells under test have active area 1mm*1mm. For a converging lens with focal length equal to 18mm, the FOV of the test sub-module is around 3º. The power density of the incident light is measured with the Pyrheliometer mounted on the
978-1-4244-2950-9/09/$25.00 ©2009 IEEE 000411
Sun Tracker, whose FOV is 5º. This indicates an overestimate of the input, but with error less than 0.5%. The light receiving area of the test sub-module is decided by the aperture on top of the lens, a circle hole at the center of a standard C-mount which can be screwed into the lens mount. The area of the aperture can be calculated based on diameter measurement using an electronic caliper, which can provide accuracy up to 0.01 mm. For our measurements, we used three apertures: 20.51mm
2, 30.48mm
2, and 49.14mm
2. Experiment was
designed to test the accuracy of aperture area measurement. Isc of the same solar cell using the same lens but three different apertures showed values proportional to the three measured aperture areas, which was a convincing proof of the aperture area measurement accuracy. The product of the light receiving area and power density is the input power. The output power is measured using the combination of outdoor Isc collection and indoor I-V sweep based on the Isc superposition principle, which will be depicted in detail in the testing procedure part below. ηsub-module is defined as:
lensD
MPP
ulesubAI
P
⋅=∑
−modη
(2) PMPP is the output power of one single junction when it is set at MPP. ID is the power density of the direct light measured by the Pyrheliometer. Alens is the light receiving area of the lens, or, the aperture area.
Testing Procedure for Sub-Module Efficiency
Preparation before Outdoor Test
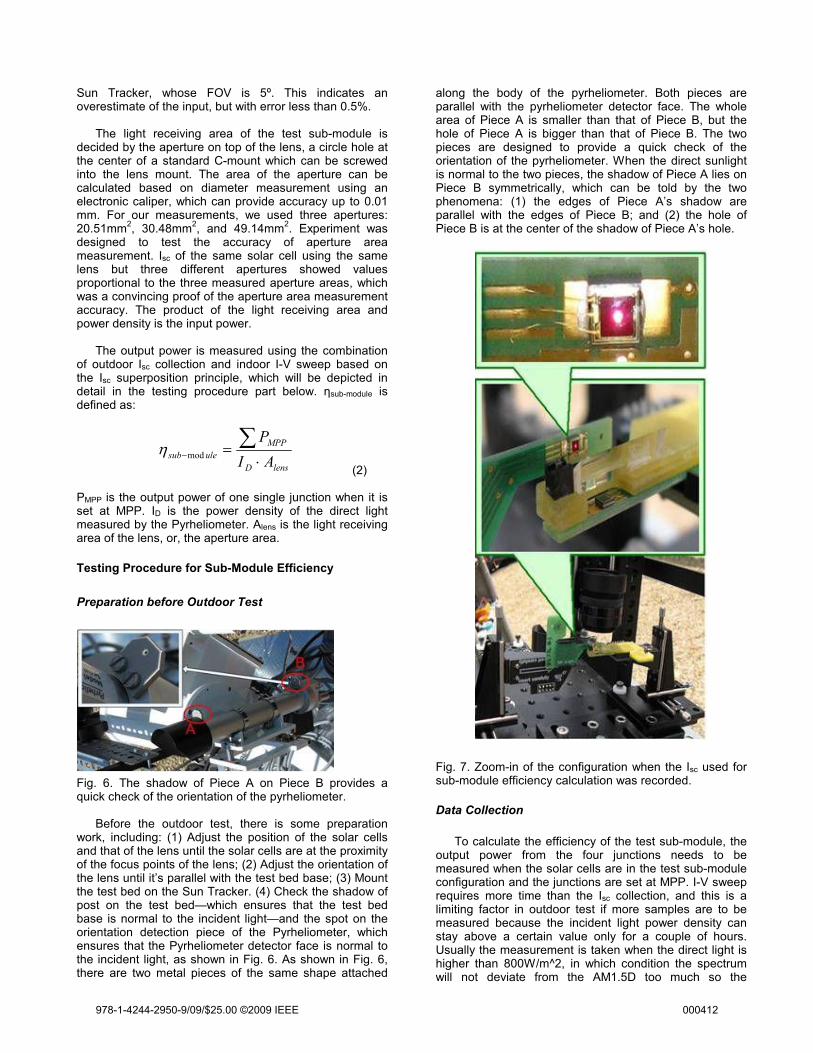
Fig. 6. The shadow of Piece A on Piece B provides a quick check of the orientation of the pyrheliometer. Before the outdoor test, there is some preparation work, including: (1) Adjust the position of the solar cells and that of the lens until the solar cells are at the proximity of the focus points of the lens; (2) Adjust the orientation of the lens until it’s parallel with the test bed base; (3) Mount the test bed on the Sun Tracker. (4) Check the shadow of post on the test bed—which ensures that the test bed base is normal to the incident light—and the spot on the orientation detection piece of the Pyrheliometer, which ensures that the Pyrheliometer detector face is normal to the incident light, as shown in Fig. 6. As shown in Fig. 6, there are two metal pieces of the same shape attached
along the body of the pyrheliometer. Both pieces are parallel with the pyrheliometer detector face. The whole area of Piece A is smaller than that of Piece B, but the hole of Piece A is bigger than that of Piece B. The two pieces are designed to provide a quick check of the orientation of the pyrheliometer. When the direct sunlight is normal to the two pieces, the shadow of Piece A lies on Piece B symmetrically, which can be told by the two phenomena: (1) the edges of Piece A’s shadow are parallel with the edges of Piece B; and (2) the hole of Piece B is at the center of the shadow of Piece A’s hole.
Fig. 7. Zoom-in of the configuration when the Isc used for sub-module efficiency calculation was recorded.
Data Collection
To calculate the efficiency of the test sub-module, the output power from the four junctions needs to be measured when the solar cells are in the test sub-module configuration and the junctions are set at MPP. I-V sweep requires more time than the Isc collection, and this is a limiting factor in outdoor test if more samples are to be measured because the incident light power density can stay above a certain value only for a couple of hours. Usually the measurement is taken when the direct light is higher than 800W/m^2, in which condition the spectrum will not deviate from the AM1.5D too much so the
978-1-4244-2950-9/09/$25.00 ©2009 IEEE 000412

measured value can be more representative. Moreover, the performance of the solar cells is temperature sensitive (especially Voc) [8], and it’s relatively time consuming and instrument demanding to realize temperature control outdoors. Based on the two reasons, inclusion of outdoor Isc collection and indoor I-V sweep is chosen to be the way to measure the PMPP of the four junctions. The Isc data was collected when the two tandem solar cells were at the focus points of the two converged beams, which could be checked by two phenomena: (1) the spot was much smaller than the solar cell, as shown in Fig. 7; and (2) the Isc achieved the maximum value in the process of the solar cell position adjustment by the micro-positioning stage. After the outdoor data collection, illumination from the indoor simulator was adjusted such that the Isc from the junction under test was equal to the Isc recorded outdoors. I-V sweep was then implemented on the junction by the Keithley Source Meter and PMPP is got from the I-V curve.
MEASUREMENT RESULT AND ANALYSIS
Measurements at UD
Three test sub-modules were measured for three different concentration levels at University of Delaware. The Isc went up linearly when the concentration number, or, the light receiving area, became bigger; the Voc also increased with higher Isc, although not linearly. However, it was found that the FF did not get obvious and steady benefit from the increased concentration; especially at 49.14X concentration, the FF decreased dramatically and led to much lower sub-module efficiency. The biggest sub-module efficiency happened at 30.48X, among the three concentration levels we tested, as shown in Fig. 8. One test sub-module demonstrated efficiency as high as 39.5% at 30.48X concentration.
Sub-module Efficiency vs. Concentration Number
37.4%
37.0%
38.8%
39.5%
39.0%
38.3%
39.1%
38.1%
38.4%
36.5%
37.0%
37.5%
38.0%
38.5%
39.0%
39.5%
40.0%
10 20 30 40 50 60Concentration Number
Sub-module Efficiency
Fig. 8. Sub-module efficiency vs. concentration number for three VHESC sub-modules under test. Fig. 9 and Fig. 10 show the I-V curves of the Mid-E solar cell and the Low-Energy Low-E solar cell in the test sub-module demonstrating the highest efficiency in the 30.48X concentration case.
I-V curve of Mid-E solar cell
-4
-3.5
-3
-2.5
-2
-1.5
-1
-0.5
0
0 0.2 0.4 0.6 0.8 1 1.2 1.4 1.6
Voltage (V)
Current (mA)
top
bottom
Fig. 9. I-V curve of Mid-E solar cell (30.48X).
I-V curve of Low-E solar cell
-4.5
-4
-3.5
-3
-2.5
-2
-1.5
-1
-0.5
0
-0.1 0 0.1 0.2 0.3 0.4 0.5 0.6 0.7
Voltage (V)Current (mA)
top
bottom
Fig. 10. I-V curve of Mid-E solar cell (30.48X).
Instead of merely providing accurate measurements of the sub-module efficiency, the test bed and the measurement methodology allow examination of the individual component’s performance. Table 1 lists the component efficiency of the test sub-module demonstrating the highest efficiency, for 30.48X concentration case.
Table 1. Efficiency table for VHESC test sub-module (30.48X) measured at UD. The measured 44.3% solar cell efficiency for 30 suns illumination matches the prediction of the solar cells’ performance. while the predicted optics efficiency is 93%, the measured result showed value approaching but still less than 90%. The dichroic mirror showed efficiency approaching 96% (97% was expected). Depositing anti-reflection coating on the bottom side of the dichroic mirror will reduce the reflective losses of the light intended for the Low-E solar cell, increasing the efficiency of the dichroic mirror by 1% (absolute value). For the converging lens, while the predicted efficiency is higher than 95%, the
978-1-4244-2950-9/09/$25.00 ©2009 IEEE 000413

measured result is only 93%. More work must be done to identify where the 2% mismatch occurs.
Measurements at NREL
The 39.5% sub-module efficiency was the result of site-specific measurement and did not involve calibration to the Isc. However, for incident beams with different spectrum distributions, the generated Isc by a solar cell would be different even the incident light intensity is the same. This means that the power production by a solar cell would be dependent on the spectrum of the incident light even the light intensity is known. National Renewable Energy Laboratory has the facility and resource for spectrum measurement. We had another two test sub-modules sent to NREL and their Isc data recorded outdoors there at 30.48X concentration level. Meanwhile, the spectrum data was measured which was used for Isc calibration. NREL has finished the Isc calibration but not the I-V sweep. Before taking the two test sub-modules to NREL, we had the Isc data measured also at UD. Assuming that the Voc and FF for the solar cells in the two test sub-modules would be the same as those for the samples in the same batch we tested at UD, we can compare the sub-module efficiency using the Isc data measured at NREL and the Isc, Voc, and FF measured at UD. Table 2 shows the comparison result for the two test sub-modules we left at NREL. ‘M2-T’ means the top junction of Mid-E solar cell labeled as #2. The mismatch between the sub-module efficiency using the un-calibrated Isc measured at UD and the un-calibrated Isc measured at NREL is less than 3%, and the mismatch between the sub-module efficiency using the un-calibrated Isc measured at UD and the calibrated Isc measured at NREL is less than 4%. The mismatch reveals the effect exerted by the spectrum to the efficiency of the optics/photovoltaic integrated system; also, the reasonable mismatch demonstrates the accuracy of the measurements facility at UD. Another difference happens in the aperture area measurement. The aperture area measurement was implemented at NREL in a different way from the way we used—we calculated the area of the circle based on the diameter measurement using the electronic caliper—and the difference between the two area measurement was about 3%. Exploration of the area measurement accuracy will be presented in later publication.
Table 2. Efficiency comparison using different Isc.
Table 2 shows the data for the two test sub-modules sent to NREL. The UD measurement to one of the two demonstrated 39.5% sub-module efficiency. Another 39.5% efficient sub-module mentioned in Table 1 is a different one and was not sent to NREL. In the comparison between the UD and NREL without calibration data, the top junction of Mid-E demonstrated higher efficiency given the outdoor spectrum at NREL, while the other three junctions all showed lower efficiency. In the comparison among all the three groups of efficiency data based on three groups of Isc, the Isc calibrated to the standard spectrum demonstrated the lowest sub-module efficiency and the biggest feature under that condition is the dramatic decrease of the contribution by the Mid-E top junction. These comparisons show that the site-specific power production does depend on the local spectrum distribution. Another interesting point is that, the influence by the spectrum difference on the total sub-module efficiency would be smaller than that on a single junction. This conclusion makes sense because for a beam with fixed power density, wherever in the spectrum you get denser photons, you must get sparser photons somewhere else; the up to 1770nm working range for the four-junction sub-module allows more options for this ‘balance’.
ACKNOWLEDGMENT
This research was, in part, funded by the U.S. Government Defense Advanced Research Projects Agency under Agreement No.: HR0011-0709-0005.
REFERENCES
[1] A. Barnett, X. Wang, N. Waite, P. Murcia et al. Initial Test Bed for Very High Efficiency Solar Cells, Proceedings 33th IEEE Photovoltaics Specialists Conference, 2008. [2] A. Barnett, D. Kirkpatrick, C. Hongsberg, D. Moore et al. Milestones Toward 50% Efficient Solar Cell Modules. [3] A. Barnett, C. Honsberg. D. Kirkpatrick, S. Kurtz et al. 50% Efficient Solar Cell Architectures and Designs, 1-4244-0016-3/06 2006 IEEE. [4] K. Emery, M. Meusel, R. Beckert, F. Dimroth, A. Bett, W. Warta, Procedure for evaluating multijunction concentrators, Proceedings 28th IEEE Photovoltaics Specialists Conference, 2000. [5] K. Emery, Measurement and Characterization of Solar Cells and Modules, Handbook of Photovoltaic Science and Engineering, 16 (2003) 701. [6] W. Durisch, J. Urban, G. Smestad, Characterization of Solar Cells and Modules Under Actual Operating Conditions, WREC 1996. [7] J. Gray, A. Haas, J. Wilcox, R. Schwartz, Efficiency of Multijunction Photovoltaic Systems, Proceedings 33th IEEE Photovoltaics Specialists Conference, 2008. [8] C. Osterwald, Translation of Device Performance Measurement to Reference Conditions, Solar Cells, 18 (1986) 269.
978-1-4244-2950-9/09/$25.00 ©2009 IEEE 000414