Modules' Interoperability - TwinERGY
153
Modules’ Interoperability <D7.1> <JUNE 2021> Ref. Ares(2021)4416449 - 07/07/2021
-
Upload
khangminh22 -
Category
Documents
-
view
0 -
download
0
Transcript of Modules' Interoperability - TwinERGY

Modules’ Interoperability <D7.1>
<JUNE 2021>
Ref. Ares(2021)4416449 - 07/07/2021

1
Deliverable
PROJECT ACRONYM GRANT AGREEMENT # PROJECT TITLE
TWINERGY 957736 TWINERGY
DELIVERABLE REFERENCE NUMBER AND TITLE
<D7.1>
<Modules’ Interoperability>
Revision: <v.1.0>
AUTHORS
Ana Isabel Martínez
García
Moisés Antón García
Konstantinos Kotsalos John Gialelis
Konstantinos Plakas
Fynn Christian
Bollhöfer
Alex Balke
Maxim Friesen
ETRA I+D ED UoP TH OWL
Ricardo Landman
Alex Papalexopoulos
Niall Byrne
David Sweeney
Luigi Sechi
WEC IES STAM
Funded by the Horizon 2020 programme of the European Union
Grant Agreement No 957736

2
DISSEMINATION LEVEL
✔ P Public
P Confidential, only for members of the consortium and the Commission Services
Version History
REVISION DATE AUTHOR ORG… DESCRIPTION
v.0.1 21.04.2021 Moisés Antón García ETRA I+D Final version of the T.o.C
v.0.2 03.05.2021 Moisés Antón García ETRA I+D Integration of chapters 3, 4 and 5
v.0.3 11.05.2021 Ana Isabel Martínez
García
ETRA I+D Integration of chapter 6 and Annexes
v0.4 25.05.2021 Konstantinos
Kotsalos
John Gialelis
ED
UoP
Contributions on the Social Network module
and the Consumer Comfort/Well-being
Module
v.0.5 31.05.2021 Fynn Christian
Bollhöfer
Axel Blake
Maxim Friesen
TH OWL Contribution to the DER module
v.0.6 31.05.2021 Alex Papalexopoulos
Ricardo Landman
Konstantinos Plakas
WEC,
UoP
Contribution to the Transactive Energy
Module

3
v.0.7 02.06.2021 Niall Byrne
David Sweeney
Ana Isabel Martínez
García
IES
ETRA I+D
Contribution to Consumer & Neighbourhood
Demand Flexibility Profiling Module
Description of NATS connection phases
v.0.8 08.06.2021 Luigi Sechi STAM Contribution to Home&Tertiary real-time
Energy Monitoring Modulle and Risk
Management and event handling module
v.0.9 22.06.2021 Alexandros Tsitsanis
Giorgos
Papadopoulos
Suite5 Revision of the preliminary version of the
document and comments
v.0.91 22.06.2021 Niall Byrne
David Sweeney
IES Revision of the preliminary version of the
document and comments
v.0.92 28.06.2021 Moisés Antón ETRA I+D Integration of modifications in the final
version from WEC, ED, STAM, ETRA, TH OWL,
UoP
v.1.0 30.06.2021 Moisés Antón ETRA I+D Final version to be summited to EC
Statement of Originality
This deliverable contains original unpublished work except where clearly
indicated otherwise. Acknowledgement of previously published material and
of the work of others has been made through appropriate citation, quotation
or both.

4
Legal Disclaimer
The information in this document is provided “as is”, and no guarantee or warranty is
given that the information is fit for any particular purpose. The above referenced
authors shall have no liability for damages of any kind including without limitation direct,
special, indirect, or consequential damages that may result from the use of these
materials subject to any liability which is mandatory due to applicable law. The sole
responsibility for the content of this publication lies with the authors. It does not
necessarily reflect the opinion of the European Union. Neither the INEA nor the
European Commission is responsible for any use that may be made of the information
contained therein.
© 2021 by TwinERGY Consortium

5
Executive summary
This present document is D7.1 “Module’s Interoperability” of the TwinERGY project,
funded by the European Commission’s Innovation and Networks Executive Agency
(CINEA) under its Horizon 2020 Research and Innovation programme (H2020). The main
objective of this deliverable is to become the ground-floor base for the development of
Work Package 7 – Development of TwinERGY system Modules. This document intends
to design the initial specifications of the different modules to be developed as well as to
assure the interoperability between them. Therefore, the deliverable focuses on the
different functionalities that each participant in the project has overviewed for the
modules developed in the context of the TwinERGY project. These nine modules will
work complementary with the aim of increasing consumer empowerment as a major
challenge in active energy markets as well as to reduce bill, tacking at the same time
energy poverty. To address this challenges, TwinERGY project will develop a series of
modules based on low-cost, well-being and security principles. These challenges will
translate into different functionalities that the modules foresee to provide to the
TwinERGY ecosystem. These different functionalities will be compiled in each module’s
respective section.
In addition, this deliverable explains the relations that participants have foreseen as a
mean to identify the interconnection among the 9 modules developed in the project as
well as with the rest of the rest of the components of the TwinERGY solution. The
modules will extract information from data collection services (raw data supported by
the Core Data Management Platform (CDMP)), the Digital Twinning Platform (through
the iSCAN Platform) but also from derivative data coming from other modules through
the TwinERGY Interoperable Platform.
Furthermore, this deliverable reflects the configuration of the Interoperability platform
from which the modules would be able to communicate data with each other once their
development reaches an advanced status. This platform of communication will allow all
the modules to receive and send messages about their calculations and their statuses
under a real-time basis. For that purpose, a NATS system is implemented. This system
will allow a scalable, secure, heterogeneous, concurrent, and flexible platform that will
be reflected in a web application that will support the smooth communication of the
modules in a user-friendly way.

6
Index
1. Introduction ................................................................................................................... 12
1.1. Scope of the document ......................................................................................... 12
1.2. Structure of the deliverable .................................................................................. 13
1.3. Abbreviation List .................................................................................................... 13
2. Objectives....................................................................................................................... 16
3. TwinERGY Modules ....................................................................................................... 19
3.1 Consumer Comfort / Well-being Module .................................................................. 21
3.2 Consumer demand flexibility profiling Module ....................................................... 22
3.3 Neighbourhood demand flexibility profiling Module .............................................. 26
3.4 Home & Tertiary real-time Energy Monitoring Module ........................................... 26
3.5 DER management module ......................................................................................... 28
3.6 Risk Management and event handling Module ....................................................... 29
3.7 TwinEV Module ........................................................................................................... 30
3.8 Social Network Module .............................................................................................. 32
3.9 Transactive Energy Module ........................................................................................ 34
4. Inputs ............................................................................................................................. 39
4.1 Functionalities ............................................................................................................. 39
4.2 Iteration with other modules ..................................................................................... 41
5. Specifications and functionalities .................................................................................... 44
5.1 Consumer Comfort / Well-being Module .................................................................. 44
5.1.1 Overview ............................................................................................................... 44
5.1.2 Detailed functionalities ........................................................................................ 45
5.1.3 Interaction with other modules .......................................................................... 50
5.2 Consumer demand flexibility profiling Module ....................................................... 50
5.2.1 Overview ............................................................................................................... 50
5.2.2 Detailed functionalities ........................................................................................ 51
7
5.2.3 Iteration with other modules .............................................................................. 55
5.3 Neighbourhood demand flexibility profiling Module .............................................. 57
5.3.1 Overview ............................................................................................................... 57
5.3.2 Detailed functionalities ........................................................................................ 57
5.3.3 Iteration with other modules .............................................................................. 59
5.4 Home & Tertiary real-time Energy monitoring ......................................................... 60
5.4.1 Overview ............................................................................................................... 60
5.4.2 Detailed functionalities ........................................................................................ 61
5.4.3 Iteration with other modules .............................................................................. 67
5.5 DER management Module ......................................................................................... 68
5.5.1 Overview ............................................................................................................... 68
5.5.2 Detailed functionalities ........................................................................................ 68
5.5.3 Iteration with other modules .............................................................................. 74
5.6 Risk Management and event handling Module ....................................................... 75
5.6.1 Overview ............................................................................................................... 75
5.6.2 Detailed functionalities ........................................................................................ 76
5.6.3 Iteration with other modules .............................................................................. 77
5.7 TwinEV Module ........................................................................................................... 78
5.7.1 Overview ............................................................................................................... 78
5.7.2 Detailed functionalities ........................................................................................ 79
5.7.3 Iteration with other modules .............................................................................. 85
5.8 Social Network Module .............................................................................................. 86
5.8.1 Overview ............................................................................................................... 86
5.8.2 Detailed functionalities ........................................................................................ 87
5.8.3 Iteration with other modules .............................................................................. 93
5.9 Transactive Energy Module ........................................................................................ 94
5.9.1 Overview ............................................................................................................... 94
5.9.2 Detailed functionalities ........................................................................................ 95
5.9.3 Iteration with other modules ............................................................................102
6. TwinERGY module’s interoperable platform ................................................................105
8
6.1 Introduction...............................................................................................................105
6.2 Requirements and needs .........................................................................................106
6.3 Examined standards .................................................................................................106
6.4 Final implementation ...............................................................................................111
6.5 Testing the platform .................................................................................................117
7. Conclusions .....................................................................................................................121
References...........................................................................................................................123
Annex 1. Functionalities description .................................................................................126
Annex 2. Modules’ interoperability ...................................................................................132
Annex 3. Definition of common messages interchanged. ..............................................134
Annex 4. Definition of messages related to modules .....................................................137
A4.1. Consumer Comfort/Well-being Module ..............................................................137
A4.2. Consumer demand flexibility profiling Module ..................................................138
A4.3. Neighbourhood demand flexibility profiling Module .........................................138
A4.4. Home & Tertiary real-time Energy monitoring ...................................................138
A4.5. DER management Module ....................................................................................140
A4.6. Risk Management and event handling Module ..................................................142
A4.7. TwinEV Module ......................................................................................................142
A4.8. Social Network Module .........................................................................................145
A4.9. Transactive Energy Module ..................................................................................149

9
List of Figures
Figure 1: Interconnection between different WP in TwinERGY ......................................... 17
Figure 2: TwinERGY Interoperable Architecture ................................................................. 21
Figure 3: Typical residential demand profile compared to solar PV generation [14]. .... 23
Figure 4: Residential demand profile compared to solar PV generation following the
implementation of battery storage and demand response actions [14]. ........................ 25
Figure 5: 7-layer architecture ............................................................................................... 36
Figure 6: Functionalities sheet at the template .................................................................. 40
Figure 7: Input data sheet from template .......................................................................... 40
Figure 8: Output data sheet from template ....................................................................... 41
Figure 9: Data classes sheet from template ....................................................................... 41
Figure 10: Modules' interoperability sheet from the template......................................... 42
Figure 11: Login and access screenshot for the Consumer/Well-being module ............. 47
Figure 12: Screenshot for the configuration and creation of an account ........................ 47
Figure 13: Screenshot for the configuration of an account for the Consumer/wellbeing
module .................................................................................................................................. 48
Figure 14: Screenshot for the occupant's last comfort level value ................................... 49
Figure 15: Screenshot for the occupant's activity level ..................................................... 49
Figure 16: Screenshot for the occupant's indoor environmental factors ........................ 49
Figure 17: Mock-Up of a potential log-in page for consumer demand flexibility profiling
module. ................................................................................................................................. 52
Figure 18: Potential dashboard interface design strategy for Consumer demand
flexibility profiling. ................................................................................................................ 54
Figure 19: Nodal diagram of the neighbourhood. ............................................................. 58
Figure 20: Block Diagram of Neighbourhood ..................................................................... 58
Figure 21: Log in the Home/Tertiary EMS module ............................................................. 62
Figure 22: Registration in the Home/Tertiary EMS module .............................................. 62
Figure 23: Energy monitoring graphs ................................................................................. 64
Figure 24: Speedometer display for heated surfaces ........................................................ 64
Figure 25: Energy forecasting .............................................................................................. 65
Figure 26: Voltage deviation detection at Node 1. ............................................................. 70
Figure 27: Voltage deviation detection at Node 2. ............................................................. 71
Figure 28: Load prediction ................................................................................................... 71
Figure 29: RES production prediction ................................................................................. 72

10
Figure 30: Battery storage predictive control power curve. .............................................. 73
Figure 31: Dynamic signal for demand response .............................................................. 74
Figure 32: Mock-up for the TwinEV login ............................................................................ 80
Figure 33: Mock-up for the search of stations ................................................................... 81
Figure 34: Mock-ups for the booking section ..................................................................... 82
Figure 35: Mock-ups for the Charging Session information ............................................. 83
Figure 36: Log-in and Registration screens ........................................................................ 89
Figure 37: Profile’s tabs ........................................................................................................ 90
Figure 38: Energy Dashboard Screens (Consumption, Savings) ....................................... 90
Figure 39: Energy Details screen (Overview tab: daily, weekly, monthly) ........................ 91
Figure 40: Energy Details screen (Devices tab) .................................................................. 92
Figure 41: Inter-connected Local Energy Markets ............................................................. 97
Figure 42: Peer 2 Peer infrastructure .................................................................................. 98
Figure 43: Pooled infra structure ........................................................................................ 98
Figure 44: Building VPP Demand Resource Portfolio Creation for Market Participation
..............................................................................................................................................101
Figure 45: Relationship among SAREF classes .................................................................107
Figure 46: OpenADR 2.0 schema .......................................................................................108
Figure 47: Example of a message related to inform a new vendor................................109
Figure 48: Example of messages sending in NATS ..........................................................110
Figure 49. Dashboard view ................................................................................................114
Figure 50. Connections view ..............................................................................................115
Figure 51. Subscriptions view ............................................................................................115
Figure 52. Message’s view ..................................................................................................116
Figure 53. Window to select one existing subject ............................................................116
Figure 54. Window to send messages ..............................................................................116

11
List of Tables
Table 1. Abbreviation list ...................................................................................................... 13
Table 2: Modules' list ............................................................................................................ 19
Table 3: Interconnection between the modules ................................................................ 42
Table 4: Input data required by Consumer Comfort/Well-being Module ........................ 45
Table 5: Data accrued from other modules at Comfort/Well-being module .................. 50
Table 6: Requirements H&T EMS......................................................................................... 66
Table 7: Requirement DER module ..................................................................................... 69
Table 8: Input requirement for the Risk Management Module ........................................ 76
Table 9: Requirements TwinEV ............................................................................................ 84
Table 10: Input requirement for Social Network Module ................................................. 87
Table 11: Input requirement for Transactive Energy Module ........................................... 96
Table 12. Definition of messages for interoperability platform .....................................112
Table 13: Definition of test cases ......................................................................................117
Table 14: Test 1 of connection to NATS ............................................................................118
Table 15: Test 2 of connection to NATS ............................................................................119
Table 16: Test 3 of connection to NATS ............................................................................120
Table 17: Functionalities list from modules .....................................................................126
Table 18: Modules' interoperability table. ........................................................................132
Table 19: Common messages interchanged ....................................................................134
Table 20: List of messages in Consumer Comfort/Well-being module ..........................137
Table 21: List of messages in Home & Tertiary real-time Energy monitoring ...............138
Table 22: List of messages in DER management Module ...............................................141
Table 23: List of messages in Risk Management and event handling module ..............142
Table 24: List of messages in TwinEV module ..................................................................143
Table 25: List of messages in Social Networking module ...............................................147
Table 26: List of messages in Transactive Energy Module ..............................................149

12
1. Introduction
1.1. Scope of the document
Within WP7 “Development of TwinERGY system modules”, the project expects to deliver
nine different modules that aim at providing consumer with several services that are
based on data analysis. Under the context of T7.1 “Modules’ specifications and system
interoperability”, the different modules’ developers have been asked to design the
specifications of their modules based on the different data they are able to extract from
not only the energy infrastructure and the distributed resources in the network, but also
from the rest of the modules available developed in TwinERGY.
All the developments from WP7 would enable consumers to have access to different
services, from consumer comfort and well-being information to event risk management
in which consumers would be helped to minimize the risk associated to the system
following a consumer-oriented perspective. The list of services provided by each module
is quite diverse, and the modules would support a wide range of functionalities based
on a consumer perspective. Furthermore, some modules would perform the energy
monitoring on a real-time basis, from which demand flexibility profiling schemas could
also be shown to consumers, at a consumer and at a neighbourhood levels accordingly.
The grid status, and the predictions associated to its management would also focus on
one of the modules. A transactive energy platform is also going to be developed in the
project, and this module would reflect DLT/blockchain technologies. An EV platform is
also being considered, which will enable EV drivers to search for charging points, but
also to optimize the charging process of their EV, with benefits not only to the driver, but
also for the grid in terms of energy management. Lastly, a web-based platform in the
form of a social network is expected to be delivered. This module will encourage social
engagement among TwinERGY system Users and enhance this engagement by adopting
and applying gamification capabilities.
This deliverable also has a goal set, which is to reinforce the communication among the
different modules. This fact is going to be performed through the elaboration of an
intercommunication platform among them. To that purpose, the “TwinERGY
Interoperable Platform” is introduced in order to help in the definition of the
interconnection between the different modules as it will be reflected in the different
chapters on this document. The platform would be used for WP7 modules as a mean of
communication where all the modules can receive and send messages about their
calculations, status and real-time environment, considering the differences in the

13
language used. In order to achieve this goal, this deliverable will give hints of the
technology to be used in the platform, as well as the explanation of the protocol to be
followed in the future implementation, and its future validation once the modules are
fully developed.
1.2. Structure of the deliverable
This deliverable is structured starting from a defined executive summary of the
document. The introduction (Chapter 1) would give the opportunity to the reader to
understand the context of the document in this task. The following chapter (Chapter 2)
is expected to identify the objectives of the deliverable regarding the project and the
interconnection with other Work Packages (WP) and their associated tasks. A brief
introduction to the different modules is done (Chapter 3) where they are contextualized
under the scope of TwinERGY objectives. Thereafter, the methodology followed to
gather the different functionalities and interconnections between modules is explained
in the following section (Chapter 4). Based on the methodology, the different partners
will provide a detailed explanation of the modules’ functionalities and their interaction
(Chapter 5). The last chapter before the conclusions (Chapter 6) lays the foundations
regarding the interoperability of the different modules by the introduction of an
intercommunication platform. This section will describe the rationale behind the
definition of this platform as well as the implementation and the different phases that
will be set in order to launch this platform.
1.3. Abbreviation List
Table 1. Abbreviation list
Acronym Full Name
BTM Behind the Meter
CDT Consumer Digital Twin
CDMP Core Data Management Platform
CEP Clean Energy Paclage
DER Distributed Energy Resources
DLT Distributed Ledger Technologies

14
DNO Distributor Network Operator
DR Demand Response
DR Demand Response
DSO Distributed System Operator
DSO Distributed System Operator
DT Digital Twin
EPES Electrical Power and Energy System
ESCO Energy Services Companies
EU European Union
EV Electrical Vehicles
GHG Greenhouse Gas
GUI Graphical User Interface
H2020 Horizon 2020
HEMS Home Energy Management System
HVAC Heating Ventilation Air Conditioning
ICE Internal Combustion Engine
IoT Internet of Things
LEC Local Energy Communities
OSI Open Systems Interconnection
P2P Peer-to-Peer
RES Renewable Energy Sources
RES Renewable Energy Source
SAREF Smart Applications REFerence ontology
SAREF4BLDG SAREF for Buildings
SAREF4ENER SAREF for Energy

15
TEM Transactive Energy Module
TES Transactive Energy System
TLS Transport Layer Security
TRL Technology Readiness Level
TSL Transport Layer Security
TSO Transmission System Operator
UC Use Case
VPP Virtual Power Plants
WP Work Package
ΤMV Thermal Mean Vote

16
2. Objectives
WP7 “Development of TwinERGY system Modules” is reflected on the Innovation Lab
Phase within the TwinERGY project. Within this phase, partners are expected to deliver
their prototypes so that they can be tested and scaled. For this purpose, as a first step,
a prototype phase is proposed. The sets of data and technologies tools proposed in a
previous phase (Design Thinking Phase from WP4: Methodological Framework and
Architecture Design and WP6: Development of Digital Twin Platform & System
Dynamics) will allow for the exploration of the ideas that would be used to validate, in a
cost-effective manner these objectives. For this purpose, in WP7, partners will deploy
the solution in 8 different tasks [1]:
• T7.2: Consumer Comfort/Well-being Module
• T7.3: Consumer and Neighbourhood demand flexibility profiling Module
• T7.4 Home & tertiary real-time Energy Monitoring Module
• T7.5 DER Management Module
• T7.6 TwinEV Module
• T7.7 Transactive Energy Module
• T7.8 Social Network Module
• T7.9 Risk Management and event handling Module
As a continuation, a deploying phase is being proposed. Through this step, TwinERGY
will prove the effectiveness of the technical and non-technical solutions from where the
new created solutions can be deployed. WP8: TwinERGY system integration will make
feasible this target. Finally, the Innovation Lab phase concludes with the validation, in
which the residents test the final solution. It is worth mentioning that the Innovation Lab
phase (WP7 & WP8) is going to receive inputs from the Ecosystem Analysis Phase, from
which the foundations of the TwinERGY project will be settled down.
On a last step, users would test the developed prototype solution to validate it on the
Scale Phase (WP9: Pilots). Throughout this phase, the different pilots based on different
countries will allow the study of a solution replicability though the different activities
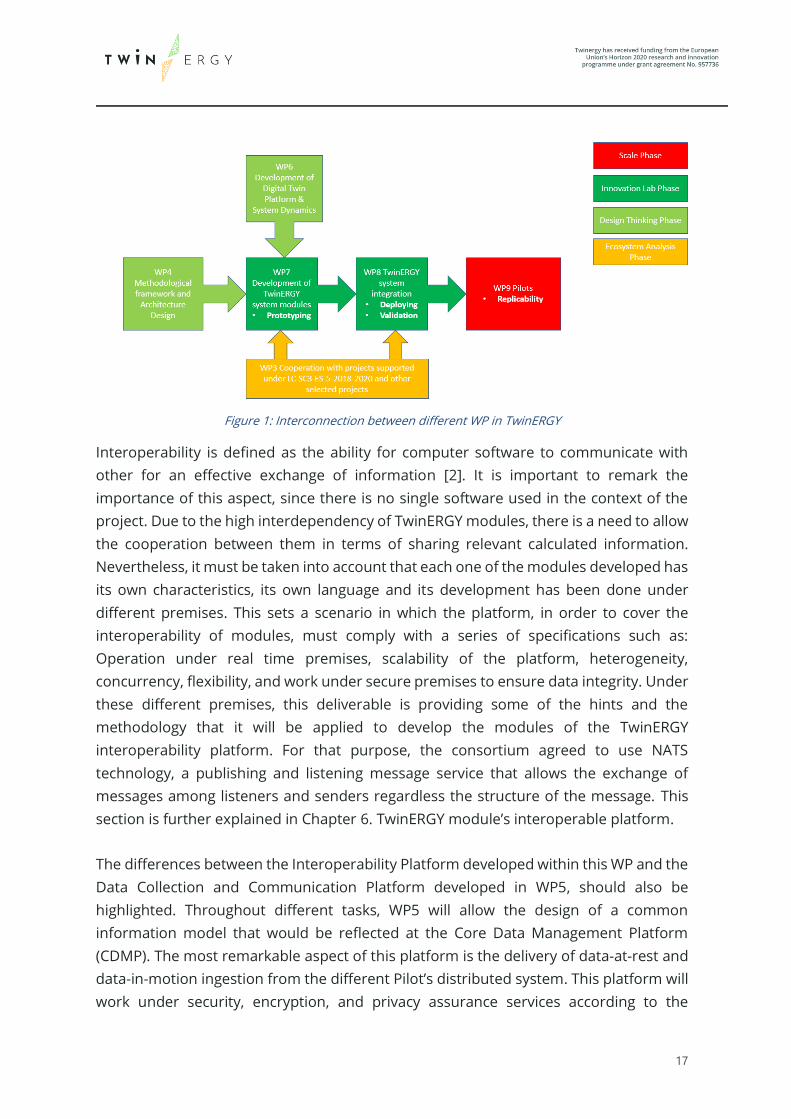
performed in the pilots thanks to the Design and Innovation Lab phases. In Figure 1 it
can be seen the interconnection between the different WPs and the different phases
within the TwinERGY project that would affect WP7 activities.
17
Figure 1: Interconnection between different WP in TwinERGY
Interoperability is defined as the ability for computer software to communicate with
other for an effective exchange of information [2]. It is important to remark the
importance of this aspect, since there is no single software used in the context of the
project. Due to the high interdependency of TwinERGY modules, there is a need to allow
the cooperation between them in terms of sharing relevant calculated information.
Nevertheless, it must be taken into account that each one of the modules developed has
its own characteristics, its own language and its development has been done under
different premises. This sets a scenario in which the platform, in order to cover the
interoperability of modules, must comply with a series of specifications such as:
Operation under real time premises, scalability of the platform, heterogeneity,
concurrency, flexibility, and work under secure premises to ensure data integrity. Under
these different premises, this deliverable is providing some of the hints and the
methodology that it will be applied to develop the modules of the TwinERGY
interoperability platform. For that purpose, the consortium agreed to use NATS
technology, a publishing and listening message service that allows the exchange of
messages among listeners and senders regardless the structure of the message. This
section is further explained in Chapter 6. TwinERGY module’s interoperable platform.
The differences between the Interoperability Platform developed within this WP and the
Data Collection and Communication Platform developed in WP5, should also be
highlighted. Throughout different tasks, WP5 will allow the design of a common
information model that would be reflected at the Core Data Management Platform
(CDMP). The most remarkable aspect of this platform is the delivery of data-at-rest and
data-in-motion ingestion from the different Pilot’s distributed system. This platform will
work under security, encryption, and privacy assurance services according to the
18
requirements elicited for the energy domain. In addition, CDMP will feed both the
different TwinERGY modules (WP7: Development of TwinERGY system modules) and
TwinERGY Digital Twins (WP6: Development of Digital Twin Platform & System Dynamics)
with raw data from the field and processes. Nevertheless, both WPs have successfully
addressed the crossover with WP5, setting different platforms, in order to not interfere
with its purposes. WP7 is going to develop the interoperability platform to cover the
message exchanging of derivative data between modules. In this way, a platform to
exchange derivative data can be applied to the modules, differentiating it from CDMP
that will be exclusively used to exchange raw data. Accordingly, WP6 would also
implement its own message platform exchange in the Digital Twins. For that purpose,
iSCAN platform [3] as the backend of the Digital Twins as the data exchange platform
from the derivative data resulting from the analytics between the Digital Twins and the
rest of applications.

19
3. TwinERGY Modules
TwinERGY is developing nine different modules that work complementary with the aim
of increasing consumer empowerment as a major challenge in active energy markets,
as well as to reduce energy bills and tackle energy poverty, maintaining low-cost, well-
being and security both in terms of privacy and personal habits. The solution will be
based on a set of technological solutions that would rely on interoperable specifications.
These modules are being developed in the different tasks associated to WP7:
“Development of TwinERGY system modules”. These modules are listed on Table 2 and
are expected to provide consumers with different services which will be based on the
data analysis from their close environment. This section is intended to provide a general
overview of the different modules based on the needs they are addressing to the actual
energy schema and the needs they cover on the different consumers.
Table 2: Modules' list
Module
Identifier Module
Responsible
partner
M1 Consumer Comfort/Well-being UoP
M2 Consumer Demand Flexibility Profiling IES
M3 Neighbourhood Demand Flexibility Profiling IES
M4 Home & Tertiary real-time Energy
Monitoring STAM
M5 DER management TH OWL
M6 Risk Management & event handling STAM
M7 TwinEV ETRA
M8 Social Network ED
M9 Transactive Energy WEC
These different modules are expected to enable an energy ecosystem to deliver real
added value services to the consumers and retailers and Local Energy Communities
(LEC). According to the proposal, there are a set of actions that are expected to be seen

20
not only in the modules, but in the context of the TwinERGY solution focused on the
consumer:
• Increase of awareness and knowledge about consumption partners, energy
behaviours, generation and demand forecasts, and demand/storage flexibility
capacity.
• Increase of local intelligence based on Digital-Twin consumer-centric Energy
Management and Control Decision Support mechanisms to optimize demand
response.
• Promote self-consumption and RES integration by leveraging local storage
capacity.
• Achieve the best energy deal for consumers through a series of open
infrastructures for publishing flexibility sources establishing contracts for
flexibility utilization and market participation.
On the other hand, a set of actions is also being presented for retailers and Local Energy
Communities:
• Forecast Demand Response potential and demand flexibility of prosumers in
short and very short term.
• Segment, classify, cluster and aggregate demand and storage [4] assets for the
formulation of VPPs.
• Monitor the evolution of Demand Response events and signals to revise pre-
defined strategies.
• Gain access to a variety of DER assets and a Transactive Energy Marketplace
• Negotiate with DER in terms of frequency, duration, and capacity.
• To ensure DR settlement and prosumer remuneration by Distributed Ledger
Technologies (DLT).
The different modules are going to be integrated with the rest of the components in the
TwinERGY solution. As previously explained, the different 9 modules deployed, will
extract information not only from data collection devices (raw data), but they will also
collect data from the Digital Twinning Platform (though the iSCAN Platform), but also
some derivative data from other modules through the TwinERGY Interoperable Platform
(Based on NATS 2.0 Technology) that is going to be explained and developed through
this document, specifically in Chapter 6. TwinERGY module’s interoperable platform.
Figure 2 which is shown down below, gives an overview of how the different tools are
being interconnected.

21
Figure 2: TwinERGY Interoperable Architecture
Although it will be further studied when all the modules are at a further developing
phase, it is intended that with a specific common user profile, to access to the different
modules of the TwinERGY solution. The aim is to avoid having several register
procedures for each module for those users that would be using several of the
developed modules.
3.1 Consumer Comfort / Well-being Module
Improved accommodation satisfaction, productivity and well-being can be achieved by
securing a thermally comfortable indoor environment. According to various studies,
38% of building occupants are satisfied with the thermal environment. Moreover,
perceived well-being as well as productivity are reduced when thermal conditions
deviate from the desired ones [4], [5]. Continuous predictions of occupants’ thermal
comfort level along with indoor environment conditions and their real time feedback on
thermal preference in order to assess their thermal tolerance is imperative, since major
savings in terms of heating, ventilation, and air conditioning (HVAC) operation
optimization could yield [6], [7].
The most popular models to estimate occupants’ thermal comfort level is the thermal
mean vote (ΤMV) and the adaptive model [8], [9] which, does not consider occupants’
physiological factors. Therefore, a personalized approach that infers (or predicts, as it is
encountered in relevant literature) individuals’ thermal comfort level, instead of the
average response of a large population shall be followed. Personal comfort models have
a much higher inference (predicting) power since personal factors are considered. These
models encounter environmental parameters (air temperature, air humidity),
occupant’s physiological parameters (skin temperature, heart rate), as well as activity

22
and feedback behavior [10]. Occupants’ physiological parameters such as skin
temperature, heart rate, and motion shall be measured by using wrist wearable sensors
that are capable of aggregating vital signals without relying on stationary infrastructure.
Moreover, indoor environmental parameters such as air temperature and humidity
along with clothing insulation parameters will be considered as well. Therefore, the
personal comfort level shall be inferred using all the above aggregated physiological,
environmental and activity data which eventually will be incorporated into the consumer
digital twin thus, creating a human-in-the-loop system. In addition to the above, real
time feedback regarding thermal preference, via stationary infrastructure, shall be
available too, leading to assessing occupant’s thermal tolerance limits on the scale
provided by ASHRAE 55 standard [11]. Capturing by an autonomous single point wrist
wearable multisensory device in real time the transitions of skin temperature, heart rate
and activities behaviour, such as resting, walking, cooking is a challenge since, the
accuracies of wearable sensors might cause uncertainties to thermal comfort inference.
In a nutshell, the objective of this module is to infer as unobtrusively possible the
occupants’ personal thermal comfort level on the scale provided by ASHRAE 55 standard
utilizing physiological and activity data collected by wearable sensors and indoor
environmental data. Compared to other technologies, such non-intrusive approaches
do not disturb occupants and enjoy high acceptance rate by them. Eventually, the
thermal comfort level shall be used for advertisement by the consumer Digital Twin
towards optimizing the use of domestic conditioning systems, but it can also be applied
to general mechanical systems in buildings. The envisaged methodology framework to
be followed adheres to a model specifically developed for occupants accounting the
great variation in personal factors.
Consumer Comfort/Well-being is a module that it is going to be developed by UOP. It is
intended to achieve a Technology Readiness Level (TRL) of 7 at the end of the project, in
which the tool would be expected to have a person-centric use as well as cooperative
approach within the context of the TwinERGY project.
3.2 Consumer demand flexibility profiling Module
In an attempt to reduce greenhouse gas (GHG) emissions in the built environment, the
EU has mandated the uptake of renewable energy systems (RES) within the bloc,
mandating member states to a RES utilization target of 30% by 2030 [12]. This transition
from traditional electricity generation systems, namely high emitting power plants, to
the deployment of both large scale and decentralized/distributed wind and solar
generation facilities is driving unprecedented change in power grid infrastructure and

23
systems [13]. This move to utilize a greater proportion of RES generation, while being a
positive step in terms of GHG reduction, is challenging the status quo with respect to
how Transmission System Operators (TSOs) and Distribution System Operators (DSOs)
can balance electricity demand and supply, which currently utilizes supply side
management techniques, such as imports, peaks and flexible generators and pumped
hydro storage, to name a few.
In addition to the move from a “business as usual” distribution model, the increased use
of RES electricity, particularly that provided through solar PV, creates some technical
issues in the distribution of electricity on the grid. The level of solar PV generation
achieved throughout the day is dependent on the weather conditions and the availability
of sunlight to create electricity. As such, the amount of electricity generated is
dependent on the weather conditions, which are generally quite variable. Furthermore,
the generation curve associated with solar PV is unlikely to correspond to the electricity
demand within a building or community. From a residential building perspective, this
generally arises since the period of generation corresponds to the time when the house
is unoccupied, while the maximum demand corresponds to lowest generation. In the
event that there is no form of energy storage, which is a typical scenario for many
buildings within the EU, it is likely that the PV system is not being utilized to its full
potential, resulting in the exportation or loss of a large proportion of generated solar
energy while maintaining a reliance on the grid supply. Figure 3 illustrates an example
of this for a residential building in the United States where there is poor balancing of the
supply and demand, resulting in the sub-optimal utilization of the solar PV generation,
which is indicated by the yellow line on the chart.
Figure 3: Typical residential demand profile compared to solar PV generation [14].
In order to address these challenges, the concept of demand response (DR) and
flexibility has begun to gain traction as a viable alternative for balancing the supply and

24
demand of electricity. DR can be described as the adjustment of power consumption of
an electric utility customer to better match the demand for power with the available
supply and is being seen as a primary enabling concept for the practical uptake of RES,
particularly solar PV in non-commercial and non-industrial buildings. Since DR can
facilitate the integration of renewable energy sources, marked by intermittency, it is
widely believed the DR will reduce the carbon-intensity and cost of power systems,
however, DR is yet to realize its full potential owing primarily to market and regulatory
barriers, as well as a lack of roll out of some technological solutions, such as battery
storage, at sufficient scale. Currently, demand response is being used almost exclusively
in energy intensive industries, such as metal, paper and cement production where load
shifting is a feasible strategy for energy management. Although multiple trials have
demonstrated that DR flexibility works, and technology rollouts progress at a reasonable
pace with the Smart Home market in the EU, the gap with the respective US market size
volumes persists and the residential DR market has been slow to gain traction [1].
Nevertheless, the ongoing transition from the traditional, centralized energy delivery
mechanism employed throughout the EU to one comprising decentralized community
micro-grids that are supported by the utilities is accelerating the adoption of community
micro-grids, virtual power plants and DR flexibility as an alternative distribution model
within the EU.
Implementing DR actions is dependent on the identification and leveraging of flexibility
within the system. Flexibility refers to those loads within buildings or community grids
that can be shifted or implemented at alternative times where it might be more
beneficial for balancing the supply and demand. An example of this would be the use of
an EV charging station at a time corresponding to maximum PV generation. By
identifying flexibility and implementing demand response actions, coupled with the
installation of energy storage technologies, electricity demand of a building can be
balanced against the generation profile of solar PV electricity, leading to the optimal
usage of PV electricity on a daily basis. An example of such a strategy implemented is a
residential building is presented in Figure 4.
25
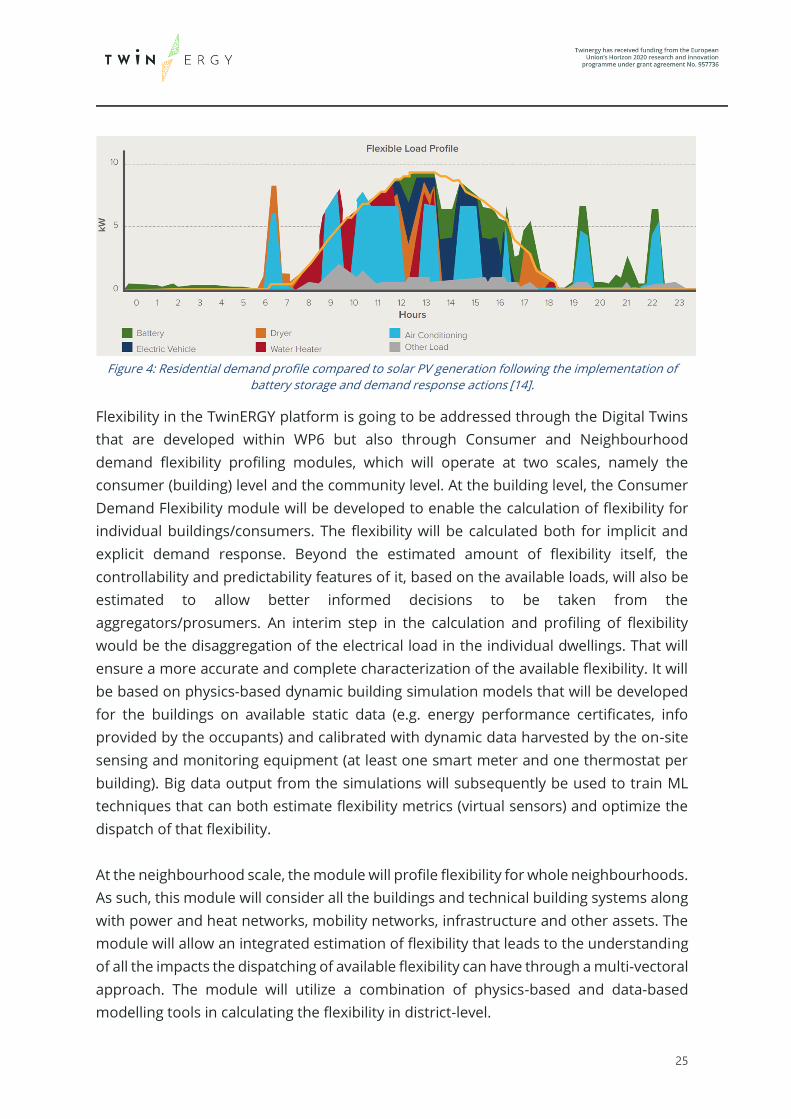
Figure 4: Residential demand profile compared to solar PV generation following the implementation of
battery storage and demand response actions [14].
Flexibility in the TwinERGY platform is going to be addressed through the Digital Twins
that are developed within WP6 but also through Consumer and Neighbourhood
demand flexibility profiling modules, which will operate at two scales, namely the
consumer (building) level and the community level. At the building level, the Consumer
Demand Flexibility module will be developed to enable the calculation of flexibility for
individual buildings/consumers. The flexibility will be calculated both for implicit and
explicit demand response. Beyond the estimated amount of flexibility itself, the
controllability and predictability features of it, based on the available loads, will also be
estimated to allow better informed decisions to be taken from the
aggregators/prosumers. An interim step in the calculation and profiling of flexibility
would be the disaggregation of the electrical load in the individual dwellings. That will
ensure a more accurate and complete characterization of the available flexibility. It will
be based on physics-based dynamic building simulation models that will be developed
for the buildings on available static data (e.g. energy performance certificates, info
provided by the occupants) and calibrated with dynamic data harvested by the on-site
sensing and monitoring equipment (at least one smart meter and one thermostat per
building). Big data output from the simulations will subsequently be used to train ML
techniques that can both estimate flexibility metrics (virtual sensors) and optimize the
dispatch of that flexibility.
At the neighbourhood scale, the module will profile flexibility for whole neighbourhoods.
As such, this module will consider all the buildings and technical building systems along
with power and heat networks, mobility networks, infrastructure and other assets. The
module will allow an integrated estimation of flexibility that leads to the understanding
of all the impacts the dispatching of available flexibility can have through a multi-vectoral
approach. The module will utilize a combination of physics-based and data-based
modelling tools in calculating the flexibility in district-level.

26
Consumer & Neighbourhood demand flexibility profiling are modules that are going to
be developed by IES. It is intended to achieve a Technology Readiness Level (TRL) of 8 at
the end of the project, in which the tools would be expected to profile flexibility for the
whole neighbourhood and the consumer side within the context of the TwinERGY
project.
3.3 Neighbourhood demand flexibility profiling Module
The general aspects described in the previous section (3.2 Consumer demand flexibility
profiling Module) also hold for this module at a Neighbourhood scale.
3.4 Home & Tertiary real-time Energy Monitoring Module
The Home & Tertiary real-time Energy Monitoring module is placed in the buildings’
energy efficiency category of services provided in by the Energy Communities. It can be
provided thanks to the aid of capillary monitoring, communication, coordinated control,
distributed storage, and Active Demand management. The traditionally monodirectional
system would see the network change to bidirectional, thus making the consumer an
active part of the process and above all it would contribute to greater control of voltage
and frequency at a distribution level.
The change to a distributed generation model consisting of small self-production plants,
with the abandonment of traditional power plants, will bring not only an improvement
in terms of environmental impact but also an advantage for individual consumers and
businesses, which would become an active part of the process. Until now, energy
efficiency and Demand Response measures have been treated as separate elements
from a technological, regulatory and market point of view. This module aims, to consider
them two sides of the same coin through concept, methodological and technological
innovations including: the removal of entry barriers, or the possibility of obtaining an
improvement in terms of energy efficiency and consequently economic for the end user,
without the need to install sensors, home automation or control systems; attention to
billing will deviate from the classic static models based on the average cost of energy,
but will take into account the real rates applied to have a correct estimate of the
expenditure by the end customer; take into account the demand and production
forecasts during a certain period; a multi-objective optimization with dynamic
constraints that through the output of the developed models, through the construction
of multi-objective algorithms, will take care of the implementation of optimized
consumption policies in the buildings. As related to the UC01, the first step is to obtain

27
a greater facilities' observability; the amount of monitored data, both static and
dynamic, are going to be gathered and then processed and analysed.
Data gathering is crucial for the energy efficiency and energy management processes;
depending on the data available, different actions are able to be taken, and eventually,
the monitoring system is going to be improved. Depending on the availability, the static
parameters will regard many aspects of the facility such as:
• Typology (apartment/household/public building)
• Footprint area
• Number of floors
• Numbers of occupants
• Nominal Power supply
• Photovoltaic plant peak power
• Energy Tariffs timing and costs
The dynamic parameters refer to:
• Energy consumption
• Photovoltaic production
• Electrical Storages
• Indoor parameters (temperature and humidity)
• Weather conditions
The data will be achieved and made available through an online graphical interface to
improve the users' awareness about their energy profile. Starting from the main
electrical appliances inventory and their behavioural rules, this module is going to
deliver the optimal load distribution during the week.
Through the Graphical User Interface (GUI), the users can fulfil the typical usage habit of
their main electrical appliances during the week. The usage routines could be updated
and overwritten by the user every time is needed. In relation to the energy monitoring
and costs information, this data can be used to find and shape the optimal load profile,
reducing costs in the energy bill and maximizing self-consumption.
Home & Tertiary real-time Energy Monitoring is a module that it is going to be developed
by STAM. It is intended to achieve a Technology Readiness Level (TRL) of 8 at the end of
the project, in which the tool would be expected to generate a building Energy

28
Management system that aids users to manage self-consumption and maximization of
self-sustainability.
3.5 DER management module
Towards reducing the overall CO2 emissions of a country, it is important to avoid using
energy that has been produced by fossil-based power plants, that run on coal or natural
gas, for example. To achieve this goal, the use of wind turbines or photovoltaics provides
a possible solution with a high potential. However, the classic energy grid is designed
around large-scale producers like aforementioned fossil-based or nuclear power plants.
In contrast to these facilities, the classic renewable energy production relies on smaller
production units like wind parks or single roofs. This fact bears a new challenge, because
if a major part of energy production should come from RES, many additional smaller
sites will be necessary. This means that a huge number of producers must be
coordinated to ensure a stable energy grid. Renewable Energy Sources (RES) are highly
dependent on weather, which means the weather forecast and its correct interpretation
is crucial for reliable energy production predictions, which in turn are required for
ensuring grid stability. Also, it is important to utilize various ways to store the excess
energy in times of very high-RES energy production and low consumption levels.
The DER management module shall solve these problems. By identifying power supply
bottlenecks in real-time, the power grid can be stabilized, and the share of renewable
energies can be maximized. Since weather conditions are volatile, there is no way to
easily maintain a stable energy production. To counter this, it is necessary to take the
upcoming weather changes into account. Typically, weather forecasts are readily
available for most location, thus it should be possible to utilize this information to make
a reasonable assumption about the amount of energy that is produced in the next hours
or even throughout the whole day. These forecasts can help establish a baseline of data
rules, which would allow algorithmic approaches to more accurately decide on actions
that are most sensible for a given situation.
One practical option is the use of battery storage to compensate peaks and dips in the
energy production. When there is a high level of RES production, as is the case for PV
systems during the day, the excess energy can be stored and used at night or when
there is little sunlight. Another feasible approach is the concept of demand response.
Here, a Home Energy Management System (HEMS) schedules the use of appliances such
as a heat pump or a washing machine to times, where it is convenient in terms of RES
production levels. Combining both options bears high potentials for improving the
energy usage in common households. Sophisticated systems combined with efficient

29
renewable energy production and storage possibilities, can play a big role in maximizing
the use of eco-friendly energy and minimize necessary shutdowns of wind turbines or
PV-systems to accommodate for a stable power grid.
The DER-module is developed by TH-OWL in support with STAM and IES. It is intended
to achieve a Technology Readiness Level (TRL) of 8 at the end of the project, in which the
tool would be expected to calculate the grid status and calculate its display in a real-time
basis.
3.6 Risk Management and event handling Module
The Electrical Power and Energy System (EPES) is evolving rapidly, increasing its
efficiency and business continuity through, among other evolutions, the growing
capability of combining distributed energy resources (DERs). Digital services are a key
enabler of this capability, building on an increased level of collaboration between all
stakeholders connected to the power supply chain that relies on near real-time
availability and exchange of data and knowledge. Dedicated hardware solutions have
changed to software and hardware solutions that makes protecting the systems more
and more sophisticated. This has induced a full redesign of the roles and responsibilities;
regulated stakeholders in charge of the transportation and distribution of electricity
(power network operators, such as TSOs (Transmission System Operators) and DSOs
(Distribution System Operators) are expected to interact and cooperate with commercial
stakeholders, like ESCOs (Energy Service Companies), aggregators, new market
operators, to ensure a cost-effective competitive functioning of the electricity grids.
DR strategies include increasing building energy efficiency, limiting demand when pre-
set limits may be exceeded, and shifting demand from peak to off-peak times (e.g., using
energy storage). Controls to limit demand involve a sequence of automated or manually
performed changes to the building HVAC (e.g., relaxing temperature and system set
points) and lighting systems (e.g., dimming and bi-level switching).
Depending on their position in the power grid and their contribution in the grid stability,
single building and distributed energy plants are going to become critical infrastructures
for the EPES. Both physical and cyber event/issues are becoming as crucial parameters
into the related cost-benefits analysis.
The Risk Management and event handling Module is going to be developed by
integrating two models, Rampart (STAM – IT) and STPA44 (UoP), which both exploit the

30
potential of energy demand flexibility (as a parameter of the network) to address local
and global grid situations.
The Risk Management and Event handling Module is developed by STAM. It is intended
to achieve a Technology Readiness Level (TRL) of 7 at the end of the project, in which the
tool would be expected to identify security gaps, planning and management of
preventive actions and countermeasures.
3.7 TwinEV Module
Nowadays, the European Union (EU) is combating climate change through interventions
in in the transportation sector. Over the last 25 years, European rules have promoted
the reduction of pollutants emissions through the carefully guidance of vehicles’
manufacturers. Nevertheless, today’s huge effort is required in the reduction of CO2
emissions through the electrification of transportation. The main regulatory framework
related to e-mobility is aforementioned as follows:
• Directive on Alternative Fuels Infrastructure (2014/94/EU)
• CO2 Emissions for Cars and Vans Performance Standards (EU 2019/631)
• Trans-European Network for Transport (TEN-T) Regulation review
• Clean Vehicles Directive (2019/1161 EU)
• Sustainable and Smart Mobility Strategy
Performing a comparison between an Electric Vehicle (EV) and an Internal Combustion
Engine (ICE) vehicle, it can be stated that EV perform at a higher efficiency with less
mechanical reliability and have no direct associated CO2 emission. Furthermore, EV store
energy through electrochemical batteries (less energy density than liquid fuels).
However, EV batteries could be charged at least 5 times slower than liquid fuel refuelling
[15].
E-mobility is a key element in the future energy system. This practice generates effects
both as an additional load and as a flexibility resource for market actors and system
operators. The capabilities of EVs are many and varied since they can provide valuable
system flexibility services and the management of congestion in transmission grids. For
this purpose, the development of a suitable charging infrastructure is required to
address different stakeholders’ needs in the electro-mobility value chain. According to
the literature [15], leaving the charging process uncontrolled could hinder some of
present challenges in the power system, such as peak power demand at certain times.
The benefits of managing the charging process regarding the power profile will open

31
new opportunities to the system. So as to mention that a smart EV charging approach
can support the integration of RES resulting in a reshape of the power demand curve
(reducing the system costs and CO2 associated emissions).
Some other underlying aspects associated to the correct spread of smart charging are
the standardization, as well as the dynamic pricing definition, market rules. These facts
require the cooperation among many different actors from diverse sectors such as:
vehicle, battery, electronic industries, ICT, mobility service providers, transport
authorities, electricity market aggregator, consumers, and power grid operators. To
avoid some of the opportunities beforementioned, ENTSO-E [15] suggest some topics
which could facilitate the implementation of smart-charging solutions.
• Coordinate charging infrastructure and electric grid scenario.
• Manage the charging process (considering V2G charging approach if possible) to
smooth peaks in the load curve.
• Deploy electromobility enablers in public and private charging infrastructure,
with metering and communication capabilities.
• Enable a new ecosystem centred around the consumer needs, by enhancing
defined roles, responsibilities to exploit the potential of EV charging as a flexible
resource.
• Update market rules and regulatory framework.
Within the context of the TwinERGY project, the TwinEV module hopes to adjust its goal
of consumer engagement in Demand Response and local optimization in the field of the
EV and its dual role as a demand and storage asset. The objective is to analyse the impact
that the charging scenarios could imply on the community in terms of grid congestion
and the welfare of individual members. To achieve this goal, the TwinEV module will
compile EV user’s preferences and requirements to adjust the services and features to
be provided.
The objective of TwinEV is to provide the required and optimized State of Charge of the
users’ EV at proper times, considering minimum charging prices and the delivery of
maximum green electricity supply to EV, based on local energy demand rationalisation.
In this sense, Electrical vehicles offer a huge flexibility potential. EV has the potential of
shifting the demand, and it can be even improved if V2G functionalities are applied, since
they can give back energy to the distribution grid when necessary. It is worthwhile to
remark that this last functionality could have a positive impact into the grid. In case of
congestion, DSO would be able to send signal to EV to limit their congestion constraints

32
on the grid. Furthermore, additional ancillary services can be provided by electric
vehicle’s battery in terms of voltage control, peak shaving, and energy buffering for RES
intermittency.
For TwinEV module to perform the optimized State of Charge and to be centralized at
the consumer engagement, there are several constraints and parameter that must be
considered. Physical limits such as battery capacity, current State of Charge (SoC),
maximal and minimal power generation, localization of Charging Points, their respective
power on charge process play an important role in the determination of a proper
charging profile. These inputs would be compiled through the preferences of each EV
users, the technical requirements of the grid and the different assets, as well as the
calculation of the Demand Response campaigns resulting in flexibility assessment. [16]
User’s will count with a user-friendly interface in which EV users would be able to
address issues of payment, security, quality, and configuration of their EV charging
profile. Regarding public infrastructure, the most suitable charging point would be
indicated to EV user, based on some principles such as prices, route cost to station, the
energy stock and the waiting-charging times. The platform will be also able to process
booking and parking processes for these regarded public EV chargers. Furthermore, this
would be combined to produce the calculation of the optimal State of Charge (SoC) for
the user, in terms of minimization of the costs and maximization of the green electricity.
This last part is required to be replicated at the private (domestic) EV chargers as well.
TwinEV is a module that it is going to be developed by ETRA. It is intended to achieve a
Technology Readiness Level (TRL) of 8 at the end of the project, in which the tool would
be intended to have a user-centric and cooperative approach within the context of the
TwinERGY project.
3.8 Social Network Module
According to the European’s Commission Package entitled ‘Clean Energy for All
Europeans’, [17] there is a particular concern to pose citizens as the central players into
the energy markets future, as part of the decarbonization effort and targets of 2050.
Towards these efforts, the Local Energy Communities (LEC) can drive and empower the
end-users to consume energy following a more responsible manner, contributing to
energy savings and steering the grid to become more flexible. The participation of
citizens and communities as partners in energy projects are transforming the energy
system. Community energy initiatives are offering new opportunities for citizens to get
actively involved in energy matters. Community energy refers to the collective energy

33
actions that foster citizens’ participation across the energy system. It has received
increased attention in recent years, developing a wide range of practices to manage
community energy projects.
The active participation of residential customers in demand response schemes as well
as their participation in energy communities possibly with shared assets (e.g., battery
storage system, rooftop production, charging point infrastructures) play an increasingly
societal role that implies the concept of fostering citizens’ positive contribution in energy
matters and raising acceptance of green technologies. It is therefore, essential to
promote residential customers’ awareness via monitoring functionalities of their
consumption/production. Such functionality may sensitize residential customer about
his/her consumption profile, with visualized dashboards providing breakdown analysis
on the share of use the different household devices towards comprehending not only
the energy footprint but also the composition of their profiling. Customers access to
data on energy profiles and bills, increases potentially the visibility and awareness of
energy consumption.
The technological advancements even behind-the-meter premises lately are foreseen to
take place with multiple sensory devices beyond smart-meter with multiple IoT based
devices. Concurrently, the expected increase load growth due to the electrification-of-
everything (e.g. Electric-heat-water pumps, electric vehicles etc.) along with the
liberalization of electricity markets (i.e., electricity companies will have to improve their
operation due to competition) will, eventually, render their involvement (via Demand
Response schemes) into electricity value chain, affecting electricity companies, in return
to reduction to their bills. The incorporation of residential consumers may be enhanced
via the competition amongst them.
The social network module within the scope of TwinERGY project aims at providing a
social network platform, which will employ a social competition strategy, designed to
encourage demand response engagement and reduction in energy usage. In other
words, it will enhance the engagement of residential households via a streamlined
competition among neighbouring households. The social network module will provide
a web-based application which will provide a full set of comprehensive dashboards for
the monitoring of consumption/production profiles aggregated at device level along
with information and statuses of any shared assets with the aid of TwinERGY Digital Twin
Platform. There will be specific graphs to present the energy saving of end-users. The
main objective of the module will be to act as a social comparison tool by comparing the
energy use between several neighbouring end-users focusing particularly on the

34
individuals own behaviour which to some extent has implication on the consumption
regular profile. The social comparison will also lead social competition among within the
community or the neighbourhood providing rewards (i.e., TwinERGY points) to the
participating households. The competition will be performed based on gamification
functionalities which in turn will be relying on specific KPIs such as energy efficiency,
participation on the local community, utilization of shared assets etc., as a matter of
providing the corresponding rewards. The Social Network Module will also work as a
generic networking platform which will enable users to interact through specific basic
social tools (e.g. post/comment tool etc).
Social network is a module that it is going to be developed by ED. It is intended to achieve
a Technology Readiness Level (TRL) of 8 at the end of the project, in which the tool maybe
provide a user-centric and cooperative approach within the context of the TwinERGY
project. The social network module will rely its design and implementation on well-
established application developed in the frame of ChargED project [18] that was further
updated in the frame of BENEFFICE project [19] to also incorporate advanced features
(i.e. the CO2 virtual coin as a reward) and will now be introduced to the TwinERGY users
further enhanced by the intelligence and the accuracy/ reliability of forecasts and results
that the Digital Twin module brings.
The Social Network Module is developed by ED. It is intended to achieve a Technology
Readiness Level (TRL) of 8 at the end of the project, in which the tool would be expected
to enhance the engagement of residential households through comprehensive
dashboards to present households’ consumer profiles to act as a comparison tool by
comparing the energy use between different end-users.
3.9 Transactive Energy Module
The energy industry is undergoing a major transformation due to a number of factors
including environmental regulations, new technologies, and active prosumer
participation in decentralized generation, storage, and smart load management at the
grid edge and Behind the Meter (BTM). The proliferation of Distributed Energy
Resources (DERs) has caused operational issues for grid operators due to their
variability, and unpredictability of the impact of DERs on the grid. Properly designed
incentive-compatible local energy markets (LEMs) can help align prosumer incentives
with grid operator objectives. The existing centralized markets cannot handle large
volumes of small quantity transactions involved for such a realization. A Transactive
Energy System (TES) platform providing for both peer-to-peer and peer-to-market
transactions provides a natural solution turning the DERs around from being a
35
problem into a solution for grid management based on market mechanisms. Another
issue with the current energy markets is the relatively high transaction costs for
market participation, delivery verification, and settlements. Blockchain technologies
can provide solutions in that respect. A Blockchain-enabled Transactive Energy system
can support incentive-compatible LEMs for the mutual benefit of the prosumers, the
grid operators, and the passive consumers, and to pave the way for consistent and
efficient regulatory reform options where needed.
Specifically, Transactive Energy (TE) is a system which consists of coordinated
participants that use automation tools to communicate and exchange energy based on
value and certain grid reliability constraints. It basically uses market–based economic
transactions and control functionality for energy trading and sharing among prosumers
within an electric power system. With a transactive energy system (TES), energy is
becoming a commodity for customers. Energy can be traded among them either on a
real time basis or on a predefined schedule, in case also storage is present.
The main concept lies on the determination of two different energy prices; price of the
external grid and internal LEM price. LEM firstly settles internally before coordinating
with the external grid. To be more specific, LEM internally resolves production and
consumption at a lower price (compared to the external grid) to incentivize the
consumers. Two main categories can be distinguished:
• Internal LEM price < Levelized feed out price of the external grid: In that case,
since the selling price of the grid is higher compared to the internal price of the
market, a consumer is incentivized to buy his energy at a lower price from
another LEM participant instead of purchasing from the grid.
• Internal LEM price >Levelized price of the external grid: A participant that
produces energy within the LEM will be better rewarded if he sells his energy
within the market rather than directly to the grid.
This is achieved mainly due to the fact that there are no transfer losses in energy
produced and exchanged between the participants of a Local energy Market on contrary
to the energy exchanges in a large-scale grid with many different voltage levels.
The European Clean Energy Package (CEP), explicitly defines for a first time, the
engagement of consumers and energy communities to the energy sector. The role of
energy communities is defined in the following laws of CEP:
• Renewable Energy directive EU 2018/2001 clearly defines renewable energy
communities.

36
• Internal Electricity Market directive EU 2019/944 defines the roles and
responsibilities of participants in an energy community.
Energy communities are considered a new entity in the market structure, defining exact
characteristics like size, ownership structure and purpose. To be more specific, in terms
of governance the participation, they should be open to everyone but voluntarily and
the customers should be allowed to leave the community anytime they want, without
losing their access rights to network. The owner of the community can be any citizen,
local authority etc. if it does not have direct relation to the energy sector. Finally, the
purpose of the community is primarily to create social rather than financial benefits.
The following Figure 5 provides the layered architecture of the proposed TES platform.
The 7-layer architecture is based on the Open Systems Interconnection (OSI) reference
model. Each layer of the OSI Model handles a specific job and communicates with the
layers above and below itself.
Figure 5: 7-layer architecture

37
Regulation layer 1
Includes laws, regulation, standards, and policies relevant to the energy markets. As well
as data protection and information security. The rules are necessary for providing the
framework and the guidelines for LEM design. These comprise the legal frameworks and
guidelines surrounding the TEM.
User layer 2
Includes Prosumers, energy sources and IOT devices. Refers to the participants of the
microgrid and their hardware platforms for exchanging information. These are the
actors that interact with the TEM.
Communication layer 3
Includes 4G/5G, Fibre optic & Bluetooth and are used by layer 2 to communicate with
the subsequent layers. Communication systems in TEM should meet specific
requirements on bandwidth. Reliability, coverage cost, security, and latency.
Network Layer 4
Includes the power and communication networks that facilitate the routing of
information between the layers. Refers to the microgrid setup and specifically whether
it uses traditional network or its own infrastructure (standalone network or grid
connected).
System operator layer 5
Includes applications, databases, data analytics and power quality analysis which
interact with layer 2, 6. And is usually handled by an independent system operator.
Market layer 6
Includes the DNO/DSO and LEM pricing as well as the settlement for energy
transactions. It determines the MCP for interactions among the participants of the
market. This layer interacts with layer 5 and 7.
Distributed ledger layer 7
Includes private permissioned blockchain that records the energy transactions and LEM
pricing. A digital platform is provided to each participant for ensuring energy and
economic validation.
The Transactive Energy Module is developed by WEC. It is intended to achieve a
Technology Readiness Level (TRL) of 8 at the end of the project. The tool is expected to

38
be used as a transactional platform that offers its participants to sell their flexible energy
loads and excess capacity to an open market to the micro-grid operators or other levels.

39
4. Inputs
This section aims to describe the process that has been followed to gather the different
specifications of the 9 different modules developed within the TwinERGY Project. In this
chapter, the methodology used to gather the functionalities of the modules that
participate in TwinERGY will be explained. The aim is to have a preliminary list of the
module’s functionalities that would be based on the project’s requirements.
Furthermore, these specifications will be correctly aligned with the project Use Cases
(UC). Once there is a correct visibility of these functionalities, relevant partners will
identify their possible iteration with other developed modules, as a mean to define the
Interoperability platform that is going to be explained within the following chapters.
4.1 Functionalities
Each of the partners within Task 7.1 is responsible for one or more of the modules
presented for the TwinERGY project as it has been presented in Table 2. In order to have
a clearer understanding of each of the modules’ functionalities, partners were asked to
identify the goals of their modules in a structured template. This template is organized
in three parts: Functionalities, Input and Output data, and classes of Information. From
the functionalities sheet (Figure 6), the following inputs were expected:
• Functionality Identifier: Through a name-based identifier associated with a key
number, functionalities from the different modules are registered.
• Name: By means of a short name, the functionality is identified.
• Description: This part provides to the functionality a brief description of the
targets to be achieved.
• UC Identifier: The Use Case associated to each of the functionality.
• Input Data Identifier: The functionality may have associated some input data
which could be essential to the operation of the module. In this part, the identifier
associated to this data input will be referenced. Just as a note, this identifier is
fully developed in “the Input data” sheet on the template.
• Output Data Identifier: As the abovementioned identifier, this one is associated
to the output data generated from each of the modules. These data sets are fully
developed in “Output data” sheet on the template.
• Interoperability: This column is set to identify if the module is interconnected to
any other module by means of exchanging information. This item will allow to
determine whether the module will exchange data or not.
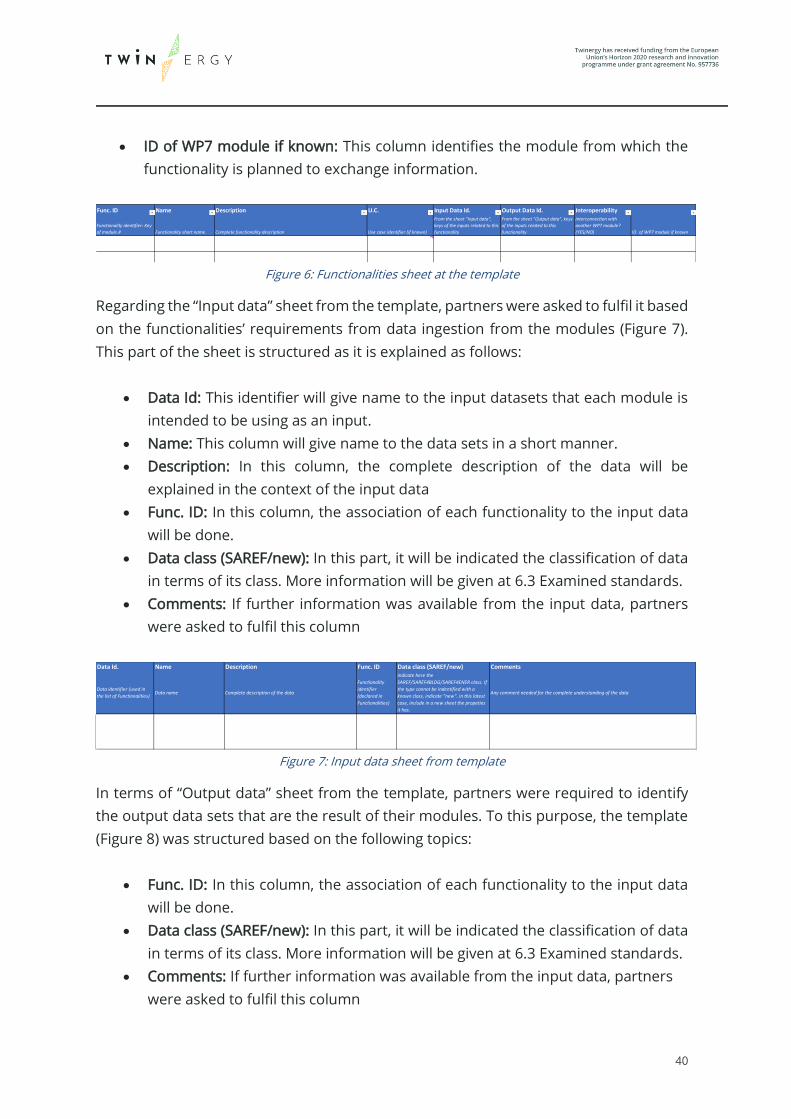
40
• ID of WP7 module if known: This column identifies the module from which the
functionality is planned to exchange information.
Figure 6: Functionalities sheet at the template
Regarding the “Input data” sheet from the template, partners were asked to fulfil it based
on the functionalities’ requirements from data ingestion from the modules (Figure 7).
This part of the sheet is structured as it is explained as follows:
• Data Id: This identifier will give name to the input datasets that each module is
intended to be using as an input.
• Name: This column will give name to the data sets in a short manner.
• Description: In this column, the complete description of the data will be
explained in the context of the input data
• Func. ID: In this column, the association of each functionality to the input data
will be done.
• Data class (SAREF/new): In this part, it will be indicated the classification of data
in terms of its class. More information will be given at 6.3 Examined standards.
• Comments: If further information was available from the input data, partners
were asked to fulfil this column
Figure 7: Input data sheet from template
In terms of “Output data” sheet from the template, partners were required to identify
the output data sets that are the result of their modules. To this purpose, the template
(Figure 8) was structured based on the following topics:
• Func. ID: In this column, the association of each functionality to the input data
will be done.
• Data class (SAREF/new): In this part, it will be indicated the classification of data
in terms of its class. More information will be given at 6.3 Examined standards.
• Comments: If further information was available from the input data, partners
were asked to fulfil this column
Func. ID Name Description U.C. Input Data Id. Output Data Id. Interoperability
Functionality identifier: Key
of module.# Functionality short name. Complete functionality description Use case identifier (if known)
From the sheet "Input data",
keys of the inputs related to this
functionality
From the sheet "Output data", keys
of the inputs related to this
functionality
Do you forseen any
interconnection with
another WP7 module?
(YES/NO) ID. of WP7 module if known
Data Id. Name Description Func. ID Data class (SAREF/new) Comments
Data identifier (used in
the list of Functionalities)Data name Complete description of the data
Functionality
identifier
(declared in
Functionalities)
Indicate here the
SAREF/SAREF4BLDG/SAREF4ENER class. If
the type cannot be indentified with a
known class, indicate "new". In this latest
case, include in a new sheet the propeties
it has.
Any comment needed for the complete understanding of the data
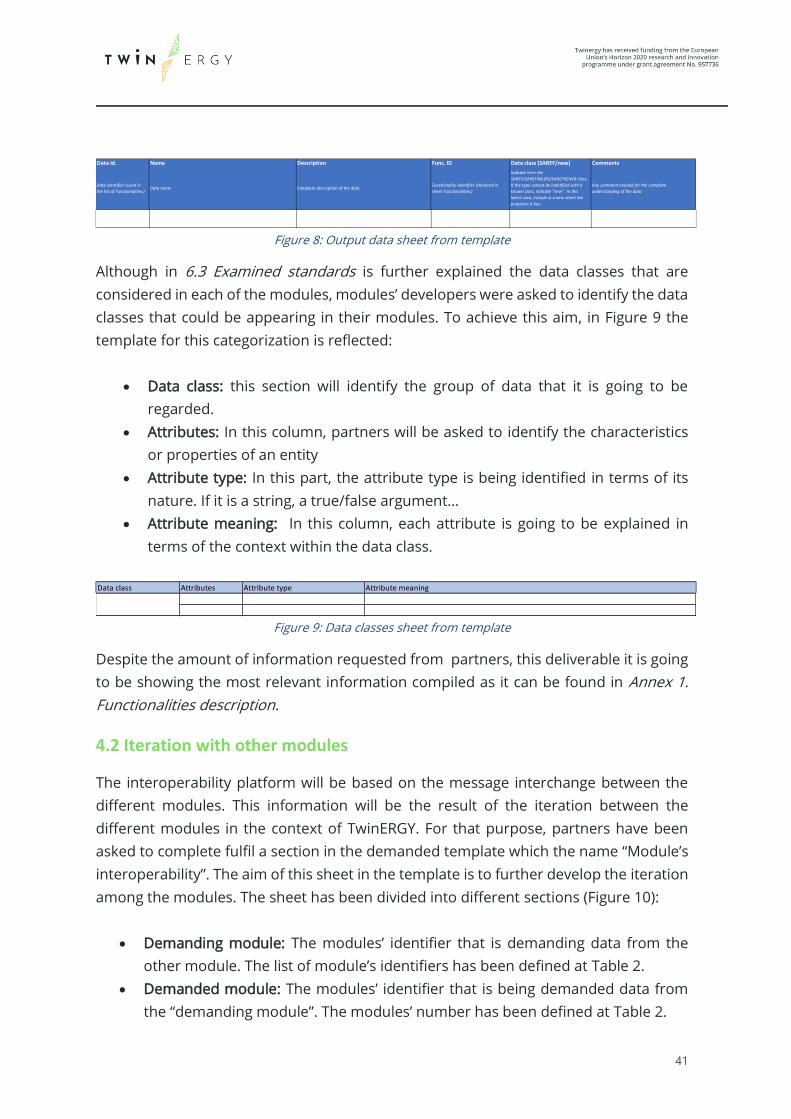
41
Figure 8: Output data sheet from template
Although in 6.3 Examined standards is further explained the data classes that are
considered in each of the modules, modules’ developers were asked to identify the data
classes that could be appearing in their modules. To achieve this aim, in Figure 9 the
template for this categorization is reflected:
• Data class: this section will identify the group of data that it is going to be
regarded.
• Attributes: In this column, partners will be asked to identify the characteristics
or properties of an entity
• Attribute type: In this part, the attribute type is being identified in terms of its
nature. If it is a string, a true/false argument…
• Attribute meaning: In this column, each attribute is going to be explained in
terms of the context within the data class.
Figure 9: Data classes sheet from template
Despite the amount of information requested from partners, this deliverable it is going
to be showing the most relevant information compiled as it can be found in Annex 1.
Functionalities description.
4.2 Iteration with other modules
The interoperability platform will be based on the message interchange between the
different modules. This information will be the result of the iteration between the
different modules in the context of TwinERGY. For that purpose, partners have been
asked to complete fulfil a section in the demanded template which the name “Module’s
interoperability”. The aim of this sheet in the template is to further develop the iteration
among the modules. The sheet has been divided into different sections (Figure 10):
• Demanding module: The modules’ identifier that is demanding data from the
other module. The list of module’s identifiers has been defined at Table 2.
• Demanded module: The modules’ identifier that is being demanded data from
the “demanding module”. The modules’ number has been defined at Table 2.
Data Id. Name Description Func. ID Data class (SAREF/new) Comments
Data identifier (used in
the list of Functionalities)Data name Complete description of the data
Functionality identifier (declared in
sheet Functionalities)
Indicate here the
SAREF/SAREF4BLDG/SAREF4ENER class.
If the type cannot be indetified with a
known class, indicate "new". In this
latest case, include in a new sheet the
propeties it has.
Any comment needed for the complete
understanding of the data
Data class Attributes Attribute type Attribute meaning
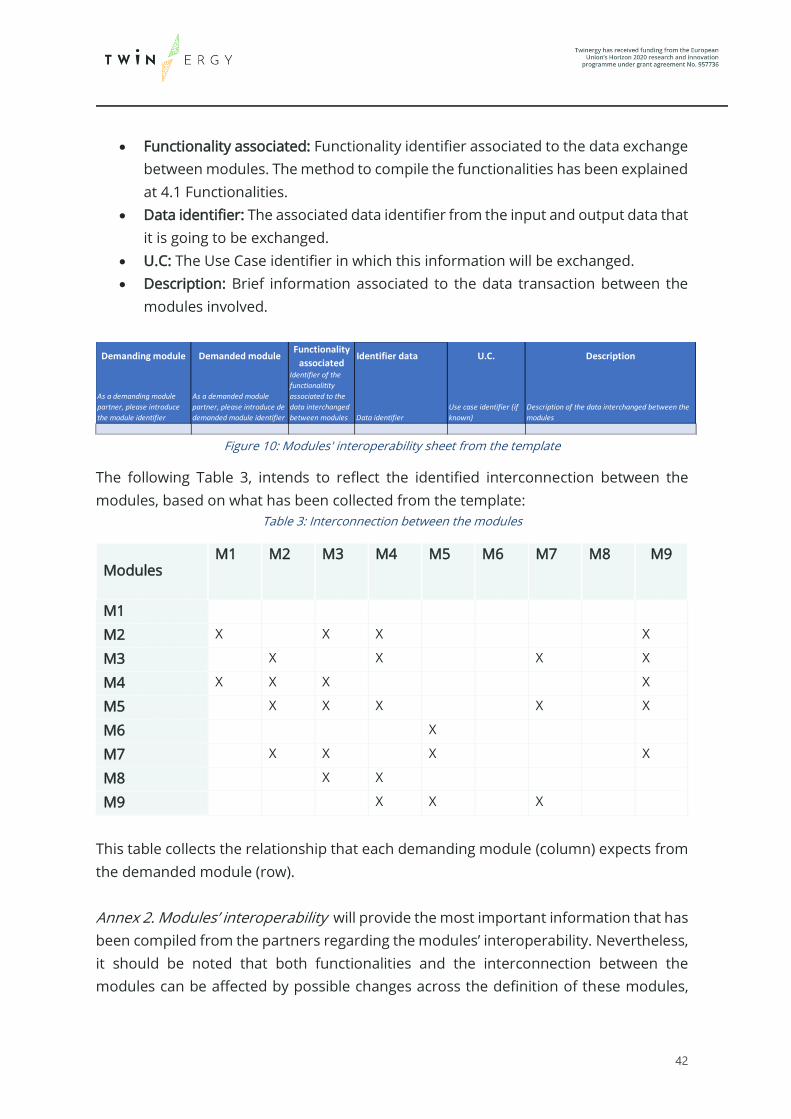
42
• Functionality associated: Functionality identifier associated to the data exchange
between modules. The method to compile the functionalities has been explained
at 4.1 Functionalities.
• Data identifier: The associated data identifier from the input and output data that
it is going to be exchanged.
• U.C: The Use Case identifier in which this information will be exchanged.
• Description: Brief information associated to the data transaction between the
modules involved.
Figure 10: Modules' interoperability sheet from the template
The following Table 3, intends to reflect the identified interconnection between the
modules, based on what has been collected from the template:
Table 3: Interconnection between the modules
Modules M1 M2 M3 M4 M5 M6 M7 M8 M9
M1
M2 X X X X
M3 X X X X
M4 X X X X
M5 X X X X X
M6 X
M7 X X X X
M8 X X
M9 X X X
This table collects the relationship that each demanding module (column) expects from
the demanded module (row).
Annex 2. Modules’ interoperability will provide the most important information that has
been compiled from the partners regarding the modules’ interoperability. Nevertheless,
it should be noted that both functionalities and the interconnection between the
modules can be affected by possible changes across the definition of these modules,
Demanding module Demanded moduleFunctionality
associatedIdentifier data U.C. Description
As a demanding module
partner, please introduce
the module identifier
As a demanded module
partner, please introduce de
demanded module identifier
Identifier of the
functionalitity
associated to the
data interchanged
between modules Data identifier
Use case identifier (if
known)
Description of the data interchanged between the
modules
Legend
Identified by the template
Potential relation

43
since each of the modules is going to be developed in different tasks where they would
target more defined functionalities.

44
5. Specifications and functionalities
Throughout this chapter, each one of the nine modules is going to be analysed in terms
of the objectives to be achieved. Furthermore, the different actions that are taking place
during the modules’ running process are also being described within this section. Based
on the different partners inputs following the methodology explained in Chapter 4, each
partner will have the opportunity to detail the different functionalities that they have
foreseen for their respective modules. Finally, each module would briefly describe the
iterations with other TwinERGY modules in terms of data exchange so that it can be set
up the basis for the Interoperability platform among the modules that is being
developed at the following chapter.
5.1 Consumer Comfort / Well-being Module
5.1.1 Overview
As explained in Chapter 3, the Consumer Comfort / Wellbeing module is going to be
designed to infer as unobtrusively as possible the occupants’ personal thermal comfort
level on the scale provided by ASHRAE 55 standard utilizing physiological and activity
data collected by wearable sensors as well as indoor environmental data. Compared to
other technologies, such non-intrusive approaches do not disturb occupants and enjoy
high acceptance rate by them. Eventually, the personal thermal comfort level as well as
the corresponding thermal tolerance will be incorporated into the consumer Digital Twin
thus, creating a human-in-the-loop system capable to optimizing the use of domestic
conditioning systems, but it can also be applied to building management systems. In the
context of the project, Consumer Comfort / Well-being covers a range of features such
as:
• Personal thermal comfort level
• Personal thermal tolerance / preferences
• Demand flexibility campaigns
• Consumer Digital Twin
• Reduction of CO2 emissions
• Monitoring of physiological parameters which contain useful medical
information.
The actors that could contribute to the smooth operation of the module are listed as
follows:

45
• End consumers / prosumers
• Home environment / energy monitoring module
5.1.2 Detailed functionalities
The main purpose of this section is to define the Consumer Comfort / Well-being module
functionalities within the TwinERGY solution. Consumer’s Comfort / Well-being Module
is responsible for the delivery of the occupant’s comfort sensation level comprising a
wearable unit for the data acquisition and a backed unit for the data analysis. The
wearable unit is low cost, long autonomy wireless device which unobtrusively acquires
physiological signals, efficiently estimates the desired parameters (such as heart rate,
skin temperature, body acceleration) and transmits them to the backend unit, via low
consumption communications protocols (Lora wan) [20]. The backend unit is
responsible for storing, sorting, analysing the received data and associating them with
demographic data, indoor and outdoor environmental information as well as
thermostat setting indications accrued from home IoT devices towards assessing the
occupant’s comfort sensation level and thermal tolerance.
The main functionality of the module is the inference of an index value, placed on a 7-
point thermal scale depicting the occupant’s comfort level within a specific indoor
thermal environment (house, office, etc). A value between -3 and +3 is produced, which
actually assesses the deviation from the neutral thermal sensation [21]. The factors that
affect the occupant’s comfort level are: i) the indoor environmental factors and ii) the
individual factors. Specifically, the indoor environmental factors comprise temperature
and relative humidity while the individual factors comprise weight, height, activity status,
clothing insulation and metabolic rate. Additionally, the module can assess individuals’
thermal tolerance by taking into account their thermal behaviour feedback. Moreover,
the module feeds the entailed information to several entities such as the Consumer
Digital Twin and the Building Digital Twin. Below the required by the module input data
are depicted:
Table 4: Input data required by Consumer Comfort/Well-being Module
Input Description Origin
Weight Occupant’s Demographic data CDMP
Height Occupant’s Demographic data CDMP
To, Ho Outdoor Temperature, Humidity CDMP
Ti, Hi Indoor Temperature, Humidity CDMP
Clo Occupant’s Clothing Insulation CDMP

46
Tth Thermostat Temperature Setting CDT
HR Occupant’s Heart Rate CMDP
Tsk Occupant’s Skin Temperature CMDP
Xi,Yi,Zi Occupant’s Body Acceleration CDT
The envisaged initialization process regarding the comfort/wellbeing module is:
• A wearable unit shall be provided to the end – user / occupant.
• The end – user / occupant will complete and submit a registration form.
• The end – user / occupant will confirm the email address with an auth key link.
• The end – user / occupant will complete and submit a demographics data form.
• The end – user / occupant will complete and submit a preferences form.
By completing all the steps above, the end – user occupant is going to have access to the
comfort / well-being module. Then, the wearable unit is properly setup to transmit data
that integrate the ID of the unit, which matches the stored data will the User ID. These
specific features are going to be further explained as follows within a brief description.
Nevertheless, this module is going to be further developed at Task 7.2 “Consumer
Comfort / Wellbeing Module”.
Login for end-users
End users (occupants) will be able to login into the platform to access the functionalities
that the module can provide. The access to the module is done by a username and an
assigned password. This first screen is linked to the next functionality, which is the
creation of an account. Furthermore, it will allow the reset of the password if the user
can no longer remember it. The login part is intended to check the username and the
encrypted password and return a session token if the call has been successful. On the
other hand, resetting the password generates a new one that is sent by an email. Below,
related mock-ups are provided (Figure 11).

47
Figure 11: Login and access screenshot for the Consumer/Well-being module
Creation and configuration of the account
The creation of the account is going to be a prerequisite to access the functionalities of
the module. This functionality is able to check the data in the creation form and returns
a true value when the account has been created and validated. On the other side, the
configuration of this account is performed in a separated section of the module through
which the user can feed in the module the requested info as well as define and configure
the interfaces). Figure 12 and Figure 13 show how this functionality is viewed on the
application.
Figure 12: Screenshot for the configuration and creation of an account

48
Figure 13: Screenshot for the configuration of an account for the Consumer/wellbeing module
Handling of operation and connectivity issues
Following the configuration of the wearable unit and the establishment of a secure
connection to the backend unit, data start flowing amongst them. Aggregated data
comprise heart rate, activity status, skin temperature, metabolic equivalent, clothing
insulation factor, indoor / outdoor conditions, and operational parameters, such as
battery alert etc. The process of inferring comfort level and thermal tolerance occurs in
the backend Consumer Digital Twin.
Comfort Level and Physiological Data Monitoring
The occupants shall have the opportunity to monitor their comfort level along with the
physiological data shaping that value. More explicitly, visualized data in the form of
charts (e.g. line charts, bar charts, etc.) and cards will be available from the Comfort /
Well–being Module for them to observe. Figure 14, Figure 15 and Figure 16 show
screenshots regarding the occupants comfort level and physiological data monitoring.
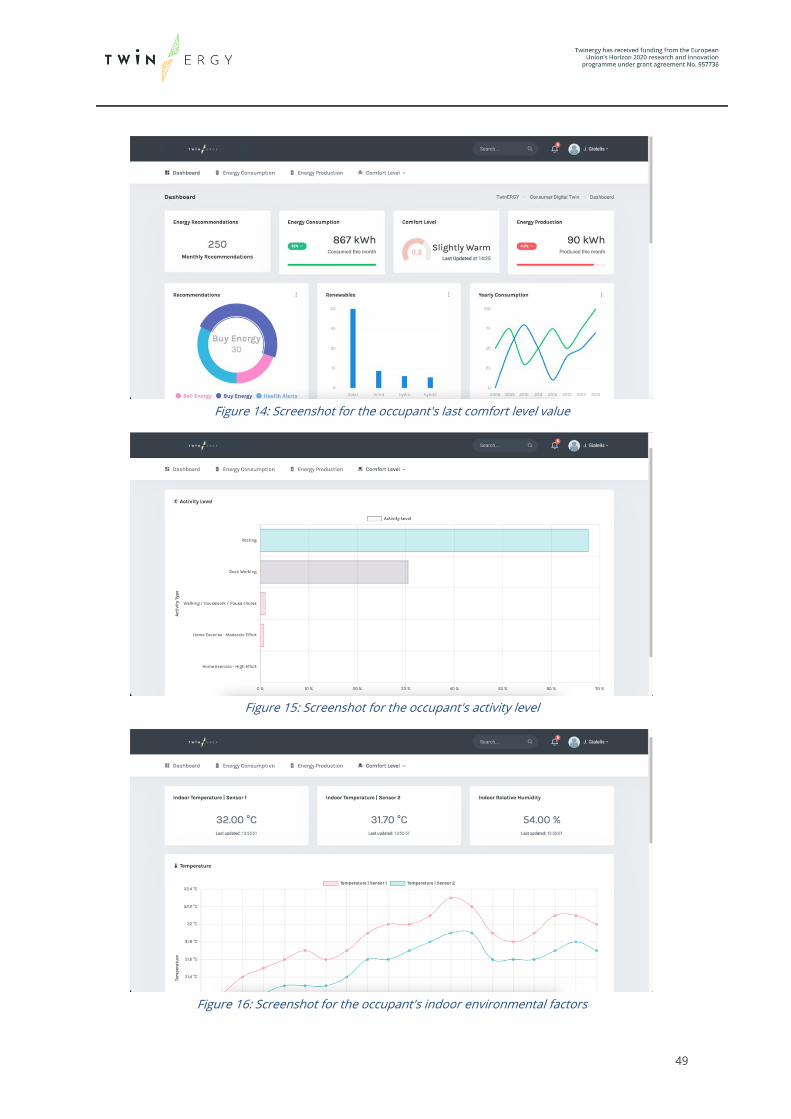
49
Figure 14: Screenshot for the occupant's last comfort level value
Figure 15: Screenshot for the occupant's activity level
Figure 16: Screenshot for the occupant's indoor environmental factors

50
5.1.3 Interaction with other modules
Consumer Comfort / Wellbeing requires data accrued from the Home & Tertiary real-
time Energy Monitoring Module, as following:
Table 5: Data accrued from other modules at Comfort/Well-being module
Input Description
To, Ho Outdoor Temperature, Humidity
Ti, Hi Indoor Temperature, Humidity
5.2 Consumer demand flexibility profiling Module
5.2.1 Overview
As described in Chapter 3, the Consumer Demand Flexibility Profiling Module is intended
to facilitate the calculation of flexibility for individual buildings or consumers, both in
terms of implicit flexibility (i.e. the actions taken by a consumer in response to dynamic
conditions, such as price signals, for example) and explicit flexibility, which refers to
automated actions that are managed and dispatched by an aggregator.
At their core, identifying and leveraging flexibility are optimization problems, which are
defined by their inputs, constraints, and objective functions. In the context of the
TwinERGY project, flexibility actions and the associated objective function optimizations
will be completed at the Digital Twin level. A hybrid approach will be taken to identify
the relevant inputs for each building, with real-time data from the demonstration
buildings, supplementing the physics-based model components of the DT platform as
well as inputs from other modules such as the Transactive Energy Module, where
dynamic pricing may impact on the optimization solution, and external factors such as
the local weather conditions. The constraints will include the physical capabilities of the
equipment, the comfort metrics & associated user preferences and will leverage static
information with respect to component and system performance metrics, as well as
dynamic metrics such as battery charge/discharge level for example. In addition to these
factors, the preferences of the consumer, as well as their willingness to participate in
flexibility actions will provide a key constraint to the implementation of flexibility of the
tool. This User Feedback will be gathered through an interaction with Consumer
Comfort/Well-Being and will ensure that any flexibility actions represent the preferences
of the user with respect to their comfort, their priorities in terms of operating their
residence and their willingness to participate in flexibility within their building. Finally,
51
the objective function is the solution for which the system is being optimized for. The
TwinERGY project has many objective functions that may be used by the flexibility
algorithm. These include but are not limited to:
• Minimise total energy consumption.
• Minimise total CO2 emission.
• Minimise total energy costs.
• Maximise share of renewable energy / self-consumption.
• Maximise/minimise machine utilisation.
• Maximise share of heat recovery.
• Maximise efficiency factor of the different energy types.
It is anticipated that, for the purpose of the TwinERGY project, the flexibility algorithms
will be integrated entirely within the DT engine, allowing for the platform to seamlessly
leverage the power of the DT platform. As a result, flexibility calculations will be
undertaken concurrently with the prediction functionality of the DT to ensure that the
forecasted energy consumption that will be used within other TwinERGY Modules, is as
accurate and representative of the actual conditions in the pilot sites as possible, As a
result, Consumer Demand flexibility profiling is intended to perform as a read-only,
cloud-based dashboard in which the user can obtain information regarding how
flexibility actions are being implemented in their buildings. Although the design of this
dashboard is ongoing and remains in flux, it is anticipated that the following building
level information will be displayed.
• Summary of Energy Consumption over a Specified Period, including proportion
provided by Renewables.
• Forecasted Energy Consumption for the Following Day.
• Forecasted Renewable Energy Generation for the Following Day.
• Identification of Flexible Loads for the Following Day.
o Proposed HVAC System Settings for Optimized Flexibility Conditions.
o Identification of Battery Charging/Discharging Potential.
o Identification of Optimum Usage Time for Using Flexible Appliances.
• Outline of Consumer Flexibility Preferences.
5.2.2 Detailed functionalities
It is anticipated that this module will contain limited functionality, operating primarily
as a read-only cloud-based dashboard platform that provides the user with information
regarding their current and forecasted energy consumption & generation, preferences

52
for implementing flexibility and proposed flexible actions. The primary computational
actions will be implemented within the DT as a core functionality of the energy
forecasting process for the TwinERGY platform. To this end, the process flow for
computing the consumer flexibility will be described loosely in the following sections,
while also describing the core requirements of the Module itself. Consumer Demand
flexibility profiling module will provide the following functionalities to the user:
• Login page for end-users where they can log in to view the flexibility within their
building.
• Creation of a user specific account that is represents their building.
• A number of informational dashboards that provide the user with an outline on
various energy and flexibility related data for their building.
Log-In Page
The first step in gaining access to the module’s Interface is completed through logging
into the platform portal. It is intended that this module will be a web-based platform
that is accessed through a web browser, such as Google Chrome, Mozilla Firefox or MS
Edge. The login page will be accessed either through a central TwinERGY platform
webpage or directly via its own URL. On this page the user will be asked to provide their
unique username and password in order to access their specific building dashboard
within the module. A mock-up of a potential log-in portal for this module is presented in
Figure 17.
Figure 17: Mock-Up of a potential log-in page for consumer demand flexibility profiling module.
Once the user successfully enters their credentials, they will be redirected to the home
page of the module. Should the user forget their password or have other difficulties
logging into the page, a “Forgot Password?” link will be provided. This link will forward
the user to a password recovery page where they will be able to complete a password

53
recovery process and reset their password in order to access their account. This process
will be completed in accordance with current GDPR and data protection best practices.
In the event that the user is logging on for the first time, they will be asked to follow a
link created their TwinERGY account.
Account Creation
In the event that the user doesn’t have an account with the TwinERGY platform or has
not visited the platform interface previously, they will be invited to click a link to “Create
an Account”. Once this link is clicked, the user will be forwarded to a unique landing page
in which they will be able to insert their relevant information to create an account. The
user will be able to input their address in order to identify their building and, following
verification of their identity and address will be enrolled in the TwinERGY platform. At
this point, the user will also be able to define an account recovery mechanism in the
event that they are locked out of their account. This process, as well as the storage of all
personal information and data will be implemented in accordance with best practice
GDPR and data protection guidelines.
Landing Page and Informational Dashboards
Once the user has correctly logged into the TwinERGY Consumer demand flexibility
profiling webpage, they will be automatically redirected to the landing page, on which a
virtual representation of their building will be displayed to the user. The user will then
be able to scroll down the page to review a number of pre-set, building specific
dashboards that present them with information related to the performance of their
building, as has been highlighted in the previous section of this report. The information
displayed through these dashboards will be accessed by the Module through an API that
is linked back to the DT platform through the iSCAN system, which is being used within
TwinERGY to support the DT through the storage of data. As a result of this, real-time,
up-to-date data will be presented to the user to inform them of their current building
consumption, RES generation, forecast energy consumption and available flexibility.
Although the design of this dashboard and the module itself has yet to commence, it is
anticipated that a range of data visualization techniques will be reviewed and
researched to ensure that the information is displayed in an appropriate and user-
friendly manner to maximize the use of the module within the overarching TwinERGY
platform. A potential sample dashboard design is presented in Figure 18 below.

54
Figure 18: Potential dashboard interface design strategy for Consumer demand flexibility profiling.
Leveraging the DT to Calculate Consumer Flexibility
The TwinERGY platform is based on the use of DT to forecast energy consumption at the
building and neighbourhood level. The DT comprises physics-based energy models of
each of the pilot sites, which are developed using the systems and loads within the
building. Once the initial building model is complete, it is then calibrated using actual
occupancy use patterns and settings, real weather conditions and metered data to act
as a virtual representation of the building itself, the Digital Twin. This DT can then be
used to undertake tasks such as forecasting and predictive analysis, “what-if” analysis,
load optimization and flexibility calculation.
Once the DT has been created, through the use of site-specific information as provided
by the pilot sites, as well as using actual weather conditions and energy consumption
data, it will be used to compute the forecasted energy consumption for the building.
This process will be completed using forecasted weather conditions, as well as the user
preferences with respect to internal comfort conditions that have been defined through
Consumer Comfort/Well-Being module. It is anticipated that the output from this
module will be used as one of the optimization constraints within the building, enabling
for the optimization of the building’s energy consumption with respect to their desired
comfort. In addition to these preferences, the user will also be asked for their willingness
to participate in flexibility actions, which will also be communicated back through the
user preferences. The users will also be polled on which objective function they would
like to optimize their building performance for, ensuring that the inputs to the flexibility
optimization algorithms are fully defined with respect to the users’ goals and
preferences.
55
Once the preferences have been defined, the DT will access the dynamic energy pricing
that has been calculated by the Transactive Energy Market. This information will be used
as an additional objective function to ensure that the flexibility actions proposed by the
DT can present the best value for money to the user. Finally, the DT will access the
forecasted weather conditions for the following day. Once this information has been
gathered, the DT will run its simulations for the day ahead, forecasting both the energy
consumption of the building but also the potential generation of any RES that is installed
on the home. This step will occur iteratively as the flexibility algorithms run through
multiple simulations to identify the most optimal solution for leveraging flexibility in a
manner that is most consistent with the users’ defined preferences.
Having identified the most appropriate flexibility dispatch for the following day, the DT
will record the final strategy and output it to iSCAN as a time-series data stream where
it is accessible to any other module. It is anticipated that this information will be
automatically pushed, through the use of APIs to both Neighbourhood demand
flexibility profiling and Home & Tertiary real-time Energy monitoring for use by those
respective modules. The Consumer Demand Flexibility Module will also access this
information and display it to the user through its dashboard.
Regarding the inputs that this module is going to have, it is just worth mentioning that
this module will act as a read cloud-based dashboard into the Digital Twin (DT).
According to the Figure 2, this module is going to have access from the DT via the iSCAN
database. So, the inputs for the flexibility calculation will further be analysed in WP6:
Development of Digital Twin Platform & System Dynamics.
5.2.3 Iteration with other modules
As stated previously, Consumer demand flexibility profiling module itself will not be
used to complete calculations and determine the flexibility of the buildings. Instead, this
process will be completed using the DT and its physics engine. Based on this distinction,
it is anticipated that the flexibility algorithms, when integrated into the DT engine, a
number of the modules will be required to interact with these DT based algorithms, both
in terms of receiving information as inputs to the flexibility calculation to providing
inputs to other modules. The flexibility algorithms will receive input, constraint and
objective function parameters and limits from a range of sources, including through the
output of other modules. Furthermore, the forecasting and identification of flexibility in
the building level loads will provide the inputs to other modules within the TwinERGY
platform. Consumer demand flexibility profiling module itself will then act as a read-
only cloud-based dashboard that indirectly interacts with other modules through its

56
presentation of the flexibility data associated with the relevant pilot building. These
interactions are as follows:
Consumer Comfort / Well-Being Module
This module will be responsible for identifying and defining the comfort criteria and user
preferences that will be used to optimize the flexibility within the building. User
requirements with respect to comfort and IAQ conditions, as well as their willingness to
participate in flexibility actions will provide the constraints required to identify the
optimized flexibility strategy for the building, while also ensuring that the flexibility
actions provided to the user are fit for purpose and consistent with their stated
requirements.
Transactive Energy Market
Where a given user indicates a desire to use “Minimize Energy Cost” as an objective
function in dispatching flexible actions, the DT will require energy cost inputs. In
TwinERGY, the platform is exploring the potential for dynamic energy pricing as a means
for creating a Local Energy Market. This dynamic pricing structure, which depends on
factors such as building energy forecasting and renewable energy generation, for
example, which will be computed by Transactive Energy Module. The output of this
module will then be used as an input to the flexibility algorithm to optimize the function
with respect to minimizing energy cost.
Neighbourhood Demand Flexibility Profiling
In order to identify flexibility at the neighbourhood scale, will provide its building level
flexibility and energy consumption forecasting for a day ahead to Neighbourhood
Demand Flexibility Profiling Module, which will use it as a means to defining the available
dispatchable flexibility for the neighbourhood. It is anticipated that each individual
building will be represented on the Neighbourhood Demand Flexibility Profiling Module.
Home & Tertiary Real Time Energy Monitoring
The Consumer Flexibility Profiling Module will provide Home & Tertiary Real Time Energy
Monitoring with the forecasted Energy Consumption for the building, as calculated by
the DT. This forecasted data will be calculated based on the optimal use of the flexibility,
based on user preferences and system limitations and the manner in which flexibility
was leveraged will be provided to the Home & Tertiary Real Time Energy Monitoring
module. This module can then implement the proposed flexibility strategy either
through implicit or explicit dispatch strategies within the Module.

57
5.3 Neighbourhood demand flexibility profiling Module
5.3.1 Overview
The Neighbourhood Demand Flexibility Profiling Module will operate in a similar manner
to Consumer Demand Flexibility Profiling Module, however it will use the Community
Digital Twin to present a single pane of glass dashboard for the entire neighbourhood.
This module will again be used as a read-only, cloud-based dashboard to allow the user
to view the flexibility profile within their neighbourhood and will include:
• Flexibility Profile for each Building in the Neighbourhood (see Section 5.2).
• Overview of RES Generation across the Neighbourhood.
• Overview of Energy Storage Capacity across the Neighbourhood.
• Overview of PV Charging Stations and their Capacity/Availability.
• Dynamic Pricing Structures being Implemented in the Neighbourhood at a given
time.
As with the previous module, it is proposed that the Community DT will complete the
computational processes that are required to identify and profile flexibility within the
neighbourhood, while the module itself will provide the user with a dashboard view of
the outputs from the flexibility algorithms.
5.3.2 Detailed functionalities
The module will provide the same functionality as that described for the previous
module, however, the calculation and profiling of flexibility within the DT will be
completed with less input from the user. Furthermore, once the user reaches the
landing page, following successful login to the platform, they will not view their building,
but instead will see either a nodal diagram of their neighbourhood (Figure 19) or a high
level block diagram of the buildings within their community (Figure 20). The manner in
which the user manipulated these landing pages is currently being discussed, and
further information will be provided in due course.

58
Figure 19: Nodal diagram of the neighbourhood.
Figure 20: Block Diagram of Neighbourhood
The calculation and profiling of flexibility at the neighbourhood level will be completed
using similar algorithms as those used in the previous explained module, although the
inputs and constraints are likely to change. It is anticipated that there will be less
consideration of user preferences at the neighbourhood level as this will have been
considered and implemented within the building level flexibility. As a result, flexibility at
the neighbourhood will focus on explicit measures, optimizing the use of RES and
minimization of GHG emissions at the neighbourhood level, while ensuring that each of
the forecasted energy demands form the buildings are satisfied within the
neighbourhood, while also addressing the objective functions defined in 5.2.1 but at the
neighbourhood scale. Dynamic energy pricing will also act as a key constraint within this
DT as peer-to-peer trading, as well as the use of community battery storage facilities will
be considered within the optimization calculations with the aim of minimizing the energy
cost to the community.
Once the optimal flexibility profile has been identified for the community, it will be
returned as time series data to iSCAN where it will be available to all modules,

59
particularly Module 7.5 DER Management, where the flexibility strategy will be
implemented within the neighbourhood.
Regarding the inputs that this module is going to have, it is just worth mentioning that
this module will act as a read cloud-based dashboard into the Digital Twin (DT).
According to the Figure 2, this module is going to have access from the DT via the iSCAN
database. So, the inputs for the flexibility calculation will further be analysed in WP6:
Development of Digital Twin Platform & System Dynamics.
5.3.3 Iteration with other modules
It is anticipated that the Neighbourhood Flexibility Profile will have interactions with a
number of other modules, both through the receipt of input required to identify and
profile flexibility but also to provide input to other modules as follows:
Consumer Flexibility Demand Profiling
The building level flexibility profiling, energy consumption forecasting & building level
RES generation will represent a core input to the Neighbourhood Flexibility Demand
Profiling Module. This module will provide the building level loads and RES generation
that will act as constraints in the calculation of flexibility within the neighbourhood, as
well as impacting the dispatch of community level RES and battery storage assets within
the module.
TwinEV
The TwinEV module will also provide an important input to Neighbourhood Demand
Flexibility Profiling, through the representation of EV charging stations within the
neighbourhood. As the user will be able to reserve a charging spot within the
community, it is important that this input is provided for the optimization of flexibility
within the neighbourhood.
Transactive Energy Market
As with Consumer Demand Flexibility Profiling, the Transactive Energy Market’s dynamic
pricing structure is an important input into the flexibility profiling at the neighbourhood
level. The utilization of community owner RES production, battery storage and EV
charging stations will dictate the tariffs and will be an essential input to the flexibility
profiling algorithms that are leveraged by the DT.
Home & Tertiary Real Time Energy Monitoring
Since Home & Tertiary real-time Energy Monitoring will provide real-time energy
monitoring as well as providing the user with implicit guidance on how best to operate

60
the building, it is possible that the flexibility profile identified by Consumer Demand
Flexibility Profiling will not be fully realized in practice. Home & Tertiary real-time Energy
Monitoring will provide input with regards to the adjusted forecasted energy
consumption, that is any variations from the output of Consumer Demand Flexibility
Profiling that are inconsistent with the actions implemented by the user. This will be
used by Neighbourhood Demand Flexibility Profiling in the event that there is a large
discrepancy between the forecasted and actual energy consumption at the building level
doesn’t have a major impact at the neighbourhood level.
DER Management
The Neighbourhood Flexibility profile will be provided to DER management module, who
will then analyse and implement the proposed measures at the community level. They
will provide grid dispatch and control strategies to ensure that the neighbourhood
flexibility objective functions are satisfied.
5.4 Home & Tertiary real-time Energy monitoring
5.4.1 Overview
The goal of the Home & Tertiary real-time Energy Monitoring Module is the development
of a user-friendly building Energy Management system aiming to support users
managing self-consumption and maximize self-sustainability. Additionally, it increases
residential awareness and engagement to demand side management programs.
Furthermore, it reduces reluctance and fear of participation in DR programs.
The Home/Tertiary EMS is going to leverage data about energy demand, renewable
production and storage system at building level. Based on the energy monitored and
forecasted patterns the module will find the optimal flexibility solution to improve self-
consumption. Whenever is feasible, the main and smarter electrical appliances are going
to be remotely controlled (eventually through smart plugs), in order to optimize the
energy patterns taking into account renewable production forecast and applying
dynamic pricing policies. Moreover, the user’s special needs and preferences, will enter
the optimization loop, preserving comfortable and healthy indoor conditions.
The outputs offered through a user-friendly GUI of a web and mobile application will
drive the users into a positive state of mind regardless the participation in demand
response programs. With the true horizon to trigger a social pressure loop and a word
of mouth about the benefits of these energy efficiency processes.

61
In the context of the project, EMS covers a range of features such as:
• Behavioural DR and Energy Consumption Reduction
• Self-consumption increasing
• Economic savings
• Reduction of CO2 emissions
• Bills Optimization
• Focusing on savings, comfort and peak shaving.
The actors that could contribute to the smooth operation of the module are listed as
follows:
• Energy final users
• VPP operator
• Retailer
• DSO operator
5.4.2 Detailed functionalities
The main purpose of this section is to define the EMS module functionalities within the
TwinERGY solution. These functionalities, as commented before, are based on the
different objectives in Section 3; the system produces a set of outputs that are then
made available to the user through a mobile and web application. The scenario depicted
by the application is:
• End-users’ account Login/Configuration
• Configuration of the building
• Main features and electrical appliances inventory
• Energy monitoring graphs
o Historical
o Forecast
• Energy billing optimization
• Optimal flexibility solutions
These specific functionalities are going to be further explained as follows within a brief
description. Nevertheless, this module is going to be further developed at Task 7.4
“Home & Tertiary real-time Energy Monitoring Module”.

62
End-users’ account Login/Configuration
The first step, essential for any web application, is identifying the user (Figure 21), which
must be preceded by registration. During the registration phase, the only confidential
information required is Name, Surname, and email address (Figure 22).
Figure 21: Log in the Home/Tertiary EMS module
Figure 22: Registration in the Home/Tertiary EMS module
Configuration of the building
During the asset configuration, it will be possible to enter a series of information, some
of which are mandatory and others are optional. In all graphical interfaces, the data to
be entered will be indicated by an asterisk. Among them are recalled:

63
• Name of the asset
• Typology
• City
• POSTAL CODE
• Heating area [m2]
• Average number of occupants
Optional information, albeit important, not essential elements for operation.
Main features and electrical appliances inventory
For individual electrical loads, the user will have the ability to enter the details of the
typical time of use during the days of the week and if their flexible use is permitted, with
indications organized by hourly intervals and divided for each day of the week. If the
load is associated with a monitoring device, the cycle of use will be defined by
overwriting the information previously provided by the user. Power lines and loads are
organized in a hierarchical manner, and therefore they provide information on the
individual electrical loads associated with a power line and therefore on the details on
consumption. The general specs required are:
• Name of the load (unique)
• Type of load
• Reference asset
• Year of installation
• Typical use cycles of the appliance during the week
The EMS Module allows to enter an hourly usage detail, for each day within the week.
Furthermore, by checking the availability of the appliance for use with flexible hours, an
additional configuration bar will appear, to specify the times during which the user is
willing to change his own appliance use routines. Depending on the type of load,
additional information will be entered. To create a more user-friendly application, the
insertion of the rated power of the devices will be supported by drop-down programs,
for the most common loads. Below is the list. However, the possibility of a personalized
entry by the user will be guaranteed.
Energy monitoring graphs
In the dashboard, the consumption data for the entire asset is going to be provided, with
a chromatic scale that allows the distinction of the individual energy meters installed.

64
The data in the GUI will be provided with different aggregation level and paired with
trends and analytics.
Figure 23: Energy monitoring graphs
Also an indication of the energy consumption of the entire asset can be provided, related
to its heated surface. A speedometer display is available for the representation.
Figure 24: Speedometer display for heated surfaces
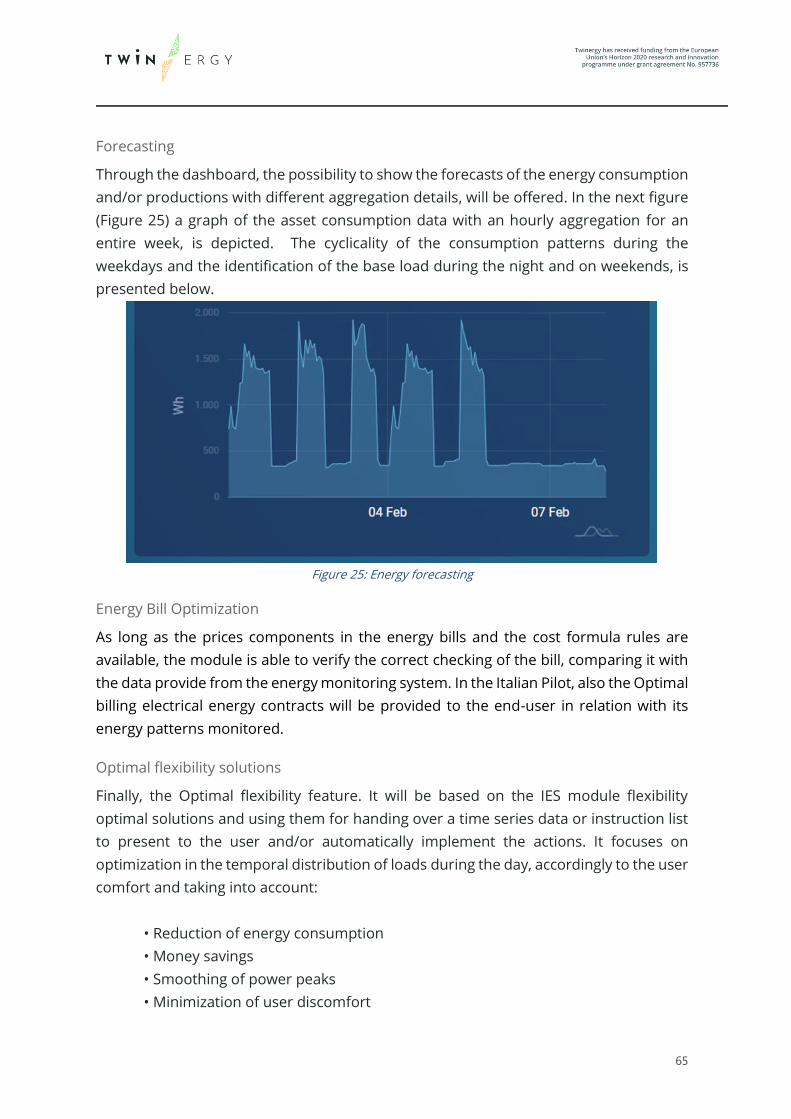
65
Forecasting
Through the dashboard, the possibility to show the forecasts of the energy consumption
and/or productions with different aggregation details, will be offered. In the next figure
(Figure 25) a graph of the asset consumption data with an hourly aggregation for an
entire week, is depicted. The cyclicality of the consumption patterns during the
weekdays and the identification of the base load during the night and on weekends, is
presented below.
Figure 25: Energy forecasting
Energy Bill Optimization
As long as the prices components in the energy bills and the cost formula rules are
available, the module is able to verify the correct checking of the bill, comparing it with
the data provide from the energy monitoring system. In the Italian Pilot, also the Optimal
billing electrical energy contracts will be provided to the end-user in relation with its
energy patterns monitored.
Optimal flexibility solutions
Finally, the Optimal flexibility feature. It will be based on the IES module flexibility
optimal solutions and using them for handing over a time series data or instruction list
to present to the user and/or automatically implement the actions. It focuses on
optimization in the temporal distribution of loads during the day, accordingly to the user
comfort and taking into account:
• Reduction of energy consumption
• Money savings
• Smoothing of power peaks
• Minimization of user discomfort

66
The main output data in the dashboard are presented as follows:
• Total initial expenditure in the canonical appliances use: It comprises a fixed
component (which depends on the optimal solution available) and the real
component (which depends on the real Users behaviour)
• Optimized spending: Also divided between real and optimal component, it
provides savings as a percentage.
• Optimized hourly distribution of individual appliances during the day of the
week: A heat map shows in bright red the periods where the smoothed power
peaks are recorded thanks to the redistribution of the loads.
• Optimized distribution of each load during the week: For each electric loads, the
pre- and post-optimization cost and the savings are going to be achievable by the
user. In this way, the user is left with the evaluations in terms of costs VS benefits,
connected to the variation or their own use routines for all certain appliances.
The module requires a set of inputs to calculate the optimal flexibility solution for a
specific building. These inputs are listed in the following table (Table 6):
Table 6: Requirements H&T EMS
Input Description Origin
Energy Demand Active energy demand monitored
for different aggregation level
(Entire facility/power lines/single
appliance)
CDMP
Demand forecast Forecast of demand over the next
24 hours and 1 week
M2 - IES
Production
forecast
Forecast of production over the
next 24 hours and 1 week
M5 - THOWL
Building supply
max. power
Maximum power to be delivered
simultaneously, considering,
demand and production.
CDMP
Building supply
min. power
Minimum power to be received
simultaneously (Base load)
CDMP
Energy price Curve of energy price Pilots and M9-WEC

67
5.4.3 Iteration with other modules
H&T EMS module is expected to interact with other modules and its calculations to
obtain valuable data sets for its own interest.
Consumer and Neighbourhood demand flexibility profiling
These two modules are being developed by IES. The EMS module requires the Forecast
Energy consumption only at domestic level. These predictions would allow to determine
the expected demand profile within a period. This is a valuable input that would
contribute to the calculation of the flexibility algorithm. In addition to this, based on the
aggregated demand monitored data, it is possible to estimate the disaggregated (single
appliances) profiles and the consequent forecasts. Furthermore, the optimization
algorithm requires as an input the production forecast within the following 24 hours and
for the next week. The difference between optimal and real energy user patterns in
output, it is going provide as input for the M3 Neighbourhood demand flexibility
profiling (IES).
Transactive Energy
This module is being developed by WEC. This module is a trading decentralised platform
that will provide novel block-chain enabled services to the transactive energy market.
Whenever is possible, the EMS module would perform an optimization based on the
curve of the dynamic energy price. This module is expected to provide these prices to
EMS module in order to help the flexibility algorithm into taking into account the
different cost tariff, the energy production from renewable and the impact on the power
grid.
Consumer Comfort / Well-being Module
This module is being developed by UoP. This module, using wearable wireless devices,
responsible to monitor and acquire physiological signals and extract the various vital
signs after suitable processing (such as heart rate, breathing rate, body temperature,
sweating index, etc). Based on these physiological data and some indoor parameters
such as temperature and humidity, this module is going to provide a comfort parameter
inside a scale of values. The curve of comfort is going to be used as input in the EMS
module towards finding the optimal flexibility solution. The main comfort type, related
to the energy efficiency is considered the thermal comfort, but also other types such as
the acoustic one are going to be calculated.

68
5.5 DER management Module
5.5.1 Overview
Renewable Energy Sources (RES) can, in most cases, do not generate power at will and
it is therefore important to invest into technologies that allow to fully harvest these
energy reserves whenever they are made available. Thus, it is necessary to utilize
methods that can make such energy sources accessible for longer periods of time and
maximize their consumption. This requires accurate forecasts about current and
estimated energy consumption, as well as measures and strategies for an adaptive and
efficient energy distribution.
There is a major imbalance between the production and the consumption of RES.
Especially in regions where a large number of RES systems are deployed, there may be
periods where wind turbines or PV-systems generate more energy than is needed or
can be consumed at the time. This can lead to instabilities within the power grid and
often requires a temporary shutdown of the RES systems. Unfortunately, this approach
results in a massively wasted RES-potentials of up to several TWh per year (e.g. 6.5 TWh
in 2019 in Germany [22]). It is therefore crucial to search for and find smart approaches
to making the power demand more flexible and more responsive.
For that, a DER management module will be developed that can transfer measured and
estimated energy levels, consumption forecasts and other relevant grid information into
a network model which projects the current grid status to calculate and display its status
in real time. This way, grid bottlenecks will be reliably detected, reported and acted
upon. Supplementary estimations of the expected loads across the grid and the
expected generation of RES are integrated, so that critical network conditions can be
predicted and mitigated by targeted switching or similar countermeasures. During
regular operation, dynamic signals are calculated for all network participants and
distributed across the network to influence the power flow, such that its proportion of
RES is maximized. Feedback loops caused by unexpected behaviour change among
consumers must be measured, detected and their impact on the network mitigated. The
field of action for the DER management module is therefore on the same level as the
microgrid controllers of the DSO’s and requires a close cooperation to execute the
corresponding circuit changes within the power grid.
5.5.2 Detailed functionalities
The following presentation of the DER-Module functionalities is based on an example
day of the small village Hagedorn in Steinheim (Westphalia) in Germany. The village has
38 houses with 103 inhabitants. There are more than 10 PV-Systems in a range of 8-
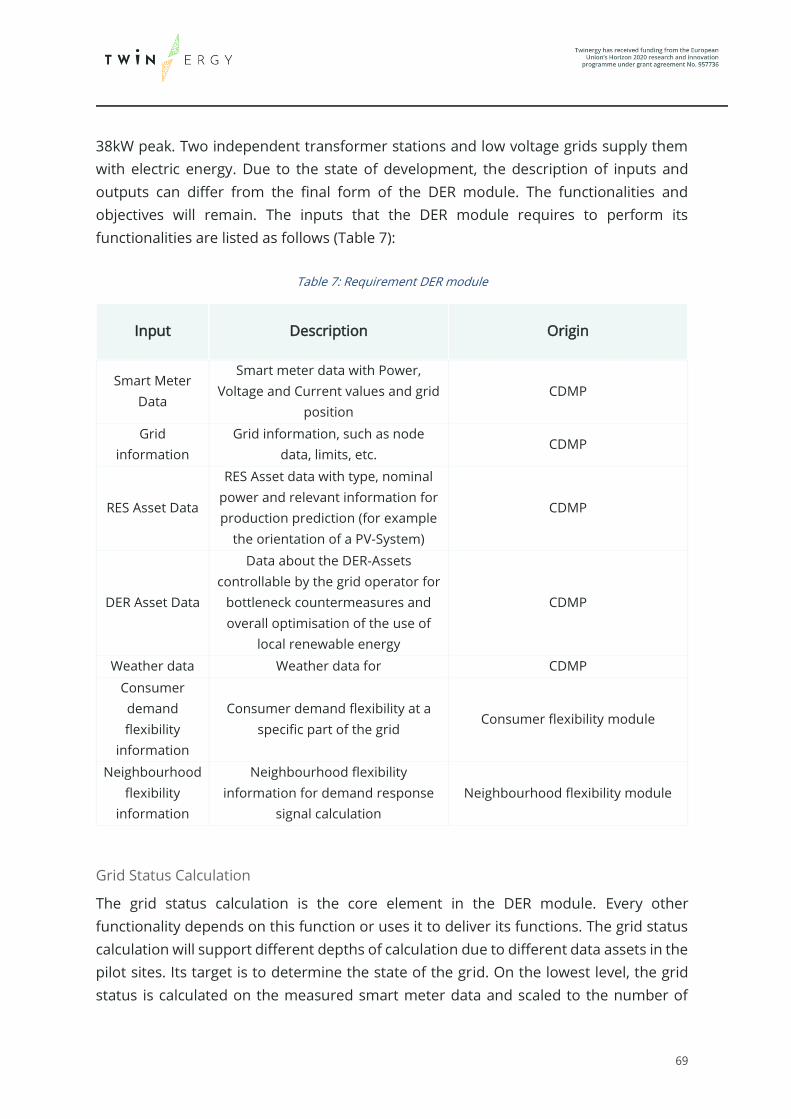
69
38kW peak. Two independent transformer stations and low voltage grids supply them
with electric energy. Due to the state of development, the description of inputs and
outputs can differ from the final form of the DER module. The functionalities and
objectives will remain. The inputs that the DER module requires to perform its
functionalities are listed as follows (Table 7):
Table 7: Requirement DER module
Input Description Origin
Smart Meter
Data
Smart meter data with Power,
Voltage and Current values and grid
position
CDMP
Grid
information
Grid information, such as node
data, limits, etc. CDMP
RES Asset Data
RES Asset data with type, nominal
power and relevant information for
production prediction (for example
the orientation of a PV-System)
CDMP
DER Asset Data
Data about the DER-Assets
controllable by the grid operator for
bottleneck countermeasures and
overall optimisation of the use of
local renewable energy
CDMP
Weather data Weather data for CDMP
Consumer
demand
flexibility
information
Consumer demand flexibility at a
specific part of the grid Consumer flexibility module
Neighbourhood
flexibility
information
Neighbourhood flexibility
information for demand response
signal calculation
Neighbourhood flexibility module
Grid Status Calculation
The grid status calculation is the core element in the DER module. Every other
functionality depends on this function or uses it to deliver its functions. The grid status
calculation will support different depths of calculation due to different data assets in the
pilot sites. Its target is to determine the state of the grid. On the lowest level, the grid
status is calculated on the measured smart meter data and scaled to the number of
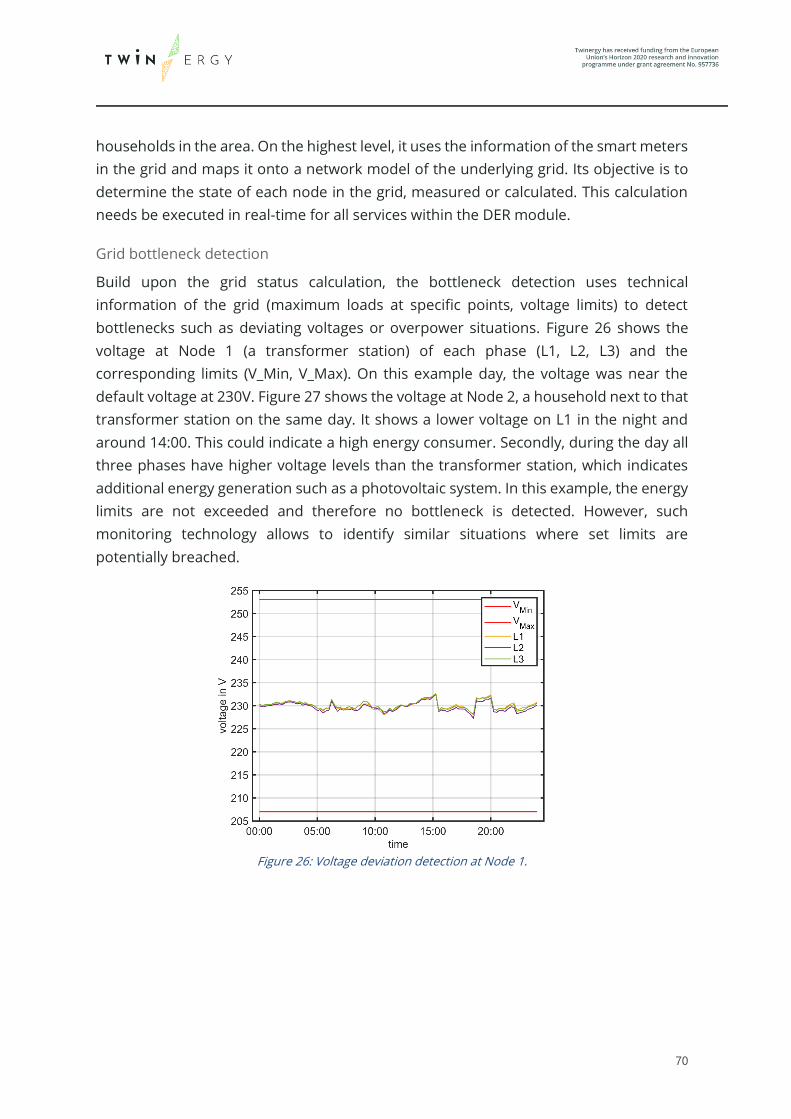
70
households in the area. On the highest level, it uses the information of the smart meters
in the grid and maps it onto a network model of the underlying grid. Its objective is to
determine the state of each node in the grid, measured or calculated. This calculation
needs be executed in real-time for all services within the DER module.
Grid bottleneck detection
Build upon the grid status calculation, the bottleneck detection uses technical
information of the grid (maximum loads at specific points, voltage limits) to detect
bottlenecks such as deviating voltages or overpower situations. Figure 26 shows the
voltage at Node 1 (a transformer station) of each phase (L1, L2, L3) and the
corresponding limits (V_Min, V_Max). On this example day, the voltage was near the
default voltage at 230V. Figure 27 shows the voltage at Node 2, a household next to that
transformer station on the same day. It shows a lower voltage on L1 in the night and
around 14:00. This could indicate a high energy consumer. Secondly, during the day all
three phases have higher voltage levels than the transformer station, which indicates
additional energy generation such as a photovoltaic system. In this example, the energy
limits are not exceeded and therefore no bottleneck is detected. However, such
monitoring technology allows to identify similar situations where set limits are
potentially breached.
Figure 26: Voltage deviation detection at Node 1.
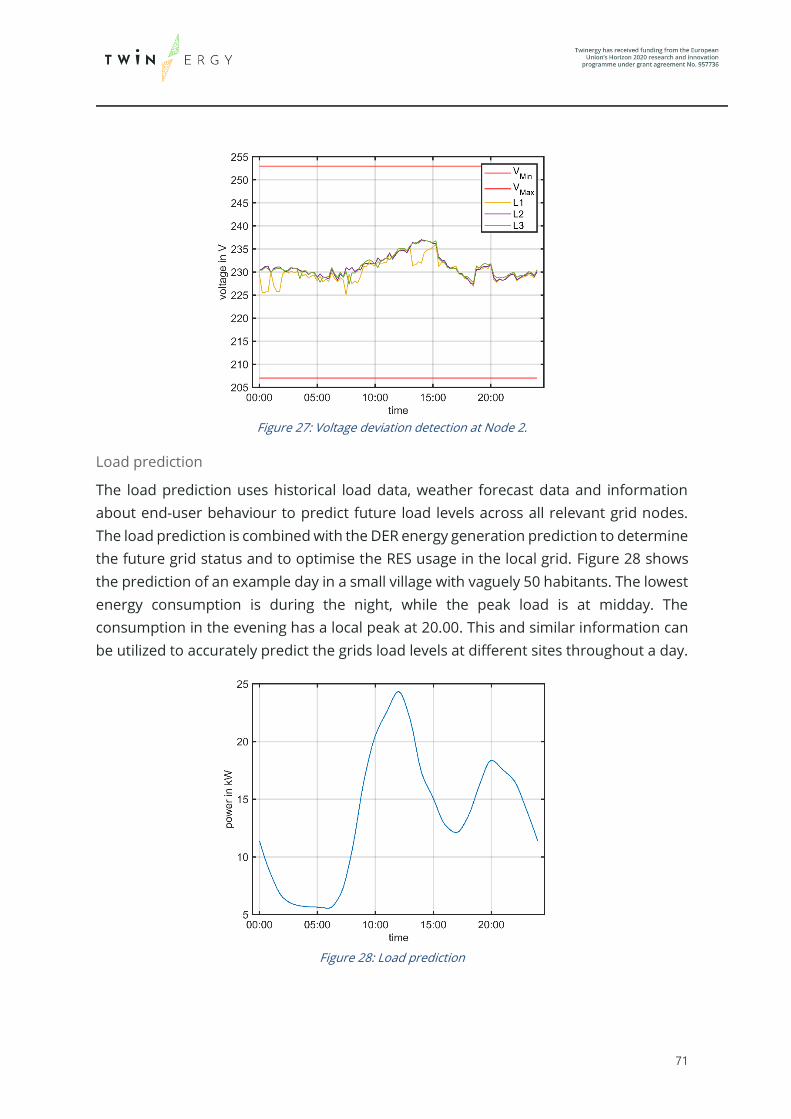
71
Figure 27: Voltage deviation detection at Node 2.
Load prediction
The load prediction uses historical load data, weather forecast data and information
about end-user behaviour to predict future load levels across all relevant grid nodes.
The load prediction is combined with the DER energy generation prediction to determine
the future grid status and to optimise the RES usage in the local grid. Figure 28 shows
the prediction of an example day in a small village with vaguely 50 habitants. The lowest
energy consumption is during the night, while the peak load is at midday. The
consumption in the evening has a local peak at 20.00. This and similar information can
be utilized to accurately predict the grids load levels at different sites throughout a day.
Figure 28: Load prediction

72
DER production prediction
Based on the local RES resources and the local weather forecast, the estimated RES
utilization and subsequent energy generation is calculated. Dependent on the
technology (photovoltaics, wind power units, biomass, combined heat and power units,
waterpower units), the DER production prediction uses different calculations. Figure 29
shows the DER production prediction on a sunny day in a small village. The generated
energy by the wind power unit is very low due to low wind speeds that are predicted by
the local weather forecast. The generated power of the photovoltaic systems on the
other hand reaches up to 125kW at 12:00 due to predicted sunshine at midday.
Figure 29: RES production prediction
Grid optimisation through public infrastructures
The demand prediction and the DER production prediction allow to predict the state of
the entire grid. This data can be used to calculate the demand from the medium voltage
grid and the share of self-consumption. With this information, public infrastructures,
such as charging stations and battery storages, can be optimised. The example village is
assumed to have a normal energy consumption at night and an energy surplus during
the day due to many deployed photovoltaic systems. Figure 30 shows a possible battery
power plan. It discharges during the night up to 5:00 and recharges during the surplus
time at midday. The charging process helps in decreasing the power surplus at the
transformer station and fills up the battery storage to have power buffers available for
local demand response. The discharging process similarly helps to stabilize the
transformer station performance by increasing the RES share of the whole village and
cover energy demands that could not have been shifted to more suitable times through
end-user behaviour. If the battery storage is empty, the energy will be provided by the
medium voltage grid.

73
Calculation of a dynamic signal for demand response
Another grid optimisation approach is enabling flexibility of the consumers within the
power grid. Utilizing the demand and RES generation forecasts, a dynamic signal is
generated to indicate to consumers at what time of day their personal energy demand
would result in the best possible RES share and grid optimisation. It uses information
gathered from profiling the flexibility by the neighbourhood demand flexibility module.
This is done by analysing the estimated power of the community after successful
optimisation and selecting the best time slots with a corresponding signal. Figure 31
shows the respective power curve at the transformer station for an optimized battery
storage. Between 8:00 and 17:00 an energy surplus is predicted and is therefore
considered to be the best time for an end-user to engage consumption. As an example,
a dynamic signal with 3 levels is shown. Level 1 indicates energy demand from the
medium voltage grid, which shall be minimized if possible. Level 2 indicates all times
where energy is drawn from the battery storage, or a small energy surplus is present.
Level 3 indicates the times where a big energy surplus is forecasted. Overall, the
consumers shall be incentivized to shift their loads from the lower to the higher level.
Figure 30: Battery storage predictive control power curve.

74
Figure 31: Dynamic signal for demand response
Feedback detection of demand response
The feedback detection uses the current grid information to measure the feedback of
the demand response by the consumers. If the feedback becomes too strong, the public
controllable devices shall react and adapt their consumption accordingly.
5.5.3 Iteration with other modules
Consumer demand flexibility profiling
The DER-Management module requires flexibility information for countermeasures on
local grid bottlenecks and local optimisation.
Neighbourhood demand flexibility profiling
The DER-Management module requires flexibility information of the neighbourhood to
calculate the dynamic signal. The flexibility information could be used for bottleneck
countermeasures if other grid countermeasures are not available.
Home and Tertiary real-time energy monitoring
The DER-Management module can provide local services (RES forecasting of a specific
building) and forecasts of the village for the H&T-Module.
TwinEV
The TwinEV-Module requires the maximum and minimum power, which the grid could
supply. This will be calculated within the grid status and bottleneck detection
functionalities. Secondly, for RES optimised charging the Module needs to know the
forecasted RES energy surplus which will be provided.

75
Transactive Energy Module
The Transactive Energy Module requires RES forecast/the dynamic Signal for consumer
to calculate the value of the consumer demand response.
5.6 Risk Management and event handling Module
5.6.1 Overview
The Risk Management and event handling Module developed inside TwinERGY aims to
identify the security gaps, supports the security operation planning and management
and helps draw up the adequate preventive actions and countermeasures. The module
is based on new analysis techniques that can better consider threats that are based not
on individual component failures but on systems theory. In cooperation with UoP, STAM
will develop a Risk Management and event handling tool with the aim to minimize the
overall risk on the TwinERGY system in a cost-benefit perspective.
The module will be composed by two main sub-modules. The first one will allow
performing of a secure operation planning and management, evaluating the possible
threats and the corresponding impacts associated to a series of unplanned events on
the low level of the grid. According to the outcomes of this first analysis, the second sub-
module will allow to evaluate a series of preventive actions and countermeasures to
mitigate the expected impacts and minimize the overall risk on the system in a cost-
benefit and a consumer-oriented perspective. The module will be designed to cover risk
down to asset and customer levels. In the context of the project, the Risk Module covers
a range of features such as:
• Anomaly patterns Detection
• Fault Anomaly Detection
• Communication and cyber events detection
The actors that could contribute to the smooth operation of the module are listed as
follows:
• Energy final users
• VPP operator
• Retailer
• DSO operator

76
5.6.2 Detailed functionalities
Risk Management - Scenario Evaluation
Based on the event historical records provided by the pilots or the record collected
during the TwinERGY project, a statistical analysis will be carried out. The probability of
different scenario will be targeted, and the risk evaluated. Also, existing
countermeasures and possible new countermeasures related to the DR will be include
in the analysis.
Anomaly patterns Detection
The anomaly detection functionality helps building managers to identify tenant
consumption patterns. Anomaly detection benefits tenants by helping them
understand how their home actively consume energy. They can then modify their
anomalous activities, analyse energy consumption costs and benefits, and eventually
reduce their wasteful activities.
Fault Anomaly Detection
Comparing a set of typical power consumption patterns with real the monitored
consumption curves, anomalies and faults of the main single appliances (such as the
heat pump) will be detected. Also, parameters related to the power supply such as,
range of voltage and frequency, are going to be taken into account as Power Quality
matters.
Communication and cyber events detection
This functionality indagate the consistency in the communication flows between
sensors, appliances, gateway, and the user by the remote interface. The presence of
cyber-threats and security lacks will be underlying. The preventive measures, the
consequences and the possible countermeasures will be analysed and selected inside a
cost-benefits framework. The inputs that the Risk Management module requires to
perform its functionalities are listed as follows (Table 8):
Table 8: Input requirement for the Risk Management Module
Input Description Origin
Energy Demand Active energy demand
monitored for different
aggregation level (Entire
CDMP and M4

77
facility/power lines/single
appliance)
Demand forecast Forecast of demand over the
next 24 hours or more
M2
Building supply max.
power
Maximum power to be
delivered simultaneously,
considering, demand and
production.
CDMP
Building supply min.
power
Minimum power to be received
simultaneously (Base load)
CDMP and M4
Peak_Demand_Power_line Peak demand of power lines
monitored in the electrical
panel
CDMP and M4
Reactive_energy_loads Reactive energy of single
appliances monitored
CDMP and M4
Reactive_energy_lines Reactive energy of power
lines in the electrical panel
CDMP and M4
Power_factor Power factor of the power
lines in the electrical panel
CDMP and M4
Sub_net_state Information regarding the
relevant risk indicators of
each element of the sub-grid
M5
Countermeasures Set of controls to be applied
on a specific sub-grid in a
certain timespan as possible
countermeasures
M6 and M5
5.6.3 Iteration with other modules
H&T Energy monitoring system
This module is being developed by STAM. This module will gather the energy data
provided by the pilots. The energy patterns will be analysed in order to find anomalies
also in relation with the DR action and possible DR countermeasures.
DER management
This module is being developed by TH-OWL. This module requires the maximum and
minimum power to be supplied considering, non-controllable demand, production, and
EVSE-related demand. DER management module is set to provide grid status
functionalities such as the expected load and generation in the grid, as well as the grid

78
status calculation in real time. This valuable information from the grid status is being
used in the Risk module as well.
5.7 TwinEV Module
5.7.1 Overview
As explained in Chapter 3, TwinEV module is going to be designed to calculate the
optimal State of Charge on EV in terms of minimization of costs and maximization of
green electricity to supply. This optimization would be considering the huge potential in
terms of flexibility that EV can provide to report benefits to the grid management, in
terms of grid congestion management, ancillary services, peak shaving and energy
buffering to gather the RES intermittency. In addition to this, EV would be considered to
act as a battery (V2G capacities). All these functionalities would be addressed to the EV
user through the distribution of a user-friendly interface which it is going to be fully
depicted at T7.6 “TwinEV module”. Through it, the EV user can perform an optimized
charging process for its EV, based on the principles of security and quality of energy
performance.
The module will allow the EV driver the selection of a suitable public charging station in
which they can proceed with the charging process. The selection of the charging point
can be specified based on factors such as dynamic pricing, route cost to the station,
arrival times and amount of battery. In addition to this, the module would let EV users
to handle the booking of the charging point as well as proceed with the payment of the
charging process. The result of this charging process could have a direct impact on the
grid management (Voltage and Congestion control), as well as the implementation of
RES into the grid. Furthermore, V2G capabilities would affect the development of grid
processes [15].
On the other hand, EV in the private field could be used as a distributed storage asset
that with the integration to Local flexibility Markets and Demand Response Campaigns
within the context of TwinERGY project. TwinEV would help in this case in the
assessment of a Smart Charging profile for EV, taking into account Demand Response
campaigns from the domestic field. In the context of the project, TwinEV covers a range
of features such as:
• Smart Charging of EV
• Vehicle-to-grid
• Demand Response Campaigns
• Participation in Energy Markets

79
• Participation in Local Flexibility markets
• Voltage Control and Grid Congestions through DSO
• Integration of RES and surpluses
• Reduction of CO2 emissions
The actors that could contribute to the smooth operation of the module are listed as
follows:
• EV user
• End consumers (MV/LV) / Prosumers
o In the case of private charging case, the EV user and End user will be the
same figure.
• Charging Point Operator (Aggregator, Customers, Business…)
• VPP operator
• Retailer
• DSO operator
5.7.2 Detailed functionalities
The main purpose of this section is to define the TwinEV module functionalities within
the TwinERGY solution. These functionalities, as commented before, are based on the
different objectives in TwinERGY Modules. The scenario depicted by the TwinEV is:
• Login for end-users in which EV users would be able to log into the module to
access the application.
• Creation and configuration of an account in which EV users are able to define
their device to use data for booking, charging sessions and payment.
• Find the most suitable charging point getting a ranking for the most suitable
station.
• Booking a charging station for a future charging session.
• Handling of the charging session process
• Smart charging
These specific functionalities are going to be further explained as follows within a brief
description. Nevertheless, this module is going to be further developed at Task 7.6
“TwinEV Module”.

80
Login and end-users
Regardless of whether the EV users are going to use a public charging point or a private
charging point, EV users will be able to login into the TwinEV platform to access the rest
of the functionalities that the module can provide. The access to the module is done by
a username and an assigned password. This first screen is linked to the next
functionality, which is the creation of an account. Furthermore, it will allow the reset of
the password if the user can no longer remember it. Down below, (Figure 32) presents
the screen to the first approach to the mock-ups of the TwinEV module regarding this
functionality. On one hand, the login part is intended to check the username and the
encrypted password and return a session token if the call has been successful. On the
other hand, resetting the password generates a new one that is sent by an email.
Creation and configuration of the account
The creation of the account is going to be a prerequisite to use the services and
functionalities presented at TwinEV module. This functionality is able to check the data
in the creation form and returns a true value when the account has been created and
validated. On the other side, the configuration of this account is performed in a
separated section of the module. The user is required to provide a configuration for its
account. Each EV user must define information for its vehicle’s data such as battery
information, type of vehicle, and V2G features. Furthermore, the user is asked to provide
the selection of the payment mode.
Figure 32: Mock-up for the TwinEV login

81
Find the most suitable charging point
Based on the current position from the EV, users can search charging stations near their
current position. The available charging stations are ranked based on a parameter set
such as the movement expenses to reach the charging point, the energy price, the queue
time to charge, the expected State of Charge, the availability of the charging point. Down
below (Figure 33), it is presented the Mock-up for this TwinEV functionality.
The user is required to identify the desired charging time that he/she has available for
the charging process. In addition to this, both the current and desired battery level are
inputs for the part of this part of the module.
Booking a charging station
This part of the module will allow EV users to book a charging point for a charging
session. The available stations to charge will be presented to the user. Based on some
of the dynamic inputs that the user could provide, such as the moment of charge, the
desired and current battery level, the EV user is able to book a charging slot within the
Figure 33: Mock-up for the search of stations

82
selected charging station. In Figure 34, it is presented the different mock-ups for this
part of the module.
Handling of the charging session process
Once the charging session has been booked, the EV user can start its charging process.
This part of the module indicates the part the status of the charging session, providing
useful information to the EV user regarding the process of charging.
Figure 34: Mock-ups for the booking section

83
Down below (Figure 35) it is shown the proposed firsts Mock-ups for this part of the
TwinEV module:
The management of the payment process it is an interesting aspect that should be
implied within the charging session module. It is important to stablish the relevant
channels to perform the process of payment of the public charging session.
Smart charging
The purpose of this functionality is to introduce the concept of intelligent charging and
how the TwinEV project is going to cope with it. TwinEV module is going to receive
important data from both other modules and the system deployed within pilots to
optimize the energy consumption in the charging operation. The amount of energy will
vary on aspects and restrictions that the Charging Points will directly encounter. TwinEV
is able to calculate the optimum charging profile for a recharge. This represents the
amount of power that should be delivered to a concrete charging session at a concrete
moment. This calculation will be based on TwinEV algorithms that would adjust both the
inputs from the system and the user preferences which have been compiled in the
previous explained functionalities.
As referenced before, the SMAC requires a set of inputs to calculate the optimal charging
profiles for a specific charging session. These inputs listed in the following table (Table
9)
Figure 35: Mock-ups for the Charging Session information

84
Table 9: Requirements TwinEV
Input Description Origin
Demand forecast Forecast of demand over the next
24 hours
Module
Production
forecast
Forecast of production over the
next 24 hours
Module
Supply point
max. power
Maximum power to be delivered
simultaneously, considering, non-
controllable demand, production
and EVSE-related demand
Module
Supply point min.
power
Minimum power to be received
simultaneously, for V2G operations
Module
Energy price Curve of energy price for cost
optimization
Module
EV battery
capacity Capacity of the EV that is charging
Module
EV SoC Battery SoC of the EV that is
charging
Module
Nominal power
of connectors
Max. power the connector is able
to deliver
CDMP
Nominal
discharge power
of connectors
Max. power the connector is able
to receive, for V2G operations
CDMP
Target slots Time when EV is required to be
charged
Module
Target SoCs Minimum SoC required by the EV
at the target slot
Module
Flex. Order
Support operations to the grid
consisting of modifications on the
supply point power flow limit
(either upper, allowing greater
Module

85
demand, or lower, imposing
demand limitations).
Opportunity cost
Additional cost considered to
disincentive long-lasting charging
sessions
Module
Based on these inputs, the algorithm will be able to optimize the charging profile, in
terms of minimization costs and RES integration. The origin of this inputs can be either
from other screenshots in the TwinEV module, information from the pilot’s asset or
derive from other modules. The last one is going be explained in the forthcoming
section.
5.7.3 Iteration with other modules
TwinEV module is expected to interact with other modules and its calculations to obtain
valuable data sets for its own interest. Based on Table 9, TwinEV is going to be describing
the main iterations with some of the modules that have been of interest to the
functionalities of TwinEV.
Consumer and Neighbourhood demand flexibility profiling
These two modules are being developed by IES. Based on the TwinEV functionalities
beforementioned, the module requires a set of information that would be valuable for
the development of the module. TwinEV requires the Forecast Energy consumption at
both a domestic and a Neighbourhood level. These predictions would allow to
determine the expected demand profile within a period. This is a valuable input that
would contribute to the calculation of the algorithm. Furthermore, the optimization
algorithm is required to have as an input the production forecast within the following
24 hours. Consumer and Neighbourhood demand flexibility profiling have identified
some functionalities that can be run with the aid of calibrated models in the scoop of
the domestic field that can provide the predictability of the forecasting of energy at a
given time. In addition to this, the Neighbourhood demand flexibility profiling can
predict the renewable generation for a given period based on the capacity available and
the weather forecast.
DER management
This module is being developed by TH-OWL. Based on TwinEV requirements, this
module requires the maximum and minimum power to be supplied considering, non-
controllable demand, production, and EVSE-related demand. DER management module
is set to provide grid status functionalities such as the expected load and generation in

86
the grid, as well as the grid status calculation in real time. This valuable information from
the grid status is being used in TwinEV module so as to provide the optimal charging
profile to EV users.
Transactive Energy
This module is being developed by WEC. This module is a trading decentralised platform
what would serve novel block-chain enabled transactive market. Since the TwinEV is
going to allow the charging of EV in public infrastructures, TwinEV is going to make use
of the TE module since a financial transaction may be required. In addition to this,
TwinEV module would perform an optimization for the charging curve in which the price
of energy is required. TE module is expected to provide these prices to TwinEV module.
Furthermore, VE consume energy from the grid. This energy consumption could greatly
benefit from the Transactive Energy module. V2G functionalities are expected to be
proven within the context of the project. For that purpose, it is expected also an energy
transfer from the EV to the grid. This module is aimed to be helping through this process.
5.8 Social Network Module
5.8.1 Overview
As explained in Chapter 3, social network module is going to be designed to enhance
the engagement of residential households by providing comprehensive dashboards to
present households’ consumer profiles, by providing breakdown analysis per device -
when applicable. The social network module will provide a web-based interface which
will provide a comprehensive dashboard for the monitoring of consumption/production
profiles aggregated at device level along with information/status regarding potential
shared assets with the aid of Digital Twin Platform. There will be specific graphs to
present the energy saving of end-users. The main objective of the module will be to act
as a social comparison tool by comparing the energy use between several neighboring
end-users focusing particularly on the individuals own behavior which to some extent
has implication on the consumption regular profile. The social comparison will also lead
social competition among within the community or the neighborhood providing
rewards (i.e., TwinERGY points) to the participating households. The competition will be
performed based on gamification functionalities which in turn will be relying on specific
KPIs such as energy efficiency, participation on the local community, utilization of shared
assets etc., as a matter of providing the corresponding rewards.
The social network module will rely its design and implementation on well-established
application developed in the frame of ChargED [18] project that was further updated in
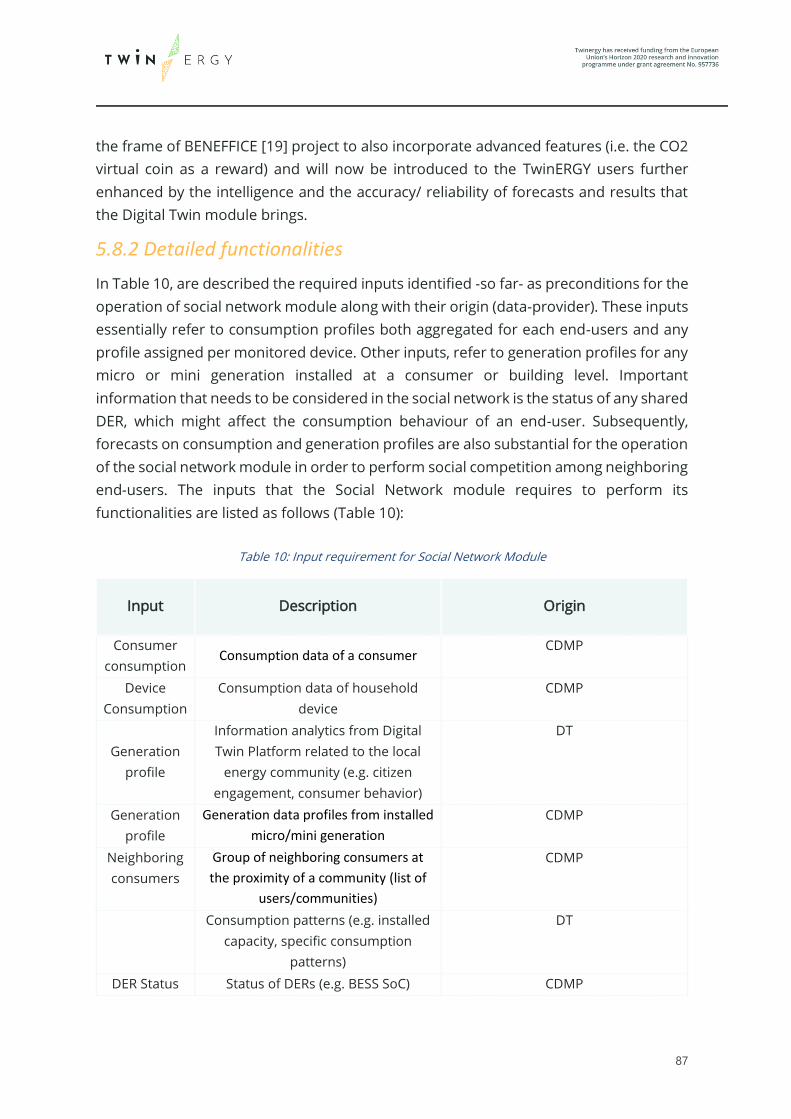
87
the frame of BENEFFICE [19] project to also incorporate advanced features (i.e. the CO2
virtual coin as a reward) and will now be introduced to the TwinERGY users further
enhanced by the intelligence and the accuracy/ reliability of forecasts and results that
the Digital Twin module brings.
5.8.2 Detailed functionalities
In Table 10, are described the required inputs identified -so far- as preconditions for the
operation of social network module along with their origin (data-provider). These inputs
essentially refer to consumption profiles both aggregated for each end-users and any
profile assigned per monitored device. Other inputs, refer to generation profiles for any
micro or mini generation installed at a consumer or building level. Important
information that needs to be considered in the social network is the status of any shared
DER, which might affect the consumption behaviour of an end-user. Subsequently,
forecasts on consumption and generation profiles are also substantial for the operation
of the social network module in order to perform social competition among neighboring
end-users. The inputs that the Social Network module requires to perform its
functionalities are listed as follows (Table 10):
Table 10: Input requirement for Social Network Module
Input Description Origin
Consumer
consumption Consumption data of a consumer
CDMP
Device
Consumption
Consumption data of household
device
CDMP
Generation
profile
Information analytics from Digital
Twin Platform related to the local
energy community (e.g. citizen
engagement, consumer behavior)
DT
Generation
profile
Generation data profiles from installed
micro/mini generation
CDMP
Neighboring
consumers
Group of neighboring consumers at
the proximity of a community (list of
users/communities)
CDMP
Consumption patterns (e.g. installed
capacity, specific consumption
patterns)
DT
DER Status Status of DERs (e.g. BESS SoC) CDMP
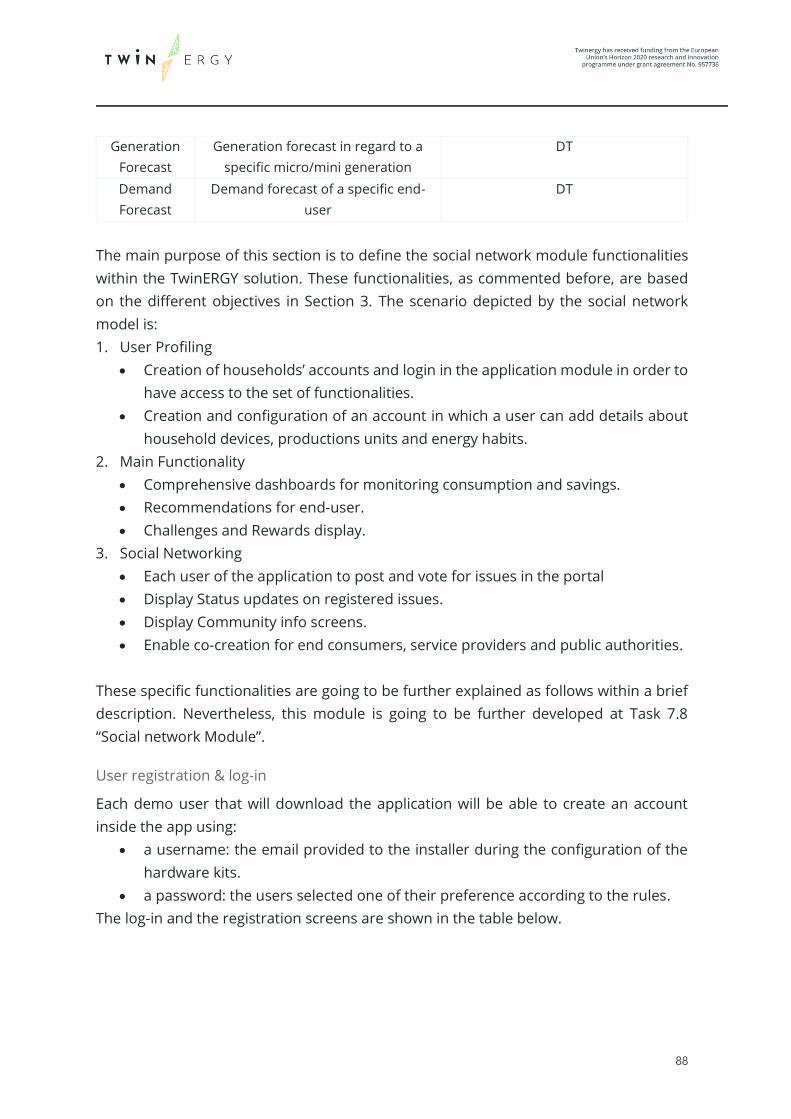
88
Generation
Forecast
Generation forecast in regard to a
specific micro/mini generation
DT
Demand
Forecast
Demand forecast of a specific end-
user
DT
The main purpose of this section is to define the social network module functionalities
within the TwinERGY solution. These functionalities, as commented before, are based
on the different objectives in Section 3. The scenario depicted by the social network
model is:
1. User Profiling
• Creation of households’ accounts and login in the application module in order to
have access to the set of functionalities.
• Creation and configuration of an account in which a user can add details about
household devices, productions units and energy habits.
2. Main Functionality
• Comprehensive dashboards for monitoring consumption and savings.
• Recommendations for end-user.
• Challenges and Rewards display.
3. Social Networking
• Each user of the application to post and vote for issues in the portal
• Display Status updates on registered issues.
• Display Community info screens.
• Enable co-creation for end consumers, service providers and public authorities.
These specific functionalities are going to be further explained as follows within a brief
description. Nevertheless, this module is going to be further developed at Task 7.8
“Social network Module”.
User registration & log-in
Each demo user that will download the application will be able to create an account
inside the app using:
• a username: the email provided to the installer during the configuration of the
hardware kits.
• a password: the users selected one of their preference according to the rules.
The log-in and the registration screens are shown in the table below.
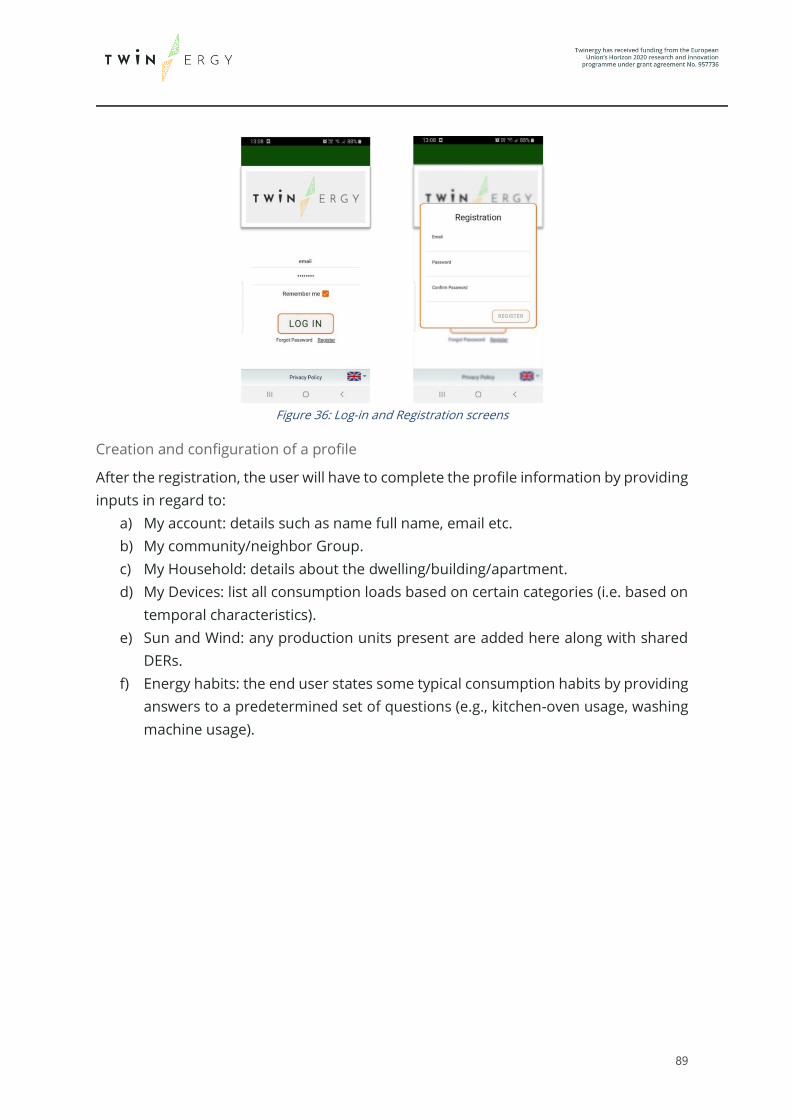
89
Figure 36: Log-in and Registration screens
Creation and configuration of a profile
After the registration, the user will have to complete the profile information by providing
inputs in regard to:
a) My account: details such as name full name, email etc.
b) My community/neighbor Group.
c) My Household: details about the dwelling/building/apartment.
d) My Devices: list all consumption loads based on certain categories (i.e. based on
temporal characteristics).
e) Sun and Wind: any production units present are added here along with shared
DERs.
f) Energy habits: the end user states some typical consumption habits by providing
answers to a predetermined set of questions (e.g., kitchen-oven usage, washing
machine usage).

90
Figure 37: Profile’s tabs
Comprehensive dashboards for monitoring consumption and savings
Screenshots of the Energy Dashboard screen are shown in the Figure 38 below:
Figure 38: Energy Dashboard Screens (Consumption, Savings)
In the Energy Dashboard screen the user can view the total daily, weekly or monthly
cumulative consumption per pre-defined time frames within the day, week or month

91
(“Consumption” tab). The orange dotted line above each graph is the indication of the
daily, weekly and monthly baseline respectively. The user should keep the consumption
below the dotted line in each case in order to achieve savings. The user has also to
option to view the daily, weekly or monthly savings simply by pressing the “Savings” tab.
In addition, the user by clicking to the “info” icon, will be presented with a description
of what it is shown in each diagram. In the Energy Dashboard the user will have the
option to click on the “More” button at the upper right side of each graph in order to see
more detailed information regarding his/her consumption in the “Energy Details”
screen. In the Energy Details screen – Overview tab, the user can select to view daily,
weekly or monthly consumption. There will be also some comparisons available with the
daily, weekly or monthly average consumption or the consumption from the last day,
week or month. The green arrows show reduction in the consumption while the red
arrows show increase in the consumption.
Figure 39: Energy Details screen (Overview tab: daily, weekly, monthly)
In the Energy Details screen– Device’s tab (Figure 40), the user will view the results of a
disaggregation algorithm and how the total consumption is distributed (in %100
percentages) in multiple different categories of devices such as:
a) HVAC systems (e.g. air-condition, electric heater, electric radiator, etc.)
b) Freezers and refrigerators
c) Water Heaters and Boilers
d) Finite state machines (e.g. fan, humidifier, iron, coffee maker, hairdryer, vacuum
cleaner etc.)
e) Washing machines (e.g. for clothes, for dishes, dryers, combo washer dryers
etc.)

92
f) On/Off devices (e.g. waffle maker, saver, trimer, TV, toaster etc.)
g) Kitchen related appliances (e.g. oven, stove, microwave)
h) Continuously varying devices (e.g. laptop, desktop PC, PS4, Xbox etc.)
i) Electric vehicles
The user by pressing in each one of the categories can see more information on each
category (what kind of devices this category includes and the total consumption in kWh)
for the respective day, week or month of his preference.
Figure 40: Energy Details screen (Devices tab)
In the Energy Details screen – Graphs tab, the user can see useful graphs related to a)
his/her daily, weekly, monthly consumption, b) the consumption per device category
(daily, weekly, monthly) and c) a pie chart with the percentage consumption per device
category (daily, weekly, monthly).
Challenges and rewards display
The user will be able to see a ranking based on certain KPIs (e.g., energy-efficiency, DERs
utilization, off-peak consumption) considering neighbouring end-users’ behaviour. The
user will be able to view in the “Badges” tab the list of available badges and their status
(which are already won and which not). The user by pressing the “More” button can view
more information regarding the badges, how he/she can win each badge from each
category and the amount of TwinERGY Points to be won with each badge.

93
Display Community info screens
The social network module will also provide the capability to the end-user to have an
overview of the status and the patterns (i.e. forecasts and historical data) of the shared
assets and DERs of a community. This particular functionality will be steered by the
Digital Twin Platform which will provide all the necessary data to be previewed in these
dashboards.
Enable co-creation for end consumers, service providers and public authorities
The social network platform will also provide an interface to enable the co-creation
among several different neighbouring end-users and flexibility actors. This particular
functionality will provide the capability to coordinate requests of the community and
resolve them in an efficient manner via upvoting/downvoting. Each might be able to take
the chance to support a request by earning multiple TwinERGY points.
Generic Functionalities
The social network platform will also provide generic functionalities such as:
• Notification alerts related to user/group activities.
• Main dashboard (central navigation point).
• Social Tools (follow user/post comment/like comment/connect).
• Public User Profile.
• Main directory.
• Public access content functionality (share content with non-registered users)
• Search functionality.
5.8.3 Iteration with other modules
The social network module needs to get continuous consumption data from:
1) household devices
2) smart metered data
3) generation data profiles from installed DERs.
Such data may be requested by the Digital Twin Platform along with the modules:
• Neighbourhood demand flexibility profiling and
• Home & Tertiary real-time Energy Monitoring.
The social network module will obtain information regarding group of neighbouring
consumers at the proximity of a community (list of users/communities) information
which possibly may be provided by Home & Tertiary real-time Energy Monitoring
module.

94
The social network module in order to support the consumers to achieve co-creation
activities need to have information regarding shared DERs in community such as
Current or forecasted status of community Battery, PVs; this type of information may be
request by the Digital Twin Platform along with the DER management module. The
outputs of the social network module such as recommendations for consumption,
challenges amongst end-users and user rewards aim to have a direct impact on the end-
users’ behaviour either as an individual process or through the integration with another
module It is not clear though which of the modules might take advantage of such
outputs. So far, within the activities of T7.1 there were no requests identified from other
modules to consider the social-network module’s outputs.
5.9 Transactive Energy Module
5.9.1 Overview
Transactive Energy Module enables grid decentralization and democratization by
connecting the micro-grid operators to the DER managers and their customers. It aims
for an integrated energy business model through energy service expansion, customer
engagement and financial inclusion. It allows them to balance the grid and provide
solutions to a several grid problems, such as grid power quality and reliability. The core
of this use case is a transactional platform that offers its participants to sell their flexible
energy loads and excess capacity on an open market to the (micro) grid operators or to
each other. Microgrid operators provide balancing and grid services at a local and micro-
grid level. A micro-grid could be a collection of a) IoT devices, b) buildings, c)
neighbourhoods/substations, and d) regions that operate at a regional level to balance
multiple neighbourhoods, districts and/or substations. It could potentially include the
high voltage grid. Each component of the system (e.g., device, building, neighbourhood,
distribution grid and transmission grid) is a self-contained ecosystem, replicated and
nested within the next layer of the system, like in a fractal configuration. All components
operate with identical information and control models and each have operational
decision-making capabilities. This platform offers a path to grid decentralization, energy
democratization, and a way to effectively leverage and monetize the emerging DER
infrastructure.
The Transactive Energy Module (TEM), based on Hybrid Blockchain technologies will be
developed to solve current intractable optimization problems and create a premiere
Transactive Energy (TE) protocol layer settlement process, marketplace, and governance
framework to allow energy-related Apps to be written and interoperate with each other.

95
Through the application and study of this Use Case in two of the TwinERGY project pilot
sites (Bristol in the United Kingdom and Benetutti in Italy), grid infrastructures would be
analysed to implement state-of-the-art equipment that can monitor and track energy
consumption and distribution. Pilot sites, consisting of apartment buildings and
individual houses will be equipped with smart meters, EV charging points, local and
public storage facilities and IOT devices such as smart plugs. These are integrated with
the Transactive Energy Module giving prosumers a powerful insight of their power
consumption and redistribution to the local energy market (LEM).
The TEM will allow for prosumers to buy and sell energy from the LEM. It will also allow
TE participants to transact in a P2P configuration outside an organized LEM/DSO or an
ISO/TSO market. These transactions are stored as an immutable record on the
blockchain specifying the actors participating in the transaction and the origin of the
energy. To further support the LEM, the TEM will process and broadcast price
forecasting of the DNO and LEM. Other TwinERGY modules will be able to listen to the
broadcast and make energy consumption or discharge decisions on behalf of the
prosumer.
For non-ISO/TSO and non LEM/DSO organized energy market transactions one pricing
option could be to use a double-sided market in which TE participants pay a unique price
based on their preferences and local supply and demand conditions (analogous to the
stock market). Another option could be to use a proxy market price using a reference
market price of the LEM organized market or the ISO/TSO market, (e.g., the 5-minute
real-time auction price.
5.9.2 Detailed functionalities
Within the context of TwinERGY, the main objective of the TEM is to record and validate
the various transactions using DLT technologies. Various transactions, as already
described in the previous section, will be completed between the participants. Due to
the limitations of the physical infrastructure of the pilot sites in which the TEM is being
deployed, some of the functionalities under study cannot be tested. The TEM will focus
on creating functional prosumer accounts, creating relations with IOT devices and
record energy transactions within the confines of what is possible with the available
equipment and infrastructure. This will include transactions from PV systems and
batteries to the main grid. Where possible, transactions as a result of flexibility
responses will also be recorded to reflect a cost saving. In addition, the TEM will use an
algorithm to calculate the pricing of the LEM. The price will be based on external DSO
pricing, battery SOC and load forecasts. In Table 11 the different inputs for the
Transactive Energy module are being defined:

96
Table 11: Input requirement for Transactive Energy Module
Input Description Origin
DSO pricing
TEM receives day ahead prcing from
DSO’s and processes this data in the
TEM algorithm to calculate LEM
pricing
External sources
Prosumer
account
TEM receives a signal that a new
prosumer has joined the ecosystem
and creates a dedicated prosumer
account in the TEM
CDMP
Device ID
TEM receives a signal that a new
device has joined the ecosystem and
rather this device has a relation to
one or more prosumers
CDMP
Consortium
ID
TEM receives a signal that a new
consortium is formed. For example,
where a new public battery is installed
CDMP
A number of algorithms have already been proposed regarding the financial settlement,
social incentives and the rules of the economic transactions. Using the TEM, small scale
DER owners actively participate in the wholesale energy market, which was practically
prohibitive before in many EU countries. The granularity of the proposed market largely
depends on how often the system is updated and new data generated. The required
data for the implementation are described in detail below:
• Market data: Retail prices of the grid (feed in/ feed out). For every time interval
the internal TEM price should be compared to the retail price of the grid.
• Generation data: Forecasted and real data measurements of assets which
produce energy in a LEM (e.g rooftop PV panels)
• Consumption data: Forecasted and real data measurements of the aggregated
load inside a building. Information of flexible loads (e.g HVAC, electric water
heater) is also required for providing demand response services.
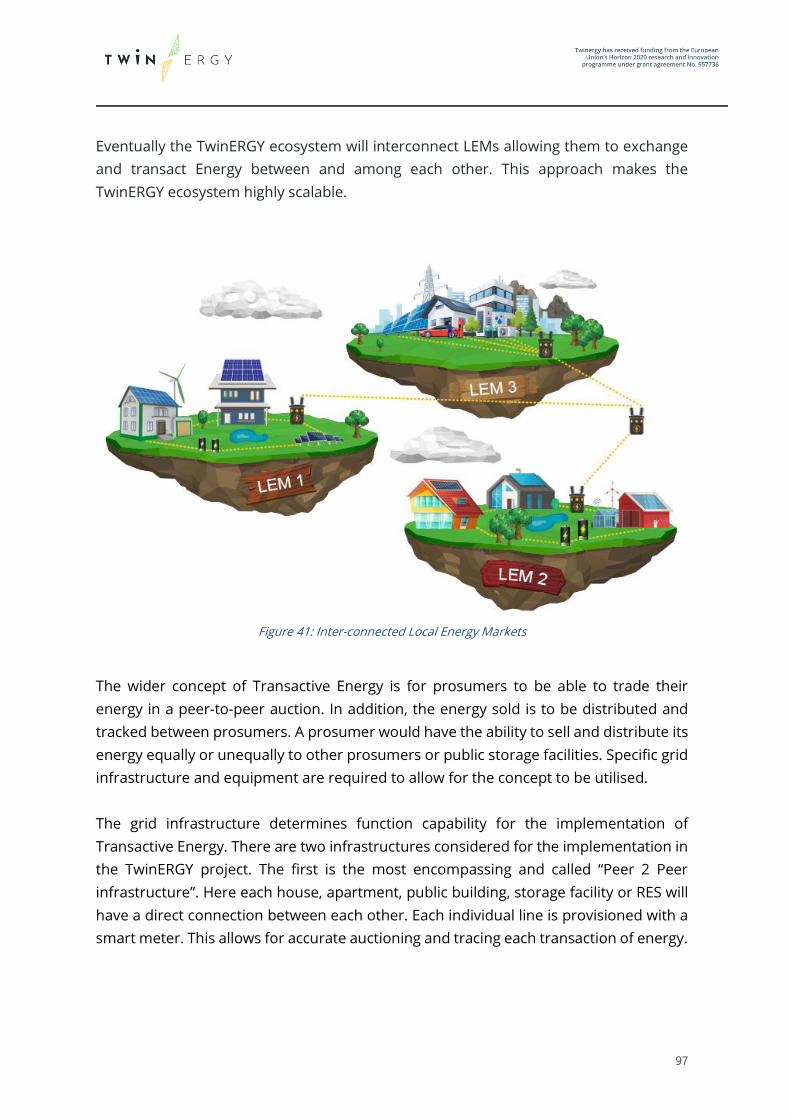
97
Eventually the TwinERGY ecosystem will interconnect LEMs allowing them to exchange
and transact Energy between and among each other. This approach makes the
TwinERGY ecosystem highly scalable.
Figure 41: Inter-connected Local Energy Markets
The wider concept of Transactive Energy is for prosumers to be able to trade their
energy in a peer-to-peer auction. In addition, the energy sold is to be distributed and
tracked between prosumers. A prosumer would have the ability to sell and distribute its
energy equally or unequally to other prosumers or public storage facilities. Specific grid
infrastructure and equipment are required to allow for the concept to be utilised.
The grid infrastructure determines function capability for the implementation of
Transactive Energy. There are two infrastructures considered for the implementation in
the TwinERGY project. The first is the most encompassing and called “Peer 2 Peer
infrastructure”. Here each house, apartment, public building, storage facility or RES will
have a direct connection between each other. Each individual line is provisioned with a
smart meter. This allows for accurate auctioning and tracing each transaction of energy.

98
Figure 42: Peer 2 Peer infrastructure
The second model is called “Pooled infrastructure” where Prosumers and RES
distribute energy in a pool which is then equally shared with all participants. The
limitation of this approach is that it is only possible to measure and trace energy
distributed to the pool or from the pool. When energy is consumed from the pool it is
not possible to trace the origin which in turn eliminates the possibility for the
implementation of auctioning and dynamic pricing between prosumers.
Figure 43: Pooled infra structure

99
VPP Creation and Market Participation
As DERs proliferate and opportunities for active or flexible demand grow, “Aggregators”
of these resources (or DER Aggregators or DERA) for the creating of the VPPs have the
potential to help unlock the value of distributed resources and bring them into energy
markets at scale. Aggregation is defined here as the act of grouping distinct agents in a
power system (i.e., consumers, producers, prosumers, or any mix thereof) to act as a
single entity when engaging in power system markets (whether wholesale or retail) or
Transactive Energy trading.
Today’s VPPs offer an ideal optimization platform for providing the supply and demand
flexibility needed to accommodate the fast-ramping needs of renewables, to balance
wind and solar intermittency and to address corresponding supply forecast errors. For
example, if one wind power source generates more energy than predicted and another
generates less, a VPP will balance the two, resulting in a more accurate forecast. In
addition, the wind power becomes a more reliable source of capacity in the market.
Often, in energy markets, market participants fire up large and less efficient power
plants to grapple with small gaps in demand. They may deploy a 600-MW gas plant when
only 5 MW is needed. With a VPP, when the DSO/TSO asks for 5 MW, the VPP will do two
things. It will look for places to reduce load, so the system may not need all of the 5 MW.
It will also look for places where it can self-generate electricity by discharging batteries,
or dispatching wind or solar facilities.
VPPs incorporate short-term load, distributed generation forecasting and aggregation
capabilities. They perform near real-time shifting of commercial and residential net
loads to provide the services needed by the grid. Under the control of a VPP, demand
on the system can be optimized and tweaked automatically, making day-ahead call-outs
a thing of the past. VPPs have the ability to go beyond simple load curtailment and to
leverage continuous communications and bi-directional control to deliver dispatchable
grid support. As a result, aggregated DERs can be orchestrated by VPPs with second to
minute response speeds. By design, VPPs can coordinate and control more efficient and
clean sources of distributed energy so there is no need to overbuild or deploy fossil-fuel
plants to balance electric demand and supply. The objective is to feed an automatic
generation control signal to VPP that indicates the DSO/TSO’s needs a certain amount
of capacity at a certain point in time. The system can then go get that capacity within the
bounds of what is currently available, at a specified confidence range, such as 2 MW with
95% confidence or 3 MW at 70% confidence. [23]

100
The objective of the VPP design we propose is to develop a demand side reserve
resource consisting of an aggregated large number of devices that can curtail entirely or
partially segments of subscribed loads for limited duration of time. We focus on small
loads at the scale of individual appliances, household or buildings which would
otherwise not be deployable as demand side resources by the system operator due to
their large number and informational requirement or not meet availability criteria for
participating demand response (PDR) due to uncertainty of the active energy used at
any particular point in time. We characterize controllable demand in terms of capacity
increments and account for the uncertainty of harvested energy resulting from
curtailment of such capacity segments.
A key aspect of controllable load segments is the uncertainty of energy yield resulting
from curtailment. The design we propose is based on aggregation large number of such
devices into a portfolio controlled by a proprietary dispatch algorithm in the cloud to
produce a virtual power plant (VPP) that can emulate a dispatchable conventional
generator. The aggregation of many small controllable load segments along with the
dispatch algorithm governing their controllers, mitigates the uncertainty in energy yield
resulting in a VPP with supply reliability within conventional statistical norms. This
approach is analogous to creating financial managed portfolios underlying high quality
bonds by aggregating large numbers of “Junk Bonds” with high probability of default.
Demand side resources consisting of load segment within household and buildings are
controlled by smart devices and dispatched through the WEC cloud algorithms. The
dispatch frequency of each device is based on subscription contracts with the customer
in accordance with the customer’s selection from a menu of contracts specifying
probability of curtailment or priority of curtailment vs. compensation. The customer
selections are aggregated into a portfolio comprising the VPP elements.
Based on the composition of the contract portfolio and the yield statistics of the
curtailable load segments, the DER Aggregator can construct a supply function,
maximizing expected return, that emulates a conventional generator supply function.
The VPP supply function which is bid into the Day-Ahead wholesale energy market or
reserve market specifies committed energy as function of wholesale price. The awarded
quantity is realized through deployment of load control by the WEC cloud algorithm.
Like with conventional generators, VPP deviations within acceptable bounds are settled
in the real time market.
Figure 44 illustrates the creation of the VPPs and their participation in the market.

101
Figure 44: Building VPP Demand Resource Portfolio Creation for Market Participation
For yield characterisation we characterise controllable demand. The energy yield and
probability of available distribution will initially be assumed and eventually calibrated to
measurements and device data. The yield distribution will guide the deployment of
controllable demand capacity to deliver a specified amount of energy with a given
probability.
Overview of specific functionalities
“Create account”.
• Prosumer joins TwinERGY project.
• Receive signal from other TwinERGY module to create prosumer account.
• TEM confirms account created.
“Register Device”.
• New device joins TwinERGY ecosystem
• Receive Signal from other TwinERGY module to register a device (PV, HVAC etc.)
• Signal includes owner and TEM creates relation between prosumer and device.
• TEM confirms device is registered and relation created.
• (2) Function to remove devices
“Register Consortium”.
• New prosumer consortium is formed.
• Receive Signal from other TwinERGY module to register a consortium.
• Signal includes participants and devices creates consortium relations.

102
• (2) Function to add and remove prosumers and devices
“Calculate and broadcast LEM and DSO/DNO Pricing” .
• TEM receives input data from other TwinERGY modules.
• TEM receives input data from DSO/DNO.
• TEM calculates LEM pricing.
• TEM broadcasts LEM/DSO/DNO pricing on set interval
• TEM records pricing on the blockchain
“Process energy transaction”.
• TEM receives request from other TwinERGY module or device to process a
transaction.
• Data input includes prosumer, device, units and destination.
• TEM processes and settles the transaction.
• TEM records transaction on the blockchain with reference to price hash
“Communicate an account balance”.
• TEM receives request from another TwinERGY module to communicate the
balance an account.
• Data input includes the ID of a Prosumer, Prosumer Consortium or Device.
• TEM communicates balance.
“Communicate transaction history”.
• TEM receives request from another TwinERGY module to communicate the
transaction history of an account.
• Data input includes the ID and date range of a Prosumer, Prosumer Consortium
or Device.
• TEM communicates an array of transaction.
“Load and generation forecast”.
• TEM receives input data from DSO/DNO.
• TEM receives input data from TwinERGY digital twin.
• TEM calculates day ahead load and generation forecast.
• TEM broadcasts load and generation forecast.
5.9.3 Iteration with other modules
The TEM will have interoperability with several other modules in the TwinERGY
ecosystem. Important inputs from other modules will be fed into TEM for the different
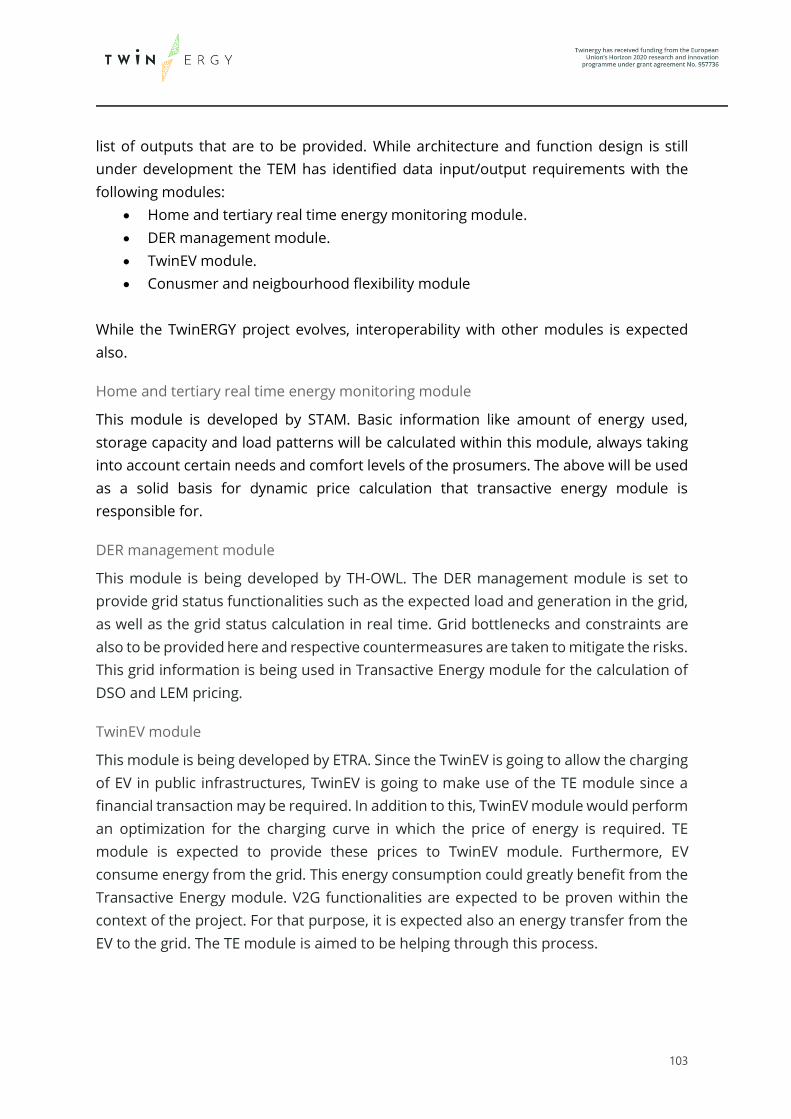
103
list of outputs that are to be provided. While architecture and function design is still
under development the TEM has identified data input/output requirements with the
following modules:
• Home and tertiary real time energy monitoring module.
• DER management module.
• TwinEV module.
• Conusmer and neigbourhood flexibility module
While the TwinERGY project evolves, interoperability with other modules is expected
also.
Home and tertiary real time energy monitoring module
This module is developed by STAM. Basic information like amount of energy used,
storage capacity and load patterns will be calculated within this module, always taking
into account certain needs and comfort levels of the prosumers. The above will be used
as a solid basis for dynamic price calculation that transactive energy module is
responsible for.
DER management module
This module is being developed by TH-OWL. The DER management module is set to
provide grid status functionalities such as the expected load and generation in the grid,
as well as the grid status calculation in real time. Grid bottlenecks and constraints are
also to be provided here and respective countermeasures are taken to mitigate the risks.
This grid information is being used in Transactive Energy module for the calculation of
DSO and LEM pricing.
TwinEV module
This module is being developed by ETRA. Since the TwinEV is going to allow the charging
of EV in public infrastructures, TwinEV is going to make use of the TE module since a
financial transaction may be required. In addition to this, TwinEV module would perform
an optimization for the charging curve in which the price of energy is required. TE
module is expected to provide these prices to TwinEV module. Furthermore, EV
consume energy from the grid. This energy consumption could greatly benefit from the
Transactive Energy module. V2G functionalities are expected to be proven within the
context of the project. For that purpose, it is expected also an energy transfer from the
EV to the grid. The TE module is aimed to be helping through this process.

104
Consumer and neigbourhood flexibility module
The Consumer Demand Flexibility Profiling Module is intended to facilitate the
calculation of flexibility for individual buildings or consumers, both in terms of implicit
flexibility (i.e. the actions taken by a consumer in response to dynamic conditions, such
as price signals, for example) and explicit flexibility, which refers to automated actions
that are managed and dispatched by an aggregator.
The Neighbourhood Demand Flexibility Profiling Module will operate in a similar manner
to Consumer Demand Flexibility Profiling Module, however it will use the Community
Digital Twin to present a single pane of glass dashboard for the entire neighbourhood.
This module will again be used as a read-only, cloud-based dashboard to allow the user
to view the flexibility profile within their neighbourhood.

105
6. TwinERGY module’s interoperable
platform
In this section we describe the process that we have followed in Task 7.1, with the aim
of achieving a stable implementation of an intercommunication platform among all the
modules. Our intention here is to begin to explain the rationale behind this platform,
followed by the description of requirements and needs, and a description of the
alternative standards that we have considered. Finally, we give a detailed description of
the implementation.
6.1 Introduction
The modules developed during WP7 conform a distributed ecosystem where all they are
communicating with each other. As can be deduced by reading previous sections in this
deliverable, these modules are highly interdependent. That means that each of them
needs information generated by one or several modules as well as they generate
information that can be needed by the rest of the modules. For instance, TwinEV
module generates a charging curve for an eVehicle charging session, and this
information is used by other modules, such as DER management module.
Moreover, the status of a module can affect the rest. For instance, if a module fails
during its execution, the modules that are waiting for its inputs may hang. So, those
waiting modules need to know this situation in order to follow a plan B: using previous
data received from the module, making an estimation of what data would be received,
or any other action. This point is important, so to ensure that the information is
interchanged among them, since it is related to the tolerance to failures of the complete
ecosystem. Besides, the modules need to receive the information immediately. It makes
no sense to receive information with a great delay or corresponding to a previous time
period. Therefore, all modules need to work with the latest data, corresponding to a real
time schema.
Such a situation implies that the WP7 needs a common platform of communication,
where all modules can receive and send messages about their calculations and their
statuses in a real time environment. Traditional solutions like checking the common
database for new/modified information and reading the new/modified data can lead to
a potential bottleneck and so have to be avoided, and those solutions do not solve the
problem of knowing the status of the rest of the modules. However, not only these

106
exposed points have to be taken into account. Each module has its own characteristics,
it is implemented in a different language, and it is deployed in different premises. This
implies that the communication channel has to be independent of the modules. All these
topics or issues have led us to look for an independent and unified framework that also
guarantees security. The requirements and needs are exposed in the next subsection.
6.2 Requirements and needs
Considering that the platform must be decentralized, it has to solve typical problems in
this kind of architectures. On the other hand, we have to deal the problems exposed in
the introduction, such as synchronization among modules or bottlenecks. So, after an
analysis, we consider that our platform presents these main needs and requirements:
• Real time: Data has to be sent and received immediately.
• Scalability: The communications have to work independently of the size or the
amount of information sent/received.
• Security: Data have to be confidential and accessible, and the system has to
ensure data integrity.
• Heterogeneity: Communicating modules have to be able of communicating
without a previous knowledge of the architecture of the rest of modules.
• Concurrency: All information sent have to be accessible by interested modules
simultaneously.
• Flexibility: The platform must be open to changes and updates.
6.3 Examined standards
Considering requirements, we divided the revision of standards in two parts. On one
hand, standards (ontologies) for data modelling. On the other hand, standards for
communication.
Data modelling
Regarding to this point, we have considered that TwinERGY project is related to energy
systems, so the information interchanged is related to the knowledge domain of energy.
Therefore, we need to model interchanged data by following an ontology. In this area
we have selected some extensions of Smart Applications REFerence ontology [24] which
is intended to enable interoperability between solutions from different providers and
among various activity sectors on the Internet of Things (IoT). It facilitates the matching
of existing assets in the smart applications domain. SAREF models the knowledge with
these main classes, among others:

107
• Device: tangible object designed to accomplish a particular task. Examples of
devices are: a light switch, a temperature sensor, an energy meter or a washing
machine.
• Function: the functionality necessary to accomplish the task for which a device is
designed. For instance: Sensing, metering, event, actuation
• Command: Orders associated to functions: Start, stop, etc.
• State: Represents real states of a device: On, off, etc.
• Service: recovery of a function, making it visible
• Profile: Specification of a device to collect information about a device’s property
or commodity
• Measurement: Measurement of a physical quantity
• Property: Property where the measurement is referring to
• Unit of measure
In next Figure 45 we show the relationship among classes in SAREF ontology.
Figure 45: Relationship among SAREF classes
However, for data modelling in TwinERGY, the use of the basic SAREF is insufficient.
Then, we have considered to include two extensions of this ontology, which cover all
aspect. They are SAREF4ENER [25] (SAREF for energy) and SAREF4BLDG [26] (SAREF for
buildings).
SAREF4ENER [25] is focused on modelling of energy systems. As main characteristic, it
extends basic SAREF classes by including more properties. For instance, while class
Device in SAREF only includes properties “has manufacturer” and “has model”, class
Device in SAREF4ENER adds more properties like “power source”, “vendor code”, etc.
Besides, SAREF4ENER has new classes not considered in SAREF, such as: Power profile,

108
Resume cost estimated, etc… On the other hand, SAREF4BLDG [26] is focused on
buildings’ life cycle. It includes new classes like Building or Physical Object. However, we
have been careful with the selected classes in the modelling, in order to avoid overlaps.
Communication standards
Regarding to this point, we have been checking different approaches of communication.
From the moment that we consider the TwinERGY ecosystem as a distributed system
with real time approach, the communication must follow a schema of message
exchange protocol.
The first option that we have considered is OpenADR 2.0 [27] standard, which facilitates
common information exchange between electricity service providers, aggregators, and
end users. OpenADR 2.0 [27] is a two-way signalling system composed by servers and
clients:
• Servers (Virtual Top Nodes or VTNs), which publish information about grid
conditions. They manage resources, create and transmit events and request
reports.
• Clients (Virtual End Nodes, or VENs). Communicates with a VTN receiving and
transmitting Smart Grid messages that relay grid situations, conditions, or
events. They receive events and respond to them, generate reports and control
demand side resources.
Figure 46: OpenADR 2.0 schema
This approach in a first step is good for our needs. However, messages have a complex
format in XML, so they include a lot of parameters that must be analysed by the receivers
and therefore, they have to be codified by the senders. For instance, this would be a
message related to inform about a new vendor:
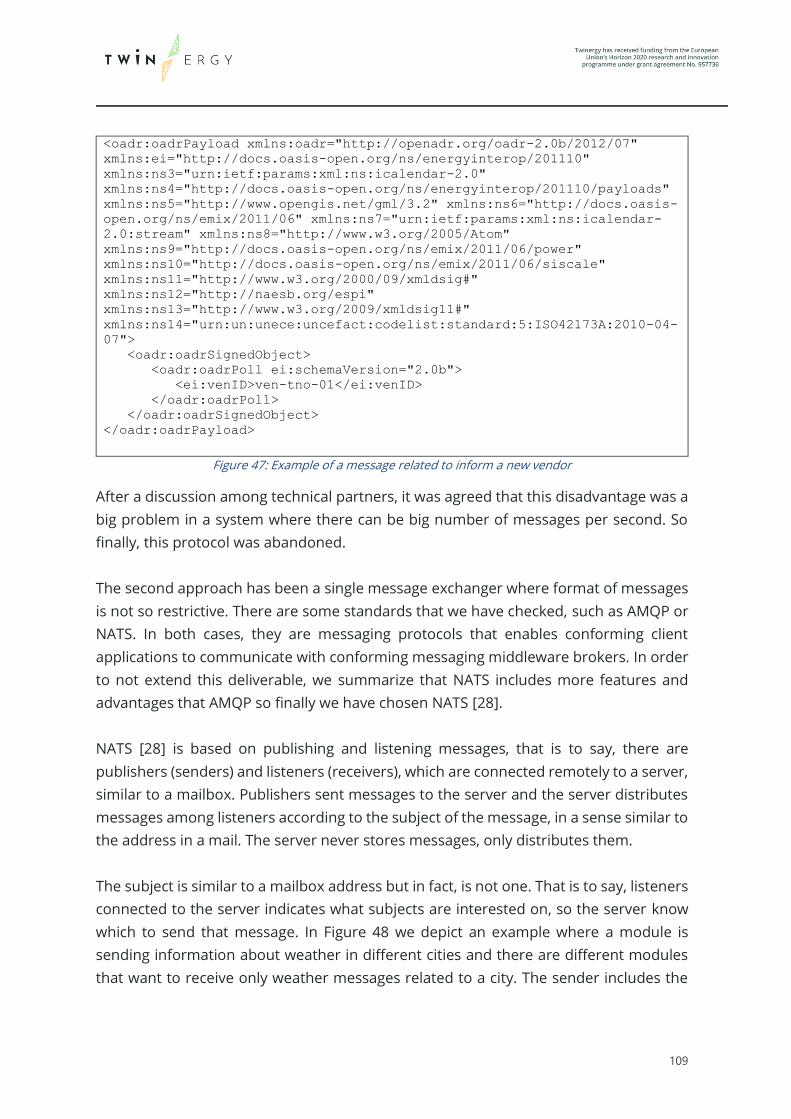
109
<oadr:oadrPayload xmlns:oadr="http://openadr.org/oadr-2.0b/2012/07"
xmlns:ei="http://docs.oasis-open.org/ns/energyinterop/201110"
xmlns:ns3="urn:ietf:params:xml:ns:icalendar-2.0"
xmlns:ns4="http://docs.oasis-open.org/ns/energyinterop/201110/payloads"
xmlns:ns5="http://www.opengis.net/gml/3.2" xmlns:ns6="http://docs.oasis-
open.org/ns/emix/2011/06" xmlns:ns7="urn:ietf:params:xml:ns:icalendar-
2.0:stream" xmlns:ns8="http://www.w3.org/2005/Atom"
xmlns:ns9="http://docs.oasis-open.org/ns/emix/2011/06/power"
xmlns:ns10="http://docs.oasis-open.org/ns/emix/2011/06/siscale"
xmlns:ns11="http://www.w3.org/2000/09/xmldsig#"
xmlns:ns12="http://naesb.org/espi"
xmlns:ns13="http://www.w3.org/2009/xmldsig11#"
xmlns:ns14="urn:un:unece:uncefact:codelist:standard:5:ISO42173A:2010-04-
07">
<oadr:oadrSignedObject>
<oadr:oadrPoll ei:schemaVersion="2.0b">
<ei:venID>ven-tno-01</ei:venID>
</oadr:oadrPoll>
</oadr:oadrSignedObject>
</oadr:oadrPayload>
Figure 47: Example of a message related to inform a new vendor
After a discussion among technical partners, it was agreed that this disadvantage was a
big problem in a system where there can be big number of messages per second. So
finally, this protocol was abandoned.
The second approach has been a single message exchanger where format of messages
is not so restrictive. There are some standards that we have checked, such as AMQP or
NATS. In both cases, they are messaging protocols that enables conforming client
applications to communicate with conforming messaging middleware brokers. In order
to not extend this deliverable, we summarize that NATS includes more features and
advantages that AMQP so finally we have chosen NATS [28].
NATS [28] is based on publishing and listening messages, that is to say, there are
publishers (senders) and listeners (receivers), which are connected remotely to a server,
similar to a mailbox. Publishers sent messages to the server and the server distributes
messages among listeners according to the subject of the message, in a sense similar to
the address in a mail. The server never stores messages, only distributes them.
The subject is similar to a mailbox address but in fact, is not one. That is to say, listeners
connected to the server indicates what subjects are interested on, so the server know
which to send that message. In Figure 48 we depict an example where a module is
sending information about weather in different cities and there are different modules
that want to receive only weather messages related to a city. The sender includes the

110
name of the city in the subject and each receiver subscribes to messages whose subject
is related to a city:
Figure 48: Example of messages sending in NATS
As it can be seen in Figure 48, a module can be subscribed to more than one subject.
Since a module can need messages related to a several types of subjects, NATS [28]
allow to use shortcuts in order to make easier this definition. Continuing with the
example of sending weather in cities around the world, if a module wants to receive
weather information from all capitals in Europe, the sender can send messages with
subjects like “weather.europe.city_name”, “weather.asia.city_name”, etc. and the
receiver can subscribe to “weather.europe.*”. Of course, modules that only want
information about a city in Europe still can subscribe to “weather.europe.city_name”.
In addition to this schema of subscriptions, NATS [28] allows to send a request and waits
for a response. This is very helpful in case that a module wants to request information
directly to another one. In this case, the communication can be synchronous (sender
locked until receiving the response or timeout) or asynchronous (sender continues
working while waiting for the response).
As we commented in OpenADR [27], the messages are very complex. In NATS [28] this
is not a problem at all, because programmers can model the data as they want, so
information is easily readable. NATS [28] allows to send messages in plain text or
structured in JavaScript Object Notation (JSON format), which is incorporated in the most
of modern languages. JSON is an open standard file format and data
interchange format that uses human-readable text to store and transmit data objects
consisting of attribute–value pairs.

111
Regarding security, NATS uses modern Transport Layer Security (TLS) semantics to
encrypt clients, route, and monitoring connections. Besides, NATS can be configured to
force client authentication in different ways:
• Connection by user/password.
• Connection by token.
• Connection by NKEY: Server has a list of known public keys and clients have to
respond to the challenge by signing it with its private key.
• Connection by credentials file.
Some other helpful features exist in NATS, but we do not expose them here in order to
not extend this section. In any case, NATS covers all needs in the communication:
• Request information to a module.
• Send notifications of statuses.
• Publish data that is distributed among interested modules.
• Secure communications.
6.4 Final implementation
In summary, the defined interoperability platform is composed by a NATS system, where
WP7 modules connect to the server and send/receive messages to/from the NATS
server. Containing information about modules’ status, their calculations or measures
registered, these messages are composed following the SAREF ontology and its
extensions. With this aim, modules will contain clients to the NATS server, in charge of
subscribing to desired messages (depending on the subject) and/or publishing
messages.
But once the platform is defined, it is needed to define data to be sent as well as message
format. Despite SAREF is used for modelling the data, it is important to be sure that
subscribers are able to identify the type of data received. With this intention, we have
firstly identified the inputs and outputs data for each module and its correspondence
with SAREF ontology. For this point, technical partners have identified the data defined
in the excel file of functionalities and modelled them as classes of SAREF, SAREF4ENER
and SAREF4BLDG ontologies. In case of data that cannot have some correspondence
with these classes, partners have identified also and modelled in a similar way. For
instance, the “flexibility grid neighbourhood delivered” can be modelled as class “Power
max” in SAREF4ENER, whilst “user survey responses” corresponds with a new class.

112
The second step has consisted of the definition of messages to be interchanged. For this
task, on one side we have defined the data structure in messages and on the other side,
the subject to identify the message type and the sender. Taking advantage of rules for
composing subjects, we structure the subjects in this way:
{MOD}.{TYPE}.{SUBTYPE}
Where:
• {MOD} is the module identifier,
• {TYPE} is the message type, and
• {SUBTYPE} is the message subtype.
For example, subject “M3.notify.error” indicates that Module 3 is notifying an error, and
“M4.synchronization” indicates that Module 4 needs to synchronize with another
module.
Depending on the message type (indicated in the subject), the message itself has a
different format. As we commented before, NATS allows to send plain text or text
structured in JSON format. In our case, we choose JSON format, with the aim of allowing
send complex data.
Finally, and after defining subjects and message structure, we have defined the set of
messages to be sent and received among modules. For this task, technical partners have
translated their input/output data from modules functionalities to messages. For this
definition we have used a table template like this:
Table 12. Definition of messages for interoperability platform
Message
Message name
and description
Subject
Message subject
Payload
Message itself
Descriptive
name of the
message
Short
description of
the message
Being {MOD} the sender
identifier (module in WP7), the
subject has to have this format:
{MOD}.{type}.{subtype}
Description of the JSON containing the data
to be sent.
113
We have to distinguish between messages in common to all the modules, and specific
messages sent by single module. In the first case, common messages correspond with
notifications of a situation has happened. As an example, a notification of error is a
message that can be sent by any of the WP7 modules. In the second case, specific
messages are related to particular situations for a module. For instance, a message
containing the predicted flexibility in the grid for the next step of time is a particular
message sent by the Neighbourhood Demand Flexibility Profiling Module.
Please, consider that the duration of modules’ development (tasks T7.2 to T7.9) are
longer than the duration in T7.1, so the definition of the set of messages is going to be
opened while those tasks are in progress as a living document. This is natural in the
sense of changes in developments may occur, due unexpected restrictions or
functionalities extensions. In the moment of delivering this document, the set of
common messages is:
• Notification of an error during a calculation or operation. It includes a code of
error and a human-readable text about the problem.
• Notification of the status of a module. It includes a code of status and a human-
readable text about the status.
• Database changed: Notification that a module has updated data in the common
storage system/database. It includes data such as the element that has been
affected, the action itself and the moment of the operation.
• Synchronization: Messages to synchronize operation between modules. That is,
a module needs that one or several modules start to make something at the
same time. It includes the moment where the synchronization must be done
and the modules affected.
• Data requests: A module needs data from another one in this moment. This
message contains the operation identifier and the parameters to execute the
request.
• Data response: This is the opposite operation to the previous one. The module
that has received the request, send a response. In this case, the message
contains the response.
The complete definition of these common messages is in Annex 3. Definition of common
messages interchanged. The definition of the messages related to each module is in
Annex 4. Definition of messages related to modules.

114
Last but not least, the NATS [28] server has been deployed in ETRA premises. One open
discussion among partners is how many servers are needed for project requirements:
a single server for all pilot sites or one server per pilot, due the huge number of
messages that we anticipate that are going to be exchanged. So, in the moment of
delivering this document, only one for development proposes is online
(nats://natsTwinERGY.etra-id.com). This has allowed us to check the different ways of
connection in NATS, being the connection by token the chosen one, as it is the easiest
one for client modules.
Complementary to the NATS server itself, a web application has been developed by
ETRA, NATS console, being accessible in this URL https://twinergy-console.etra-id.com. It
consists of a tool related to monitor the server and publish/subscribe messages. Since
the access is authenticated, only partners can work with it. The application has been
created with the aim of supporting the development of modules in WP7 in different
ways: a developer can send easily messages to be read by his/her module, check if a
message has been sent from his/her modules, or test response time from his/her
modules. The application is composed by these screens:
• Dashboard: The main page, where statistics are shown (connections,
subscriptions, memory used, etc…)
Figure 49. Dashboard view
• Connections: List of applications connected to NATS server. For each client
connected, it shows its address, its activity and other information. Besides, if user
clicks over the number of subscriptions of a client, the application goes to the
view Subscriptions with the filter client set to the client.
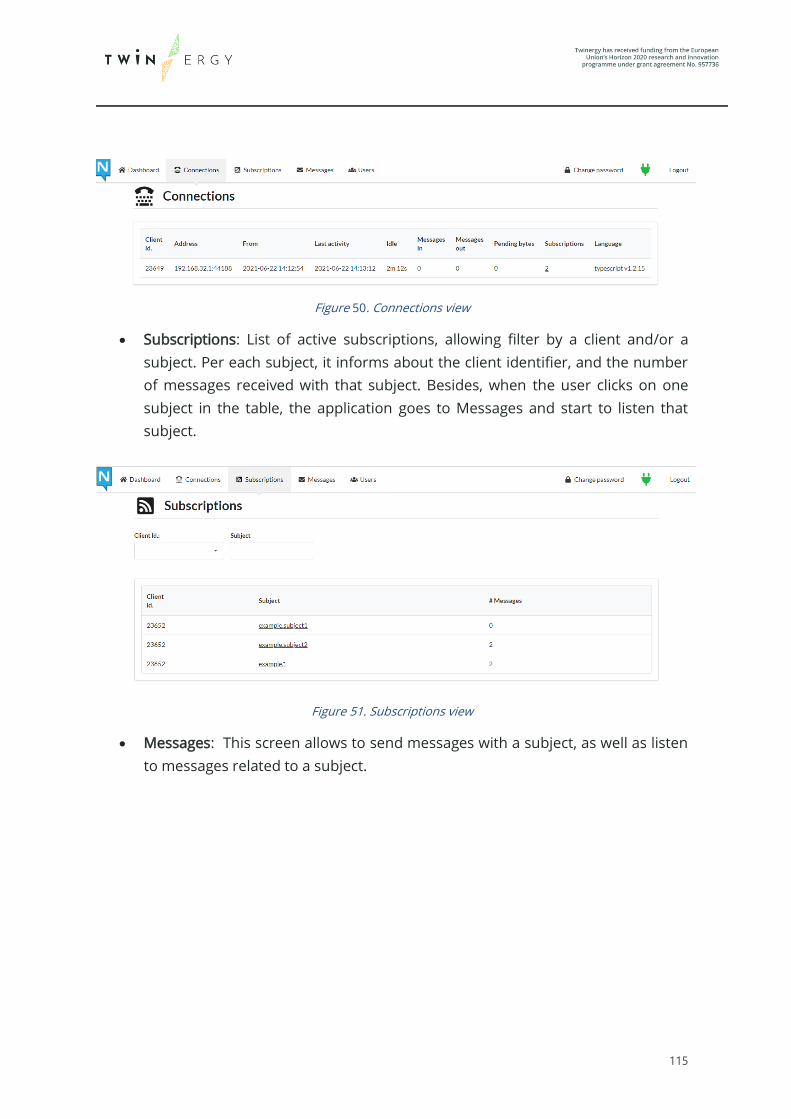
115
Figure 50. Connections view
• Subscriptions: List of active subscriptions, allowing filter by a client and/or a
subject. Per each subject, it informs about the client identifier, and the number
of messages received with that subject. Besides, when the user clicks on one
subject in the table, the application goes to Messages and start to listen that
subject.
Figure 51. Subscriptions view
• Messages: This screen allows to send messages with a subject, as well as listen
to messages related to a subject.
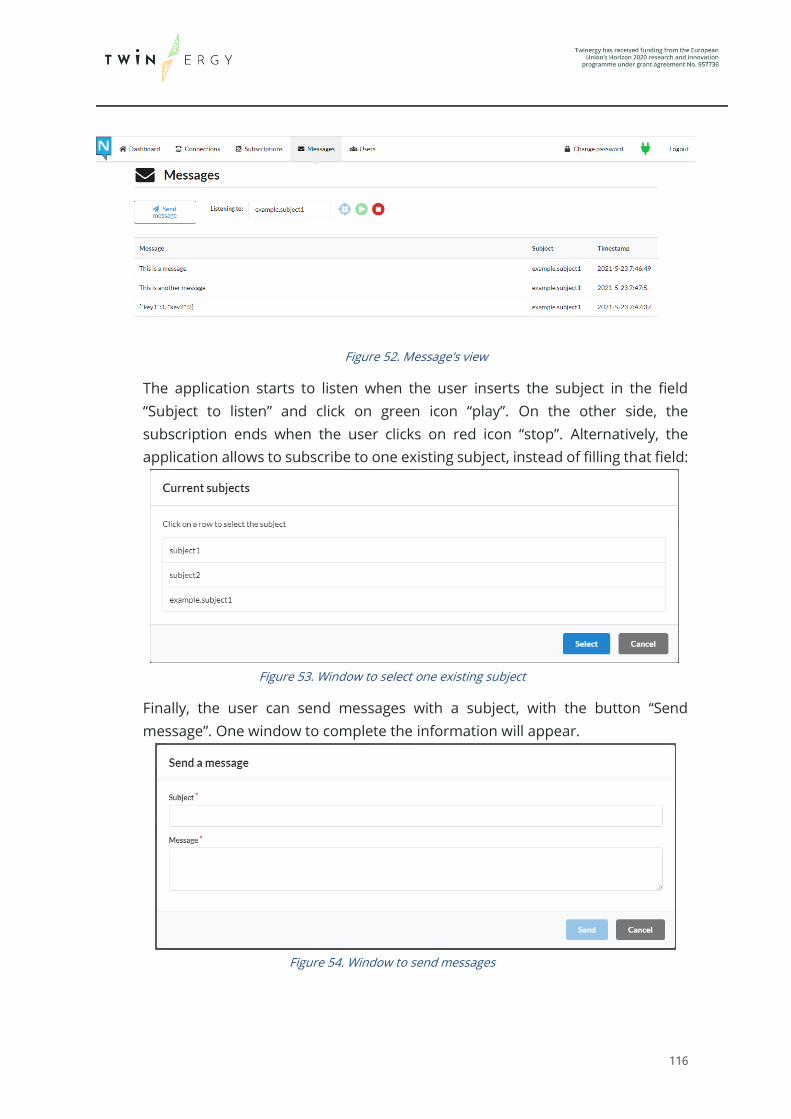
116
Figure 52. Message’s view
The application starts to listen when the user inserts the subject in the field
“Subject to listen” and click on green icon “play”. On the other side, the
subscription ends when the user clicks on red icon “stop”. Alternatively, the
application allows to subscribe to one existing subject, instead of filling that field:
Figure 53. Window to select one existing subject
Finally, the user can send messages with a subject, with the button “Send
message”. One window to complete the information will appear.
Figure 54. Window to send messages

117
6.5 Testing the platform
With the aim of checking that the platform is working, all technical partners have to
ensure that their modules are able to connect to the platform and also to send/receive
all different messages.
Since the delivering date of this document is previous to have a first version of modules
in WP7, the real tests have not been started. So, for this needed task, we have defined a
set of test cases to be implemented in test applications sending and receiving dummy
data. These test applications have to reproduce the environment that the final real
application will have, so the test cases not only ensure that each module will able to
connect, but it will be able to operate with the platform in the same way as in the real
environment. These test cases are defined to be coded in the programming language
that each partner has intention of using in their modules.
The test cases have been executed during the final part of the Task T7.1 by all the
partners, getting successful results for all. Before exposing the list of test cases
implemented, here we describe the structure of them. They are defined in tables like
the following Table 13:
Table 13: Definition of test cases
Test case Identifier. Name
Summary of test A description of the test (scope, features to be tested, etc.)
Pre-conditions List of conditions to be met before starting the test
Dependencies List of previous test cases that have to be executed and passed
before starting this test
Steps List of steps that conforms the test case
Post-Condition The final status after the execution of the test.
Acceptance
criteria
What conditions have to be met in order to consider the test
case as passed
Due this is a first step of testing of the platform, we have defined only three test cases:

118
1. Test of connection (Table 14).
2. Send/receive messages (Table 15).
3. Request/reply data (
4. Table 16).
Regarding to the real testing of the platform, it will be done as partners involved in
WP7 start to develop the real modules, as well as they include the interchange of
messages in their codes.
Table 14: Test 1 of connection to NATS
Test case TC01. Test of connection
Summary of test A module checks if it can reach the NATS server and connect to
it.
Pre-conditions • The NATS server is online and running
Dependencies None
Steps 1. Execute the instructions for connection to NATS. For
example, in Javascript: const nc = NATS.connect({url: “urlNATSserver”,
token: "keyToken", json:true});
nc.on('connect', (c) => {
console.log(‘Connected to server’);
nc.close();
console.log(‘Connected to server’);
});
nc.on('error', (err) => {
console.log(‘error in connection:’);
console.log(err);
});
Post-Condition The connection is done or an exception is generated
Acceptance
criteria
The connection is done and no exceptions are generated

119
Table 15: Test 2 of connection to NATS
Test case TC02. Send/receive messages
Summary of test When a message related to notifications of error is generated, it
is received by listeners subscribed to that type of messages
Pre-conditions • The NATS server is online and running
• There is one client application, called PUB, connected to
the NATS server, actuating as publisher.
• There is another client application, called LIST, connected
to the NATS server, actuating as listener
Dependencies TC01
Steps 1. LIST subscribes to subject “test.messages”. For instance, in
Javascript:
nc.subscribe("test.messages", (msg) => {
console.log(msg.code);
console.log(msg.message);
});
2. PUB sends a message with subject “test.messages” and
content {“code”: 200, “message”: “OK”}. For instance, in
Javascript:
nc.publish("test.messages",{"code":200,"messag
e": "OK");
Post-Condition The application LIST receives the message with subject
“test.messages” and content {“code”: 200, “message”: “OK”}.
Acceptance
criteria
• The application PUB has not problems when sending the
message.
• The application LIST has to receive a message with subject
“test.notification.error” and content { “code”: 500,
“message”: “Test”}

120
Table 16: Test 3 of connection to NATS
Test case TC03. Request/Reply data
Summary of
test
A module request to another one for data and the second one responds.
Pre-conditions • The NATS server is online and running
• There is one client application, called REQ, connected to
the NATS server, actuating as requester.
• There is another client application, called RESP, connected
to the NATS server, actuating as responder.
Dependencies TC01, TC02
Steps 1. RESP subscribes to messages of subject “getTime” and type
“reply”, and for those messages calculates the local date time
and returns it . For instance, in Javascript:
nc.subscribe(“getTime“, (msg, reply) => {
if(reply) {
const date = new Date().toLocaleString();
nc.publish(reply, {“time”: date});
}
});
2. REQ receives the response. For instance, in Javascript:
nc.requestOne(“getTime“, (msg) => {
console.log(“the time is“ + msg.time);
});
Post-Condition REQ receives a response with the local date time
Acceptance
criteria
REQ receives the response and none exception is produced

121
7. Conclusions
The document presents the nine different modules that are in charge of providing
customers with several services. These are quite varied and are addressed in several
ways to different energy related aspects such as consumer empowerment, energy
markets (under the perspective of local intelligence), promotion not only self-
consumption and RES integration, but also addressing consumers to achieve the best
energy deal. These different modules are being developed in posterior phases of the
project under different tasks related to WP7: Development of TwinERGY system
Modules. Nevertheless, this document is intended to reflect a brief overview related to
the context in which the modules are being developed and the functionalities they
foresee to provide. For that purpose, partners have prepared not only a detailed
description of the functionalities, but also, they have identified the potential actors to be
participating in the modules running process.
It should be highlighted that the different modules conform a distributed ecosystem
from which modules are highly interdependent. As it has been shown in Chapter 5 and
6, these modules require a structure that allow the exchange of information. Related to
the exchange of information among the different modules, this deliverable has targeted
the creation of an Interoperability Platform for the modules, to allow them to exchange
data. In order to achieve this goal, TwinERGY consortium agreed to use a single message
exchanger based on NATS technology. This technology will allow an effective messaging
method that distributes message among modules regardless its data language, since
NATS allows JSON files in plain or structure way. NATS covers all the needs in the
communication process among the modules, allowing them to request information to
each other, send notifications and publish data in a secure way. Although this platform
is defined in this deliverable, it must be taken into account that its implementation it is
not completed during the duration of this task since module’s development will be
taking place in the rest of WP7 tasks (T7.2 – T7.9).
Consequently, changes may occur during this development phase, having a direct effect
on the message schema (which has been defined in Chapter 6 and specified in Annex 3.
Definition of common messages interchanged. and Annex 4. Definition of messages
related to modules). Therefore, this deliverable will be used as a reference to conduct
the communication of modules, once they will have reached a more advanced phase of
development covering the challenges of interoperability among the modules. To aid in
the smooth communication among the modules, this deliverable has introduced the
web application for this NATS console that will act as the Interoperable platform for the

122
messages interchanged between modules in TwinERGY. This application has been
created to support in a user-friendly manner to check the interchanged messages
among the modules.
123
References
[1] TwinERGY Consortium, “TwinERGY - Innovation Action,” 2020.
[2] https://www.dermengine.com, “Dermengine,” [Online]. Available:
https://www.dermengine.com . [Accessed June 2021].
[3] IES, “iSCAN Intelligent Control and Analysis,” [Online]. Available:
https://www.iesve.com/icl/iscan. [Accessed June 2021].
[4] S. S. A. E. Karmann C, “Percentage of commercial Buildings ocuupant satisfied
with their thermal comfort,” Proceedings of the 10th Windsor Conference,
2018.
[5] K. a. H. M. McCartney, “Thermal comfort and productivity,” ,Proceedings of the
9th International conference on indoor air quality and climate, 2002.
[6] S. K. B. J. R. a. C. G. Purdon, “Model-free HVAC control using occupant feedback,”
Proceedings of the 38th annual IEEE conference on local computer networks,
2013.
[7] C. N. S. a. P. R. Sarkar, “iLTC: Achieving individual comfort in shared spaces.,”
Proceedings of the 2016 International Conference on Embedded Wireless
Systems and Networks., 2016.
[8] M. a. F. N. J. Humphreys, “, The validity of ISO-PMV for predicting comfort votes
in every-day thermal environments.,” Energy and Buildings, 34, pp 667 – 684,
2002, 2002.
[9] J. Z. Y. S. S. R. P. a. B. G. Kim, “, Personal comfort models: Predicting individuals’
thermal preference using occupant heating and cooling behavior and machine
learning.,” Building and Environment, 129, pp 96 – 106, 2018.
[10] T. Z. D. S. Y. L. H. a. X. L. Chaudhuri, “ Random forest based thermal comfort
prediction from gender-specific physiological parameters using wearable
sensing technology.,” Energy and Buildings, 166, pp 391 – 406, 2018.
[11] ASHRAE, “Thermal environmental conditions for Human Occupancy,” [Online].
Available: https://www.ashrae.org/technical-resources/bookstore/standard-
55-thermal-environmental-conditions-for-human-occupancy.

124
[12] EUROPARL. [Online]. Available:
https://www.europarl.europa.eu/factsheets/en/sheet/70/renewable-
energy#:~:text=In%20November%202016%20the%20Commission,target%20f
or%20RES%20by%202030.&text=Member%20States%20must%20transpose%
20the,law%20by%2030%20June%202021.. [Accessed May 2021].
[13] É. P. F. d. Laussanne, “IRGC: International Risk Governance Center,” [Online].
Available: https://irgc.org/wp-content/uploads/2018/09/Demand-side-
Flexibility-for-Energy-Transitions-Policy-Brief-2016.pdf. [Accessed May 2021].
[14] C. D. M. Goldenberg, “Rock Mountain Institute,” [Online]. Available:
https://rmi.org/wp-
content/uploads/2018/02/Insight_Brief_Demand_Flexibility_2018.pdf.
[Accessed May 2021].
[15] ENTSO-E, Electric Vehicle Integration into Power Grids, ENTSO-E Position Paper,
2021.
[16] EMAAS CONSORTIUM, EMAAS Project Public Summary Reoirt, European
Comission, Electric Mobility Europe, 2020.
[17] Directorate-General for Energy (European Commission), “Clean energy for all
Europeans,” 2019.
[18] “ChargED Project,” [Online]. Available: http://www.charged-project.eu.
[19] “BENEFFICE project,” [Online]. Available: http://www.beneffice.eu/.
[20] “Lora Alliance,” [Online]. Available: https://lora-alliance.org/about-lorawan/.
[Accessed 31 05 2021].
[21] ASHRAE, “Thermal environmental conditions for Human Occupancy,” [Online].
Available: https://www.ashrae.org/technical-resources/bookstore/standard-
55-thermal-environmental-conditions-for-human-occupancy. [Accessed June
2021].
[22] Bundesnetzagentur, “Jahresbericht 2020,” Bundesnetzagentur für Elektrizität,
Gas, Telekommunikation, Post und Eisenbahn, Bonn, 2021.
[23] M. Knowledge. [Online]. Available: https://microgridknowledge.com/virtual-
power-plants-grid. [Accessed May 2021].
[24] S. Ontology, “SAREF ETSI,” [Online]. Available: https://saref.etsi.org/. [Accessed
May 2021].
[25] SAREF, “SAREF for Energy,” [Online]. Available:
https://saref.etsi.org/saref4ener/. [Accessed May 2021].
[26] SAREF, “SAREF for Buildings,” [Online]. Available:
https://saref.etsi.org/saref4bldg/. [Accessed May 2021].

125
[27] O. ADR, “OPEN ADR,” [Online]. Available:
https://www.openadr.org/specification. [Accessed May 2021].
[28] NATS, “NATS,” [Online]. Available: https://nats.io/. [Accessed May 2021].

126
Annex 1. Functionalities description
In this table it is presented the different functionalities presented by the modules up to
the date of this deliverable.
Table 17: Functionalities list from modules
Func. ID
Functionality
Identifier: Key of
Module
Name
Functionality
short name
Description
Complete functionality description
M1.01 Personal data Provide values calculated for each consumer/occupant
M1.02 Comfort level Assesment of Comfort Level
Consumer.Flex.01
Forecasted
energy
consumption
Simulations can be run using the calibrated models of
each building in each pilot site to generated forecasted
time series demand
Consumer.Flex.02
Load
disaggregation
Based on the calibrated model and historical demand
data for a building, the load data can be disaggregated
into individual channels
Consumer.Flex.03
Flexibility
identification
Similar to the iVN, the forecasted RES production and
demand data can be used to identify flexibility
opportunities in the future
Consumer.Flex.04
Consumption
optimisation
Through the user-specific dashboard, and based on
specific building information, implicit demand response
actions can be identified through optimisation and
suggested to the user.
Neighbourhood.Fl
ex.01
RES production
forecasting
The iVN can predict the renewable generation for a
given period based on the capacity available and the
weather forecast for the site in question
Neighbourhood.Fl
ex.02
Flexibility
identification
Based on the forecasted RES production and expected
demand profile, the iVN can provide information to the
aggregator potential constraints or opportunities in
terms of demand flexibility within the time period

127
Neighbourhood.Fl
ex.03
Demand
response
optimisation
Through the user-specific dashboard, and based on
specific pilot site information, implicit demand response
actions can be advised, and explicit actions can be
identified for the operator using the optimisation
algorithm
Neighbourhood.Fl
ex.04
Power system
analysis
The iVN will evaluate all potential demand response
actions and ensure network stability throughout,
alerting the operator if any violations of equipment
operating limits occur.
H&T-EMS.01
Energy
Monitoring Energy monitoring system
H&T-EMS.02
Optimal Energy
Billing
Check the correct electrical energy billing+optimal
billing (if available)
H&T-EMS.03
Electrical
Flexibility
Management
Based on the output of the "Consumer demand
flexibility profiling Module" this functionality will
translate flexibility actions into users' actions that will
be communicated either through a GUI or actuated
directly as loads control (e.g. smart plugs). Also the
comfort and wellbeing module output are going to be
taken into account.
H&T-EMS.04
Anomaly
Detection
Checking of requested power versus nominal power of
buildings' key loads.
H&T-EMS.05
Optimal RES
Selector
Based on the weather forecast and on the PV weather
forecast from the M5 module, the service will provide
the best PV module tipology and their number
DERMgmt.01
grid status
calculation
Provides grid status calculation in realtime for control
purposes.
DERMgmt.02
grid bottleneck
detection
Uses grid status results and compares with grid
hardware information to detect bottlenecks.
DERMgmt.03 expected load
Load prediction functionality for predictive control of
the grid

128
DERMgmt.04
expected
generation
DER generation prediction based on weather data,
resources etc.
DERMgmt.05
countermeasure
calculation
Uses flexibility information provided by different
technologies, such as batterys, ev-charging-stations,
etc. to calculate countermeasures against current and
predicted grid bottlenecks
DERMgmt.06
dynamic signal
calculation
calculates a dynamic signal for demand response by the
community
DERMgmt.07
feedback
detection &
countermeasure
detects feedback of the demand response of the
habitants, if the feedback is to strong for the grid,
countermeasures in direct operation with the DSO will
be calculated and rolled out
Risk.01
Event
Management-
Situation
Awareness
Anomaly in energy the behaviour of specific loads or
structures
Risk.02
Risk
Management-
Scenarios
evaluation
Quantitative Scenario Risk evaluation for different
event and assets
TwinEV.01 logIn It allows the user to log in the TwinEV module
application
TwinEV.02 resetPassword
It allows the user to resset the password for his/her user
in the TwinEV module application
TwinEV.03 createAccount
This function allows the creation of an user to be used
in the TwinEV module platform
TwinEV.04 updateAccount
Update of an existing user account in the TwinEV
module platform
TwinEV.05 deleteAccount
Deletion of an existing user account in the TwinEV
module platform

129
TwinEV.06 configureEVehicl
e
Configuration of one or more vehicles associated to a
charging profile
TwinEV.07 getFreeStations Searching of available stations
TwinEV.08 bookingStation This function is used by the eVehicle owners to book a
Charging Point from a station from the available list.
TwinEV.09 routeCalculation This function is used for the calculation of the cost of the
route to the Charging Point
TwinEV.10 mostSuitableStat
ions
This function will generate a list of the available
charging points ranked under certain circumstances
TwinEV.11 minPrices This function will create an optimal charging curve for
eVehicles in terms of minimization of the pricing charge
TwinEV.12 maxGreenElectri
city
This function will create an optimal charging curve for
eVehicles in terms of maximization of the green energy
providing from the grid
TwinEV.13 chargingSession This function will create a charging session for the eV
users
TwinEV.14 V2GMode
This function will analyse through the smart charging
process the possible enegy that can flow between the
grid and the car in both ways in order to contribute as
an asset in the DSO management
TwinEV.15 chargingPoints
This functionality will allow to manage the configuration
of the charging points. This is to be used by either
private users who own a charging point or CPO
(Charging Point Operators)
SocialNetwork.01
Display
consumption/ge
neration
information
Display information related to households consumption
in a comprehensive manner
SocialNetwork.02 Display potential
candidate users
Display potential candidate users from the
neighborhood and allow the end-user to select whom to
challenge

130
for social
comparison
SocialNetwork.03
Social
Competition
challenges
Encourage demand response engagement and
reduction in energy usage through social competition
challenges
SocialNetwork.04 Offer rewards
Reward users with ‘TwinERGY Points’ or badges that
can be redeemed in exchange for “eco positive” goods
and services
SocialNetwork.05
Display
information from
DTP
Display community analytics screens with the aid of
Digital Twin Platform
SocialNetwork.06 Co-creation of
services
Enable co-creation for end consumers, service providers
and public authorities (e.g. search services, group chat,
stack overflow, group users based on location)
SocialNetwork.07
Customization of
notfications
regarding
community
User to be able to parametrize the notification for co-
creation (e.g. community batter SoC, production)
TwinTEP.00
Authenticate_m
odule
Allows a TwinERGY module to authenticate against the
TEP, establish connection and start communication.
TwinTEP.01
Account_creatio
n
Allows a prosumer to have access to a transactive
account that can be managed by TwinERGY modules via
API.
TwinTEP.02
Account_inactiva
tion
TwinTEP.03
TwinERGY_IOT_c
reation
Allows a TwinERGY module to create a device in the TEP
and link the device to one or more prosumers
TwinTEP.04
TwinERGY_IOT_R
elation
creates a new relation between a prosumer and an
existing TwinERGY device
TwinTEP.05
Reward_prosum
er
Rewards the prosumer with Twinergy tokens for the
sale of Kwh

131
TwinTEP.06
Reverse_transact
ion
Burns tokens of a prosumer that were originally
received via a reward
TwinTEP.07 Request_balance
Allows TwinERGY modules to retrieve the balance of a
prosumer
TwinTEP.08
Pay_out_prosum
er
Burns prosumer TwinERGY tokens and transfers the
Ethereum equivalent to a prosumer ERC20 wallet on the
Ethereum Mainnet.
TwinTEP.09
Prosumer_TX_hi
story_twinergy
Allows TwinERGY modules to retrieve the transaction
history of a prosumer on the TwinERGY blockchain
TwinTEP.10
Prosumer_TX_hi
story_Ethereum
Allows TwinERGY modules to retrieve the transaction
history of a prosumer on the Ethereum Mainnet
blockchain
TwinTEP.11
Twinergy_IOT_d
evice_history
Allows Twinergy modules to retrieve a transaction
history of a TwinERGY IOT device
TwinTEP.12
Grid_operator_T
X_history
Allows Twinergy modules to retrieve a transaction
history of a grid operator
TwinTEP.13
Invoice_grid_ope
rator
Sends a payment request to the grid operator to settle
and back the TwinERGY tokens supplied with Ether.
TwinTEP.14 P2P_Transact Exchanges KWH for Currency between prosumers

132
Annex 2. Modules’ interoperability
In this table, it is presented the different interconnections between modules, and the
functionality associated by its Identifier. In it can be found the description and the name
of each of these functionalities.
Table 18: Modules' interoperability table.
Demanding
Module
As a demanding
module partner,
please introduce
the module
identifier
Demanded
Module
As a demanded
module partner,
please
introduce the
demanded
module
identifier
Functionality associated
Identifier of the functionality associated to the
data interchanged between modules
Μ1 Μ4 M1.02
M2 M1 M1.02
M2 M9 TwinTEP.09
M2 M3 Neighbourhood.Flex.02
M2 M4 H&T-EMS.02
M3 M2 Consumer.Flex.03
M3 M7 TwinEV.12; TwinEV.11
M3 M9 TwinTEP.09
M3 M4 H&T-EMS.02
M4 M2/M3 Consumer.Flex.02; Neighbourhood.Flex.02
M4 M9 TwinTEP.12
M4 M1 M1.02

133
M5/M4 M4/M5 H&T.X
M5 M2 Consumer.Flex.03
M5 M3 Neighbourhood.Flex.02
M6 M5 DERMgmt.01
M7 M3 TwinEV.11
M7 M5 TwinEV.11
M8 M3-M4 SocialNetwork.01-05
M8 M4 SocialNetwork.02-03
M8 M5 SocialNetwork.07
M9 M4 H&T-EMS.02
M9 M5 DERMgmt.02; DERMgmt.01
M9 M7 TwinEV.12

134
Annex 3. Definition of common messages
interchanged.
To add information regarding the schema messaging
The above messages indicate in the previous section are listed here:
Table 19: Common messages interchanged
Message
Message name and
description
Subject
Message subject
Data
Description of the JSON with the data interchanged
Notification: Error
{MOD} has
generated an error
during its execution
{MOD}.notify.error
{
“code”: integer (HTTP code 400-599, referenced
here),
“message”: string (human readable string)
}
For instance: {
“code”: 500,
“message”: “Too many requests. Re-starting
module”
}
Notification: Status
{MOD} wants to
notify its status
{MOD}.notify.status {
“code”: integer(HTTP code: 100-299, referenced
here),
“message”: string (human readable string)
}
For instance: {
“code”: 202,
“message”: “Module back to normal”
}
Notification:
Database changed
{MOD} has
inserted, modified
or deleted entities
{MOD}.notif.dbChanged {
“timestamp”: string (ISO Date of the operation),
“dataset”: string (collection/table/dataset that has
changed)
“action”: string (INSERT/UPDATE/DELETE)
“amount”: string (ONE/MANY)

135
in/from the Suite5
storage
system/database
“extra”: string (other important information)
}
For instance: {
“timestamp”: 2021-02-25T23:40:45.123Z,
“dataset”: “forecasting”
“action”: ”INSERT”
“amount”: “ONE”
“extra”: ”id=YHDGE3HETFDy”
}
Synchronization
{MOD} needs to
synchronize with
one or several
modules
{MOD}.synchronization {
“timestamp”: string (ISO Date of the operation),
“type”: string (type/reason for synchronization),
“destination”: array[string] (array of affected
modules(
}
For instance: {
“timestamp”: 2021-02-25T23:40:45.123Z,
“type”: “restart”,
“destination”: [“M2”, “M3”]
}
Data request
{MOD} needs
information from
{MOD2}
{MOD}.request.{MOD2}
{
“operation”: string (request type identifier),
“keyId”: string (identifier used for the response)
“params”: accorded format for the request
between related partners
}
For instance: {
“operation”: “get_forecast”,
“keyId”: “EUND/efg3G”
“params”: ”period=24h”
}
Data response
{MOD} responds to
a request from
{MOD2}
{MOD}.response.{MOD
2}
{
“keyId”: string (same identifier as the data request
message which sourced this response)
“response”: string (JSON)
}

136
For instance, (in response to example of previous
row): {
“keyId”: “EUND/efg3G”
“response”: [23.4, 33.0, 30.0, … 45.9]
}

137
Annex 4. Definition of messages related to
modules
A4.1. Consumer Comfort/Well-being Module
The list of messages for this module are:
Table 20: List of messages in Consumer Comfort/Well-being module
Message
Message name
and description
Subject
Message subject
Payload
Message itself
Data request
M1 needs
information from
M4
M1.request.M4
{
“operation”: String [request type identifier],
“keyId”: String [identifier used for the response]
“params”: accorded format for the request
between related partners
}
For instance: {
“operation”: “indoor temperature”,
“keyId”: “EUND/efg3G”
“params”: { userID=”1”, ”period=24h” }
}
For instance: {
“operation”: “indoor humidity”,
“keyId”: “EUND/efg3G”
“params”: { userID=”1”, ”period=24h” }
}
Data response
M4 responds to a
request from M1
M4.response.M1 {
“keyId”: String (same identifier as the data request
message which sourced this response)
“response”: String (JSON)
}
For instance, (in response to example of previous
row): {
“keyId”: “EUND/efg3G”
“response”: [23.4, 22.0, 23.0, … 22.9]

138
}
For instance, (in response to example of previous
row): {
“keyId”: “EUND/efg3G”
“response”: [55.4, 55.0, 52.0, … 57.9]
}
A4.2. Consumer demand flexibility profiling Module
This module does not send specific messages, but common messages.
A4.3. Neighbourhood demand flexibility profiling Module
This module does not send specific messages, but common messages.
A4.4. Home & Tertiary real-time Energy monitoring
Table 21: List of messages in Home & Tertiary real-time Energy monitoring
Message
Message name
and description
Subject
Message subject
Payload
Message itself
Data Request
Short
description of
the message
M4.Timeseries.MonitorData [
{
"id": 0,
"referenceDateFrom": "2021-06-
25T16:07:37.696Z",
"referenceDateTo": "2021-06-
25T16:07:37.696Z",
"energy": 0,
"reactiveEnergy": 0,
"minVoltage": 0,
"maxVoltage": 0,
"vendorMeter": {
"vendorMeterId": "string",
"channel": "string"

139
}
}
]
Data response
Possible
message for the
real VS optimal
users energy
behaviour
M4.Timeseries.
EnergyBehaviour
{
"id": 0,
"assetId": 0,
"discomfort": 0,
"status": "SOLVED/UNSOLVED",
"result": {
"optimizationReferenceId": 0,
"canonicalOffpeakCost": 0,
"realFlexCost": 0,
"optimizedFlexCost": 0,
"optimizedCycleTimes": [
{
"assetReferenceId": 0,
"nodeName": "string",
"canonicalCost": 0,
"optimizedCost": 0,
"optimizedCycleTimes": {
"additionalProp1": [
{
"from": 0,
"to": 0
}
],
"additionalProp2": [
{
"from": 0,
"to": 0
}
],
"additionalProp3": [
{
"from": 0,
"to": 0
}
]
}
}

140
],
"powerDistributions": {
"additionalProp1": [
{
"from": 0,
"to": 0,
"power": 0
}
],
"additionalProp2": [
{
"from": 0,
"to": 0,
"power": 0
}
],
"additionalProp3": [
{
"from": 0,
"to": 0,
"power": 0
}
]
}
}
}
A4.5. DER management Module
For this module, messages use the following data structures:
• String: String, serial of characters.
• Float: Real value.
• ISODate: String representing a date with format ISO Date.
• Timeseries: JSON containing the value of local res in an interval of time:
{
“start”: ISODate (when the period starts),
“end”: ISODate (when the period ends),
“value”: Float (share of local res)
}
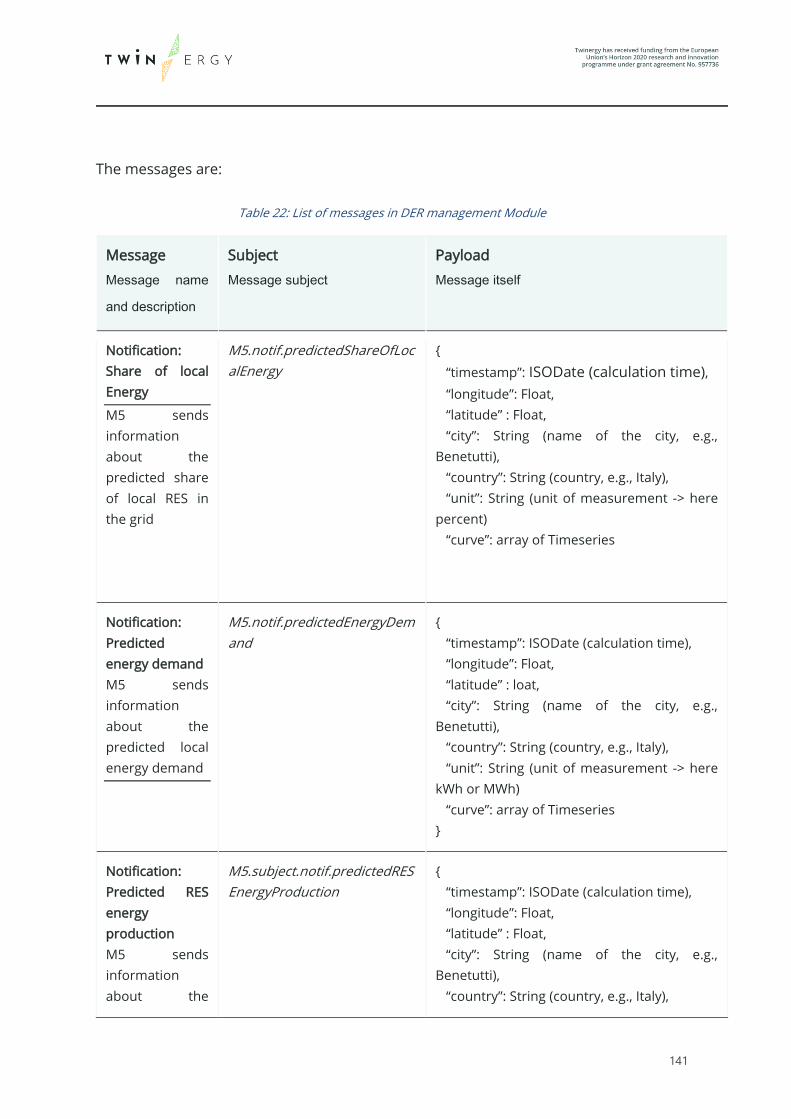
141
The messages are:
Table 22: List of messages in DER management Module
Message
Message name
and description
Subject
Message subject
Payload
Message itself
Notification:
Share of local
Energy
M5 sends
information
about the
predicted share
of local RES in
the grid
M5.notif.predictedShareOfLoc
alEnergy
{
“timestamp”: ISODate (calculation time),
“longitude”: Float,
“latitude” : Float,
“city”: String (name of the city, e.g.,
Benetutti),
“country”: String (country, e.g., Italy),
“unit”: String (unit of measurement -> here
percent)
“curve”: array of Timeseries
Notification:
Predicted
energy demand
M5 sends
information
about the
predicted local
energy demand
M5.notif.predictedEnergyDem
and
{
“timestamp”: ISODate (calculation time),
“longitude”: Float,
“latitude” : loat,
“city”: String (name of the city, e.g.,
Benetutti),
“country”: String (country, e.g., Italy),
“unit”: String (unit of measurement -> here
kWh or MWh)
“curve”: array of Timeseries
}
Notification:
Predicted RES
energy
production
M5 sends
information
about the
M5.subject.notif.predictedRES
EnergyProduction
{
“timestamp”: ISODate (calculation time),
“longitude”: Float,
“latitude” : Float,
“city”: String (name of the city, e.g.,
Benetutti),
“country”: String (country, e.g., Italy),

142
predicted local
res production
“unit”: String (unit of measurement -> here
kWh or MWh)
“curve”: array of Timeseries
}
Notification:
Consumer DR
Signal
M5 sends
information
about the local
DR-Signal (if
directly used by
HEMS)
M5.notif.consumerDRSignal {
“timestamp”: ISODate (calculation time),
“longitude”: Float,
“latitude” : Float,
“city”: String (name of the city, e.g.,
Benetutti),
“country”: String (country, e.g., Italy),
“unit”: String (unit of measurement -> here
unitless)
“curve”: array of Timeseries
}
A4.6. Risk Management and event handling Module
Table 23: List of messages in Risk Management and event handling module
Message
Message name
and description
Subject
Message subject
Payload
Message itself
Notification:
Anomaly
Detection of
anomalies in the
energy patterns
{M6}.{notif}.{anlomay} {
"id": 0,
"referenceDateFrom": "2021-06-
25T16:07:37.696Z",
"referenceDateTo": "2021-06-
25T16:07:37.696Z",
“longitude”: Float,
“latitude” : Float,
“city”: String
“country”: String (country, e.g., Italy),
“Event”: array of Timeseries
}
A4.7. TwinEV Module
For this module, the messages use the following data structures:
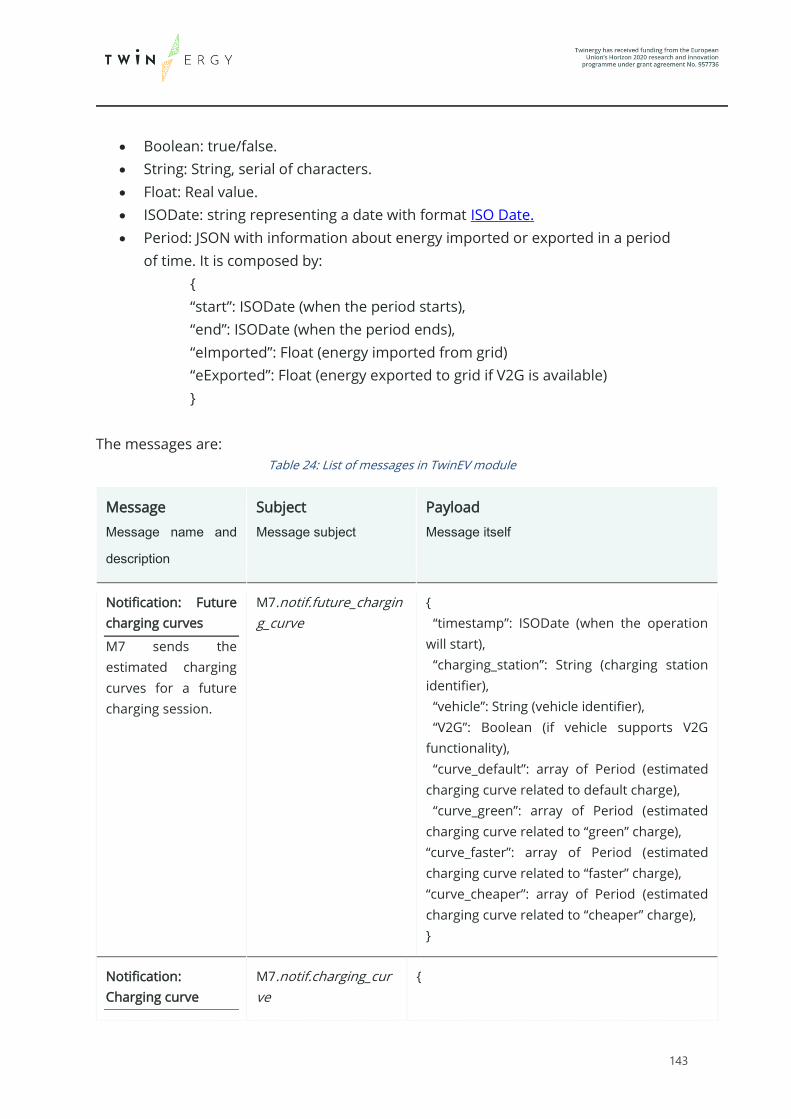
143
• Boolean: true/false.
• String: String, serial of characters.
• Float: Real value.
• ISODate: string representing a date with format ISO Date.
• Period: JSON with information about energy imported or exported in a period
of time. It is composed by:
{
“start”: ISODate (when the period starts),
“end”: ISODate (when the period ends),
“eImported”: Float (energy imported from grid)
“eExported”: Float (energy exported to grid if V2G is available)
}
The messages are:
Table 24: List of messages in TwinEV module
Message
Message name and
description
Subject
Message subject
Payload
Message itself
Notification: Future
charging curves
M7 sends the
estimated charging
curves for a future
charging session.
M7.notif.future_chargin
g_curve
{
“timestamp”: ISODate (when the operation
will start),
“charging_station”: String (charging station
identifier),
“vehicle”: String (vehicle identifier),
“V2G”: Boolean (if vehicle supports V2G
functionality),
“curve_default”: array of Period (estimated
charging curve related to default charge),
“curve_green”: array of Period (estimated
charging curve related to “green” charge),
“curve_faster”: array of Period (estimated
charging curve related to “faster” charge),
“curve_cheaper”: array of Period (estimated
charging curve related to “cheaper” charge),
}
Notification:
Charging curve
M7.notif.charging_cur
ve
{

144
M7 sends
information about
the charging curve
for a charging
session
“timestamp”: ISODate (when the operation
starts),
“charging_station”: String (charging station
identifier),
“vehicle”: String (vehicle identifier),
“V2G”: Boolean (vehicle supports V2G
functionality)
“curve”: array of Period (curve calculated for
this session)
}
Notification: New
restrictions to the
grid
M7 sends the
restrictions for the
grid, configured by
the DSO
M7.notif.dso_restriction
s
{
“start”: ISODate (when restrictions become
valid),
“end”: ISODate (when restrictions become
invalid),
“V2G”: Boolean (needs to use V2G when
possible),
“max”: Float (Maximal power to be supplied
by the charging points),
“min”: Float (Minimal power to be supplied by
the charging points)
}
Notification: new
eVehicle user
M7 notifies a new
user with electric
vehicle.
M7.notif.new_eVehicle {
“timestamp”: ISODate (creation date),
“user”: String (user identifier),
“vehicle”: String (vehicle identifier),
“storage”: String (collection/storage system
where related data is stored)
“register”: String (identifier of the register
containing the data)
}
Notification:
Removed eVehicle
user
M7 notifies that has
removed a user with
electric vehicle
M7.notif.remove_eVehic
le
{
“timestamp”: ISODate (removing date),
“user”: String (user identifier),
“vehicle”: String (vehicle identifier)
}

145
Notification: New
charging point
M7 notifies a new
charging point
belonging to a
charging station
M7.notif.future_chargin
g_curve
{
“timestamp”: ISODate (creation date),
“CP”: String (charging point identifier),
“CS”: String (charging station identifier),
“storage”: String (collection/storage system
where related data is stored)
“register”: String (identifier of the register
containing the data)
}
Notification:
Charging point
removed
M7 notifies that has
removed a charging
point belonging to a
charging station
M7.notif.dso_restriction
s
{
“timestamp”: ISODate (removing date),
“CP”: String (charging point identifier),
“CS”: String (charging station identifier)
}
A4.8. Social Network Module
For this module, the messages use the following data structures:
• Boolean: true/false.
• String: String, serial of characters.
• Float: Real value.
• ISODate: string representing a date with format ISO Date.
• SinglePeriod: JSON with information about periods of time. It is composed by:
{
“start”: ISODate (when the period starts),
“end”: ISODate (when the period ends)
}
• EnergyPeriod: JSON with information about energy imported and exported in
each period of time. It is composed by:
{
“start”: ISODate (when the period starts),
“end”: ISODate (when the period ends),
“eImported”: Float (energy imported from grid)
“eExported”: Float (energy exported to grid if V2G is available)
}

146
• ChargePeriod: JSON with information about charge in each period of time. It is
composed by:
{
“start”: ISODate (when the period starts),
“end”: ISODate (when the period ends),
“eCharge”: Float (energy used)
“eDischarge”: Float (energy exported to grid if discharging)
}
• Recommendation: JSON with information about a challenge:
{
“start”: ISODate (when the period starts),
“end”: ISODate (when the period ends),
“description”: String (challenge description),
“target”: Float (challenge target)
}
• Consumer: JSON with information about a consumer:
{
“user”: String (consumer identifier),
“location”: String (user location)
}
• Reward: JSON with information about a reward:
{
“reward”: String (reward identifier)
“description”: String (reward description)
}
• Setting: JSON containing a setting:
{
“setting”: String (setting identifier)
“description”: String (setting description)
“value”: String (setting value)
}
The messages are:

147
Table 25: List of messages in Social Networking module
Message
Message name
and description
Subject
Message subject
Payload
Message itself
Data request
M8 needs
information from
M3-4
M8.request.M4
Depending on the request, the message will be one of
these JSONs:
{
“operation”: String (“get_gener_forecast”),
“keyId”: String( “EUND/efg3G”),
“assetId”: String (e.g., “PV1”),
“Period”: array of SinglePeriod,
“forecast”: array of Float (values in kWh)
}
{
“operation”: String (“get_smart-meter_load”),
“keyId”: String (“EUND/efg3G”),
“meteringPointId”: string(e.g.,, House1),
“Period”: array of SinglePeriod,
“energyMeter”: array of Float (energy in kWh)
}
{
“operation”: String (“get_current_load”),
“keyId”: String(“EUND/efg3G”),
“timestamp”: ISODate,
“device”: String (device identifier)
“smart”: Boolean (smart device)
}
{
“operation”: String (“get_smartDevices_schedules”),
“keyId”: String(“EUND/efg3G”),
“userID”: String (e.g., “House1”),
“device”: String (device identifier),
“Period”: array of SinglePeriod,
“curve”: array of Float
}
Data request M8.request.M5
Depending on the request, the message will be one of
these JSONs:

148
M8 needs
information from
M5
{
“operation”: String( “get_EV_chargingStatus”),
“keyId”: String (“EUND/efg3G”),
“charging_station”: String (charging station
identifier),
“vehicle”: String (vehicle identifier),
“V2G”: Boolean (vehicle supports V2G functionality)
“curve”: array of EnergyPeriod (per each period of
time, the energy imported-exported)
}
{
“operation”: String (“get_BESS_status”),
“keyId”: String (“EUND/efg3G”)
“BESSid”: String (battery identifier),
“curve”: array of ChargePeriod (per each period of
time, the energy imported-exported)
}
Notification:
Consumers
Recommendation
s
M8 sends
information
about
recommendation
s on neighbouring
consumers for
energy challenge
M8.notif.consu
mers_rec
{
“timestamp”: ISODate,
“neighbourhood”: String (neighbourhood identifier),
“consumer”: String (consumer identifier),
“recs”: array of Recommendation (challenge target
per each period of time)
}
Notification:
Neighbourhood
Users
M8 sends
information
about set of
potential
candidate users
from the
M8.notif.neighb
ourhood_users
{
“timestamp”: ISODate (when the operation starts),
“neighbourhood”: String (neighbourhood identifier),
“consumers”: array of Consumer (per each
neighbourhood)
}

149
neighbourhood
(recommendation
s)
Notification: User
Rewards
M8 sends
information
about user
rewards via
‘TwinERGY Points’
or badges
M8.notif.user_re
wards
{
“timestamp”: ISODate (when the operation starts),
“user”: String (user identifier),
“type”: Boolean (TwinERGY Points or badges),
“points”: Float (TwinERGY Points),
“rewards”: array of Rewards (for each user)
}
Notification: User
Settings
M8 sends
information
about user
configuration file
for selected
consumption
settings
M8.notif.user_co
nfiguration_setti
ngs
{
“timestamp”: ISODate (when the operation starts),
“user”: string (user identifier),
“settings”: array of Setting (for each user)
}
A4.9. Transactive Energy Module
Table 26: List of messages in Transactive Energy Module
Message
Message
name and
description
Subject
Message subject
Payload
Message itself
Notifictation:
Error code
Expectation
that
prosumers
and devices
M9.notif.error
{
“timestamp”: string (ISO
Date when the message
is broadcasted),
“code”: integer (HTTP
code 400-599, referenced
here),

150
joining the
TwinERGY
network are
also
broadcasted
via the NAT
server.
“message”: string
(human readable string)
}
TEM custom error code
messages
{
“code”: 409,
“message”:
“Prosumer account
already exists”
“Device already exists”
“Device already has an
existing prosumer
relation”
“Device already has an
existing consortium
relation”
“Prosumer is already a
member of the
consortium”
“Prosumer account does
not exist”
“Device does not exist”
“Consortium does not
exist”
“No data available for
date range”
“Transaction destination
unknown”
}
Notification:
Forecasting
of LEM price
TEM
broadcasts
the total
transacted
energy for a
specific
period
M9.notif.forecast.lem_price
{
“timestamp”: string (ISO
Date when the message
is broadcasted),
“lem_ID”: string (LEM
identifier),
“price_kwh”: array of
Period (96 price values)
“dso_price”: array of
Period (96 price values)
}
Data
Request
M5.notif.predictedShareOfLocalEnergy
M5.notif.predictedEnergyDemand

151
M9 needs
information
from M5
M5.subject.notif.predictedRESEnergyProduction
M5.notif.consumerDRSignal
Data
Request
M9 needs
information
from M4
Pending messaging from STAM which is relying
on the pilot site equipment
Data
Request
M9 needs
information
from Digital
Twins

152