Improved aortic stiffness assessment in the elderly using a one‐dimensional fluid displacement MR...
8
Original Research Improved Aortic Stiffness Assessment in the Elderly Using a One-Dimensional Fluid Displacement MR Method Kenneth A. Kraft, PhD, 1 * Ding-Yu Fei, PhD, 2 Xianzhi Shao, PhD, 3 Yung-Yeh Chang, MS, 2 and Ross Arena, PhD 4 Purpose: To assess the in vitro accuracy of two rapid pro- jective MR wave velocity measurement sequences, and their relative performance for assessing aortic stiffness in adults of all ages. Materials and Methods: In vitro testing was performed using latex tube phantoms with precisely-known flow wave velocities, both in the presence and absence of simulated static tissue. A total of 104 adults representing a large age range (21– 83 years) underwent aortic wave velocity (AWV) measurements using multiple trials of each method in a single MR session. The relative agreement between the two AWV results in each tertile of subject age and the coefficient of variation of the AWV data were assessed. Results: In vitro wave velocities did not differ significantly from the known values for either MR method, with or with- out simulated static tissue. In vivo, the mean AWVs for the young and middle-aged cohorts did not differ significantly between the two MR methods. However, in the elderly group, the two methods did not agree, and one sequence was found to be superior in this age cohort. Conclusion: In elderly individuals, a one-dimensional MR method for evaluating aortic stiffness based on aortic blood displacement yields a smaller coefficient of variation and superior overall performance than a similar method based on aortic blood velocity. The two methods perform equiva- lently in young and middle-aged subjects. Key Words: aortic stiffness; MR pulse sequences; compar- ative study; human aging; wave velocity J. Magn. Reson. Imaging 2006;24:603– 610. © 2006 Wiley-Liss, Inc. ELEVATED CENTRAL ARTERIAL stiffness has recently attracted increasing clinical attention because of its strong association with cardiovascular mortality and morbidity in at-risk populations (1–5). Although a num- ber of noninvasive methods of measuring aortic stiff- ness have been described to date, most suffer signifi- cant drawbacks. For example, direct assessment of aortic distensibility (6) using any imaging modality re- quires knowledge of the central arterial pulse pressure, which is difficult to obtain noninvasively. Instead, pe- ripheral (brachial) pulse pressure is commonly used, which is reportedly a poor substitute (7,8). Alterna- tively, stiffness can be indirectly assessed via the rate of propagation of the pressure or flow wave (the wave velocity) in a vessel. However, transit-time ultrasonic or tonometric techniques such as carotid–femoral wave velocity (9) use body surface measurements to estimate arterial length, and therefore fail to account for the three-dimensional and sometimes tortuous in vivo ar- terial geometry. In addition, although the central aorta is the desired target vessel, the carotid–femoral wave velocity technique inherently omits the most proximal aortic segment, and instead represents an average over multiple (elastic and muscular) arterial segments. In principle, because of its high degree of spatial ac- curacy and the absence of acoustic window limitations, MR is an ideal modality for measuring aortic wave ve- locity (AWV). To date, the main disadvantage of most MR-based measures of aortic stiffness has been lengthy acquisition time (10 –12), which increases vulnerability to cardiac gating problems such as heart rate variabil- ity, and therefore discourages widespread clinical de- ployment. Proposed strategies to reduce acquisition time using projective sequences have either required complex correction factors to overcome intravoxel phase dispersion (13), or rely on linear pencil-beam excitation of the artery of interest (14). The latter tech- nique requires that a significant length of the thoracic aorta be straight, which effectively limits the utility of 1 Department of Radiology, Virginia Commonwealth University, Rich- mond, Virginia, USA. 2 Department of Biomedical Engineering, Virginia Commonwealth Uni- versity, Richmond, Virginia, USA. 3 Aspyra Inc., Jacksonville, Florida, USA. 4 Department of Physical Therapy, Virginia Commonwealth University, Richmond, Virginia, USA. Grant sponsor: Virginia Commonwealth University General Clinical Research Center; Grant sponsor: National Institutes of Health (NIH); Grant number: R01 HL069962; Grant sponsor: National Institutes of Health (NIH), National Center for Research Resources (NCRR); Grant number: M01 RR00065. Presented in part at the 13th Annual Meeting of ISMRM, Miami Beach, FL, USA, 2005. *Address reprint requests to: K.A.K., PhD, Department of Radiology, Post Office Box 980072, Virginia Commonwealth University, Rich- mond, Virginia 23298-0072. E-mail:[email protected] Received July 21, 2005; Accepted May 5, 2006. DOI 10.1002/jmri.20663 Published online 28 July 2006 in Wiley InterScience (www.interscience. wiley.com). JOURNAL OF MAGNETIC RESONANCE IMAGING 24:603– 610 (2006) © 2006 Wiley-Liss, Inc. 603
-
Upload
independent -
Category
Documents
-
view
1 -
download
0
Transcript of Improved aortic stiffness assessment in the elderly using a one‐dimensional fluid displacement MR...

Original Research
Improved Aortic Stiffness Assessment in theElderly Using a One-Dimensional FluidDisplacement MR MethodKenneth A. Kraft, PhD,1* Ding-Yu Fei, PhD,2 Xianzhi Shao, PhD,3 Yung-Yeh Chang, MS,2
and Ross Arena, PhD4
Purpose: To assess the in vitro accuracy of two rapid pro-jective MR wave velocity measurement sequences, andtheir relative performance for assessing aortic stiffness inadults of all ages.
Materials and Methods: In vitro testing was performedusing latex tube phantoms with precisely-known flow wavevelocities, both in the presence and absence of simulatedstatic tissue. A total of 104 adults representing a large agerange (21–83 years) underwent aortic wave velocity (AWV)measurements using multiple trials of each method in asingle MR session. The relative agreement between the twoAWV results in each tertile of subject age and the coefficientof variation of the AWV data were assessed.
Results: In vitro wave velocities did not differ significantlyfrom the known values for either MR method, with or with-out simulated static tissue. In vivo, the mean AWVs for theyoung and middle-aged cohorts did not differ significantlybetween the two MR methods. However, in the elderlygroup, the two methods did not agree, and one sequencewas found to be superior in this age cohort.
Conclusion: In elderly individuals, a one-dimensional MRmethod for evaluating aortic stiffness based on aortic blooddisplacement yields a smaller coefficient of variation andsuperior overall performance than a similar method basedon aortic blood velocity. The two methods perform equiva-lently in young and middle-aged subjects.
Key Words: aortic stiffness; MR pulse sequences; compar-ative study; human aging; wave velocityJ. Magn. Reson. Imaging 2006;24:603–610.© 2006 Wiley-Liss, Inc.
ELEVATED CENTRAL ARTERIAL stiffness has recentlyattracted increasing clinical attention because of itsstrong association with cardiovascular mortality andmorbidity in at-risk populations (1–5). Although a num-ber of noninvasive methods of measuring aortic stiff-ness have been described to date, most suffer signifi-cant drawbacks. For example, direct assessment ofaortic distensibility (6) using any imaging modality re-quires knowledge of the central arterial pulse pressure,which is difficult to obtain noninvasively. Instead, pe-ripheral (brachial) pulse pressure is commonly used,which is reportedly a poor substitute (7,8). Alterna-tively, stiffness can be indirectly assessed via the rate ofpropagation of the pressure or flow wave (the wavevelocity) in a vessel. However, transit-time ultrasonic ortonometric techniques such as carotid–femoral wavevelocity (9) use body surface measurements to estimatearterial length, and therefore fail to account for thethree-dimensional and sometimes tortuous in vivo ar-terial geometry. In addition, although the central aortais the desired target vessel, the carotid–femoral wavevelocity technique inherently omits the most proximalaortic segment, and instead represents an average overmultiple (elastic and muscular) arterial segments.
In principle, because of its high degree of spatial ac-curacy and the absence of acoustic window limitations,MR is an ideal modality for measuring aortic wave ve-locity (AWV). To date, the main disadvantage of mostMR-based measures of aortic stiffness has been lengthyacquisition time (10–12), which increases vulnerabilityto cardiac gating problems such as heart rate variabil-ity, and therefore discourages widespread clinical de-ployment. Proposed strategies to reduce acquisitiontime using projective sequences have either requiredcomplex correction factors to overcome intravoxelphase dispersion (13), or rely on linear pencil-beamexcitation of the artery of interest (14). The latter tech-nique requires that a significant length of the thoracicaorta be straight, which effectively limits the utility of
1Department of Radiology, Virginia Commonwealth University, Rich-mond, Virginia, USA.2Department of Biomedical Engineering, Virginia Commonwealth Uni-versity, Richmond, Virginia, USA.3Aspyra Inc., Jacksonville, Florida, USA.4Department of Physical Therapy, Virginia Commonwealth University,Richmond, Virginia, USA.Grant sponsor: Virginia Commonwealth University General ClinicalResearch Center; Grant sponsor: National Institutes of Health (NIH);Grant number: R01 HL069962; Grant sponsor: National Institutes ofHealth (NIH), National Center for Research Resources (NCRR); Grantnumber: M01 RR00065.Presented in part at the 13th Annual Meeting of ISMRM, Miami Beach,FL, USA, 2005.*Address reprint requests to: K.A.K., PhD, Department of Radiology,Post Office Box 980072, Virginia Commonwealth University, Rich-mond, Virginia 23298-0072. E-mail:[email protected] July 21, 2005; Accepted May 5, 2006.DOI 10.1002/jmri.20663Published online 28 July 2006 in Wiley InterScience (www.interscience.wiley.com).
JOURNAL OF MAGNETIC RESONANCE IMAGING 24:603–610 (2006)
© 2006 Wiley-Liss, Inc. 603

this method to a subset of relatively young subjects. Formaximum clinical applicability, an ideal method shouldoffer both rapid and accurate assessment of aortic stiff-ness in all populations, including the elderly.
We have previously proposed two one-dimensionalprojection MR sequences for assessing AWV in the hu-man descending thoracic aorta within a single cardiaccycle (15,16). The axial projective excitation strategycommon to both sequences offers the distinct advan-tage of accommodating nonlinear vessel geometries.Likewise, the use of time-of-flight motion encodingovercomes intravoxel phase dispersion limitations. Thefirst sequence (15) (herein termed the “velocity method”)is designed to simultaneously measure systolic bloodvelocity at two discrete axial sites along the aorta. Thesecond sequence (16) (termed the “displacementmethod”) tracks the concurrent movement of blood atmultiple closely spaced vessel sites. Both techniquesemploy postprocessing of the one-dimensional data toextract the resultant wave velocity. To date, no large-scale study has been conducted to assess the compar-ative in vivo effectiveness of these two methods in sub-jects of all ages. Therefore, the purpose of this studywas to verify the measurement accuracy of these twoMR wave velocity methods in latex tube phantoms, aswell as the relative in vivo performance of both methodsfor assessing AWV in over 100 adult subjects represent-ing a large age range.
MATERIALS AND METHODS
Latex Tube Phantoms
The accuracy and precision of wave velocity (WV) re-sults from the two MR methods were assessed usingwater-filled compliant latex tubes and a pulsatilepump, as described previously (16). Briefly, a thin-walltube having a WV typical of a human aorta (�5.5m/second) as well as a thick-wall tube representative ofthe upper limit of aortic WV (�16 m/second) were se-quentially subjected to MR measurements and the re-sults were compared with accurate pressure-based WVdeterminations. The latter measurements were ob-tained using two pressure transducers separated by alarge length (0.5–0.8 m) of tubing, in order to reducemeasurement error. MR data were acquired both in theabsence and presence of an adjacent water bath (4-cmdeep) to simulate static tissue in vivo. Fifteen repeti-tions of each measurement configuration were acquiredto assess reproducibility.
Human Subjects
A total of 104 adults (55 men, 49 women, age range21–83 years) underwent AWV measurements usingboth the velocity and displacement methods in a singleMR session. None of the participants had a history ofmyocardial infarction, stroke, peripheral arterial dis-ease, heart failure, cardiac arrhythmia, or diabetes, al-though some (8.6%) were taking antihypertensive med-ication. The university Institutional Review Boardapproved the study, and all participants provided in-formed consent.
MRI
All in vitro and in vivo WV data were acquired using aclinical 1.5-T MR system (Vision, Siemens Medical So-lutions, Erlangen, Germany). A standard spine arraysurface coil was used for signal reception. After posi-tioning of electrocardiogram leads, subjects were posi-tioned supine on the coil and centered in the magnetusing the xiphisternum as an anatomical landmark.Transaxial and sagittal scout images through the de-scending thoracic aorta were acquired initially. Thesagittal image was used to guide the positioning andangulation of subsequent AWV sequences (excitationsorthogonal to the vessel long-axis) as well as for posi-tioning spatial saturation (parallel to the aorta, appliedover the spine and adjacent muscle and skin). Next,using these geometrical prescriptions, a test run of thevelocity method was conducted in order to determinethe delay between the R-wave trigger and onset of sys-tolic flow in the descending aorta. This time intervalvaried from subject to subject, and was used to tailor asoftware variable delay coded within both AWV mea-surement sequences. Finally, at least seven trials ofeach AWV method were acquired. Subjects were askedto hold their breath during each trial of the velocitymethod, but were allowed to breathe freely during thedisplacement method acquisitions. After each MR ac-quisition, raw data were wirelessly offloaded to a per-sonal computer for data processing and analysis, asdescribed previously (17). In order to discern possiblesystematic differences between the two MR methodsdue to subject age, AWV data were partitioned by sub-ject age tertile. The AWV coefficient of variation (CV)was also computed for each individual and each MRmethod; the average CV within each age tertile wasemployed as a metric of the relative reproducibility ofeach MR technique.
The strategic approaches adopted for our two AWVmethods are outlined in Figs. 1 and 2, and are illus-trated using data acquired from the thick-wall latextube phantom. The velocity method (Fig. 1a) employsrepeated application of a dual-excitation radiofre-quency (RF) pulse, oriented perpendicular to the vessellong axis (Fig. 1b). The pulse employs a cosine-modu-lated Gaussian waveform, which simultaneously ex-cites both (upstream and downstream) vessel sites (15).Because a single gradient (nominally the Z gradient) isused for both excitation and echo acquisition, the re-sulting data represent one-dimensional projections. Inthe absence of flow, the Fourier-transformed echoessimply reveal the RF excitation profile, namely twopeaks positioned at the excitation frequencies.However, when fluid motion occurs, the peaks arefrequency-shifted in the direction of and in direct pro-portion to the flow velocity. Hence, rapid repeated mea-surement of such frequency shifts (relative to the zero-flow baseline) permits the pulsatile fluid velocitywaveform to be reproduced at two discrete vessel sitesin pseudo-real-time. Quantitatively, the instantaneousfluid velocity (at each vessel site) is equal to the corre-sponding peak’s frequency shift in Hertz, divided by thequantity (�p � G � TE), where �p is the proton gyromag-netic ratio, G is the read gradient amplitude, and TE is
604 Kraft et al.
the echo time. Parameters chosen for the velocitymethod (Fig. 1a) include: TR � 5.5 msec, TE � 6.5msec, RF pulse duration � 896 �sec, flip angle � 30°,receiver bandwidth 62.5 kHz (in vitro) or 125 kHz (invivo), and separation between upstream and down-stream sites � 84 mm. The number of echoes acquiredper measurement was typically 64,
Figure 1c depicts the passage of a single pulse of waterthrough the phantom within a 166-msec interval of time(30 echoes acquired in this case). Each of the gradientechoes was zero-padded to improve velocity resolutionand then Fourier-transformed separately. By simply
stacking the one-dimensional data in temporal sequence,the resulting time–velocity plot is created. By inspection, asmall delay is evident in the temporal position of thedownstream (rightmost) velocity waveform, with respectto that of the upstream. This delay quantifies the propa-gation rate (wave velocity), which is characteristic of thiscompliant vessel. Fitting the initial part of the velocitywaveforms to a polynomial function allows the temporaldelay to be accurately evaluated (17). The wave velocity issimply the distance between the two excitation sites (84mm in our implementation) divided by the calculated tem-poral delay. In vivo, if the aortic segment being evaluatedis not straight, the actual intraluminal path length be-tween excitation sites is measured from the scout imagesand used in the AWV calculation.
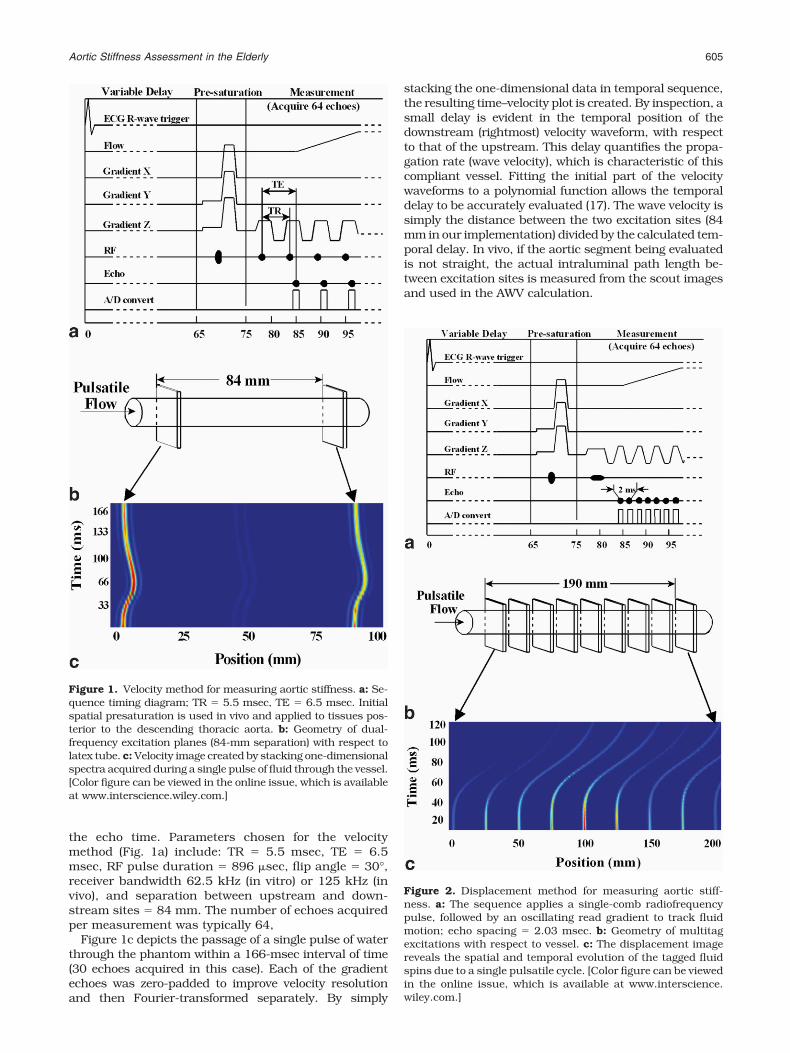
Figure 2. Displacement method for measuring aortic stiff-ness. a: The sequence applies a single-comb radiofrequencypulse, followed by an oscillating read gradient to track fluidmotion; echo spacing � 2.03 msec. b: Geometry of multitagexcitations with respect to vessel. c: The displacement imagereveals the spatial and temporal evolution of the tagged fluidspins due to a single pulsatile cycle. [Color figure can be viewedin the online issue, which is available at www.interscience.wiley.com.]
Figure 1. Velocity method for measuring aortic stiffness. a: Se-quence timing diagram; TR � 5.5 msec, TE � 6.5 msec. Initialspatial presaturation is used in vivo and applied to tissues pos-terior to the descending thoracic aorta. b: Geometry of dual-frequency excitation planes (84-mm separation) with respect tolatex tube. c: Velocity image created by stacking one-dimensionalspectra acquired during a single pulse of fluid through the vessel.[Color figure can be viewed in the online issue, which is availableat www.interscience.wiley.com.]
Aortic Stiffness Assessment in the Elderly 605

A major concern with in vivo determinations of AWVusing the velocity method is achieving adequate sup-pression of static signal. This is because only a smallfraction of signal within a paraxial section through thethorax arises from aortic blood. Without substantialsuppression of extraaortic tissue, the blood signalwould be dwarfed or even completely obscured by themuch larger static signal component. Accordingly, twocomplementary tactics are simultaneously used in vivoto substantially diminish the intensity of such signals.The first step is to apply a conventional spatial pre-saturation pulse (Fig. 1a) in the coronal plane posteriorto the descending thoracic aorta. A hollow cylindricalpresaturation scheme described previously (15) was notused in this study, because it causes excessive signalloss in subjects with curved aortas, which is frequentlythe case among the elderly. The second step is to ac-quire an identical “mask” measurement during cardiacdiastole (18), one heartbeat after the normal systolicacquisition. Time domain subtraction of the diastolicfrom the systolic dataset preferentially cancels staticsignal, while leaving unscathed the frequency-shiftedsignal from aortic blood. Breathholding was routinelyused with this wave velocity method because it wasfound to improve data quality, presumably by minimiz-ing respiration-induced movement of static structuresbetween the systolic and diastolic acquisitions.
The displacement method (Fig. 2a) differs from that ofFig. 1 in two principal respects. First, the RF excitationpulse is designed to excite not just two, but multiplethin sites (Fig. 2b) along the vessel. The pulse itself wascreated by concatenating alternating frequencies of twocosine functions, with a Hamming window applied toshape the envelope (16). Second, the comb excitation isapplied only once, and subsequent motion of the mag-netically tagged fluid spins is followed using an oscil-lating frequency-encoding gradient. The echo spacingof 2.03 msec confers improved temporal resolution tothis method in comparison with the velocity method.Also, because the AWV measurement involves only oneRF pulse, the optimal flip angle is 90° and TR is unde-fined. Other relevant parameters for this sequence are:variable TE (increments of 2.03 msec), number of ech-oes � 64, RF pulse duration � 3.2 msec, receiver band-width 125 kHz, number of excitation sites � 9, andseparation between adjacent excitations � 22.6 mm.
In the latex tube phantom, a stack plot of the individ-ual Fourier-transformed echoes yields the time-posi-tion (displacement) plot depicted in Fig. 2c. Wave veloc-ity can be extracted from the displacement data eitherby direct fitting of the curves to a mathematical model,or by first differentiating the displacement curves andevaluating the resultant velocity curves. In vivo, curva-ture of the descending aorta can also be corrected withthis method, as previously described (16). Similarly tothe velocity method, posterior presaturation is alsoused in vivo to minimize the intensity of static signal.However, diastolic signal subtraction was not found tobe decidedly helpful in this method, and was thereforenot used. Consequently, breathholding was unneces-sary.
RESULTS
In Vitro Results
Table 1 presents wave velocity results for the latex tubephantoms. Data are shown for both the MR velocity andMR displacement methods, and for the thin-wall andthick-wall latex tubes with and without the adjacentstatic water bath. For comparison, the “true” wave ve-locity for each tube is denoted in Table 1 as the “dualpressure” method. Although the standard deviation ofthe MR wave velocities increased when the water bathwas present, none of the MR results differed signifi-cantly from the corresponding dual pressure value byone-way analysis of variance (ANOVA).
In Vivo Results
AWV data amenable to analysis were successfully ac-quired from all 104 subjects. A representative aorticvelocity image acquired from a 24-year-old male subjectis displayed in Fig. 3. The upper panel depicts a sagittalscout image of the descending thoracic aorta, with over-laid oblique vertical lines illustrating the sites and ori-entation of RF tagging. In the velocity image (lowerpanel), time increases vertically from bottom to top,with a measurement duration of 352 msec. The hori-zontal axis represents a 200-mm field of view within thethorax in approximately the cranial–caudal direction.Residual static signals appear in the velocity image asstraight vertical bands of intensity at the two excitationsites. Systolic blood flow in the descending thoracicaorta occurs from left to right in this orientation, and isrevealed in the velocity image as the two signal traces(identified by black arrows in Fig. 3), which emergerightward from the static signals at an early time pointand subsequently return at end-systole. The AWV isextracted by polynomial fitting of the early phase of thesystolic velocity waveforms (17).
Figure 4 shows an example of a displacement imageacquired from a 51-year-old male subject. Again, thevertical lines overlaid on the scout image (upper panel)represent tissue planes excited by the multifrequencyRF pulse, and the lower panel is a spatial–time plotexactly analogous to that of Fig. 3. However, the ap-pearance of tagged aortic blood is qualitatively differentin that cumulative motion is tracked throughout earlysystole (128 msec duration). Identification of the time ofinitial acceleration at each tag site (the flow “feet”) al-lows the AWV to be quantified. This is shown in Fig. 4 asthe quasihorizontal line overlaid on the displacement
Table 1In Vitro Wave Velocity (WV) Results in Thin-Wall and Thick-WallLatex Tubes*
Thin-wall(m/second)
Thick-wall(m/second)
Dual pressure 5.52 (0.05) 15.83 (0.15)MR velocity (in air) 5.76 (0.27) 15.89 (0.32)MR displacement (in air) 5.71 (0.29) 15.66 (0.58)MR velocity (water bath) 5.68 (0.53) 16.12 (1.46)MR displacement (water bath) 5.61 (0.39) 15.79 (0.79)
*Each entry represents the mean (SD) of 15 trials.
606 Kraft et al.

image; AWV is inversely proportional to the slope of thisline.
Table 2 and Fig. 5 show the in vivo comparison ofAWV results by subject age tertile. As expected, anincrease in AWV, representing increased aortic stiff-ness, is noted with increasing age. When comparing thetwo MR methods in each age group, neither the youngsubject group (age 21–39, mean 29 years) nor the mid-dle-aged cohort (age 40–59, mean 47 years) exhibited asignificant difference in mean AWV. However, for theelderly group (age 60 and over, mean 68 years) thevelocity method apparently underestimated the actualAWV, as judged by its substantially increased coeffi-cient of variation (16.9% vs. 10.9%) with respect to thedisplacement method.
A scatter plot of AWV vs. age for all subjects is shownin Fig. 6. The data shown are those obtained using thedisplacement method. A linear least squares fit to thedata yielded the equation AWV (m/second) � 2.34 �0.08 (age), with a squared correlation coefficient (r2) of0.58. A similar plot using data acquired with the veloc-
ity method (not shown) exhibited an inferior degree ofcorrelation (r2 � 0.30), due to increased data scatteramong the older subjects.
DISCUSSION
Because clinical populations at highest risk for cardio-vascular morbidity and mortality tend to be older, it isimportant that techniques developed to noninvasivelystudy aortic stiffness be accurate and reliable in elderlysubjects. Most previously proposed and currently fa-vored measurement methods have disregarded this im-portant practical issue. A number of factors conspire torender aortic stiffness determinations problematic inelderly populations. Increased arterial tortuosity withage degrades the accuracy of techniques that rely onsurface estimates of arterial length (e.g., carotid-femo-ral WV). Moreover, aging appears to exert a variablestiffening effect on different regions of the central vas-culature (19), and such regional heterogeneity couldtherefore be masked using such techniques. Hence,stiffness assessments should be localized to the aortaitself, and not averaged over multiple arterial segments.
Arterial stiffness determinations having long acquisi-tion times are very sensitive to electrocardiogram (ECG)gating disruptions (due to timing jitter, dependence of
Figure 3. Sagittal scout image (upper panel) and representa-tive velocity image (lower panel) obtained from a 24-year-oldmale subject. The orientation of the applied RF excitationplanes is depicted by overlaid lines on the scout image. The twostraight vertical traces in the velocity image (indicated bydashed lines) represent residual signal from static tissues.Signals due to descending aortic blood flow (black arrows) areseen as curved traces to the right of the static positions; aorticwave velocity is extracted from the early portion of these sig-nals. Also coincidentally visible at the upstream site is a left-ward-directed signal trace due to ascending aortic flow (col-ored arrow).
Figure 4. Sagittal scout image (upper panel) and representa-tive displacement image (lower panel) from a 51-year-old malesubject. The multiple curved signal traces represent descend-ing aortic blood flow, while the vertical traces arise from resid-ual static tissue signals. The slope of the oblique overlaid lineconnecting the flow “feet” in the displacement image is in-versely proportional to the aortic wave velocity.
Aortic Stiffness Assessment in the Elderly 607

heart rate on respiration, gradient interference, etc.),and are particularly prone to fail in older subjects, dueto the higher prevalence of arrhythmias in older popu-lations (20). In addition, clinical throughput and theexpediency of averaging repeated trials are negativelyaffected by lengthy measurement times. An ideal mea-surement should therefore be rapid (subsecond dura-tion) and preferably would not require breathholding.
The two MR sequences evaluated in the present studywere designed to overcome the major drawbacks ofmost currently deployed methods for measuring hu-man aortic stiffness. Our experience with over 100 sub-jects of all adult ages has demonstrated that both se-quences are very reliable (0% failure rate), althougheach has particular advantages and disadvantages, de-pending on certain subject characteristics.
The velocity method performs well when the systolicaortic blood velocity is high, as is typically true foryoung and middle-aged subjects. A practical advantageof this method is that it is amenable to rapid (�15seconds), automated software analysis (17). Becausethe velocity method uses repeated RF excitationsthroughout the measurement, it benefits from constantreplacement of RF-tagged aortic blood during systole.Consequently, blood signal does not fade due to T2
relaxation and can be observed until end-systole, ifdesired. This allows the peak flow velocity (PFV) to bequantified, as shown in Table 2. The principal disad-vantage of the technique is its poor depiction of theearly systolic phase (or “foot”) of the flow waveform. Thisoccurs because aortic blood must move appreciablyduring the sequence echo time (TE), in order to beresolved from the static background signal. In practice,aortic blood velocities below about 0.2 m/second aretherefore undetectable. In healthy young and middle-aged subjects with peak aortic blood velocities near 1m/second, this limitation is of little consequence. How-ever, among the elderly (age �60 years), peak aorticvelocities may only reach 0.45 m/second. In suchcases, few points will be obtained during the systolicupstroke, thus resulting in inaccurate AWV measure-ments. Our phantom data lend support for this notion,in that we observed that the variability of the velocitymethod increased when the peak fluid velocity was re-duced, but that of the displacement method did not.Specifically, the coefficient of variation of the displace-ment method was approximately unchanged (9.3% vs.8.8%) when the fluid velocity was reduced from 0.9 to0.58 m/second. However, for the velocity method, the
Table 2Aortic Wave Velocity (AWV) Data by Subject Age Group: Comparison of Two Methods
Age group NMean age
(years)
Velocity method Displacement method
PFV (m/second)a AWV(m/second)a CV (%)
AWV(m/second)a CV (%)
Young 43 29 1.08 (0.18) 4.66 (1.30) 9.4 4.68 (0.97) 12.0Middle 32 49 0.78 (0.16) 6.03 (1.38) 10.1 6.00 (0.98) 11.5Elderly 29 68 0.55 (0.09) 6.81 (2.21) 16.9 7.91 (1.72) 10.9
aData represent mean (SD).PFV � peak flow velocity, AWV � aortic wave velocity, CV � coefficient of variation.
Figure 5. Comparison of mean AWV results by subject agetertile. Error bars represent SDs. For the young and middle-aged cohorts, there was no significant difference in mean AWVbetween the velocity and displacement methods. For the el-derly group, a significant difference was observed (P � 0.05 bypaired t-test).
Figure 6. Scatter-plot and least squares linear fit of AWV datavs. age for all 104 subjects as measured using the displace-ment MR method.
608 Kraft et al.

CV increased significantly from 10.6% to 17.1% for asimilar change in fluid velocity. Another weakness ofthe velocity method is that measurement accuracy isimpaired when the peak aortic blood velocities at thetwo anatomical sites differ. This phenomenon is fre-quently observed in older subjects, and is likely relatedto convective acceleration (or deceleration) due to aorticluminal taper. A third disadvantage in terms of subjectinconvenience is the necessity of breath holding. Al-though the duration of each individual breath-hold wasshort (�5 seconds), it is possible that nonreproduciblebreathholding also contributed to the overall higher CVof the method.
Because the displacement method employs only asingle RF comb excitation pulse with rapid echo refo-cusing, the temporal resolution (2.03 msec) is superiorto that of the velocity method (5.5 msec). This excitationstrategy also supports a larger flip angle (90° vs. 30°)and permits adjacent tags to be closely spaced along theaorta without eliciting RF saturation effects. Themethod also benefits from the physiological phenome-non of slow antegrade aortic blood flow at end-diastole,which causes the blood signal to migrate slightly, andhence be resolved from the static background, evenbefore the onset of systole. In addition, because of thelarge RF flip angle and relatively prolonged T2 of bloodcompared to tissue, diastolic subtraction does not ma-terially improve signal quality with this method, andwas not used. Consequently, breathholding was notroutinely performed, further reducing subject examina-tion time. The main disadvantage of the displacementmethod at present is that data analysis is not fullyautomated and is therefore somewhat slower. Anotherlimitation is that blood displacement trajectories tendto weaken and disperse over time, due to T2 relaxationand evolution of the flow profile from plug-like towardparabolic. These effects limit the useful data acquisitionwindow to �150 msec in vivo. Although not detrimentalto the accurate evaluation of AWV, this limit may pre-clude evaluation of the PFV in subjects whose bloodvelocity peaks later in systole.
Due to its large diameter and normally high distensi-bility, the proximal ascending aorta is presumably theone arterial segment for which stiffening exerts themost profound physiological consequences. Ideally,therefore, stiffness measurements should be localizedto the ascending, rather than descending aorta, Be-cause both the velocity and displacement MR methodsare designed to target the descending aorta, they sharethis limitation in their current stage of development.Although we observed ascending aortic flow traces asan incidental finding in some subjects using the veloc-ity method (e.g., the trace identified by a colored arrowin Fig. 3), neither MR technique was deliberately tar-geted to nor optimized for the ascending aorta. Bothmethods perform best when blood flow is unidirectionalover a significant length of vessel, which is not generallythe case in the ascending segment because of its limitedlength. Also, the ascending aorta is relatively distal tothe spine array receiver coil and exhibits a commensu-rately weaker flow signal. These considerations ren-dered the descending aorta a more attractive targetvessel in our view. However, it is likely that, with an
appropriate volume RF coil, signals from the ascendingaorta could be reliably detected using the sequencesdescribed herein. A secondary advantage associatedwith accessing the ascending vs. the descending aortais that the integrated blood velocity waveform, togetherwith the vessel cross-sectional area (from a scout im-age), could provide a rapid estimate of cardiac strokevolume, if desired.
The regression line fit of the dependence of AWV onage (Fig. 6) agrees quite well with published data ac-quired using aorto–femoral Doppler flow (21), applana-tion tonometry (22), and MR methods (10,19). In addi-tion, the coefficients of variation observed usingrepeated trials (Table 2) compare favorably with repro-ducibility data using a carotid–femoral technique (23).Absolute accuracy of the MR data is also presumablyhigher because the vessel length is precisely known.
In conclusion, we evaluated two one-dimensional MRsequences for measuring aortic wave velocity both invitro and in a cohort of 104 men and women of all ages.Both sequences (velocity method and displacementmethod) were found to be equally valid for measuringaortic wave velocity in young and middle-aged subjects.In these age groups, the methods are somewhat com-plementary in terms of their relative strengths andweaknesses. Among elderly subjects, however, the dis-placement method manifests several advantages thatrender it the clear technique of choice for quantifyingaortic stiffness.
ACKNOWLEDGMENT
We thank Ms. Cai-Ting Fu for assistance with dataanalysis.
REFERENCES1. Laurent S, Boutouyrie P, Asmar R, et al. Aortic stiffness is an
independent predictor of all-cause and cardiovascular mortality inhypertensive patients. Hypertension 2001;37:1236–1241.
2. Boutouyrie P, Tropeano AI, Asmar R, et al. Aortic stiffness is anindependent predictor of primary coronary events in hypertensivepatients: a longitudinal study. Hypertension 2002;39:10–15.
3. Meaume S, Benetos A, Henry OF, Rudnichi A, Safar ME. Aortic pulsewave velocity predicts cardiovascular mortality in subjects �70 yearsof age. Arterioscler Thromb Vasc Biol 2001;21:2046–2050.
4. Cruickshank K, Riste L, Anderson SG, Wright JS, Dunn G, GoslingRG. Aortic pulse-wave velocity and its relationship to mortality indiabetes and glucose intolerance: an integrated index of vascularfunction? Circulation 2002;106:2085–2090.
5. Wildman RP, Mackey RH, Bostom A, Thompson T, Sutton-Tyrrell K.Measures of obesity are associated with vascular stiffness in youngand older adults. Hypertension 2003;42:468–473.
6. Rerkpattanapipat P, Hundley WG, Link KM, et al. Relation of aorticdistensibility determined by magnetic resonance imaging in pa-tients � or � 60 years of age to systolic heart failure and exercisecapacity. Am J Cardiol 2002;90:1221–1225.
7. Karamanoglu M, O’Rourke MF, Avolio AP, Kelly RP. An analysis ofthe relationship between central aortic and peripheral upper limbpressure waves in man. Eur Heart J 1993;14:160–167.
8. Vulliemoz S, Stergiopulos N, Meuli R. Estimation of local aorticelastic properties with MRI. Magn Reson Med 2002;47:649–654.
9. Lehmann ED. Noninvasive measurements of aortic stiffness: meth-odological considerations. Pathol Biol (Paris) 1999;47:716–730.
10. Mohiaddin RH, Firmin DN, Longmore DB. Age-related changes ofhuman aortic flow wave velocity measured noninvasively by mag-netic resonance imaging. J Appl Physiol 1993;74:492–497.
11. Boese JM, Bock M, Schoenberg SO, Schad LR. Estimation of aorticcompliance using magnetic resonance pulse wave velocity mea-surement. Phys Med Biol 2000;45:1703–1713.
Aortic Stiffness Assessment in the Elderly 609

12. Laffon E, Marthan R, Montaudon M, Latrabe V, Laurent F, Ducas-sou D. Feasibility of aortic pulse pressure and pressure wave ve-locity MRI measurement in young adults. J Magn Reson Imaging2005;21:53–58.
13. Bock M, Schad LR, Muller E, Lorenz WJ. Pulsewave velocity mea-surement using a new real-time MR-method. Magn Reson Imaging1995;13:21–29.
14. Macgowan CK, Henkelman RM, Wood ML. Pulse-wave velocitymeasured in one heartbeat using MR tagging. Magn Reson Med2002;48:115–121.
15. Itskovich VV, Kraft KA, Fei DY. Rapid aortic wave velocity measure-ment with MR imaging. Radiology 2001;219:551–557.
16. Shao X, Fei DY, Kraft KA. Rapid measurement of pulse wave veloc-ity via multisite flow displacement. Magn Reson Med 2004;52:1351–1357.
17. Shao X, Fei DY, Kraft KA. Computer-assisted evaluation of aorticstiffness using data acquired via magnetic resonance. Comput MedImaging Graph 2004;28:353–361.
18. Kraft KA, Itskovich VV, Fei DY. Rapid measurement of aortic wavevelocity: in vivo evaluation. Magn Reson Med 2001;46:95–102.
19. Rogers WJ, Hu YL, Coast D, et al. Age-associated changes in re-gional aortic pulse wave velocity. J Am Coll Cardiol 2001;38:1123–1129.
20. Blomstrom-Lundqvist C, Scheinman MM, Aliot EM, et al. ACC/AHA/ESC guidelines for the management of patients with su-praventricular arrhythmias. Circulation 2003;108:1871–1909.
21. Avolio AP, Deng FQ, Li WQ, et al. Effects of aging on arterialdistensibility in populations with high and low prevalence of hy-pertension: comparison between urban and rural communities inChina. Circulation 1985;71:202–210.
22. Vaitkevicius PV, Fleg JL, Engel JH, et al. Effects of age and aerobiccapacity on arterial stiffness in healthy adults. Circulation 1993;88:1456–1462.
23. Sutton-Tyrrell K, Mackey RH, Holubkov R, Vaitkevicius PV, Spur-geon HA, Lakatta EG. Measurement variation of aortic pulse wavevelocity in the elderly. Am J Hypertens 2001;14:463–468.
610 Kraft et al.