
Implicit and Automated Emotional Tagging of Videos - CiteSeerX
146
-
Upload
khangminh22 -
Category
Documents
-
view
2 -
download
0
Transcript of Implicit and Automated Emotional Tagging of Videos - CiteSeerX
UNIVERSITÉ DE GENÈVE FACULTÉ DES SCIENCESDépartement d'Informatique Professeur Thierry Pun
Implicit and Automated Emotional
Tagging of Videos
THÈSE
présenté à la Faculté des sciences de l'Université de Genève
pour obtenir le grade de Docteur ès sciences, mention informatique
par
Mohammad SOLEYMANI
de
Téhéran (IRAN)
Thèse No 4368
GENÈVE
Repro-Mail - Université de Genève
2011


Acknowledgements
First and foremost, I would like to thank Thierry to give me the opportunity to work on
this thesis. He has been always a supportive advisor who provided me with both freedom and
trust. Thanks to Guillaume for many things that I cannot count, from being a great o�ce
mate and colleague to a true friend helping me at hard moments and sharing lots of memorable
experiences. Thanks to Joep who thought me how to think critically. Thanks to Didier who was
always generous in helping me with his rich neuro-psychological knowledge. Thank to Donn, for
helping me with his impressive knowledge on systems and computer science and for the outdoorsy
and fun experiences we shared. Thanks to Eniko with her lovely smile who has been and hopefully
will be a good friend. Thanks to Maurits for being a supportive o�ce mate and friend. I would
like to give special thanks to Fokko for creating the �rst version of the LATEXtemplate that I
used for this thesis and all his support and kindness. CVML folks were all very friendly and
helpful, the lunch time chats and co�ee time discussions helped me a lot to get new ideas and
feel comfortable. Stéphane, Eric, Benoît, Sophie, Jana, Farzad, Sun and Slava, thank you all.
Thanks to Nicolas, Daniel, Elie and Germaine for their administrative and technical supports. I
really feel lucky to have colleagues and friends like you.
I would also like to thank the researchers with whom I collaborated outside of the UniGe. I
thank Maja and Jeroen at Imperial College London for giving me the opportunity to work with
their group. I have certainly learned a lot and took advantage of my visits to London. Your
contributions were certainly essential to the success of this thesis. Thanks to Jozef, for helping
me with the experiments in London and being a welcoming host. I would like to express my
exceptional thanks to Martha at Delft University of Technology who showed me an excellent
example of a con�dent, hard working and ambitious researcher. Thanks to Sander and Christian
for sharing their knowledge and the friendly discussions. I certainly owe a debt of gratitude to
my Masters advisor in Iran, Prof. Hossein-Zadeh. I appreciate his patience with me when I was
a beginner and un-experienced in research.
Not to forget, my parents, my brother, Majid and Saeid, and my sisters, Mehri, Zohreh and
Nahid, who always supported me throughout my studies and encouraged me to be ambitious.
Finally, I would like to thank my wife, Gretchen, for everything.
i

ii

Résumé
Les émotions jouent un rôle important dans la sélection du contenu multimédia et la con-
sommation de video des spectateurs. Lrd objectifs principals de cette thèse, sont de détecter
et d'estimer les caractéristiques a�ectives de vidéos en se basant sur l'analyse automatique des
contenus, ainsi que de reconnaitre les émotions ressenties par les spectateurs en réponse aux
vidéos. Ces caractérisations émotionnelles peuvent être utilisées pour étiqueter/marquer le con-
tenu. L'étiquetage implicite ou automatique des vidéos utilisant des informations a�ectives aide
à améliorer la performance des systèmes de recommandation et de recherche.
Dans cette thèse, une base sur la théorie des émotions et le procédé pour les approches utiliseés
pour conduire des expériences dans le domaine a�ective. Une étude de la littérature présente les
études existants en matière de compréhension a�ective des vidéos utilisant l'analyse du contenu,
et sur les techniques qui existent pour l'évaluation des émotions en réponse à des vidéos. Quatre
collections de vidéos émotionnelles ont été développées, c'est à dire qu'elles contiennent des
vidéos dont le contenu suscite des émotions ; ces vidéos sont utilisées comme stimuli pour les
expériences et pour la compréhension émotionnelle des vidéos par analyse du contenu. Trois
corpus émotionnels incluant des réponses émotionnelles individuelles aux vidéos de la part de
plusieurs participants ont aussi été enregistrés.
Les axes d'analyses et d'évaluations dans cette thèse sont de deux ordres : premièrement, les
méthodologies et les résultats des méthodes de reconnaissance utilisées pour détecter l'émotion
en réponse aux vidéos sont présentés. Deuxièmement, les méthodologies et les résultats de la
compréhension émotionnelle des medias utilisant l'analyse du contenu sont fournis. Dans le pre-
mier axe, une méthode de détection d'émotion dans un espace continu basée sur la régression est
présentée et les corrélations entre les auto-évaluations des émotions et les réponses physiologiques
sont montrées. Par ailleurs, une étude sur la reconnaissance d'émotions indépendamment du
participant est présentée. La deuxième étude montre la performance d'une approche de recon-
naissance d'émotions utilisant les signaux EEG, la distance du regard, et la réponse pupillaire
des participants comme rétroactions a�ectives. La faisabilité d'une approche de reconnaissance
d'émotions en réponse à des vidéos utilisant un tel système est montrée. Les meilleures précisions
de classi�cation de 68.5% pour trois niveau de valence et de 76.4% pour trois niveau d'arousal
sont obtenues en utilisant une stratégie de fusion des modalités et une machine à support de
vecteurs. Après avoir étudié les réponses à des scènes de �lm, les résultats et les méthodes pour
l'évaluation des émotions en réponses à des clips musicaux sont donnés.
Par ailleurs, des méthodes d'analyse de contenu permettant de détecter les émotions, qui
sont les plus susceptibles d'être induites par un contenu multimédia donné, sont présentées. Des
caractéristiques de bas niveau du contenu qui sont utilisées pour la compréhension a�ective sont
iii

iv RÉSUMÉ
introduites. Encore une fois, la méthode de régression est utilisée pour la compréhension a�ective
des vidéos, et la corrélation entre les caractéristiques du contenu, les réponses physiologiques et
l'auto-évaluation des émotions ont été étudiées. Il est montré que les corrélations des caractéris-
tiques multimédia avec les caractéristiques physiologiques et l'auto-évaluation de par l'utilisateur
sont signi�catives. Ceci demontre l'utilité des réponses physiologiques et des caractéristiques du
contenu pour l'étiquetage émotionnel des vidéos. Ensuite, un système de représentation a�ective
pour estimer les émotions ressenties au niveau de la scène a été proposé en utilisant un système
de classi�cation bayésien. La précision de classi�cation de 56%, obtenue sur trois classes d'émo-
tions avec un classi�eur bayésien naïf, a été améliorée à 64% après avoir utilisé des information
a-priori sur le genre et l'etat emotioniel precedent.
En conclusion, des résultats prometteurs ont été obtenus dans le marquage émotionnel des
vidéos. Cependant, la compréhension émotionnelle de contenu multimédia est une tâche di�cile
et avec l'état de l'art actuel, une solution universelle pour détecter et étiqueter tous les contenus
qui conviennent à tous les utilisateurs n'est pas possible. Les systèmes basés sur l'informatique
a�ective fonctionnent seulement s'ils sont capables de prendre en compte les pro�ls contextuels
et personnels.

Abstract
Emotions play a pivotal role in viewers' content selection and use. The main aim of this
study is to detect and estimate a�ective characteristics of videos based on automated content
analysis as well as to recognize the felt emotions in viewers in response to videos. These emotional
characterizations can be used to tag the content. Implicit or automated tagging of videos using
a�ective information help recommendation and retrieval systems to improve their performance.
In this thesis, a background on emotion theories and the process of emotional experience in
response to videos are given. The literature review sheds light on existing studies on a�ective
understanding of videos using content analysis and the existing techniques in emotion assessment
in response to videos. Four emotional video datasets are developed. They consist of emotional
videos to be used as stimuli for experiments and emotional understanding of videos by content
analysis. Three emotional corpora including emotional, bodily responses to videos from multiple
participants have been also recorded.
The analysis and evaluations directions in this thesis are twofold: �rst, methodology and
results of emotion recognition methods employed to detect emotion in response to videos are
presented. Second, methodology and results of emotional understanding of multimedia using
content analysis are provided. In the �rst direction, a regression based method to detect emotion
in continuous space is presented, and the correlates of emotional self assessments and physiolog-
ical responses are shown. Moreover, a multi-modal participant independent emotion recognition
study is presented. The second study shows the performance of an inter-participant emotion
recognition for tagging using participants' ElectroEncephaloGram (EEG) signals, gaze distance
and pupillary response as a�ective feedbacks. The feasibility of an approach to recognize emotion
in response to videos using such a system is shown. The best classi�cation accuracy of 68.5%
for three labels of valence and 76.4% for three labels of arousal are obtained using a modality
fusion strategy and a support vector machine. After studying the responses to movie scenes, the
results and the methods for emotion assessment in response to music clips are given.
Moreover, content analysis methods to detect emotions that are more likely to be elicited by
a given multimedia content are presented. Low level content features, which are used for a�ective
understanding, are introduced. Again the regression method is used for a�ective understanding
of videos and the correlation between content features, physiological responses and emotional
self reports have been studied. Content based multimedia features' correlations with both phys-
iological features and users' self-assessment of valence-arousal are shown to be signi�cant. This
implies the usefulness of physiological responses and content features for emotional tagging of
videos. Next, an a�ective representation system for estimating felt emotions at the scene level
has been proposed using a Bayesian classi�cation framework. The classi�cation accuracy of 56%
v

vi ABSTRACT
that was obtained on three emotional classes with a naïve Bayesian classi�er was improved to
64% after utilizing temporal and genre priors.
In conclusion, promising results have been obtained in emotional tagging of videos. However,
emotional understanding of multimedia is a challenging task and with the current state of the
art methods a universal solution to detect and tag all di�erent content which suits all the users
is not possible. Systems based on a�ective computing can only work if they are able to take
context and personal pro�les into account.

Contents
Résumé iii
Abstract v
1 Introduction 1
1.1 Application Scenario . . . . . . . . . . . . . . . . . . . . . . . . . . . . . . . . . . 3
1.2 Contributions . . . . . . . . . . . . . . . . . . . . . . . . . . . . . . . . . . . . . . 4
1.3 Thesis Overview . . . . . . . . . . . . . . . . . . . . . . . . . . . . . . . . . . . . 4
2 Background 5
2.1 Why Do We Feel Emotions? . . . . . . . . . . . . . . . . . . . . . . . . . . . . . . 5
2.2 Emotional Representations . . . . . . . . . . . . . . . . . . . . . . . . . . . . . . . 6
2.2.1 Component processes . . . . . . . . . . . . . . . . . . . . . . . . . . . . . . 6
2.2.2 Discrete models . . . . . . . . . . . . . . . . . . . . . . . . . . . . . . . . . 8
2.2.3 Dimensional models . . . . . . . . . . . . . . . . . . . . . . . . . . . . . . 8
2.3 Emotional Self-Reporting Methods . . . . . . . . . . . . . . . . . . . . . . . . . . 9
2.3.1 Video a�ective annotation tools . . . . . . . . . . . . . . . . . . . . . . . . 11
2.4 A�ective Characterization of Videos . . . . . . . . . . . . . . . . . . . . . . . . . 12
2.4.1 Emotion recognition from Eye gaze and pupil dilation . . . . . . . . . . . 17
2.4.2 Emotion recognition from audio-visual modalities . . . . . . . . . . . . . . 17
2.5 Implicit Tagging . . . . . . . . . . . . . . . . . . . . . . . . . . . . . . . . . . . . 18
2.6 Summary . . . . . . . . . . . . . . . . . . . . . . . . . . . . . . . . . . . . . . . . 19
3 A�ective Corpus Development 21
3.1 Video Corpora Development . . . . . . . . . . . . . . . . . . . . . . . . . . . . . . 21
3.1.1 Existing emotional video corpora . . . . . . . . . . . . . . . . . . . . . . . 21
3.1.2 Developed emotional video corpora . . . . . . . . . . . . . . . . . . . . . . 22
3.2 A�ective Expression Databases . . . . . . . . . . . . . . . . . . . . . . . . . . . . 34
3.2.1 Existing databases . . . . . . . . . . . . . . . . . . . . . . . . . . . . . . . 35
3.2.2 Developed emotional response corpora . . . . . . . . . . . . . . . . . . . . 38
3.2.3 Recommendations . . . . . . . . . . . . . . . . . . . . . . . . . . . . . . . 47
3.3 Summmary . . . . . . . . . . . . . . . . . . . . . . . . . . . . . . . . . . . . . . . 48
vii

viii CONTENTS
4 Emotion Detection from Bodily Responses 49
4.1 Bodily Signals and Sensors . . . . . . . . . . . . . . . . . . . . . . . . . . . . . . . 49
4.1.1 Physiological signals and sensors . . . . . . . . . . . . . . . . . . . . . . . 49
4.1.2 Eye gaze and pupil diameter . . . . . . . . . . . . . . . . . . . . . . . . . . 53
4.2 Peripheral Physiological Signals for A�ective Tagging . . . . . . . . . . . . . . . . 54
4.2.1 Video a�ective characterization using peripheral physiological responses . 54
4.3 Multi-Modal Emotion Recognition in Response to Videos . . . . . . . . . . . . . 59
4.3.1 Preliminary study . . . . . . . . . . . . . . . . . . . . . . . . . . . . . . . 59
4.3.2 Multi-modal emotion recognition . . . . . . . . . . . . . . . . . . . . . . . 62
4.3.3 Experimental results . . . . . . . . . . . . . . . . . . . . . . . . . . . . . . 67
4.4 Emotion Recognition in Response to Music Videos 1 . . . . . . . . . . . . . . . . 72
4.4.1 Overview . . . . . . . . . . . . . . . . . . . . . . . . . . . . . . . . . . . . 72
4.4.2 Emotional Features . . . . . . . . . . . . . . . . . . . . . . . . . . . . . . . 72
4.4.3 Emotion classi�cation . . . . . . . . . . . . . . . . . . . . . . . . . . . . . 73
4.4.4 Experimental results . . . . . . . . . . . . . . . . . . . . . . . . . . . . . . 74
4.5 Discussions . . . . . . . . . . . . . . . . . . . . . . . . . . . . . . . . . . . . . . . 75
4.6 Summary . . . . . . . . . . . . . . . . . . . . . . . . . . . . . . . . . . . . . . . . 77
5 Content Analysis for A�ect Estimation 79
5.1 Overview . . . . . . . . . . . . . . . . . . . . . . . . . . . . . . . . . . . . . . . . 79
5.1.1 Audio-Visual Features . . . . . . . . . . . . . . . . . . . . . . . . . . . . . 79
5.1.2 Textual features . . . . . . . . . . . . . . . . . . . . . . . . . . . . . . . . 81
5.1.3 Continuous characterization of multimedia . . . . . . . . . . . . . . . . . . 81
5.2 Movie Scene Classi�cation Using A Bayesian Framework . . . . . . . . . . . . . . 83
5.2.1 Dataset and annotations . . . . . . . . . . . . . . . . . . . . . . . . . . . . 84
5.2.2 Arousal estimation with regression on shots . . . . . . . . . . . . . . . . . 86
5.2.3 Scene classi�cation . . . . . . . . . . . . . . . . . . . . . . . . . . . . . . . 86
5.2.4 Results . . . . . . . . . . . . . . . . . . . . . . . . . . . . . . . . . . . . . 88
5.3 Video Characterization Using Text Analysis . . . . . . . . . . . . . . . . . . . . . 91
5.3.1 Shot level characterization using dictionary . . . . . . . . . . . . . . . . . 91
5.3.2 Scene classi�cation using text analysis . . . . . . . . . . . . . . . . . . . . 91
5.4 Boredom Ranking . . . . . . . . . . . . . . . . . . . . . . . . . . . . . . . . . . . 93
5.4.1 Dataset and features . . . . . . . . . . . . . . . . . . . . . . . . . . . . . . 93
5.4.2 Boredom ranking results . . . . . . . . . . . . . . . . . . . . . . . . . . . . 94
5.5 Summary . . . . . . . . . . . . . . . . . . . . . . . . . . . . . . . . . . . . . . . . 95
6 Conclusions and Perspectives 97
6.1 Lessons Learned . . . . . . . . . . . . . . . . . . . . . . . . . . . . . . . . . . . . 97
6.2 Conclusions . . . . . . . . . . . . . . . . . . . . . . . . . . . . . . . . . . . . . . . 98
6.3 Perspectives . . . . . . . . . . . . . . . . . . . . . . . . . . . . . . . . . . . . . . . 99
Appendix A: List of Publications 101
1. This study was done in collaboration with, Sander Koelstra, Christian Mühl, Ashkan Yazdani, and Jong-Seok Lee in the context of Petamedia European network of excellence.

CONTENTS ix
Appendix B: Consent Form 103
Appendix C: Participant's Instructions 107
Appendix D: Video Clips 111

x CONTENTS
List of Figures
1.1 The video upload rate on youtube from June 2007 in hours per minute. This
�gure is taken from YouTube's o�cial blog 2. . . . . . . . . . . . . . . . . . . . . 1
1.2 Implicit a�ective tagging vs. explicit tagging scenarios. The analysis of the bodily
responses replaces the direct interaction between user and the computer. There-
fore, users do not have to be distracted for tagging the content. . . . . . . . . . . 3
2.1 The component process model of emotion (This �gure is taken from [1]). . . . . . 7
2.2 Self Assessment Manikins. From top to bottom the manikins express di�erent
levels of arousal, valence, and dominance. . . . . . . . . . . . . . . . . . . . . . . 10
2.3 A participant can indicate his emotion on Geneva emotion wheel by clicking or
choosing the circles. . . . . . . . . . . . . . . . . . . . . . . . . . . . . . . . . . . 10
2.4 Users can identify emotions they are feeling with 14 animated characters are ex-
pressing emotions. Retrieved from http://studiolab.io.tudelft.nl/desmet/PrEmo. 11
3.1 The distribution of di�erent movie scenes on arousal and valence plane. Average
arousal and valence are shown. Di�erent numbers represent di�erent movies (see
Table 3.1). . . . . . . . . . . . . . . . . . . . . . . . . . . . . . . . . . . . . . . . . 23
3.2 Total number of keywords reported by 10 participants to 64 video clips . . . . . . 24
3.3 A snapshot of the a�ective annotation platform. . . . . . . . . . . . . . . . . . . . 25
3.4 Average arousal scores, given by male and female participants. . . . . . . . . . . . 26
3.5 Average absolute valence scores given by male and female participants. . . . . . . 27
3.6 Average arousal scores in di�erent times of the day. . . . . . . . . . . . . . . . . . 28
3.7 Average absolute valence scores in di�erent times of the day. . . . . . . . . . . . . 28
3.8 A snapshot of Bill Bowel's travel projects website. . . . . . . . . . . . . . . . . . 29
3.9 A snapshot of the main Human Intelligent Task (HIT) on Amazon Mechanical
Turk (MTurk). . . . . . . . . . . . . . . . . . . . . . . . . . . . . . . . . . . . . . 30
3.10 Average boredom scores in di�erent moods. . . . . . . . . . . . . . . . . . . . . . 32
3.11 Average boredom scores in positive and negative moods. . . . . . . . . . . . . . . 33
3.12 Histogram of arousal, valence, dominance and liking ratings given to all videos
by the 32 participants. The blue bars are the histogram of the quantized ratings
in nine levels. The red bars are showing the ratings quantized in 80 levels (the
quantization step is equal to 0.1). This �gure was originally created by Sander
Koelstra and published in [2]. . . . . . . . . . . . . . . . . . . . . . . . . . . . . . 34
2. http://youtube-global.blogspot.com/2010/11/great-scott-over-35-hours-of-video.html
xi

xii LIST OF FIGURES
3.13 The mean video ratings from experiment participants on the arousal-valence plane.
The orientation of the triangle indicates the quadrant for which the video was
selected by the online ratings. Liking is encoded by color: dark red is low liking
and bright yellow is high liking. Dominance is encoded by symbol size: small
symbols stand for low dominance and big for high dominance. This �gure was
originally created by Christian Mühl and published in [3]. . . . . . . . . . . . . . 35
3.14 facial ElectroMyoGram (EMG) signals were recorded from Zygomaticus major
(left), and Frontalis muscles (right). These images are retrieved from Wikimedia. 38
3.15 Participant 1 physiological responses to a comedy scene: respiration pattern (top-
left), Galvanic Skin Response (GSR) (top-right), blood pressure (bottom left),
and Zygomaticus major EMG (bottom-right). The e�ect of the spectator's laugh
can be seen on the respiration pattern and EMG signal. . . . . . . . . . . . . . . 39
3.16 Participant 2 physiological responses to a surprising action scene: respiration pat-
tern (top-left), GSR (top-right), blood pressure (bottom left), and Frontalis EMG
(bottom-right). The surprise moment is indicated by an arrow. . . . . . . . . . . 39
3.17 Arousal and valence self-assessment: Self Assessment Manikin (SAM) manikins
and sliders. . . . . . . . . . . . . . . . . . . . . . . . . . . . . . . . . . . . . . . . 40
3.18 The EEG cap layout for 32 EEG in addition to two reference electrodes. Retrieved
from Biosemi website (http://www.biosemi.com). . . . . . . . . . . . . . . . . . . 41
3.19 Each trial started by a 15s neutral clip and continued by playing one emotional
clip. The self-assessment was done at the end of each trial. There were 20 trials
in each session of experiment. . . . . . . . . . . . . . . . . . . . . . . . . . . . . . 42
3.20 In the experimental setup, six video cameras were recording facial expressions.
The modi�ed keyboard is visible in front of the participant. . . . . . . . . . . . . 42
3.21 Two examples of natural expressions to a fearful (on the left) and disgusting (on
the right) video. The snapshots of the stimuli videos with eye gaze overlaid and
without eye gaze overlaid, frontally captured video, raw physiological signals and
raw eye gaze data are shown. On the �rst row, the red circles show the �xation
points and their radius indicate the time spent in each �xation point. The red
lines indicate the moments were each of the snapshots were captured. The eye
gaze tracker signals have the value -1 when eye gaze data is not available (e.g.,
during blinking moments). . . . . . . . . . . . . . . . . . . . . . . . . . . . . . . . 43
3.22 Snapshots of videos captured from 6 cameras recording facial expressions and head
pose. . . . . . . . . . . . . . . . . . . . . . . . . . . . . . . . . . . . . . . . . . . . 44
3.23 Placement of peripheral physiological sensors. Four electrodes were used to record
ElectroOculoGram (EOG) and 4 for EMG (Zygomaticus major and Trapezius
muscles). In addition, GSR, Blood Volume Pulse (BVP), temperature and respi-
ration were measured. This �gure was originally created by Christian Mühl and
published in [2]. . . . . . . . . . . . . . . . . . . . . . . . . . . . . . . . . . . . . . 45
3.24 A participant shortly before the experiment. . . . . . . . . . . . . . . . . . . . . . 46
3.25 Images used for self-assessment. from top: Valence SAM, Arousal SAM, Domi-
nance SAM, Liking. . . . . . . . . . . . . . . . . . . . . . . . . . . . . . . . . . . 46

LIST OF FIGURES xiii
4.1 Biosemi active two box and battery. . . . . . . . . . . . . . . . . . . . . . . . . . 50
4.2 A participant wearing an EEG head cap with 32 electrodes. EOG and EMG �at
electrodes are attached on the participant's face. The temperature, GSR sensors
and plethysmograph are attached to the participant's left hand. . . . . . . . . . . 50
4.3 An EMG signal recorded from the zygomaticus major muscle. . . . . . . . . . . . 51
4.4 A raw GSR signal. The noisy GSR signal is visible with its tonic and phasic
responses. Tonic response corresponds to the overall level of GSR whereas phasic
response is the abrupt changes (drops in the current �gure) due to the stimuli. . 51
4.5 A BVP signal. . . . . . . . . . . . . . . . . . . . . . . . . . . . . . . . . . . . . . . 51
4.6 An ElectroCardioGram (ECG) signal recorded from electrodes placed on a partic-
ipant's upper corner of chest below the clavicle bone and the abdomen below the
last rib. The strong contraction of the left ventricle generated large peaks visible
in the signal. . . . . . . . . . . . . . . . . . . . . . . . . . . . . . . . . . . . . . . 52
4.7 A RSP signal is shown. Counting the signal peaks provides us with a measure of
respiration rate. . . . . . . . . . . . . . . . . . . . . . . . . . . . . . . . . . . . . . 52
4.8 The Tobii X120 eye gaze tracker which was used in this study. . . . . . . . . . . . 53
4.9 Results of the one way ANalysis Of VAriance (ANOVA) test on the self assessments
showing signi�cant di�erences between the average assessments levels of the two
gender groups. . . . . . . . . . . . . . . . . . . . . . . . . . . . . . . . . . . . . . 58
4.10 Stimulus videos are shown in the valence-arousal plane. The center of the ellipses
represents the mean arousal, and valence and the horizontal and vertical radius
represents the standard deviation of the online assessments. The clip codes are
printed at the center of each ellipse. . . . . . . . . . . . . . . . . . . . . . . . . . 60
4.11 The EEG cap layout for 32 EEG in addition to two reference electrodes. Retrieved
from Biosemi website (http://www.biosemi.com). . . . . . . . . . . . . . . . . . . 63
4.12 From top to bottom: on the �rst plot, there is an example of pupil diameter
measures from three di�erent participants in response to one video. The sec-
ond plot shows the �rst principal component extracted by Principal Component
Analysis (PCA) from the time series shown in the �rst plot (the lighting e�ect).
The bottom plot shows the pupil diameter of the blue signal in the �rst plot after
reducing the lighting e�ect. . . . . . . . . . . . . . . . . . . . . . . . . . . . . . . 67
4.13 Box plots of four di�erent gaze data features in three emotional conditions. (a)
Eye blinking rate for arousal classi�cation (b) Approach time ratio for valence
classi�cation (c) Blink depth, average blink time, for valence classi�cation (d)
STD of pupil diameter for valence classi�cation. One way ANOVA results showed
a signi�cant di�erence between features mean of di�erent classes (p < 0.05) . . . 69
4.14 This bar chart shows the F1 score for classi�cation results of each class from
di�erent modalities. . . . . . . . . . . . . . . . . . . . . . . . . . . . . . . . . . . 70
5.1 A diagram of the proposed video a�ective representation. . . . . . . . . . . . . . 85
5.2 Snapshot of the a�ective annotation software which is implemented in LABVIEW.
The positive excited manikin can be seen in the central part of the display. . . . . 86

xiv LIST OF FIGURES
5.3 Three classes in the valence-arousal space are shown; namely calm (1), positive
excited (2) and negative excited (3). . . . . . . . . . . . . . . . . . . . . . . . . . 87
5.4 Five-points smoothed shot arousal curve (full line), and corresponding self-assessments
(dashed line). . . . . . . . . . . . . . . . . . . . . . . . . . . . . . . . . . . . . . . 88
5.5 Classi�cation results for consecutive scenes in a movie. The circle represents the
target class, and the plus sign shows the results of the Naïve Bayesian classi�er
with genre prior and the triangle shows the results with both genre and time
priors. The samples, which are misclassi�ed by the Bayesian classi�er with genre
prior, are encircled. . . . . . . . . . . . . . . . . . . . . . . . . . . . . . . . . . . . 90
5.6 The Whissel dictionary of a�ect in language. Each word had three ratings. . . . . 91
5.7 Valence estimation and self reports on shot level for two movies are shown. . . . . 92

Acronyms and Abbreviations
ANOVA ANalysis Of VAriance
ANS Autonomous Nervous System
BCI Brain Computer Interface
BP Blood Pressure
BVP Blood Volume Pulse
CNS Central Nervous System
CMRR Common-Mode Rejection Ratio
CMS Common Mode Sense
DBN Dynamic Bayesian Network
DFA Discriminant Function Analysis
DLF Decision Level Fusion
ECG ElectroCardioGram
EEG ElectroEncephaloGram
EMG ElectroMyoGram
EOG ElectroOculoGram
FLF Feature Level Fusion
fNIRS functional Near InfraRed Spectroscopy
GSR Galvanic Skin Response
HR Heart Rate
HSL Hue, Saturation, Lightness
HSV Hue, Saturation, Value
HIT Human Intelligent Task
IADS International A�ective Digitized Sound system
IAPS International A�ective Picture System
KNN K-Nearest-Neighbor
LDA Linear Discriminant Analysis
MBP Marquardt BackPropagation
MFCC Mel Frequency Cepstral Coe�cients
xv

xvi List of Notations
MTurk Amazon Mechanical Turk
NES Neuro-Endocrine System
GMM Gaussian Mixture Models
MLP MultiLayer Perceptron
MPEG Moving Picture Experts Group
OCC Orthoney, Clore and Collins
PAD Pleasure-Arousal-Dominance
PANAS Positive And NegAtive Schedule
PC Personal Computer
PCA Principal Component Analysis
pLDA pseudoinverse Linear Discriminant Analysis
Plet Plethysmograph
QDA Quadratic Discriminant Analysis
RBFN Radial Basis Function Networks
RSP ReSPiration amplitude
RVM Relevance Vector Machine
SAM Self Assessment Manikin
SD Standard deviation
SEC Stimulus Evaluation Checks
SNS Somatic Nervous System
SVM Support Vector Machine
Temp Temperature
USB Universal Serial Bus

Chapter 1
Introduction
The digital age changed the way multimedia content is generated. Multimedia content used
to be only generated by a handful of big companies, record producers and television and radio
stations. Today, everybody can easily record, edit and publish multimedia content using handheld
devices. According to YouTube 1 weblog [4], YouTube users, in 2010, were uploading 35 hours
of videos in every minute. Although these videos can include redundant content, this number
is very large considering that YouTube is only one of the video repositories with user generated
content.
Figure 1.1: The video upload rate on youtube from June 2007 in hours per minute. This �gureis taken from YouTube's o�cial blog 3.
This number is almost seven times bigger comparing to June 2007 (see Fig. 1.1). The videos
uploaded on youtube in 2010 for one week is approximately equal to 176000 full length Hollywood
movies. This massive amount of digital content needs indexing to be searchable and accessible by
users. Most of the current multimedia retrieval systems use user generated tags to index videos.
Social media websites therefore encourage users to tag their content. However, the users' intent
when tagging multimedia content does not always match the information retrieval goals which is
to index the content with meaningful describing terms. A large portion of user de�ned tags are
either motivated by the goal of increasing the popularity and reputation of a user in an online
1. www.youtube.com
1

2 CHAPTER 1. INTRODUCTION
community or based on individual and egoistic judgements [5].
Multimedia indexing needs relevant terms, which can describe its content, genre and category.
Researchers in multimedia therefore focused on generating characterizations of videos involving
cognitive concepts depicted in videos to facilitate their indexing [6]. The cognitive concepts are
selected in a way that is easy to detect by human. An alternative to the cognitive approach
to indexing is a paradigm for video indexing based on the emotions which are felt by viewers
watching the content [7]. This is motivated by the fact that emotions play an important role in
viewers' content selection and consumption.
When a user watches video clips or listens to music, he/she may experience certain feelings
and emotions [8, 9, 10] which manifest through bodily and physiological cues, e.g., pupil dilation
and contraction, facial expressions, e.g., frowning, and changes in vocal features, e.g., laughter.
A�ective video indexing aims at deriving representations of video that characterize the emotions
that they elicit. A�ective experience in response to a video is personal which means it depends on
the experience of a single viewer. However, there exist a more popular response which is the basis
of movie genres we know, e.g., drama, comedy, horror. The main aim of the study which was
done and reported in this thesis is to detect and estimate these a�ective characteristics of videos
based on automated content analysis emotion prediction or to recognize emotions in response
to videos with the aim of a�ective indexing. Implicit tagging refers to the e�ortless generation
of subjective tags based on users non-verbal behavioral responses to a content. Implicit tagging
of videos using a�ective information can help recommendation and retrieval systems to improve
their performance [11, 12, 13]. Automated a�ective tagging tries to estimate the emotional
response which is more likely to be elicited by content, e.g., loud sound or faster motions are
more likely to elicit excitement, whereas implicit tagging a�ective tagging uses the responses of
users to generate tags. Implicit or automated tagging thus does not interrupt users while listening
or watching a video. Moreover, in the presence of reliable implicit or automated tagging methods,
determined tags carry less irrelevant and inaccurate information. The set of relevant and re�ned
indexing terms will improve the multimedia information retrieval results.
In automated a�ective tagging, a set of content features, e.g., motion component, color
variance, audio energy, extracted from the content are used to estimate the emotions which are
likely to be elicited after showing the content. This approach is an open loop because it does
not rely on the response of the viewers and can be only used to provide an approximation for
possible a�ective reactions to the content. The automated a�ective tagging can be used as a
starting point to �lter the data in a cold start scenario.
On the other hand, the implicit tagging results can enrich the user generated tags and auto-
mated tags to improve their quality. In order to translate a user's bodily and behavioral reactions
to emotions, reliable emotion assessment techniques are required. Emotion assessment is a chal-
lenging task; even users are not always able to express their emotion by words and the emotion
self-reporting error is not negligible. This is therefore di�cult to de�ne a ground truth. A�ec-
tive self-reports might be held in doubt because users cannot always remember all the di�erent
emotions they had felt during watching a video, and/or might misrepresent their feelings due to
self presentation, e.g., a user wants to show he is courageous whereas, in reality, he was scared
[14]. The emotion recognition system provides us with an alternative that reduces the e�ort of

1.1. APPLICATION SCENARIO 3
deciding on the right label and on de�ning the right questions or methods to assess emotions
explicitly.
1.1 Application Scenario
In a real system, every item usually comes with user generated tags. The automated or
content based a�ective tagging can provide additional tags, which can semantically describe the
content, e.g., exciting video, slow or sad video. Implicit tagging can further enhance these tags
by �rst providing reliable tags for a given content and then by providing a more genuine ground
truth for further processing of the content. These two tagging strategies together can reinforce
each other by providing feedback and initial tags.
What I mean by a�ective content of videos is not the emotion expressed in the content but
the emotion felt by the users while watching the videos. Users do not evaluate media content
on the same criteria. Some might tag multimedia content with words to express their emotion
while others might use tags to describe the content. For example, a picture receive di�erent tags
based on the objects in the image, the camera by which the picture was taken or the emotion
a user felt looking at the picture. Scherer de�nes this by intrinsic and extrinsic appraisal [15].
Intrinsic appraisal is independent of the current goals and values of the viewer while extrinsic
or transactional appraisal leads into feeling emotions in response to the stimuli. For example,
the content's intrinsic emotion of a picture with a smiling face is happiness whereas this person
might be a hatred �gure to the viewer and the extrinsic appraisal leads into unpleasant emotions.
What I want to detect is the later one that is the emotion felt by the viewer.
In the proposed application scenario, when a user watches a video his/her emotional expres-
sions will be detectable by sensors and facial and body tracking methods. These responses can
be reliably used to reliably generate a�ective tags. A scheme of implicit tagging scenario versus
explicit tagging is shown in Fig. 1.2.
Figure 1.2: Implicit a�ective tagging vs. explicit tagging scenarios. The analysis of the bodilyresponses replaces the direct interaction between user and the computer. Therefore, users do nothave to be distracted for tagging the content.
In the proposed implicit tagging scenario, multimedia content will be tagged based on the
bodily reactions of users recorded by a physiological acquisition device and an eye gaze tracker.
The reactions can be used both to �nd tags common to a population and to develop a personal

4 CHAPTER 1. INTRODUCTION
pro�le possibly in fusion with user preferences and browsing history. With the recently marketed
physiological devices such as Neurosky 4, Emotiv helmet 5, and Q-sensor 6 physiological interfaces
are likely going to be the emerging human computer interfaces of the future.
1.2 Contributions
The contributions and achievements of the current thesis can be summarized in the following
items:
� Study of the correlation between low level video and audio content features, such as lighting,
motion component, audio energy, and emotional responses, i.e., arousal and valence self
reports, and physiological responses, e.g. facial muscle activities, Galvanic Skin Response
(GSR).
� Development and evaluation of a participant-dependent regression based method to detect
emotion in continuous space using peripheral nervous system physiological responses.
� Development and evaluation of a multi-modal participant independent emotion recognition
method with pupil dilation, gaze distance and ElectroEncephaloGram (EEG) signals. This
emotion recognition method was developed to satisfy a video implicit tagging system needs.
� Development and evaluation of a regression based content analysis method to estimate the
a�ect of viewers from the content of the video.
� Proposition of temporal and genre priors to be used in a Bayesian framework for a�ective
classi�cation of videos based on their content.
� Proposition of a text analysis approach for a�ective characterizations of movie scenes based
on their subtitles.
� Development of two databases with emotional responses of 27 and 32 participants to movie
scenes, online user generated videos, and music videos.
� Development of video benchmarks for a�ective characterization and boredom ranking.
These contributions have been re�ected in the publications by the author during his thesis
work [13, 3, 16, 10, 17, 18, 19, 2, 20, 21, 22]. These publications are also listed in Appendix 6.3.
1.3 Thesis Overview
In Chapter 2, I give a background on emotion theories, a�ective content analysis and emotion
recognition in response to videos. Next, in Chapter 3, existing emotional corpora are listed
and presented and then the developed video corpora for stimuli and a�ective analysis as well
as databases of emotional responses are presented. In Chapter 4, methodology and results of
emotion recognition methods employed to detect emotion in response to videos are presented.
In Chapter 5, content analysis methods to detect emotions that are more likely to be elicited
by a given multimedia content and their evaluations are given. Finally, Chapter 6 concludes the
thesis and gives the perspectives.
4. http://www.neurosky.com/5. http://www.emotiv.com/6. http://www.a�ectiva.com/q-sensor/

Chapter 2
Background
2.1 Why Do We Feel Emotions?
Emotions are complex phenomena with a�ective, cognitive, conative and physiological com-
ponents [23]. The a�ective component is the subjective experience in connection with feelings.
The perception and evaluation of the emotional situation is the cognitive component. The cona-
tive component is about a�ective expression. The conative component includes facial expressions,
body gesture, and any other action which has a preparatory function for action in response to the
emotional situation. The physiological components regulate physiological responses in reaction
to the emotional situation, for example, increasing perspiration during a fearful experience.
Darwin suggested that emotions only exist due to their survival value and therefore, should
be observable in both human and animals [24]. James [25] pioneered the idea that emotions have
certain peripheral physiological responses. He suggested that emotions are felt due to changes in
physiological responses. Social constructionists support another theory for the origin of emotions.
They claim emotions are only products of social interaction and cultural rules. Darwinian theory
of emotion emphasizes the evolution history of species and the e�ect of emotions on their survival
whereas social constructionists emphasize the history of individuals in generating similar bodily
responses to emotions [24].
Cognitive theories of emotion are the most recent theories developed to de�ne emotion.
Amongst the cognitive theories, one of the most well-accepted ones which explains the emotional
process is the appraisal theory. According to this theory, cognitive judgment or appraisal of the
situation is a key factor in the emergence of emotions [26, 27, 1]. According to Orthoney, Clore
and Collins (OCC) [27] emotions are experienced with the following scenario. First, there is a
perception of an event, object or an action. Then, there will be an evaluation of events, objects
or action according to personal wishes and norms. Finally, the perception and evaluation result
in a speci�c emotion. Considering the same scenario for an emotional experience in response to
multimedia content, emotions arise �rst through sympathy with the presented emotions in the
content [23]. During the appraisal process for an emotional experience in response to multimedia
content, the viewer examines events, situations and objects with respect to their novelty, pleas-
antness, goal, attainability, copability, and compatibility with his/her norms. Then, the viewer's
perception induces speci�c emotions, which changes the viewer's physiological responses, mo-
tor actions, and feelings. The component process model, proposed by Scherer [26, 28], will be
5

6 CHAPTER 2. BACKGROUND
discussed in more detail, in the following Section.
There are three categories of emotional processes in response to multimedia which are emotion
induction, emotional contagion and empathic sympathy [23]. An example of emotion induction
is when in a TV show, a politician's comment makes the viewers angry while he is not angry
himself. The angry response from the viewers is due to their perception of the situation according
to their goals and values. The emotional contagion happens when the viewer only perceives the
expressed emotion from a video. For example, the induced joy as a result of sitcom laughters
can be categorized in this category. In the empathic category, the situation or event does not
a�ect the viewer directly but the viewer follows the appraisal steps of the present characters in
the multimedia content. The empathic reaction can be symmetric co-emotion when the viewer
has positive feelings about the character or asymmetric co-emotions in case of negative feeling
about the character [29].
Empathy is a complex phenomenon which has cognitive and a�ective components. The
a�ective empathy is the primitive response for sympathizing with another individual. On the
contrary, cognitive empathy is understanding another person and the rational reconstruction of
his/her feelings [30, 23]. Zillman developed the a�ective disposition theory for narrative plot
[31, 29]. According to this theory, empathic emotions are originated from the observation of
the actors by viewers. First, the character's actions are morally judged by the viewer and the
judgment results in a positive or negative perception of the character. Then, depending on the
character's approval or disapproval from the viewer, the viewer sympathizes emphatically or the
counter empathy might happen. The intensity of the perceived emotion in response to a �lm
depends on how much the viewer identi�es himself/herself with the heroes and to what extent
the one's own identity is given up while watching the video [31]. The most important emotion
inducing components of movies are narrative structures and music [23].
One should be careful not to mix moods and emotions. Mood is an a�ective di�used state
that is long, slow moving and not tied to a speci�c object or stimulus whereas emotions can
occur in short moments with higher intensities [15].
2.2 Emotional Representations
2.2.1 Component processes
The component process model of emotions is based on the cognitive theory of emotion in
which emotion is considered a cognitive process. Scherer de�nes emotion as �an episode of
interrelated, synchronized changes in the states of all or most of the �ve organismic subsystems
in response to the evaluation of an external or internal stimulus event as relevant to major
concerns of the organism� [15]. In the absence of any of the components and factors, an a�ective
phenomenon cannot be called emotion. For example while �feeling� is the subjective experience
and an a�ective component of emotion, it is not the synonym of emotion [15]. Mood can be also
distinguished from emotion due to its lack of speci�c trigger.
According to the component process model proposed by Scherer, �ve components correspond-
ing to �ve di�erent functions are engaged in an emotion episode. These �ve components are cogni-
tion, peripheral e�erence, motivation, motor expression and subjective feeling [1]. The cognitive

2.2. EMOTIONAL REPRESENTATIONS 7
component evaluates objects and events in a process called Stimulus Evaluation Checks (SEC).
In SEC process, an organism examines the relevance of an action or event considering the fol-
lowing questions:
1. Is it relevant to the organism or does it a�ect the organism(relevance)?
2. What are the implications of the event or action regarding organism's goals and well-being
(implications)?
3. Can the organism cope with it (copping potential)?
4. Does the event or action have any con�ict with social normative signi�cance or values
(normative signi�cance)?
According to [1] the �rst question can be answered by checking the novelty of the stimulus,
its intrinsic pleasantness and its goal or need relevance. Implications of an event or action for an
organism can be checked by causal attribution check or understanding who and why caused the
action or event. The implications can be further evaluated by checking the outcome probability,
goal/need conduciveness or positive e�ect on the organism's goals and needs and the urgency of
the action or event. An action or event can be urgent when it endangers organism's goals and
needs and requires fast response, e.g., �ght or �ight actions. Coping potential can be determined
by evaluating the control of agents or organism on the event or action, the power of the organism
over the stimulus and its potential for adjustment with the event or action and its consequences.
Normative signi�cance is evaluated for socially living species by checking the organism's internal
and external standards.
Figure 2.1: The component process model of emotion (This �gure is taken from [1]).
The component process model evaluates an event or action at di�erent layers (see Fig. 2.1).
Appraisal and other cognitive functions can have a bi-directional e�ect on each other. A weak

8 CHAPTER 2. BACKGROUND
stimulus can create a large e�ect after being evaluated and giving a positive feedback to the
system. For example, a relevant stimulus can increase the importance of a previously irrelevant
stimulus after the relevance check in the appraisal mechanism.
The SEC evaluation will make e�ect on the autonomic physiology, action tendencies, motor
expressions and eventually subjective feeling. The Autonomous Nervous System (ANS) along
with Central Nervous System (CNS) and Neuro-Endocrine System (NES) regulate the neuro-
physiological component or body changes to prepare the individual for the emotional reaction.
This reaction can be more intense in case of �ght or �ight activations, e.g., in case of fear or
anger. The Somatic Nervous System (SNS) plays the role of communication of reaction and be-
havioral intention by driving the motor expression component, e.g., facial and vocal expression.
Eventually, the central nervous system monitors the internal state and surrounding environment
reactions and causes subjective feeling [15].
The emotional experience is a result of e�ect of an action or event on all subsystems which
is triggered by SEC evaluation. The subjective feeling component communicates with other
subcomponents and makes the organism to communicate the felt emotions with others [28].
2.2.2 Discrete models
Discrete emotions theories are inspired by Darwin and support the idea of the existence of the
certain number of basic and universal emotions [15, 24]. Darwin suggested that emotions exist
due to their importance for species' survival. Di�erent psychologists proposed di�erent lists of
basic emotions. The so called basic emotions are mostly utilitarian emotions, and their number
is usually from 2 to 14.
Plutchik proposed eight primary emotions; namely, anger, fear, sadness, disgust, surprise,
anticipation, trust, and joy. He suggested that basic emotions are biologically primitive and
have evolved in order to increase the reproductive success of animals [32]. Ekman studied the
universality of emotions based on facial expressions and his list of basic emotion included fear,
anger, surprise, disgust, joy, and sadness [24]. Scherer suggests using the term �modal� instead
of �basic� emotions. Scherer also proposed a list of emotional keywords to code discrete and free
choice emotional reports [15].
2.2.3 Dimensional models
Wundt [33] was the �rst to propose a dimensional representation for emotions. Dimensional
theories of emotion suggest that emotions can be represented as points in a continuous space,
and discrete emotions are folk-psychological concepts [34]. Discrete emotions also have problems
in representing emotions. The main one being that keywords are not cross-lingual: emotions
do not have exact translations in di�erent languages, e.g., �disgust� does not have an exact
translation in Polish [35]. Psychologists often represent emotions in an n-dimensional space
(generally 2- or 3-dimensional). The most famous such space, which is used in the present study
and originates from cognitive theory, is the 3D valence-arousal-dominance or Pleasure-Arousal-
Dominance (PAD) space [36]. The valence scale ranges from unpleasant to pleasant. The arousal
scale ranges from passive to active or excited. The dominance scale ranges from submissive (or
�without control�) to dominant (or �in control, empowered�). Fontaine et al. [37] proposed adding
2.3. EMOTIONAL SELF-REPORTING METHODS 9
predictability dimension to PAD dimensions. Predictability level describes to what extent the
sequence of events is predictable or surprising for a person.
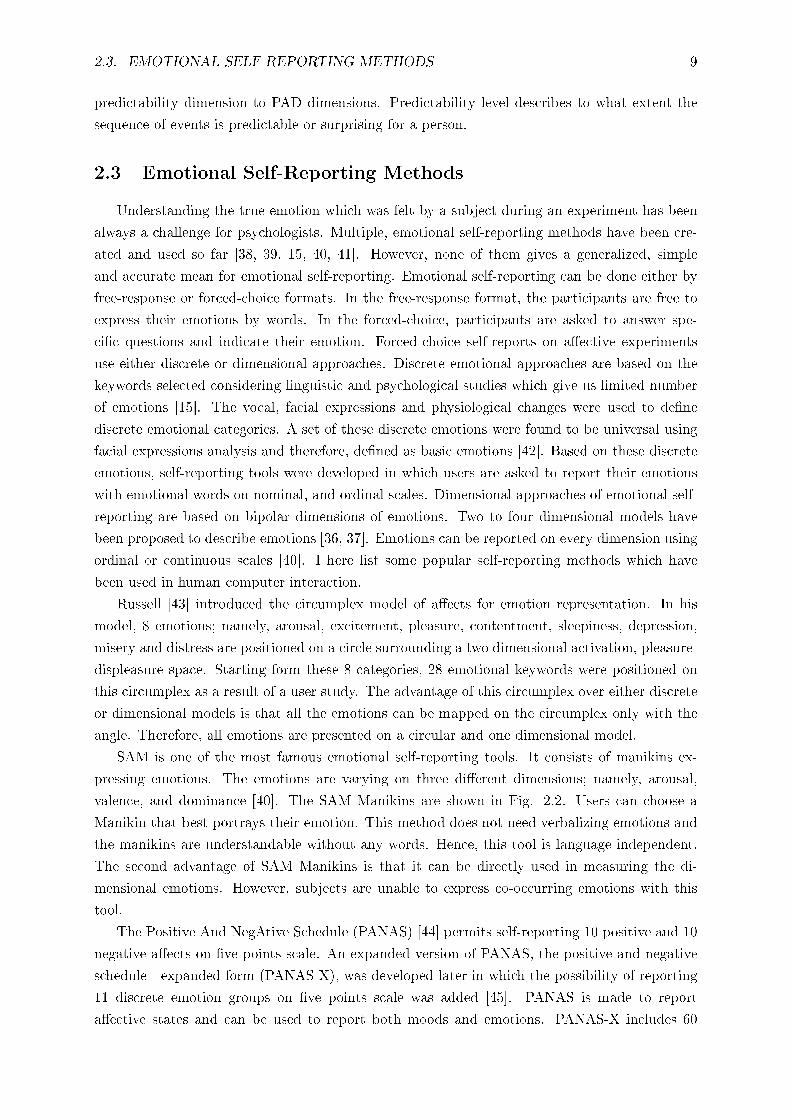
2.3 Emotional Self-Reporting Methods
Understanding the true emotion which was felt by a subject during an experiment has been
always a challenge for psychologists. Multiple, emotional self-reporting methods have been cre-
ated and used so far [38, 39, 15, 40, 41]. However, none of them gives a generalized, simple
and accurate mean for emotional self-reporting. Emotional self-reporting can be done either by
free-response or forced-choice formats. In the free-response format, the participants are free to
express their emotions by words. In the forced-choice, participants are asked to answer spe-
ci�c questions and indicate their emotion. Forced-choice self-reports on a�ective experiments
use either discrete or dimensional approaches. Discrete emotional approaches are based on the
keywords selected considering linguistic and psychological studies which give us limited number
of emotions [15]. The vocal, facial expressions and physiological changes were used to de�ne
discrete emotional categories. A set of these discrete emotions were found to be universal using
facial expressions analysis and therefore, de�ned as basic emotions [42]. Based on these discrete
emotions, self-reporting tools were developed in which users are asked to report their emotions
with emotional words on nominal, and ordinal scales. Dimensional approaches of emotional self-
reporting are based on bipolar dimensions of emotions. Two to four dimensional models have
been proposed to describe emotions [36, 37]. Emotions can be reported on every dimension using
ordinal or continuous scales [40]. I here list some popular self-reporting methods which have
been used in human computer interaction.
Russell [43] introduced the circumplex model of a�ects for emotion representation. In his
model, 8 emotions; namely, arousal, excitement, pleasure, contentment, sleepiness, depression,
misery and distress are positioned on a circle surrounding a two dimensional activation, pleasure-
displeasure space. Starting form these 8 categories, 28 emotional keywords were positioned on
this circumplex as a result of a user study. The advantage of this circumplex over either discrete
or dimensional models is that all the emotions can be mapped on the circumplex only with the
angle. Therefore, all emotions are presented on a circular and one dimensional model.
SAM is one of the most famous emotional self-reporting tools. It consists of manikins ex-
pressing emotions. The emotions are varying on three di�erent dimensions; namely, arousal,
valence, and dominance [40]. The SAM Manikins are shown in Fig. 2.2. Users can choose a
Manikin that best portrays their emotion. This method does not need verbalizing emotions and
the manikins are understandable without any words. Hence, this tool is language independent.
The second advantage of SAM Manikins is that it can be directly used in measuring the di-
mensional emotions. However, subjects are unable to express co-occurring emotions with this
tool.
The Positive And NegAtive Schedule (PANAS) [44] permits self-reporting 10 positive and 10
negative a�ects on �ve points scale. An expanded version of PANAS, the positive and negative
schedule - expanded form (PANAS-X), was developed later in which the possibility of reporting
11 discrete emotion groups on �ve points scale was added [45]. PANAS is made to report
a�ective states and can be used to report both moods and emotions. PANAS-X includes 60

10 CHAPTER 2. BACKGROUND
Figure 2.2: Self Assessment Manikins. From top to bottom the manikins express di�erent levelsof arousal, valence, and dominance.
emotional words and takes on average 10 minutes to be completed [45]. The time needed to �ll
this questionnaire make it too di�cult to use in the experiments with limited time and several
stimuli.
Scherer [15] positioned 16 emotions around a circle to combine both dimensional and discrete
emotional approaches to create the Geneva emotion wheel. For each emotion around the wheel,
�ve circles with increasing size from the center to the sides are displayed. The size of the circle
is an indicator of the intensity of felt emotion (see Fig. 2.3). In an experiment, a participant
can pick up to two emotions, which were the closest to his/her experience from 20 emotions, and
then report their intensities with the size of the marked circles. In case, no emotion is felt, a
user can mark the upper half circle in the hub of the wheel. If a di�erent emotion is felt by a
user, it can be written in the lower half circle. The emotions are sorted on the circle in a way
to have, high control emotions on the top and low control emotions in the bottom whereas the
horizontal axis which is not visible on the wheel represent valence or pleasantness.
Figure 2.3: A participant can indicate his emotion on Geneva emotion wheel by clicking orchoosing the circles.

2.3. EMOTIONAL SELF-REPORTING METHODS 11
PrEmo is an alternative non-verbal emotion reporting tool to report emotions in response
to product design. Desmet proposed PrEmo to overcome the problem of reporting co-occurring
emotions with animated characters expressing emotions [38]. PrEmo consists of 14 animated
characters expressing di�erent emotions, and it is hence language independent. Users can rate
in three levels each character that they identify as the ones relevant to their felt emotions (see
Fig. 2.4.
Figure 2.4: Users can identify emotions they are feeling with 14 animated characters are express-ing emotions. Retrieved from http://studiolab.io.tudelft.nl/desmet/PrEmo.
Zoghbi et al. proposed a joystick for emotional communication in human robot interactions
[46]. Users can report the pleasantness or valence by moving the joystick forward and backward
and report the level of arousal by squeezing the joystick handle. Although this tool gives the
possibility to report the emotions in real time, it causes distraction for a participant in front of
a stimulus and it is not yet available for other researchers to use.
2.3.1 Video a�ective annotation tools
Among the self-reporting tools which have been developed, a few of them were designed
speci�cally for video a�ective annotation. Villon developed an annotation tool with which a
user can drag and drop videos on the valence-arousal plane. This method gives the possibility
of comparison between the ratings given to di�erent videos and enable a user to give ratings
relative to other videos [47]. This tool enables users to keep their previous reports into account
while annotating a new video.
Feeltrace was developed to annotate the intrinsic emotion in videos [48]. This tool is originally
designed to annotate the emotions expressed in videos, e.g., talk shows, acted facial expressions
or gestures [49]. Although this tool gives the possibility of continuous annotation, it is not an
appropriate tool for emotional self-reporting, because it is di�cult for a user to both concentrate
on the video and reporting changes in his emotions.
An online video a�ective annotation tool has been developed by Soleymani et al. [18]. In
their annotation tool, a user can self-report emotions after watching a given video clip by means

12 CHAPTER 2. BACKGROUND
of SAM manikins and emotional keywords from a selected list in a drop down menu (see Fig.
3.3).
2.4 A�ective Characterization of Videos
Wang and Cheong [50] used content audio and video features to classify basic emotions elicited
by movie scenes. In [50], audio was classi�ed into music, speech and environment signals and
these were treated separately to shape an audio a�ective feature vector. The audio a�ective vector
of each scene was fused with video-based features such as key lighting and visual excitement to
form a scene feature vector. Finally, using the scene feature vectors, movie scenes were classi�ed
and labeled with emotions.
Irie et al. [51] proposed a latent topic model by de�ning a�ective audio-visual words in the
content of movies to detect emotions in movie scenes. They extracted emotion-category-speci�c
audio-visual features named a�ective audio-visual words. These higher level features were used
to classify movie scenes using a latent topic driving model. This model takes into account
temporal information which is the e�ect of the emotion from precedent scene to improve a�ect
classi�cation.
A hierarchical movie content analysis method based on arousal and valence related features
was presented by M. Xu et al. [52]. In this method, the a�ect of each shot was �rst classi�ed in
the arousal domain using the arousal correlated features and fuzzy clustering. The audio short
time energy and the �rst four Mel Frequency Cepstral Coe�cients (MFCC) (as a representation
of energy features), shot length, and the motion component of consecutive frames were used
to classify shots in three arousal classes. Next, they used color energy, lighting and brightness
as valence related features to be used for a HMM-based valence classi�cation of the previously
arousal-categorized shots. A drawback of the proposed approach is that a shot can last less than
few seconds; it is thus not realistic to form a ground-truth with assigning an emotion label to
each shot.
A regression based arousal and valence representation of MTV (Music-TV) clips using content
features was presented in [53]. The arousal and valence values were separated into 8 clusters by
an a�nity propagation method. Two di�erent feature sets were used for arousal and valence
estimation which was evaluated using a ground truth. The ground truth was based on the
average assessments of 11 users.

2.4. AFFECTIVE CHARACTERIZATION OF VIDEOS 13
Table2.1:
Thesummaryof
video
a�ective
representation
literature.
Study
Emotion
repres.
Dimensions
or
Classes
#Annota-
tors
Modalities
Results
Kang[54]
disc.
fear/anger,
joy,
sadness
andnetural
10V
classi�cation
rate,fear:
81.3%,sadness:
76.5%,
joy:78.4%
Hanjalic&Xu[7]
cont.
valence
andarousal
N/A
AV
noevaluation
Wang&
Cheong
[50]
disc.
fear,
anger,
surprise,
sadness,joy,disgustand
neutral
3AV
74.7%
Ari�n&
Cheung
[55]
cont.
pleasure,arousal,
and
dom
inance
14AV
-
Xuet
al.[52]
disc.
fear,anger,
happiness,
sadnessandneutral
?AV
80.7%
Irieet
al.[51]
disc.
acceptance,anger,
an-
ticipation,disgust,joy,
fear,
sadness,
surprise
andnetural
16AV
subject
agreem
entrate
0.56
disc.:discrete,cont.:continuous,repres.:representation,V:visual,AV,audio-visual,N/A
:not
available

14 CHAPTER 2. BACKGROUND
Emotional characteristics of videos have also improved music and image recommendation.
Shan et al. [11] used a�ective characterization using content analysis to improve �lm music
recommendation. Tkal£i£ et al. showed how a�ective information can improve image recom-
mendation [12]. In their image recommendation scenario, a�ective scores of images from the
International A�ective Picture System (IAPS) [56] were used as features for an image recom-
mender. They conducted an experiment with 52 participants to study the e�ect of using a�ective
scores. The image recommender using a�ective scores showed a signi�cant improvement in the
performance of their image recommendation system.
A summary of few existing literature in emotional understanding of videos using content
analysis is given in Table 2.1. There has been long standing research on emotion assessment from
physiological signals [8, 57, 58, 59, 60, 61]. These studies can be divided into di�erent categories
according to the modalities recorded and the stimuli. I divide stimuli into two categories, active
and passive paradigm. In an active stimulus paradigm, the participant is active in the process of
eliciting an emotion whereas in a passive stimulus paradigm, a participant is passively observing
or listening an emotional stimulus. The work presented in this thesis does not involve active
stimuli paradigm and can be categorized as passive stimuli paradigm studies. In the following, I
introduce some relevant existing passive stimuli studies.
Lisetti and Nasoz used physiological response to recognize emotion in response to movie
scenes [60]. The movie scenes elicited six emotions; namely sadness, amusement, fear, anger,
frustration and surprise. They achieved a high recognition rate of 84% for the recognition
of these six emotions. However, the classi�cation was based on the analysis of the signals in
response to pre-selected segments, in the shown video, known to be related to highly emotional
events.
Takahashi [62] recorded EEG and peripheral physiological signals from 12 participants. He
then classi�ed the responses to emotional videos into �ve classes; namely, joy, sadness, disgust,
fear, and relax. He achieved the accuracy of 41.7% using EEG signals. However, the feature
level fusion of EEG signals and peripheral physiological signals failed to improve the classi�cation
accuracy.
Kim and André [8] used music as stimuli to elicit emotions in four participants. The emotions
were corresponding to the four quadrants on the valence-arousal plane; namely, positive high/low
and negative high/low classes. Peripheral physiological signals were recorded while the songs
corresponding to di�erent emotional states selected by participants according to their personal
preferences were playing. In a participant independent approach, their system could recognize
four emotional classes with 70% accuracy.

2.4. AFFECTIVE CHARACTERIZATION OF VIDEOS 15
Table
2.2:
Thesummaryof
emotionrecognitionliterature
usingpassive
stimuliparadigm
andphysiological
signals.
(Part.:participant,
Clas.:
classes,dep.:dependent,ind.:independent,K-Nearest-Neighbor
(KNN),LinearDiscrim
inantAnalysis(LDA),MarquardtBackPropagation(M
BP),
pseudoinverseLinearDiscrim
inantAnalysis(pLDA),EMDC:em
otion-speci�cmultileveldichotom
ousclassi�cation,RadialBasisFunctionNetworks
(RBFN),
QuadraticDiscrim
inantAnalysis(Q
DA),
MultiLayer
Perceptron
(MLP),
ReSPirationam
plitude(R
SP),
Tem
perature
(Tem
p),
Blood
Pressure
(BP),ElectroCardioGram
(ECG),Plethysm
ograph(Plet),ElectroOculoGram
(EOG),ElectroMyoGram
(EMG),Induc.:Induction,Im
p.
Card.:Im
pedance
Cardiography)
Study
Stimuli
#Part.
Sensors
Classi�ers
# Clas.
Classes
Best
averagere-
sultandpart.de-
pendency
Lisetti
and
Nasoz
[60]
video
29GSR,
Tem
p,
ac-
celerometer,heat�ow
,Heart
Rate(H
R)
KNN,
Discrim
inant
Function
Analysis
(DFA),MBP
6sadness,
anger,
frus-
tration,
surprise,
fear,
amusement
84%,Part.
ind.
Takahashi
[62]
video
12EMG,
EOG,
Plet,
GSR,EEG
SupportVec-
tor
Machine
(SVM)
5joy,
sadness,
disgust,
fear,andrelax
41.7%,Part.
ind.
Bailenson
etal.[63]
video
41systolic
BP,diastolic
BP,meanarterial
BP,
GSR,
ECG,
Tem
p,
Plet,
Piezo-electric
sensor
SVM
2sadness/neutral,
amuse-
ment/neutral
95%,Part.
dep.
Kim
andAn-
dré
[8]
music
3ECG,RSP,GSR
EMDC,
pLDA
4positive
high/low
arousal,
negative,
high/low
arousal
70%,Part.
ind.
Koelstra
etal.[16]
music
video
5EMG,
GSR,
RSP,
Tem
p,EEG
LDA
2low/higharousalandva-
lence
58%,Part.
dep.
Kolodyazhniy
etal.[64]
video
34ECG,
EMG,
Imp.
Card.,Tem
p,Capnog-
raphy,
RSP.,
Induc.,
Plet.,
BP,
Piezo-
electricsensor
LDA,
QDA,
MLP,
RBFN,
KNN
3sadness,fear,neutral
77.5%,Part.
ind.

16 CHAPTER 2. BACKGROUND
Table2.3:
Thesummaryof
emotionrecognitionliterature
usingactive
stimuliparadigm
andphysiological
signals.(Part.:participant,Clas.:classes,
Part.:participant,
dep.:dependent,
ind.:independent,
GaussianMixture
Models(G
MM),
Relevance
VectorMachine(RVM),
Dynam
icBayesian
Network(D
BN),BloodVolumePulse(B
VP))
Study
Stimuli
#Part.
Sensors
Classi�ers
# Clas.
Classes
Best
averagere-
sultandpart.de-
pendency
Healey
and
Picard[65]
driving
24ECG,
EMG,
RSP,
GSR
LDA
3threestress
levels
97%
Part.
ind.
Picardet
al.
[66]
self
in-
duction
1ECG,
RSP,
GSR,
BVP,EMG
LDA
8neutral,
anger,
hate,
grief,
platonic
love,
romantic
love,
joy,
reverence
81%
Part.
dep.
Wang
and
Gong[58]
simulated
driving
13RSP,
Tem
p,
GSR,
BVP
LDA,GMM,
SVM,DBN
5happy,
angry,
sad,
fa-
tigue,neutral
80%
Part.
dep.
Katsiset
al.
[67]
simulated
driving
10ECG,
EMG,
GSR,
RSP
SVM
4low/high
stress,
disap-
pointm
ent,euphoria
79.3%
Part.
dep.
Chanel
etal.
[59]
gaming
20RSP,
Tem
p,
GSR,
BVP,EEG
LDA,
QDA,
SVM
3boredom
,engagement,
anxiety
63%
Part.
ind.
Chanel
etal.
[61]
recall
10RSP,
Tem
p,
GSR,
BVP,EEG
LDA,
QDA,
SVM,RVM
3calm
,positive
excited,
negativeexcited
70%
Part.
dep.

2.4. AFFECTIVE CHARACTERIZATION OF VIDEOS 17
Koelstra et al. [16] recorded EEG and peripheral physiological signals of six participants
in response to music videos. Participants rated their felt emotions by means of arousal, va-
lence and like/dislike rating rating. The emotional responses of each participant were classi�ed
into two classes of low/high arousal, low/high like/dislike, and low/high valence. The average
classi�cation rates varied between 55% and 58% which is slightly above random level.
In a more recent study, Kolodyazhniy et al. [64] used peripheral physiological signals to
recognize neutral, fear and sadness responses to movie excerpts [68]. During the presentation
of videos to the participants, they introduced startle stimuli using randomly generated white
noise sounds to boost physiological responses. Their system was able to recognize sadness, fear
and neutral, emotional states with the recognition rate of 77.5% in a participant-independent
approach.
Active stimuli have been also employed for emotion recognition studies. Examples are driving
or simulated driving [65, 58, 67], emotion recall [59, 66] and gaming [61].
Tables 2.3 and 2.2 summarize the characteristics of di�erent emotion recognition studies using
passive and active stimuli and physiological signals.
2.4.1 Emotion recognition from Eye gaze and pupil dilation
Eye gaze and pupillary responses has been used extensively to measure attention. However,
we are not aware of research on how emotions a�ect eye gaze while watching videos; therefore,
the eye gaze itself has not been used for emotion recognition. The pupillary response is the
measurement of pupil diameter over time. Pupil can dilate or constrict in response to illuminary,
cognitive, attentional and emotional stimuli [69, 70].
Partala and Surakka [70] studied pupil size variation in three di�erent emotional states;
namely, positive activated, negative activated and neutral. In both positive and negative emo-
tional conditions, pupil diameter was signi�cantly larger than the neutral state. Bardley et al.
[69] also recorded pupil diameter with heart rate and skin conductance in response to IAPS
emotional pictures [56] and found signi�cant pupil dilation in the presence of high arousal as well
as unpleasant emotions.
Gao et al. [71] showed the signi�cance of using pupillary re�ex for stress assessment after
reducing the light e�ect using a real-time feedback. They displayed words in di�erent colors
and asked participants to report displayed words' font color. According to �Stroop Color-Word
Interference Test�, words with certain colors induce stress in the viewers.
2.4.2 Emotion recognition from audio-visual modalities
Most of research aiming at detecting emotions is based on the analysis of facial expressions,
speech, behavioral attitudes such as posture which can be all measured by audio-visual modalities
[72]. From these modalities, one of the most well studied emotional expression channels after
audio is visual channel capturing facial expressions. A human being uses facial expressions as
a natural mean of emotional communication. Emotional expressions are also used in human-
human communication to clarify and stress what is said, to signal comprehension, disagreement,
and intentions, in brief, to regulate interactions with the environment and other persons in the
vicinity [73, 74]. Emotional facial expressions are often classi�ed into six Ekman basic emotion

18 CHAPTER 2. BACKGROUND
using his action unit coding system [24]. Automatic facial expression methods are usually based
on tracking multiple points, e.g., corners of lips, on a registered image of face [75].
Posture and gesture have been shown to carry valuable information related to a�ect [76, 77].
It has been shown how low level posture features such as orientation and distances between joints
can discriminate between di�erent emotional states [78, 76].
Audio and speech have been analyzed in two di�erent levels [79]. The �rst level is explicit or
linguistic level, which deals with the semantics and the words spoken. An a�ective dictionary was
developed by Whissell which speci�es each word dimensional a�ective scores [80]. The second
level, acoustic and prosodic features, have been used to detect the emotion of speakers. Low level
speech features such as Mel Frequency Cepstral Coe�cients (MFCC) are often used to detect
speakers' emotions in continuous as well as discrete emotional representations [81, 77, 82].
For further reading on audio-visual a�ect recognition methods, I refer the reader to the
following surveys [83, 79, 72]
2.5 Implicit Tagging
Pantic and Vinciarelli de�ne implicit tagging as using non-verbal behavior to �nd relevant
keyword or tags for multimedia content [5]. Implicit tagging research has recently attracted
researchers' attention, and number of studies have been published [10, 84, 85, 86]. To the best
of my knowledge the following studies have been conducted in this direction.
Kierkels et al. [13] proposed a method for personalized a�ective tagging of multimedia using
peripheral physiological signals. Valence and arousal levels of participants' emotion when watch-
ing videos were computed from physiological responses using linear regression [10]. Quantized
arousal and valence levels for a clip were then mapped to emotion labels. This mapping enabled
the retrieval of video clips based on keyword queries. So far this novel method achieved low
precision.
Joho et al. [84, 85] developed a video summarization tool using facial expressions. A prob-
abilistic emotion recognition based on facial expressions was employed to detect emotions of 10
participants watching eight video clips. The participants were asked to mark the highlights of
the video with an annotation tool after the experiments. The expression change rate between
di�erent emotional expressions and the pronounce level of expressed emotions were used as fea-
tures to detect personal highlights in the videos. The pronounce levels they used was ranging
from highly expressive emotions, surprise and happiness, to no expression or neutral. They have
also extracted two a�ective content-based features which were audio energy and visual change
rate from videos to create an a�ective curve in the same way as the a�ective highlighting method
proposed by Hanjalic [87].
Arapakis et al. [88] introduced a method to assess the topical relevance of videos in accordance
to a given query using facial expressions showing users' satisfaction or dissatisfaction. Based on
facial expressions recognition techniques, basic emotions were detected and compared with the
ground truth. They were able to predict with 89% accuracy whether a video was indeed relevant
to the query. In a more recent study, the feasibility of using a�ective responses derived from
both facial expressions and physiological signals as implicit indicators of topical relevance was
investigated. Although the results are above random level and support the feasibility of the

2.6. SUMMARY 19
approach, there is still room for improvement from the best obtained classi�cation accuracy,
66%, on relevant versus non-relevant classi�cation [89].
Yazdani et al. [86] proposed using a Brain Computer Interface (BCI) based on P300 evoked
potentials to emotionally tag videos with one of the six Ekman basic emotions [42]. Their system
was trained with 8 participants and then tested on 4 others. They achieved a high accuracy on
selecting tags. However, in their proposed system, a BCI only replaces the interface for explicit
expression of emotional tags, i.e. the method does not implicitly tag a multimedia item using
the participant's behavioral and psycho-physiological responses.
2.6 Summary
This Chapter serves as a background review of the related research. I �rst gave a brief
introduction to the de�nition of emotion and emotional experience scenarios in response to mul-
timedia. Then, studies on multimedia content analysis with the goal of estimating the emotion
which is more likely to be elicited to the viewers were given. The literature on emotion recogni-
tion using physiological signals was also brie�y reviewed. Finally, the existing work on implicit
tagging was provided.

20 CHAPTER 2. BACKGROUND

Chapter 3
A�ective Corpus Development
3.1 Video Corpora Development
A�ective video corpora are developed with three di�erent goals: �rst, emotion elicitation or
mood regulation in psychological experiments; second, emotional characterization of videos using
content for video indexing or highlighting and third, recognition of the intrinsic emotions in the
videos, e.g., detecting the emotions which were expressed by people in the videos. One should
avoid mixing these three di�erent research tracks and the goals behind them. For example, movie
excerpt which are more likely to elicit strong emotions are chosen in the �rst group for emotion
elicitation whereas only using the strongly emotional excerpts is not appropriate for emotional
characterization in the second group. Emotional characterization should be able to deal with
the full spectrum of emotions in videos, from neutral videos to mixed and strong emotions. In
this Section, the �rst two types of a�ective corpora will be addressed. The third type of a�ective
video corpora which deals with intrinsic emotions or a�ective expression will be explained in the
following Section, Section 3.2.
3.1.1 Existing emotional video corpora
Rottenberg et al. [9] created an emotional video dataset for psychological emotion elicitation
studies. The excerpts, which were about 1 to 10 minutes long, were either extracted from famous
commercial movies or from non-commercial videos which were used in emotional research, e.g., an
amputation surgery video. First, they formed a set of excerpts with di�erent targeted emotions;
namely, amusement, anger, disgust, fear, neutral, sadness and surprise. They evaluated the
excerpts based on �intensity� and �discreteness�. The �intensity� of an excerpt means whether
a video received high mean report on the target emotion in comparison to other videos. The
�discreteness� refers to what extent the target emotion was felt more intensely in comparison to
all non-targeted emotions. The �discreteness� was measured using the ratings a video received
on the target emotion in comparison to the other emotions. They ultimately formed a dataset
consisting of 13 videos, from under one minute to 8 minutes long, for emotion elicitation studies.
In a more recent study, Schaefer et al. [44] created a larger dataset from movie excerpts
to induce emotions. In their study, they went beyond discrete basic emotions and developed a
corpus including 15 mixed feelings, in addition to six discrete emotions; namely, anger, disgust,
21

22 CHAPTER 3. AFFECTIVE CORPUS DEVELOPMENT
sadness, fear, amusement, tenderness. 364 participants annotated their database using three
questionnaires. After watching each video, participants answered emotional arousal on a seven
points scale. Then using a modi�ed version of Di�erential Emotions Scale (DES) questionnaire,
they reported how much they felt each of the 16 listed emotions on a seven point scale. The
third questionnaire was PANAS with 10 positive and 10 negative emotions on �ve points scale.
64 collected excerpts with French audio tracks are available online with their averaged assessed
scores 1.
Almost every published work in the �eld of multimedia content analysis and emotions used
a di�erently developed dataset. A brief description of di�erent dataset used for emotional char-
acterization using content features is given in the following.
Wang and Cheong [50] created and annotated a dataset consisting of 36 full length Hollywood
movies which have 2040 scenes. Three annotators watched the movies and reported their emo-
tions by Ekman basic emotions [42] to every scene. Only 14% of movie scenes received double
labels, and the rest only received single emotional labels from their three annotators.
Hanjalic and Xu [7] used excerpts from �Saving private Ryan� and �Jurassic park 3� and
two soccer matches in their study without annotations. Irie et al. [51] only used 206 selected
emotional scenes out of 24 movies. 16 students annotated these scenes by eight Plutchik basic
emotions; namely, joy, acceptance, fear, surprise, sadness, disgust, anger, and anticipation [32].
The annotators �rst watched the videos and then reported how much they felt each of these
emotions on seven points scale. The emotional labels were assigned to the selected scenes only
if more than 75% of annotators agreed on them, otherwise the neutral label was assigned to the
movie scene. Xu et al. [52] used selected scenes from eight movies containing 6201 shots, which
are in total 720 minutes long. The videos were manually labeled by �ve emotions: fear, anger,
happiness, sadness and neutral spanning the arousal dimension in three levels and valence in two
levels.
3.1.2 Developed emotional video corpora
Four emotional video corpora has been developed by us using four di�erent settings. The
annotations of the �rst and the fourth dataset were gathered a laboratory setting. The second
and the fourth dataset have emotional reports from a web-based online platform, and the third
dataset includes emotional reports using an online crowdsourcing platform.
3.1.2.1 Movie scenes annotated in a laboratory environment
A dataset consisting of emotional movie scenes suitable for emotion elicitation and charac-
terization was developed. I chose 64 movie scenes from eight movies to be shown in two sessions,
Due to the limited time a participant can spend in each session.
To create this video dataset, I extracted video scenes from movies selected either according
to similar studies (e.g., [50, 9, 7]), or from recent famous movies. The movies included four
major genres: drama, horror, action, and comedy. Video clips used for this study are extracted
from the list given in Table 3.1. The extracted scenes, eight for each movie, had durations of
approximately one to two minutes each and contained an emotional event (judged by the author).
1. http://nemo.psp.ucl.ac.be/FilmStimuli

3.1. VIDEO CORPORA DEVELOPMENT 23
Table 3.1: The movie scenes were extracted from the listed movies
Drama movies Comedy movies
The pianist (6), Hotel Rwanda(2)
Mr. Bean's holiday (5), Loveactually (4)
Horror movies Action movies
The ring (Japanese version)(7), 28 days later (1)
Kill Bill Vol. I (3), Saving pri-vate Ryan (8)
The complete list of the scenes with editing instructions and descriptions is available in Appendix
6.3.
Figure 3.1: The distribution of di�erent movie scenes on arousal and valence plane. Averagearousal and valence are shown. Di�erent numbers represent di�erent movies (see Table 3.1).
The distribution of average arousal and valence scores are shown in Fig. 3.1. The num-
bers,which represent the movie scenes, are the codes assigned to movies in Table 3.1. The
variance of valence dimension increases with arousal. This is in accordance with the �ndings of
[90] in which arousal and valence scores in response to the IAPS and the International A�ective
Digitized Sound system (IADS) showed a parabolic or heart shape distribution.
Three participants out of ten were female. The participants were from 20 to 40 years old (M =
29.3, SD = 5.4). The di�erence between arousal and valence scores given by the participants
to all the videos was studied by means of a multi-way ANOVA was performed on arousal and
valence scores considering three factors, the video scenes, the participants and the order in which
the videos were shown to the participants during sessions. The e�ect of the order in which the
videos were presented to users on ratings was not signi�cant. However, there was a signi�cant
di�erence on average valence scores between di�erent participants (F (9) = 18.53, p < 1× 10⁻⁵)
and di�erent videos (F (63) = 12.17, p < 1 × 10⁻⁵). There was also a signi�cant di�erence
on average arousal scores between di�erent participants (F (9) = 19.44, p < 1 × 10⁻⁵) and

24 CHAPTER 3. AFFECTIVE CORPUS DEVELOPMENT
di�erent videos (F (63) = 3.23, p < 1× 10⁻⁵). These di�erences can be originated from di�erent
personal experiences and memories concerning di�erent movies as well as participants' mood and
background.
3.1.2.2 Web-based annotated movie scenes dataset 2
In order to �nd videos eliciting emotions from the whole spectrum of possible emotions, a
user study was conducted to annotate a set of manually preselected movie scenes. The dataset
has been extracted from 16 full length Hollywood movies which are listed in Table 3.2 (mostly
popular movies). We extracted and chose these video scenes from movies in the same way as the
video clips in the previous Section. 155 short clips, which are about one to two minutes long,
were manually selected from these movies to form the dataset.
A web-based annotation system has been launched to assess participants' felt emotion. In
this system, a user signs up giving his/her personal information including gender, age, and email
address. The system also asked optional information like, cultural background and origin which
helped the system to form a pro�le of the user. Fig. 3.3 shows a snapshot of the assessment
interface where a video clip is being shown. After watching each video clip, the participant ex-
pressed his/her felt emotion using arousal and valence, quantized in nine levels. The participants
2. Jeremy Davis contributed to the development of this dataset by implementing the web-based platform.
Figure 3.2: Total number of keywords reported by 10 participants to 64 video clips

3.1. VIDEO CORPORA DEVELOPMENT 25
Table 3.2: The video clips were extracted from the listed movies
Drama movies Comedy movies
The pianist, HotelRwanda, Apocalypsenow, American historyX, Hannibal
Man on the moon, Mr.Bean's holiday, Love ac-tually
Horror movies Action movies
Silent hill, 28 days later,The shining
Kill Bill Vol. I, Kill BillVol. II, Platoon, Thethin red line, Gangs ofNew York
Figure 3.3: A snapshot of the a�ective annotation platform.
also chose the emotional label manifesting his/her felt emotion. The emotion labels are afraid,
amused, anxious, disgusted, joyful, neutral, and sad. These labels have been chosen based on
the labels assessed in our previous experiments (see subsection 3.1.2.1). During the previous
experiments, the laboratory based experiment, we asked 10 participants to freely express their
emotions, elicited by movie scenes with words. These emotional keywords were the ones which
appeared more frequently [10] (see Fig. 3.2). Note that they roughly correspond to the six basic
�Ekman's emotions� [42].
Initially, 82 participants signed up to annotate the videos. From these 82 participants,
42 participants annotated at least 10 clips. Participants were from 20 to 50 years old (M =
26.9, SD = 6.1). Out of the 42 participants, 27 were male, and 15 were female with di�erent
cultural backgrounds living in four di�erent continents. The results of a multi-way ANOVA on
arousal scores as the dependent variable and participant, video clip, and time of the day as e�ects
showed that the average arousal scores have a signi�cant di�erence for di�erent participants
(F (41) = 3.23, p < 1 × 10⁻⁵), video clips (F (154) = 5.35, p < 1 × 10⁻⁵) and times of the day
(F (7) = 2.69, p < 0.01). A day has been divided into eight time interval, early morning (6:00 to
9:00), morning (9:00 to 11:30), noon (11:30 to 13:00), afternoon (13:00 to 16:30), evening (16:30
to 19:30), late evening (19:30 to 22:30), night (22:30 to 24:00) and after midnight (00:00 to 6:00).

26 CHAPTER 3. AFFECTIVE CORPUS DEVELOPMENT
The average arousal scores in di�erent time periods are shown in Fig. 3.6. The average arousal
scores given to all videos is increasing from early in the morning till noon. Then it decreases till
it bounces back for late evening and night. Female participants, on average, gave higher arousal
scores to the videos (see Fig. 3.4). A Wilcoxon test showed that the di�erence between female
and male participants' arousal scores was signi�cant (p = 3× 10⁻¹⁶).
Studying the variance of valence is more tricky since the dataset roughly has a balanced set of
pleasant and unpleasant videos. Looking at the average valence scores, no signi�cant di�erence
can be observed between the ratings given by di�erent gender groups or in di�erent time intervals.
We therefore decided to compute the absolute valence score and study the e�ect of the absolute
valence score after being centered. This means extremely pleasant or unpleasant scores will be
treated in the same way, and we de�ned absolute centered valence score as a measure of emotion
strength. Looking at this absolute score, female participants reported signi�cantly stronger
emotions (see Fig. 3.5). The result of a Wilcoxon test between the absolute valence scores of
female and male participant showed the signi�cance (p = 0.002). The results of a multi-way
ANOVA on absolute valence scores as the variable and participant, video clip, and time of the
day as e�ects showed that the average arousal scores have a signi�cant di�erence for di�erent
participants (F (41) = 4.76, p < 1×10⁻⁵), video clips (F (154) = 4.89, p < 1×10⁻⁵) and times of
the day (F (7) = 2.68, p < 0.01). The absolute valence, which is resulted by folding the valence
arousal plane, is correlated with arousal.
Figure 3.4: Average arousal scores, given by male and female participants.
3.1.2.3 Boredom detection dataset using crowdsourcing 3
Developing video processing algorithms capable of predicting viewer boredom requires suit-
able corpora for development and testing. A video dataset has been gathered in the context of
the MediaEval 4 2010 A�ect Task for boredom prediction of Internet videos. Standard limitations
3. This dataset was developed in Collaboration with Martha Larson from Delft University of Technology, theNetherlands.
4. http://www.multimediaeval.org

3.1. VIDEO CORPORA DEVELOPMENT 27
on viewer a�ective response annotation are overcome by making use of crowdsourcing. Using
MTurk 5, we rapidly gathered self-reported boredom scores from a large user group that is demo-
graphically diverse also represented our target population (Internet video viewers). Ultimately,
this dataset can be used by boredom-prediction algorithms to improve multimedia retrieval and
recommendation. Relatively little research has investigated topic-independent factors that con-
tribute to the relevance of multimedia content to the user information need.
For the purpose of the A�ect Task and related research, a simple de�nition of boredom was
adopted. Boredom was taken to be related to the viewer's sense of keeping focus of attention
and to be related to the apparent passage of time [91]. Boredom is a negative feeling associated
with viewer perceptions of the viewer-perceived quality (viewer appeal) of the video being low.
The dataset selected for the corpus is Bill's Travel Project, a travelogue series called �My
Name is Bill� created by the �lm maker Bill Bowles 6 (see Fig. 3.8). The series consists of 126
videos between two to �ve minutes in length. This data was chosen since it represents the sort
of multimedia content that has risen to prominence on the Internet. Bill's travelogue follows the
format of a daily episode related to his activities and as such is comparable to �video journals�
that are created by many video bloggers. The results of analysis on video series such as �Bill's
Travel Project� can extend to other video bloggers, and also perhaps to other sorts of semi-
professional user generated video content. Because the main goal of this study was to study the
e�ect of content related features, by using one series, the e�ect of high variance between content
generated by multiple �lm makers in di�erent genres was avoided.
The design of the utilized crowdsourcing strategy was inspired by existing crowdsourcing
literature, for example, [92], online articles and blog posts about crowdsourcing such as �Behind
the enemy lines� blog 7, and re�ecting on our past experience regarding collecting annotations
online. A two-step approach was taken for our data collection. The �rst step was the pilot
that consisted of a single micro-task or Human Intelligent Task (HIT) involving one video and
5. http://www.mturk.com6. http://www.mynameisbill.com7. http://behind-the-enemy-lines.blogspot.com
Figure 3.5: Average absolute valence scores given by male and female participants.

28 CHAPTER 3. AFFECTIVE CORPUS DEVELOPMENT
Figure 3.6: Average arousal scores in di�erent times of the day.
would be used for the purpose of recruiting and screening MTurk users (referred to as �workers�).
The second step was the main task and involved a series of 125 micro-tasks, one for each of the
remaining videos in the collection. Workers were paid 30 US dollar cents for each accomplished
HIT.
The pilot contained three components corresponding to qualities that were required from
our recruits. The �rst section contained questions about the personal background (age, gender,
cultural background). Using MTurk's ability to block workers from certain countries, the geo-
graphical location of participants was partly limited from south Asian countries to maintain the
Figure 3.7: Average absolute valence scores in di�erent times of the day.

3.1. VIDEO CORPORA DEVELOPMENT 29
Figure 3.8: A snapshot of Bill Bowel's travel projects website.
overall balance. The second section contained questions about viewing habits: workers were asked
whether they were regular viewers of Internet videos. The third section tested their seriousness
by asking them to watch the video, select a word that re�ected their mood at the moment and
also write a summary. The summary constituted a �veri�able� question, recommended by [92].
The summary o�ered several possibilities for veri�cation. Its length and whether it contained
well-formulated sentences gave us an indication of the level of care that the worker devoted to
the HIT. Also, the descriptive content indicated whether the worker had watched the entire
video, or merely the beginning. A �nal question inquired if they were interested in performing
further HITs of the same sort. In order to hide the main goal of the study from workers, the
video description edit box was placed prominently in the HIT.
The workers were chosen for the main task from the participants of the pilot by considering
the quality of their description and choosing a diverse group of respondents. The quali�cation
was only granted to the participants who answered all the questions completely. The workers
were invited to do the main study by sending them an invitation e-mail via their ID number on
the MTurk platform. The e-mail informed the users that our quali�cation was granted to them.
Use of a quali�cation served to limit those workers that carry out the HIT to the invited workers.
Each HIT in the main study consisted of three parts. In the �rst part, the workers were
asked to specify the time of the day, which gave us a rough estimate of how tired they were.
Also, the workers were asked to choose a mood word from a drop down list that best expressed
their reaction to an imaginary word (none word), such as those used in [93]. The mood words
were pleased, helpless, energetic, nervous, passive, relaxed, and aggressive. The answers to these
questions gave us an estimate of their underlying mood. In the second part, they were asked to
watch the video and give some simple responses to the following questions. They were asked to
choose the word that best represented the emotion they felt while watching a video from a second
list of emotion words in the drop down list. The emotion list contained Ekman six basic emotions
[42]; namely, sadness, joy, anger, fear, surprise, and disgust, in addition to boredom, anxiety,

30 CHAPTER 3. AFFECTIVE CORPUS DEVELOPMENT
neutral and amusement, which cover the entire a�ective space, as de�ned by the conventional
dimensions of valence and arousal [36]. The emotion and mood word lists contained di�erent
items, which were intended to disassociate them for the user. Next, they were asked to provide a
rating specifying how boring they found the video and how much they liked the video, both on a
nine point scale. Then, they were asked to estimate how long the video lasted. Here, we had to
rely on their full cooperation in order not to cheat and look at the video timeline. Finally, they
were asked to describe the contents of the video in one sentence. We emphasized the description
of the video rather than the mood word or the rating, in order to conceal the main purpose of
the HIT. Quality control of the responses was carried out by checking the description of the
video and also by ensuring that the time that they took to complete the HIT was reasonable. A
snapshot of the main HIT is shown in Fig. 3.9.
Figure 3.9: A snapshot of the main HIT on MTurk.
Our pilot HIT was initially published for 100 workers and �nished in the course of a single
weekend. We re-published the HIT for more workers when we realized we needed more people in
order to have an adequate number of task participants. Only workers with the HIT acceptance
rate of 95% or higher were admitted to participate in the pilot HIT. In total, 169 workers
completed our pilot HIT, 87.6% of which reported that they watch videos on the Internet. We
took this response as con�rmation that our tasks participants were close to the target audience
of our research. Out of 169 workers, 105 were male, and 62 were female and two did not report
their gender. Their age average was 30.48 with the standard deviation of 12.39. The workers
in the pilot HITs identi�ed themselves by di�erent cultural backgrounds from North American,
Caucasian to South and East Asian. Having such a group of participants with a high diversity in
their cultural background would have been di�cult without using the crowdsourcing platforms.
Of the 169 pilot participants, 162 were interested in carrying out similar HITs. Out of the
interested group, 79 workers were determined to be quali�ed and were assigned our task-speci�c
quali�cation within MTurk. This means only 46.7% of the workers who did the pilot HIT were
able to answer all the questions and had the pro�le we required for the main task.
In total, 32 workers have participated and also annotated more than 60 of the 125 videos

3.1. VIDEO CORPORA DEVELOPMENT 31
in the main task HIT series. This means only 18.9% of the participants in the pilot and 39.0%
of the quali�ed participants committed to doing the main task HIT series seriously. Of this
group of 32 serious participants, 18 are male and 11 are female with ages ranging from 18 to 81
(M = 34.9, SD = 14.7).
To evaluate the quality of the annotations, the time spent for each HIT was compared to the
video length. In 81.8% of the completed HITs, the working duration for each HIT was longer
than the video length. This means that in 18.2% of the HITs we have doubts if the workers fully
watched the videos. This shows the importance of having workers with the right quali�cations
and trustworthy pool of workers in annotation or evaluation hits. Rejecting those HITs reduced
the number of workers who carried out more than 60 videos in the main series of HIT to 25 from
which 17 are male and, 8 are female ages ranging from 19 to 59 (M = 33.9, SD = 11.8).
We asked three questions for each video to assess the level of boredom. First, how boring
the video was on a nine-point scale from the most to the least boring. Second, how much the
user liked the video on the nine-point scale and third how long the video was. Boredom was
shown to have on average a strong negative correlation, ρ = −0.86 with liking scores. The time
perception did not show a signi�cant correlation for all users, and it varied from 0.4 down to
-0.27. Although a positive correlation was expected from boredom scores, and the perception of
time seven participants' boredom scores have negative correlations with the time perception.
The correlation between the order of watching the videos for each participant and the boredom
ratings was also examined. No positive linear correlation was found between the order and
boredom score. This means that watching more videos did not increase the level of boredom
and in contrary for 2 of participant it decreased their boredom. Additionally, the correlation
between the video length and boredom scores was investigated. No positive correlation was
found between the boredom scores and videos' duration. We can conclude that the lengthy
videos are not necessarily perceived as more boring than the shorter videos.
To measure the inter-annotator agreement, the Spearman correlation between participants'
pairwise boredom scores was computed. The average signi�cant correlation coe�cient was very
low, ρ = 0.05. There were even cases where the correlation coe�cients were negative, which
shows complete disagreement between participants. For each worker, we then grouped videos
into two rough categories, above and below the mean boredom score of that worker. We computed
the average pair-wise Cohen's kappa for these categories and here found only slight agreement
(κ = 0.01 ± 0.04). We also compared agreement on the emotion words workers associated with
viewers. Here, again Cohen's kappa indicated only slight agreement (κ = 0.05 ± 0.06). The
strong correlations suggest that it is indeed bene�cial to investigate personalized approaches to
a�ective response prediction.
In order to obtain the best estimation of mood out of the mood words, �rst the responses of
each participant were clustered into the three hours time intervals. In each three hours interval,
the most frequent chosen mood word was selected as the dominant mood. After calculating the
dominant moods, we found that using the implicit mood assessment none of the participants had
the �relaxed� mood as her dominant mood.
The average boredom scores in di�erent moods are shown in Fig. 3.10. The boredom scores
were on average lower for passive mood and higher in energetic, nervous and pleased. Moods were
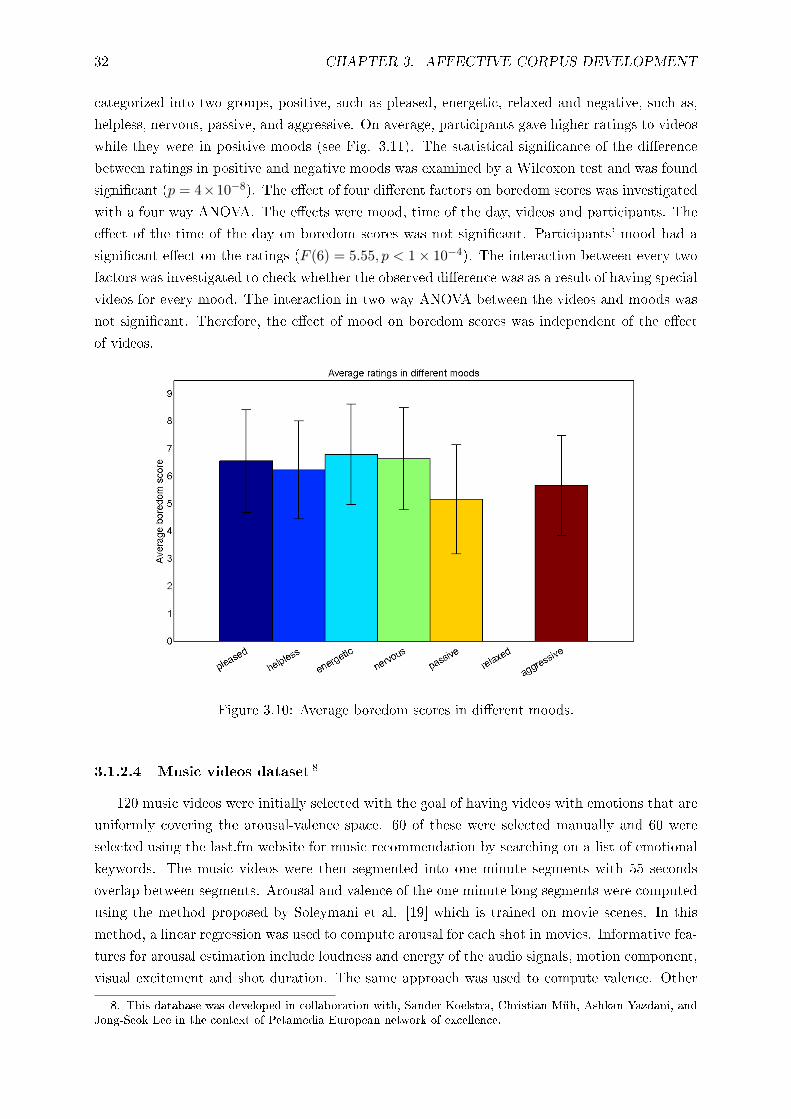
32 CHAPTER 3. AFFECTIVE CORPUS DEVELOPMENT
categorized into two groups, positive, such as pleased, energetic, relaxed and negative, such as,
helpless, nervous, passive, and aggressive. On average, participants gave higher ratings to videos
while they were in positive moods (see Fig. 3.11). The statistical signi�cance of the di�erence
between ratings in positive and negative moods was examined by a Wilcoxon test and was found
signi�cant (p = 4×10⁻⁸). The e�ect of four di�erent factors on boredom scores was investigated
with a four way ANOVA. The e�ects were mood, time of the day, videos and participants. The
e�ect of the time of the day on boredom scores was not signi�cant. Participants' mood had a
signi�cant e�ect on the ratings (F (6) = 5.55, p < 1× 10⁻⁴). The interaction between every two
factors was investigated to check whether the observed di�erence was as a result of having special
videos for every mood. The interaction in two way ANOVA between the videos and moods was
not signi�cant. Therefore, the e�ect of mood on boredom scores was independent of the e�ect
of videos.
Figure 3.10: Average boredom scores in di�erent moods.
3.1.2.4 Music videos dataset 8
120 music videos were initially selected with the goal of having videos with emotions that are
uniformly covering the arousal-valence space. 60 of these were selected manually and 60 were
selected using the last.fm website for music recommendation by searching on a list of emotional
keywords. The music videos were then segmented into one minute segments with 55 seconds
overlap between segments. Arousal and valence of the one minute long segments were computed
using the method proposed by Soleymani et al. [19] which is trained on movie scenes. In this
method, a linear regression was used to compute arousal for each shot in movies. Informative fea-
tures for arousal estimation include loudness and energy of the audio signals, motion component,
visual excitement and shot duration. The same approach was used to compute valence. Other
8. This database was developed in collaboration with, Sander Koelstra, Christian Müh, Ashkan Yazdani, andJong-Seok Lee in the context of Petamedia European network of excellence.

3.1. VIDEO CORPORA DEVELOPMENT 33
content features such as color variance and key lighting that have been shown to be correlated
with valence [50] were utilized for valence estimation. The emotional highlight score of the i-th
segment ei was computed using the following equation:
ei =√a2i + v2i (3.1)
The arousal, ai, and valence, vi, ranged between -10 and 10. Therefore, a smaller emotional
highlight score (ei) is closer to the neutral state. For each video, the one minute long segment
with the highest emotional highlight score was chosen to be extracted for the experiment. For
a few clips, the automatic a�ective highlight detection was manually overridden. This was done
only for songs with segments that are particularly characteristic of the song, well-known to the
public, and most likely to elicit emotional reactions. Given the 120 one-minute music video
segments, the �nal selection of 40 videos used in the experiment was made on the basis of
subjective ratings. Each video was rated by 14-16 volunteers using an online self-assessment
tool. Valence and arousal was rated on a 9-point discrete scale. To maximize the strength of
elicited emotions, we selected those videos that had the strongest volunteer ratings and at the
same time a small variation. For each video, we calculated a normalized arousal and valence
score by taking the mean rating divided by the standard deviation. Then, for each quadrant
in the normalized valence-arousal space, we selected the 10 videos that lay the closest to the
extreme corner of the quadrant.
After watching each video, participants reported their emotion by means of continuous rat-
ings ranging from 1 to 9. Although they were able to choose any point on a continuous scale
participants tended to click under displayed numbers (see the red bars on Fig. 3.12). The blue
bars on Fig. 3.12 show the ratings' histograms quantized in nine levels. From the blue bars, we
can see that the distribution of the ratings is skewed towards higher scores.
The average ratings of the videos are shown in Fig. 3.13. According to the average ratings,
the videos are well covering the whole arousal and valence plane on four quadrants; namely,
low arousal, high valence (LAHV), low arousal, low valence (LALV), high arousal, low valence
Figure 3.11: Average boredom scores in positive and negative moods.

34 CHAPTER 3. AFFECTIVE CORPUS DEVELOPMENT
1 2 3 4 5 6 7 8 9rating
050
100150200250300
no. o
f rat
ings
Arousal ratings
1 2 3 4 5 6 7 8 9rating
050
100150200250300
no. o
f rat
ings
Valence ratings
1 2 3 4 5 6 7 8 9rating
050
100150200250300
no. o
f rat
ings
Dominance ratings
1 2 3 4 5 6 7 8 9rating
050
100150200250300
no. o
f rat
ings
Liking ratings
Figure 3.12: Histogram of arousal, valence, dominance and liking ratings given to all videos bythe 32 participants. The blue bars are the histogram of the quantized ratings in nine levels. Thered bars are showing the ratings quantized in 80 levels (the quantization step is equal to 0.1).This �gure was originally created by Sander Koelstra and published in [2].
(HALV) and high arousal, high valence (HAHV). The orientation of the triangles represents
the emotional quadrant represents the video clips' quadrants based on the preliminary study on
a limited number of volunteers using an online platform. The results show that the expected
emotions are in strong agreement with reported emotions (i.e. online volunteers usually place
the video in the same quadrant as participants in the experiment). The average ratings for
dominance ratings are also visible in Fig. 3.13. The liking ratings, which are encoded in colors,
are visually shown to be correlated with valence.
In order to measure inter-annotation agreement between di�erent participants, we computed
the pair-wise Cohen's kappa between self reports after quantizing the ratings into nine levels.
A very weak agreement was found on emotional feedbacks with κ = 0.02 ± 0.06 for arousal,
κ = 0.08±0.08 for valence, and κ = 0.05±0.08 for liking ratings. A paired t-test was performed
on the κ values of valence ratings in comparison to liking and arousal. The t-test results showed
that, on average, the agreement on valence ratings is signi�cantly higher than agreement on
arousal (p = 2.0× 10⁻²⁰) and liking rating (p = 4.5× 10⁻⁷).
3.2 A�ective Expression Databases
Creating a�ective databases is the �rst step in any emotion recognition study. Recent ad-
vances of emotion recognition studies have created novel databases containing emotional expres-
sions in di�erent modalities. These databases mostly includes speech, visual, or audio-visual data
[94, 49, 95, 96, 97]. The visual modality of the emotional databases includes face- and/or body

3.2. AFFECTIVE EXPRESSION DATABASES 35
LAHV HAHV
LALV HALV
LAHV HAHV
LALV HALV
2 3 4 5 6 7 82
3
4
5
6
7
8
Arousal
Va
len
ce
Stimulus locations, dominance, and liking in Arousal−Valence space
LALV
LAHV
HALV
HAHV
Figure 3.13: The mean video ratings from experiment participants on the arousal-valence plane.The orientation of the triangle indicates the quadrant for which the video was selected by theonline ratings. Liking is encoded by color: dark red is low liking and bright yellow is high liking.Dominance is encoded by symbol size: small symbols stand for low dominance and big for highdominance. This �gure was originally created by Christian Mühl and published in [3].
gestures. The audio modality carries acted or genuine emotional speech in di�erent languages. In
the last decade, most of the databases consisted only of acted or deliberately expressed emotions.
This is nevertheless changing by more recent trend of sharing spontaneous and natural emotional
databases such as in [95, 97, 96, 3]. We here only review the publicly available spontaneous or
naturalistic databases and refer the reader for posed, audio and audio-visual databases to the
following reviews [98, 72, 94].
3.2.1 Existing databases
One of the notable databases with spontaneous reactions is the Belfast database (BE) created
by Cowie et al. [49]. The BE database includes spontaneous reactions in TV talk shows.
Although the database is very rich in body gestures and facial expressions, the variety in the
background and quality makes the data a challenging dataset of automated emotion recognition.
The usual databases are recorded with a constant background (blue or green curtain) with a �xed
camera and lighting. Despite the existence of a large number of studies on emotional expressions
and their databases, there are only few open and publicly available databases which include
bodily responses, in addition to audio-visual data. BE database was later included in a much
larger ensemble of databases of the HUMAINE projects [95]. HUMAINE database consists of
three naturalistic databases and six induced reaction databases. Databases vary in size from 8
to 125 participants and in modalities, from only audio-visual to peripheral physiological signals.
These databases were developed independently in di�erent sites and collected under HUMAINE

36 CHAPTER 3. AFFECTIVE CORPUS DEVELOPMENT
project.
Pantic et al. created a web-based emotional database of posed and spontaneous facial ex-
pressions with both static images, and videos [94, 99]. Their database, called MMI database,
consists of images and videos captured from both frontal and pro�le view. The MMI database
includes data from 61 adults acting di�erent basic emotions and 25 adults reacting to emotional
videos. This web-based database gives an option of searching in the corpus and is downloadable
on the Internet 9.
The �Vera am Mittag� (VAM) audio-visual database [96] is another example of developing a
database using spontaneous naturalistic reactions during a talk show. 12 hours of audio-visual
recordings from a German talk show with the same name was segmented and annotated. The
segments were annotated using valence, activation and dominance dimensions. The audio-visual
signals consist of the video and utterances recorded from 104 di�erent speakers. In addition to
the audio-visual database, an audio database and a video database were also developed. The
VAM-Audio includes utterances from 19 speakers. Only high quality and low noise segments
of the emotional audio content were selected for VAM-Audio. In VAM-Faces, the segments in
videos which included faces were separately segmented and annotated. The VAM-Faces includes
1867 images from 20 speakers.
Comparing to audio-visual databases, there are fewer publicly available a�ective, physiologi-
cal databases. Healey recorded one of the �rst a�ective, physiological datasets at Massachusetts
Institute of Technology (MIT), which has reactions of 17 drivers under di�erent levels of stress
[59, 65]. She recorded 24 subjects driving around Boston and annotated the dataset by the
drivers' stress level. Out of these 24 subjects' responses, 17 are available on the publicly avail-
able database. Her recordings include ECG, GSR - recorded from hands and feet -, EMG - from
right Trapezius - as well as the respiration pattern. The database of stress recognition in drivers
is publicly available on Internet from Physionet 10.
One of the few databases which includes both peripheral and central nervous system phys-
iological responses and facial expressions, is the enterface 2005 emotional database recorded
by Savran et al. [100]. This database includes two sets. The �rst one has EEG, peripheral
physiological signals, functional Near InfraRed Spectroscopy (fNIRS) from 5 male subjects. Sec-
ond dataset only has fNIRS and facial videos from 16 subjects from both genders. The �rst
database recorded spontaneous responses to the emotional images from the IAPS [56] and the
second database was recorded in a selected set of images retrieved from arbitrary sources on the
internet.
The characteristics of the reviewed databases are summarized in Table 3.3.
9. http://www.mmifacedb.com/10. http://www.physionet.org/pn3/drivedb/

3.2. AFFECTIVE EXPRESSION DATABASES 37
Table3.3:
Thesummaryof
thecharacteristicsof
thereviewed
emotional
databases.Thelast
twocolumnsarethedeveloped
databases.
Database
NoPart.
PosedorSpon.
Induced
or
Natural
Audio
Visual
Peripheral
physio.
EEG
Eyegaze
MIT
[59]
17Spon.
Natural
No
No
Yes
No
No
eNTERFACE05[100]
5,16
Spon.
Induced
No
Yes
Yes
Yes
No
MMI[94]
61,29
Posed
&spon.
Induced
No
Yes
No
No
No
HUMAIN
E[95]
Multiple
Spon.
Both
Yes
Yes
Yes
No
No
VAM
[96]
19Spon.
Natural
Yes
Yes
No
No
No
SEMAIN
E[97]
20Spon.
Induced
Yes
Yes
No
No
No
DEAP
[3]
32Spon.
Induced
No
Yes∗
Yes
Yes
No
MAHNOB-HCI[20]
30Spon.
Induced
Yes
Yes
Yes
Yes
Yes
∗ Only
for22
participants.
Spon.:spontaneous,Part.:participant

38 CHAPTER 3. AFFECTIVE CORPUS DEVELOPMENT
3.2.2 Developed emotional response corpora
I contributed to the recordings in the three experiments which were conducted to record
participants' emotional reactions to videos. Physiological responses and facial expressions (only
in the second and third experiments) were recorded while participants were watching video clips
extracted from movies or online repositories. The nature of the video clips varied from scenes
from famous commercially produced movies (the �rst experiment) to the music clips (the third
experiment). The goal of these recordings was to study the correlations and the intensity of
emotional reactions by viewers in response to videos. The experimental setup, apparatus and
recorded modalities for each experiment is provided in detail.
3.2.2.1 Movie experiment
The video scenes selected in the Section 3.1.2.1 were used to elicit emotions in the same
experiment. Peripheral signals and facial expression EMG signals were recorded for emotion
assessment. EMG signals from the right Zygomaticus major muscle (smile, laughter) and right
Frontalis muscle (attention, surprise) were used as indicators of facial expressions (see Fig. 3.14).
GSR, skin temperature, breathing pattern (using a respiration belt) and BVP (using a plethys-
mograph) were also recorded. All physiological data was acquired via a Biosemi Active II system
with active electrodes, from Biosemi Systems 11. The data were recorded with a sampling fre-
quency of 1024 Hz in a sound-isolated Faraday cage. Examples of recorded physiological signals
in a surprising and funny scene are given in Figures 3.16 and 3.15. The GSR and respiration
signals were respectively smoothed by a 512 and a 256 points averaging �lters to reduce the high
frequency noise. EMG signals were �ltered by a Butterworth band pass �lter with a lower cuto�
frequency of 4 Hz and a higher cuto� frequency of 40 Hz.
Figure 3.14: facial EMG signals were recorded from Zygomaticus major (left), and Frontalismuscles (right). These images are retrieved from Wikimedia.
To reduce the mental load of the participants, the protocol divided the show into 2 sessions
of 32 movie scenes each. Each of these sessions lasted approximately two hours, including setup.
Eight healthy participants (three female and �ve male, from 22 to 40 years old) participated in
the experiment. Thus, after �nishing the experiment three types of a�ective information about
each movie clip were available:
� multimedia content-based information extracted from audio and video signals;
11. http://www.biosemi.com

3.2. AFFECTIVE EXPRESSION DATABASES 39
Figure 3.15: Participant 1 physiological responses to a comedy scene: respiration pattern (top-left), GSR (top-right), blood pressure (bottom left), and Zygomaticus major EMG (bottom-right). The e�ect of the spectator's laugh can be seen on the respiration pattern and EMGsignal.
� physiological responses from spectators' bodily reactions (due to the autonomous nervous
system) and facial expressions;
� self-assessed arousal and valence, used as 'ground truth' for the true feelings of the spec-
tator.
Since video scenes were showed in random order, the average valence-arousal values over
participants in the self-assessed vectors (64 elements each) do not depend on the order in which
Figure 3.16: Participant 2 physiological responses to a surprising action scene: respiration pattern(top-left), GSR (top-right), blood pressure (bottom left), and Frontalis EMG (bottom-right).The surprise moment is indicated by an arrow.

40 CHAPTER 3. AFFECTIVE CORPUS DEVELOPMENT
scenes were presented.
The participants were �rst informed about the experiment, the meaning of arousal and va-
lence, the self-assessment procedure, and the video content. In emotional-a�ective experiments,
the bias of the emotional state (participants' mood) needs to be removed. To allow leveling
of feature values over time a baseline is recorded at each trial start by showing one short 30s.
neutral clip randomly selected from clips provided by the Stanford psychophysiology laboratory
[9].
Each trial started with the user pressing the �I am ready� key which started the neutral clip
playing. After watching the neutral clip, one of the movie scenes was played. After watching the
movie scene, the participant �lled in the self-assessment form which popped up automatically.
In total, the time interval between the starts of consecutive trials was approximately three
to four minutes. This interval included playing the neutral clip, playing the selected scene,
performing the self-assessment, and the participant-controlled rest time. In the self-assessment
step for evaluating arousal and valence, the SAM Manikin pictures with a slider to facilitate
self-assessment of valence and arousal were used (see Fig. 3.17). The sliders correspond to a
numerical range of [0, 1] while the numerical scale was not shown to the participants.
Figure 3.17: Arousal and valence self-assessment: SAM manikins and sliders.
3.2.2.2 Multimodal movie experiment (MAHNOB-HCI) 12
Multi-modal recording setup was arranged to record facial videos, audio and vocal expres-
sions, eye gaze, and physiological signals simultaneously (see Fig. 3.20). The experiment was
12. This database is developed in collaboration with Maja Pantic, Imperial College London and available onlineat http://mahnob-db.eu/hct-tagging

3.2. AFFECTIVE EXPRESSION DATABASES 41
controlled by the Tobii studio software (http://www.tobii.com). In order to synchronize di�er-
ent modalities, device generated time stamps were recorded along with audio and physiological
signals. These time stamps consist of time series with square shaped periodic signal (60Hz)
representing the moments when the cameras' shutters were open to capture each frame. The
synchronization method and hardware setup details are given in Lichtenauer et al. [101].
The Biosemi active II system 13 with active electrodes was used for physiological signals
acquisition. Physiological signals including ECG, EEG (32 channels), respiration amplitude,
and skin temperature were recorded while the videos were shown to the participants.
Electroencephalogram signals were recorded with a 1024Hz sampling rate and later down-
sampled to 256Hz to reduce the memory and processing costs. EEG signals were recorded
using active AgCl electrodes placed according to the international 10-20 system. The layout
of EEG electrodes on the cap is shown in Fig. 3.18. Motion and moscular artifacts were kept
at a minimum level by instructing the participants to minimize their movements while videos
were playing. The EEG signals recorded by Biosemi active electrodes are recorded referenced
to Common Mode Sense (CMS) electrode as a part of its feedback loop. In order to gain the
full Common-Mode Rejection Ratio (CMRR) at 50Hz, EEG signals should be re-referenced to
a common reference. EEG signals were thus re-referenced to the average reference to increase
signal to noise ratio.
Figure 3.18: The EEG cap layout for 32 EEG in addition to two reference electrodes. Retrievedfrom Biosemi website (http://www.biosemi.com).
30 participants with di�erent cultural and education backgrounds volunteered to participate
in response to a campus wide call for volunteers at Imperial College, London. Out of the 30
young healthy adult participants, 17 were female and 13 were male; ages varied between 19
to 40 years old (M = 26.06, SD = 4.39). Participants had di�erent educational background
from undergraduate students to post-docs with di�erent English pro�ciency from intermediate
to native speakers.
13. http://www.biosemi.com

42 CHAPTER 3. AFFECTIVE CORPUS DEVELOPMENT
Figure 3.19: Each trial started by a 15s neutral clip and continued by playing one emotionalclip. The self-assessment was done at the end of each trial. There were 20 trials in each sessionof experiment.
Figure 3.20: In the experimental setup, six video cameras were recording facial expressions. Themodi�ed keyboard is visible in front of the participant.
The participants were informed about the experiment and their rights with a verbal intro-
duction, by email and through a consent form. Participants were trained about the interface
before the experiment and during the setup time. The participants were also introduced to the
meaning of arousal, valence, dominance and predictability in the self-assessment procedure, and
to the nature of the video content.
To reduce the emotional bias, before each emotional video a short, neutral clip randomly
selected from the clips provided by the Stanford psychophysiology laboratory [9] was shown to
the participants.
After watching a short, neutral clip, one of the 20 video clips was played. Video clips were
played from the dataset in random order. After watching the video clip, the participant �lled
in the self-assessment form which appeared automatically. Five multiple choice questions were
asked during the self-report for each video. The �ve questions were 1. emotional label/tag; 2.
arousal level; 3. valence level; 4. dominance level; 5. predictability level. These questions were
chosen based on the emotional dimensions suggested by [37]. The emotional labels included
neutral, anxiety, amusement, in addition to the Ekman six basic emotions; namely, sadness, joy,

3.2. AFFECTIVE EXPRESSION DATABASES 43
disgust, anger, surprise, fear. To simplify the interface, a keyboard was provided with only nine
numerical keys and the participant could answer each question by pressing one of the nine keys.
Questions 2 to 5 were on a nine points scale. Dominance and predictability responses were not
used in this thesis. In total, the time interval between the start of a trial and the end of the
self-reporting phase was approximately two and half minutes. This interval included playing the
neutral clip, playing the emotional clip, performing the self-assessment. Running of the whole
protocol took on average 50 minutes, in addition to 30 minutes setup time (see Fig. 3.19).
Automatic analysis of facial expression is an interesting topic from both scienti�c and prac-
tical point of view. It attracted the interest of many researchers since such systems will have
numerous applications in behavioral science, medicine, security, and human-computer interac-
tion. To develop and evaluate such applications, large collections of training and test data are
needed [102, 103]. In this database, we were interested in studying the spontaneous responses of
participants while watching video clips. This can be used later for emotional implicit tagging of
multimedia content.
Fig. 3.22 shows the synchronized views from the six di�erent cameras. The two close up
cameras above the screen give a near-frontal view of the face in color 3.22(a) or monochrome
Figure 3.21: Two examples of natural expressions to a fearful (on the left) and disgusting (on theright) video. The snapshots of the stimuli videos with eye gaze overlaid and without eye gazeoverlaid, frontally captured video, raw physiological signals and raw eye gaze data are shown.On the �rst row, the red circles show the �xation points and their radius indicate the time spentin each �xation point. The red lines indicate the moments were each of the snapshots werecaptured. The eye gaze tracker signals have the value -1 when eye gaze data is not available(e.g., during blinking moments).

44 CHAPTER 3. AFFECTIVE CORPUS DEVELOPMENT
(a) frontal view in color (b) close up from the top of thescreen
(c) close up from the bottom left
(d) close up from the bottomright
(e) pro�le view (f) wide angle from above thescreen
Figure 3.22: Snapshots of videos captured from 6 cameras recording facial expressions and headpose.
3.22(b). The monochrome views have a better sharpness and less motion blur than the color
camera. The two views from the bottom of the screen, 3.22(c) and 3.22(d), give a close up
view that may be more useful during down-facing head poses, and make it possible to apply
passive stereo imaging. For this, the intrinsic and extrinsic parameters of all cameras have been
calibrated. Linear polarizing �lters were applied with the two bottom cameras, in order to reduce
the re�ection of the computer screen in eyes and glasses. The pro�le view 3.22(e) can be used to
extract backward-forward head/body movements, or to aid the extraction of facial expressions,
together with the other cameras. The wide-angle view 3.22(f) captures the upper body, arms
and hands, which can also carry valuable information about a person's a�ective state.
Although we did not explicitly asked the participant to express or talk during the experiments,
there exist some natural utterances and laughters in the recorded audio signals. Petridis and
Pantic showed that it is possible to tag videos by the level of hilarity using viewer's laughter [104].
Di�erent types of laughter can be an indicator of the level of hilarity of multimedia content.
3.2.2.3 Music videos experiment (DEAP) 14
A set of experiments were conducted to record participants' responses to music videos. The
goal of the experiments were to use the collected data to train classi�ers to be used for an
emotionally aware music recommendations system. The experiments were performed in the lab-
oratory environment with controlled illumination. EEG and peripheral physiological signals were
14. The database for emotion analysis using physiological signals (DEAP) was developed in collaboration with,Sander Koelstra, Christian Mühl, Ashkan Yazdani, and Jong-Seok Lee in the context of Petamedia Europeannetwork of excellence.

3.2. AFFECTIVE EXPRESSION DATABASES 45
recorded using a Biosemi Active II system 15. The �Presentation� software by Neuro-behavioral
systems 16 was used for running the protocol, playing the videos and recording the self-reports.
The computer which was running the �Presentation� software sent hardware triggers via parallel
port to the Biosemi system. These triggers were later used for synchronization and segmentation
of the signals.
Figure 3.23: Placement of peripheral physiological sensors. Four electrodes were used to recordEOG and 4 for EMG (Zygomaticus major and Trapezius muscles). In addition, GSR, BVP,temperature and respiration were measured. This �gure was originally created by ChristianMühl and published in [2].
Physiological signals were all recorded at a sampling rate of 512 Hz using active AgCl elec-
trodes. 32 EEG electrodes were placed on participants' scalp according to the international 10-20
system. The following peripheral nervous system signals were acquired: GSR, respiration am-
plitude, skin temperature, ECG, BVP by plethysmograph, EMG of Zygomaticus and Trapezius
muscles, and electrooculogram (EOG).
32 Healthy participants (16 male and 16 female), aged between 19 and 37 (M = 27.2, SD =
4.4), volunteered to participate in the experiment for a small compensation. Each participant
signed a consent form and �lled in a questionnaire before the experiment. They were then
given a set of instructions about the protocol and the meaning of the di�erent dimensions they
were going to report during emotional self-assessment. Next, the electrodes were attached to
the participant's body. This electrode setup took about 20 minutes. After this setup step, the
participant watched and performed a training trial to allow the participants to get familiar with
the experimental protocol. This training trial comprised of displaying a short video and asking
the participants to rate the video accordingly, once the video was �nished. The experiment
started with a 2 minute rest period in which the participants were asked to relax for baseline
recording. The experiment consisted of 40 trials each of which contained:
1. two second screen displaying the current trial number;
2. a �ve second baseline recording (a �xation cross was displayed);
3. playing of the one minute stimulus video;
4. emotional self-assessment using arousal, valence, like/dislike rating and dominance dimen-
sions.
15. http://www.biosemi.com16. http://www.neurobs.com
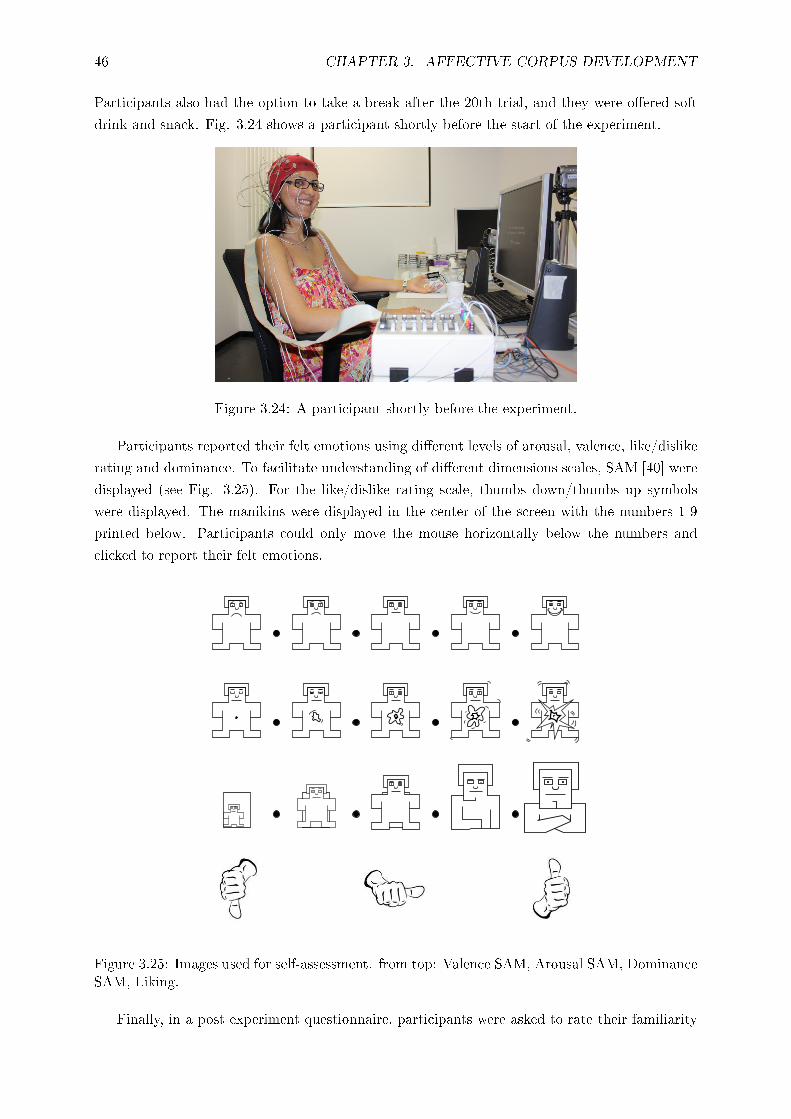
46 CHAPTER 3. AFFECTIVE CORPUS DEVELOPMENT
Participants also had the option to take a break after the 20th trial, and they were o�ered soft
drink and snack. Fig. 3.24 shows a participant shortly before the start of the experiment.
Figure 3.24: A participant shortly before the experiment.
Participants reported their felt emotions using di�erent levels of arousal, valence, like/dislike
rating and dominance. To facilitate understanding of di�erent dimensions scales, SAM [40] were
displayed (see Fig. 3.25). For the like/dislike rating scale, thumbs down/thumbs up symbols
were displayed. The manikins were displayed in the center of the screen with the numbers 1-9
printed below. Participants could only move the mouse horizontally below the numbers and
clicked to report their felt emotions.
Figure 3.25: Images used for self-assessment. from top: Valence SAM, Arousal SAM, DominanceSAM, Liking.
Finally, in a post experiment questionnaire, participants were asked to rate their familiarity

3.2. AFFECTIVE EXPRESSION DATABASES 47
with each of the songs on a scale of 1 (�Never heard it before the experiment�) to 5 (�Knew the
song very well�). The analysis of ratings are given in subsection 3.1.2.4.
3.2.3 Recommendations
Inducing emotions and recording a�ective reactions is a challenging task. Special attention
needs to be paid to several crucial factors, such as stimuli that are used, the laboratory environ-
ment, as well as the recruitment of participants. Our experience can be distilled into a list of
recommendations that will enable the development of additional corpora to proceed smoothly.
� The experiment environment in the laboratory should be kept isolated from the outside
environment. The participants should not be able to see the examiners or hear the noise
from the outside. The light and temperature should be controlled to avoid variation in
physiological reactions due to non controlled parameters.
� Choosing the right stimuli material is an important factor in any a�ective study. They
should be long enough to induce emotions and short enough to prevent boredom. Further-
more, to be sure variation in stimuli length does not introduce variance in the measure-
ments between emotional and non-emotional stimuli, we suggest the stimuli durations to
be equal. The mixture of contradicting emotions can make problems for self-assessments.
If the goal of the study is to �nd only one tag or recognize one speci�c emotional response,
we recommend using videos which do not induce multiple emotions.
� A correct participant recruitment can make a signi�cant di�erence in the results. A moti-
vated participant with the right skills for �lling the questionnaire on a computer is desir-
able, due to the nature of a�ective experiments. The rewards can make the participants
more motivated and responsible. However, cash compensations might attract participants
who are not motivated or lack desired communication skills. Therefore, rewarded recruit-
ment should be done with considerations of desired population, e.g., gender balance, age
distribution, etc.
� A complex apparatus is more likely to fail at any moment during experiments. Sometimes,
a recording failure may reveal itself after the recordings have been done. Thus, planning
of extra recording sessions is recommended.
� Contact lenses usually cause participants to blink more, which introduces a higher level
of artifacts on EEG signals. Therefore, the participants with visual correction should
avoid using contact lenses as much as possible. Thick glasses a�ect the eye gaze tracker
performance. In the experiments in which both these modalities are recorded, recruiting
participants with no visual correction is advised.
� Properly attending to participants takes an prominent part of one's attention, which can
easily lead to forgetting parts of complicated technical protocols. Therefore, operation
of the recording equipment during the experiments should be made as simple as possible
(preferably just by pressing a single button). Alternatively, the tasks of controlling and
monitoring correct data collection and attending to participants, can be divided between
multiple laboratory assistants with carefully de�ned procedures.

48 CHAPTER 3. AFFECTIVE CORPUS DEVELOPMENT
3.3 Summmary
In this Chapter, an overview of relevant existing a�ective databases was given. Developed
databases, in the course of our studies including stimuli videos and recorded responses, were
introduced. E�ect of di�erent parameters such as circadian cycles, gender and mood on emotional
ratings were investigated. In the following Chapter 4, the analysis carried out from bodily
responses which were recorded in the developed databases will be provided.

Chapter 4
Emotion Detection from Bodily
Responses
Emotional experience of viewers in response to videos can be identi�ed from their expressions
and physiological responses. In this chapter, I report on the studies, conducted during my
doctoral studies, to detect emotions in response to videos. First, I give a brief introduction to
the bodily signals. Then, the methods and results of emotion detection analyzed and validated
from the three recorded experiments will be discussed.
4.1 Bodily Signals and Sensors
4.1.1 Physiological signals and sensors
In this Section, I provide a brief description of the peripheral physiological sensors, which
were used, and signals, which were recorded during my studies. All the physiological signals
including EEG signals were recorded using a Biosemi Active two MK1 1 system. Biosemi Active
II systems can record physiological signals with a sampling rate up to 16kHz using 24 bits A/D
converters (see Fig. 4.1). The A/D box connects to a Personal Computer (PC) via Universal
Serial Bus (USB) connection and is insulated from the acquisition system using an optical �ber.
A participant wearing the EEG head cap with Biosemi sensors attached is shown in Fig. 4.2.
4.1.1.1 Electromyogram
EMG are the signals generated by skeletal muscles, which can be recorded by means of
electrodes attached to the skin covering those muscles. Normally, a pair of electrode are attached
along the muscle to record the di�erence of the electrical potential between two points. An EMG
signal is the electrical potential generated by muscle cells, which is caused by the electrical
or neurological activation of muscular cells. Facial and gesture emotional expressions activate
di�erent muscles. The muscular activity related to emotional responses can be measured by
electromyography. For example, smiling activates Zygomaticus major and Frontalis muscles
activity is a sign of attention or stress [105].
1. http://www.biosemi.com
49

50 CHAPTER 4. EMOTION DETECTION FROM BODILY RESPONSES
Figure 4.1: Biosemi active two box and battery.
Figure 4.2: A participant wearing an EEG head cap with 32 electrodes. EOG and EMG �atelectrodes are attached on the participant's face. The temperature, GSR sensors and plethys-mograph are attached to the participant's left hand.
4.1.1.2 Galvanic skin response
GSR is a physiological signal which measures electrical conductance or resistance between
two points on the skin. Skin's electrical conductance varies with its level of moisture which is
mostly caused by sweat glands. Sweat glands are controlled by the sympathetic nervous system
and their activity changes by emotional arousal [106]. Lang et al. discovered that the mean value
of GSR is related to the level of motional arousal [57]. GSR is also known by Skin conductance
(SC), electrodermal response (EDR), psychogalvanic re�ex (PGR), skin conductance response
(SCR). In my studies, GSR was measured by positioning two electrodes on the distal phalanges
of the middle and index �ngers and passing a negligible current through the body. An example
of GSR response is shown in Fig. 4.4.
4.1.1.3 Electrocardiogram and blood volume pulse
Blood Volume Pulse (BVP) is the volume of blood in peripheral vessels measured by pho-
toplethysmograph or plethysmograph. A photoplethysmograph consists of an infra-red emitter
and detector. The amount of re�ected infra-red light from the skin (usually �nger) corresponds

4.1. BODILY SIGNALS AND SENSORS 51
Figure 4.3: An EMG signal recorded from the zygomaticus major muscle.
Figure 4.4: A raw GSR signal. The noisy GSR signal is visible with its tonic and phasic responses.Tonic response corresponds to the overall level of GSR whereas phasic response is the abruptchanges (drops in the current �gure) due to the stimuli.
to the volume of blood in peripheral vessels. It is possible to derive heart rate by detecting peaks
on BVP signals (see Fig. 4.5). BVP is also a relative measure of blood pressure and its level can
be used as an indirect measure of blood pressure.
Because of the nature of muscular activity, heart muscle activity generates an electrical
potential di�erence on the skin. These changes can be measured by placing electrodes on one's
chest. Electrocardiography (ECG or EKG) is the electrical measurements by electrodes on the
participant's chest, which mostly originate from heart activities. ECG signals depending on
electrodes' placement can be interpreted and used to detect heart rate (HR) and heart rate
variability (HRV) (see Fig. 4.6). HR and HRV correlate with emotional changes. Pleasantness
of stimuli can increase peak heart rate response [57], and HRV decreases with fear, sadness, and
Figure 4.5: A BVP signal.

52 CHAPTER 4. EMOTION DETECTION FROM BODILY RESPONSES
Figure 4.6: An ECG signal recorded from electrodes placed on a participant's upper corner ofchest below the clavicle bone and the abdomen below the last rib. The strong contraction of theleft ventricle generated large peaks visible in the signal.
happiness [107]. In addition to the HR and HRV features, spectral features derived from HRV
were shown to be a useful feature in emotion assessment [108].
4.1.1.4 Respiration
Respiration depth or amplitude can be measured by measuring the expansion of the chest or
abdomen circumference. A �exible belt with a piezo-electric crystal sensor which measures the
belt's expansion can measure respiration patterns. Respiration rate and depth can be measured
from the resulting signal (see Fig. 4.7). Respiration pattern (RSP) has been also shown to
change in di�erent emotional responses. Slow respiration is linked to relaxation whereas irregular
rhythm, quick variations, and cessation of respiration correspond to more aroused emotions like
anger or fear [8, 107].
Figure 4.7: A RSP signal is shown. Counting the signal peaks provides us with a measure ofrespiration rate.
4.1.1.5 Skin temperature
Skin temperature also changes in di�erent emotional states [109]. Although temperature
changes are slower than other signals, they can be an indicator of emotional responses [110]. Skin
temperature is measured by placing a temperature sensor directly in contact with participants'
skin, e.g., their �nger.

4.1. BODILY SIGNALS AND SENSORS 53
4.1.1.6 EEG
Psychological studies regarding the relations between emotions and the brain are uncovering
the strong implication of cognitive processes in emotions [111, 112] (see Section 2.2.1). As a
result, the EEG signals carry valuable information about the participants' felt emotions.
EEG signals are recorded by measuring electrical potential by placing electrodes on one's
scalp. EEG signals result from the ensemble of the activation of millions of neurons in the brain.
A famous electrode placing system is the international 10-20 system, which was employed in all
the studies in this thesis. Electrodes are placed on approximately �xed positions according to
their distance between inion and nosion point of a participant. The spiking neurons' electrical
potentials (in the order of 10 µVolts) are very weak compared to muscular activities (order of
200 µVolts). Therefore, EEG signals can be easily contaminated by facial muscle activities, eye
movements and environment noise. The unwanted artifacts, 50Hz or 60Hz power interference,
EEG signals are usually recorded via active electrodes, which amplify the EEG signals on the
electrodes to increase their signal to noise ration (SNR). The second solution to avoid environment
noise is to record EEG signals in rooms which are isolated and shielded to electromagnetic �elds,
i.e, Faraday cages.
4.1.2 Eye gaze and pupil diameter
Eye gaze trackers use the re�ection of infrared or near infrared red light from retina detected
by cameras to track eye gaze. This allows measuring the pupil diameter with the eye gaze
simultaneously. The eye gaze tracker technology utilized in this research, Tobii X120 2 eye gaze
tracker, provides the position of the projected eye gaze on the screen, the pupil diameter, the
moments when the eyes were closed and the instantaneous distance of the participant's eyes to
the gaze tracker device (see Fig. 4.8). Pupil diameter has been shown to change in di�erent
emotional states [69, 70].
Figure 4.8: The Tobii X120 eye gaze tracker which was used in this study.
2. http://www.tobii.com

54 CHAPTER 4. EMOTION DETECTION FROM BODILY RESPONSES
4.2 Peripheral Physiological Signals for A�ective Tagging
4.2.1 Video a�ective characterization using peripheral physiological responses
4.2.1.1 Overview
A video dataset of 64 movie scenes from 8 movies was manually selected. Experiments
were conducted during which physiological signals were recorded from spectators. After each
scene, the spectator self-assessed his/her valence-arousal levels. To reduce the mental load of
the participants, the protocol divided the show into 2 sessions of 32 movie scenes each. Each
of these sessions lasted approximately two hours, including setup. The processed data include
the responses of eight healthy participants (three female and �ve male, from 22 to 40 years old)
participated in the experiment. The details on the experimental setup and protocol are given in
detail in Section 3.2.2.1.
After �nishing the experiment three types of a�ective information about each movie clip were
available:
� multimedia content-based information extracted from audio and video signals;
� physiological responses from spectators' bodily reactions (due to the autonomous nervous
system) and from facial expressions;
� self-assessed arousal and valence, used as �ground truth� for the true feelings of the spec-
tator.
Next, we aimed at demonstrating how those true feelings about the movie scenes can be ob-
tained by using the information that is either extracted from audio and video signals or contained
within the recorded physiological signals. To this end, features that were likely to be in�uenced
by a�ect were extracted from the audio and video content as well as from the physiological
signals. Thus, each feature from feature vectors of 64 samples highlights a single characteristic
(for instance, average sound energy) of the movie scenes. In a similar way, feature vectors were
extracted from the physiological signals. As one may expect, a single feature, e.g., average sound
energy, may not be equally relevant to the a�ective feelings of di�erent participants. In order
to personalize the set of all extracted features, an additional operation called relevant-feature
selection has been implemented. During the relevant-feature selection for arousal, the correlation
between the single-feature vectors and the self-assessed arousal vector is determined. Only the
features with high absolute correlation coe�cient (|ρ| > 0.25) were subsequently used for esti-
mating arousal. A similar procedure was performed for valence. It will be shown that accurate
estimates of the self-assessed arousal and valence can be obtained based on the relevant feature
vectors for physiological signals as well as from the relevant feature vectors for audio and video
information.
4.2.1.2 Feature extraction
Galvanic Skin Response (GSR), Blood Volume Pulse (BVP), ElectroMyoGram (EMG), skin
temperature, and respiration pattern were recorded in the experiments. The placement of elec-
trodes on the face (for EMG) and ground electrodes on the left hand enabled us to record an
ECG signal. Using the electrocardiogram, the pulse transit time was computed as a feature.
In addition to the heart rate and heart rate variability features, the multi-scale entropy (MSE)

4.2. PERIPHERAL PHYSIOLOGICAL SIGNALS FOR AFFECTIVE TAGGING 55
of the heart rate variability was computed from ECG signals. The MSE of the heart rate was
shown to be a useful feature in emotion assessment [8].
Regarding the EMG signals, the Frontalis muscles activity is a sign of attention or stress
in facial expressions. The activity of the Zygomaticus major was also monitored, since this
muscle is active when the user is laughing or smiling. Most of the power in the spectrum of an
EMG during muscle contraction is in the frequency range between 4 to 40 Hz. Thus, the muscle
activity features were obtained from the energy of EMG signals in this frequency range for the
di�erent muscles. The rate of eye blinking is another feature, which is correlated with anxiety
[113]. Eye-blinking a�ects the EMG signal that is recorded over the Frontalis muscle and results
in easily detectable peaks in that signal. All the extracted features are listed in Table 4.1.
Table 4.1: This table lists all 66 features extracted from physiological signals. Number of featuresextracted from each channel is given in brackets.
Peripheral Signal Extracted features
GSR (16) Average skin resistance, average of derivative, mean ofderivative for negative values only(average decrease rate dur-ing decay time), proportion of negative samples in the deriva-tive vs. all samples, Number of local minima in the GSRsignal, average rising time of the GSR signal, kurtosis, skew-ness, spectral power in the bands([0-0.1]Hz, [0.1-0.2]Hz, [0.3-0.4]Hz)
BVP (20) (64) Average BVP, heat rate, heart rate derivative, heart ratevariability, standard deviation of heart rate, ECG multi-scale entropy (4 levels), �nger pulse transit time, kurtosisand skewness of the heart rate, energy ratio between the fre-quency bands [0, 0.08]Hz and [0.15, 5]Hz, spectral power inthe bands ([0-0.1]Hz, [0.1-0.2]Hz, [0.3-0.4]Hz)
RSP (10) Band energy ratio (energy ratio between the lower (0.05-0.25Hz) and the higher (0.25-5Hz) bands), average respi-ration signal, mean of derivative (variation of the respira-tion signal), standard deviation, dynamic range or great-est breath, breathing rhythm (spectral centroid), breathingrate, spectral power in the bands ([0-0.1]Hz, [0.1-0.2]Hz, [0.3-0.4]Hz)
Skin
temperature (11)Range, average, minimum, maximum, standard deviation,kurtosis, skewness, spectral power in the bands([0-0.1]Hz,[0.1-0.2]Hz, [0.3-0.4]Hz)
EMG Zygomaticus
and Frontalis (9)Energy, average, standard deviation of energy, variance, Rateof eye blinking per second, extracted from the Frontalis EMG

56 CHAPTER 4. EMOTION DETECTION FROM BODILY RESPONSES
4.2.1.3 Feature selection and regression
The relevance of features for a�ect was determined using Spearman correlation between each
extracted feature and the users' self-assessment. I now demonstrate how user-felt arousal and
valence can be estimated, based on the physiological which were found to have a signi�cant
correlation with the self-assessed valence and arousal. For each participant, a training set of
63 scenes was formed by selecting 63 of the 64 movie scenes and the corresponding feature
values. The remaining scene served as a test set. In order to obtain an estimate, based on
the signi�cantly correlated features, of the user's valence and arousal, all signi�cantly correlated
features are weighted and summed as is indicated in Equation 4.1, where y(j) is the estimate of
valence-arousal grade, j is the indexing number of a speci�c movie scene 1, 2, .., 64, xi(j) is the
feature vector corresponding to the i-th signi�cantly correlated feature, Ns is the total number of
signi�cant features for this participant, and wi is the weight that corresponds to the i-th feature.
y(j) =
Ns∑i=1
wixi(j) + w0 (4.1)
In order to determine the optimum y, the weights in Equation 4.1 were computed by means
of a RVM from the Tipping RVM toolbox [114]. This procedure was applied on the user self
assessed valence-arousal, y(j), and on the feature-estimated valence-arousal, y(j), over all movie
scenes. This procedure is performed two times for optimizing the weights corresponding to:
� physiological features when estimating valence,
� physiological features when estimating arousal,
In a �rst step, weights are computed from the training set. In the second step, the obtained
weights were applied to the test set, and the mean absolute error between the resulting estimated
valence-arousal grades and self assessed valence-arousal was calculated. These two steps were
repeated 64 times. Each time the 63 movie scenes of the training set were selected from the
total of 64 scenes while the single, remaining scene served as the test set. The results from this
cross-validation will be presented in the following Section.
4.2.1.4 Experimental results
To video dataset presented in Section 3.1.2.1 was used as stimuli. Peripheral signals and
facial expression EMG signals were recorded for emotion assessment. EMG signals from the
right Zygomaticus major muscle (smile, laughter) and right Frontalis muscle (attention, surprise)
were used as indicators of facial expressions. GSR, skin temperature, breathing pattern (using a
respiration belt) and BVP (using a plethysmograph) were also recorded. All physiological data
was acquired via a Biosemi Active-two system with active electrodes, from Biosemi Systems
(http://www.biosemi.com). The data were recorded with a sampling frequency of 1024 Hz in a
sound-isolated Faraday cage. The GSR and respiration signals were respectively smoothed by
a 512 and a 256 points averaging �lters to reduce the high frequency noise. EMG signals were
�ltered by a Butterworth band pass �lter with a lower cuto� frequency of 4 Hz and a higher
cuto� frequency of 40 Hz.
The correlations between physiological features and self assessments were determined. Table
4.2 shows, for each participant, the features which had the highest absolute correlations with

4.2. PERIPHERAL PHYSIOLOGICAL SIGNALS FOR AFFECTIVE TAGGING 57
that participant's self-assessments of valence and arousal.
Table 4.2: Physiological features with the highest absolute correlation with self assessments forparticipants 1 to 8.
Part. Arousal ρ Valence ρ
1 GSR Skewness 0.43 EMG Zygomaticus (sum ofabsolute)
0.74
2 EMG Frontalis (sum of abso-lute)
0.66 EMG Frontalis (sum of abso-lute)
-0.73
3 GSR power spectral density0.1-0.2 Hz band
0.48 EMG Zygomaticus(sum of ab-solute)
0.53
4 EMG Zygomaticus average 0.32 EMG Zygomaticus(sum of ab-solute)
0.49
5 EMG Frontalis (sum of abso-lute)
0.38 EMG Frontalis (sum of abso-lute)
-0.49
6 Plethysmograph multi-scaleentropy (2nd)
0.42 EMG Zygomaticus (sum ofabsolute)
0.56
7 GSR standard deviation 0.55 EMG Zygomaticus (sum ofabsolute)
0.71
8 BVP (average) -0.33 EMG Zygomaticus (sum ofabsolute)
0.64
For physiological signals, the variation of correlated features over di�erent subjects illustrates
the di�erence between participants' responses. While GSR features are more informative regard-
ing the arousal level of participants 1, 3, and 7, EMG signals were more important to estimate
arousal in participants 2, 4, and 5.
The di�erence between the self assessments of male and female participants was investigated
by means of a one way ANOVA test of variance applied on these assessments. The di�erence
between the two genders group self assessments was found to be signi�cant for gender groups'
valence (F = 50.6, p < 0.005) and arousal (F = 11.9, p < 0.005), and for participants' valence
(F = 10.3, p < 0.005) and arousal (F = 20.3, p < 0.005). The female participants reported lower
valence and higher arousal on average. Comparison with assessed valence showed that this gender
di�erence comes from the fact that female participants reported higher level of unpleasantness
and excitement. Rottenberg et al.[9] showed that female participants reported more intense
emotions in response to emotional movie scenes. The female participants' emotional responses
in our study were also stronger compared with those from male participants. Fig. 4.9 shows the
results of this one way ANOVA test on the two gender groups' valence self assessments.
The accuracy of the estimated valence and arousal is evaluated by computing the mean
absolute error between the estimates and the self-assessments of either valence or arousal (Table
4.3). The mean absolute error (EMAE) was calculated from a leave-one-out cross validation on

58 CHAPTER 4. EMOTION DETECTION FROM BODILY RESPONSES
(a) arousal, p = 6× 10⁻⁴, F = 11.9 (b) valence, p = 3.8× 10⁻¹², F = 50.6
Figure 4.9: Results of the one way ANOVA test on the self assessments showing signi�cantdi�erences between the average assessments levels of the two gender groups.
Table 4.3: Mean absolute error (EMAE), and Euclidean distance (EED) between estimatedvalence-arousal grades and self assessments (participants 1 to 8).
Part. EMAE Arousal
estimated from
physiological features
EMAE Valence
estimated from
physiological features
EED Physiological
features
1 0.17 0.10 0.21
2 0.12 0.09 0.16
3 0.15 0.11 0.21
4 0.15 0.12 0.20
5 0.15 0.14 0.22
6 0.18 0.18 0.27
7 0.16 0.11 0.21
8 0.16 0.07 0.18
Average 0.15 0.11 0.21
Random
level
∼0.4 ∼0.4 ∼0.5
64 video clips for each participant.
EMAE =1
Ntest
Ntest=64∑j=1
|yj − yj | (4.2)
EMAE was computed from Equation 4.2 where Ntest is the number of test samples (64) and
yj is the estimated valence-arousal for the j-th sample in test set. EMAE values are shown
in Table 4.3; all EMAE values are considerably smaller than a random level determination of

4.3. MULTI-MODAL EMOTION RECOGNITION IN RESPONSE TO VIDEOS 59
EMAE (which is around 0.4, and is estimated by generating random measurements of valence
and arousal). While EMAE separately considers valence and arousal determinations, a more
global performance measure can be de�ned. Considering valence and arousal as coordinates in
the 2-D valence-arousal space, the overall accuracy of the estimated, joint valence-arousal grades
was evaluated by computing the Euclidean distance (EED) between the estimated points and
the self-assessments (ground truth). This Euclidean distance is a useful indicator of the system's
performance for a�ect representation and a�ects similarity measurement, when using valence
and arousal as indicators. With valence and arousal being expressed in normalized ranges [0-1],
EED is computed as follows:
EED =1
Ntest
Ntest=64∑j=1
√(yarousalj − yarousalj )2 + (yvalencej − yvalencej )2 (4.3)
EED values are shown in Table 4.3. It can in particular be observed that the average Euclidean
distance results are all below random level (which is around 0.5). The EMAE represents the
distance of the determined emotion from the self-assessed emotion in the dimensions of arousal
or valence. EMAE is thus useful to compare each dimension's results. The EMAE of arousal
and valence shows that valence determination was more precise than arousal determination. The
superior valence results might have been caused by the fact that the pleasantness of emotion is
easier to understand and report for participants.
4.3 Multi-Modal Emotion Recognition in Response to Videos
A user-independent emotion recognition method with the goal of recovering a�ective tags for
videos using EEG, pupillary response and gaze distance was developed and evaluated. We �rst
selected 20 video clips with extrinsic emotional content from movies and online resources. Then
EEG responses and eye gaze data were recorded from 24 participants while watching emotional
video clips. Ground truth was de�ned based on the median arousal and valence scores given to
clips in a preliminary study using an online questionnaire. Based on the participants' responses,
three classes for each dimension were de�ned. The arousal classes were calm, medium aroused
and activated, and the valence classes were unpleasant, neutral and pleasant. One of the three
a�ective labels of either valence or arousal was determined by classi�cation of bodily responses.
The details on the experimental setup and protocol are given in detail in Section 3.2.2.2.
4.3.1 Preliminary study
In the preliminary study, 21 commercially produced movies were �rst segmented into their
scenes. Scenes longer than two minutes were divided into shorter two minutes long excerpts.
From these excerpts, 155 emotional video clips containing excerpts extracted from movies were
manually selected. The 155 selected videos were shown to more than 50 participants; each video
clip received 10 annotations on average [18]. The preliminary study was conducted utilizing an
online a�ective annotation system in which the participants were able to use a web interface to
report their emotions in response to the videos played by a web-based video player (see Fig. 3.3).
In case of using videos from online repositories, the full length videos were used in the dataset.

60 CHAPTER 4. EMOTION DETECTION FROM BODILY RESPONSES
In the preliminary study, the participants were thus asked to self-assess their emotion by
reporting the felt arousal (ranging from calm to excited/activated) and valence (ranging from
unpleasant to pleasant) on nine points scale as well as emotional keywords. 14 video clips were
chosen based on the preliminary study from the clips which received the highest number of
emotional keyword tags in di�erent emotion categories, which are listed in the Table 4.3.1.1.
Videos were selected to cover di�erent emotional responses (see Fig. 4.10). Three other popular
video clips from online resources were added to this set (two for joy/happiness and one for
disgust). Three past weather forecast reports (retrieved from youtube.com) were also used as
neutral emotion clips. The videos from online resources were added to the dataset to enable us to
distribute some of the emotional video samples with the recorded multi-modal dataset described
below. Table 4.3.1.1 gives the emotional labels, titles, and sources of the emotional video clips.
The median arousal and valence was used to determine ground truth labels with the following
procedure. First, the values assessed by the online questionnaire were centered and then three
equal length intervals were de�ned on the assessment range (arousal, valence ∈ [1, 9]). The
labels assigned to all videos are given in Table 4.3.1.1. The distribution of online self emotions
for the selected videos is shown in Fig. 4.10.
Regarding the self-reports, we computed the average pair-wise Cohen's kappa for keyword
based annotations. A fair multi-rater agreement was found on emotional keywords (9 keywords)
with κ = 0.32. The correlation between arousal and valence ratings between participants was also
computed. The correlation between arousal and valence ratings given by di�erent participants
on nine points scales were mean(ρ) = 0.45, SD(ρ) = 0.25 and mean(ρ) = 0.73, SD(ρ) = 0.12
respectively. Therefore, there was a higher inter-rater agreement on valence comparing to arousal.
1 2 3 4 5 6 7 8 91
2
3
4
5
6
7
8
9
12
3
4 5
6
7
8
9
10
11
12
13
14
15
16
17
18
19
20
Val
ence
Arousal
Figure 4.10: Stimulus videos are shown in the valence-arousal plane. The center of the ellipsesrepresents the mean arousal, and valence and the horizontal and vertical radius represents thestandard deviation of the online assessments. The clip codes are printed at the center of eachellipse.

4.3. MULTI-MODAL EMOTION RECOGNITION IN RESPONSE TO VIDEOS 61
Table 4.4: The video clips are listed the with their sources. The emotion labels are: calm (Cal.),medium aroused (Med.), activated (Act.), unpleasant (Unp.), neutral valence (Neu.), Pleasant(Pls.).
Code Emotion Labels Video clips sources
1 Act., Unp. Hannibal
2 Act., Unp. The Pianist
3 Med., Pls. Mr. Bean's holiday
4 Act., Neu. Ear worm (blip.tv)
5 Med., Neu. Kill Bill VOL I
6 Med., Pls. Love actually
7 Med., Pls. Mr. Bean's holiday
8 Cal., Pls. The thin red line
9 Med., Neu. The shining
10 Med., Pls. Love actually
11 Act., Unp. The shining
12 Med., Unp. Gangs of New York
13 Act., Unp. Silent hill
14 Med., Unp. The thin red line
15 Cal., Neu. AccuWeather New York weather report (youtube.com)
16 Act., Unp. American history X
17 Cal., Neu. AccuWeather Detroit weather report (youtube.com)
18 Act., Pls. Funny cats (youtube.com)
19 Cal., Neu. AccuWeather Dallas weather report (youtube.com)
20 Act., Pls. Funny (blip.tv)
4.3.1.1 Ground truth de�nition
The median arousal and valence was used to determine ground truth labels with the following
procedure. First, the values assessed by the online questionnaire were centered and then three
equal length intervals were de�ned on the assessment range (arousal, valence ∈ [1, 9]). The
labels assigned to all videos are given in Table 4.3.1.1. The distribution of online self emotions
for the selected videos is shown in Fig. 4.10.
Ultimately, 20 videos were selected to be shown which were between 35s to 117s long (M =
81.4s, SD = 22.5s). Psychologists recommended videos from one to ten minutes long for elici-
tation of a single emotion [44, 9]. Here, the video clips were kept as short as possible to avoid
multiple emotions or habituation to the stimuli while keeping them long enough to observe the
e�ect.

62 CHAPTER 4. EMOTION DETECTION FROM BODILY RESPONSES
4.3.2 Multi-modal emotion recognition
4.3.2.1 EEG signals
Electroencephalogram signals were recorded with a 1024Hz sampling rate and later down-
sampled to 256Hz to reduce the memory and processing costs. EEG signals were recorded using
active AgCl electrodes placed according to the international 10-20 system. The layout of EEG
electrodes on the cap are shown in Fig. 4.11. The unwanted artifacts, trend and noise were
reduced prior to extracting the features from EEG data by pre-processing the signals. Drift
and noise reduction were done by applying a 4-45Hz band-pass �lter. Other artifacts such as
muscular activity was kept at a low level by instructing the participants to minimize their move-
ments while videos were playing. Biosemi active electrodes record EEG signals referenced to
common mode sense electrode (CMS) as a part of its feedback loop. In order to gain the full
common-mode rejection ratio (CMRR) at 50Hz, EEG signals should be re-referenced to another
reference. EEG signals were thus re-referenced to the average reference to maximize signal to
noise ratio.
The spectral power of EEG signals in di�erent bands was found to be correlated with emotions
[115, 116, 61]. Power spectral density (PSD) from di�erent bands were computed using fast
Fourier transform (FFT) and Welch algorithm [117]. In this method, the signal is split into
overlapping segments and the PSD is estimated by averaging the periodograms. The averaging
of periodograms results in smoother power spectrum. The PSD of each electrode's EEG signals
was estimated using 15s long windows with 50% overlapping.
The logarithms of the PSD from theta (4Hz < f < 8Hz), slow alpha (8Hz < f < 10Hz),
alpha (8Hz < f < 12Hz), beta (12Hz < f < 30Hz) and gamma (30Hz < f) bands were
extracted from all 32 electrodes as features. In addition to power spectral features, the di�erence
between the spectral power of all the 14 symmetrical pairs on the right and left hemisphere
was extracted to measure the possible asymmetry in the brain activities due to the valence of
an emotional stimuli [118, 115]. The asymmetry features were extracted from all mentioned
bands except slow alpha. The total number of EEG features of a trial for 32 electrodes is
14× 4 + 32× 5 = 216 features. A list of extracted EEG features is given in Table 4.5.
4.3.2.2 Eye gaze data
The X120 Tobii 3 eye gaze tracker provides the position of the projected eye gaze on the screen,
the pupil diameter, the moments when the eyes were closed and the instantaneous distance of
the participant's eyes to the gaze tracker device positioned below the screen. The eye gaze data
was sampled at 60Hz. The blinking moments are also extractable from eye gaze data. The eye
gaze itself is highly dependent on the content and therefore, it was not used directly for emotion
recognition. However, pupil diameter has been shown to change in di�erent emotional states
[69, 70].
A linear interpolation was used to replace the missing pupil diameter samples due to eye
blinking. Then, the average diameter of right and left eye pupil was used as the pupil diameter
time series. The major cause of pupil diameter variation comes from lighting; therefore, the
3. http://www.tobii.com

4.3. MULTI-MODAL EMOTION RECOGNITION IN RESPONSE TO VIDEOS 63
Figure 4.11: The EEG cap layout for 32 EEG in addition to two reference electrodes. Retrievedfrom Biosemi website (http://www.biosemi.com).
participants' responses to the same video (stimuli) in the controlled lighting environment follow
similar patterns. There are di�erent parametric models for pupillary light re�ex [119, 120].
However, these parametric models are not error free and calculating their numerous parameters
is rather di�cult without speci�c light re�ex experiment. It has been shown that the pupil
diameter variation as a result of light changes with age and between di�erent people [119]. Most
of the participants in our experiment were young, in their twenties; therefore, the aging e�ect was
assumed to be negligible. The di�erence between the magnitudes can be reduced by normalizing
the pupil diameter time series. Consequently we extracted the light re�ex using a non-parametric
estimation from the data. This common lighting re�ex pattern was estimated for each video using
PCA.
If Y is the M ×Np matrix containing the centered and normalized pupillary responses to the
same video from Np participants and M samples, then Y consists of three components:
Y = X + Z + E (4.4)
X is the lighting response which is the strongest e�ect on the signal. Z is the parasympa-
thetic emotional and attentional response and E is the noise originated from measurement. These
three components are originated from independent sources, and the decorrelating characteristic
of PCA is able to separate these three. First, Y was decomposed using PCA into Np compo-
nents. The �rst principal component is assumed to be a close estimation of the lighting re�ex.
The normalized principal component was then removed from normalized time series. Then the
remaining residual part includes Z + E.
Y = UDV T (4.5)
Ap = UD (4.6)

64 CHAPTER 4. EMOTION DETECTION FROM BODILY RESPONSES
Table 4.5: This table list all the features extracted from eye gaze data and EEG signals.
Eye gaze dataExtracted features
Pupil diameter standard deviation, spectral power in the followingbands: ]0, 0.2]Hz, ]0.2, 0.4]Hz, ]0.4, 0,6]Hz and ]0.6,1]Hz
Gaze distance approach time ratio, avoidance time ratio, approachrate
Eye blinking blink depth, blinking rate, length of the longest blink,time spent with eyes closed
EEG theta, slow alpha, alpha, beta, and gamma PSD foreach electrode. The spectral power asymmetry be-tween 14 pairs of electrodes in the four bands of alpha,beta, theta and gamma.
Sp = V T (4.7)
Y1 = Ap1Sp1 (4.8)
YR = Y − Y1 (4.9)
If we decompose Y using singular value decomposition (SVD) U is a matrix with eigen vectors
of Y Y T as its column. D is a diagonal matrix whose diagonal values are the eigen values of Y Y T .
Finally, the columns of V are the eigen vectors of Y TY (see Equation 4.5). From the principal
components of Y , Ap, we can reconstruct the �rst principal component or the light re�ex pattern
Y1 (see Equation 4.6). To remove the light re�ex component, Y1, from all the time series, it is
enough to subtract it from the original data (see Equation 4.8 and 4.9). YR is the residual part
which contains the emotional and attentional pattern, in addition to the noise.
After removing the linear trend, the power spectrum of the pupil diameter variation was
computed. Standard deviation and spectral features were extracted from the pupil diameter.
The Hippus e�ect is the small oscillations of eye pupil diameter between 0.05 to 0.3Hz and with
the amplitude of 1 mm [119, 121]. Hippus e�ect has been shown to be present when one is
relaxed or passive. In the presence of mental activity, the e�ect will disappear. The Hippus
e�ect is extracted by the �rst two power spectral features which are covering up to 0.4 Hz. The
rate of eye blinking is shown to be correlated with anxiety [113]. From the eye blinks, the eye
blinking rate, the average and maximum blink duration were extracted as features. In addition
to the eye blinking features, the amount of time the participants spent with his/her eyes closed
was also used as a feature to detect possible eye closing due to unpleasant emotions.
Although the participants were asked not to move during the experiment, there were small
head movements which manifested itself in the distance between participants' eyes and the eye

4.3. MULTI-MODAL EMOTION RECOGNITION IN RESPONSE TO VIDEOS 65
gaze tracker. The distance of the participant to the screen and its changes provide valuable
information about the participants' posture. The total change in the distance of the user to
the gaze tracker, gaze distance, was calculated to measure the possible approach and avoidance
phenomena. The amount of time the participant spent per trial getting close or far from the
screen was computed as well. These features were named approach and avoidance ratio to
represent the amount of time participant spent getting close or going far from the screen. The
frequency of the participants' movement towards the screen during each trial, approach rate, was
also extracted. Ultimately 12 features were extracted from the eye gaze data. A summary of all
extracted features is given in Table 4.5.
All the extracted features were numerical. To reduce the between participant di�erences, it
is necessary to normalize the features. Maximum-Minimum normalization was applied on each
feature of the features set separately for each participant's signals. In this normalization, the
minimum value for any given feature is subtracted from the same feature of a participant, and
the results were divided by the di�erence between the maximum and minimum values.
4.3.2.3 Emotion classi�cation
With the proposed inter-participant emotion recognition, the goal is to �nd the emotional
class with the highest agreement within a population. The most popular emotional class or tag
can satisfy a larger population of viewers in a video retrieval scenario. For each video from the
dataset, the ground truth was thus de�ned by computing the median of arousal and valence
scores given on a nine point scale. The median values were then categorized into three classes
with equal intervals. According to this de�nition, we can name these classes calm, medium
aroused, and activated for arousal and unpleasant, neutral, and pleasant for valence.
A SVM classi�er with RBF kernel was employed to classify the samples using features from
each of the two modalities. Prior to classi�cation, a feature selection was used to select dis-
criminative features as follows. First, a one way ANOVA test was done on only the training
set for each feature with the class as the independent variable. Then any feature for which
the ANOVA test was not signi�cant (p > 0.05) was rejected. This feature selection criterion
was hence re-calculated for each cross validation's iteration. A leave-one-participant-out cross
validation technique was used to validate the user-independent classi�cation performance. At
each step of cross validation, the samples of one participant were taken out as test set, and the
classi�er was trained on the samples from the rest of the participants. This cross validation was
employed to imitate the e�ect of introducing a new user to our emotion recognition system. This
process was repeated for all participants' data.
4.3.2.4 Modality fusion strategy
Classi�cation in di�erent modalities can be fused at both feature level and decision level. We
applied these two fusion strategies and reported their results. With the feature level fusion, the
feature vectors from di�erent modalities were concatenated to form a larger feature vector. The
feature selection and classi�cation methods were then applied to the new feature set. However
with the decision level fusion, classi�cation was performed on each modality separately and the
classi�cation outcomes were fused to generate the fusion results. In [62] feature level fusion of

66 CHAPTER 4. EMOTION DETECTION FROM BODILY RESPONSES
EEG and peripheral physiological signals did not improve the single modality results. On the
other hand, Chanel et al. [61] showed how a fusion strategy improved the emotion recognition
accuracy by fusing the results from EEG and peripheral features at decision level. Our results
(see Section 4.3.3) shows how in contrary to Feature Level Fusion (FLF), Decision Level Fusion
(DLF) signi�cantly outperforms the best single modality for arousal classi�cation and do not
underperform for valence classi�cation.
In addition to the superior classi�cation performance obtained by multi-modal strategy, in
the absence of one of the modalities due to temporary problems or artifacts, the system can
still continue working as a single modality emotion detection. The adaptability of the system
to remove and add new modalities can be achieved without re-training the classi�ers using the
DLF. The adaptability and scalability of the DLF strategy gives it another advantage over FLF.
Here, we used two modalities, which are EEG and eye gaze data. The results of the classi�-
cation over two modalities were fused to obtain the multi-modal fusion results. If the classi�ers
provide con�dence measures on their decisions, combining decisions of classi�ers can be done us-
ing a summation rule. The con�dence measure summation fusion was used due to its simplicity
and its proved performance for emotion recognition according to [61]. Other decision combination
methods including product of con�dence measures, decision template fusion, Dempster-Shafer,
Bayesian belief integration [122], weighted sum and weighted product [123] did not give superior
results.
The probabilistic outputs of classi�ers are used as a measure of con�dence. The sum rule is
thus de�ned as follows for a given trial:
ga =
∑q∈Q
Pq(ωa|xi)
K∑a=1
∑q∈Q
Pq(ωa|xi)=
∑q∈Q
1
|Q|Pq(ωa|xi) (4.10)
In Equation 4.10, ga is the summed con�dence interval for a�ect class ωa . Q is the ensemble
of the classi�ers chosen for fusion, |Q| the number of such classi�ers and Pq(ωa|xi) is the posteriorprobability of having class ωa the sample is xi according to classi�er q. The �nal choice is done
by selecting the class ωa with the highest ga. It can be observed that ga can also be viewed as a
con�dence measure on the class, ωa, given by the fusion of classi�ers.
There are two problems employing SVM classi�ers in this fusion scheme. First, they are
intrinsically only two-class classi�ers and secondly, their output is uncalibrated so that it is
not directly usable as a con�dence value in case one wants to combine outputs of di�erent
classi�ers or modalities. To tackle the �rst problem, the one versus all approach is used where
one classi�er is trained for each class (N classi�er to train), and the �nal choice is done by
majority voting. For the second problem, Platt [124] proposes to model the probability of being
in one of the two classes knowing the output value of the SVM by using a sigmoid �t, while Wu
et al. [125] proposes a solution to extend this idea to multiple classes. In this study, we used the
MATLAB libSVM implementation [126] of the Platt and Wu algorithms to obtain the posterior
probabilities, Pq(ωa|xi).

4.3. MULTI-MODAL EMOTION RECOGNITION IN RESPONSE TO VIDEOS 67
4.3.3 Experimental results
The experiments were performed in a laboratory environment with controlled temperature
and illumination; 24 participants viewed 20 video clips each. 467 samples were gathered over a
potential dataset of 24×20 = 480 samples; the 13 missing ones were unavailable due to technical
di�culties.
0 500 1000 1500 2000 2500 3000 35003
4
5Pupilary responses to one of the videos
0 500 1000 1500 2000 2500 3000 3500−4
−2
0
2The first principal component
0 500 1000 1500 2000 2500 3000 35003.4
3.6
3.8
4
4.2
Time
The highlighted signal after subtracting the principal component
Figure 4.12: From top to bottom: on the �rst plot, there is an example of pupil diametermeasures from three di�erent participants in response to one video. The second plot shows the�rst principal component extracted by PCA from the time series shown in the �rst plot (thelighting e�ect). The bottom plot shows the pupil diameter of the blue signal in the �rst plotafter reducing the lighting e�ect.
To �nd the best discriminative EEG features, the linear discrimination criterion was calcu-
lated. This parameter is the between class variance divided by within class variance for any given
feature (see Table 4.6). For arousal classi�cation, PSD in alpha bands of occipital electrodes was
found to be the most discriminant features. In contrary for valence beta and gamma bands of
temporal electrodes are more informative. The between class to within class variance ratios are
higher for the best arousal EEG features. The higher linear discrimination criterion for best
arousal features explains the superior classi�cation rate for arousal dimension (see Table 4.7).
In order to study the discrimination abilities of the eye gaze data features, a one way analysis
of variance test was performed on the features. The di�erence between the mean of features in
di�erent arousal or valence categories was found signi�cant (p < 0.05). The signi�cance of one
way ANOVA shows that there is at least a signi�cant di�erence between the means of the samples
from two classes out of three. The box plots of four features namely, eye blinking rate, approach
rate, maximum blink length, and standard deviation of pupillary responses are shown in Fig.

68 CHAPTER 4. EMOTION DETECTION FROM BODILY RESPONSES
Table 4.6: 10 best EEG features for arousal and valence classi�cation based on linear discrim-ination criterion. The between class variance to within class variance ratios, σ2bw/σ
2wn are also
given.
Arousal classi�cation Valence classi�cation
Band Electrode/s σ2bw/σ2wn Band Electrode/s σ2bw/σ
2wn
Slow α PO4 0.18 β T8 0.08α PO4 0.17 γ T8 0.08θ PO4 0.16 β T7 0.07Slow α PO3 0.15 γ T7 0.06θ Oz 0.14 γ P8 0.05Slow α O2 0.14 γ P7 0.05Slow α Oz 0.14 θ Fp1 0.04θ O2 0.13 β CP6 0.04θ FC6 0.13 β P8 0.04α PO3 0.13 β P7 0.04
4.13. In average eye blinking rate was higher in calmer videos (see Fig. 4.13(a)). The amount
of time participants spent getting closer to the screen is lower for the pleasant category. This
shows that they had a tendency to seat more upright while watching more pleasant videos (see
Fig. 4.13(b)). On the other hand, the maximum blink length or depth is higher for unpleasant
videos. This is due to the fact that participants kept their eyes closed for some moments while
watching unpleasant videos (see Fig. 4.13(c)). Pupillary response's standard deviation is also
shown to be higher during neutral scenes (see Fig. 4.13(d)).
The results have shown that it is possible to accurately recognize emotions with a user-
independent approach. The classi�cation accuracy measures are summarized in Table 4.7. The
traditional F-score which combines precision and recall by their harmonic mean was also com-
puted for each emotion category to give an overall evaluation of classi�cation performance (Equa-
tion 4.11). The F1 score varies between zero and one. The random level is 0.5 for binary
classi�cation and balanced classes; values closest to 1 indicate a better performance.
F1 =2× precision× recallprecision+ recall
(4.11)
Precision and recall can be only de�ned for one class; hence, the F1 scores were calculated
from the results of one versus all classi�cation schemes for each class separately. As a result,
the expectation of F1 scores of a uniform random classi�er are calculated and given in Table
4.7. The classi�cation rates of both three class classi�cations are de�ned as the percentage of
correctly classi�ed samples.
For the SVM classi�er, the size of the kernel, γ, was selected between [0.01, 10], based on
the average F1 score using a 20-fold cross validation on the training set. The C parameter that
regulates the tradeo� between error minimization and margin maximization is empirically set
to 1. Classi�cations were �rst performed with the goal of recovering the three classes with a
leave-one-participant-out cross validation scheme. Regarding the single modality classi�cation

4.3. MULTI-MODAL EMOTION RECOGNITION IN RESPONSE TO VIDEOS 69
1 2 3
0
0.2
0.4
0.6
0.8
1
1: Calm, 2: Medium arousal, 3: Activated
(a) Eye blinking rate, arousal
1 2 3
0
0.2
0.4
0.6
0.8
1
1: Unpleasant, 2: Neutral valence, 3: Pleasant
(b) Approach time ration, valence
1 2 3
0
0.2
0.4
0.6
0.8
1
1: Unpleasant, 2: Neutral valence, 3: Pleasant
(c) Blink depth, valence
1 2 3
0
0.2
0.4
0.6
0.8
1
1: Unpleasant, 2: Neutral valence, 3: Pleasant
(d) SD of pupil diameter, valence
Figure 4.13: Box plots of four di�erent gaze data features in three emotional conditions. (a)Eye blinking rate for arousal classi�cation (b) Approach time ratio for valence classi�cation (c)Blink depth, average blink time, for valence classi�cation (d) STD of pupil diameter for valenceclassi�cation. One way ANOVA results showed a signi�cant di�erence between features mean ofdi�erent classes (p < 0.05)
of arousal and valence in three classes, we obtained 62.1% and 50.5% accuracy from EEG signals
and 71.1% and 66.6% accuracy from eye gaze data (see Table 4.7). Although EEG classi�cation
results are inferior to the eye gaze data, they are comparable to the state of the art classi�cation
rates considering the inter-participant classi�cation scheme [127, 61].
The FLF did not improve the best single modality, gaze data, results. However, the modalityfusion strategy using the DLF improved the best SVM classi�cation rate for arousal up to 76.4%.The DLF did not underperform for valence classi�cation. To test the statistical signi�cance of theclassi�cation performance, a paired t-test was used to compare F1 scores of the DLF on one sideand the self reports and the best single modality, eye gaze data, on the other side. The F1 scoresfrom each participant's samples were compared and the improvement over arousal classi�cationcomparing to eye gaze data and self reports were found signi�cant (p < 0.01). However, thedi�erence between the eye gaze, DLF, and self reports F1 scores on valence classi�cation wasnot found statistically signi�cant. The con�dence levels of the classi�cation results from the twomodalities were added to �nd the class with the highest summed con�dence.
The confusion matrices for each modality show how they performed on each emotion category
(Tables 4.8.a - 4.8.j). In these confusion matrices, the row represents the classi�ed label, and each
column represents the ground truth. Only for activated category EEG classi�cation performed

70 CHAPTER 4. EMOTION DETECTION FROM BODILY RESPONSES
0
0.1
0.2
0.3
0.4
0.5
0.6
0.7
0.8
0.9
Calm Med. ar. Act. Unp. Neut. Pleas. Average
EEG
Gaze data
FLF
DLF
Self reports
Figure 4.14: This bar chart shows the F1 score for classi�cation results of each class from di�erentmodalities.
as well as gaze data modality. However, the fusion of both with the exceptions of neutral
valence class outperformed gaze data results (see tables 4.8.a - 4.8.d and 4.8.f - 4.8.i). The DLF
outperformed the feature level fusion for all categories except unpleasant (see tables 4.8.c, 4.8.d,
4.8.h, and 4.8.i).
The use of di�erent stimuli and emotion classes make it di�cult to directly compare the results
to a similar work. Here, we compare the obtained accuracy with the most similar existing works.
Kolodyazhniy et al. [64] used videos extracted from movies, in a user independent strategy,
to classify three classes; namely, neutral, sadness and fear. They obtained 77.5% recognition
rate from peripheral physiological responses while introducing random startles. Their results on
three classes are almost at the same level of our arousal classi�cation performance. In a gaming
protocol, Chanel et al. [127] achieved the accuracy of 63% in a user-independent approach on the
recognition of three classes; namely, boredom, engagement, anxiety. These three classes can be
translated to our three arousal levels. Our results are inferior to the ones by Lisetti and Nasoz
[60] on six classes. However, we did not only select the responses from the highly emotional
moments in each scene or excerpt and our scene segmentation was independent of the emotional
Table 4.7: The classi�cation rate and F1 scores of emotion recognition for di�erent modalities.
ModalityClassi�cation rate Average F1
dimension arousal valence arousal valence
EEG 62.1% 50.5% 0.60 0.50
Eye gaze 71.1% 66.6% 0.71 0.66
FLF 66.4% 58.4% 0.65 0.55
DLF 76.4% 68.5% 0.76 0.68
Self-reports with SAM
manikins
55.7% 69.4% 0.57 0.70
Random level 33.3% 33.3% 0.36 0.40

4.3. MULTI-MODAL EMOTION RECOGNITION IN RESPONSE TO VIDEOS 71
Table 4.8: Confusion matrices of di�erent classi�cation schemes (row: classi�ed label; column:ground truth). The numbers on the �rst row and the �rst column of tables a, b, c, d and erepresents: 1. calm, 2. medium aroused, 3. activated and for tables f, g, h, i, and j represents: 1.unpleasant 2. neutral valence 3. pleasant. The confusion matrices relate to classi�cation using(a, f) EEG signals (b, g) Eye gaze data (c, h) FLF (d, i) DLF (e, j) Self reports
Arousal
1 2 3
1 44 15 11
2 22 111 39
3 30 60 135
(a) EEG
1 2 3
1 60 7 9
2 10 136 40
3 26 43 136
(b) Eye gaze data
1 2 3
1 49 14 10
2 15 117 31
3 32 55 144
(c) FLF
1 2 3
1 62 6 8
2 8 146 28
3 26 34 149
(d) DLF
1 2 3
1 63 35 11
2 24 88 65
3 9 63 109
(e) Self reports
Valence
1 2 3
1 87 56 52
2 23 52 15
3 54 31 97
(f) EEG
1 2 3
1 108 46 26
2 36 77 12
3 20 16 126
(g) Eye gaze data
1 2 3
1 139 83 56
2 7 36 10
3 18 20 98
(h) FLF
1 2 3
1 115 48 22
2 27 75 12
3 22 16 130
(i) DLF
1 2 3
1 126 40 4
2 38 91 53
3 0 8 107
(j) Self reports
content.
The agreement between participants' self-reports and ground truth is shown in the confusion
matrix given in Table 4.8.e and Table 4.8.j. The columns of this table represent how the videos of
each class de�ned by ground truth were individually self-reported. For example, the �rst column
of this table represent how many of the samples which were actually in class one were classi�ed
into di�erent classes.
In order to measure the agreement between individual self-reports and the ground truth, the
self-reported arousal and valence scores on nine point scale were translated into three levels.
These levels were then treated like classi�ed labels, and the classi�cation rate was computed.
This was done by considering that the goal of each participant is to label a video clip by the
correct label, the most common tag. The classi�cation rate for individually self-reported labels
was 55.7% for arousal which is inferior to the worst classi�er's result. Although, looking at
the inter-annotation agreement, participants found that it easier to self-report pleasantness, the
classi�cation rate for valence is not signi�cantly lower than the self-report rate. Therefore, the
accuracy of obtained tags via classi�cation is comparable to the individually reported labels.
Fig. 4.14 summarizes the comparison of di�erent classi�cation strategies showing the F1
scores for each category and on average. Looking at the bars on the most right side of the

72 CHAPTER 4. EMOTION DETECTION FROM BODILY RESPONSES
chart, only EEG results are inferior to the explicit self-report agreements using self assessment
manikins.
4.4 Emotion Recognition in Response to Music Videos 4
4.4.1 Overview
In this study, we present an emotion detection method for music videos using central and
peripheral nervous system physiological signals. A set of 40 music clips eliciting a broad range of
emotions were �rst selected. After extracting the one minute long, emotional highlight of each
video, they were shown to 32 participants while their physiological responses were recorded. Par-
ticipants self-reported their felt emotions after watching each clip by means of arousal, valence,
dominance, and liking ratings. The physiological signals included electroencephalogram, galvanic
skin response, respiration pattern, skin temperature, electromyograms and blood volume pulse
using plethysmograph. Emotional features were extracted from the signals. The details on the
experimental setup and protocol are given in detail in Section 3.2.2.3.
4.4.2 Emotional Features
The following peripheral nervous system signals were recorded: GSR, respiration amplitude,
skin temperature, electrocardiogram, blood volume by plethysmograph, electromyograms of Zy-
gomaticus and Trapezius muscles, and EOG. GSR provides a measure of the resistance of the
skin by positioning two electrodes on the distal phalanges of the middle and index �ngers. A
plethysmograph measures blood volume in the participant's thumb. Skin temperature and res-
piration were recorded since they vary with di�erent emotional states.
Regarding the EMG signals, the Trapezius muscle (neck) activity was recorded to investigate
possible head movements during music listening. The activity of the Zygomaticus major was
also monitored, since this muscle is activated when the participant laughs or smiles.
Most of the power in the spectrum of an EMG during muscle contraction is in the frequency
range between 4 to 40 Hz. Thus, the muscle activity features were obtained from the energy of
EMG signals in this frequency range for the di�erent muscles. The rate of eye blinking is another
feature, which is correlated with anxiety. Eye-blinking a�ects the EOG signal and results in easily
detectable peaks in that signal.
All the physiological responses were recorded at a 512Hz sampling rate and later down-
sampled to 256Hz to reduce processing time. The trend of the ECG and GSR signals was
removed by subtracting the temporal, low frequency drift. The low frequency drift was computed
by smoothing the signals on each ECG and GSR channels with a 256 points moving average.
In total 106 features were extracted from peripheral physiological responses based on the
proposed features in the literature [61, 8, 107, 58, 10] (see also Table 4.9).
From the EEG signals, power spectral features were extracted. The logarithms of the spectral
power from theta (4-8 Hz), slow alpha (8-10 Hz), alpha (8-12 Hz), beta (12-30Hz) and gamma
(30+ Hz) bands were extracted from all 32 electrodes as features. In addition to power spectral
4. This study was done in collaboration with, Sander Koelstra, Christian Mühl, Ashkan Yazdani, and Jong-Seok Lee in the context of Petamedia European network of excellence.

4.4. EMOTION RECOGNITION IN RESPONSE TO MUSIC VIDEOS 5 73
features the di�erence between the spectral power of all the symmetrical pairs of electrodes on
the right and left hemisphere was extracted to measure the possible asymmetry in the brain
activities due to emotional stimuli. The total number of EEG features of a trial for 32 electrodes
is 216. Table 4.9 summarizes the list of features extracted from the physiological signals.
Table 4.9: Features extracted from EEG and physiological signals.
Signal Extracted features
GSR average skin resistance, average of derivative, average of derivative fornegative values only (average decrease rate during decay time), propor-tion of negative samples in the derivative vs. all samples, number oflocal minima in the GSR signal, average rising time of the GSR sig-nal, 10 spectral power in the [0-2.4]Hz bands, zero crossing rate of Skinconductance slow response (SCSR) [0-0.2]Hz, zero crossing rate of Skinconductance very slow response (SCVSR) [0-0.08]Hz, SCSR and SCVSRmean of peaks magnitude
BVP Average and standard deviation of HR, HRV, and inter beat intervals, en-ergy ratio between the frequency bands [0.04-0.15]Hz and [0.15-0.5]Hz,spectral power in the bands ([0.1-0.2]Hz, [0.2-0.3]Hz, [0.3-0.4]Hz), lowfrequency [0.01-0.08]Hz, medium frequency [0.08-0.15]Hz and high fre-quency [0.15-0.5]Hz components of HRV power spectrum.
Respiration
pattern
band energy ratio (di�erence between the logarithm of energy betweenthe lower (0.05-0.25Hz) and the higher (0.25-5Hz) bands), average res-piration signal, mean of derivative (variation of the respiration signal),standard deviation, range or greatest breath, breathing rhythm (spec-tral centroid), breathing rate, 10 spectral power in the bands from 0 to2.4Hz, average peak to peak time, median peak to peak time
Skin tempera-
ture
average, average of its derivative, spectral power in the bands ([0-0.1]Hz,[0.1-0.2]Hz)
EMG and EOG eye blinking rate, energy of the signal, mean and variance of the signal
EEG theta, slow alpha, alpha, beta, and gamma PSD for each electrode. Thespectral power asymmetry between 14 pairs of electrodes in the fourbands of alpha, beta, theta and gamma.
4.4.3 Emotion classi�cation
In this section, we present the methodology and results of single-trial classi�cation of the
responses to videos. Two di�erent modalities were used for classi�cation; namely EEG signals,
and peripheral physiological signals.
Three di�erent binary classi�cation problems were posed: the classi�cation of low/high
arousal, low/high valence and low/high liking. The participants' ratings during the experiment
were used to generate the ground truth. The ratings for each of these scales are thresholded into
two classes (low and high). On the nine points scale, the hard threshold was simply set to �ve

74 CHAPTER 4. EMOTION DETECTION FROM BODILY RESPONSES
which is in the middle of the minimum and maximum values. For some participants, this led to
unbalanced classes. To show to what extent the classes were unbalanced the average and stan-
dard deviation of percentage of samples belonging to the high class were calculated. The mean
and standard deviation (over participants) of the percentage of videos belonging to the high class
per rating scale are: arousal (M = 59%, STD = 15%), valence (M = 57%, STD = 9%) and
liking (M = 67%, STD = 12%).
In order to consider the unbalanced classes for evaluation, we reported the F1-score, which is
commonly employed in information retrieval and takes the class balance into account, contrary
to the mere classi�cation rate. A naïve Bayes classi�er was employed which is a simple and
generalizable classi�er and is able to deal with unbalanced classes in small training sets.
First, the features for the given modality were extracted from each trial or response to each
video. Then, for each participant, the F1 scores were used to evaluate the performance of emotion
classi�cation in a leave-one-out cross validation scheme. At each step of the cross validation, one
trial was used as the test-set and the of the trial served as the training set.
We used Fisher's linear discriminant J for feature selection:
J(f) =|µ1 − µ2|σ21 + σ22
(4.12)
where µi and σi are the mean and standard deviation for feature f from class i. We calculated
this criterion for each feature and then applied a threshold to select the maximally discriminating
ones. This threshold was empirically set to 0.3.
A Gaussian naïve Bayes classi�er was used to classify the test-set as low/high arousal, valence
or liking. The naïve Bayes classi�er G assumes independence of the features and is given by:
G(f1, .., fn) = argmaxc
p(C = c)
n∏i=1
p(Fi = fi|C = c) (4.13)
where F is the set of features and C the classes. p(Fi = fi|C = c) is estimated by assuming
Gaussian distributions of the features and modeling these from the training set.
4.4.4 Experimental results
Table 4.10 shows the average recognition rates and F1-scores (average F1-score for both
classes) over participants for each modality and each rating scale. We compared the results to the
expected values (analytically determined) of random classi�ers, voting according to the majority
class in the training data, and voting for each class with the probability of its occurrence in the
training data. For determining the expected values of majority voting and class ratio voting,
we used the class ratio of each participant's feedback during the experiment. These results are
slightly over-estimated since, in reality, the class ratio would have to be estimated from the
training set in each fold of the leave-one-out cross-validation.
Voting according to the class ratio gives an expected F1-score of 0.5 for each participant. An
independent one-sample t-test was performed to test the signi�cance of the di�erence between the
F1 scores of all participants and random level F1 score, 0.5. According to the results reported
in Table 4.10, 8 out of the 9 obtained F1-scores are signi�cantly superior to the class ratio

4.5. DISCUSSIONS 75
Table 4.10: Average accuracies (ACC) and F1-scores (F1, average of score for each class) overparticipants. Stars indicate whether the F1-score distribution over subjects is signi�cantly higherthan random level, 0.5, according to an independent one-sample t-test (∗∗ = p < .01, ∗ = p <.05). For comparison, expected results are given for classi�cation based on random voting, votingaccording to the majority class and voting with the ratio of the classes.
Arousal Valence Liking
Modality ACC F1 ACC F1 ACC F1
EEG 0.62 0.58** 0.58 0.56** 0.55 0.50Peripheral 0.57 0.53* 0.63 0.61** 0.59 0.54**
Random 0.50 0.48 0.50 0.49 0.50 0.48Majority class 0.64 0.39 0.59 0.37 0.67 0.40Class ratio 0.56 0.50 0.52 0.50 0.59 0.50
random baseline. The exception is the classi�cation of liking using EEG signals (p = 0.068).
However, looking at the F1 this voting scheme does not perform better. Overall, classi�cation
using EEG and peripheral are not signi�cantly di�erent (p = 0.41) (tested using a two-sided
repeated samples t-test over the concatenated results from each rating scale and participant).
The modalities can be seen to perform moderately complementarily, where EEG scores best
for arousal, peripheral for valence. The results on valence dimension classi�cation performed best,
followed by liking and then arousal. Although the classi�cation results are signi�cantly higher
than random level, they are still far from being ideal for an emotional tagging application. This
can be due to a noisy ground-truth which is based on self-reports and low intensity emotions.
Signal noise, individual physiological di�erences and low number of samples are the other possible
causes of the relatively poor classi�cation accuracy.
4.5 Discussions
In this section, we discuss limitations of the conducted studies and provide the open is-
sues. Physiological responses can vary due to non-emotional changes, such as circadian rhythms,
ambient temperature, body posture and other psychophysiological factors such as attention,
anticipation and mental e�ort [128]. Emotion recognition from bodily responses is therefore,
limited by controlling di�erent contextual factors. Moreover, like other similar works [64], the
generalization of the results are limited by the videos shown to the participants.
The inter-annotation agreement for arousal self-reports in general is lower comparing to
keyword based self-assessments. In a real-case scenario for an explicit tagging system, using
words will be easier for an ordinary user and leads to higher between participant agreement
in comparison to arousal and valence reported by Self Assessment Manikin (SAM). However,
emotional keywords are di�cult to translate and might not exist with the same meaning in
di�erent languages [35]. Emotion detection can overcome those di�culties with keeping the
accuracy at the same level. In these studies, participants were asked to explicitly choose an

76 CHAPTER 4. EMOTION DETECTION FROM BODILY RESPONSES
emotional indicator to form the ground truth. In a real application, with the existence of a reliable
user-independent emotion recognition method, the self-reporting phase can be eliminated.
In the �rst study (see Section 4.2.1), the results of a participant dependent emotion detection
using regression (RVM) using peripheral physiological signals showed the feasibility of using these
signals for video a�ect detection. These results were shown further useful by the results obtained
by Kierkels et al. [129, 13] for implicit tagging using the regression outputs.
In the second study (see Section 4.3), the �rst study was expanded to include more par-
ticipants and a participant independent approach was taken. Arousal labels were on average
detected with higher accuracy using EEG signals comparing to valence labels. This might be
due to higher visual and auditory variance of the arousal variant videos comparing to valence
variant ones. Exciting scenes usually contain fast movements and loud noises which manifest
themselves both in EEG signals and pupillary responses, whereas the di�erence between pleasant
and unpleasant responses can be hidden in the semantics. The direct bodily responses to di�er-
ent stimuli can increase the variance in responses and improve the emotion recognition results.
For example, faster changing video induces a di�erent response in occipital cortex comparing to
a more static video.
The DLF superior classi�cation rate for arousal and its similar performance for valence clas-
si�cation shows that the proposed emotion classi�cation can replace the self-reporting of single
participants for detecting popular, emotional tags for this dataset. These popular, emotional
tags are de�ned by the emotions felt by the majority of users watching the same video. After
detecting emotional classes, they can be stored along other metadata attached to each video.
Emotional labels can be converted to scores for arousal and valence for each video. The emo-
tional scores can be then used, like in the image recommendation applications [12], to improve
a video recommender's performance. In future works, the recognized emotional labels should be
added as features to a video recommendation system to study the e�ect of introducing emotional
labels on those systems. This e�ect can be determined by assessing users' satisfaction from a
recommendation or retrieval system with and without emotional information. The emotion de-
tection can be also used indirectly as a tool to detect topical relevance in information retrieval
systems [89].
In the second experiment, the determination of ground truth is based on the participants'
feedback in the online preliminary experiment. In order to measure the agreement between
the popular responses of the two separate populations of the preliminary assessments and the
experiments, we computed the median valence and arousal reported during the experiment and
compared the labels based on the recorded participants' popular response. Only three arousal
labels out of 40 labels were changed from activated to medium arousal or vice-versa. No valence
label has changed when comparing two populations. This is due to valence dimension's higher
inter-annotator agreement.
These studies still has open issues that need to be considered in the future. In a real case
scenario, any new user will need to have few minutes of signals recorded to provide reliable values
for feature normalization due to the utilized normalization. The estimation of pupillary response
to illumination is an open issue which needs more investigation. Although we assumed that the
lighting pupillary responses are similar between participants, there will be a large di�erence in

4.6. SUMMARY 77
case of introducing users from a di�erent age group. Therefore, the parameters of a reliable
model for pupillary re�ex to lighting, such as [119], should be determined before introducing
a new user to the system. Alternatively, the real time lighting e�ect similar to [71] can be
employed to remove the lighting e�ect. A larger video set and a larger number of participant
can be considered to increase the generalization of the developed emotion classi�er in response
to videos.
In the last experiment on music videos (see Section 4.4), the results were poor comparing to
the second experiment. The inferior results can be caused by three factors. First, the emotions
elicited by music videos were weaker comparing to movie scenes. Second, the classi�cation
was participant dependent, and the number of samples were smaller. Finally, eye gaze, which
contributed the most in the superior results for the second experiment, was not recorded.
In these studies, the length of the experimental session limited number of videos we could
show to each participant. The number of participants in these studies were large and diverse
enough comparing to similar studies [8, 61]. However, the population only consisted of young
students, which limits the trained algorithm to this particular group. These limitations might
worsen the results in case of introducing a new genre of video which was not present in the
current video set. To generalize and train such a system, the recruited participants should be as
close as possible to the target audience of the video retrieval or recommendation systems.
Emotions can co-occur and/or last for very short moments. This puts using a single emotional
label for a video clip under question. In order to address this issue, self-reporting should include
the possibility to indicate di�erent emotions and their degree of strength. This is possible by using
questionnaires such as positive and negative a�ect schedule (PANAS) [130] or Geneva emotion
wheel [15]. However, these emotional self-reporting methods are more complex and make the
experiment longer. In future work, multiple or co-occurring emotions should be assessed using a
more sophisticated self reporting tool.
4.6 Summary
In this chapter, the methodology, evaluation criteria and results of emotion detection for
three di�erent experiments were presented. First, a personalized regression based emotion de-
tection was proposed, implemented and evaluated on eight participants. The second study was
a participant independent multi-modal emotion recognition in response to videos. The third
study was conducted to detect emotions in response to music videos in a participant dependent
approach. In the next Chapter, the methods and results on the estimation of the emotion from
the content itself will be given.

78 CHAPTER 4. EMOTION DETECTION FROM BODILY RESPONSES

Chapter 5
Content Analysis for A�ect Estimation
5.1 Overview
In this chapter, the developed methodology and the results concerning the evaluations of the
methods estimating emotions from video content are presented. Although, emotions are personal
and vary depending on the contextual factors, there exists a more common emotion which is
induced by a video excerpt or a movie scene. The common emotion eliciting characteristic
is an crucial factor for the popularity of commercial movies. Di�erent genres of movies elicit
certain emotions in the majority of audience, e.g., comedy, drama, horror. The present study
is focused on movies because they represent one of the most common and popular types of
multimedia content. An a�ective representation of scenes will be useful for tagging, indexing
and highlighting of important parts in a movie.
5.1.1 Audio-Visual Features
Audio and video were �rst demultiplexed. Music videos were encoded into the Moving Picture
Experts Group (MPEG)-1 format to extract motion vectors and I-frames for further feature
extraction. The video stream of the music clips has been segmented at the shot level using the
method proposed in [131].
Movie scenes have been segmented at the shot level using the OMT shot segmentation soft-
ware [132]. Video clips were encoded into MPEG-1 format to extract motion vectors and I frames
for further feature extraction. We used the OVAL library (Object-based Video Access Library)
to capture video frames and extract motion vectors.
Sound has an signi�cant impact on user's a�ect. For example, according to the �ndings of
Picard [133], loudness of speech (energy) is related to evoked arousal, while rhythm and average
pitch are related to valence. The audio channels of the movie scenes were extracted and encoded
into monophonic information (MPEG layer 3 format) at a sampling rate of 48 kHz, and their
amplitude range was normalized in [-1, 1]. All of the resulting audio signals were normalized to
the same amplitude range before further processing. A total of 53 low-level audio features were
determined for each of the audio signals. These features, listed in Table 5.1, are commonly used
in audio and speech processing and audio classi�cation [134, 135].
Wang et al [50] demonstrated the relationship between audio type's proportions and a�ect,
79

80 CHAPTER 5. CONTENT ANALYSIS FOR AFFECT ESTIMATION
where these proportions refer to the respective duration of music, speech, environment, and
silence in the audio signal of a video clip. To determine the three principal audio types (music,
speech, and environment), silence was �rst identi�ed by comparing the audio signal energy of each
sound sample with a pre-de�ned threshold empirically set at 5 × 10⁻⁷. After removing silence,
the remaining audio signals were classi�ed into three classes using a SVM. We implemented a
three class audio type classi�er using support vector machines (SVM with polynomial kernel)
operating on audio low-level features in a time window of one second. Despite some classes
overlapping (e.g., presence of a musical background during a dialogue), the classi�er was usually
able to recognize the dominant audio type. The SVM was trained utilizing more than 3 hours of
audio, extracted from movies and labeled manually. The classi�cation results were used to form
4 bins (3 audio types and silence) normalized histogram; these histogram values were used as
a�ective features for the a�ective representation. Mel Frequency Cepstral Coe�cients (MFCC),
Formants and the pitch of audio signals were extracted using the PRAAT software package [136].
From a movie director's point of view, lighting key [50, 137] and color variance [137] are
important parameters to evoke emotions. We therefore, extracted lighting key from frames in
the Hue, Saturation, Value (HSV) space by multiplying the average value (V in HSV) by the
standard deviation of the values. Color variance was obtained in the CIE LUV color space by
computing the determinant of the covariance matrix of L, U, and V.
The average shot change rate and shot length variance were extracted to characterize video
rhythm. Hanjalic et al. [7] showed the relationship between video rhythm and a�ect. Fast
object movements in successive frames are also an e�ective factor to evoke excitement. To
measure this factor, the motion component was de�ned as the amount of motion in consecutive
frames computed by accumulating magnitudes of motion vectors for all B and P frames.
Colors and their proportions have an e�ect to elicit emotions. In order to use colors in the
list of video features, 20 bin color histograms of hue and lightness values in the HSV space were
computed for each I frame and subsequently averaged over all frames. The resulting averages in
the 20 bins were used as video content-based features. The median of L value in Hue, Satura-
tion, Lightness (HSL) space was computed to obtain the median lightness of a frame. Shadow
proportion or the proportion of the dark area in a video frame is another feature which relates
to a�ect [50]. Shadow proportion is determined by comparing the lightness values in HSL color
space with an empirical threshold. Pixels with lightness level below this threshold (0.18 [50]) are
assumed to be dark and in the shadow in the frame.
Visual excitement is a measure of the average pixel's color change between two consecutive
frames [50]. It is de�ned as the average change between the CIE Luv histograms of the 20× 20
blocks of two consecutive frames. In our case, this visual excitement feature was implemented
from the de�nition given in [50] for each key frame. Two visual cues were also implemented
to characterize these key frames. The �rst one, called visual detail, is used as an indicator of
the distance from the camera to the scene and di�erentiates between close-ups and long-shots.
The visual detail was computed by the average gray level co-occurrence matrix (GLCM) [50].
The other visual cue is the grayness which was computed from the proportion of the pixels with
saturation below 20%, which is the threshold determined for colors that are perceived as gray
[50].

5.1. OVERVIEW 81
Table 5.1: Low-level features extracted from audio signals.
Feature category Extracted features
MFCC MFCC coe�cients (13 features) [135], Derivative of MFCC (13features), Autocorrelation of MFCC (13 features)
Energy Average energy of audio signal [135]Formants Formants up to 5500Hz (female voice) (�ve features)Time frequency Spectrum �ux, Spectral centroid, Delta spectrum magnitude,
Band energy ratio, [135, 134]Pitch First pitch frequencyZero crossing rate Average, Standard deviation [135]Silence ratio Proportion of silence in a time window [138]
5.1.2 Textual features
Two textual features were also extracted from the subtitles track of the movies. According
to [139] the semantic analysis of the textual information can improve a�ect classi�cation. As the
semantic analysis over the textual data is not the focus of our work, we extracted simple features
from subtitles by tokenizing the text and counting the number of words. These statistics have
been used with the timing of the subtitles to extract the talking rate feature which is the number
of words that had been spoken per second on the subtitles show time. The other extracted
feature is the number of spoken words in a scene divided by the length of the scene, which can
represent the amount or existence of dialogues in a scene.
A method based on the bag of words of strategy and estimating the a�ect elicited by content
using Whissel Dictionary [80] is also proposed (see Section 5.3).
5.1.3 Continuous characterization of multimedia
A method estimating dimensional emotions are proposed. The dataset consisting of 64 movie
scenes (details in Section 3.1.2.1) was used and shown to 8 participants. Their continuous
emotional self reports served as the ground truth for a continuous a�ect estimation method.
The a�ect was estimated using regression and evaluated using a leave one out cross validation
strategy. A similar method detecting a�ect from physiological responses in Section 4.2.1 is used
to estimate what emotion is going to be elicited showing videos.
First, the correlations between content features and self assessments were determined. Table
5.2 shows, for each participant, the features which had the highest absolute correlations with that
participant's self-assessments of valence and arousal. The large variation between participants
regarding which multimedia features have the highest absolute correlation value with their self
assessment indicates the variance in individual preferences to di�erent audio or video features.
For instance, an increase in motion component leads to higher arousal for participant 8. For the
same feature, increase in motion component resulted in lower valence for participant 5, which
means that the participant had a negative feeling for exciting scenes with a large amount of
movement in objects or background.
Moreover, The correlation between physiological responses and content features was studied.
Table 5.3 shows, for all participants, the correlation coe�cients between four di�erent pairs of

82 CHAPTER 5. CONTENT ANALYSIS FOR AFFECT ESTIMATION
Table 5.2: Content features with the highest absolute correlation with self assessments for par-ticipants 1 to 8.
Part. Arousal ρ Valence ρ
1 6th MFCC coe�cient 0.44 15th bin of the Hue histogram(purplish)
-0.47
2 19th bin of the Hue histogram(purplish)
-0.47 Shadow proportion standarddeviation
-0.51
3 8th MFCC coe�cient 0.45 Last autocorrelation MFCCcoe�cient (standard devia-tion)
0.53
4 First autocorrelation MFCCcoe�cient (standard devia-tion)
0.44 3rd autocorrelation MFCC co-e�cient (standard deviation)
0.39
5 4th Derivative MFCC 0.35 Motion component -0.47
6 11th autocorrelation MFCCcoe�cient
-0.37 5th bin of Luminance his-togram
-0.39
7 12th MFCC coe�cient 0.43 Color variance standard devi-ation
0.48
8 Motion component 0.40 Visual cue, detail 0.52
physiological features and multimedia features. These eight features have been chosen from the
features which have signi�cant correlation with self assessments and thus are more importance
for a�ect characterization. The correlations show that the indicated physiological responses are
signi�cantly correlated with changes in multimedia content. This is for instance the case with
the positive correlation between EMG Zygomaticus energy and key lighting of the video content:
lighter scenes have a direct, positive e�ect on the Zygomaticus activity.
The arousal and valence were estimated using regressors. If y(j) is the emotion, arousal
or valence, felt by viewers and y is our estimation. In order to determine the optimum y, the
weights in Equation 4.1 were computed via a linear RVM from the Tipping RVM toolbox [114].
This procedure was applied on the user self assessed valence-arousal, y(j), and on the feature-
estimated valence-arousal, y(j), over all movie scenes. This procedure is performed two times
for optimizing the weights corresponding to:
� multimedia features when estimating valence;
� multimedia features when estimating arousal.
The mean absolute error (EMAE) and Euclidean distance (EED) are used to evaluate the
regression results in the same was as Section 4.2.1.4.
EED and EMAE values are shown in Table 5.4. It can in particular be observed that the
average Euclidean distance results are all below random level (which is around 0.5). The EMAE
represents the distance of the determined emotion from the self assessed emotion in the dimen-

5.2. MOVIE SCENE CLASSIFICATION USING A BAYESIAN FRAMEWORK 83
Table 5.3: The linear correlation ρ values between multimedia features, and physiological featureswhich are signi�cantly correlated with self assessments (participants 1 to 8).
Part. EMG Zygomati-cus (Sum of abso-lute values) / Keylighting
GSR powerspectral den-sity 0-0.1 Hzband / Standarddeviation (SD)of the �rst au-tocorrelation ofMFCC
BVP spectraldensity 0.1-0.2Hz band / Shotlength variation
EMG Zygomati-cus (Sum of abso-lute values) / Vi-sual cue, details
1 - 0.73 0.54 -
2 0.71 0.72 0.84 0.53
3 0.35 0.71 0.89 0.33
4 0.51 0.50 0.78 0.43
5 0.39 0.63 0.88 0.36
6 0.41 0.63 0.91 0.30
7 0.46 0.76 0.86 0.40
8 0.64 0.55 0.82 0.56
sions of arousal or valence. EMAE is thus useful to compare each dimension's results. The EMAE
of arousal and valence shows that valence determination was more precise than arousal deter-
mination. The superior valence results might have been caused by the easier valence assessment
and therefore, a more precise self assessment on valence.
5.2 Movie Scene Classi�cation Using A Bayesian Framework
Emotions that are elicited in response to a video scene contain valuable information for multi-
media tagging and indexing. The novelty of the method proposed in this Section is to introduce
a Bayesian classi�cation framework for a�ective video tagging that allows taking contextual
information into account. We think that using the existing online metadata can improve the
a�ective representation and classi�cation of movies. Such metadata, like movie genre, is avail-
able on the Internet (e.g., the internet movie database http://www.imdb.com). Movie genre can
be exploited to improve an a�ect representation system's inference about the possible emotion
which is going to be elicited in the audience. For example, the probability of a happy scene in
a comedy certainly di�ers from that in a drama. Moreover, the temporal order of the evoked
emotions, which can be modeled by the probability of emotion transition in consecutive scenes,
is also expected to be useful for the improvement of an a�ective representation system.
It is shown here how to bene�t from the proposed priors in a Bayesian classi�cation frame-
work. A�ect classi�cation was done for a three labels scene classi�cation problem, where the

84 CHAPTER 5. CONTENT ANALYSIS FOR AFFECT ESTIMATION
Table 5.4: Mean absolute error (EMAE), and Euclidean distance (EED) between estimatedvalence-arousal grades and self assessments (participants 1 to 8).
Part. EMAE Arousal
estimated from MCA
EMAE Valence
estimated from MCA
EED MCA
1 0.18 0.13 0.24
2 0.17 0.15 0.23
3 0.15 0.04 0.21
4 0.15 0.13 0.21
5 0.15 0.15 0.24
6 0.15 0.12 0.22
7 0.12 0.12 0.18
8 0.13 0.07 0.16
Average 0.15 0.11 0.21
Random
level
∼0.4 ∼0.4 ∼0.5
labels are �calm�, �positive excited�, and �negative excited�. Ground truth was obtained through
manual annotation with a FEELTRACE-like [48] annotation tool with the self-assessments serv-
ing as the classi�cation ground-truth. The usefulness of priors is shown by comparing classi�ca-
tion results with or without using them.
In our proposed a�ective indexing and retrieval system, di�erent modalities, such as video,
audio, and textual data (subtitles) of a movie will be used for feature extraction. Fig. 5.1
shows the diagram of such a system. The feature extraction block extracts features from the
three modalities and stores them in a database. Then, the a�ect representation system fuses the
extracted features, the stored personal information, and the metadata to represent the evoked
emotion. For a personalized retrieval, a personal pro�le of a user (with his/her gender, age,
location, social network) will help the a�ective retrieval process.
5.2.1 Dataset and annotations
21 commercial and famous movies were �rst gathered and fully annotated. A list of the
movies in the dataset and their corresponding genre is given in Table 5.5.
FEELTRACE is a self-assessment tool which was proposed by Cowie et al. [48] to assess
emotion in the valence-arousal space. In this assessment tool, the coordinates of a pointer
manipulated by the user are continuously recorded during the show time of the stimuli (video,
image, or external source) and used as the a�ect indicators. Inspired by this tool designed for
psychological studies, an a�ective self reporting tool has been implemented to assess emotion
during the watching of a video. The emotion is recorded as the coordinates of the pointer on the

5.2. MOVIE SCENE CLASSIFICATION USING A BAYESIAN FRAMEWORK 85
Metadata: genre, rating, …
INTERNET
Database
Textual information
Feature extraction
Video
Audio
Affect representatio
n system
Affect
User’s personal profile, gender,
age, etc…
Figure 5.1: A diagram of the proposed video a�ective representation.
Table 5.5: List of movies in the dataset.
Drama movies Comedy movies
The pianist, Blood diamond, HotelRwanda, Apocalypse now, American his-tory X, Hannibal
Man on the moon, Mr. Bean's holiday,Love actually, Shaun of the dead, Shrek
Horror movies Action movies
Silent hill, 28 days later, Rungu(Japanese), The shining
Man on Fire, Kill Bill Vol. 1, Kill BillVol. 2, Platoon, The thin red line, Gangsof New York
click event.
One participant annotated the movies so as to indicate at which times his felt emotion has
changed. Thus, the valence and arousal values received from the participant should occur when
there was a change in the participant's emotion. The participant was asked to indicate at least
one point during each scene not to leave any scene without assessment. Continuous annotation
of the movies is a time consuming process; hence the participant was asked to annotate at most
two movies per day of di�erent genres.
A set of SAM manikins [40] are generated for di�erent combinations of arousal and valence
to help the user understand the emotions related to the regions of valence-arousal space. E.g.
the positive, excited manikin is generated by combining the positive manikin and the excited
manikin. A preview of the annotation software is given in Fig. 5.2.

86 CHAPTER 5. CONTENT ANALYSIS FOR AFFECT ESTIMATION
Figure 5.2: Snapshot of the a�ective annotation software which is implemented in LABVIEW.The positive excited manikin can be seen in the central part of the display.
5.2.2 Arousal estimation with regression on shots
Informative features for arousal estimation include loudness and energy of the audio signals,
motion component, visual excitement and shot duration. Using a method similar to Hanjalic et
al. [7] and to the one proposed in [10], the felt arousal from each shot is computed by a regression
of the content features (see Section 5.1.1 for a detailed description). In order to �nd the best
weights for arousal estimation using regression, a leave one movie out strategy on the whole
dataset was used, and the linear weights were computed by means of a RVM from the RVM
toolbox provided by Tipping [114]. The RVM is able to reject uninformative features during
its training hence no further feature selection was used for arousal determination. Equation 5.1
shows how Ns audio and video based features zki of the k-th shot are linearly combined by the
weights wi to compute the arousal ak at the shot level.
ak =
Ns∑i=1
wiZki + w0 (5.1)
5.2.3 Scene classi�cation
After computing arousal at the shot level, the average and maximum arousals of the shots of
each scene are computed and used as arousal indicator features for the scene a�ective classi�ca-
tion. During an exciting scene, the arousal related features do not all remain at their extreme
level. In order to represent the highest arousal of each scene, the maximum of the shots' arousal
was chosen to be used as a feature for scene classi�cation.
The linear regression weights that were computed from our data set were used to determine
the arousal of each movie's shots. This was done in such a way that all movies from the dataset
except for the one to which the shot belonged to were used as the training set for the RVM.
Any missing a�ective annotation for a shot was approximated using linear interpolation from
the closest a�ective annotated time points in a movie.
It was observed that arousal has higher linear correlation with multimedia content-based
features than valence. Valence estimation from regression is not as accurate as arousal estimation
and therefore,valence estimation has not been performed at the shot level.
For the purpose of categorizing the valence-arousal space into three a�ect classes, the valence-

5.2. MOVIE SCENE CLASSIFICATION USING A BAYESIAN FRAMEWORK 87
arousal space was divided into the three areas shown in Fig. 5.3, each corresponding to one class.
According to [57] emotions mapped to the lower arousal category are neither extreme pleasant
nor unpleasant emotions and are di�cult to di�erentiate. Emotional evaluations are shown to
have a heart shaped distribution on valence-arousal space [57]. Hence, we categorized the lower
half of the plane into one class. The points with an arousal of zero were counted in class 1,
and the points with arousal greater than zero and valence equal to zero were considered in class
2. These classes were used as a simple representation for the emotion categories based on the
previous literature on emotion assessment [61].
PositiveNegative
Calm
Valence
3 2
Excited
1 1
Arousal
Figure 5.3: Three classes in the valence-arousal space are shown; namely calm (1), positiveexcited (2) and negative excited (3).
In order to characterize movie scenes into these a�ective categories, the average and maximum
arousal of the shots of each scene and the low level extracted audio- and video- based features
were used to form a feature vector. This feature vector, in turn, was used for the classi�cation.
The content features are listed in Section 5.1.1.
If the content feature vector of the j-th scene is xj , the problem of �nding the emotion class,
yj , of this scene is formulated as estimating the yj which maximizes the probability p(yj |xj , theta)where θ is the prior information which can include the user's preferences and video clip's meta-
data. In this study one of the prior metadata (θ) we used is for instance the genre of the movie.
Personal pro�le parameters can be also added to θ. Since in this study the whole a�ect represen-
tation is trained by the self report of one participant the model is assumed to be personalized for
this participant. When the emotion of the previous scene is used as another prior the scene a�ect
probability formula changes to p(yj |yj−1, xj , θ). Assuming for simpli�cation that the emotion of
the previous scene is independent of the content features of the current scene this probability
can be reformulated as:
p(yj |yj−1, xj , θ) =p(yj−1|yj , θ)p(yj |xj , θ)
p(yj−1|θ)(5.2)
The classi�cation problem is then simpli�ed into the determination of the maximum value
of the numerator of Equation 5.2, since the denominator will be the same for all di�erent a�ect

88 CHAPTER 5. CONTENT ANALYSIS FOR AFFECT ESTIMATION
classes yj . The priors are established based on the empirical probabilities obtained from the
training data. For example, the occurrence probability of having a given emotion followed by
any of the emotion categories was computed from the participant's self-assessments and for each
genre. This allowed to obtain the p(yj−1|yj , θ). Di�erent methods were evaluated to estimate
the posterior probability p(yj |xj). A naïve Bayesian approach which assumes the conditional
probabilities are Gaussian was chosen as providing the best performance on the dataset; the
superiority of this method can be attributed to its generalization abilities.
5.2.4 Results
5.2.4.1 Arousal estimation on shots
Fig. 5.4 shows a sample arousal curve from part of the �lm entitled �Silent Hill�. Fig. 4 is a
typical example of the obtained results on arousal estimation. The estimated a�ect curve, in the
�rst half, fairly closely follows the self-assessment curve. This moreover shows the correlation
between arousal related content features and participant's self-estimated a�ect. The participant's
felt emotion was, however, not entirely in agreement with the estimated curve, as can for instance
be observed in the second half of the plot. A possible cause for the discrepancy is the low
temporal resolution of the self-assessment. Another possible cause is experimental weariness:
after having had exciting stimuli for minutes, a participant's arousal might be decreasing despite
strong movements in the video and loud audio. Finally, some emotional feelings might simply
not be captured by low-level features; this would for instance be the case for a racist comment
in a movie dialogue which evokes disgust for a participant. Without some form of semantic high
level analysis of the movie script, the content features are unable to detect verbal behavior in
movie scenes.
Figure 5.4: Five-points smoothed shot arousal curve (full line), and corresponding self-assessments (dashed line).
5.2.4.2 Scene classi�cation results
The naïve Bayesian classi�er results are shown in Table 5.6-a. A more complex SVM clas-
si�er was also evaluated on this dataset but did not demonstrate an improvement in terms of
classi�cation results. The superiority of the Bayesian classi�er with priors over a more complex
classi�er such as the SVM shows that the improvement brought in through the use of adequate
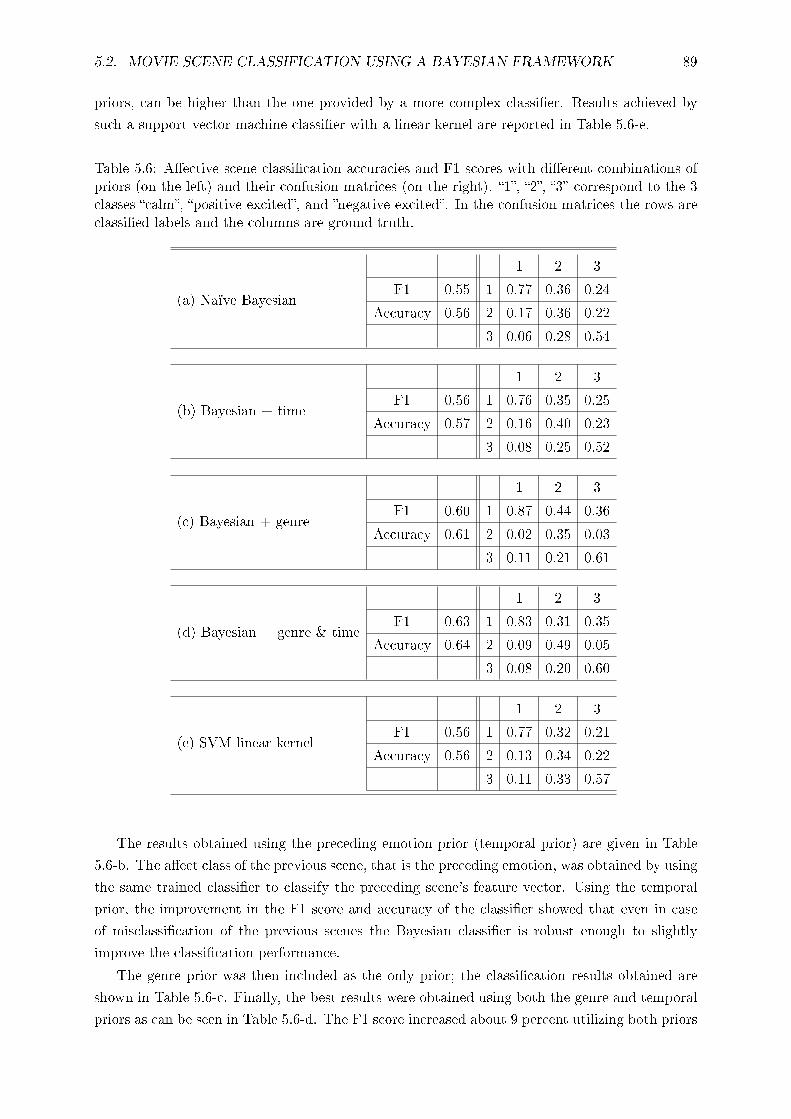
5.2. MOVIE SCENE CLASSIFICATION USING A BAYESIAN FRAMEWORK 89
priors, can be higher than the one provided by a more complex classi�er. Results achieved by
such a support vector machine classi�er with a linear kernel are reported in Table 5.6-e.
Table 5.6: A�ective scene classi�cation accuracies and F1 scores with di�erent combinations ofpriors (on the left) and their confusion matrices (on the right). �1�, �2�, �3� correspond to the 3classes �calm�, �positive excited�, and �negative excited�. In the confusion matrices the rows areclassi�ed labels and the columns are ground truth.
(a) Naïve Bayesian
1 2 3
F1 0.55 1 0.77 0.36 0.24
Accuracy 0.56 2 0.17 0.36 0.22
3 0.06 0.28 0.54
(b) Bayesian + time
1 2 3
F1 0.56 1 0.76 0.35 0.25
Accuracy 0.57 2 0.16 0.40 0.23
3 0.08 0.25 0.52
(c) Bayesian + genre
1 2 3
F1 0.60 1 0.87 0.44 0.36
Accuracy 0.61 2 0.02 0.35 0.03
3 0.11 0.21 0.61
(d) Bayesian + genre & time
1 2 3
F1 0.63 1 0.83 0.31 0.35
Accuracy 0.64 2 0.09 0.49 0.05
3 0.08 0.20 0.60
(e) SVM linear kernel
1 2 3
F1 0.56 1 0.77 0.32 0.21
Accuracy 0.56 2 0.13 0.34 0.22
3 0.11 0.33 0.57
The results obtained using the preceding emotion prior (temporal prior) are given in Table
5.6-b. The a�ect class of the previous scene, that is the preceding emotion, was obtained by using
the same trained classi�er to classify the preceding scene's feature vector. Using the temporal
prior, the improvement in the F1 score and accuracy of the classi�er showed that even in case
of misclassi�cation of the previous scenes the Bayesian classi�er is robust enough to slightly
improve the classi�cation performance.
The genre prior was then included as the only prior; the classi�cation results obtained are
shown in Table 5.6-c. Finally, the best results were obtained using both the genre and temporal
priors as can be seen in Table 5.6-d. The F1 score increased about 9 percent utilizing both priors

90 CHAPTER 5. CONTENT ANALYSIS FOR AFFECT ESTIMATION
in comparison to naïve Bayesian.
As with the temporal prior, the genre prior leads to better estimate of the emotion class. The
classi�cation accuracies of the �rst class �calm� and the third class, �negative excited� have been
improved with this prior. Regarding the �calm� class, the reason for this improvement is that the
genre has a clear impact on arousal, thus on �calm� vs. �aroused� classi�cation (horror and action
movies have higher arousal than drama and comedy). The determination of the second class,
�positive excited�, was only improved by utilizing the temporal prior and not by the genre prior.
The reason is that positive excited emotions were spread among di�erent genres in this training
data. A sample of movie scenes classi�cation along time is shown in Fig. 5.5. The evolution of
classi�cation results over consecutive scenes, when adding the time prior, shows that this prior
allows correcting results for some samples that were misclassi�ed using the genre prior only. For
example on the 4th and 20th scene the classi�er with time prior was able to �nd the correct class
while the naïve Bayesian with only genre prior missed it. Moreover, adding the time prior did
not change any correct classi�cation of the naïve Bayesian classi�er.
Figure 5.5: Classi�cation results for consecutive scenes in a movie. The circle represents thetarget class, and the plus sign shows the results of the Naïve Bayesian classi�er with genre priorand the triangle shows the results with both genre and time priors. The samples, which aremisclassi�ed by the Bayesian classi�er with genre prior, are encircled.
One of the main drawbacks of the proposed approach is the low temporal resolution of a�ective
annotations. It is impossible to guarantee a perfect continuous assessment and annotation of a
movie without the user being distracted at times from the movie events. It is also non-realistic
to expect an average user to be able to use psychological terms and consistent words to express
his/her emotions. Using physiological signals or audio-visual recordings will help overcome these
problems and facilitate this part of the work, by yielding continuous a�ective annotations without
interrupting the user [10].
More prior information and semantic analysis of the movie's script (subtitles), as well as higher
level features, are necessary to further improve a�ect representation. Priors can be personality
related information that help in the de�nition of personal, a�ective pro�les. An example of such
pieces of information is a social network groups indicating people with the same taste, gender,
ethnicity, age, etc. A larger dataset of movies with annotations from multiple participants with
di�erent backgrounds will therefore, enable us to examine more priors. It will also provide us with
a better understanding of the feasibility of using group-wise pro�les containing some a�ective
characteristics that are shared between users.

5.3. VIDEO CHARACTERIZATION USING TEXT ANALYSIS 91
w Pleasantness Activation imagerya 2.0000 1.3846 1.0abandon 1.0000 2.3750 2.4abandoned 1.1429 2.1000 3.0abandonment 1.0000 2.0000 1.4abated 1.6667 1.3333 1.2abilities 2.5000 2.1111 2.2ability 2.5714 2.5000 2.4able 2.2000 1.6250 2.0abnormal 1.0000 2.0000 2.4. . . .. . . .. . . .
Figure 5.6: The Whissel dictionary of a�ect in language. Each word had three ratings.
5.3 Video Characterization Using Text Analysis
Subtitles of movies carry valuable semantic information that can be used for a�ective under-
standing [139]. In this Section, the same dataset utilized in the previous Section, Section 5.2,
was employed to study the usefulness of text analysis for a�ective characterization. Two di�erent
approaches were taken for a�ective understanding of movies based on subtitles. First, a shot
level characterization based on Whissel Dictionary [80] and then a scene classi�cation based on
the bag of words strategy.
5.3.1 Shot level characterization using dictionary
The dictionary of a�ect in language [80] contains 8743 words, which are rated by 200 volun-
teers in three dimensions; namely, pleasantness, activation and imagery which means whether a
word gives a clear mental picture. Example of words and their ratings are shown in Fig. 5.3.1.
In order to characterize the pleasantness of movies in shot level, �rst the subtitles were
tokenized, and then the words, which were spoken in each shot, were extracted. The pleasantness
ratings of words were averaged which gave us the pleasantness in each shot. Two examples of
obtained results with a self reported valence curve are shown in Fig. 5.7.
Although, in the �rst half of American History X (see Fig. 5.7(a)) the a�ect estimation
follows the self assessments there are moments in which the estimated valence is not entirely in
accordance with the self assessments, e.g., from seconds 5000 to 6000 in American History X and
around 1000 seconds in Love actually (see Fig. 5.7).
5.3.2 Scene classi�cation using text analysis
In this Section, a bag of words strategy is employed for classi�cation of scenes into three classes
of calm�, �positive excited�, and �negative excited� which is the same classi�cation scheme that
was used in Section 5.2. For this purpose, the subtitles were �rst tokenized, and the frequency of
terms were calculated (after removing the stop words). In the proposed method, each a�ective
class was dealt with like a document in text retrieval and every word spoken in a scene with

92 CHAPTER 5. CONTENT ANALYSIS FOR AFFECT ESTIMATION
(a) American History X
(b) Love Actually
Figure 5.7: Valence estimation and self reports on shot level for two movies are shown.
unknown a�ect was presented as a query to a repository of indexed documents (classes). The
similarity of the scene to the indexed documents was measured by �rst computing the normalized
word frequencies in classes and comparing the normalized frequencies of the query in di�erent
classes. The class or document with the highest frequency of the query was identi�ed as relevant
and its class, e.g., �calm�, was identi�ed as the class corresponding to that word. For example,
the following sentence words were classi�ed as:
�oh� �you're� �crazy� �i'm� �just� �bringing�
2 1 3 1 2 2
A majority vote over the query results decides the class of the whole scene, e.g., the above ex-
ample is therefore, classi�ed in class �2�. A ten fold cross validation was used for the classi�cation
of scenes based on a majority vote between the subtitle words. Three text processing schemes
were applied on the dataset. First, simply by tokenizing and computing the frequencies. Second,
after removing the English stop words and third after removing stop word and stemming. Te
classi�cation results are shown in Table 5.7. The results showed that removing stop words and
stemming did not improve the results and only by using text and bag of words strategy it is
possible to estimate the emotions with a rate which is signi�cantly higher than a random guess.
The text analysis combined with video and audio content features can further improve the MCA
results.

5.4. BOREDOM RANKING 93
5.4 Boredom Ranking
5.4.1 Dataset and features
The dataset selected for the developed corpus is Bill's Travel Project, a travelogue series called
�My Name is Bill� created by the �lm maker Bill Bowles (http://www.mynameisbill.com/) (see
Section 3.1.2.3). Each video is annotated by multiple annotators with boredom scores on nine
point scale. The average boredom score given by participants of the preliminary study served
as the ground truth for this benchmarking challenge. First 42 videos were released and used for
training. The remaining 80 videos were served as the evaluation.
The dataset consists of information from di�erent modalities; namely, visual information from
video, speech transcripts, audio signals, titles and publication dates.
The low level content features were extracted from audio and video signals; namely, key light-
ing, color variance, motion component zero crossing rate, audio energy. A detailed description
of the content features in Section 5.1.1 . Shot boundaries were detected using the method de-
scribed in [131]. Video length, shot change rate and variation (standard deviation and skewness),
number of shots and average shot length were extracted using the detected shot boundaries.
The speech transcripts were provided by a software implemented originally for speech recog-
nition in meetings [140]. Using WordNet [141] the nouns and nouns which could describe a
country, place or land were �rst extracted as location names. Each noun was checked to see if
it has a Wikipedia page in English. The number of nouns indexed in Wikipedia was counted
as information related feature. This was extracted as an indicator of the amount of information
each transcript carries. The sum of the length of all nouns' Wikipedia pages was also extracted
Table 5.7: A�ective scene classi�cation accuracies and F1 scores with di�erent combinations ofpriors (on the left) and their confusion matrices (on the right). �1�, �2�, �3� correspond to thethree classes �calm�, �positive excited�, and �negative excited�.
(a) Without preprocessing
1 2 3
F1 0.48 1 0.35 0.21 0.23
Accuracy 0.51 2 0.26 0.56 0.14
3 0.39 0.23 0.62
(b) Stop word removal
1 2 3
F1 0.47 1 0.37 0.24 0.22
Accuracy 0.49 2 0.23 0.53 0.15
3 0.40 0.23 0.63
(c) Stemming & stop word removal
1 2 3
F1 0.45 1 0.35 0.18 0.23
Accuracy 0.47 2 0.26 0.55 0.16
3 0.39 0.26 0.60

94 CHAPTER 5. CONTENT ANALYSIS FOR AFFECT ESTIMATION
to represent the information signi�cance of the content. Location fame score was computed by
averaging the Wikipedia page size of all the location nouns. The number of location nouns was
another feature in this class. Based on the scores given to the development set, information
transfer, fame score, video length, number of shots and shot change related features were formed
the set of proposed features.
In order to determine the boredom score estimation, the regression weights were computed
by means of a RVM from the Tipping RVM toolbox [114].
5.4.2 Boredom ranking results
First, the correlation between low level content features with the development set was studied.
Then the features with signi�cant Spearman correlation were chosen in the feature set. Finally,
three di�erent runs were generated by combining the new proposed features and the selected
content features. The content features with highest ranking correlation with the training set are
shown in Table 5.8.
Table 5.8: Content features with signi�cant ranking correlation with boredom scores in thedevelopment set.
Feature Kendall's Tau corre-
lation
Average of the third Mel-Frequency cepstral coe�-cients (MFCC)
-0.24
Average of the 10th MFCC 0.21
Average of the third MFCC 0.24
Standard deviation of the third coe�cient of the auto-correlation of MFCC
0.24
Video key lighting 0.23
Average of 16th bin of the Luminance histogram (outof 20 bins)
0.25
Average of 17th bin of the Luminance histogram 0.23
Table 5.9: Ranking evaluation results for all the 5 submitted runs and random level.
Run Kendall's Tau
ranking
correlation
Spearman ρ Kendall's Tau
ranking
distance
Spearman
footrule
distance
r p ρ p
Random
level
- - - - 1660 27.4
1 0.13 0.07 0.19 0.08 1700 23.2
2 0.10 0.17 0.14 0.20 1650 25.2
3 0.10 0.18 0.14 0.19 1439 24.4
Four ranking distance metric were used to evaluate the boredom ranking results, which are
given in Table 5.9. The Kendall's Tau ranking correlation, Kendall's Tau ranking distance,

5.5. SUMMARY 95
Spearman ρ and Spearman footrule distance. The details about these metrics are available in
[142].
The �rst run used the proposed feature and not the content features. The second run used
all the content features and proposed features together (217 features). Finally, the last run used
the combination of the selected content features and proposed features.
The best results were obtained from regression using the proposed set of features and the
combination of selected content features with proposed features. None of the generated ranked
lists on the test set had signi�cant ranking correlation with the ground truth p < 0.05).
A set of features for the ranking of felt boredom in videos is proposed. The boredom ranking
results were evaluated using Kendal Tau's ranking correlation and ranking distances. The fame
score, amount of information and shot segmentation information are proposed to be useful for
boredom ranking.
5.5 Summary
Di�erent content based a�ective representation systems using di�erent modalities for esti-
mating felt emotions at the scene level have been proposed. The method, which used a Bayesian
classi�cation framework that allows taking some form of context into account, obtained the best
results. Results showed the advantage of using well chosen priors, such as temporal information
provided by the previous scene emotion, and movie genre. The F1 classi�cation score of 0.55 that
was obtained on three emotional classes with a naïve Bayesian classi�er was improved to 0.56 and
0.59 using only the time and genre prior. This F1 score �nally improved to 0.63 after utilizing
all the priors. Promising results were also obtained from text analysis. The text analysis can be
further developed using di�erent similarity measures and combining with other modalities. A set
of features to detect the boredom elicited in the audience from the content was also proposed.

96 CHAPTER 5. CONTENT ANALYSIS FOR AFFECT ESTIMATION

Chapter 6
Conclusions and Perspectives
The studies reported in this thesis were focused on automatically and unobtrusively detecting
emotional tags for videos. These emotional tags are useful means for �lling the semantic gap
between users' and computers' understanding of multimedia content. This problem was attacked
from two di�erent perspectives. Automatic detection of users' emotions in response to videos
was �rst attempted. Then automatic prediction of users' emotion based on low-level content
features was also studied.
6.1 Lessons Learned
Many lessons were learned by the author which are re�ected in this thesis. To summarize, I
give the following crucial points:
� Emotional understanding of multimedia is a challenging task and extremely di�cult to be
solved with a universal solution. Systems based on a�ective computing can only work if
they are able to take context and personal pro�les into account.
� Self reports and especially dimensional self reports are not easy to provide. The ground
truth de�nition is one of the main challenges in a�ective computing and emotion recognition
[79]. Special attention is needed in gathering emotional self reports, such as asking di�erent
questions to check the consistency and possibly using a post experiment questionnaire.
� Physiological responses vary from person to person and time to time. An e�ective base-
lining is required for a robust emotion recognition system.
� To reduce the between participant and between session variance, the experiment envi-
ronment in the laboratory should be kept isolated from the outside environment. The
participants should not be able to see the examiners or hear the noise from the outside.
The light and temperature should be controlled to avoid variation in physiological reactions
due to non controlled parameters.
� Choosing the right stimuli material is an important factor in any a�ective study. They
should be long enough to induce emotions and short enough to prevent boredom. Further-
more, to assure that variation in stimuli length does not introduce variance in the measure-
ments between emotional and non-emotional stimuli, we suggest the stimuli durations to
be equal. The mixture of contradicting emotions can make problems for self-assessments.
� Regarding multimedia content analysis, speech transcripts and subtitles are rich sources
97

98 CHAPTER 6. CONCLUSIONS AND PERSPECTIVES
of semantic information. Taking to account textual and contextual information enhances
multimedia content-based a�ective understanding.
6.2 Conclusions
In Chapter 2, I gave a background on emotion theories, a�ective content analysis and emotion
recognition in response to videos. First, emotional theories concerning the emotional responses
to videos and movies and cognitive theory of emotions were explained. Then, di�erent emotional
presentation such as discrete, and dimensional were explained. A literature review on emo-
tional self reporting methods,emotional understanding of videos using content analysis, emotion
recognition using bodily responses and implicit tagging were given.
Next, in Chapter 3, existing emotional corpora were listed and presented. The developed
emotional video corpora and analysis over users' emotional self reports were presented. The re-
sults on video corpora development showed the importance of context and variation of emotional
response by time, mood and gender. The developed databases of emotional, bodily responses
were also presented. The experimental protocol and participants' information were provided in
detail.
In Chapter 4, methodology and results of emotion recognition methods employed to detect
emotion in response to videos were presented. First, a regression based method to detect emotion
in continuous space was presented, and correlates of emotional self assessments and physiologi-
cal responses were shown. Second, a multi-modal participant independent study was presented.
The second study showed the performance of an inter-participant emotion recognition tagging
approach using participants' EEG signals, gaze distance and pupillary response as a�ective feed-
backs. The feasibility of an approach to recognize emotion in response to videos was shown.
The best classi�cation accuracy of 68.5% for three labels of valence and 76.4% for three labels
of arousal were obtained using a modality fusion strategy and a support vector machine. Al-
though the results were based on a fairly small video dataset, due to experimental limitations,
the promising accuracy can be scalable to more samples from a larger population. The improved
performance using multi-modal fusion techniques leads to the conclusion that by adding other
modalities, such as facial expressions, accuracy as well as robustness should further improve. The
last Section of Chapter 4, presented the results and methods for emotion assessment in response
to music videos. Although, a similar approach was taken the results were inferior to the studies
with movie scenes. This can be due to the weaker emotional content and the absence or weaker
presence of narrative plot in music videos.
In Chapter 5, content analysis methods to detect emotions that are more likely to be elicited
by a given multimedia content were presented. Low level content features, which were used
for a�ective understanding, were introduced. Again the regression method was used for a�ective
understanding of videos and the correlation between content features, physiological responses and
emotional self reports were studied. Content based multimedia features' correlations with both
physiological features and users' self-assessment of valence-arousal were shown to be signi�cant.
Next, an a�ective representation system for estimating felt emotions at the scene level has
been proposed using a Bayesian classi�cation framework. The classi�cation accuracy of 56% that
was obtained on three emotional classes with a naïve Bayesian classi�er was improved to 64%

6.3. PERSPECTIVES 99
after utilizing temporal and genre the priors. Results showed the advantage of using well chosen
priors, such as temporal information provided by the previous scene emotion, and movie genre.
Finally, a set of features for the ranking of felt boredom in videos were proposed. The boredom
ranking results were evaluated using Kendal Tau' ranking correlation and ranking distances. The
fame score, amount of information and shot segmentation information were shown to be useful
for boredom ranking.
6.3 Perspectives
Di�erent open questions arose during the studies which were conducted during the work
presented in thesis. The open questions can be distilled into the following items:
� There are a lot of useful information in the temporal dimension since emotional responses
often do not have abrupt changes. Emotion recognition in continuous time, which takes into
account the temporal dimension, is one of the key problems which needs to be addressed.
� Text, audio and visual features can be combined at di�erent levels to improve the emo-
tional understanding of videos. Using language models and natural language processing
for semantic analysis of subtitles can also improve the results.
� In this thesis, only simple feature level fusions were attempted. More advanced fusion tech-
niques on sensorial level considering the correlation between di�erent responses recorded
by di�erent sensors is an interesting approach to be taken.
� Real life or ambulatory recording can provide a more general estimate of emotional re-
sponses, which manifest themselves in bodily signals. Real life emotional responses despite
the environment noise can have higher intensities. Less obtrusive devises such as the
Q-sensor by A�ectiva 1 can be employed for real life recordings in places such as movie
theaters.
� Users are more responsive in a social context. In future, experiments can be conducted
in the presence of more than one participant to boost their expressions and emotional
responses.
� The performance of a retrieval system using emotional tags detected by content analysis
and emotion recognition systems can be studied and compared to a baseline system using
only user generated tags or self reports.
1. http://www.a�ectiva.com/q-sensor/

100 CHAPTER 6. CONCLUSIONS AND PERSPECTIVES

Appendix A: List of Publications
Journal articles
1. M. Soleymani, M. Pantic, and T. Pun. �Multi-Modal Emotion Recognition in Response toVideos�, IEEE Trans. on A�ective Computing, under review.
2. M. Soleymani, J. Lichtenauer, T. Pun, and M. Pantic. �A Multi-Modal Database for A�ectRecognition and Implicit Tagging�, IEEE Trans. on A�ective Computing, Special Issue onNaturalistic A�ect Resources for System Building and Evaluation, in press, 2011.
3. S. Koelstra∗, C. Muhl∗, M. Soleymani∗, A. Yazdani, J.S Lee, T. Ebrahimi, T. Pun, A.Nijholt, and I. Patras. �DEAP: A Database for Emotion Analysis using PhysiologicalSignals�, IEEE Transactions on A�ective Computing, Special Issue on Naturalistic A�ectResources for System Building and Evaluation, in press, 2011. (∗ shared �rst authorship,the �rst three authors are sorted alphabetically)
4. M. Soleymani, G. Chanel, J.J.M. Kierkels, and T. Pun. �A�ective Characterization ofMovie Scenes Based on Content Analysis and Physiological Changes�, Int'l Journal ofSemantic Computing, vol 3, no. 2, 235-254, 2009.
5. G. Chanel, J.J.M. Kierkels, M. Soleymani, and T. Pun. �Short-term emotion assessmentin a recall paradigm�, Int'l Journal of Human-Computer Studies, vol. 67 no. 8, 607-627,2009.
Peer-reviewed international conferences and workshops
1. M. Larson, M. Soleymani, P. Serdyukov, S. Rudinac, C. Wartena, G. Friedland, V. Mur-dock, R. Ordelman and G.J.F. Jones. �Automatic Tagging and Geo-Tagging in Video Col-lections and Communities�, ACM Int'l conference on Multimedia Retrieval (ICMR '11),Trento, Italy, 2011. (oral presentation)
2. M. Soleymani, S. Koelstra, I. Patras, T. Pun, �Continuous Emotion Detection in Responseto Music Videos�, Int'l Workshop on Emotion Synthesis, rePresentation, and Analysis inContinuous spacE (EmoSPACE), Santa Barbara, CA, US, March 2011. (oral presentation)
3. J.J.M. Kierkels, M. Soleymani, and T. Pun, �Identi�cation of Narrative Peaks in VideoClips: Text Features Perform Best�, Lecture Notes on Computer Science (LNCS), Proceed-ing of the Cross language evaluation forum (CLEF 2009), Springer, 2010.
4. M. Soleymani, Martha Larson, �Crowdsourcing for A�ective Annotation of Video: Devel-opment of a Viewer-reported Boredom Corpus�, Workshop on crowdsourcing for searchevaluations, ACM SIGIR 2010, Geneva, Switzerland. (runner up award from Bing)(oral presentation)
5. S. Koelstra, A. Yazdani, M. Soleymani, C. Muhl, J-S Lee, T. Ebrahimi, T. Pun, A. Nijlhot,and I. Patras. �Single Trial Classi�cation of EEG and Peripheral Physiological Signals forRecognition of Emotions Induced by Music Videos�, Int'l Conference on Brain Informatics(BI 2010), Toronto, Canada, 2010. (oral presentation)
101

102 APPENDIX A: LIST OF PUBLICATIONS
6. J.J.M. Kierkels, M. Soleymani, and T. Pun, �Queries and tags in a�ect-based multimediaretrieval�, IEEE Int'l Conference on Multimedia and Expo (ICME'09), Special Session onImplicit Tagging (ICME2009), New York, United States, 2009. (oral presentation)
7. M. Soleymani, G. Chanel, J.J.M. Kierkels, and T. Pun, �A Bayesian Framework for VideoA�ective Representation�, Int'l Conference on A�ective Computing and Intelligent inter-action, Amsterdam, Netherlands, 2009. (oral presentation)
8. M. Soleymani, G. Chanel, J.J.M. Kierkels, and T. Pun, �A�ective Characterization ofMovie Scenes Based on Multimedia Content Analysis and User's Physiological EmotionalResponses�, IEEE Int'l Symposium on Multimedia, Berkeley, US, December 2008. (oralpresentation)
9. M. Soleymani, G. Chanel, J.J.M. Kierkels, and T. Pun,�A�ective Ranking of Movie ScenesUsing Physiological Signals and Content Analysis�, the second ACM Workshop on the ManyFaces of Multimedia Semantics at ACM conference on Multimedia, Vancouver, Canada,October 2008. (oral presentation)
10. M. Benovoy, A. Brouse, T.G. Corcoran, H. Drayson, C. Erkut, and J. Filatriau, M. Soleymani,et al. �Audiovisual Content Generation Controlled by Physiological Signals for Clinical andArtistic Applications�, Proceedings of the eNTERFACE 2007 Workshop, Istanbul, Turkey,2007.
Posters and abstracts
1. G. Gninkoun, and M. Soleymani. �Automatic Violence Scenes Detection: A Multi-ModalApproach�, Working notes proceedings of the MediaEval 2011 workshop, Pisa, Italy, 2011.
2. C.-H. Demarty, C. Penet, G. Gravier, and M. Soleymani. �The MediaEval 2011 A�ectTask: Violent Scenes Detection in Hollywood Movies�, Working notes proceedings of theMediaEval 2011 workshop, Pisa, Italy, 2011.
3. M. Soleymani. �Travelogue Boredom Detection with Content Features�, Working notesproceedings of the MediaEval 2010 workshop, Pisa, Italy, 2010.
4. M. Soleymani, Jeremy Davis, and T. Pun. �A collaborative Personalized A�ective VideoRetrieval System�, Int'l Conference on A�ective Computing and Intelligent interaction,Amsterdam, Netherlands, 2009. (Demonstration)
5. M. Soleymani, G. Chanel, J, Kierkels, and T. Pun. �Valence-Arousal Representation ofMovie Scenes Based on Multimedia Content Analysis and User's Physiological EmotionalResponses�, 5th Joint Workshop on Machine Learning and Multimodal Interaction (MLMI),Utrecht, Netherlands, 2008.
6. R. Lehembre, C. Muhl, U. Gundogdu, A. Sayin, M. Soleymani, and C. Erkut. �Auditoryvs. visual feedback in an asynchronous brain-computer interface�, BCI meets RoboticsWorkshop Leuven, Belgium, 2007.
Proceeding and special session
1. M. Larson, M. Soleymani, P. Serdyukov, V. Murdock, and G.J.F. Jones. Working notesproceedings of the MediaEval 2010 workshop, Pisa, Italy, 2010.
2. M. Larson, M. Soleymani, and P. Serdyukov. Special session on Automatic Tagging andGeo-Tagging in Video Collections and Communities at the ACM Int'l conference on Mul-timedia Retrieval (ICMR '11), Trento, Italy, 2011.

103

104 APPENDIX B: CONSENT FORM
Appendix B: Consent Form
Laboratoire de Vision par ordinateuret multimédia (CVML)Département d'informatiqueUniversité de Genève
Battelle bâtiment A7, Route de Drize,1227 Carouge
Projet informatique d'interaction multimodaleFormulaire de consentement pour l'acqsition de données
Le Laboratoire de Vision par ordinateur et multimédia (CVML) du Département d'informatique de l'Université de Genève conduit des recherches en informatique dans le domaine des interfaces multimodales. Ces interfaces ont pour but d'améliorer la communication entre humain et machine grâce à l'utilisation de modes d'interaction non-standards, c'est-à-dire autres que le clavier et la souris.
Le CVML réalise des tests concernant des protocoles de communication informatiques multimodaux. Nous vous proposons donc de participer à des expériences en tant que l'un des sujets. Il ne s'agit pas d'expériences de recherche médicale, biomédicale, thérapeutique, etc. Nous n'avons pas de connaissances médicales, et ne sommes pas à même de déceler de possibles anomalies.
Dans le texte qui suit, vous serez désigné "sujet" et la ou les personne qui supervisent l'expérience seront nommés "expérimentateur".
Déroulement des expériences
Les expériences sont décrites plus bas dans ce texte. Nous tenons à votre disposition d'autres documents plus détaillés, et les complèterons très volontiers par des explications orales.
Le sujet participe à l'expérience de manière bénévole, sans contrepartie financière. Le laboratoire veille cependant à régler les frais inhérents à l'expérience.
Respect de la sphère privée, conservation des données
Les renseignements collectés sur le sujet ainsi que les données acquises sont strictement confidentiels et anonymes. Les données seront utilisées à des fins de recherche uniquement. Les résultats des analyses pourront faire l'objet de publications scientifiques, toujours en respectant strictement l'anonymat des sujets.
Chaque sujet se voit attribuer un numéro de code. Aucune information permettant d'identifier la personne n'est attachée aux données. L'expérimentateur ne connaît la correspondance entre ce code et vous-même que pour les données dont il gère l'acquisition. Le responsable de projet est la seule personne ayant la liste de toutes les correspondances. L'expérimentateur et le responsable de projet sont strictement liés par le secret professionnel concernant les données et les correspondances entre données et sujets.
Les données sont sauvegardées à double exemplaire: chez l'expérimentateur pour les besoins de ses travaux, et chez le chef de projet pour une conservation de longue durée. A votre demande écrite, les données vous concernant peuvent être effacées, et/ou peuvent vous être communiquées.
Conditions d'arrêt de l'expérience
L'expérience se termine lorsque tous les tests sont achevés ou que l'un des cas suivants se présente:
le sujet décide d'arrêter l'expérience de son propre chef pour n'importe quelle raison. Il n'est pas tenu d'indiquer la ou les raisons qui ont conduit à sa décision;
l'expérimentateur décide d'exclure le patient de l'étude en lui précisant le motif (p.ex. s'il ne répond plus aux exigences prévues par le protocole).
Informations supplémentaires
Des renseignements supplémentaires peuvent être demandés à tout moment au responsable de l'étude ou aux expérimentateurs.
Responsable de l'étude: Thierry Pun ([email protected]).
© UniGe - CVML 2007Page 1 sur 3

105
Expérimentateurs actuels: Guillaume Chanel, [email protected], Mohammad Soleymani, [email protected].
Acquisition de signaux physiologiques
Nous utilisons pour enregistrer les signaux physiologiques le dispositif d'acquisisition Active II de la société Biosemi (http://www.biosemi.com). La caractéristique de ce système est qu'il utilise des électrodes dites actives, c'est-à-dire qu'une infime quantité de courant est diffusée par la surface de l'électrode. Selon l'information reçue et à notre connaissance, la quantité infime de courant injectée permet de supposer qu'il n'y a pas de risques pour la santé du sujet. De la même manière, nous ne sommes pas au courant de contre-indications ou risques associés à l'utilisation de cet équipement. Le système Biosemi Active II est utilisé par de nombreux laboratoires à travers le monde pour des expériences similaires. Il n'y a pas de risque d'électrocution car le dispositif à électrodes est isolé galvaniquement du reste du système d'acquisition (liaison par fibre optique) et est alimenté par batterie.
Acquisition de signaux électro-encéphalographiques (EEG)
Des signaux EEG - électroencéphalographiques sont utilisés pour le développement d'interfaces informatiques interactives et multimodales (faisant appel à plusieurs sens humains). Les signaux acquis permettent de localiser les régions du cerveau activées pour une tâche donnée. Dans le futur, et c'est là l'un des buts de ces recherches, ils devraient pouvoir aussi servir à contrôler directement une machine par "la pensée", chaque commande étant associée à un état mental précis ("tâche") de l'utilisateur. Dans le futur toujours, ils devraient également permettre de détecter de manière grossière l'état émotionnel de l'utilisateur.
Acquisition d'autres types de signaux physiologiques
D'autres types de signaux physiologiques peuvent également être enregistrés, pour étudier l'ensemble des réponses à certains stimulis. En fonction des capteurs à disposition, ces signaux peuvent être par exemple de type électro-cardiographique (ECG), électro-myographique (EMG), résistance de la peau (GSR - Galvanic Skin Resistance).
Acquisition vidéo
Il est possible qu’une vidéo de l’expérience, incluant votre visage, soie enregistrée dans un but de contrôle (pour vérifier que l’expérience c’est déroulée comme prévue) mais également pour étudier les aspects comportementaux.
Déroulement des expériences d'enregistrement des EEGs
Le sujet est assis sur une chaise et porte un casque à électrodes sur la tête (figure ci-contre). Ce casque est relié à un ordinateur via un dispositif d'acquisition qui stocke les données reçues en temps réel. Ces données sont les potentiels électriques mesurés par chaque électrode (maximum 64 électrodes). Selon le type de test, les expériences peuvent se dérouler de diverses manières.
Pour la problématique du contrôle direct d'une machine par la pensée, le sujet effectue plusieurs tâches mentales (p.ex. imagination de mouvement, calcul mental) et les données ainsi acquises sont traitées par l'ordinateur qui tente d'extraire des commandes pour une application informatique. L'expérience se déroule en deux phases. Durant la première phase dite d'apprentissage, le sujet se familiarise avec l'appareil et réalise cet apprentissage dont la durée dépend des capacités du sujet. Il est difficile de prévoir à l'avance la durée de l'apprentissage. Les cas reportés les plus longs mentionnent un maximum de 30 séances d'une heure réparties dans le temps. Dans nos propres expériences, cette durée est sensiblement inférieure, et l'un des buts de la recherche est de la réduire encore. La seconde phase consiste en l'utilisation de l'application informatique. La durée de cette phase dépend de l'expérience et est inférieure à la durée de l'apprentissage (au maximum 15 heures).
Pour la détection de l'état émotionnel, divers stimulus sont présentés (images, vidéos, sons) et les EEGs sont enregistrés. Dans ces expériences, il n'y a en principe pas de phase d'apprentissage, et leur durée est plus courte que pour la problématique du contrôle direct d'une machine par la pensée. Attention certaines scènes des vidéos présentées peuvent heurter votre sensibilité.
© UniGe - CVML 2007Page 2 sur 3

106 APPENDIX B: CONSENT FORM
Questionnaire d'expérience
Les questions qui vous sont posées ici ont pour but de faciliter le traitement des signaux qui seront acquis. Dans le cas des EEG, la connaissance de la main prédominante est importante car elle a une influence sur les signaux acquis. Les réponses que vous donnerez seront traitées de manière strictement confidentielle.
Coordonnées
Nom et prénom(s)
Adresse
Numéro postal/Ville
Adresse email
Téléphone
Renseignements généraux
Vous êtes un/une homme femme
Votre date de naissance (jour/mois/année)
Renseignements influençant les signaux EEG
Main prédominante: gaucher droitier ambidextre
Formulaire de consentement
La signature du présent formulaire atteste que vous êtes majeur, que vous n'êtes ni sous tutelle ou curatelle, que avez bien compris le but de l'expérience et la tâche qui vous sera demandée et que vous consentez librement à participer à cette étude.
Le responsable d'étude/les expérimentateurs m'ont informé oralement et par écrit des buts de l'étude en informatique portant sur les interfaces multimodales, ainsi que des risques éventuels.
J'accepte que des signaux et images d'expérience soient enregistrés et traités, ceci à des buts scientifiques uniquement et en respectant la confidentialité, et que des publications scientifiques soient réalisées sur la base des résultats obtenus.
J'ai lu et compris les informations relatives à l'étude susnommée. J'ai reçu des réponses satisfaisantes aux questions concernant ma participation à cette étude. Je recevrai une copie du présent dossier (information, formulaire de consentement et questionnaire d'expérience).
Je participe volontairement à cette étude. Je peux à tout moment retirer mon accord de participation à cette étude sans avoir à donner de raisons.
J'ai eu suffisamment de temps pour réfléchir avant de prendre ma décision.
Cochez ici si vous acceptez que votre image soit utilisée pour une éventuelle publication scientifique.
Cochez ici si vous acceptez que votre image soit publiée dans une base de données scientifique.
Cocher SVP: J'ai bien lu ce qui précède et je consens à participer à cette expérience.
Signature du sujet (vous): ………………………….. Date: ……………………
Signature du responsable de l'expérience: ………………………… Date: ……………………
© UniGe - CVML 2007Page 3 sur 3

107

108 APPENDIX C: PARTICIPANT'S INSTRUCTIONS
Appendix C: Participant's Instructions
Participant instructions
In the experiment you are participating in, we study the relation between music videos and emotions. Your task is to watch the videos and afterwards to judge your own emotional state, that is your feelings elicited by the music video, and to rate the video.
There are 3 scales that you can use to indicate your feelings: pleasure, arousal, and dominance. All scales range from 1 to 9.
Valence scaleThe scale ranges from big frown to big smile, which represents feelings that range from unhappy or sad to happy or joyful. The rating is done by choosing one among 9 options within the range, as shown below. The facial expressions of the mannequins help you find appropriate options.
unhappy happysad joyful
Arousal scaleThe scale ranges from calm or bored to stimulated or excited. Again, you are to choose one among 9 options. You can see that the facial expression of the mannequin remains the same, but the "explosion" or grumbling in the stomach of the mannequin indicates the degree of arousal.
calm stimulatedbored excited
Dominance/ControlSometimes you feel empowered (in control of everything) when listening to music or seeing a video. Other times, you feel rather helpless and weak (without control). The scale ranges from submissive (or "without control") to dominant (or "in control"). A

109
small mannequin in the left side indicates that you feel unimportant or without control, bullied, like someone else is the leader or in charge, or like you can't handle the situation. A big mannequin in the right side indicates that you feel important, very big, or like you don't need anyone's help.
unimportant importantwithout control in control
General liking scale
A fourth scale asks for your personal rating of the video, that is how much you liked the music video. Please be careful not to confuse this with the “pleasure scale”. Here we are interested in your taste, not your feeling. For example you can still like a video that makes you feel bad, i.e. sad or angry.
dislike like
If you have more questions please don’t hesitate to refer to the experimenter.
And now .. enjoy the experiment

110 APPENDIX C: PARTICIPANT'S INSTRUCTIONS

Appendix D: Video Clips
First Movie Database
To create the video dataset, we extracted video scenes from eight movies selected eitheraccording to similar studies, or from recent famous movies. The movies included four majorgenres: drama, horror, action, and comedy. Video clips used for this study are from the following:Saving Private Ryan (action), Kill Bill, Vol. 1 (action), Hotel Rwanda (drama), The Pianist(drama), Mr. Bean's Holiday (comedy), Love Actually (comedy), The Ring, Japanese version(horror) and 28 Days Later (horror). The extracted scenes, eight for each movie, had durationsof approximately one to two minutes each and contained an emotional event. The followingdataset has been presented and used in Sections 3.1.2.1, 4.2.1 and 5.1.3.
28 Days Later
The version of the movie we used starts by the �Fox searchlights pictures� Intro.Scenenumber
Starttime
Stoptime
Description of the start of the scene
1 00:09:05 00:10:09 Jim (Cillian Murphy) walks in the deserted streets of Lon-don with plastic bag in his hand
2 00:13:39 00:15:15 Starts with a close shot on Jim's face in the church
3 00:42:33 00:44:55 The taxi starts ascending the trash dump in the tunnel
4 00:49:04 00:50:02 Inside the grocery store in the deserted gas station
5 01:08:29 01:09:24 Major Henry West (Christopher Eccleston) and Jim arewalking in a corridor
6 01:34:58 01:35:46 Hannah (Megan Burns) is sitting in a red dress frightenedin a room
7 01:36:09 01:37:58 A �ght between the black soldier and a zombie
8 01:39:14 01:39:48 Jim opens the taxi's door facing Major Henry West
111
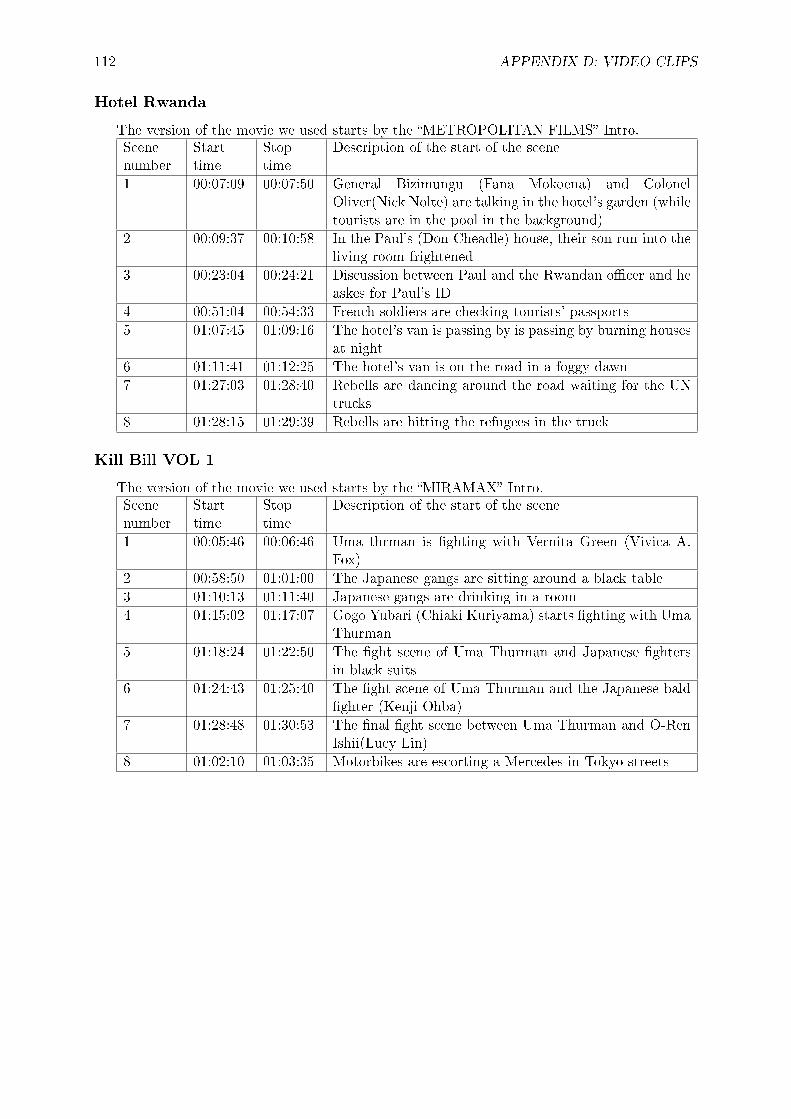
112 APPENDIX D: VIDEO CLIPS
Hotel Rwanda
The version of the movie we used starts by the �METROPOLITAN FILMS� Intro.Scenenumber
Starttime
Stoptime
Description of the start of the scene
1 00:07:09 00:07:50 General Bizimungu (Fana Mokoena) and ColonelOliver(Nick Nolte) are talking in the hotel's garden (whiletourists are in the pool in the background)
2 00:09:37 00:10:58 In the Paul's (Don Cheadle) house, their son run into theliving room frightened
3 00:23:04 00:24:21 Discussion between Paul and the Rwandan o�cer and heaskes for Paul's ID
4 00:51:04 00:54:33 French soldiers are checking tourists' passports
5 01:07:45 01:09:16 The hotel's van is passing by is passing by burning housesat night
6 01:11:41 01:12:25 The hotel's van is on the road in a foggy dawn
7 01:27:03 01:28:40 Rebells are dancing around the road waiting for the UNtrucks
8 01:28:15 01:29:39 Rebells are hitting the refugees in the truck
Kill Bill VOL 1
The version of the movie we used starts by the �MIRAMAX� Intro.Scenenumber
Starttime
Stoptime
Description of the start of the scene
1 00:05:46 00:06:46 Uma thrman is �ghting with Vernita Green (Vivica A.Fox)
2 00:58:50 01:01:00 The Japanese gangs are sitting around a black table
3 01:10:13 01:11:40 Japanese gangs are drinking in a room
4 01:15:02 01:17:07 Gogo Yubari (Chiaki Kuriyama) starts �ghting with UmaThurman
5 01:18:24 01:22:50 The �ght scene of Uma Thurman and Japanese �ghtersin black suits
6 01:24:43 01:25:40 The �ght scene of Uma Thurman and the Japanese bald�ghter (Kenji Ohba)
7 01:28:48 01:30:53 The �nal �ght scene between Uma Thurman and O-RenIshii(Lucy Lin)
8 01:02:10 01:03:35 Motorbikes are escorting a Mercedes in Tokyo streets

113
Love Actually
The version of the movie we used starts by the �UNIVERSAL� IntroScenenumber
Starttime
Stoptime
Description of the start of the scene
1 00:12:19 00:13:57 Colin Frissell (Kriss Marchall) serves at the party
2 00:47:37 00:49:09 Aurelia (Lúcia Moniz) is bringing a cup of co�ee for JamieBennett (Colin Firth) in the garden
3 01:18:28 01:20:33 The jewellery salesman (Rowan Atkinson) is rapping anecklace
4 01:23:45 01:27:04 Colin Frissell arrives at Milwaukee
5 01:43:19 01:44:57 The old lady opens the door and surprises by seeing theprime minister (Hugh Grant)
6 01:51:38 01:54:14 School's Christmas concert starts
7 01:58:15 02:05:00 Jamie Bennett arrived at Portugal
8 00:28:26 00:29:52 Daniel (Liam Neeson) and Sam (Thomas Sangster) aresitting on a bench
Mr. Bean's Holiday
The version of the movie we used starts by the �UNIVERSAL� Intro.Scenenumber
Starttime
Stoptime
Description of the start of the scene
1 00:05:39 00:07:22 Mr. Bean (Rowan Atkinson) takes a taxi at the trainstation
2 00:10:41 00:12:59 Mr. Bean is being served in a French restaurant
3 00:31:52 00:33:50 Mr. Bean is trying to raise money by dancing and imi-tating singer's acts
4 00:37:33 00:39:19 Mr. Bean rides a bike on a road
5 00:40:37 00:42:35 Mr. Bean tries to hitchhike
6 00:45:45 00:47:15 Mr. Bean wakes up in a middle of the shooting of acommercial
7 01:08:04 01:09:02 Dressed as a woman tries to get into the theater with afake ID
8 01:11:35 01:13:22 Mr. Bean is changing the projecting movie to his webcamvideos
Ringu (Japanese version)
The version of the movie we used starts by the �STUDIO CANAL� Intro.Scenenumber
Starttime
Stoptime
Description of the start of the scene
1 00:05:32 00:08:15 School girls are frightened by hearing the ring tone
2 00:27:39 00:29:38 Reiko (Nanako Matsushima) watches the video alone inan empty room
3 00:59:39 01:01:52 Reiko sees the past in black and white
4 01:19:10 01:21:48 Reiko is descending into the well
5 01:25:24 01:27:54 Ryuji (Hiroyuki Sanada) is writing at home and he noticesthat the TV is on and showing the terrifying video
6 01:29:56 01:31:55 Reiko seats on the sofa in her house
7 01:12:05 01:14:48 Reiko and Ryuji are pushing the well's lead
8 00:48:20 01:49:42 Reiko is sleeping in her father's house

114 APPENDIX D: VIDEO CLIPS
Saving private Ryan
The version of the movie we used starts by the �Paramount pictures� Intro.Scenenumber
Starttime
Stoptime
Description of the start of the scene
1 00:04:29 00:06:08 Start scene of the approaching of boats with these wordsapear �June 6, 1944�
2 00:06:09 00:08:15 Landing on the Omaha beach
3 00:09:33 00:12:56 Combat scene on the beach
4 02:13:38 02:14:23 The sniper is praying when he is on a tower
5 00:18:51 00:21:38 The commander is looking into a mirror to see the sourceof the gun�re in a combat scene
6 02:26:05 02:27:21 The combat scene where Capt. John H. Miller (TomHanks) was shot
7 00:56:04 00:57:25 While they are looking for private Ryan, by accident awall collapses and they face a group of German soldierson the other side of the destroyed wall
8 01:20:00 01:20:45 Group of soldiers are walking on a green �eld
The Pianist
The version of the movie we used starts by the �BAC �lms� Intro.Scenenumber
Starttime
Stoptime
Description of the start of the scene
1 00:00:24 00:02:09 Warsaw in 1939 (black and white shots)
2 00:21:10 00:22:34 Szpilman (Adrien Brody) is playing in a restaurant
3 00:24:28 00:25:54 Szpilman walks in the streets of Warsaw
4 00:32:57 00:34:11 A crazy man and children on the street
5 01:56:12 01:58:13 Szpilman (with long hair and beards) tries to open a can
6 00:44:34 00:47:07 Jewish families are waiting to be sent to concentrationcamps
7 00:58:01 01:59:27 Szpilman in a construction site
8 01:50:38 01:51:52 German soldiers are burning everything with�amethrower
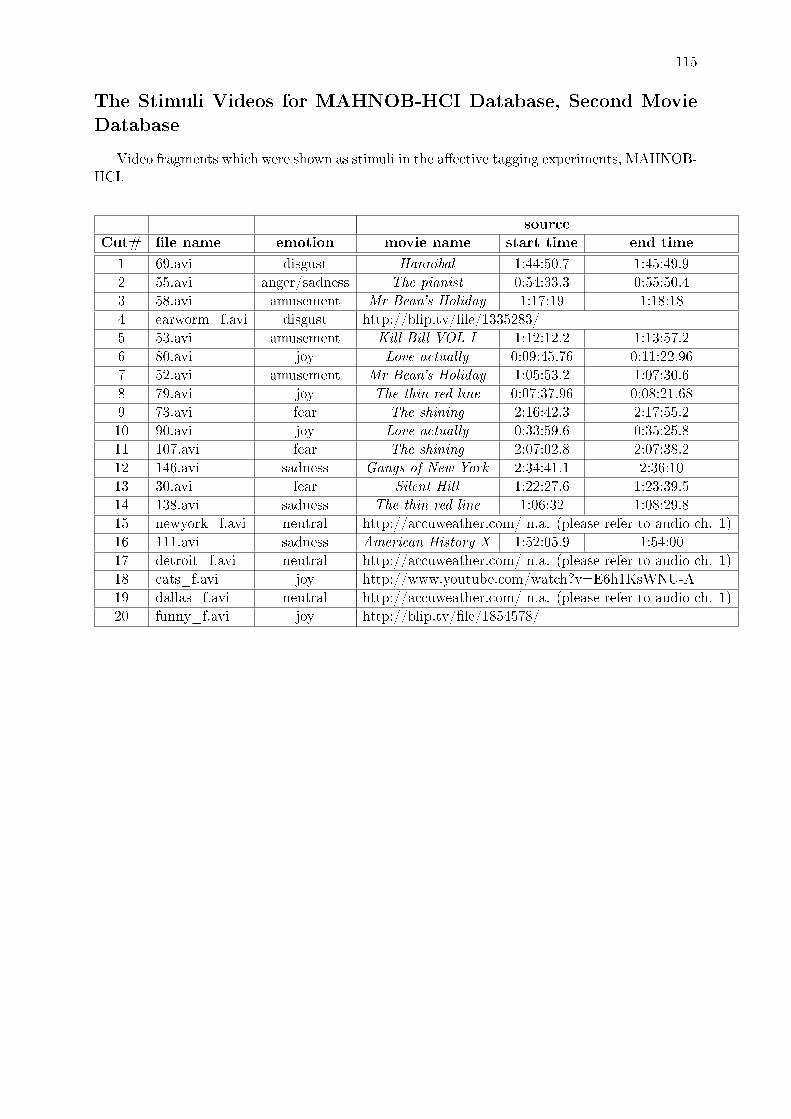
115
The Stimuli Videos for MAHNOB-HCI Database, Second Movie
Database
Video fragments which were shown as stimuli in the a�ective tagging experiments, MAHNOB-HCI.
source
Cut# �le name emotion movie name start time end time
1 69.avi disgust Hannibal 1:44:50.7 1:45:49.9
2 55.avi anger/sadness The pianist 0:54:33.3 0:55:50.4
3 58.avi amusement Mr Bean's Holiday 1:17:19 1:18:18
4 earworm_f.avi disgust http://blip.tv/�le/1335283/
5 53.avi amusement Kill Bill VOL I 1:12:12.2 1:13:57.2
6 80.avi joy Love actually 0:09:45.76 0:11:22.96
7 52.avi amusement Mr Bean's Holiday 1:05:53.2 1:07:30.6
8 79.avi joy The thin red line 0:07:37.96 0:08:21.68
9 73.avi fear The shining 2:16:42.3 2:17:55.2
10 90.avi joy Love actually 0:33:59.6 0:35:25.8
11 107.avi fear The shining 2:07:02.8 2:07:38.2
12 146.avi sadness Gangs of New York 2:34:41.1 2:36:10
13 30.avi fear Silent Hill 1:22:27.6 1:23:39.5
14 138.avi sadness The thin red line 1:06:32 1:08:29.8
15 newyork_f.avi neutral http://accuweather.com/ n.a. (please refer to audio ch. 1)
16 111.avi sadness American History X 1:52:05.9 1:54:00
17 detroit_f.avi neutral http://accuweather.com/ n.a. (please refer to audio ch. 1)
18 cats_f.avi joy http://www.youtube.com/watch?v=E6h1KsWNU-A
19 dallas_f.avi neutral http://accuweather.com/ n.a. (please refer to audio ch. 1)
20 funny_f.avi joy http://blip.tv/�le/1854578/

116 APPENDIX D: VIDEO CLIPS

Bibliography
[1] D. Sander, D. Grandjean, and K. R. Scherer, �A systems approach to appraisal mechanismsin emotion,� Neural Netw., vol. 18, no. 4, pp. 317�352, May 2005.
[2] M. Soleymani, S. Koelstra, I. Patras, and T. Pun, �Continuous emotion detection in re-sponse to music videos,� in 1st International Workshop on Emotion Synthesis, rePresenta-tion, and Analysis in Continuous spacE (EmoSPACE), Santa Barbara, US, March 2011.
[3] S. Koelstra, C. Mühl, M. Soleymani, A. Yazdani, J.-S. Lee, T. Ebrahimi, T. Pun, A. Nijholt,and I. Patras, �DEAP: A Database for Emotion Analysis using Physiological Signals,�IEEE Trans. A�ective Computing, Special Issue on Naturalistic A�ect Resources for SystemBuilding and Evaluation, 2011, in Press.
[4] (2010) Great scott! over 35 hours of video uploaded every minute to youtube. Blog post,Visited on 10 august 2011. [Online]. Available: http://youtube-global.blogspot.com/2010/11/great-scott-over-35-hours-of-video.html
[5] M. Pantic and A. Vinciarelli, �Implicit human-centered tagging,� IEEE Signal ProcessingMagazine, vol. 26, no. 6, pp. 173�180, November 2009.
[6] A. F. Smeaton, P. Over, and W. Kraaij, �High-Level Feature Detection from Video inTRECVid: a 5-Year Retrospective of Achievements,� in Multimedia Content Analysis,Theory and Applications, A. Divakaran, Ed. Berlin: Springer Verlag, 2009, pp. 151�174.
[7] A. Hanjalic and L.-Q. Xu, �A�ective video content representation and modeling,� Multi-media, IEEE Transactions on, vol. 7, no. 1, pp. 143�154, 2005.
[8] J. Kim and E. André, �Emotion recognition based on physiological changes in music listen-ing,� Pattern Analysis and Machine Intelligence, IEEE Transactions on, vol. 30, no. 12,pp. 2067�2083, 2008.
[9] J. Rottenberg, R. D. Ray, and J. J. Gross, Emotion elicitation using �lms, ser. Series ina�ective science. Oxford University Press, 2007, pp. 9�28.
[10] M. Soleymani, G. Chanel, J. J. M. Kierkels, and T. Pun, �A�ective Characterizationof Movie Scenes Based on Content Analysis and Physiological Changes,� InternationalJournal of Semantic Computing, vol. 3, no. 2, pp. 235�254, June 2009.
[11] M. K. Shan, F. F. Kuo, M. F. Chiang, and S. Y. Lee, �Emotion-based music recommenda-tion by a�nity discovery from �lm music,� Expert Syst. Appl., vol. 36, no. 4, pp. 7666�7674,September 2009.
[12] M. Tkal£i£, U. Burnik, and A. Ko²ir, �Using a�ective parameters in a content-based rec-ommender system for images,� User Modeling and User-Adapted Interaction, vol. 20, no. 4,pp. 279�311, September 2010.
[13] J. J. M. Kierkels, M. Soleymani, and T. Pun, �Queries and tags in a�ect-based multi-media retrieval,� in ICME'09: Proceedings of the 2009 IEEE international conference onMultimedia and Expo. Piscataway, NJ, USA: IEEE Press, 2009, pp. 1436�1439.
[14] R. W. Picard and S. B. Daily, �Evaluating A�ective Interactions: Alternatives to Ask-ing What Users Feel,� in CHI Workshop on Evaluating A�ective Interfaces: InnovativeApproaches, 2005.
117

118 BIBLIOGRAPHY
[15] K. R. Scherer, �What are emotions? And how can they be measured?� Social ScienceInformation, vol. 44, no. 4, pp. 695�729, December 2005.
[16] S. Koelstra, A. Yazdani, M. Soleymani, C. Mühl, J.-S. Lee, A. Nijholt, T. Pun, T. Ebrahimi,and I. Patras, �Single Trial Classi�cation of EEG and Peripheral Physiological Signals forRecognition of Emotions Induced by Music Videos,� in Brain Informatics, ser. LectureNotes in Computer Science, Y. Yao, R. Sun, T. Poggio, J. Liu, N. Zhong, and J. Huang,Eds. Berlin, Heidelberg: Springer, 2010, vol. 6334, ch. 9, pp. 89�100.
[17] M. Soleymani, G. Chanel, J. J. M. Kierkels, and T. Pun, �A�ective ranking of movie scenesusing physiological signals and content analysis,� in MS '08: Proceeding of the 2nd ACMworkshop on Multimedia semantics. New York, NY, USA: ACM, 2008, pp. 32�39.
[18] M. Soleymani, J. Davis, and T. Pun, �A collaborative personalized a�ective video retrievalsystem,� in A�ective Computing and Intelligent Interaction and Workshops, 2009. ACII2009. 3rd International Conference on, sep 2009.
[19] M. Soleymani, J. J. M. Kierkels, G. Chanel, and T. Pun, �A bayesian framework forvideo a�ective representation,� in Proceedings of the International Conference on A�ectiveComputing and Intelligent interaction (ACII 2009), September 2009, pp. 1�7.
[20] M. Soleymani, J. Lichtenauer, T. Pun, and M. Pantic, �A Multi-Modal A�ective Databasefor A�ect Recognition and Implicit Tagging,� IEEE Trans. A�ective Computing, SpecialIssue on Naturalistic A�ect Resources for System Building and Evaluation, under review.
[21] M. Soleymani, G. Chanel, J. Kierkels, and T. Pun, �A�ective Characterization of MovieScenes Based on Multimedia Content Analysis and User's Physiological Emotional Re-sponses,� in IEEE International Symposium on Multimedia (ISM'08), Berkeley, US, De-cember 2008.
[22] M. Soleymani and M. Larson, �Crowdsourcing for A�ective Annotation of Video: Devel-opment of a Viewer-reported Boredom Corpus,� in Workshop on Crowdsourcing for SearchEvaluation, SIGIR 2010, Geneva, Switzerland, July 2010.
[23] W. Wirth and H. Schramm, �Media and Emotions,� Communication research trends,vol. 24, no. 3, pp. 3�39, 2005.
[24] P. Ekman, Basic Emotions. John Wiley & Sons, Ltd, 2005, pp. 45�60.
[25] W. James, �What is an emotion?� Mind, vol. 9, pp. 17+, 1884.
[26] K. R. Scherer, �Studying the emotion-antecedent appraisal process: An expert systemapproach,� Cognition & Emotion, vol. 7, no. 3, pp. 325�355, 1993.
[27] A. Ortony, G. L. Clore, and A. Collins, The Cognitive Structure of Emotions. CambridgeUniversity Press, July 1988.
[28] K. R. Scherer, The component process model: Architecture for a comprehensive computa-tional model of emergent emotion. Oxford, UK: Oxford University Press, 2010, ch. 2.1,pp. 105�130.
[29] D. Zillmann, The psychology of suspense in dramatic exposition. Lawrence Erlbaum As-sociates, Inc, 1996, pp. 199�231.
[30] A. I. Nathanson, Rethinking Empathy. Lawrence Erlbaum Associates, Inc, 2003, pp.107�130.
[31] D. Zillmann, Empathy: A�ect from bearing witness to the emotions of others. LawrenceErlbaum Associates, Inc, 1991, pp. 135�168.
[32] R. Plutchik, A general psychoevolutionary theory of emotion. New York: Academic press,1980, pp. 3�33.
[33] W. Wundt, Grundzüge der physiologischen Psychologie. Leipzig: Engelmann, 1905.

BIBLIOGRAPHY 119
[34] S. Marsella, J. Gratch, and P. Petta, Computational models of emotion. Oxford, UK:Oxford University Press, 2010, ch. 1.2, pp. 21�41.
[35] J. A. Russell, �Culture and the Categorization of Emotions,� Psychological Bulletin, vol.110, no. 3, pp. 426�450, 1991.
[36] J. A. Russell and A. Mehrabian, �Evidence for a three-factor theory of emotions,� Journalof Research in Personality, vol. 11, no. 3, pp. 273�294, September 1977.
[37] J. Fontaine, K. Scherer, E. Roesch, and P. Ellsworth, �The World of Emotions is notTwo-Dimensional,� Psychological Science, vol. 18, no. 12, pp. 1050�1057, 2007.
[38] P. Desmet, Measuring emotion: development and application of an instrument to measureemotional responses to products. Norwell, MA, USA: Kluwer Academic Publishers, 2003,ch. 9, pp. 111�123.
[39] P. Winoto and T. Y. Tang, �The role of user mood in movie recommendations,� ExpertSystems with Applications, vol. 37, no. 8, pp. 6086�6092, 2010.
[40] M. M. Bradley and P. J. Lang, �Measuring emotion: the Self-Assessment Manikin andthe Semantic Di�erential.� J Behav Ther Exp Psychiatry, vol. 25, no. 1, pp. 49�59, March1994.
[41] J. A. Russell, A. Weiss, and G. A. Mendelsohn, �A�ect Grid: A single-item scale of pleasureand arousal,� Journal of Personality and Social Psychology, vol. 57, no. 3, pp. 493�502,September 1989.
[42] P. Ekman, W. V. Friesen, M. O'Sullivan, A. Chan, I. Diacoyanni-Tarlatzis, K. Heider,R. Krause, W. A. LeCompte, T. Pitcairn, and P. E. Ricci-Bitti, �Universals and culturaldi�erences in the judgments of facial expressions of emotion.� Journal of personality andsocial psychology, vol. 53, no. 4, pp. 712�717, October 1987.
[43] J. A. Russell, �A circumplex model of a�ect,� Journal of Personality and Social Psychology,vol. 39, no. 6, pp. 1161�1178, December 1980.
[44] A. Schaefer, F. Nils, X. Sanchez, and P. Philippot, �Assessing the e�ectiveness of a largedatabase of emotion-eliciting �lms: A new tool for emotion researchers,� Cognition &Emotion, vol. 24, no. 7, pp. 1153�1172, 2010.
[45] D. Watson and L. A. Clark, �The PANAS-X: Manual for the Positive and Negative A�ectSchedule Expanded Form,� 1994.
[46] S. Zoghbi, D. Kulic, E. Croft, and M. Van der Loos, �Evaluation of a�ective state estima-tions using an on-line reporting device during human-robot interactions,� in Proceedingsof the 2009 IEEE/RSJ international conference on Intelligent robots and systems, ser.IROS'09. Piscataway, NJ, USA: IEEE Press, 2009, pp. 3742�3749.
[47] O. Villon, �Modeling a�ective evaluation of multimedia contents: user models to Associatesubjective experience, physiological expression and contents description,� Ph.D. disserta-tion, Université de Nice - Sophia Antipolis, Nice, France, October 2007.
[48] R. Cowie, E. Douglas-Cowie, S. Savvidou, E. Mcmahon, M. Sawey, and M. Schröder. (2000)'feeltrace': an instrument for recording perceived emotion in real time.
[49] E. Douglas-cowie, R. Cowie, and M. Schröder, �A New Emotion Database: Considerations,Sources and Scope,� in In, 2000, pp. 39�44.
[50] H. L. Wang and L.-F. Cheong, �A�ective understanding in �lm,� Circuits and Systems forVideo Technology, IEEE Transactions on, vol. 16, no. 6, pp. 689�704, jun 2006.
[51] G. Irie, T. Satou, A. Kojima, T. Yamasaki, and K. Aizawa, �A�ective Audio-Visual Wordsand Latent Topic Driving Model for Realizing Movie A�ective Scene Classi�cation,� Mul-timedia, IEEE Transactions on, vol. 12, no. 6, pp. 523�535, October 2010.

120 BIBLIOGRAPHY
[52] M. Xu, J. S. Jin, S. Luo, and L. Duan, �Hierarchical movie a�ective content analysis basedon arousal and valence features,� in Proceeding of the 16th ACM international conferenceon Multimedia, ser. MM '08. New York, NY, USA: ACM, 2008, pp. 677�680.
[53] S. Zhang, Q. Tian, S. Jiang, Q. Huang, and W. Gao, �A�ective mtv analysis based onarousal and valence features,� in Multimedia and Expo, 2008 IEEE International Confer-ence on, april 2008, pp. 1369�1372.
[54] H.-B. Kang, �A�ective content detection using hmms,� in Proceedings of the eleventh ACMinternational conference on Multimedia, ser. MULTIMEDIA '03. New York, NY, USA:ACM, 2003, pp. 259�262.
[55] S. Ari�n and P. Cheung, �A�ective Level Video Segmentation by Utilizing the Pleasure-Arousal-Dominance Information,� Multimedia, IEEE Transactions on, vol. 10, no. 7, pp.1325�1341, 2008.
[56] P. Lang, M. Bradley, and B. Cuthbert, �International a�ective picture system (iaps): A�ec-tive ratings of pictures and instruction manual,� University of Florida, Gainesville, Florida,US, Tech. Rep. A-8, 2005.
[57] P. J. Lang, M. K. Greenwald, M. M. Bradley, and A. O. Hamm, �Looking at pictures:A�ective, facial, visceral, and behavioral reactions,� Psychophysiology, vol. 30, no. 3, pp.261�273, 1993.
[58] J. Wang and Y. Gong, �Recognition of multiple drivers' emotional state,� in In ICPR'08:The 19th International Conference on Pattern Recognition, 2008.
[59] J. A. Healey, �Wearable and automotive systems for a�ect recognition from physiology,�Ph.D. dissertation, MIT, 2000.
[60] C. L. Lisetti and F. Nasoz, �Using noninvasive wearable computers to recognize humanemotions from physiological signals,� EURASIP J. Appl. Signal Process., vol. 2004, no. 1,pp. 1672�1687, January 2004.
[61] G. Chanel, J. J. M. Kierkels, M. Soleymani, and T. Pun, �Short-term emotion assessmentin a recall paradigm,� International Journal of Human-Computer Studies, vol. 67, no. 8,pp. 607�627, August 2009.
[62] K. Takahashi, �Remarks on Emotion Recognition from BioPotential Signals,� in in 2ndInt. Conf. on Autonomous Robots and Agents, 2004, 2005.
[63] J. Bailenson, E. Pontikakis, I. Mauss, J. Gross, M. Jabon, C. Hutcherson, C. Nass, andO. John, �Real-time classi�cation of evoked emotions using facial feature tracking andphysiological responses,� International Journal of Human-Computer Studies, vol. 66, no. 5,pp. 303�317, may 2008.
[64] V. Kolodyazhniy, S. D. Kreibig, J. J. Gross, W. T. Roth, and F. H. Wilhelm, �An a�ec-tive computing approach to physiological emotion speci�city: Toward subject-independentand stimulus-independent classi�cation of �lm-induced emotions,� Psychophysiology, p. InPress, 2011.
[65] J. A. Healey and R. W. Picard, �Detecting stress during real-world driving tasks usingphysiological sensors,� Intelligent Transportation Systems, IEEE Transactions on, vol. 6,no. 2, pp. 156�166, 2005.
[66] R. W. Picard, E. Vyzas, and J. Healey, �Toward Machine Emotional Intelligence: Analysisof A�ective Physiological State,� IEEE Transactions on Pattern Analysis and MachineIntelligence, vol. 23, no. 10, pp. 1175�1191, Oct. 2001.
[67] C. D. Katsis, N. Katertsidis, G. Ganiatsas, and D. I. Fotiadis, �Toward Emotion Recogni-tion in Car-Racing Drivers: A Biosignal Processing Approach,� Systems, Man and Cyber-netics, Part A: Systems and Humans, IEEE Transactions on, vol. 38, no. 3, pp. 502�512,may 2008.

BIBLIOGRAPHY 121
[68] S. D. Kreibig, F. H. Wilhelm, W. T. Roth, and J. J. Gross, �Cardiovascular, electrodermal,and respiratory response patterns to fear and sadness-inducing �lms,� Psychophysiology,vol. 44, pp. 787�806, 2007.
[69] Bradley, M. Margaret, Miccoli, Laura, Escrig, A. Miguel, Lang, and J. Peter, �The pupilas a measure of emotional arousal and autonomic activation,� Psychophysiology, vol. 45,no. 4, pp. 602�607, July 2008.
[70] T. Partala and V. Surakka, �Pupil size variation as an indication of a�ective processing,�International Journal of Human-Computer Studies, vol. 59, no. 1-2, pp. 185�198, 2003.
[71] Y. Gao, A. Barreto, and M. Adjouadi, �Monitoring and processing of the pupil diametersignal for a�ective assessment of a computer user,� in Proceedings of the 13th InternationalConference on Human-Computer Interaction. Part I: New Trends. Berlin, Heidelberg:Springer-Verlag, 2009, pp. 49�58.
[72] Z. Zeng, M. Pantic, G. I. Roisman, and T. S. Huang, �A survey of a�ect recognitionmethods: Audio, visual, and spontaneous expressions,� IEEE Transactions on PatternAnalysis and Machine Intelligence, vol. 31, no. 1, pp. 39�58, March 2009.
[73] J. Russell and J. Fernandez-Dols, Eds., The psychology of facial expression. New York,US: Cambridge University Press, 1997.
[74] Keltner, D. and Ekman, P., Facial Expression Of Emotion, 2nd ed. New York, US:Guilford Publications, 2000, pp. 236�249.
[75] M. Pantic and I. Patras, �Dynamics of facial expression: recognition of facial actions andtheir temporal segments from face pro�le image sequences,� Systems, Man, and Cybernet-ics, Part B: Cybernetics, IEEE Transactions on, vol. 36, no. 2, pp. 433�449, Mar. 2006.
[76] P. R. De Silva and N. Bianchi-Berthouze, �Modeling human a�ective postures: an informa-tion theoretic characterization of posture features,� Comp. Anim. Virtual Worlds, vol. 15,no. 3-4, pp. 269�276, 2004.
[77] M. Nicolaou, H. Gunes, and M. Pantic, �Output-associative rvm regression for dimensionaland continuous emotion prediction,� in Automatic Face Gesture Recognition and Workshops(FG 2011), 2011 IEEE International Conference on, march 2011, pp. 16�23.
[78] A. Kleinsmith, Silva, and N. Bianchi-Berthouze, �Cross-cultural di�erences in recognizinga�ect from body posture,� Interacting with Computers, vol. 18, no. 6, pp. 1371�1389, 2006.
[79] H. Gunes and M. Pantic, �Automatic, dimensional and continuous emotion recognition,�Int'l Journal of Synthetic Emotion, vol. 1, no. 1, pp. 68�99, 2010.
[80] C. M. Whissell, The Dictionary of A�ect in Language. Academic Press, 1989, vol. 4, pp.113�131.
[81] C. M. Lee and S. S. Narayanan, �Toward detecting emotions in spoken dialogs,� Speechand Audio Processing, IEEE Transactions on, vol. 13, no. 2, pp. 293�303, 2005.
[82] M. Nicolaou, H. Gunes, and M. Pantic, �Continuous prediction of spontaneous a�ect frommultiple cues and modalities in valence-arousal space,� IEEE Transactions on A�ectiveComputing, vol. 2, pp. 92�105, 2011.
[83] R. A. Calvo and S. D'Mello, �A�ect Detection: An Interdisciplinary Review of Models,Methods, and Their Applications,� IEEE Transactions on A�ective Computing, vol. 1,no. 1, pp. 18�37, Jan. 2010.
[84] H. Joho, J. Staiano, N. Sebe, and J. Jose, �Looking at the viewer: analysing facial activityto detect personal highlights of multimedia contents,� Multimedia Tools and Applications,vol. 51, no. 2, pp. 505�523, October 2010.
[85] H. Joho, J. M. Jose, R. Valenti, and N. Sebe, �Exploiting facial expressions for a�ectivevideo summarisation,� in Proceeding of the ACM International Conference on Image andVideo Retrieval, ser. CIVR '09. New York, NY, USA: ACM, 2009.

122 BIBLIOGRAPHY
[86] A. Yazdani, J.-S. Lee, and T. Ebrahimi, �Implicit emotional tagging of multimedia usingEEG signals and brain computer interface,� in Proc. SIGMM Workshop on Social media,2009, pp. 81�88.
[87] A. Hanjalic, �Adaptive Extraction of Highlights From a Sport Video Based on ExcitementModeling,� Multimedia, IEEE Transactions on, vol. 7, no. 6, pp. 1114�1122, 2005.
[88] I. Arapakis, Y. Moshfeghi, H. Joho, R. Ren, D. Hannah, and J. M. Jose, �Integrating facialexpressions into user pro�ling for the improvement of a multimodal recommender system,�in Multimedia and Expo, 2009. ICME 2009. IEEE International Conference on, July 2009,pp. 1440�1443.
[89] I. Arapakis, I. Konstas, and J. M. Jose, �Using facial expressions and peripheral physio-logical signals as implicit indicators of topical relevance,� in Proceedings of the seventeenACM international conference on Multimedia, ser. MM '09. New York, NY, USA: ACM,2009, pp. 461�470.
[90] R. B. Dietz and A. Lang, �Aefective agents: E�ects of agent a�ect on arousal, attention,liking and learning,� in Cognitive Technology Conference, 1999.
[91] J. D. Laird, Feelings: The Perception of Self, 1st ed. USA: Oxford University Press, Jan.2007.
[92] A. Kittur, E. H. Chi, and B. Suh, �Crowdsourcing user studies with Mechanical Turk,� inProceeding of the twenty-sixth annual SIGCHI conference on Human factors in computingsystems, ser. CHI '08. New York, NY, USA: ACM, 2008, pp. 453�456.
[93] M. Quirin, M. Kazén, and J. Kuhl, �When Nonsense Sounds Happy or Helpless: TheImplicit Positive and Negative A�ect Test (IPANAT),� Journal of Personality and SocialPsychology, vol. 97, no. 3, pp. 500�516, 2009.
[94] M. Pantic, M. Valstar, R. Rademaker, and L. Maat, �Web-based database for facial expres-sion analysis,� in 2005 IEEE International Conference on Multimedia and Expo. IEEE,2005, pp. 317�321.
[95] E. Douglas-Cowie, R. Cowie, I. Sneddon, C. Cox, O. Lowry, M. McRorie, J.-C. Mar-tin, L. Devillers, S. Abrilian, A. Batliner, N. Amir, and K. Karpouzis, �The HUMAINEDatabase: Addressing the Collection and Annotation of Naturalistic and Induced Emo-tional Data,� in A�ective Computing and Intelligent Interaction, ser. Lecture Notes inComputer Science, A. Paiva, R. Prada, and R. Picard, Eds. Berlin, Heidelberg: SpringerBerlin/Heidelberg, 2007, vol. 4738, ch. 43, pp. 488�500.
[96] M. Grimm, K. Kroschel, and S. Narayanan, �The Vera am Mittag German audio-visualemotional speech database,� in Multimedia and Expo, 2008 IEEE International Conferenceon, april 2008, pp. 865�868.
[97] G. McKeown, M. F. Valstar, R. Cowie, and M. Pantic, �The SEMAINE corpus of emo-tionally coloured character interactions,� in Multimedia and Expo (ICME), 2010 IEEEInternational Conference on, July 2010, pp. 1079�1084.
[98] M. El Ayadi, M. S. Kamel, and F. Karray, �Survey on speech emotion recognition: Features,classi�cation schemes, and databases,� Pattern Recognition, vol. 44, no. 3, pp. 572�587,october 2010.
[99] M. F. Valstar and M. Pantic, �Induced Disgust, Happiness and Surprise: an Addition tothe MMI Facial Expression Database,� in Proceedings of Int'l Conf. Language Resourcesand Evaluation, Workshop on EMOTION, Malta, May 2010, pp. 65�70.
[100] A. Savran, K. Ciftci, G. Chanel, J. C. Mota, L. H. Viet, B. Sankur, L. Akarun, A. Caplier,and M. Rombaut, �Emotion detection in the loop from brain signals and facial images,� inProceedings of the eNTERFACE 2006 Workshop, Dubrovnik, Croatia, July 2006.

BIBLIOGRAPHY 123
[101] J. Lichtenauer, M. Valstar, J. Shen, and M. Pantic, �Cost-e�ective solution to synchro-nized audio-visual capture using multiple sensors,� in AVSS '09: Proceedings of the 2009Sixth IEEE International Conference on Advanced Video and Signal Based Surveillance.Washington, DC, USA: IEEE Computer Society, 2009, pp. 324�329.
[102] T. Kanade, J. F. Cohn, and Y. Tian, �Comprehensive database for facial expression anal-ysis,� in Automatic Face and Gesture Recognition, 2000. Proceedings. Fourth IEEE Inter-national Conference on. IEEE Press, 2000, pp. 46�53.
[103] Pantic, M. and Rothkrantz, L. J. M., �Toward an a�ect-sensitive multimodal human-computer interaction,� Proceedings of the IEEE, vol. 91, no. 9, pp. 1370�1390, 2003.
[104] S. Petridis and M. Pantic, �Is this joke really funny? judging the mirth by audiovisuallaughter analysis,� in Multimedia and Expo, 2009. ICME 2009. IEEE International Con-ference on, 2009, pp. 1444 �1447.
[105] P. Ekman, Commentaries: Duchenne and facial expression of emotion, ser. Studies inEmotion and Social Interaction. Cambridge University Press, Nov. 2006, pp. 270�284.
[106] M. E. Dawson, A. M. Schell, and D. L. Filion, The electrodermal system, 2nd ed. NewYork, NY, US: Cambridge University Press, 2000, pp. 200�223.
[107] P. Rainville, A. Bechara, N. Naqvi, and A. R. Damasio, �Basic emotions are associated withdistinct patterns of cardiorespiratory activity.� International journal of psychophysiology,vol. 61, no. 1, pp. 5�18, July 2006.
[108] R. McCraty, M. Atkinson, W. A. Tiller, G. Rein, and A. D. Watkins, �The e�ects ofemotions on short-term power spectrum analysis of heart rate variability,� The AmericanJournal of Cardiology, vol. 76, no. 14, pp. 1089�1093, 1995.
[109] R. A. McFarland, �Relationship of skin temperature changes to the emotions accompanyingmusic,� Applied Psychophysiology and Biofeedback, vol. 10, pp. 255�267, 1985.
[110] S. D. Kreibig, �Autonomic nervous system activity in emotion: A review,� Biological Psy-chology, vol. 84, no. 3, pp. 394�421, july 2010.
[111] R. Adolphs, D. Tranel, and A. R. Damasio, �Dissociable neural systems for recognizingemotions,� Brain and Cognition, vol. 52, no. 1, pp. 61�69, June 2003.
[112] A. R. Damasio, T. J. Grabowski, A. Bechara, H. Damasio, L. L. B. Ponto, J. Parvizi, andR. D. Hichwa, �Subcortical and cortical brain activity during the feeling of self-generatedemotions,� Nature Neuroscience, vol. 3, no. 10, pp. 1049�1056, October 2000.
[113] F. H. Kanfer, �Verbal rate, eyeblink, and content in structured psychiatric interviews,�Journal of Abnormal and Social Psychology, vol. 61, no. 3, pp. 341�347, 1960.
[114] M. E. Tipping, �Sparse Bayesian Learning and the Relevance Vector Machine,� Journal ofMachine Learning Research, vol. 1, pp. 211�244, 2001.
[115] R. J. Davidson, �A�ective neuroscience and psychophysiology: toward a synthesis.� Psy-chophysiology, vol. 40, no. 5, pp. 655�665, September 2003.
[116] L. I. Aftanas, N. V. Reva, A. A. Varlamov, S. V. Pavlov, and V. P. Makhnev, �Analysisof evoked EEG synchronization and desynchronization in conditions of emotional activa-tion in humans: temporal and topographic characteristics.� Neuroscience and behavioralphysiology, vol. 34, no. 8, pp. 859�867, October 2004.
[117] P. D. Welch, �The Use of Fast Fourier Transform for the Estimation of Power Spectra: AMethod Based on Time Averaging Over Short, Modi�ed Periodograms,� IEEE Transactionson Audio and Electroacoustics, vol. 15, pp. 70�73, 1967.
[118] S. K. Sutton and R. J. Davidson, �Prefrontal Brain Asymmetry: A Biological Substrate ofthe Behavioral Approach and Inhibition Systems,� Psychological Science, vol. 8, no. 3, pp.204�210, 1997.

124 BIBLIOGRAPHY
[119] V. F. Pamplona, M. M. Oliveira, and G. V. G. Baranoski, �Photorealistic models for pupillight re�ex and iridal pattern deformation,� ACM Trans. Graph., vol. 28, no. 4, pp. 1�12,2009.
[120] A. Longtin and J. Milton, �Modelling autonomous oscillations in the human pupil light re-�ex using non-linear delay-di�erential equations,� Bulletin of Mathematical Biology, vol. 51,no. 5, pp. 605�624, September 1989.
[121] H. Bouma and L. C. J. Baghuis, �Hippus of the pupil: Periods of slow oscillations ofunknown origin,� Vision Research, vol. 11, no. 11, pp. 1345�1351, 1971.
[122] D. Ruta and B. Gabrys. (2000) An Overview of Classi�er Fusion Methods.
[123] L. I. Kuncheva, Combining Pattern Classi�ers: Methods and Algorithms. Wiley-Interscience, july 2004.
[124] J. C. Platt, Probabilities for SV Machines. MIT Press, 2000, pp. 61�74.
[125] T. F. Wu, C. J. Lin, and R. C. Weng, �Probability Estimates for Multi-class Classi�cationby Pairwise Coupling,� J. Mach. Learn. Res., vol. 5, pp. 975�1005, 2004.
[126] C. Chang and C. Lin, �LIBSVM: a Library for Support Vector Machines,� 2001.
[127] G. Chanel, C. Rebetez, M. Bétrancourt, and T. Pun, �Emotion assessment from physio-logical signals for adaptation of game di�culty,� Systems, Man and Cybernetics, Part A:Systems and Humans, IEEE Transactions on, vol. PP, no. PP, p. In Press, 2011.
[128] S. D. Kreibig, G. Schaefer, and T. Brosch, Psychophysiological response patterning in emo-tion: Implications for a�ective computing. Oxford, UK: Oxford University Press, 2010,ch. 2.4, pp. 105�130.
[129] J. J. M. Kierkels and T. Pun, �Simultaneous exploitation of explicit and implicit tags ina�ect-based multimedia retrieval,� in A�ective Computing and Intelligent Interaction andWorkshops, 2009. ACII 2009. 3rd International Conference on, September 2009, pp. 1�6.
[130] D. Watson, L. A. Clark, and A. Tellegen, �Development and validation of brief measuresof positive and negative a�ect: the PANAS scales.� Journal of personality and social psy-chology, vol. 54, no. 6, pp. 1063�1070, June 1988.
[131] P. Kelm, S. Schmiedeke, and T. Sikora, �Feature-based video key frame extraction forlow quality video sequences,� in Proc. Int. Workshop on Image Analysis for MultimediaInteractive Services, May 2009, pp. 25 �28.
[132] B. Janvier, E. Bruno, T. Pun, and S. Marchand-Maillet, �Information-theoretic temporalsegmentation of video and applications: multiscale keyframes selection and shot boundariesdetection,� Multimedia Tools and Applications, vol. 30, no. 3, pp. 273�288, Sep. 2006.
[133] R. W. Picard, A�ective Computing. MIT Press, Sep. 1997.
[134] L. Lu, H. Jiang, and H. Zhang, �A robust audio classi�cation and segmentation method,�in Proc. ACM Int. Conf. Multimedia, Ottawa, Canada, 2001, pp. 203�211.
[135] D. Li, I. K. Sethi, N. Dimitrova, and T. McGee, �Classi�cation of general audio data forcontent-based retrieval,� Pattern Recognition Letters, vol. 22, no. 5, pp. 533�544, 2001.
[136] P. Boersma, �Praat, a system for doing phonetics by computer,� Glot International, vol. 5,no. 9/10, pp. 341�345, 2001.
[137] Z. Rasheed, Y. Sheikh, and M. Shah, �On the use of computable features for �lm classi�-cation,� IEEE Trans. Circuits Syst. Video Technol., vol. 15, no. 1, pp. 52�64, 2005.
[138] L. Chen, S. Gunduz, and M. Ozsu, �Mixed type audio classi�cation with support vectormachine,� in Proc. Int. Conf. Multimedia and Expo, Toronto, Canada, July 2006, pp. 781�784.
[139] M. Xu, L.-T. Chia, H. Yi, and D. Rajan, �A�ective content detection in sitcom using subti-tle and audio,� in Multi-Media Modelling Conference Proceedings, 2006 12th International,2006.

BIBLIOGRAPHY 125
[140] A. Stolcke, X. Anguera, K. Boakye, O. Çetin, A. Janin, M. Magimai-Doss, C. Wooters, andJ. Zheng, �Multimodal technologies for perception of humans,� R. Stiefelhagen, R. Bowers,and J. Fiscus, Eds. Berlin, Heidelberg: Springer-Verlag, 2008, ch. The SRI-ICSI Spring2007 Meeting and Lecture Recognition System, pp. 450�463.
[141] G. A. Miller, �WordNet: a lexical database for English,� Commun. ACM, vol. 38, no. 11,pp. 39�41, Nov. 1995.
[142] R. Fagin, R. Kumar, and D. Sivakumar, �Comparing top k lists,� in SODA '03: Proceedingsof the fourteenth annual ACM-SIAM symposium on Discrete algorithms. Philadelphia,PA, USA: Society for Industrial and Applied Mathematics, 2003, pp. 28�36.