Implementing and Evaluating a Clinical Information Interface ...
103
e University of San Francisco USF Scholarship: a digital repository @ Gleeson Library | Geschke Center Doctor of Nursing Practice (DNP) Projects eses, Dissertations, Capstones and Projects 12-12-2014 Implementing and Evaluating a Clinical Information Interface between an Electronic Medical Record and a Patient Classification System Tanya Osborne-McKenzie University of San Francisco, [email protected] Follow this and additional works at: hps://repository.usfca.edu/dnp Part of the Analytical, Diagnostic and erapeutic Techniques and Equipment Commons , Health Communication Commons , Health Information Technology Commons , and the Nursing Administration Commons is Project is brought to you for free and open access by the eses, Dissertations, Capstones and Projects at USF Scholarship: a digital repository @ Gleeson Library | Geschke Center. It has been accepted for inclusion in Doctor of Nursing Practice (DNP) Projects by an authorized administrator of USF Scholarship: a digital repository @ Gleeson Library | Geschke Center. For more information, please contact [email protected]. Recommended Citation Osborne-McKenzie, Tanya, "Implementing and Evaluating a Clinical Information Interface between an Electronic Medical Record and a Patient Classification System" (2014). Doctor of Nursing Practice (DNP) Projects. 45. hps://repository.usfca.edu/dnp/45
-
Upload
khangminh22 -
Category
Documents
-
view
4 -
download
0
Transcript of Implementing and Evaluating a Clinical Information Interface ...

The University of San FranciscoUSF Scholarship: a digital repository @ Gleeson Library |Geschke Center
Doctor of Nursing Practice (DNP) Projects Theses, Dissertations, Capstones and Projects
12-12-2014
Implementing and Evaluating a ClinicalInformation Interface between an ElectronicMedical Record and a Patient Classification SystemTanya Osborne-McKenzieUniversity of San Francisco, [email protected]
Follow this and additional works at: https://repository.usfca.edu/dnp
Part of the Analytical, Diagnostic and Therapeutic Techniques and Equipment Commons,Health Communication Commons, Health Information Technology Commons, and the NursingAdministration Commons
This Project is brought to you for free and open access by the Theses, Dissertations, Capstones and Projects at USF Scholarship: a digital repository @Gleeson Library | Geschke Center. It has been accepted for inclusion in Doctor of Nursing Practice (DNP) Projects by an authorized administrator ofUSF Scholarship: a digital repository @ Gleeson Library | Geschke Center. For more information, please contact [email protected].
Recommended CitationOsborne-McKenzie, Tanya, "Implementing and Evaluating a Clinical Information Interface between an Electronic Medical Record anda Patient Classification System" (2014). Doctor of Nursing Practice (DNP) Projects. 45.https://repository.usfca.edu/dnp/45

Running Head: CLINICAL INFORMATION INTERFACE 1
Implementing and Evaluating a Clinical Information Interface between an Electronic Medical
Record and a Patient Classification System
Tanya Osborne-McKenzie, DNP(c), MBA, RN
University of San Francisco
Committee Members
Marjorie Barter, EdD, RN, CNL, CENP
K.T.Waxman DNP, MBA, RN, CNL, CENP, CHSE
Kathy Malloch, PhD, MBA, RN, FAAN

CLINICAL INFORMATION INTERFACE 2
Table of Contents
SECTION I
Title and Abstract
Title…………………………………………………….……………………1
Abstract…………………………………………………….………………..4
SECTION II
Introduction
Background Knowledge…………………………………………………….5
Local Problem……………………………………………………………….7
Intended Improvement………………………………………………………9
Review of the Evidence…………………………………………………………….11
Conceptual/Theoretical Framework………………………………………………..17
SECTION III
Methods
Ethical Issues……………………………………………………………….20
Setting………………………………………………………………………21
Planning the Intervention…………………………………………………...23
Implementing the Project…………………………………………………………...29
Planning the Study of the Intervention……………………………………………...31
Methods of Evaluation………………………………………………………….…..32
Analysis…………………………………………………………………………......35
SECTION IV
Results
Program Evaluation/Outcomes……………………………………….….…37
SECTION V
Discussion
Summary……………………………………………………………………39
Relation to Other Evidence…………………………………………………42
Barrier to Implementation/Limitations………………………………..……44
Interpretation………………………………………………………………..47
Conclusions…………………………………………………………………50

CLINICAL INFORMATION INTERFACE 3
SECTION VI
Other Information
Funding…………………………………………………………………….50
SECTION VII
References…………………………………………………………………51
SECTION VIII
Appendices
Appendix A……………………………………………………………..…54
Appendix B…………………………………………………………….….55
Appendix C……………………………………………………………..…68
Appendix D………………………………………………………………..72
Appendix E……………………………………………………………...…73
Appendix F………………………………………………………….….….74
Appendix G………………………………………………………….…….75
Appendix H………………………………………………………….…….76
Appendix I……………………………………………………..……..……78
Appendix J…………………………………..……………………….….…80
Appendix K…………………………………………………………..….…82
Appendix L…………………………………………………………..…….85
Appendix M…………………………………………….…………….……86
Appendix N……………………………………………………..…….……87
Appendix O……………………………………………………………...…88
Appendix P………………………………………………………..…….….90
Appendix Q…………………………………………………………..…….91
Appendix R………………………………………………………………...92
Appendix S…………………………………………………………………94
Appendix T…………………………………………………………………95
Appendix U…………………………………………………………..…….96
Appendix V………………………………………………….……………..97

CLINICAL INFORMATION INTERFACE 4
Abstract
As a result of the Affordable Care Act and the Institute of Medicine’s initiatives,
hospitals are challenged to improve outcomes as efficiently as possible. How does the national
initiative of RNs partnering with other healthcare professionals to improve the quality of patient
care at a lower cost, cascade down to individual organizations? One answer may come by
focusing on nurse staffing in acute care hospitals. Considering the impact RNs have on patient
quality outcomes and the bottom line of hospitals, appropriate management of the RN workforce
is one of the most important areas hospitals can focus on in order to meet the goals of ACA and
the IOM.
The aim of the project is to create and implement a clinical information interface between
two software solutions, by different vendors, that allows electronic medical record (EMR) data to
provide source data for the patient classification system (PCS). The end result will be a
classification system that is fully automated. The creation and implementation of a clinical
interface between software solutions from different industry partners is a very new and
innovative approach for advancing the use of software. No template for this work is available.
This computerized information interface (CII) will allow Nurse Managers to use timely, accurate
and consistent data to make informed decisions to manage the nursing workforce in the in-patient
setting.

Running Head: CLINICAL INFORMATION INTERFACE 5
Implementing and Evaluating a Clinical Information Interface between an Electronic Medical
Record and a Patient Classification System
Introduction
Background Knowledge
Signed by President Barrack Obama in March of 2010, the Patient Protection and
Affordable Care Act (PPACA) was enacted with the goals of improving the quality and
affordability of health insurance, decreasing insurance rates and lowering cost of healthcare for
individuals and the government. The PPACA’s anticipated outcomes include value-based
purchasing, financial incentives to hospitals for improving the quality of care, publically
reporting performance and bundled payments (Key features of the PPACA, 2014); resulting in
the challenge hospitals now face: to improve quality outcomes while reducing expenses.
The 2011 Institute of Medicine’s report on The Future of Nursing (Institute of Medicine,
2011) suggested registered nurses (RN), as the largest component of healthcare workers, with
over three million in the United States (US), must play a vital role in helping realize the
objectives of the PPACA. Nurses must partner with other healthcare professionals in the effort to
redesign the US healthcare system and be accountable for their own contributions to deliver
high-quality care as efficiently as possible.
How does the national initiative of RNs partnering with other healthcare professionals to
improve the quality of patient care at a lower cost, cascade down to individual organizations?
One answer may come by focusing on nurse staffing in acute care hospitals. The relationship
between appropriate nurse staffing levels in hospitals to improvements in quality of patient care,
nurse engagement and patient satisfaction has been well documented (Aiken, Clarke, & Sloane,
2002). Additionally, RNs have a significant relationship with the cost of care. Labor costs eat up
over 50% of the revenue in hospitals (Herman, 2013), with the majority of that cost going to RN
labor. Considering the impact RNs have on patient quality outcomes and the bottom line of
hospitals, appropriate management of the RN workforce is one of the most important areas
hospitals can focus on in order to meet the goals of ACA and the IOM.
Influencing factors
Nurse to patient (RN: PT) ratios and staffing to acuity are methods of attempting to
appropriately staff for positive patient outcomes. RN: PT ratios have been introduced into
legislation in an effort to prevent understaffing in hospitals and improve patient outcomes. In

CLINICAL INFORMATION INTERFACE 6
1999, Governor Gray Davis signed RN staffing ratios into law, making California the first state
in the nation to require mandatory RN: PT ratios in all acute care facilities. Five years later, in
2004, after a long fight, the law was implemented (Coffman, Seago, & Spetz, 2002). A study
published in 2010 compared patient outcomes in the state of California, with RN: PT ratios and
Pennsylvania and New Jersey, states without mandated ratios. The study linked lower RN: PT
ratios to significant lower likelihood of in-patient, preventable and surgical deaths (Aiken et al.,
2010). Conversely, studies have indicated correlations between outcomes and RN: PT ratios
(Bolton et al., 2007). RN: PT ratios ensure RNs are not assigned more than a specific number of
patients and has shown to be beneficial in organizations with the practice of assigning large
numbers of patients to RNs. The reality is that in-patient nursing units in the acute care setting
are complex, dynamic environments where patient care needs is highly variable. Staffing
decisions based solely on RN: PT ratios are likely to result in less efficient staffing and could
have a negative impact on patient outcomes. Mandating ratios may help improve care by limiting
the number of patients each nurse is assigned. However, appropriate workforce management
must take into consideration more than numbers of nurses and patients. Strategies, processes,
tools to maximize productivity, containing labor costs and ensure compliance with labor rules,
laws and contracts are needed in order to effectively manage the RN workforce and are much
more complicated than mandated staffing ratios. Lombardi, (2013) describes the primary
pressures driving workforce management initiatives in today’s businesses include marketplace
demands for a workforce that is flexible (i.e. change staffing ratios), rapidly changing business
conditions that require ready access to data to drive decision-making and economic conditions
that require improved control over labor costs.
A component of RN workforce management is the skill mix and number of nursing staff
required to safely provide patient care and can be referred to as acuity. As early as the 1950s,
researchers have attempted to develop methods to provide an accurate number of nurses required
to provide safe and quality care (Abdellah & Levine, 1954). Every patient has different needs
and in order to determine the number of nurses required, patients need to be classified by needs
and the time required meeting those needs. To define as simply as possible, patient classification
systems (PCS) is a workforce management tool used to match the supply (RN numbers and time
available to provide care) to the demand (of the patient, in terms of care needs). PCS attempts to
measure the work the nurses must do to maintain patient safety and predict patient requirements

CLINICAL INFORMATION INTERFACE 7
for care; the acuity. Determining the number of hours for care required in order to provide safe
patient care is the goal of a PCS (Malloch, 2012). Most organizations use some PCS
methodology, whether home grown or purchased, paper or electronic, in order to generate a
guide to staff each day. If a consistent, reliable PCS were available, hospitals would be a step
closer to meeting the national initiative of decreasing costs and improving patient outcomes.
Local Problem
RN: PT ratios and traditional PCS are helpful in the effort to determine appropriate
staffing because they solve part of the puzzle by limiting the maximum number of patients
assigned to each nurse. Staffing ratios are not the entire solution; however, as every patient’s
needs are different. One RN with five patients may have quite a different workload than another
RN with five patients, therefore ratios and the acuity should be used in tandem when staffing.
RN: PT ratios can be considered the foundation for long term scheduling while the acuity
provides essential information for shift staffing.
Classifying patients by their needs moves a step closer to determining the appropriate
number of nurses required for patient care. Either on paper or electronically; accuracy,
consistency and timeliness are required to ensure the data entered into the PCS will provide
reliable information to make projections for staffing that enhance patient safety and are cost
effective. Accuracy requires that nurses entering data have the knowledge of and clearly identify
all care needs required by the patient in the upcoming time period, for example, the number of
RNs required for the next shift. Errors affecting accuracy include the nurses’ knowledge deficit
regarding all the patient care needs, for example, the RN is not aware that a physician wrote an
order for additional medication. The knowledge deficit may be related to mental lapse or lack of
awareness of new orders or a change care the patient needs.
Consistency requires each patient have data, regarding needs, entered into the PCS.
Errors may occur if patients are omitted, for example, one RN assigned to care for three patients
does not enter the data into the PCS. With data of three patients missing, inaccurate staffing
decisions could be made. Errors of omission may occur if a RN is busy and did not have the time
to enter the data. Errors can also occur if nurses enter data inaccurately in an attempt to increase
staffing levels.
Timeliness requires that the PCS data is entered prior to the time staffing decisions are
made. In order to make staffing decisions for the upcoming timeframe, organizations typically

CLINICAL INFORMATION INTERFACE 8
assign a time for data to be entered into the PCS. In order to accurately project the number of
RNs required, all patients must be rated and all data must be entered before a specific time.
Timeliness errors may occur when the data is entered after the identified deadline or after
staffing decisions are made.
Traditional PCS, either on paper or electronic, require the RNs to enter the data, thus
increasing the odds of errors in consistency, timeliness and accuracy. Entering data into the PCS
is not exceptionally time consuming, never the less, adds to the RN’s workload and may take
time away from patient care. Even if all patient data is entered by the specified time, the
information provided is for a specific point in time and can’t account for changes in patient
condition, patient flow or additional orders that occur after the time of data entry. PCS takes the
patient’s condition into consideration, improve accuracy of staffing decisions and are better than
RN; PT ratios alone; yet opportunities for improvement remain.
Predicting the volume and complexity of work and matching it up to the right staff ratio
can be complicated and time consuming. When variables are added such as differing skill and
experience levels, and staff absences the challenge is even more complicated. To achieve the
balance of providing high quality care at an affordable cost, hospitals must be sure to match the
right number of nurses to the number of patients requiring the care. Staffing by using current
practices has shown gains in staffing accuracy; however, more can be done. Limiting these
barriers of the traditional PCS is one way to improve staffing accuracy in hospitals.
Salinas Valley Memorial Hospital (SVMH) is a 252 bed acute care hospital, located in
California’s Central Coast. SVMH has utilized an electronic medical record (EMR) to capture
information about patient’s status for decades. The EMR includes the documentation of the care
the RN and other healthcare professionals provide to each patient and include computerized
physician order entry (CPOE) and electronic medication administration records (eMAR).
Each shift, busy nurses must turn their attention away from their patients to enter data into the
PCS; data that is used to assist nurse managers, staffing clerks and administrative supervisors to
make staffing decisions for the upcoming shift. SVMH utilized a purchased, electronic PCS
which required RNs to manually enter data, by a specific time each shift. That information was
then to be used, by the Staffing Office clerks, Nursing Supervisors and Managers to make
staffing decisions for the upcoming timeframe. This process was in place for approximately two

CLINICAL INFORMATION INTERFACE 9
years. The results were minimal compliance by the RNs to enter the data accurately, consistently
and timely and no one used the PCS to make staffing decisions.
This author was designated the project lead for SVMH’s PCS approximately eighteen
months ago. As part of gaining an understanding the PCS the author conducted assessments of
the system, the RNs who entered the data and the managers who were to make staffing decisions,
based on the PCS. Results of the PCS assessment included the following: compliance rate was
38%, frequently the RNs reported the data inputted were inaccurate and just as often the data
were entered later than the time required to make staffing decisions. RNs and managers were
assessed via survey Appendix A (End User Questionnaire). RNs, who provided direct patient
care in the different specialty areas, were referred to as DCPs in order to differentiate from other
RNs (such as managers and informaticists). Most responses by the DCPs identified obstacles to
timeliness, accuracy and consistency and included requesting not to have to log out of on
application (EMR) and into another (PCS) and back again. This was the rationale provided by
most DCP for low compliance rate. Nurse Managers/ Supervisors requested a way to have
accurate data, in order to make reliable decisions. The current situation resulted in poor user
satisfaction and efficiency with the PCS.
Intended Improvement
Triggers for the change
Primary triggers for the change were the hope to leverage technological advancements to
meet the requests of the end user (DCPs and Nurse Managers/ Supervisors) and breakdown the
obstacles to timeliness, accuracy and consistency. The primary request of the DCPs was to
automate the PCS. Automating the PCS would remove barriers regarding accuracy, compliance
and timeliness of data entry, decrease the DCPs’ workload as well as provide real time
information for Nurse Managers/ Supervisors to base staffing decisions.
Technology has advanced in everyday life, improving communications, research,
shopping, entertainment and travel. Technology has also had an impact in health care. The late
1960s and early 1970s saw the introduction of technological solutions within hospitals in
accounting and finance. In the 1980s, computerized nursing documentation systems began to
emerge. Between 1990-2013 technological solutions available to hospitals has increased at an
alarming rate and include smart intravenous pumps, eMAR, bar coding medications, CPOE,
electronic documentation systems and picture archiving and communication systems (PACS).

CLINICAL INFORMATION INTERFACE
10
As a consequence of these advancements, healthcare reform advocacy groups and governmental
agencies have urged the advancement of healthcare information technologies (HIT). By 1999,
the Institute of Medicine (Institute of Medicine, 2000) study, To Err is Human, had
recommended the use of CPOE as a strategy to decrease medical errors. In 2008 a report by the
Congressional Budget Office states CPOE can reduce prescribing errors by 95%. In addition to
patient safety, expectations of the consistent use of HIT includes improvement in quality of care
and patient satisfaction, decreasing the expense of care, maintaining a healthy workplace
environment an improving staff engagement. The Health Information Technology for Economic
and Clinical Health Act (HITECH) was signed into law by President Barrack Obama in 2009.
The HITECH Act provided $17 billion of Medicare and Medicaid funding for adopting HIT
prior to 2015 (Gordon, 2009).The accelerated rate of advancing technology, the encouragement
of advocacy groups and governmental incentives has resulted in technology implementation in
hospitals now being the norm and allowed for the opportunity to link the EMR and the PCS.
Project aim
A change project will be implemented to improve the timeliness, accuracy and
consistency of the PCS. The aim of the project is to create and implement a clinical information
interface between two software solutions, by different vendors, that allows EMR data to provide
source data for the PCS. The end result will be a classification system that is fully automated.
DCPs will no longer be required to enter data into the PCS and timely, accurate and consistent,
patient data will be available for decision-makers to determine acuity, allowing for accurate
staffing decisions and equitable assignments.
Malloch and Meisel (2013) state reliability, validity and sensitivity are requirements of an
effective PCS. The PCS, implemented at SVMH in 2011, required the DCP to manually enter the
data in order to obtain the level of acuity. Compliance with manual data entry averaged 38%, as
most DCPs chose not to enter data into the PCS. As a result of low compliance, the data from the
PCS was not reliable; subsequently, a staffing matrix, based on census was utilized to staff units.
Leaders at SVMH recognized the value of the PCS, but needed to develop a reliable method of
inputting the data. The CII, an automated of data entry solution, was the innovation implemented
to eliminate poor compliance and other barriers to optimal use of the PCS.

CLINICAL INFORMATION INTERFACE
11
To achieve the project goal a series of conditional and logical expressions that interprets
clinical charting, physician order, and medication administration data and translates this
information into one of five intensity levels for each of the eight PCS care categories (Cognitive,
Self-Care, Emotional/Social/Spiritual, Pain & Comfort, Family, Treatments & Procedures,
Transition, and Care Coordination) must be developed. The process is called Clinical
Information Interface (CII).
Review of the Evidence
While interfaces between products are common in the industry, clinical interfaces within
PCS solutions are not. No template for this work existed. It is for that reason, the literature
review focused on general topics around PCS and technology acceptance. The following key
words, as individual terms and combination, were used in the literature review: Nurse to patient
ratios, patient classification systems, acuity, acuity and patient outcomes, nurses’ acceptance of
technology and nurse staffing. Search parameters included articles in English that were published
within the last five years. In assessing the research the following four areas stood out: RN: Pt
ratio, acuity related to patient outcomes, technology and technology acceptance by nurses and
patient classification systems. For a summary of the evidence, please refer to Appendix B
(Evidence Table).
Nurse to patient ratios
Studies attempting to understand the impact of California’s RN: PT ratio are non-
experimental, comparing like datasets before and after the legislation was put in place. Studies
targeted in the evidence review focused on assessing the commonly used data sets, determining
if the legislation had the desired impact (increasing the number of RNs in acute care hospitals)
and if a positive relationship exists between mandated RN: PT ratios and outcomes.
Aiken, et al. (2010) compared RN workloads across three states; examining how RN
staffing and patient outcomes, including patient mortality and failure-to-rescue, are affected by
the differences in RN workloads across the hospitals of the three states. To perform the
comparison, the researchers used surveys two years after the start of the mandatory ratios. Nearly
80, 000 RNs in California, New Jersey and Pennsylvania participated in the survey. Principal
findings were California hospital RNs cared for one less patient on average than nurses in the
other states and two fewer patients on medical surgical units. Lower ratios are associated with

CLINICAL INFORMATION INTERFACE
12
significantly lower mortality. When RNs’ workloads were the same as the California-mandated
ratios in all three states, RN burnout and dissatisfaction on the job were lower and the RN’s
believed the quality of care was improved. The study concluded that the California-mandated,
hospital RN: PT ratios are associated with lower mortality and patient outcomes and are
predictive of improved RN retention rates. The researchers point out that data obtained regarding
workloads was derived from self-reporting and may be prone to biases, however, prior research
by the same researchers, using the same methods have shown the results to be predictable and
accurate.
Bolton et al., (2007) used post-mandated ratios data from 2004 and 2006 to conduct a
study in order to assess trends in staffing and outcomes two years after the implementation of
California-mandated RN: PT ratios. The authors compared the California Nursing Outcomes
Coalition (CalNOC) data from 252 medical surgical and step down nursing units, in 108
hospitals, representing greater than 500, 000 patient days to determine the difference between
pressure ulcers, nurse staffing and patient falls before and after RN: PT ratios. The study was not
able to establish a positive relationship between improvements anticipated in RN-sensitive
patient outcomes.
Mark, Harless, Spetz, Reiter, & Pink’s, (2013) studied whether, following
implementation of California’s RN: PT ratio legislation, changes in acuity-adjusted nurse
staffing and quality of care in California hospitals outpaced similar changes in hospitals when
compared with states without mandated ratios. Data from multiple, reputable sources were used
to group hospitals into quartiles based on staffing levels before the mandate. Comparison of the
staffing levels and quality of care between California hospitals over the same time period in
hospitals and 12 comparison hospitals without ratios was undertaken. With a few exceptions the
study found, post-regulation, California’s RN staffing had increased significantly over the
comparison hospitals; mixed effects were noted on quality.
Spetz, Donaldson, Aydin, & Brown, (2008) examined two commonly used datasets and
unit-based data to compare nurse staffing measurements and assess the relative strengths and
limitations of each measure. The authors used primary and secondary data from the American
Hospital Association, California Office of Statewide Health Planning and Development,
CalNOC and the California Workforce Initiative Survey in this non-experimental study. The

CLINICAL INFORMATION INTERFACE
13
study concluded unit-level data collection is likely more precise, though difference between
databases may account for variability in research findings. This study is important, as most
studies regarding RN: PT ratios include one or more of the datasets assessed.
Serratt, Harrington, Spetz, & Blegen, (2011) utilized data from California Hospital
Annual Financial Disclosure Reports from 273 acute care hospitals to identify and describe
changes in nurse and non-nursing staffing likely to have occurred as a result of the RN: PT ratio
legislation. The study concluded that most hospitals increased the number of RN staff; however,
decreases in support staff and other non-nurse staff was not evident. This indicated the mandated
ratios had the desired effect of increasing the number of nurses in acute care hospitals.
Nurse staffing to patient outcomes
A plethora of literature, from many different countries, exists exploring the relationship
between higher RN hours to improved patient outcomes and survival rates of hospitalized
patients. Research has ranged from focusing on data from the RNs’ perspective to reviewing
national databases to determine patient outcomes. The literature strongly recommends
collaboration between RNs and Managers and policy makers to achieve safe staffing levels.
In order to examine the effects of RN staffing and organizational support for nursing care
on RN’s dissatisfaction with their jobs, RN burnout and RN reports of patient care, Aiken et al.,
(2002) conducted a multisite, cross-sectional survey of 10, 319 RNs employed on medical and
surgical units in hospitals in the United States, Canada, England and Scotland. Dissatisfaction,
burnout and concerns about the quality of patient care were universal findings; however, in
hospitals with low RN staffing, RNs were three times as likely to imply poor care quality.
By combining longitudinal retrospective and concurrent cross-sectional methods,
Duffield et al., (2011) analyzed five years of administrative data and one overlapping year of
primary unit data to investigate if nurse staffing, increased workload and unstable nursing unit
environments were linked to negative patient outcomes. The authors reviewed workforce data
from 27 hospitals, totaling 286 different in-patient hospital units. Results from the longitudinal
sample revealed that higher numbers of RN hours were associated with significantly decreased
rate of decubiti, pneumonia and sepsis (p< .01). The cross-sectional study resulted in increased
errors, specifically medication errors, with fewer RNs.

CLINICAL INFORMATION INTERFACE
14
Hinno, Partanen, & Vehvilainen-Julkunen, (2011) used a cross-sectional, descriptive
questionnaire in a qualitative study to investigate relationships between nursing activities, nurse
staffing and adverse patient outcomes in hospitals in Finland and the Netherlands. The authors’
results were consistent with previous research: the higher number of RNs, the better patient
outcomes. A significant association exists between nurse staffing and adverse patient outcomes.
Limitations of the study included the lack of a national register in Finland, resulting in the need
for RNs to rely on memory to recall the frequency of adverse events over the past three months.
The population growth and the low number of skilled RNs in Singapore was the impetus
for Lin’s 2013 study to understand what relationship between RN staffing and patient outcomes,
if any. Lin completed an integrative review, examining the empirical evidence on the
relationship between RN staffing and quality of care in acute care settings in different countries,
by reviewing the literature and extracting data from primary sources. The evidence strongly
associated higher numbers of RNs with better quality of patient care.
West et al., (2014) studied whether the size of the workforce (RNs, doctors and support
staff) impacted the chances of survival of critically ill hospitalized patients. The cross-sectional,
retrospective, risk adjusted observational study used statistical controls to assess relationships
between specific independent variables and dependent variables. Participation was voluntary;
however, the participating units were reflective of the population. Data from 61 hospitals, six
months before and after the date of the study was used. The strongest evidence indicated that
higher number of nurses and doctors were associated with better patient outcomes. No evidence
supported the number of support staff working on a unit effecting patient survival. A high
workload was associated with higher mortality. The study found the availability of medical staff
had no relationship with survival across the range of acuity. However, a statistically significant
association between the number of RNs and patient’s risk of mortality at high levels of acuity
was observed.
Patient classification systems
Many different PCS are in use throughout the world in an effort by hospitals to determine
the appropriate numbers of RNs are needed for their patients. Much is written about PCS;
however, no consensus for any specific tool exists and the literature seems heavy on opinion and
anecdotal evidence and discussions on the topic and sorely lacking in research. That may partly

CLINICAL INFORMATION INTERFACE
15
be due to the uniqueness of each patient’s needs, each DCP’s skill set/experience and each
environment. Each set of circumstances being so different, the time and cost researching
individual PCS would be difficult. In spite of this, efforts continue in the search to find an
objective method for predicting RN workloads. The judgment of the expert RN will continue to
be taken into consideration when making staffing decisions.
Fasoli & Haddock, (2011), using an integrative review of the literature, aimed to identify
current practices related to PCS and determine if a “gold standard” PCS exists that could be
adopted or adapted for use by RN leaders in practice. The authors reviewed sixty-three articles
from 1983-2010. Many criticisms from earlier articles remained in recent articles and while
specific characteristics of some PCS were shared, no consensus exists about PCS. The
recommendation of the authors is to use a combination of PCS and RN judgment.
Hurst et al., (2008) describe a major study out of the United Kingdom which aimed to
overcome weaknesses in patient classification and RN workload assessments by developing an
easy-to-used method. The goal was to strengthen the current process which was highly subjective
and dependent upon RN judgment, something that cannot be validated independently. 2,756
patients in three hospitals were sampled, exceeding recommendations for validity. Ward RNs in
the three hospitals scored patients at least daily using two different classification instruments.
The authors developed a tool with a ten step algorithm for calculating direct care hours per
patient day. The authors concluded; however, that to develop a simple tool requires large datasets
that are expensive to collect and maintain. Extrapolating from existing information in order to
contain cost and time may be required; however, in doing so, validity and reliability principles
should not be abandoned.
The Zebra Index (ZI) was the focus of a 2011 study by Levenstam & Bergbom. The aim
of the study was to describe an approach for developing an RN index that was based on the
patients’ needs of RN care and enables costs to be calculated. An index and a calculation of the
ZI, which shows the intensity of the RN care, were developed. The Zebra system consists of
patient classification, staffing monitoring and estimations, quality monitoring and an activity
study. The ZI provided reliable information about the changing RN situations over a period of
time. The authors concluded the ZI could assist in projecting staffing needs.
Technology and technology acceptance by nurses
CLINICAL INFORMATION INTERFACE
16
Located in California, SVMH follows the RN: PT ratio legislation, when making staffing
decisions. SVMH also used an electronic PCS system, which was essentially not being used to
facilitate staffing decisions. Studies relating RNs to improved patient outcomes strengthened this
author’s belief that a PCS that provides accurate and timely data could be used to support
organizations to make appropriate staffing decisions. Enhancing the PCS by implementing the
CII would achieve that goal. A major concern was whether the DCP’s would trust the CII to lead
the decision making about staffing. Implementation of any PCS would not be successful if the
end-user, the DCP, did not trust or accept the system. This question led the author to include
technology and technology acceptance by RNs in the review of the evidence.
Huryk, (2010) completed a literature review to examine current trend in RN’s attitudes
toward healthcare information technology (HIT). Several major databases were used to find
thirteen articles to review. If projects involving HIT were to be deemed successful, RNs must
recognize that that incorporating electronic health records into their daily practice is beneficial to
patient outcomes. Huryk concluded the most common detractors were poor system design,
system slowdown and system downtime and RNs were concerned that the use of technology
would dehumanize patient care. In spite of this, the attitudes of RNs towards HIT were positive.
Implications of the study included the need to involve RNs in system design in order to improve
post-implementation satisfaction.
Ingebrigtsen et al., (2014) conducted a review of literature of major databases (Medline,
Cinahl, Embase and Business Source Premier), to examine evidence associating clinical
leadership and successful information technology (IT) adoption in healthcare organizations.
Results of the study demonstrated important associations between the attributes of clinical
leaders and IT adoption. Specifically, leaders who possess technical informatics skills and prior
experience with IT project management influenced long-term commitment to the use of IT.
Kua, Liu, & Ma, (2013) used a questionnaire to collect 665 responses investigating
personality traits of RNs in regard to technology readiness toward mobile electronic medical
record systems. RNs were found to be optimistic, innovative and secure but uncomfortable about
technology. The authors conclude that continuous educational programs focused on RNs
improving their IT literacy, minimizing stress and discomfort about IT and focusing on recruiting
more optimistic RNs go a long way in supporting HIT implementation and usage. The

CLINICAL INFORMATION INTERFACE
17
friendliness of user interfaces of the EMR will greatly enhance the RNs’ engagement with HIT.
The authors caution implementers against ignoring the effects of personalities on technology and
recommended personality traits should be included in organizational personnel databases.
Implementation of this recommendation would come with legal and ethical challenges and is
therefore not likely to be taken seriously by any organization.
Rivard & Lapointe, (2012) used questionnaires to study the response by the implementers
of IT to resistance of the end user. The study sought to answer the two questions: “What are
implementers’ responses to user resistance?” and “What are the effects of these responses on
user resistance?” The first question led to a creation of a taxonomy that included four categories
of implementers’ responses to user resistance: inaction, acknowledgement, rectification and
dissuasion. The answer to the second question depended on the response to the first, offering a
theoretical explanation of the effects of implementers’ responses on user resistance behavior. For
example, inaction by the implementer results in increase resistance by the end user. The study
concluded that implementers of IT solutions can predict the outcome of the implementation, by
understanding the impact of different responses the implementer has on the end user.
Conceptual/Theoretical Framework
An electronic PCS, which required DCPs to manually enter data, had been implemented
eighteen months earlier at SVMH lacked the desired accuracy, timeliness and consistency and
was not used to facilitate staffing decisions. DCPs reported the data entry was “busy work” and
most did not enter the data at all. Even more disconcerting; nursing leaders continued to use a
census-based staffing grid as the primary method for making staffing decisions, never taking
acuity into consideration. In addition to the staffing matrix, decisions for additional staff were
based on requests by the DCPs. Typically, any additional staff requested was provided.
Studies relating RNs to improved patient outcomes strengthened this author’s belief that a
PCS that provides accurate and timely data could be used to support organizations to make
appropriate staffing decisions. The CII would allow the accurate and timely data needed, but
would the DCP’s trust the CII to lead decision making about staffing? Implementation of any
PCS will not be successful if the end-user, the DCP, does not trust or accept the system.
Providing the proper framework to facilitate implementation was vital to achieving positive
adaptation of PCS using the CII.

CLINICAL INFORMATION INTERFACE
18
The Technology Acceptance Model (TAM) was considered as a framework for the
implementation of the project. The TAM provides a model of how users come to accept and use
technology (Davis, 1989). The TAM focuses on the user’s perception of usefulness of the
technology and the ease of use. The CII would be used to guide staffing decisions; however, the
concern this author had is regarding the DCPs trusting the information. Technically, the CII
won’t require the DCPs to use the system; instead, they must trust the system is working. It is for
that reason; the TAM was not selected.
A theory that attempts to explain how, why and at what rate new ideas, such as
technology, are embraced, would be a better theory to use as a framework for the development
and implementation of the CII. The Diffusion of Innovations theory (Rogers, 2010), which
includes four elements (the innovation itself, communication channels, time and a social system),
that influence the spread of a new idea appeared to be a more appropriate framework to ensure
adaptation and may also facilitate priming a culture that can more easily accept change.
Diffusion is the movement of a material from an area of higher concentration to an area
of lower concentration. In his Diffusion of Innovation theory, Rogers (2010) explains how the
innovation spreads through an area of high concentration to a level of lower concentration. The
innovation, or change, will go through five stages (knowledge, persuasion, decision,
implementation and confirmation) of diffusion.
The knowledge stage is the point at which people experience “selective perception” and
either recognize the need or gap before change can be considered. The change agent, a champion
of the innovation who is respected by those likely to be affected by the change, must be
identified during the knowledge stage, if the innovation is to be implemented. The gap at SVMH
was the inability to use the PCS effectively due to poor compliance. This author functioned as
the change agent to drive the innovation, the CII, forward.
During the second stage in the process of diffusing innovation, persuasion, the end user’s
attitudes toward the innovation must be acknowledged. The end user becomes involved in the
change and makes decisions that affect the success of the project. Rogers cautions that even
when the user has positive feelings related to the innovation, there is no guarantee of successful
diffusion. The majority of the DCPs participating with the build of the CII associated positive

CLINICAL INFORMATION INTERFACE
19
feelings. A few DCPs, while not completely negative about the CII, were highly skeptical; an
attitude that could lead to the failure of the project.
Critical to the successful diffusion of an innovation is the decision stage. This third stage
is the point in time the decision is made to adopt or reject the innovation. Innovations may be
rejected, even after the initial decision to adopt is made. Small tests of change can be used to
test, or pilot, an innovation in an effort to minimize the impact of failure. The CII was
implemented in one area at a time, to ensure success in on area before implementing throughout
the organization.
The fourth stage, implementation, includes the initial use of the innovation and is
designed to test the innovation in the live environment. Once the innovation is implemented, the
innovation’s success is dependent upon acceptance and may take time and revision before
becoming successful. Time allotted to step back, make adjustments, reeducate and reorganize
may be required for a successful implementation. Several changes were made before the CII
functioned properly.
Continued use of innovation occurs during the confirmation stage. During this fifth stage
users seek reinforcement that the innovation has been successfully diffused and metrics of
success are met. Regret and discontent with the end product is a possibility regardless of
preventative efforts put in place. The CII is relatively new; however, with the use of reports and
audits, the success of the project can be determined in time. Reports can reflect the improvement
that is made as a result of the CII. The work of nursing is often difficult to illustrate and nursing
can be seen as only an expense by some in hospitals. When the CII/PCS is fully functioning and
being used to manage the workforce, cost effective care that improves patient outcomes will be
the result.
The goal of the project is not only to develop the CII, but to also have the DCPs trust in
the validity of the data that will be used to guide staffing decisions. Rogers (2010) cautions that
diffusion and acceptance of new ideas does not happen quickly, especially in social systems
made up of many different people with different rates of acceptance to change. A primary reason
for selecting the Diffusion of Innovation theory for the implementation of the CII is the theory’s
consideration of the differences in the rate of acceptance by providing five categories of
adopters. In order to obtain a critical mass of individuals, or diffusion, a series of phases, taking

CLINICAL INFORMATION INTERFACE
20
each individual on their own, personal journey through first hearing of the change to acceptance,
must occur. In an organization, such as a hospital, with hundreds of nurses, of different
generations and life experiences, different rates of acceptance and proficiency are to be expected.
To address those variables, Rogers posits five adopter categories: Innovators, early
adopters, the early majority, the late majority and laggards. Innovators are willing to take risks,
have the highest social standards and are quick to adopt new technologies. The innovators were
important to the project, and included the RN informaticists, programmers and others who would
make up the core of the project team. Early adopters have a high degree of leadership and social
status than other adopters and have a greater discretion about adoption choices than the innovator
group. Early adopters were targeted by the project team to make up the majority of the DCPs
recruited to work on the project and participant of the Acuity Committee. Additionally, early
adopters were tasked with supporting their colleagues as the CII is rolled out.
The early majority include staff adopting the innovation early on, but after the innovators
and the early adopters. Early majority members also have “above average social status, contact
with early adopters and seldom hold positions of opinion leadership in a system” (Rogers, 2010,
p. 283). The charge RNs and Nursing Supervisors will be targeted as the early majority and as
such, were included in the initial group to be educated.
The late majority has below average social status, little opinion leadership and adopts an
innovation after the average participant and only with skepticism. Laggards are the last to adopt
innovation, showing no opinion leadership and usually hold on to traditions and dislike change.
Nurse Managers will need to hold both late adopters and laggards accountable for completing the
education and compliance.
Implementation of the CII will involve all the patients in a particular patient care area.
Application of the Diffusion of Innovation, will involve early adopters and early majority using
their influence to promote interest and increase the rate in which the CII is accepted and trusted
by their colleagues.
Methods
Ethical Issues
The aim of the project was to implement change that meets the requirements for a
performance improvement project and not a research project. No intention for using the data for

CLINICAL INFORMATION INTERFACE
21
research exists. Approval as a performance improvement project was provided for the
application of evidence within change process and the achievement of an accurate, consistent and
timely process for PCS from SVMH leadership and the University of San Francisco’s Doctorate
in Nursing Practice department. See Appendix C (DNP Project Approval Form) for the DNP
Project approval form.
Data reviewed during part of the project t included patient information. For that reason,
aggregated data with no identifiers was used prior to view of project participants. Additionally,
participants working on the project who were employees of SVMH followed current
organizational patient privacy policies.
Setting
Location
The project was conducted at SVMH, a 252 bed acute care, district hospital that opened
in 1953. SVMH’s services include Critical Care (CC), an Emergency Department (ED),
diagnostic imaging, Medical Surgical (M/S) and Women’s and Children’s Services. The CC
consists of a 13 bed Intensive Care Unit, a 15 bed heart center and a 40 bed telemetry unit. The
ED provides care to approximately 44, 000 patients each year. The three M/S units have the
capacity to provide care to 84 patients. The five unit Women’s and Children’s’ areas includes a
Level III Neonatal Intensive Care Unit. SVMH’s Regional Stroke Center, Regional Heart Center,
Regional Spine Center and Stroke Centers have all received certification by the Joint
Commission (TJC). SVMH employs approximately 1600 people, approximately 600 are RNs
providing direct patient care.
Key roles
The project required the expertise of several disciplines and an industry partner and
therefore required several work teams be established to achieve scheduled deliverables and gain
acceptance for a successful change project. RN’s who provide direct patient care, RNs from
informatics, IT staff, nurse leaders and leaders and IT experts from the industry partner were
enlisted in the project design and rollout. Participation from each of the teams was essential in
creating a well-orchestrated project plan, timeline and agreed upon milestones, to move the
project forward. The level of commitment varied among individual team members. All team
members were required to champion the project, facilitate trouble shooting and solution finding,

CLINICAL INFORMATION INTERFACE
22
when appropriate. The general responsibilities (Appendix D Responsibility Matrix) are defined
as follows:
Project Lead, Nursing (PLN): Fulltime administrative leader within SVMH
system, tasked with coordinating the CII project from both nursing and IT’s point
of view. The PLN will need to communicate with SVMH’s Chief Nursing
Officer (CNO) and Chief Financial Officer (CFO), project team members, RN
staff, leaders of the RN union and others as the project evolves; be accountable
for the expense of the project; maintain records of the project; develop or
facilitate the development of education plans and other not yet defined
responsibilities.
Project Lead, Informatics (PLI): Fulltime administrative leader within SVMH
system tasked with coordinating the CII project from the point of view of the IT
side.
Nurse Informaticists (RNI): Fulltime, permanent RN, with clinical and IT
experience and a comprehensive understanding of the nursing documentation
system. The RNI will need to work closely with the DCPs in order to interpret the
work of the DCPs into the language of the RN documentation. The RNI would
also be called upon to assist with audits and other tasks, as needed.
Programmers: Full and part-time, permanent employees of SVMH’s IT
department. Programmers will need to be available, as needed, to support the
writing of the expressions for the CII during the building of the M/S instrument
and will be expected to write the expressions for subsequent CIIs.
Functional Systems Analyst (FSA): A fulltime, employee of SVMH’s Informatics
department. The FSA is the expert on the PCS software for SVHM and is an
integral member of the team, coordinating and educating team members on the
software as well as acting as the go between for SVMH and the industry partner.
Direct Care Provider (DCP): RNs expert representing each specialty areas in
which the CII instruments were built and implemented. DCPs were required to
use clinical judgment to assist the informaticists, FSA and the Programmers to
understand care required for each dimension, allowing for the mapping and

CLINICAL INFORMATION INTERFACE
23
expression building needed for the CII. The majority of the DCPs selected to
work on the project identified as informal leaders with a positive history of
working their own work processes. The PLN requested each group of DCP
include a member who was an informal leader identified as having a history of
presenting barriers to change.
Industry Partner Project Lead (IPPL): RN Informaticists employed by the
industry partner. The IPPL will lead the team from API and communicate with
PLN to ensure required resources are available to complete the project.
Industry Partner Programmers (IPP): IT specialists tasked with building the
expressions that will result in the interface.
Instrument Expert: A PhD, educated RN builder of the traditional PCS used by
SVMH and consultant to the industry partner. The Instrument expert guided the
PLN throughout the build and implementation of the CII. Additionally, the
Instrument Expert provided support to the project by assisting with
communication with the CNO/CFO, union leadership and others.
Work completed 18 months earlier building the traditional PCS system (requiring manual
data input), yielded a PCS for the specialty areas of M/S, CC and Women’s and Children’s. An
interface would need to be developed for each area of specialty, utilizing three different groups
of DCPs. The balance of the team members would be required to participate in the development
of the interfaces in all the specialty areas. While the DCPs will be removed from their normally
scheduled shifts when working on the project, the other team members will be adding the work
required for the CII to their already busy workloads. For these two reasons, team leaders decided
to build each instrument consecutively; rather than concurrently. Additionally, because much of
the care provided in the M/S areas would be the same in CC and Women’s and Children, the
team decided the M/S instrument would be the first instrument to build and implement.
Planning the Intervention
Purpose and process
The creation and implementation of a clinical interface between technological solutions is
a very new and innovative approach for advancing the use of software. No template for this work
exists. A clinical interface between the EMR and the PCS will be a benefit to SVMH. The EMR

CLINICAL INFORMATION INTERFACE
24
includes the orders, via CPOE, the eMAR and nurses’ documentation. SVMH will collaborate
with an industry partner specializing in innovative workforce management solutions, including a
PCS system. The goal of PCS is to “quantify categories of care in order to measure and/or
predict the required nursing hours/effort for direct patient care” (Malloch & Meisel, 2013, p. 35).
A primary function of the PCS is to assist nurse managers with projecting the number of nurses
required to provide patient care for upcoming shifts.
The aim of the project is to develop a series of conditional and logical expressions that
interprets clinical charting, physician order, and medication administration data and translates
this information into one of five intensity levels for each of the eight PCS care categories
(Cognitive, Self-Care, Emotional/Social/Spiritual, Pain & Comfort, Family, Treatments &
Procedures, Transition, and Care Coordination). The process is called Clinical Information
Interface (CII).
The CII mapping process is as follows:
I. Select a Care Category
II. Identify the patient care needs for each Intensity Level
III. Discuss with the Expert Nurse panel (DCP) those interventions, orders, or medications
that support each of the care needs for that level.
IV. Try to not only identify single events (disoriented, BMI score, Morse Fall risk), but event
combinations and frequencies.
V. Talk through how DCPs would look at the EMR documentation to reflect the care needs.
VI. Write down the discussion as logical Boolean expressions. (e.g. If Level of
Consciousness is Restless or Orientation is Disoriented AND Physical Behavior =
Resistive to care, or impulsive or anxious, then the Intensity Level is 4)
VII. Identify the EMR mnemonics for each of the items in the expression (e.g.
NEURO.LOC is the patient’s Level of Consciousness, NEURO.ORIE is the patient’s
orientation)
VIII. Add the above mnemonics to a list for IT so they can download the values to the
CII
IX. Repeat Steps 1-8 for all intensity levels and Care Categories

CLINICAL INFORMATION INTERFACE
25
X. Write the actual logical expressions in the CII software for all expressions (i.e.
NEURO.LOC = “Restless or NEURO.ORIE = “Disoriented” AND (NEURO.B = count
group of 1 of (“Resistive to care”, “impulsive”, “anxious”))
XI. As the expressions are written for a dimension, start testing the expressions to confirm
they are being read, understood, and interpreted as desired. Remember, computers do
exactly what they are told, so if the expression is stated one way (the desired intent), but
written another way (the way the computer was programmed), the result will be what was
expected. Be especially clear on the logical grouping, i.e., where the parenthesis are
used. Also, spelling counts. If the programmer search for a “Yes” value, but the EMR
sends over a “Y”, the program will not evaluate the expression as True.
CII’s goal is to provide safe, accurate, cost- effective staffing decisions for adult in-patient
and adult critical care nursing units and provide a method of allowing charge nurses to make
equitable assignments for DCPs.
A strengths, weaknesses, opportunities and threats (SWOT) analysis was completed to assess
the strengths and weakness, within SVMH, and opportunities and threats, outside SVMH, with
regard to the CII implementation (Appendix E SWOT Analysis). Internal strengths of the project
included the strength of the IT department, the commitment of the core project team and the
relationship with the industry partner. SVMH has a history of being an early adopter of
technology having had an electronic documentation system for two decades. The IT department
at SVMH supports most systems in the organization. Very little support is provided by outside
entities. Expected weakness the team recognized were the challenge of gaining acceptance of a
new process by the end users and the lack of a template for creating the CII. External
opportunities included the potential for improving working relationships with industry partners
and the potential for developing a blueprint for integrating separate technology solutions from
different vendors. The most pressing external threat was lack of clarity around the amount of
support SVMH would receive from their industry partners to develop the CII.
Leadership needs
To understand the importance of any PCS, nurse leaders must understand that, while the
midnight census may frequently be used as a standard for budgeting, the midnight census is
rarely accurate enough to be used for planning staffing needs on a busy, acute care nursing unit.

CLINICAL INFORMATION INTERFACE
26
The midnight census is based on volumes of patients in bed, on a specific unit, at a specific time
and does not consider the number of patients transferred into or out of the unit or admitted and
discharged. Additionally, the midnight census makes the assumption that all patients have the
same care requirements; not reflecting any of the nursing interventions or professional services
delivered to the patients.
A PCS attempts to measure the actual workload, based on previously validated criteria.
As a result, improved staffing decisions, based on objective data can be made by leaders; thus,
the PCS supports improved patients and caregiver satisfaction, budgets and effective staffing
plans. The primary need a PCS meets, for leaders, is the ability to use data to make proactive
decisions about staffing. The result should promote consistent, repeatable practices that improve
the quality of care and provide accurate data for budgeting purposes; concepts most valued by
the DCPs and leadership alike.
Past system changes
Acuity can be defined as the level of nursing care requirements that guides projected
nursing staff resources. Patient classification is a methodology that groups patients according to
their need. Patient need is based on the patient acuity. A PCS should take into consideration only
direct time, hours of care or service provided directly to the patient. Hours for those staff
working to support direct caregivers, such as the nurse manager and unit secretary, should not be
considered in the acuity.
The PCS SVMH had in place prior to the CII was developed by a nationally recognized
expert in leadership and the development of effective evidenced-based processes and systems for
patient care. Each area, M/S, CC and Women’s and Children’s, utilized DCPs to build an
instrument specific to the respective specialty area. Each instrument included dimensions of care,
for example, Cognitive Status. Each dimension included patient care needs and interventions the
patient required to meet the needs. For each of these dimensions, a 1 to 5 level was determined,
(Appendix F Patient Care Needs Intervention Matrix). Once the levels of intensity were
developed, the instruments were taken to the individual nursing units where DCPs validated their
workload by rating the amount of time required to complete each patient intervention. The data
was used to develop an individual instrument for each specialty area.
Cost/Benefit analysis

CLINICAL INFORMATION INTERFACE
27
The first opportunity SVMH’s industry partner would have to implement the CII in a
hospital setting would be with this project. For that reason, the industry partner chose to bear a
portion of the costs of the project, by providing the programmers for the expression building and
RN experts as team leads. Team members employed by SVMH were authorized to work on the
project, as a portion of their regular duties; therefore, no true project budget was developed prior
to the onset of the project. The SVMH IT department; considered a support department by the
organization, had the overall departmental cost paid out of overhead dollars collected from each
cost center.
While the PLN was not required to develop a budget for the project, efforts to associate
all costs of the project for later analysis were made. All team members providing support to the
project, other than the industry partners, were considered in the cost of the project. In considering
the costs and benefits of implementing the CII the team leader determined that if Nurse
Managers used data to improve staffing decisions a significant reduction in costs related to day
to day overstaffing would result.
Expenses
SVMS did not pay the industry partner fees normally associated with the implementation
of the CII. Eight RNs were approved for 80 hours of work for a total of 640 hours. At an average
rate of $65/hour that equaled $41,600 (Appendix G Cost Benefit of CII Implementation). To
keep them separate from unit budgets, the labor hours associated with nurses was charged to the
Nursing Administration budget. These hours were approved for the development of the Adult In-
patient and Adult Critical Care instrument. Much of the support of implementation was provided
by the industry partner and had no financial impact on SVMH.
Additional costs anticipated after implementation of the CII were based on the outcome
of the acuity committee meetings, required updates and auditing. In the event additional work
was required by the direct care provider group, additional costs were likely to be incurred.
Nurse informaticists, nurse manager, director of clinical informatics and nurses completing the
open chart audits have all been included at the amount of hour’s required and average rate of pay
over the next three years of the project. Direct care nurses and auditing nurses were members of
the unions and contractually, have annual 2.5% pay increase. The pay increase will need to be
taken into consideration as part of the cost of the program. Though team members that were not
CLINICAL INFORMATION INTERFACE
28
union members were not guaranteed a pay increase, a 2.5% pay increase was reflected in the
budget. At the start of the project, the cost of the build was expected to be approximately
$90,217.
Savings
Cost savings estimates were based on an expected decrease in incremental overtime,
amount of the Nurse Manager’s time devoted to making staffing decisions and/or investigating
and explaining productivity variances, decreasing accidental overstaffing and time no longer
needed to meet with state regulatory bodies (Appendix G Cost Benefit of CII Implementation).
The CII/PCS implementation included an upgrade of the Assignment Screen. Upon project
implementation, charge nurses will be required to assign patients in the PCS using the
assignment screen. The PCS associates the acuity hours of need by patient. The DCP has a
specific amount of time to provide care to patients. Typical nursing shifts were eight or twelve
hours long. As each patient was assigned to a DCP, the remaining amount of time the DCP has
available to provide care to additional patients during the shift decreases. A DCP scheduled to
work from 7:00 a.m. until 3:00 p.m. had the capacity to provide eight hours of care to patients.
The capacity of the DCP to provide care decreased as more patients were assigned. The upgraded
assignment screen will allow the charge nurse to visualize the amount of hours of care for each
assignment, facilitating the charge nurse’s ability to make safe, equitable assignments. The
concept of equitable assignment was an important change in the culture at SVMH. Prior to the
CII/PCS assignments were often made by location (patients in rooms in close proximity were
assigned to one DCP) or by DCP’s convenience (the DCP was assigned the group of patients
assigned the day before) and workload was not taken into consideration. Frequently, assignments
were not equitable and resulted in incremental overtime (IOT) by DCPs with the heavier
workload. The upgraded assignment screen allowed the charge nurse to visualize the workload of
each DCP and make equitable assignments resulting in decreased IOT.
IOT was approximately 40 hours/pay period on each of the six units where the CII would
be implemented. The average nurse at SVMH earned $65/hour. IOT was paid at a premium;
averaging $97.6/ hour or $3,904/unit/pay period or $101, 504 annually, for each nursing unit.
The total cost of IOT of the six units was $609,024. Additional causes for IOT include late
admissions and changes in patient conditions and not all IOT could be attributed to inequitable

CLINICAL INFORMATION INTERFACE
29
assignments. A review of how assignments were made by the charge nurses revealed that the
majority of the charge nurses made assignments based on the location of the patients and DCP
preference. Rarely was the condition of the patients and equitable assignments taken into account
when assignments were made. An assumption was made by the PLN that approximately 20% of
the IOT could be related to inequitable assignments, causing DCPs to stay past the expected
length of their shift in order to complete work. An annual decrease in IOT by 20% or $121, 805
was predicted as a result of the CII implementation.
Frequently, overstaffing was related to errors in projecting the staffing needs for the
previous shift by Nurse Managers and others making staffing decisions. The CII/PCS was
expected to provide data the Nurse Managers required in order to improve staffing decisions and
decrease the amount of overstaffing errors. One RN overstaffed on an eight hour shift, each pay
period, due to imprecise staffing estimations, at the average nurse’s salary equates to $520 a pay
period. Applying this over 26 pay periods and six units results in potential of $81,120 savings.
Conservatively, 20% annual savings related to overstaffing or $16,224 was predicted.
An informal survey of the Nurse Managers from M/S and CC estimated spending ten
hours a pay period attempting to predict staffing. At the average Nurse Manager $75/hour, pay
rate, ten hours equaled $750/pay period. Over 26 pay periods and six managers, was the potential
of to $117,000 savings. An annual 20% savings or $23, 400 was predicted.
In late 2013, the California Department of Public Health (CDPH) visited SVMH,
following an anonymous complaint. The complaint claimed SVMH did not meet the California
regulatory standard for hospitals to implement a PCS reflecting patient care needs which are
based on the RN’s assessment. Nurse leaders searched through six months of paper staffing
records to show that SVMH had complied with the law. Claims of unsafe staffing were
unsubstantiated. Through the experience SVMH’s nursing leadership recognized the automation
of the PCS would provide improved method for record keeping and improve the ease in which
records could be retrieved in the future. The CDPH visit was another impetus for SVMH to
implement the CII
Without an upgrade or change in the way the PCS is used, SVMH could anticipate
another visit from CDPH. The time needed for the previous survey was approximately three
hours and involved the CNO and several directors for a total cost (of salaries) of $1,218. This

CLINICAL INFORMATION INTERFACE
30
cost would be saved during the first year of the CII. Total cost savings over the next three years
is $497,330, for a net savings of $407,113 over the course of the first three years of the project
(Appendix G Cost Benefit of CII Implementation).
Implementation of the Project
The aim of the project was to develop a series of conditional and logical expressions that
interprets clinical charting, physician order, and medication administration data and translates
this information into one of five intensity levels for each of the eight PCS care categories
(Cognitive, Self-Care, Emotional/Social/Spiritual, Pain & Comfort, Family, Treatments &
Procedures, Transition, and Care Coordination). The patient classification instrument data
elements were mapped to the appropriate EMR data elements by the DCP. Missing data elements
were identified within the EMR. Those data elements were subsequently configured for mapping
so that the instrument could provide appropriate acuity. Once mapping was complete,
expressions were developed by programmers to allow the data elements mapped from the EMR
to be interpreted into a specific amount of time required for each element and represented by a
number in PCS.
Upon completion of the build, the PLN and industry partners led a team of DCPs,
different from the ones who participated on the build, in completing open chart audits. Results
from the CII and the open chart audits were compared. Discrepancies were reviewed by the FSA,
RNI, PLN and industry partners to understand the rationale and appropriate changes were made.
The work breakdown structure (WBS) defined the discrete work elements necessary to
organize the scope of this project starting with the design of the project charter and approval by
the executive sponsor (Appendix H Work Breakdown Structure). The project charter described
statement of work, the scope of the project and the authority framework authorizing this project.
As no template existed for this work, an additional tool used as a time line, entitled CII
Implementation Check list was also used in order to track additional deliverables not accounted
for in the WBS.
The next phase included the preparation and planning for the project. The project
required the work of several disciplines and an industry partner and therefore required several
work teams be established to achieve scheduled deliverables and gain acceptance by the end-
users. RN’s who provide direct patient care, RNs from informatics, IT staff, nurse leaders and

CLINICAL INFORMATION INTERFACE
31
leaders and IT experts from the industry partner must all be included in this project design and
rollout. Participation from the teams was essential in creating a well-orchestrated project plan
and timeline with agreed upon milestones (Appendix I Gantt Chart) to achieve success.
Executive team approval was required prior to commencement on the project.
The majority of the initial work required to implement a system that provides data that
was being continuously received from the EMR, including orders from CPOE, medications from
the eMAR and relevant nursing documentation, was performed by the DCPs (RN experts),
informatics RNs and industry partner experts. Preparatory time was spent in meetings with the
project leads and various team members, in the form of teleconferences during the length of the
project. Each team member was required to identify the barriers to achieving the milestones
necessary to achieve the implementation timeline.
The PLN was ultimately responsible for the project including the timeline, quality
assurance and any risk management and mitigation strategies. Disseminating information with a
change of this magnitude was essential. To ensure the project had the support of the leaders,
Nursing Managers and Directors from the three areas were made aware of the process
improvement strategy during a “boot camp” led by the industry partner (Appendix J Boot Camp
Agenda). The goal of the boot camp was to inform Nurse Manager/Director stakeholders of the
proposed CII, including the anticipated benefits. The first of quarterly scheduled meetings of the
Acuity Committee meeting, held shortly before the implementation of the project, was focused
on education. At least half of the Acuity Committee’s members were DCPs. The goal was to
initiate education of the end user; essentially developing super users. Additional education was
provided in the form of small group and 1:1 sessions for all end users (direct care providers,
nursing supervisors and nurse managers).
The go live date for the M/S instrument was December 18, 2013. The industry partner
committed to being on site from December 16-18th
. In preparation for the go live, on December
16, 2013, a required upgrade of the system and testing was completed. SVMH’s industry partner
assisted with the live install and provided support during and after the install. Once the install
was complete, the clinical elements and expressions needed to be extracted from the test
environment and imported into the live environment. The industry partner assisted with the copy
process. When the clinical elements and expressions were in the live environment, the CII feed

CLINICAL INFORMATION INTERFACE
32
from the EMR was directed to the live PCS. Once the data feed from the EMR the industry
partner monitored the CII feed and population of data into the PCS for the next twenty-four
hours. The CII/PCS was initiated, the go-live, after confirmation of the systems functionality. At
this point the DCPs no longer needed to manually enter data into the PCS; however, charge
nurses could manually override the automated classifications, if the DCPs disagreed with the
rankings.
As much of the CII/PCS data came as a result of the RN documentation; concern from
the DCPs participating on the project that missed documentation would cause missed data
elements in the CII/PCS. Those missing elements could result in inaccuracies in the
classifications. A messaging campaign targeting the DCPs was initiated prior to the go live date.
The messaging included documentation teaching points identified by the DCPs involved in the
mapping process. Included in the messaging was a reminder that, as a new system, the PCS was
imperfect and needed to be in the live environment in order to assess the accuracy and
effectiveness and ultimately make improvements.
Planning the Study of the Intervention
Planning the study of the intervention required strong organizational skills and flexibility
of the team members for several reasons. The DCPs on the team were removed from their
schedules in order to participate on the team. Arranging schedules for the DCP’s participation
often caused the timeline to change. For all other team members, the project was in addition to
already busy schedules. On several occasions, the CII project did not take priority, causing
multiple delays in the timeline. Though the industry partners were facilitating the development of
the CII having part of the team located across the country and the need to submit requests for any
work to be completed (work orders) also added delays.
After several changes in the implementation dates, the PLN and the IPPL made a
commitment to implement the CII before the end of the calendar year, regardless of any
necessary upgrades. Once that commitment was made, the team was able to stay close to the
timeline. The PLN regularly collaborated with the industry partner expert to determine the best
methods for evaluating the project.
The allocated time frame was ten months from inception to final evaluation. The Project
Plan and the CII Implementation Checklist were employed to set milestones and monitor

CLINICAL INFORMATION INTERFACE
33
progress. The possibility of the CII was discussed by the organization and industry partner
project leads during April and May 2013. The preparatory phase of the project was completed in
October 2013, including presentations by project leaders to organizational union leadership and
nurse leaders, including the boot camp. Phase1of the project included the development of
expressions in four of the eight dimensions of care, requiring labor time by RN experts and
informatics staff which was completed in November, 2013. Phase II included building the
remainder of the expression for the Adult In-patient instrument and was completed in December
2013. A “soft go-live” occurred on December 18, 2013. The soft go live was defined as the Adult
In-patient tool being active in the live environment; however, the data were not used as a
reference to make equitable assignments or to make staffing decisions. The team monitored the
data, conducted manual chart audits and initiated staff education. Specific timeline information
was outlined in the Accountability Table (Appendix K).
Methods of Evaluation
Creating evaluation metrics and process measures for data capture and analysis was
crucial to determining the success of the program. Metrics were captured and periodically
analyzed for trends. Metrics included manual chart audits; CII and DCP cross -comparing acuity
rankings, reports generated from the PCS, productivity data, face validity and Acuity Committee
member feedback. Nurses participating with the mapping were surveyed, to understand their
perceptions of benefits of participating in the mapping. DCPs were to be surveyed to understand
their perception of assignments after CII was implemented.
Manual chart audits
Much of the work for the project was completed in a test environment. The test
environment was generated by creating patients with similar diagnoses, orders, and
documentation requirements as the typical patients admitted on the M/S and CC units. The test
environment simulated the real environment and was beneficial for trialing the effectiveness of
the CII without causing disruption in the actual environment. However, the simulated
environment had limitations to its usefulness. For example, data entered in the simulated
environment were all entered at a single time. Actual hospital patient charts were episodic in the
rate information is entered; doctors were likely to enter orders at any time; while the RN

CLINICAL INFORMATION INTERFACE
34
documented several times during a shift. The CII needed to be made active in the live
environment, “turned on”, to allow the team to assess its functionality on real patients.
Upon going live with the CII a group of DCPs were asked to complete chart audits to
determine the patient’s acuity. In an effort to prevent bias, different DCPs participated in the
chart audits from those participating in the mapping. The acuity rankings of the CII were
compared to the acuity rankings of the manual audits.
Reports
Four reports: Comparison, Assignment, Unit Workload and Inter-Rater Reliability are
reports the PCS offers that were to be used to assess the effectiveness of the implementation. The
Comparison Report (Appendix L) presents the hours of need, as predicted by the PCS, in
comparison with the amount of hours that were scheduled and/or worked. The hours were
grouped by coverage period and skill. Assessment of the CII/PCS using the Comparison Report
would be completed by comparing the hours projected versus the actual hours scheduled and/or
worked. The numbers should be very similar, if staffing decisions were made using the hours of
need as a guide.
The Assignment Report (Appendix M) lists the patients assigned to DCPs and which
DCPs and patients were left unassigned. Upon project implementation, charge nurses were
required to enter the DCP’s assignments in the PCS. The PCS associates the acuity hours of need
by patient. The DCP was scheduled a specific amount of time to provide care to patients.
Typically, the shifts were eight or twelve hours long. As the patients were assigned to a DCP, the
amount of time the DCP had left available during the shift decreased. A DCP scheduled to work
from 7:00 a.m. until 3:00 p.m. had the capacity to provide eight hours of care to patients. The
capacity of the DCP to provide care decreased as more patients are assigned. The Assignment
Report shows the amount of hours of care for each assignment, allowing for an assessment of the
charge nurse’s proficiency in making safe, equitable assignments. Assessment of the CII/PCS
upgrade using the Assignment Report would be completed by noting equitable assignments were
consistently made by the charge nurse. The numbers should be very similar, if staffing decisions
were made using the hours of need as a guide.
The Workload Summary Report (Appendix N) was run for a specified period of time to
provide a summary of the workload, grouped by coverage period, for the unit chosen. Census

CLINICAL INFORMATION INTERFACE
35
information, admits, discharges, the unit’s classification percentage, projected need and a view of
how the scheduled and actual hours line up in comparison was included in the report. Prior to the
implementation of the CII/PCS, staffing decisions were made by using a census based staffing
guide and requests made by DCPs. The result was a suspected misalignment between the hours
of DCPs required based on the acuity of the patients and the mandated RN: PT ratio and the
actual DCP hours used. When staffing decisions are based on the CII/PCS data, an alignment of
the number of acuity hours needed and the total number of hours required should result.
The Inter-rater Reliability (IRR) Report (Appendix O) was run for a specified period of
time and depicted the percentage of agreement among two DCPs rating the same patient through
the IRR process. Details include which of the eight specific dimensions, if any, were rated
differently through the separate classifications. Prior to the implementation of the CII, IRR was
used on a regular basis to assess the validity of the PCS instrument. Upon the implementation of
the CII, the PLN and industry partner expert determined that, with the automation, a different
methodology for assessing the PCS’s validity was required.
Productivity reports, face validity and cross-comparison
Productivity reports used by the Nurse Managers will be used to assess the effectiveness
of the CII/PCS. Improved accuracy in staffing should decrease the amount of overtime and over
usage of DCPs. The productivity of each area was expected to be more in alignment with
budgetary expectations.
A primary concern for the team was acceptance of the data by the DCPs. A methodology
to determine if the DCPs agreed with the acuity ratings from the CII/PCS was developed. The
tool was called the Face Validity Survey (Appendix P) and required the auditor, the charge nurse
and the DCP to use their judgment to rate each assignment on a scale of light, average or heavy.
Each response was compared to one another and to the acuity rating from the CII/PCS to
determine how closely the RN’s judgment was aligned with one another and the CII/PCS.
When the DCP disagreed with the automated acuity ranking and manually classified the
patient, the team would need to investigate the cause of the discrepancy. A cross-comparison of
the two rankings was required to determine what dimension the discrepancy occurred. Once the
dimension was identified, further drill down to determine the cause of the discrepancy was
identified. One cause for the automated ranking to be low, found during a cross comparison was

CLINICAL INFORMATION INTERFACE
36
documentation lapses by the DCP, resulting in the CII/PCS not taking into account required
elements of care. An example of cause for the automated ranking to be too high, found during a
cross-compare was discontinued medications continuing to be included in the patient’s needs.
Appendix Q illustrates an example of a cross-compare.
Analysis
At the time of this writing, the CII/PCS was implemented in three M/S and three CC
units and the DCPs have access to view the data. However, the data were not being used by the
Nurse Managers to guide staffing decisions. It was for that reason only a portion of the
evaluation methods were analyzed.
Qualitative evaluation methods, such as the chart audits and the face validity were
analyzed and can help to determine if the DCPs feel the CII/PCS accurately rates the patient’s
needs; however, most quantitative assessments which were based on using the CII/PCS to guide
staffing decisions were not yet assessed. Initial chart audits reflected the CII/PCS ranking higher
acuity levels than the DCPs rankings. Upon reflection, the team believed that since the mapping
was done prospectively, the DCPs involved in the mapping, concerned that the CII/PCS “give
credit” for all the care that may be required, over ranked many elements, causing rankings to be
artificially high. After the chart audits, the team reviewed the expressions and made the
appropriate edits. The open chart audit was repeated, with results appearing to be more in
alignment with the CII/PCS.
Face validity audits were conducted. DCPs were used as auditors. Using an audit form
which identified the unit, the DCPs and assignments listed, the auditor was directed to assess the
unit and the DCP and rank the assignment as light, average or heavy. Next the charge nurse
assessed each assignment, followed by the individual DCPs, using the same descriptors. Sixty-
eight assignments were reviewed during the face validity audits. Of the 68, 44 of the assignments
had the same rankings from all three nurses and the acuity system. Twenty-two assignments had
two of the three nurses agreed and the CII and two assignments had no agreement between the
nurses and the CII. The charge nurse disagreed with the CII fifteen of the twenty-two times a
disagreement between a nurse and the CII was noted. Typically, the DCP and the auditor agreed
with the CII. Of the seven instances in which the DCP did not agree, one or more of the patients

CLINICAL INFORMATION INTERFACE
37
in the assignment was noted to be confused and/or agitated. The DCP’s impression of the patient
being “heavy” was apparent even if a sitter was in attendance.
The education for the charge RNs was completed immediately prior to the submission of
this paper. The Assignment Report reflects a greater than 90% compliance rate by the charge
RNs for making assignments. Charge RNs understand how to make the assignments in the PCS.
Analysis of the Assignment Report indicates that DCPs continued to be assigned patient loads
that require more time than the length of the shift. Minimal change in the way charge RNs make
assignments had occurred in spite of the ability for the charge RN to see the patient’s needs in a
particular assignment requires more time than the DCP had during the shift.
The Comparison and Workload Summary reports were reviewed to determine probable
future savings when staffing decisions were made using the PCS as a guide. The reports reflect
overstaffing averaged one RN and one nurse assistant (in areas that used nurse assistants) every
shift, every day. The total overage for all six areas totaled 17 RNs and 15 nurse assistants for
every 24 hour period. The PCS considers the amount of care required by the patients and equates
that number to the amount of staff required. For example, on October 10, 2014 the Intensive
Care Unit (ICU) had a census of 10 patients who required at total of 44.3 hours of care during the
12 hour day shift. The ICU is an all RN staff. The PCS indicated the need for 3.01 RNs, yet
seven RNs worked that shift. Why were four additional RNs working that day?
The PCS does not take California’s RN’PT ratios, which limits RNs in an ICU to no
greater than two patients, into consideration. With a census of 10 a minimum of five RNs were
required. Once ratios were taken into consideration, the actual overstaffing was now two RNs,
not four. Aside from RN; PT ratios, organizational and unit standards needed to be considered.
SVMH’s standard was to have a charge RN, not assigned to patients, on every unit. With that
taken into consideration, the ICU required six RNs for that shift and were only over by one RN.
Another example of unit standards that needed consideration was types of patients, despite the
time of care calculated by the PCS, the unit considers should be staffed at a higher RN; PT ratio.
In SVMH’s ICU RNs caring for patients immediately out of surgery after having open
heart surgery and patients receiving continuous renal replacement therapy were only assigned
one patient. Nurse Managers indicated that often the overstaffing occurred as a result of
anticipated patient admissions. Anticipated admissions could be real (patients scheduled for

CLINICAL INFORMATION INTERFACE
38
surgery and will be admitted afterward) or potential (assumptions that the Emergency
Department will be busy). None of these instances occurred on October 10th
. The conclusion was
that the ICU was overstaffed by one RN on that shift.
After similar analysis of all the units over a month’s time, the conclusion was that SVMH
overstaffed an average of six RNs and five nurse assistants each day. Calculations were made
using an average RN salary of $65 per hour and nurse assistant salary of $22 per hour. The ICU
RNs worked 12 hour shifts and the calculation s for each shift was based on 12 hours. In all the
other areas, the staff worked eight hour shifts and the calculations were based on eight hours.
The cost savings to be realized by not overstaffing one RN and one nurse assistant each day
totaled $1, 554, 900 (Appendix R Revised Cost Savings of CII). Based on this calculation, the
PLN and industry partner leads scheduled a meeting with the CNO and CFO to review potential
benefits of using the CII/PCS to the full potential.
Results
Program Evaluation and Outcomes
The settings spanned the second year of the University of San Francisco’s Executive
Leadership Doctor of Nursing Practice program and the six in-patient nursing units at SVMH
described earlier. The goal of the project was to implement the CII/PCS and the upgraded
assignment screen on the three M/S and three CC nursing units. The initial plan was to
implement the CII/PCS in M/S first, analyze the outcome and then implement in CC. The plan
changed shortly after the CDPH visit. The team believed that it to be prudent to implement the
CII in the live environment as soon as possible. Educating staff and completing analysis would
be more efficient if all areas could be done at the same time.
The change in the scheduled roll out (from implementation and analysis in M/S then
implementation analysis in CC to implementation in both areas then analysis of both areas) was
not the only change that occurred during the project’s implementation. Other changes from the
original plan included longer than expected time from start to implementation, SVMH took on a
greater than expected role in developing the instruments, leadership changes and the
determination that more education was necessary than initially planned. The assumption was the
CII/PCS would be complete in six months. The project took almost one year.
CLINICAL INFORMATION INTERFACE
39
The industry partner and SVMH did not have a formalized understanding regarding
expectations of how much of the workload each side would carry. Expression writing of the M/S
instrument was completed by the industry partner. When the CC instrument was to be completed,
the industry partner stated the work was to shift to SVMH. The team at SVMH understood that
the industry partner was to complete the mapping on both instruments. Two months went by
until the FSA was available to complete the work. Additionally, though a template from the M/S
development was made, information of changes and corrections that were made was not
available. The FSA and the RNI collaborated to develop a template and a method to ensure all
updates were documented.
As the timeframe extended beyond the initial expectations the team became increasingly
concerned about lack of acceptance and trust in the system by the DCPs. The PNL engaged the
Department of Education to assist with developing a structured education plan that included a
skills check list (Appendix S) and a Frequently Asked Questions (Appendix T). Additional
education classes were planned specifically to improve Nurse Manager/Director understanding
and support of the CII/PCS.
This author was designated lead of the PCS project in April of 2013. Work on the
CII/PCS started in October 2013. The CII/PCS went live in the M/S areas in December 2013 and
in the CC areas by July 2014. SVMH’s Nursing Department underwent three changes in twelve
months between the projects inception and this writing. With each change, work slowed while
the new leader was educated on the plans and anticipated outcomes. At the start of the project,
the team had no budgetary constraints. Following the second leadership change for Nursing,
DCP hours approved for the project were eliminated. All further work needed of the DCPs was
to be completed while on duty. This was a difficult task as most DCP were too busy with patient
care to complete audits. SVMH experienced organizational changes in leadership that resulted in
changes in reporting structure and changes in the PLI also slowed the project implementation.
The CII/PCS was created and implemented in the live environment. Two separate
technological solutions supported by different vendors were able to communicate and the result
was that data from the EMR was translated by the PCS to provide a guide for the number of staff
needed to adequately provide care to the patients on each unit. Though the charge RNs enter the
DCPs assignments in the PCS, additional support will be needed in order to have charge RNs

CLINICAL INFORMATION INTERFACE
40
make equitable assignments. When the CII/PCS is used to its full-potential SVMH should see
improved patient safety and improved staff engagement related to equitable assignments and cost
savings related to staffing decisions based on the data provided.
An alternative change strategy was to revert back to the manual entry by the DCPs and
discontinue the CII. The idea was briefly discussed when the Nursing Leadership was evolving.
Meetings with the PNL, industry partner leadership and SVMH’s leadership and union leaders
assured all parties involved that the benefits of the CII/PCS was worth continuing with the
project’s implementation.
Discussion
Summary
Key successes/Key challenges
Key successes of the project included a sense of urgency by SVMH’s leadership,
Organizational commitment to improve productivity outcomes, strong industry partner
relationship and the commitment of the project implementation team. The SVMH RN union
leadership verbalized concerns that staffing decisions were based on census. Regulatory
standards require staffing be based on the acuity of the patients. This was a topic at monthly
Labor-Management meetings for several months. The concern was not entirely factual. The
foundation of staffing at SVMH was based on census-driven matrices put in place in 2012. The
staffing matrix wasn’t the only component involved in staffing decisions. Also true was the
practice of the staffers to overstaff each unit in case additional patients were admitted. The
overstaffing practices resulted in high overtime percentages with most Nurse Mangers reporting
overages in productivity metrics. The California mandated RN: PT ratios coupled with the
overstaffing, resulted in units rarely being staffed efficiently. In fact, most often, units were
overstaffed. SVMH’s leadership could show regulatory compliance with paper staffing records;
however, collecting the paper work was labor intensive and on rare occasions, pages were
misplaced. Nursing leaders felt a sense of urgency for an easier way to maintain and retrieve
evidence of regulatory compliance, explain the process to union leadership and improve staffing
efficiencies.
Two additional key successes in implementing the CII/PCS were the strong industry
partnership and the enthusiasm and commitment to the project by many of the project team
CLINICAL INFORMATION INTERFACE
41
members. SVMH and the industry partner involved had a history of positive working
relationships and collaboration. Implementing the CII was a natural part of that partnership. The
industry partner was interested in the implementation of the CII/PCS and needed a hospital to do
so. For that reason the industry partner was willing to assist SVMH with the implementation
without charging for the CII process. As the project neared implementation all team members
participated in weekly and then daily phone calls to review reports and make corrections. The
PLI, RNI and many of the DCPs were excited and committed to the project from the onset.
Though the implementation of the project took longer than expected, success came in large part
due to the commitment of the team members. In spite of very busy schedules, team members
continued to make time to work on the development of the CII.
Key challenges to the project’s success included the lack of a template for the work, lack
of a project manager/project plan and the lack of consistent organizational leadership.
Implementation of the CII was an alpha project for both SVMH and the industry partner. While
the idea of how to develop the CII was in place, the fact that no one on the team had actual
experience and no guide existed elsewhere made the implementation challenging, required parts
of the development to be done by trial and error. As a result of the expertise of the industry
partners and the commitment of the team members, delays related to this were limited.
The lack of a true project manager/project plan was challenge and was the major cause of the
timeline delays. The previous lead of the PCS project at SVMH reported many obstacles with
nurse leader engagement and understanding expectations of the PCS. This author faced the same
obstacles.
During the length of the project, nursing leadership changed three times. Each change
resulted in a delay in the project implementation while the new CNO met with union leadership
and the implementation team and was informed of the current implementation plan. With each
leadership change, the delay was approximately two months before the PLN was able to confirm
approval for DCPs to continue work on the project. In addition to the leadership change in
nursing, other changes took place that caused delays. Oversight of SVMH’s Informatics
department changed two times during the project’s implementation. At the start of the project,
the PLI reported to the CNO, who supported the project. Immediately after the initiation of the
development of the M/S instrument, the PLI began to report to the COO. The COO required a

CLINICAL INFORMATION INTERFACE
42
briefing about the project. A few months later, the PLI was transferred back to the Nursing
Department. By that time, the third CNO was in place and explanations were required to obtain
approval for prioritizing the CII/PCS project implementation. No template for the work existed, a
project lead with little formal project management experience and multiple leadership changes
were significant barriers that caused the project to be delayed, taking twice as long as expected to
implement the CII.
Lessons learned
Over the course of the year spent developing and implementing the CII/PCS project,
several lessons were learned. Implementation of a project such as the CII/PCS could have been
completed in six months, rather than one year, if the following existed: clear responsibilities and
expectations, a project manager and clear definitions of success to all parties involved. The most
important and perhaps the most obvious lesson learned by the PLN was ensuring the clarity of
work to be completed by the industry partners and the organization and has been discussed in
earlier sections. A project manager, someone whose responsibility it was to create clear and
obtainable project objectives, build project requirements and manage the constraints (including
timelines, costs and scope) would have been helpful and perhaps mitigated much of the other
issues that caused project delays. A project manager would have better understood the processes
requiring completion before project implementation objectives could be met. A project
manager’s skills were especially needed when projects involving several disciplines and
organizations were involved.
The American Organization of Nurse Executives’ (AONE) Guiding Principles for
Defining the Role of the Nurse Executive in Technology Acquisition and Implementation
(AONE, 2009) recommends integrating patient safety and quality into the return on investment
analysis, to insure staff understand the benefits and objectives and assuring the objectives are
measurable prior to the start of the project. The project leads would have benefited from AONE’s
recommendation of clearly defining success before work on the project started. Each participant
had their own perception of success. The FSA saw success when the CII/PCS was implemented.
The PLN, IPPL and industry partner expert saw success as the CII/PCS was implemented, the
data were used as a guide to workforce management (with supporting data) and the DCPs trusted
the system. Many DCPs stated success to them was when the CII/PCS reflected additional DCPs

CLINICAL INFORMATION INTERFACE
43
were required. The CFO saw success as an improvement in productivity in the nursing
departments using CII/PCS. The CNO saw success when the DCP union leaders no longer made
PCS an agenda item at Labor/Management meetings. The vision of success may not have
changed for each party concerned. However, understanding the motivation for each stakeholder’s
interest in the project and clarity by the team members of what was needed for success would
have helped the PLN when discussing the project with the different groups.
Sustain/Replicate gains
Improved accuracy, consistency and timeliness of data entered into the PCS to facilitate
efficient staffing decisions were the primary gains from implementation of the CII. The
implementation of the CII/PCS was intended to improve patient outcomes, staff engagement and
productivity outcomes. Additional time was required to before the CII/PCS was developed and
implemented. Keeping in mind the lessons learned from SVMH, the industry partners would be
able to replicate the CII in other organizations, using the same and different EMR.
Structures that SVMH did not have and were created during the process would facilitate
an increased rate of implementation as the CII/PCS is replicated elsewhere. An example was the
“Expressions Configuration Instrument” which was a record keeping tool used to track
expressions as they were created or changed.
Implications for advanced nursing practice
The PPACA (2010) becoming law challenged hospitals to improve quality outcomes
while reducing the cost of care. The Institute of Medicine’s Future of Nursing report (2011)
suggested RNs partner with other healthcare professionals in an effort to redesign the US
healthcare system and be accountable for their own contributions to deliver high-quality care as
efficiently as possible. RNs are uniquely positioned to have an impact on both the quality and
cost of healthcare. The CII project’s goal was an example of how nurses can not only partner, but
take the lead, in meeting the challenges healthcare faces. The CII project was an effort to
integrate the EMR and the PCS, each supported by a different vendor, to improve workforce
management at SVMH. Additional possibilities as a result of the project include setting a
template for others to continue work on the integration of the multiple technological solutions
within hospitals and improved working relationships between organizations and their industry
partners.

CLINICAL INFORMATION INTERFACE
44
Relation to Other Evidence
Hospitals have many technological products and from different vendors. The CII project
was an effort to integrate the EMR and the PCS each supported by a different vendor to improve
workforce management at SVMH. Evidence was sought to gain a full understanding regarding
how to integrate two different technological solutions; however, no template for the work
existed. The review of the evidence focused on better understanding RN: PT ratios and nurse
staffing’s relationships to patient outcomes, patient classifications systems and the how nurses
accept technology.
A plethora of literature, from many different countries, existed exploring the relationship
between higher RN hours to improved patient outcomes and survival rates of hospitalized
patients. Research has ranged from focusing on data from the RNs’ perspective to reviewing
national databases to determine patient outcomes. The literature strongly recommended
collaboration between RNs and Managers and policy makers to achieve safe staffing levels.
Many different PCS were in use throughout the world in an effort by hospitals to determine the
appropriate numbers of RNs were needed for their patients. Much was written about PCS;
however, no consensus for any specific tool existed and the literature seemed heavy on opinion,
anecdotal evidence and discussions on the topic and sorely lacking in research. That may partly
be due to the uniqueness of each patient’s needs, each DCP’s skill set/experience and each
environment. Each set of circumstances being so different, the time and cost researching
individual PCS would be difficult. In spite of this, efforts have continued in the search to find an
objective method for predicting RN workloads. The judgment of the expert RN continued to be
taken into consideration when making staffing decisions. Appendix B summarizes major
contributions in the literature.
Located in California, SVMH followed the RN: PT ratio legislation, when making
staffing decisions. SVMH also used an electronic PCS system, which was not used to facilitate
staffing decisions. Studies relating RNs to improved patient outcomes strengthened this author’s
belief that a PCS that provides accurate, consistent and timely data could be used to support
organizations to make appropriate staffing decisions. Enhancing the PCS by implementing the
CII would achieve that goal. A major concern was would the DCP’s trust the CII to lead the
decision making about staffing? Implementation of any PCS would not be successful if the end-
CLINICAL INFORMATION INTERFACE
45
user, the DCP, did not trust or accept the system. This question led the author to include
technology and technology acceptance by RNs in the review of the evidence.
The development of the CII/PCS added to the evidence in several ways. First, the
implementation of the CII improved the quality of the data used for workforce management by
decreasing the barriers of timeliness, accuracy and consistency of traditional PCS. As the RN
documented, orders were entered and medications entered into the eMAR. The information was
available for PCS interpretation of a specific level of acuity. Second, the CII/PCS project team
agreed with Fasoli & Haddock’s (2011) recommendation to use a combination of PCS and RN
judgment in making staffing decisions. Better decision-making for staffing was a result of the
CII/PCS; however, hospital, in-patient nursing units were dynamic, busy places. The status of a
patient changed at any time. If the DCPs were busy providing care to patients and had not yet
documented, those data elements would not be available to the CII and the data may be
inaccurate. RNs were required to use their judgment in addition to the CII/PCS to ensure proper
staffing was provided. Finally, Huryk’s (2010) study implied the need to involve RNs in system
design in order to improve post-implementation satisfaction. DCP RNs participated in the
development and implementation of the CII/PCS. In fact, the PLN specifically engaged two
DCPs considered being in what Rogers’ defined as the early majority or late majority group as
team members. Their participation on the team may have had a positive impact with some of the
DCPs when the CII/PCS was implemented.
Barrier to Implementation/Limitations
Many barriers to the implementation of the CII/PCS existed. Some barriers were known
prior to the onset of the project and some were not fully understood until after the project
commenced.
Known barriers
Barriers to the project’s implementation that the team was aware of prior to the start
included no template for the work being done, lack of clarity regarding the amount of time
required and lack of acceptance of the end-user.
No template for the work: There was consensus among the project team that Rogers’
Diffusion of Innovations theory could guide the implementation of the CII/PCS. The team had a
clear understanding of the aim of the project: to create and implement a clinical information
CLINICAL INFORMATION INTERFACE
46
interface between two software solutions, by different vendors, that allowed EMR data to
provide source data for the PCS. The end result was envisioned to be a fully automated
classification system where DCPs would no longer be required to manually enter data into the
PCS. In addition, timely, accurate and consistent, patient data would be available for decision-
makers to determine acuity, allowing for accurate staffing decisions and equitable assignments.
However, no template for the work existed and neither did an alternate plan for that potential
barrier.
The SVMH team members were to develop the CC instrument, after the industry partner
completed the work on the M/S instrument. At that point, the SVMH team realized no template
existed for the work that the industry partner completed. The FSA created a document entitled
“Expressions Configuration by Instrument” which was to be used as a tracking mechanism for
expressions as they were created or changed. This document was used as a guide for the duration
of the project to use as a reference for what expressions were used and where and to eliminate
redundancies.
Lack of clarity regarding the amount of time required: While time was approved for the
project and approval obtained to place the cost of the DCPs in an alternate cost center, the actual
time required for the project was unknown. With the industry partners writing the expressions,
the SVMH team member’s expected the development and implementation of the CII would be a
few months. Additionally, the SVMH team assumed the industry partner would develop both the
M/S and the CC instruments. The industry partner understood their commitment to be to develop
only one instrument. This misunderstanding increased the length of time of the project. An
estimated amount of time was approved and assurance of continued support, if needed, by the
industry partner was obtained. The alternate plan for uncertainty about the time required was a
verbal agreement with industry partners to provide additional assistance, if needed.
Lack of acceptance by the end user: Implementation of the CII was not the only measure
of success for the project. DCPs and Nurse Managers must trust that the data from the CII was
timely, accurate and consistent with the resulting decisions made based on the data benefiting
patient care and the organization’s bottom line. Education on the PCS, the CII and regulatory
implications were provided in a mandatory boot camp for Nurse Managers/Directors. The
CLINICAL INFORMATION INTERFACE
47
rationale for the boot camp was to expand the knowledge base of the nurse leaders in order to
support their staff. Education was also presented during the Acuity Committee meetings.
Unknown barriers
Barriers to the project’s implementation that the team was not aware of prior to the start
included lack of a tracking mechanism for the expressions, unclear understanding of work from
industry partners and SVMH and poor communication between project team and the end users.
Lack of a tracking mechanism for the expressions: Almost immediately after taking the
lead in the development of the CC instrument, the SVMH team learned there was no method to
track what testing and changes had been made during the development of the M/S instrument. As
the components of the CII were tested and changes were made, a method for logging the tests
and changes was required. A record of what changes were made and why was needed. A
document entitled “Expressions Configuration by Instrument” was created by the FSA. The
document was used as a tracking mechanism for expressions as they were created or changed.
An additional goal of the document was to eliminate redundancies.
Unclear understanding of work expected from each partner: An understanding of work
that was expected from the organization and the industry partner was vital to completion of the
project. Additionally, expectations of work completed by specific teams within the organization
should have been clearly defined. They were not. Again, as no template for the work existed,
lack of clarity around work expectation of each partner was anticipated. Unfortunately, the
clarity regarding the expectations of the work should have been discussed and contracted to the
extent that was known prior to the start of the project. Assumptions were made by both SVMH
and the industry partner. As the work continued with the development the CC instrument, role
expectations became clearer. For example, the first instrument was developed with a significant
amount of support from the industry partner. Additional instrument development was expected to
be developed primarily by SVMH.
Poor communication of project to end users: An announcement went out via the Acuity
Committee members at the initiation of the soft go live. Due to low compliance, the soft go live
did not impact most DCPs. However, DCPs who had manually entered data into the PCS
verbalized concern about a system change without previous knowledge. The team members,
Acuity Committee members and nurse leaders were encouraged to communicate with DCPs.

CLINICAL INFORMATION INTERFACE
48
This experience made the PLN understand the need to improve communication with the actual
project goes live. The Education Department was engaged to develop a formalized education
process, including a skills checklist and sign in sheet, to ensure every DCP was educated on the
CII/PCS. Additionally, an extra class was provided for nurse leaders and educators. Keeping in
mind the Diffusions of Innovation theory focuses heavily on communication, the early adopters,
many of them on the Acuity Committee, will be given speaking points to use to educate other
DCPs. Greater than 50% of the Acuity Committee team were DCPs and represented all in-patient
nursing units. In addition to the formal education, flyers, emails and word of mouth will be used
to communicate the CII/PCS process.
Interpretation
To say that the CII/PCS project has ended is to imply that alone, implementation of an
innovation makes a difference. What makes a difference is how people use the innovation. When
innovations do not have the outcomes expected, adjustments must be made to bridge that gap and
make the innovations user friendly. Many differences between expected and actual outcomes
were noted by the project team. Length of the project, changes in planned and actual use of the
assignment screen, additional reports required and the development of a new process were all
differences noted from the expected outcomes. The project time line was initially six months and
extended to one year. Reasons for the delays have been mentioned in previous sections of this
paper.
The Assignment Screen, (Appendix V) is the screen used by the charge RN to assign
patients to DCPs. The summary portion of the screen allows the viewer to visualize a summary
of the assignments made, staffing and skill mix required, admissions, discharges and transfers
and the classification summary. The expected use for the Staffing Summary was that it would
provide the user a quick glance at the amount of staff required for the patients. While the
Summary Screen does provide the number of FTEs required for the amount of time required for
patient care, the charge RNs and Nurse Managers don’t use the screen because it does not
provide an accurate reflection of staffing needs in a specific environment.
Aside from the amount of time required by the patient, state, organization and unit level
standards need to be considered when making staffing decisions. California’s RN: PT ratios
mandate the minimum number of patients assigned to each RN in a patient care area. SVMH’s

CLINICAL INFORMATION INTERFACE
49
standard is for every nursing unit to have a charge nurse that is not assigned to patients. Not all
nursing units at SVMH accommodate patients requiring intravenous insulin and the units that do
accommodate these patients require a RN: PT ratio of 1:3.
The Assignment Screen (Appendix U) depicts an in-patient unit with a census of 14. The
Staffing Summary indicates a need for 2.64 RNs. Based on the patient need alone, an assumption
could be made that this unit could be staffed with three RNs for the entire shift. The unit is a
telemetry unit. The mandated RN: PT ratio for a telemetry unit is 1:4. Taking mandated ratios
into consideration, the unit requires four RNs. SVMH’s standard is to have a charge RN without
a patient assignment on each unit. Taking the patient’s needs, the mandated ratios and the
standard of the organization, five RNs are required for this unit during this shift. More RNs could
be required, if patients were receiving insulin via intravenous drips. To use the Assignment
Screen’s Staffing Summary as effectively as possible, enhancements to allow for screen to be
individualized for a specific environment is required.
Another difference in the expected and the observed outcome is how variances in the
CII/PCS ranking and the DCP’s rankings are viewed. When the DCP disagree with the
automated acuity ranking and manually classified the patient, the team would need to investigate
the cause of the discrepancy. A cross-comparison of the two rankings is required to determine
what dimension the discrepancy occurred. Once the dimension is identified, further drill down to
determine the cause of the discrepancy was identified. Appendix Q illustrates an example of a
cross-compare. The CII ranked the amount of patient education the patient as a moderate
intervention, while the DCP ranked it as a minimal intervention. The result of this and several
other areas of misalignment between the CII and actual acuity was the patient was rated a level
four by the CII. The DCP manually classified the patient and the rating was a level two.
Once the variances are identified members of the team will need to investigate to
determine the root cause of the variance. A variance could be related to one of three reasons. The
first cause of variance is related to the DCP’s documentation. Elements for the classification are
taken from CPOE, eMAR and the DCP’s documentation. If the DCP does not document specific
elements, the CII cannot accurately rate patients. The second cause of variance is related to the
system itself. The system may be the PCS or the EMR. For example, each data element in the
EMR is unique. An upgrade of the EMR that results in a change in any data element will not be

CLINICAL INFORMATION INTERFACE
50
identifiable by the PCS. If the EMR has changed any data elements, the CII cannot accurately
rate patients. The third cause of variance is related to changes that will need the Acuity
Committee’s direction to resolve. In the case of the cross-compare example in Appendix Q, the
DCP rated the patient education required as a minimal intervention. The CII takes into account
each documentation entry of the DCP. The patient was being discharged and the DCP reviewed
all education the patient was provided during the entire admission. The DCP stated the patient
understood all the education provided. The CII is programed to account for each documentation
entry and rated the education as a moderate intervention. The Acuity Committee would need to
meet to determine how to accurately capture education provided into the acuity. Developing an
algorithm to determine the best method for resolution, the responsible party and an expected
timeline for resolution may facilitate the speed in which improvements are made.
An additional challenge with the cross comparison is that the only way to know if a DCP
manually entered a classification is to check each individual DCP’s assignment. This is a labor
intense process. The team has requested a Cross-Compare Summary Report that allows the user
to easily visualize any manually classified patients. Further, the report would identify the
percentage of variances per dimensions and expressions.
The IRR was run for a specified period of time and depicted the percentage of agreement
among two DCPs rating the same patient through the IRR process. Details include which of the
eight specific dimensions, if any, are rated differently through the separate classifications. Prior
to the implementation of the CII, IRR was used on a regular basis to assess the validity of the
PCS instrument. Upon the implementation of the CII, the PLN and industry partner expert
determined that, with the automation, a different methodology for assessing the PCS’s validity
was required. The cross-compare summary report could be that new methodology. A summary
report can be run periodically in order to identify the percentage of patients with manual
classifications. The variances can be identified. The Acuity Committee can meet to collaborate
on a resolution. Nothing can be done to change the time taken to implement the CII/PCS;
however, other improvements can help overall user acceptance.
Finally, the Cost/Benefit Analysis required a review and updating. The original
assumption was that using objective data to guide staffing would result in using one less
registered nurse in a 24 hour period. After the CII was in place an analysis of the data reflected

CLINICAL INFORMATION INTERFACE
51
that the organization overstaffed by a minimum of one registered nurse and one C.N.A. each
shift on each unit implementing the CII. That data resulted in a revision of the Cost/Benefit
Analysis (Appendix V).
Conclusion
Using the CII to overcome the barriers of timeliness, accuracy and consistency of
traditional PCS solutions will allow decision makers in hospitals to improve workforce
utilization. Expectations from this application include overtime reduction resulting from
improved staffing and higher productivity. The benefit of the CII/PCS is noted in the in-patient
nursing units; however, requests have been made by DCPs in the Emergency Department and
surgery areas for a classification system to help determine appropriate patient placement from
outpatient areas into in-patient areas.
Continued work developing the CII/PCS include moving to other hospitals with other
EMRs, improving and standardizing the implementation process and further developing the
integration of technological solutions from different vendors to improve the communication of
healthcare records. This experience was helpful in that such a large group of DCPs were
involved in making decisions that ultimately impact the hospital’s bottom line. RN partnering
with hospital leadership and other healthcare professionals to manage the workforce is essential
to the national initiative of improving the quality of patient care and decreasing healthcare costs.
Other Information
Funding
No funding sources were obtained in the design, implementation, interpretation and
publication of the project.

CLINICAL INFORMATION INTERFACE
52
References
Abdellah, F. G., & Levine, E. (1954). Work-sampling applied to the study of nursing personnel.
Nursing Research, 3(1), 1-6.
Aiken, L. H., Clarke, S. P., & Sloane, D. M. (2002). Hospital staffing, organization, and quality
of care: Cross-national findings. International Journal for Quality in Health Care, 14(1),
5-13.
Aiken, L. H., Sloane, D. M., Cimiottie, J. P., Clarke, S. P., Flynn, L., Seago, J. A., ... Smith, H.
L. (2010, August). Implications of the california nurse staffing mandate for other states.
Health Services Research, 45(4), 905. http://dx.doi.org/10.111/j.1475-6773.2010.01114.x
AONE, (2009). AONE guiding principles for defining the role of the nurse executive in
technology acquisition and implementation. Retrieved from http://www.AONE.org.
Bolton, L. B., Aydin, C. E., Donaldson, N., Brown, D. S., Sandhu, M., Fridman, M., & Aronow,
H. U. (2007). Mandated nurse staffing ratios in California: A comparison of staffing and
nurse-sensitive outcomes pre- and postregulation. Policy, Politics & Nursing Practice, 8,
238-250. http://dx.doi.org/10.1177/1527154407312737
Bolton, L. B., Aydin, C. E., Donaldson, N., Brown, D. S., Sandhu, M., Fridman, M., & Aronow,
H. U. (2007). Mandated nurse staffing ratios in California: A comparison of staffing and
nursing-sensitive outcomes pre and postregulation. Policy, Politics, & Nursing Practice,
8, 238-250. http://dx.doi.org/10.1177/1527154407312737
Coffman, J. M., Seago, J. A., & Spetz, J. (2002). Minimum nurse-to-patient ratios in acute care
hospitals in California. Health Affairs, 21(5), 53-64.
http://dx.doi.org/10.1377/hlthaff.21.5.53
Davis, F.D. (1986). A technology acceptance model for empirically testing new end-user
information systems: Theory and results. (Doctoral dissertation, Sloan School of
Management, Massachusetts Institute of Technology)
Duffield, C., O’Brien-Pallas, L., Aisbett, C., Roche, M., King, M., & Aisbett, K. (2011). Nursing
staffing, nursing workload, the work environment and patient outcomes. 24, 244-255.
http://dx.doi.org/10.1016/j.apnr.2009.12.004

CLINICAL INFORMATION INTERFACE
53
Fasoli, D. R., & Haddock, K. S. (2011, April 11). Results of an integrative review of patient
classification systems. Annual Review of Nursing Research, 295-316.
http://dx.doi.org/10.1891/0739-6686.28.295
Gordon, K. (2009). Obama signs hitech act for healthcare IT. Health Capital Topics, 2,
(6).Retrieved from http://www.healthcapital.com/hcc/newsletter/6_09/HITECH.pdf.
Herman, B. (2013). 10 statistics on hospital labor costs as a percentage of operating revenue.
Retrieved from http://www.beckershospitalreview.com/racs-/-icd-9-/-icd-10/10-statisitcs-
on-hospital-labor-costs-as-a-percentage-of-operating-revenue.html
Hinno, S., Partanen, P., & Vehvilainen-Julkunen, K. (2011). Nursing activitie, nurse staffing and
adverse patient outcomes as perceived by hospital nurses. 21, 1584-1593.
http://dx.doi.org/10.1111/j.1365-2702.2011.03956.x
Hurst, K., Smith, A., Casey, A., Fenton, K., Scholefield, H., & Smith, S. (2008, July).
Calculating staffing requirements. Nursing Management, 15(4), 26-34.
Huryk, L. A. (2010). Factors influencing nurses’ attitudes towards healthcare information
technology. Journal of Nursing Management, 18, 606-612.
http://dx.doi.org/10.1111/j.1365-2834.2010.01084.x
Ingebrigtsen, T., Georgiou, A., Clay-Williams, R., Magrabi, F., Hordern, A., Prgomet, M., ...
Braithwaite, J. (2014). The impact of clinical leadership on health information technology
adoption: Systemic review. International Journal of Medical Informatics, 83, 393-405.
http://dx.doi.org/10.1016/j.ijmedinf.2014.02.005
Institute of Medicine (2000). To err is human: Building a safer health system. Washington D.C.:
National Academy Press.
Institute of Medicine (2011). The future of nursing: Leading change, advancing health.
Washington D.C. National Academy Press.
Key features of the affordable care act by year. (2014). Retrieved from
http://www.HHS.gov/HealthCare/facts/timeline/timeline-text.html#top
Kua, K., Liu, C., & Ma, C. (2013). An investigation of the effect of nurses’ technology readiness
on the acceptance of mobile electronic record systems. Medical Informatics & Decision
Making, 13(88), 1-14. Retrieved from http://www.biomedcentral.com/1472-6947/13/88

CLINICAL INFORMATION INTERFACE
54
Levenstam, A., & Bergbom, I. (2011). The zebra index: on method for comparing units in terms
of nursing care. Journal of Nursing Management, 19(), 260-268. Retrieved from
Lin, C. H. (2013, October-December). The impact of nurse staffing on quality of patient care in
acute care settings: An integrative review paper, 40(4), 10-23.
Lombard, M. & Laurano, M. Human capital management tools 2013. Retrieved from
http://www.aberdeen.com/assets/report-preview/8101-RA-human-capital-management-
Malloch, K. (2012, November/December). Changing tides: Increasing evidence to embrace a
patient classification system. Nursing Economics, 30(6), 356-358.
Malloch, K., & Meisel, M. (2013, December). Patient classification systems: State of the Science
2013. Nurse Leader, 11(6), 35-40.
Mark, B. A., Harless, D. W., Spetz, J., Reiter, K. L., & Pink, G. H. (2013, April). California’s
minimum nurse staffing legislation: Results from a natural experiment. Health Services
Research, 48(2), 435-454. http://dx.doi.org/10.1111/j.1475-6773.2012.01465
Rivard, S., & Lapointe, L. (2012, Septemeber). Information technology implementers’ responses
to user resistance: Nature and effects. MIS Quarterly, 36(3), 897-920. http://dx.doi.org/
Rogers, E. M. (2003). Diffusion of innovations (5th ed.). New York: Free Press.
Serratt, T., Harrington, C., Spetz, J., & Blegen, M. (2011, September 13). Staffing changes
before and after mandated nurse-to-patient ratios in California’s hospitals. Policy,
Politics, & Nursing Practice, 12, 133-140. http://dx.doi.org/10.1177/1527154411417881
Spetz, J., Donaldson, N., Aydin, C., & Brown, D. (2008, October). How many nurses per
patient? Measurements of nurse staffing in health services research. Health Services
Research and Educational Trust, 43(5), 1674-1692.
http://dx.doi.org/10.1111/j.1475=6773.2008.00850.x
West, E., Barron, D. N., Harrison, D., Rafferty, A. M., Rowan, K., & Sanderson, C. (2014,
February 11). Nurse staffing, medical staffing and mortality in intensive care: An
observational study. 51, 781-794. http://dx.doi.org/10.1016/j.ijnurstu.2014.02.007
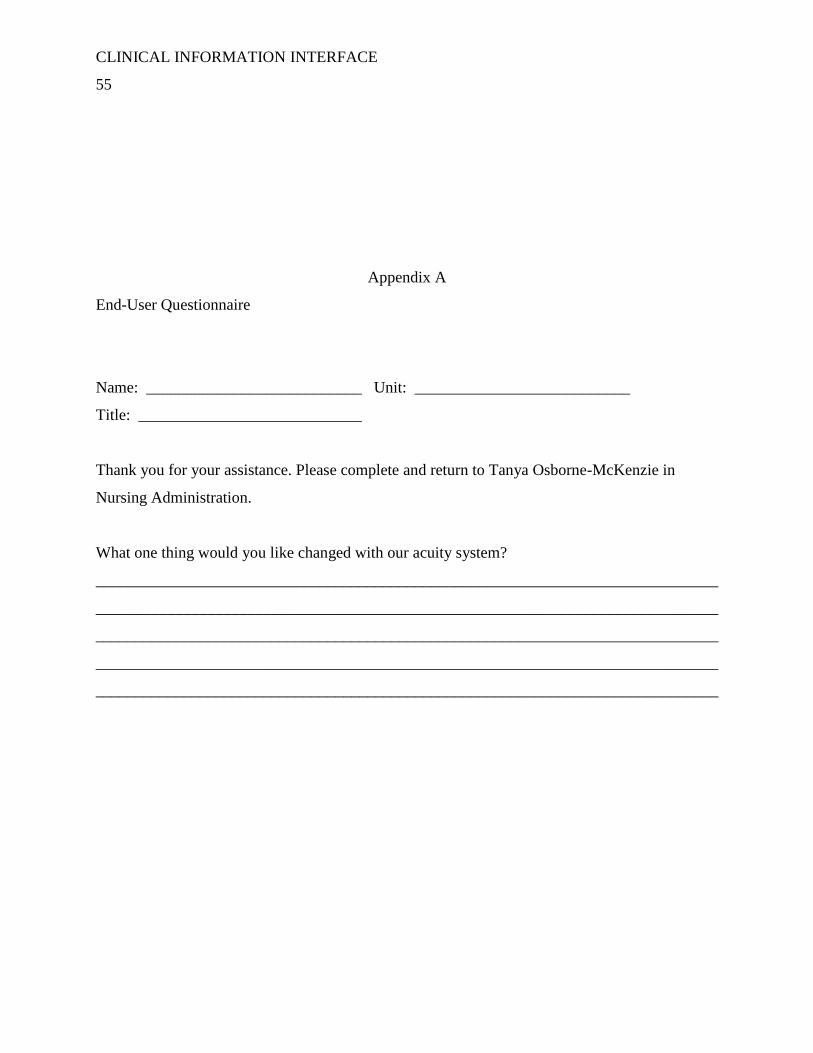
CLINICAL INFORMATION INTERFACE
55
Appendix A
End-User Questionnaire
Name: ___________________________ Unit: ___________________________
Title: ____________________________
Thank you for your assistance. Please complete and return to Tanya Osborne-McKenzie in
Nursing Administration.
What one thing would you like changed with our acuity system?
______________________________________________________________________________
______________________________________________________________________________
______________________________________________________________________________
______________________________________________________________________________
______________________________________________________________________________

CLINICAL INFORMATION INTERFACE
56
Appendix B
Evidence Table
RN: PT Ratios
Author/ Article
Study Design (Validity/ Methods)
Study Results Study Conclusions Pertinent Findings
Relevance to Care (Significance)
Evidence Rating
Aiken, L.H., et al. (2010) Implications of the California nurse staffing mandate for other states Health Research and Educational Trust
Nurse
workloads are
compared
across the
three states
and examined
how nurse
and patient
outcomes,
including
patient
mortality and
failure-to-
rescue, are
affected by
the
differences in
nurse
workloads
across the
hospitals in
these states.
California
hospitals
nurses cared
for one less
patient on
average than
nurses in the
other states and
two fewer
patients on
medical and
surgical units.
Lower ratios
are associated
with
significantly
lower
mortality.
When nurses’
workloads
were in line
with
California-
mandated
ratios in all
three states,
nurses’
Hospital
nurse
staffing
ratios
mandated in
California
are
associated
with lower
mortality and
nurse
outcomes
predictive of
better nurse
retention in
California
and in other
states where
they occur.
Although
attempts to
minimize
bias were
implemented
, the use of
the same
This paper
describes the
implications of
California’s
mandated nurse
staffing to three
other states.
Implications for
nursing in
informing other
states that are
debating nurse
ratio legislation.
Evidence
Level: 3
Non-
experimen-
tal
Quality
Rating: A

CLINICAL INFORMATION INTERFACE
57
burnout and
job
dissatisfaction
were lower,
and nurses
reported
consistently
better quality
of care.
nurses to
assess the
impact of the
California
legislation
and to report
on quality of
care and job
satisfaction
may be a
study
limitation.
Bolton, L.B., et al. (2007) Mandated nurse staffing ratios in California: A comparison of staffing and nursing-sensitive outcomes pre- and postregulation Policy, Politics & Nursing Practice
Post-
regulation
ratios data
from 2004-
2006 were
used to assess
trends in
staffing and
outcomes two
years after
implementing
in California.
The authors
compared the
California
Nursing
Outcomes
Coalition
(CalNOC)
data from 252
Medical
Surgical and
step down
nursing units,
in 108
hospitals,
representing
greater than
500, 000
patient days
to determine
the difference
Exploratory
examination of
the relationship
between
staffing and
nursing
sensitive
patient
outcomes was
completed.
Anticipated
improvement
s in nursing
sensitive
patient
outcomes
were not
observed.
Limitations
of the study
included the
CalNOC
database, in
2005 were
based on
data from a
convenience
sample of
California
hospitals.
The data
does not
represent
hospitals that
did not
participate.
This report
contributes to
the growing
understanding
of the impacts
of regulatory
staffing
mandates on
hospital
operations and
patient
outcomes.
Evidence
Level: 3
Non-
experiment
al
Quality
Rating: B

CLINICAL INFORMATION INTERFACE
58
between
pressure
ulcers, nurse
staffing and
patient falls
before and
after RN: PT
ratios
Mark, B.A., et al. (2013) California’s minimum nurse staffing legislation: Results from a natural experiment Health Research and Educational Trust
Data from the
American
Hospital
Association
Annual
Survey of
Hospitals, the
California
Office of
Statewide
Health
Planning and
Development,
the Hospital
Cost Report
Information
System, and
the Agency
for Healthcare
Research and
Quality’s
Health Care
Cost and
Utilization
Project’s State
Inpatient
Data-bases
from 2000-
2006 were
grouped into
four quartiles
based on pre-
regulation
staffing
levels. The
difference-in-
California
hospitals
increased nurse
staffing levels
over time
significantly
more than did
comparison
state hospitals.
Failure to
rescue
decreased
significantly
more in some
California
hospitals, and
infections due
to medical care
increased
significantly
more in some
California
hospitals than
in comparison
state hospitals.
There were no
statistically
significant
changes in
either
respiratory
failure or
postoperative
sepsis.
Following
implement-
ation of
California’s
minimum
nurse
staffing
legislation,
nurse
staffing in
California
increased
significantly
more than it
did in
comparison
states’
hospitals, but
the extent of
the increases
depended
upon pre-
regulation
staffing
levels; there
were mixed
effects on
quality.
The study
had several
limitations
including the
timing
placed the
study prior to
Medicare’s
With mixed
reviews
regarding
improvements
in quality and
mandated and
research relating
the cost of
nursing care is
related to
mandated ratios,
the larger and so
far, unanswered
question is
whether the
incremental
increases in
quality are
worth the cost.
Evidence
Level: 3
Non-
experiment
-al
Quality
Rating: C
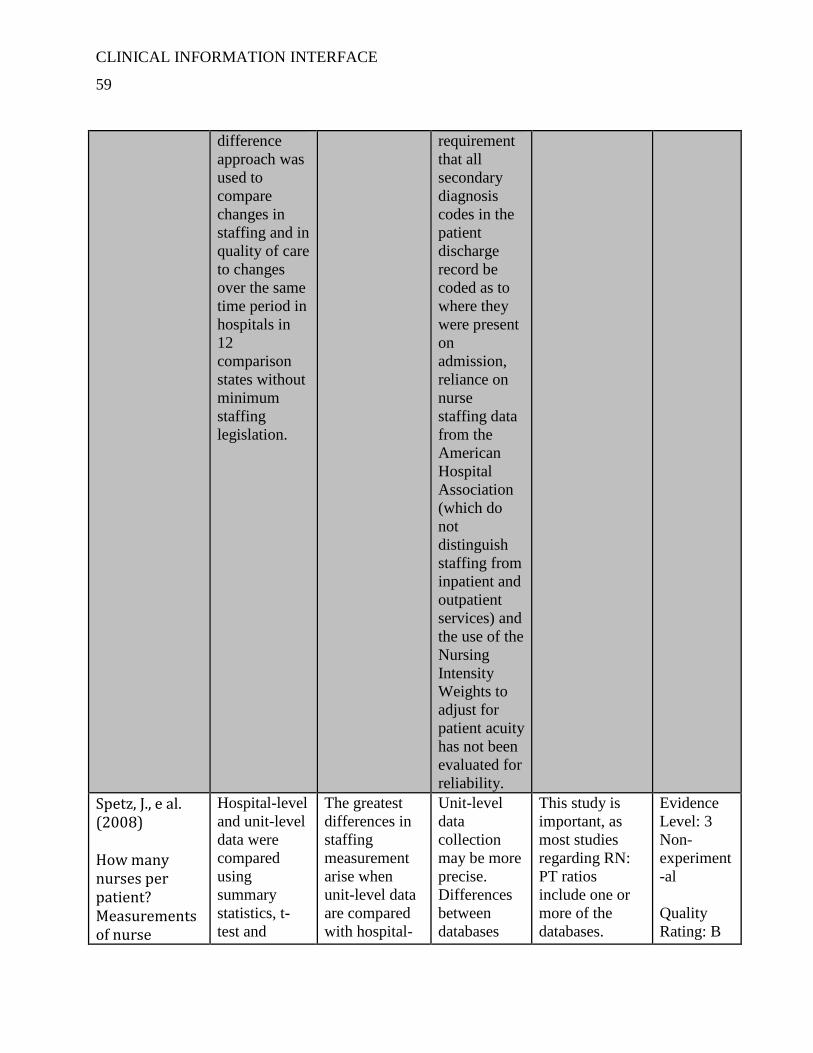
CLINICAL INFORMATION INTERFACE
59
difference
approach was
used to
compare
changes in
staffing and in
quality of care
to changes
over the same
time period in
hospitals in
12
comparison
states without
minimum
staffing
legislation.
requirement
that all
secondary
diagnosis
codes in the
patient
discharge
record be
coded as to
where they
were present
on
admission,
reliance on
nurse
staffing data
from the
American
Hospital
Association
(which do
not
distinguish
staffing from
inpatient and
outpatient
services) and
the use of the
Nursing
Intensity
Weights to
adjust for
patient acuity
has not been
evaluated for
reliability.
Spetz, J., e al. (2008) How many nurses per patient? Measurements of nurse
Hospital-level
and unit-level
data were
compared
using
summary
statistics, t-
test and
The greatest
differences in
staffing
measurement
arise when
unit-level data
are compared
with hospital-
Unit-level
data
collection
may be more
precise.
Differences
between
databases
This study is
important, as
most studies
regarding RN:
PT ratios
include one or
more of the
databases.
Evidence
Level: 3
Non-
experiment
-al
Quality
Rating: B

CLINICAL INFORMATION INTERFACE
60
staffing in health services research Health Research and Educational Trust
correlations. level
aggregated
data reported
in large
administrative
databases.
There is
greater
dispersion in
the data
obtained from
publicly
available,
administrative
data sources
than in unit-
level data;
however, the
unit-level data
sources are
limited to a
select set of
hospitals and
are not
available to
many
researchers.
may account
for
differences
in research
findings.
Serratt, T., et al (2011) Staffing changes before and after mandated nurse-to-patient ratios in California’s hospitals Policy, Politics & Nursing Practice
Examined two
years of date
from
California
Hospital
Annual
Financial
Disclosure
Reports in
primarily
general acute
care hospitals
in order to
identify and
describe
changes in
nurse and
The study
concluded that
most hospitals
increased the
number of RN
staff and
decreases in
support staff
and other non-
nursing staff
were not
evident.
Mandated
ratios had the
desired effect
of increasing
the number
of nurses in
acute care
hospitals as
evidenced by
the mean
productive
hours per
patient day
of RNs and
registry
nurses in
California
The study’s
focus was on
the changes in
nurse and non-
nurse staffing
during the early
implementation
phase of RN:
PT ratios.
Continued
exploration is
required to
determine
ongoing and
long-term
staffing changes
since the
Evidence
Level: 3
Non-
experiment
-al
Quality
Rating: B

CLINICAL INFORMATION INTERFACE
61
non-nursing
staffing that
were likely to
have occurred
as a result of
the RN: PT
ratio
legislation.
hospitals
increased
between
fiscal year
2000 and
2006,
hospitals
staffing
above
minimum
1:5 nurse-to-
patient ratio
in fiscal year
2000 and
2006
compared to
hospitals
staffing at or
below the
minimum
and unit-
based
support staff
and other
non-nurse
staff mean
productive
hours per
patient day
or per
service were
not reduced.
mandated ratios
took effect.
Nurse Staffing to Patient Outcomes
Author/ Article
Study Design Study Results Study Conclusions Pertinent Findings
Relevance to Care
Evidence Rating
Aiken, L.H., et al. (2002) Hospital staffing,
Multisite
cross-
sectional
surveys of 10,
319 RNs in
Dissatisfaction,
burnout, and
concerns about
quality of care
were common
Adequate
nurse staffing
and
organizational/
Managerial
RN reports
of low
quality of
care were
three times
Evidence
Level: 3
Qualitative

CLINICAL INFORMATION INTERFACE
62
organization, and quality of care: cross-national findings International Journal for Quality in Health Care
adult acute-
care hospitals
in the United
States,
Canada,
England and
Scotland.
among hospital
nurses in all
five sites.
Organizational/
Managerial
support for
nursing had a
pronounced
effect on
nurses’
dissatisfaction
and burnout,
and both
organizational
support for
nursing and
nurse staffing
were directly,
and
independently,
related to
nurse-assessed
quality of care.
support for
nursing are
key to
improving the
quality of
patient care, to
diminishing
nurse job
dissatisfaction
and burnout
and,
ultimately, to
improving the
nurse retention
problem in
hospital
settings.
Study
limitations
included: a
convenience
sample,
hospitals with
fewer than ten
survey
responses
were removed,
only RNs
employed in
medical
surgical
nursing units
were
surveyed.
as likely in
hospitals
with low
staffing and
support for
nurses as in
hospitals
with high
staffing and
support.
Quality
Rating: A
Duffield, C., et al. (2011) Nursing staffing, nursing workload, the work environment
Longitudinal
retrospective
and
concurrent
cross-
sectional
methods were
used to
analyze five
Results from
the
longitudinal
sample
revealed higher
number of TN
hours were
associated with
significantly
Nurse staffing
(fewer RNs),
increased
workload, and
unstable unit
environments
were linked to
negative
patient
Unit-level
data
including
staffing
would not be
difficult to
obtain for
analysis at
the
Evidence
Level: 3
Non-
experiment-
al
Quality
Rating: B

CLINICAL INFORMATION INTERFACE
63
and patient outcomes Applied Nursing Research
years of
administrative
data and one
overlapping
year of
primary unit
data to
investigate if
nurse staffing,
increased
workload and
unstable
nursing unit
environments
were linked to
negative
patient
outcomes.
Workforce
data from 27
hospitals,
totaling 286
different in-
patient
hospital units
were
reviewed.
decreased rate
of decubiti,
pneumonia and
sepsis. The
cross-sectional
study resulted
in increased
errors,
specifically
medication
errors, with
fewer nurses.
outcomes
including falls
and
medication
errors on
medical and
surgical units
in a mixed
method study
combining
longitudinal
data and
primary data
collection.
Combining the
two studies;
longitudinal
and cross-
sectional, was
much more
difficult than
anticipated by
the
researchers.
Only 43 of the
80 units were
able to be
studied. The
data was
limited by the
medical record
coding. It is
unclear if all
adverse
patient events
were recorded
on the patient
records.
individual
hospital
level in most
counties.
Additional
research to
identifying
the data to
assess
relationships
among nurse
staffing and
workloads in
terms of
case-mixes,
patient
acuity and
turnover.
Hinno, S., et al. (2011) Nursing activities,
A cross-
sectional,
descriptive
questionnaire
survey was
The study’s
results were
consistent with
previous
research: the
Significant
associations
were found
between nurse
staffing and
The findings
provide
insight into
the potential
effects of
Evidence
Level: 3
Non-
experimental

CLINICAL INFORMATION INTERFACE
64
nurse staffing and adverse patient outcomes as perceived by hospital nurses Journal of Clinical Nursing
used to
investigate
relationships
between
nursing
activities,
nurse staffing
and adverse
patient
outcomes in
hospitals in
Finland and
the
Netherlands.
higher number
of RNs, the
better patient
outcomes.
adverse
patient
outcomes in
hospital
settings.
Compared to
the
Netherlands,
in Finland,
nurses appear
to have higher
workloads,
there are
higher patient-
to-nurse ratios,
and these
adverse
staffing
conditions are
associated
with higher
rates of
adverse
patient
outcomes.
major
changes or
reductions in
nursing staff
on the
occurrence
of adverse
patient
outcomes in
hospital
settings.
Quality
Rating: B
Lin, C.H., (2013) The impact of nurse staffing on quality of patient care in acute care settings: An integrative review paper Singapore Nursing Journal
A literature
search was
conducted;
extracting
data to
determine the
impact of
nurse staffing
on quality of
patient care.
The evidence
largely
associated
elevated nurse
staffing levels
and higher RN
proportions
with better
quality of
patient care.
The findings
can assist
hospital
administrators
in nurse
staffing
planning and
nurse
administrators
in developing
an appropriate
staffing model
to achieve
quality patient
outcomes.
A limitation of
the study was
that all
Findings of
reviewed
studies
indicated
that reducing
RNs
numbers
significantly
decrease the
quality of
patient care.
Evidence
Level: 3
Meta-
synthesis
Quality
Rating:
B
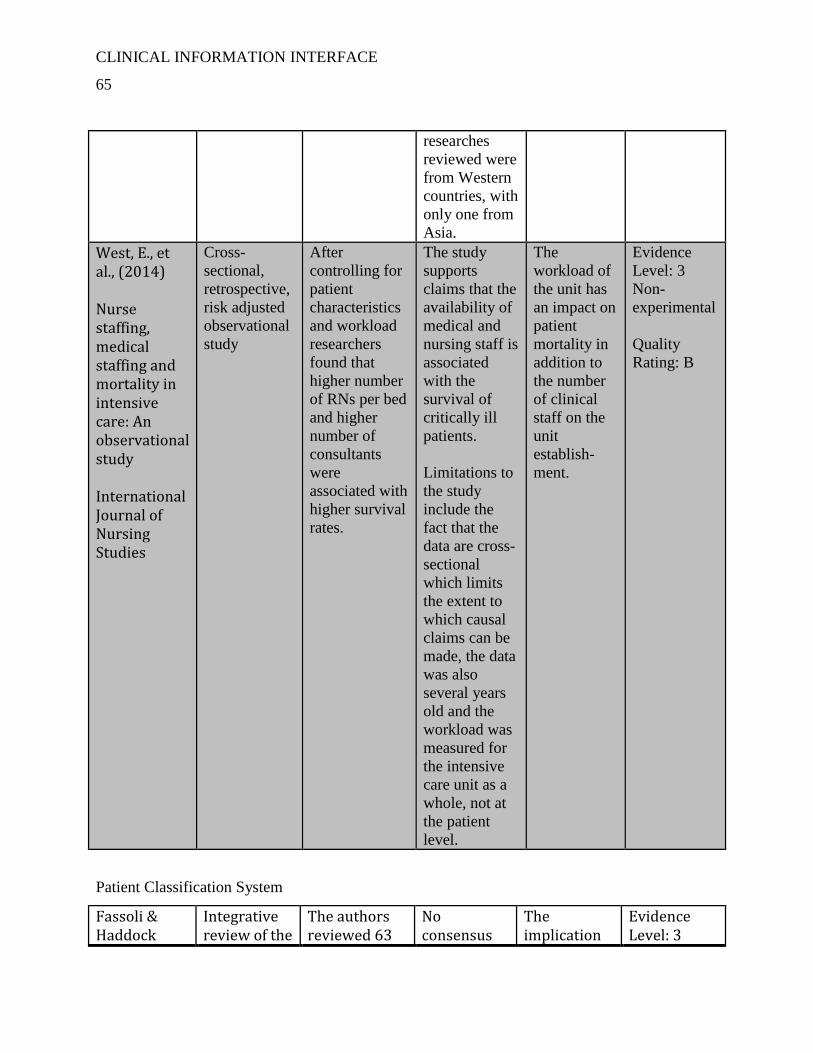
CLINICAL INFORMATION INTERFACE
65
researches
reviewed were
from Western
countries, with
only one from
Asia.
West, E., et al., (2014) Nurse staffing, medical staffing and mortality in intensive care: An observational study International Journal of Nursing Studies
Cross-
sectional,
retrospective,
risk adjusted
observational
study
After
controlling for
patient
characteristics
and workload
researchers
found that
higher number
of RNs per bed
and higher
number of
consultants
were
associated with
higher survival
rates.
The study
supports
claims that the
availability of
medical and
nursing staff is
associated
with the
survival of
critically ill
patients.
Limitations to
the study
include the
fact that the
data are cross-
sectional
which limits
the extent to
which causal
claims can be
made, the data
was also
several years
old and the
workload was
measured for
the intensive
care unit as a
whole, not at
the patient
level.
The
workload of
the unit has
an impact on
patient
mortality in
addition to
the number
of clinical
staff on the
unit
establish-
ment.
Evidence
Level: 3
Non-
experimental
Quality
Rating: B
Patient Classification System
Fassoli & Haddock
Integrative review of the
The authors reviewed 63
No consensus
The implication
Evidence Level: 3

CLINICAL INFORMATION INTERFACE
66
(2011) Results of an integrative review of patient classification Systems Annual Review of Nursing Research
literature aimed to identify current practices related to PCS and determine if a “gold standard” PCS could be adopted or adapted for use by RN leaders in practice.
articles from 1983-2010, finding many criticisms from earlier articles remained in recent articles and a few specific characteristics of some PCS.
exists about PCS.
for nursing is the need for continued balancing of PCS and nursing judgment.
Quality Rating: B
Hurst, K. et al., (2008) Calculating staffing requirements Nursing Management
Attempt to
develop an
easy-to-use
patient
classification
system. 2,
759 patients
in three
hospitals
were
sampled.
The authors
developed a
tool with a ten
step algorithm
for calculating
direct care
hours per
patient day.
To develop a
simple tool
requires large
datasets that
are expensive
to collect and
maintain.
Extrapolating
from existing
information
in order to
contain cost
and time may
be required;
however, in
doing so,
validity and
reliability
principles
should not be
abandoned.
Evidence
Level: 2
Quasi-
experimental
Quality
Rating: B
Levenstam & Bergbom (2011) The zebra index: one method for comparing units in terms of nursing care Journal of Nursing
The index
and
calculation
for
classifying
patients was
developed.
The index
shows the
intensity of
nursing care.
The index
makes possible
to follow
changes in the
nursing care
given over a
period of time
and it can have
a totally
different
The index
obtains
reliable
information
about the
changing
nursing
situations
over a period
of time.
The approach
described can
be used in
different
settings and is
not bound to
on country,
but can be
looked upon
as a general
method.
Evidence
Level: 2
Quasi-
experimental
Quality
Rating: B

CLINICAL INFORMATION INTERFACE
67
Management workload
situation.
Technology and Technology Acceptance by Nurses
Huryk (2010) Factors influencing nurses’ attitudes towards healthcare information technology Journal of Nursing Manage-ment
A search of PubMed, CINAHL and Medline databases and reviewed 13 articles to examine current trends in RN’s attitudes towards healthcare information technology (HIT).
The attitudes of nurses toward HIT are positive. Increased computer experience is the main demographic indicator for positive attitudes.
The most common detractors was poor system design, system slowdown and system downtime and RNs were concerned that the use of technology would dehumanize patient care, the attitudes of RNs towards HIT were positive.
Implications of the study included the need to involve RNs in system design in order to improve post-implementation satisfaction.
Evidence Level: 3 Non-experimental Quality Rating: B
Ingebrigtsen et al., (2014) The impact of clinical leadership on health information technology adoption: Systematic review Internationa
Review of
the literature
of the major
databases to
examine
evidence
associating
clinical
leadership
and
successful IT
adoption in
healthcare
organizations
.
The results
demonstrate
important
associations
between the
attributes of
clinical
leaders and
IT adoption.
Leaders who
possess
technical
informatics
skills and
prior
experience
with IT
project
management
were related
to a long-
term
commitment
to the use of
Proactive
leadership
behaviors and
partnerships
with IT
professionals
that is
associated with
successful
organizational
and clinical
outcomes.
Evidence
Level: 3
Non-
experimental
Quality
Rating: B

CLINICAL INFORMATION INTERFACE
68
l Journal of Medical Informatics
IT.
Kua, Lui & Ma, (2013) An investigation of the effect of nurse’ technology readiness on the acceptance of mobile electronic medical record systems BMC Medical Informatics & Decision Making
Self-
administered
questionnaire
used to
collect 665
valid
responses
from a large
hospital in
Taiwan to
investigate
personality
traits of RNs
in regard to
technology
readiness
toward
mobile
electronic
medical
record
systems.
The authors
conclude that
continuous
educational
programs
focused on
RNs
improving
their IT
literacy,
minimizing
stress and
discomfort
about IT and
focusing on
recruiting
more
optimistic
RNs to
champion
HIT
implementa-
tion and
usage.
The
friendliest of
user
interfaces of
the EMR will
greatly
enhance the
RN’s
engagement
with HIT.
The authors
caution
implementers
ignoring the
effects of
personalities on
technology and
recommends
personality traits
be included in
the personnel
databases of
organizations.
Evidence
Level: 3
Non-
experimental
Quality
Rating: B
Rivard & Lapointe, (2012) Information technology implement-ters’ responses to users resistance: Nature and effects MIS Quarterly
Question-
naires used to
study the
response by
implementers
of IT to
resistance of
the end user.
The study
wanted to
answer two
questions:
“What are
implement-
ers’
responses to
user
A taxonomy
that included
four
categories of
imple-
menters’
responses to
user
resistance
was
developed.
The effects
of these
depended on
the response
to the first
question.
The
researchers
provided a
theoretical
explanation
of how
implementer’
s responses
may affect
the
antecedents
that earlier
research
found to be
associated
with user
resistance
Implementers
can predict the
effect the
response of the
implementer to
resistance has
on the end user.
Evidence
Level: 3
Non-
experimental
Quality
Rating: C
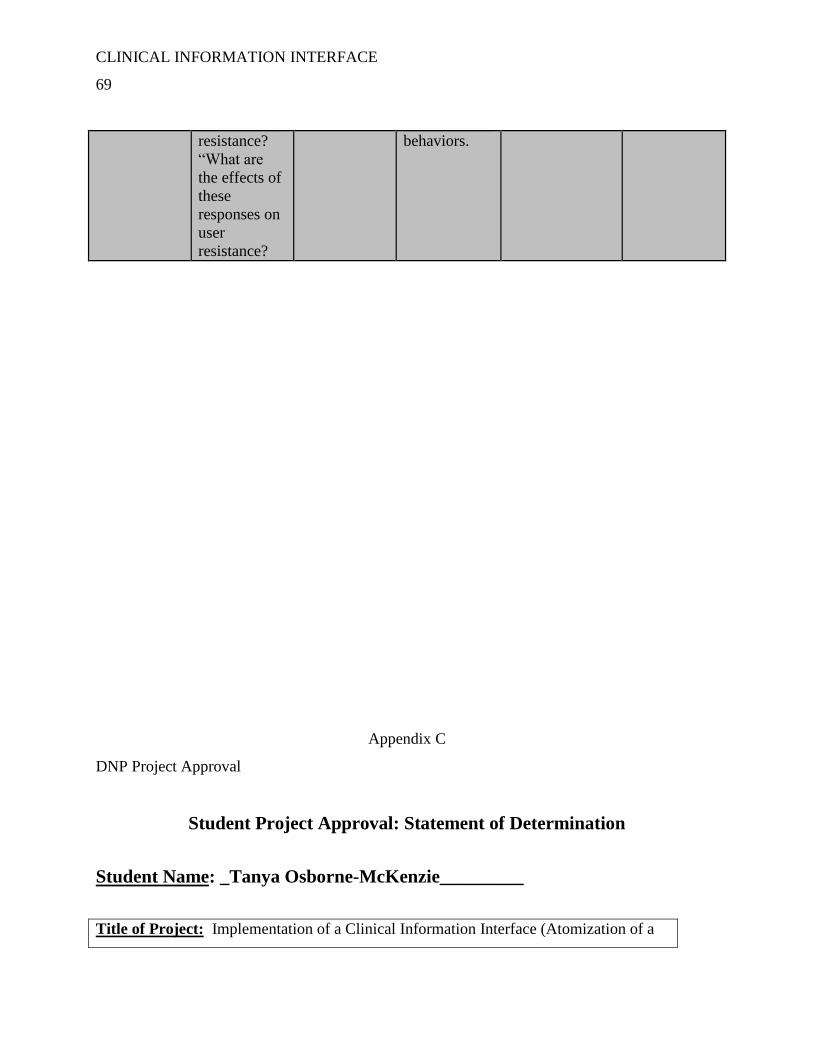
CLINICAL INFORMATION INTERFACE
69
resistance?
“What are
the effects of
these
responses on
user
resistance?
behaviors.
Appendix C
DNP Project Approval
Student Project Approval: Statement of Determination
Student Name: _Tanya Osborne-McKenzie_________
Title of Project: Implementation of a Clinical Information Interface (Atomization of a

CLINICAL INFORMATION INTERFACE
70
Patient Classification System)
Brief Description of Project: Patien
t classification systems (PCS) are commonly used to predict patient requirements for
nursing care. The requirements, or patient acuity, is then used to manager nursing staffing
plans, developing budgets and are foundational for patient satisfaction, nursing
satisfaction and making daily staffing decisions. PCSs have many limitations, including
the validity and reliability of the tools are infrequently monitored, often the tools used are
complex and require considerable time to complete and the tools lack credibility of staff
nurses and administrators.
Opinion-based acuity systems must be replaced by evidenced-based systems. Evidenced-
based PSCs are available in today’s market. A limitation of these systems is the time
needed by the user (nurse) to enter the data and the knowledge the user needs to ensure
the accuracy of the data that is entered. Evidenced-based systems must be enhanced by
systems that are not time consuming. Many hospitals have electronic medicine
administration records (eMAR), computerized physician order entry (CPOE and
electronic nursing documentation systems. Ultimately, the automation of an evidenced-
based PCS system can support the decisions made to manage nursing personnel
resources, costs and quality.
A) Aim Statement: To implement a Clinical Information Interface (an automated
Patient Classification System) of an acuity system that is objective, reliable, valid and
intuitive into in-patient areas of an acute care hospital.
B) Description of Intervention: A multi-disciplinary team, will develop, test and
implement an automated version of the PCS currently used. The upgrade will allow for
data from CPOE, eMAR and nursing documentation screens to be expressed into the
PCS.

CLINICAL INFORMATION INTERFACE
71
C) How will this intervention change practice? Data is continuously received by
PCS from EMR solution(s). This includes orders from CPOE, medication and IV
administration data from your EMAR source, and relevant nursing documentation as
well. Compliance of the acuity system will be increased, as the acuity will no longer be
dependent upon the RN to enter data. Accuracy will be increased as the acuity system
will no longer be dependent on the RN’s knowledge.
D) Outcome measurements:
Implementation by March 31, 2014
Staffing decisions made by referring to PCS.
Positive feedback from staff survey
To qualify as an Evidence-based Change in Practice Project, rather than a Research Project, the
criteria outlined in federal guidelines will be used:
(http://answers.hhs.gov/ohrp/categories/1569)
☐ This project meets the guidelines for an Evidence-based Change in Practice Project as
outlined in the Project Checklist (attached). Student may proceed with implementation.
☐This project involves research with human subjects and must be submitted for IRB approval
before project activity can commence.
Comments:
EVIDENCE-BASED CHANGE OF PRACTICE PROJECT CHECKLIST *
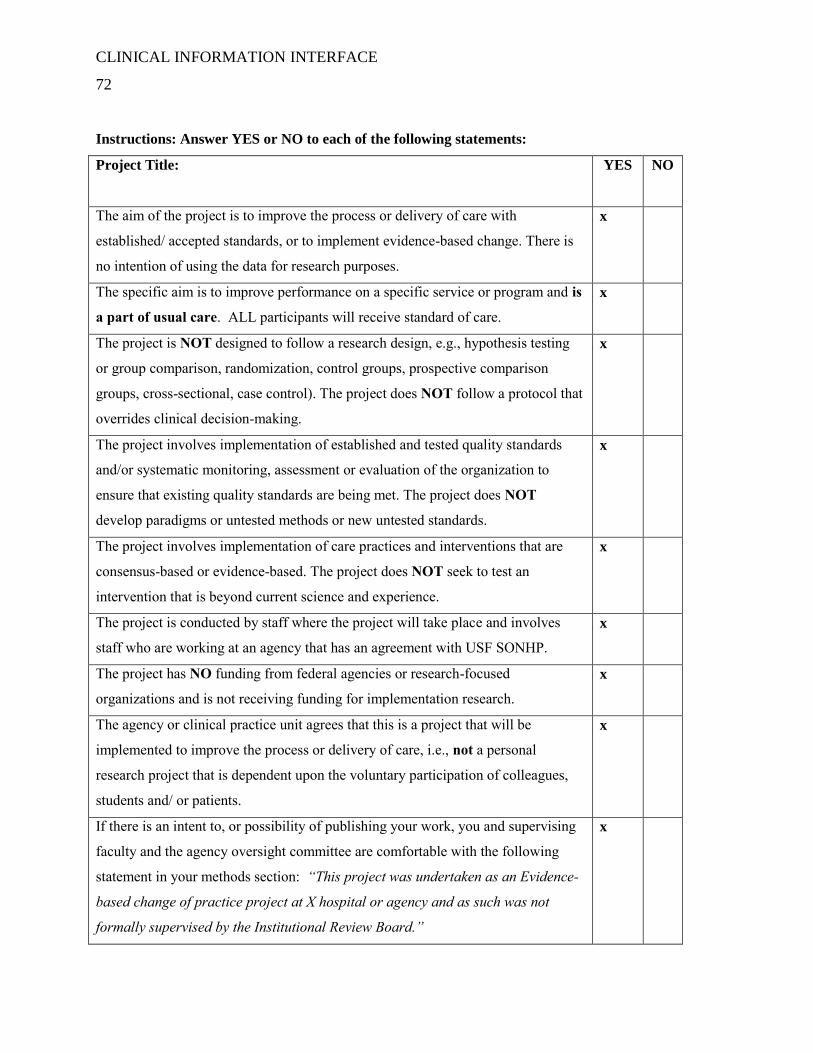
CLINICAL INFORMATION INTERFACE
72
Instructions: Answer YES or NO to each of the following statements:
Project Title:
YES NO
The aim of the project is to improve the process or delivery of care with
established/ accepted standards, or to implement evidence-based change. There is
no intention of using the data for research purposes.
x
The specific aim is to improve performance on a specific service or program and is
a part of usual care. ALL participants will receive standard of care.
x
The project is NOT designed to follow a research design, e.g., hypothesis testing
or group comparison, randomization, control groups, prospective comparison
groups, cross-sectional, case control). The project does NOT follow a protocol that
overrides clinical decision-making.
x
The project involves implementation of established and tested quality standards
and/or systematic monitoring, assessment or evaluation of the organization to
ensure that existing quality standards are being met. The project does NOT
develop paradigms or untested methods or new untested standards.
x
The project involves implementation of care practices and interventions that are
consensus-based or evidence-based. The project does NOT seek to test an
intervention that is beyond current science and experience.
x
The project is conducted by staff where the project will take place and involves
staff who are working at an agency that has an agreement with USF SONHP.
x
The project has NO funding from federal agencies or research-focused
organizations and is not receiving funding for implementation research.
x
The agency or clinical practice unit agrees that this is a project that will be
implemented to improve the process or delivery of care, i.e., not a personal
research project that is dependent upon the voluntary participation of colleagues,
students and/ or patients.
x
If there is an intent to, or possibility of publishing your work, you and supervising
faculty and the agency oversight committee are comfortable with the following
statement in your methods section: “This project was undertaken as an Evidence-
based change of practice project at X hospital or agency and as such was not
formally supervised by the Institutional Review Board.”
x

CLINICAL INFORMATION INTERFACE
73
ANSWER KEY: If the answer to ALL of these items is yes, the project can be considered an
Evidence-based activity that does NOT meet the definition of research. IRB review is not
required. Keep a copy of this checklist in your files. If the answer to ANY of these questions
is NO, you must submit for IRB approval.
*Adapted with permission of Elizabeth L. Hohmann, MD, Director and Chair, Partners Human
Research Committee, Partners Health System, Boston, MA.
STUDENT NAME (Please print): Tanya Osborne-McKenzie_________
Signature of
Student:_____________________________________________DATE__12/10/2013_____
SUPERVISING FACULTY NAME (Please
print):_________________________________________
Signature of Supervising:
__________________________________________DATE_______________
Appendix D

CLINICAL INFORMATION INTERFACE
74
Responsibility Matrix

CLINICAL INFORMATION INTERFACE
75
Appendix E
SWOT Analysis
Strengths
Strong IT Department
IT Infrastructure
Interdisciplinary team
Strong relationship with
industry partner
Weaknesses
Buy-in/acceptance of end user
No template for work involved
to create and implement
Opportunities
Enhance team communication
Decrease end user workload
Improve accuracy of staffing
decisions
Create a template for
interfaces between other
technology solutions
Threats
doption
Uncertain timeframe; therefore,
cost, to create and implement
Must maintain timeline for
completion
Staff proficiency

CLINICAL INFORMATION INTERFACE
76
Appendix F
Patient Care Needs Intervention Matrix

CLINICAL INFORMATION INTERFACE
77
Appendix G
Cost/Benefit of CII Implementation
2013 2014 2015 2016
ANTICIPATED
SAVINGS
Overstaffing 0 16,224 16,630 17,046
Incremental
Overtime 0 121,680 124,722 127,840
Nurse Manager
Time 0 23,400 23,985 24,585
CDPH Survey 0 1,218 0 0
Net Savings 0 162,522 165,337 169,471
OPERATING
EXPENSES
Direct Care RNs 26, 000 15,600 4,264 4,371
Auditing RNs 0 4,480 2132 2185
Informaticists 5,600 5,600 0 0
Director,
Informatics 3,600 3,600 0 0
Misc. IT 1,300 1,300 0 0
Clinical RN
Manager 3,600 3,600 1474 1511

CLINICAL INFORMATION INTERFACE
78
Total Expenses $40,100 30,580 7,870 8,067
NET SAVINGS ($40,100) 131,942 157,467 161,404
Appendix H
Work Breakdown Structure
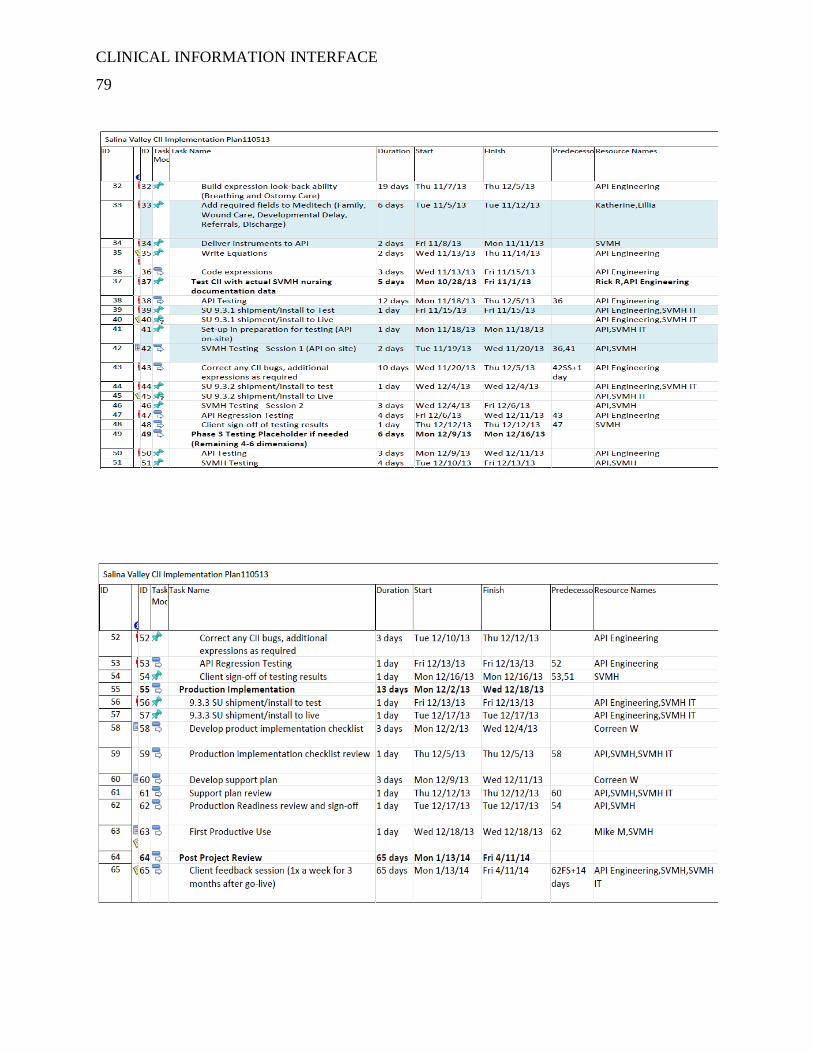
CLINICAL INFORMATION INTERFACE
79

CLINICAL INFORMATION INTERFACE
80
Appendix I

CLINICAL INFORMATION INTERFACE
81
Gantt Chart

CLINICAL INFORMATION INTERFACE
82

CLINICAL INFORMATION INTERFACE
83
Appendix J
Boot-camp Agenda
Patient Classification Solution – Nursing Leadership Training
(1/2 day session)
CLIENT NAME
CITY, STATE
PREPARATION
Dates: 01/01/01
Time: Start time to end time (four hours)
GOALS
Assist nursing leadership in preparing for the monitoring process of Patient Classification
Assist nursing leadership in understanding the importance of monitoring Patient Classification data.
OBJECTIVES
By the end of this session the attendees will be able to
Discuss the Patient Classification process specific to their organization.
Run reports from the Patient Classification Solution.
Understand the importance of Patient Classification surveillance.
PREREQUISITES
Understanding of the Patient Classification Solution.
Knowledge of unit staffing requirements as mandated by staffing practices/legislation.
EQUIPMENT
Projection unit able to support Super VGA
All connecting cables and power supplies
Projection screen
1 PC for each attendee that meets the requirements listed in your hardware requirements document and has access to Patient Classification.
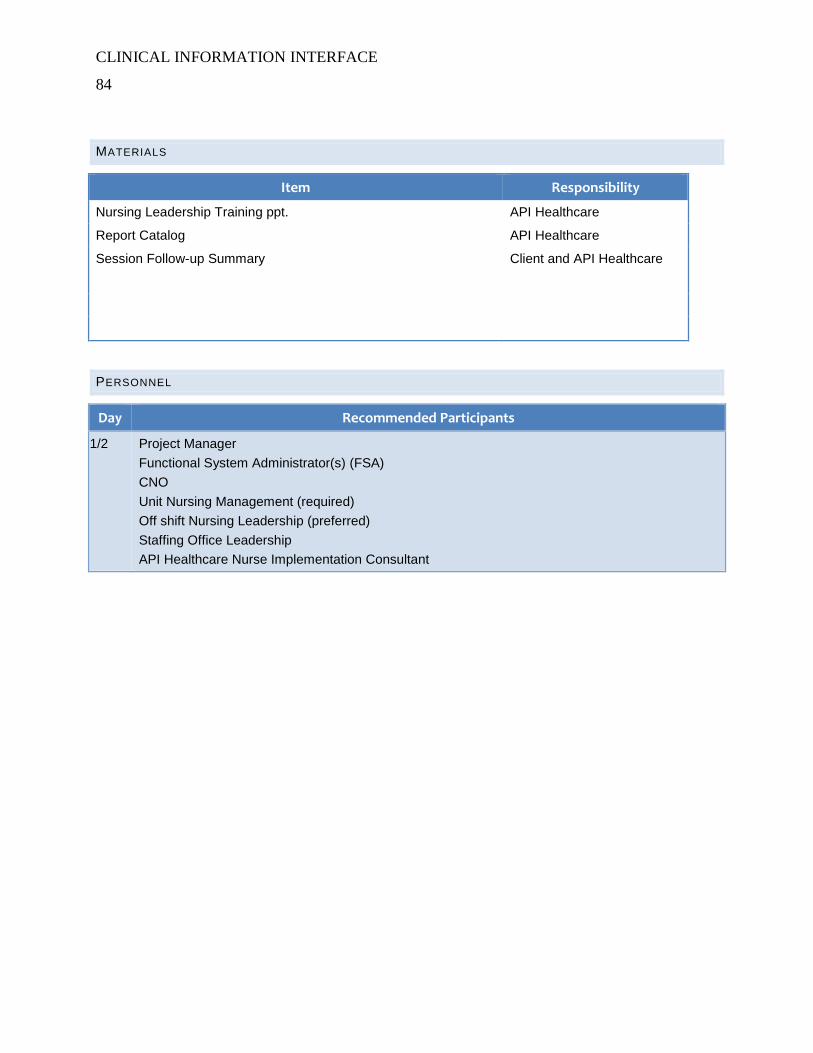
CLINICAL INFORMATION INTERFACE
84
MATERIALS
Item Responsibility
Nursing Leadership Training ppt. API Healthcare
Report Catalog API Healthcare
Session Follow-up Summary Client and API Healthcare
PERSONNEL
Day Recommended Participants
1/2 Project Manager
Functional System Administrator(s) (FSA)
CNO
Unit Nursing Management (required)
Off shift Nursing Leadership (preferred)
Staffing Office Leadership
API Healthcare Nurse Implementation Consultant

CLINICAL INFORMATION INTERFACE
85
Appendix K
Accountability Table
Salinas Valley CII Implementation Checklist
Item Date Owner Comments
Pre-Implementation
Communication to
SVMH RN staff
Thurs
12/12, Fri
12/13 SVMH
Timeline for the install, what to expect,
how to submit questions and report
issues, Info on the validation phases
after install: data validation, chart
checking, workload validation
Create a process for
documenting CII
classifications that may
be overwritten by the
Charge Nurses
Monday,
12/16 SVMH Communicate to Charge RNs
Stage 9.3.3 for SVMH
Thurs,
12/12
API
Engineering
Install 9.3.3 to test
Thurs,
12/12 Cynthia/Aaron
Test expressions in Test
Thurs
12/12, Fri
12/13 SVMH
Install 9.3.3 to live
Mon
12/16 Cynthia/Aaron
Import expressions
from Test to Live
Mon
12/16 Cynthia/Aaron
Turn on CII live feed
after install
Mon
12/16 Cynthia/Aaron
Set permission to allow
RN Charge Nurse the
ability to override CII
classifications
Mon
12/16 Cynthia
Validation of CII feed
Mon
12/16,
Tues
12/17
API
Engineering
Validate clinical elements and
documentation is being written to the
database via the HL7 feed
Communication to RN
staff of successful
install
Tuesday
12/17 SVMH

CLINICAL INFORMATION INTERFACE
86
Additional expression
testing
Mon
12/16,
Tues
12/17 SVMH
Update Expression
document
Mon
12/16,
Tues
12/17 Cynthia, Rick Rick on site Monday, Tuesday
Confirm API and
SVMH support
resources
Mon
12/16 API, SVMH
Go/No-Go meeting
Tues
12/17 SVMH, API
First Productive Use -
start classifications with
CII
Wed
12/18 Cynthia
Configure departments to utilize
documentation driven CII
Post Implementation
Staff and Charge RNs
can start looking at
classifications
Thursday
12/19 SVMH
Charge RNs use pre-defined process for
documenting classifications that they
override
Validation of CII
classifications
Wed
12/18 -
Wed
12/31
API
Engineering
Review the system, look at
classifications, verify the data for each,
and review the CII diagnostic logs.
Update communication
to SVMH RN staff on
status of CII
classification
processing
Monday,
12/23
What did we find through the validation
process, what feedback are we getting
from the RN staff and Charge Nurses?
Reminder what's planned for after the
holidays, i.e.., data validation, chart
checks
Data Validation 1/6/14 -
1/10/14
Conduct chart checks
against CII
1/6/14 -
1/10/14
Update communication
to SVMH RN staff on
results of chart checks 1/13/2014
Validate workload
validation numbers
1/13/14 -
1/17/14
API Team on site 1/20-
24/14 API
Mapping for Critical
Care instrument
1/21,22
and 24/14 API SVMH
Acuity Committee 1/23/2014 API, SVMHS Includes staff from all areas (50% direct

CLINICAL INFORMATION INTERFACE
87
meeting care providers)
Manual chart audits of
Adult In-pt tool 1/22/2014 SVMH
Lisa Garcia/Kelly Flower (MSN
Prepared RNs)
Test expressions in Test 1/28/2014 SVMH Cyndi Mar
Manual chart audits of
CC tool 2/5/2014 SVMH
Lisa Garcia/Kelly Flower (MSN
Prepared RNs)
Implement staff
education 2/4/2014 SVMH
Wendy Keema/Vanessa Irwin (e-
Learning charge RNs)
Training on the Smart
Assignment Screen 2/28/2014
Live education of charge RNs(AHNs
lead?)
Staffing by Acuity and
Smart Assignment 2/28/2014

CLINICAL INFORMATION INTERFACE
88
Appendix L
Comparison Report
CLINICAL INFORMATION INTERFACE
89
Appendix M

CLINICAL INFORMATION INTERFACE
90
Assignment Report
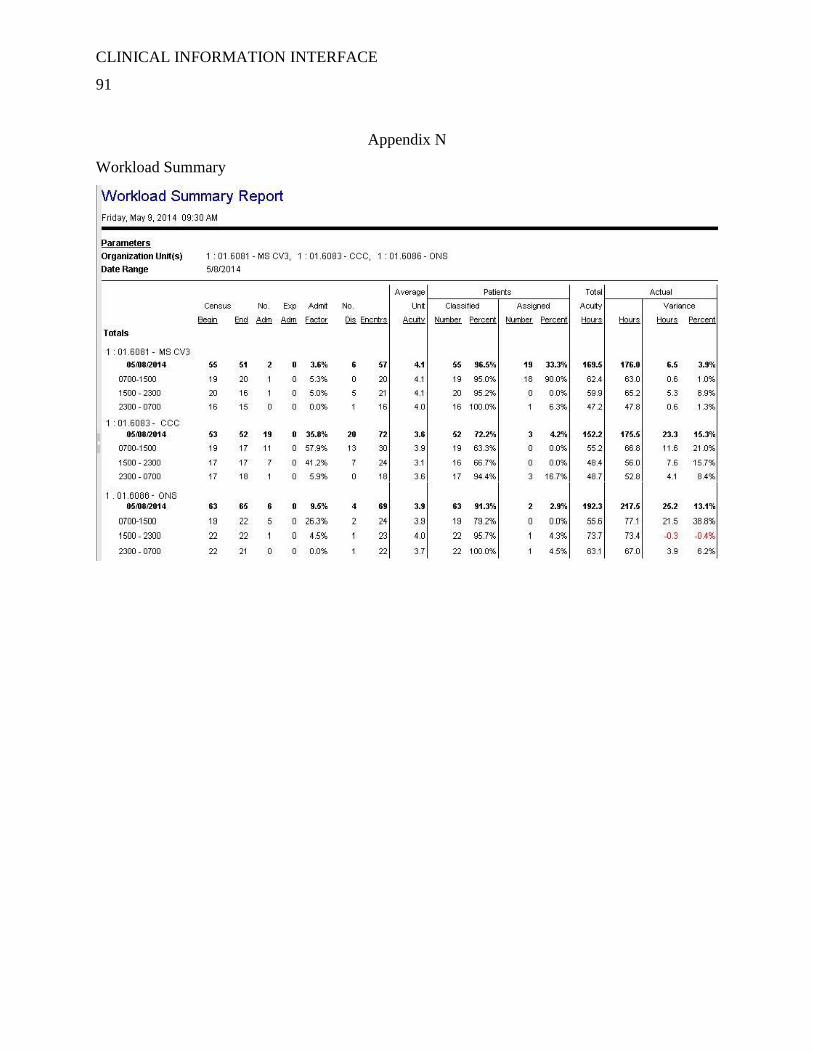
CLINICAL INFORMATION INTERFACE
91
Appendix N
Workload Summary
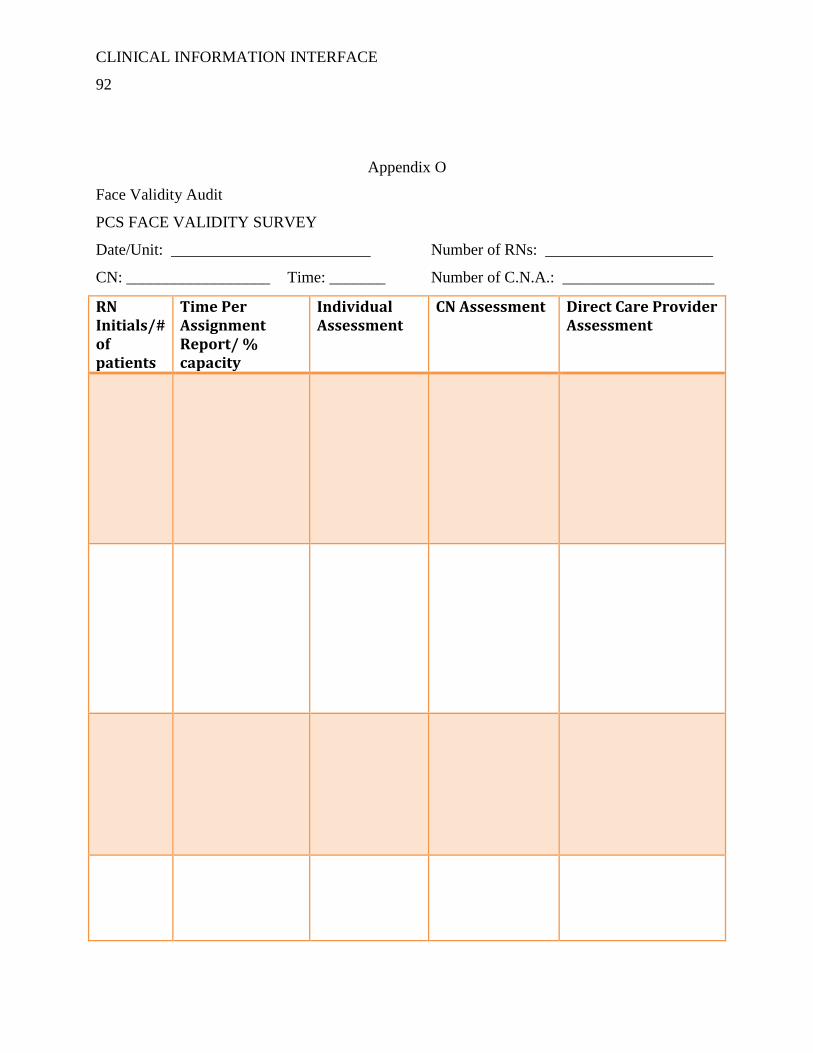
CLINICAL INFORMATION INTERFACE
92
Appendix O
Face Validity Audit
PCS FACE VALIDITY SURVEY
Date/Unit: _________________________ Number of RNs: _____________________
CN: __________________ Time: _______ Number of C.N.A.: ___________________
RN Initials/# of patients
Time Per Assignment Report/ % capacity
Individual Assessment
CN Assessment Direct Care Provider Assessment

CLINICAL INFORMATION INTERFACE
93
PCS FACE VALIDITY SURVEY: Instructions
1. Review Assignment Report:
a. Add amount of time assigned to each RN
b. Note number of patients assigned to each RN
2. Scan the unit. Using your critical thinking as a charge RN and staff RN:
a. Does the amount of time indicated on the Assignment Report match reflect what
you see?
b. Enter, under Individual Assessment, if you believe the assignment is Light,
Average or Heavy (L, A, H).
c. If the assignment is ranked differently than your assessment, provide rationale for
your ranking.
3. Speak with CN:
a. Enter under CN Assessment, charge nurse’s ranking of assignment (L,A, H).
b. If the assignment is ranked differently than the CN assessment, provide rationale
for CN ranking.
4. Speak with RN:
a. Enter under Direct Care Provider Assessment, DCP’s ranking of assignment (L,
A, H).
b. If the assignment is ranked differently than the DCP’s assessment, provide
rationale for DPC’s ranking.

CLINICAL INFORMATION INTERFACE
94
Appendix P
Cross-Compare
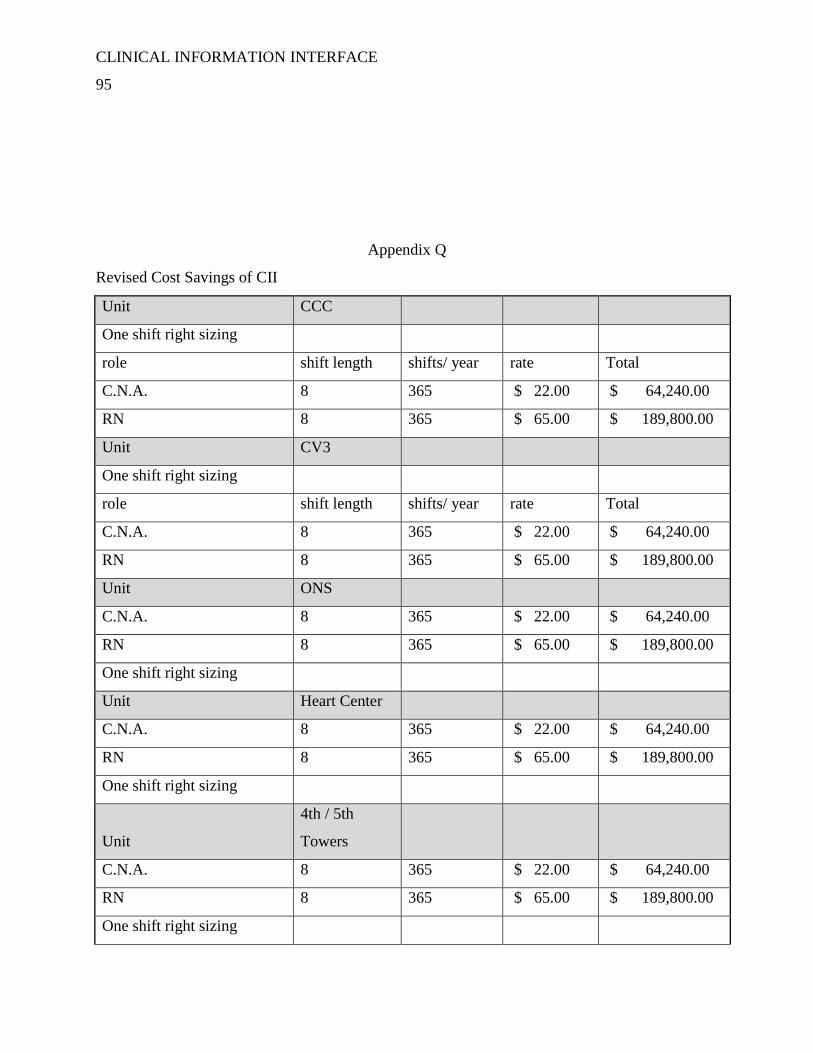
CLINICAL INFORMATION INTERFACE
95
Appendix Q
Revised Cost Savings of CII
Unit CCC
One shift right sizing
role shift length shifts/ year rate Total
C.N.A. 8 365 $ 22.00 $ 64,240.00
RN 8 365 $ 65.00 $ 189,800.00
Unit CV3
One shift right sizing
role shift length shifts/ year rate Total
C.N.A. 8 365 $ 22.00 $ 64,240.00
RN 8 365 $ 65.00 $ 189,800.00
Unit ONS
C.N.A. 8 365 $ 22.00 $ 64,240.00
RN 8 365 $ 65.00 $ 189,800.00
One shift right sizing
Unit Heart Center
C.N.A. 8 365 $ 22.00 $ 64,240.00
RN 8 365 $ 65.00 $ 189,800.00
One shift right sizing
Unit
4th / 5th
Towers
C.N.A. 8 365 $ 22.00 $ 64,240.00
RN 8 365 $ 65.00 $ 189,800.00
One shift right sizing

CLINICAL INFORMATION INTERFACE
96
Unit ICU
RN 12 365 $ 65.00 $ 284,700.00
One shift right sizing
$ 1,554,900.00
Appendix R
Skills Checklist
Patient Classification System
Skill Checklist
Charge Nurse Unit:______________
Performance Criteria: The (Charge Nurse) is able assign patients to staff and classify patients.
Directions: Trainee initials the “initial” column when
independently able to perform, under the supervision of
a trainer, the following:
Initial when completed
o Access Virtual Desktop
o Access API PCS LIVE (TRAIN)
o Patient Classification Screen Overview
(Filter, Tools, Alerts, Patient List, Coverage
Period, Organization Unit, Staff List, Summary
Column)
o Assign Patients
Patient List
Assignment Details Pane
Edit Assignment Pane
Staff List
Selections from Employee Tiles
Employee Detail Pane
Break Relief Assignment
Reassignment of Patient
Coverage
o Classify Patients
Patient Information Area
View Patients
Dimensions Care Categories
Classify Patient
Self-Assign Patients (New Admissions
Only)

CLINICAL INFORMATION INTERFACE
97
o Reports
Assignment Report
Employee Classification Compliance
Report
Unit Classification History Report
Trainee (Print): ______________________________________ Trainee Initials:___________
Trainee (Signature):________________________________ Date: ___________________
** Note: My Signature verifies I have completed this checklist and understand the content.
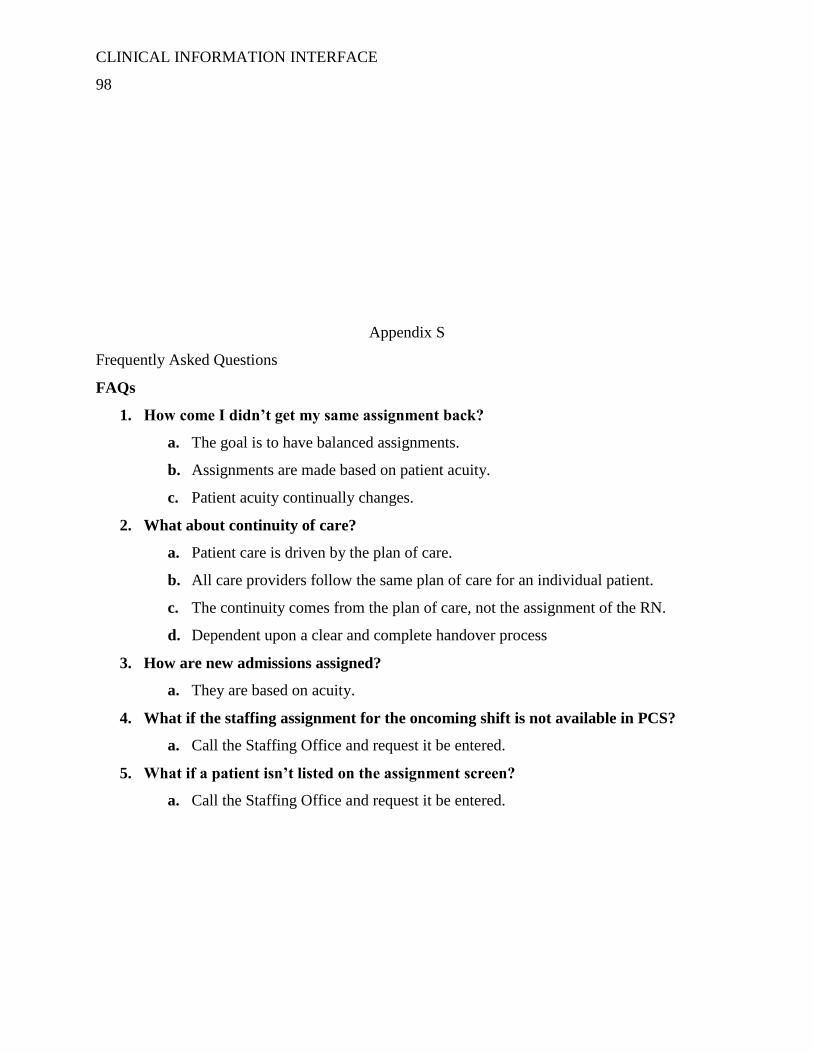
CLINICAL INFORMATION INTERFACE
98
Appendix S
Frequently Asked Questions
FAQs
1. How come I didn’t get my same assignment back?
a. The goal is to have balanced assignments.
b. Assignments are made based on patient acuity.
c. Patient acuity continually changes.
2. What about continuity of care?
a. Patient care is driven by the plan of care.
b. All care providers follow the same plan of care for an individual patient.
c. The continuity comes from the plan of care, not the assignment of the RN.
d. Dependent upon a clear and complete handover process
3. How are new admissions assigned?
a. They are based on acuity.
4. What if the staffing assignment for the oncoming shift is not available in PCS?
a. Call the Staffing Office and request it be entered.
5. What if a patient isn’t listed on the assignment screen?
a. Call the Staffing Office and request it be entered.

CLINICAL INFORMATION INTERFACE
99
Appendix T
Assignment Screen

CLINICAL INFORMATION INTERFACE
100
Appendix U
Inter-rater Reliability

CLINICAL INFORMATION INTERFACE
101
Appendix V
Revised Cost/Benefit of CII Implementation
2013 2014 2015 2016
ANTICIPATED
SAVINGS
Overstaffing 0 16,224 1,554,900 1,558,010
Incremental
Overtime 0 121,680 124,722 127,840
Nurse Manager
Time 0 23,400 23,985 24,585
CDPH Survey 0 1,218 0 0
Total Savings 0 $162,522 $1,703,607 $1,710,435
OPERATING
EXPENSES
Direct Care RNs 26, 000 15,600 4,264 4,371

CLINICAL INFORMATION INTERFACE
102
Auditing RNs 0 4,480 2132 2185
Informaticists 5,600 5,600 0 0
Director,
Informatics 3,600 3,600 0 0
Misc. IT 1,300 1,300 0 0
Clinical RN
Manager 3,600 3,600 1474 1511
Total Expenses $40,100 30,580 7,870 $8,067
NET SAVINGS ($40,100) 131,942 $1,696,737 $1,702,368