Implementation of adaptive optimal operation for a semi-batch reaction system
15
Pergamon Computers chem. Engng Vol. 22, No. 1-2, pp. 185-199, 1997 Copyright © 1997 Elsevier Science Ltd Printed in Great Britain. All rights reserved PlI: S0098-1354(96)00358..4 0098-1354/97 $1%00+0.00 Implementation of adaptive optimal operation for a semi-batch reaction system D. Ruppen ~, D. Bonvin 2 and D.W.T. Rippin 3 LONZA Inc., CH-3930 Visp Switzerland 2 Institut d'Automatique, EPFL, CH-1015 Lausanne Switzerland 3 Laboratorium for technische Chemie, ETH, CH-8092 Zurich Switzerland (deceased, June 1994) (Received 19 December 1994; revised 16 October 1995) Abstract This paper presents the results of on-line optimization of the acetoacetylation of pyrrole with diketene in a laboratory-scale reactor. In addition to the desired reaction of pyrrole to 2-acetoacetyl pyrrole, there are several undesired side reactions. The selectivity can be controlled by adjusting the feed rate of diketene to a given solution of pyrrole. Variable amounts of impurities in the crude pyrrole imply different rate constants for each batch. Consequently, on-line estimation of some rate constants and subsequent adjustment of the feeding strategy through dynamic optimization are necessary to reach a desired objective. The nonlinear differential-algebraic optimization problems for both the estimation and the optimization are transformed into nonlinear algebraic optimization problems (AOP). Due to the different characteristics of the estimation and optimization problems, the resulting AOPs are solved using different techniques. Successive quadratic programming is applied to solve the AOP in the estimation, and successive linear programming is used for the optimization. Both are fast infeasible-path methods. The estimation and optimization problems are solved sequentially at given points in time. Results are presented for the minimization of batch time subject to endpoint constraints with respect to yield and two of the concentrations. Runs with and without on-line optimization are compared to demonstrate the effectiveness of the on-line strategy. © 1997 Elsevier Science Ltd 1. Introduction In batch chemical processes, materials typically pass consecutively through several unit operations such as reaction, crystallization, centrifugation, drying, etc. As undesirable variations in one production step often cannot be fully compensated for downstream, or only at high costs, corrections have to be made where the variations appear, which is often at the reaction step. Operating conditions that change from batch to batch may result in unacceptable variations of product quality, additional operations or, still worse, the loss of the batch. Consequently, it is of great importance to supervise the operation of each batch individually. The problem of safe and optimal operation of a batch reactor has two aspects: the extraction of relevant information about the present batch (estimation) and the use of this information with regard to safety and productivity (optimization). Since deviations from nom- inal behaviour often cannot be predicted before the batch is started, the information has to be acquired on-line, i.e., as the batch proceeds. A major difficulty is the fact that the key variables, such as concentrations, commonly cannot be measured on-line directly. Although industry is interested in on-line information, particularly for safety reasons, one cannot expect suitable sensors for measuring key variables directly to become standard in the near future. The concept of model-based measure- ments may provide a suitable method to circumvent this problem. However, unique relationships have to exist between measured and estimated variables. Furthermore, these relationships need to be valid over a wide range of operating conditions, thus calling for nonlinear models. For most batch processes, unique relationships between commonly measured quantities and variables to be estimated do not exist (e.g. rate constants often cannot be uniquely determined from the measured heat evolution resulting from several reactions). Furthermore, due to the wide range of operation, linear approximations of nonlinear models cannot be applied. Hence, applications in the chemical industry of model-based estimation, such as Extended Kalman filtering, represent solutions that 185
Transcript of Implementation of adaptive optimal operation for a semi-batch reaction system

Pergamon
Computers chem. Engng Vol. 22, No. 1-2, pp. 185-199, 1997 Copyright © 1997 Elsevier Science Ltd
Printed in Great Britain. All rights reserved PlI: S0098-1354(96)00358..4 0098-1354/97 $1%00+0.00
Implementation of adaptive optimal operation for a semi-batch reaction
system
D. R u p p e n ~, D . B o n v i n 2 a n d D . W . T . R i p p i n 3
LONZA Inc., CH-3930 Visp Switzerland 2 Institut d'Automatique, EPFL, CH-1015 Lausanne Switzerland
3 Laboratorium for technische Chemie, ETH, CH-8092 Zurich Switzerland (deceased, June 1994)
(Received 19 December 1994; revised 16 October 1995)
Abstract
This paper presents the results of on-line optimization of the acetoacetylation of pyrrole with diketene in a laboratory-scale reactor. In addition to the desired reaction of pyrrole to 2-acetoacetyl pyrrole, there are several undesired side reactions. The selectivity can be controlled by adjusting the feed rate of diketene to a given solution of pyrrole. Variable amounts of impurities in the crude pyrrole imply different rate constants for each batch. Consequently, on-line estimation of some rate constants and subsequent adjustment of the feeding strategy through dynamic optimization are necessary to reach a desired objective.
The nonlinear differential-algebraic optimization problems for both the estimation and the optimization are transformed into nonlinear algebraic optimization problems (AOP). Due to the different characteristics of the estimation and optimization problems, the resulting AOPs are solved using different techniques. Successive quadratic programming is applied to solve the AOP in the estimation, and successive linear programming is used for the optimization. Both are fast infeasible-path methods. The estimation and optimization problems are solved sequentially at given points in time.
Results are presented for the minimization of batch time subject to endpoint constraints with respect to yield and two of the concentrations. Runs with and without on-line optimization are compared to demonstrate the effectiveness of the on-line strategy. © 1997 Elsevier Science Ltd
1. Introduction
In batch chemical processes, materials typically pass consecutively through several unit operations such as reaction, crystallization, centrifugation, drying, etc. As undesirable variations in one production step often cannot be fully compensated for downstream, or only at high costs, corrections have to be made where the variations appear, which is often at the reaction step. Operating conditions that change from batch to batch may result in unacceptable variations of product quality, additional operations or, still worse, the loss of the batch. Consequently, it is of great importance to supervise the operation of each batch individually.
The problem of safe and optimal operation of a batch reactor has two aspects: the extraction of relevant information about the present batch (estimation) and the use of this information with regard to safety and productivity (optimization). Since deviations from nom- inal behaviour often cannot be predicted before the batch is started, the information has to be acquired on-line, i.e.,
as the batch proceeds. A major difficulty is the fact that the key variables, such as concentrations, commonly cannot be measured on-line directly. Although industry is interested in on-line information, particularly for safety reasons, one cannot expect suitable sensors for measuring key variables directly to become standard in the near future. The concept of model-based measure- ments may provide a suitable method to circumvent this problem. However, unique relationships have to exist between measured and estimated variables. Furthermore, these relationships need to be valid over a wide range of operating conditions, thus calling for nonlinear models. For most batch processes, unique relationships between commonly measured quantities and variables to be estimated do not exist (e.g. rate constants often cannot be uniquely determined from the measured heat evolution resulting from several reactions). Furthermore, due to the wide range of operation, linear approximations of nonlinear models cannot be applied. Hence, applications in the chemical industry of model-based estimation, such as Extended Kalman filtering, represent solutions that
185
186 D. RUPPEN et al.
uft) I I y(t)
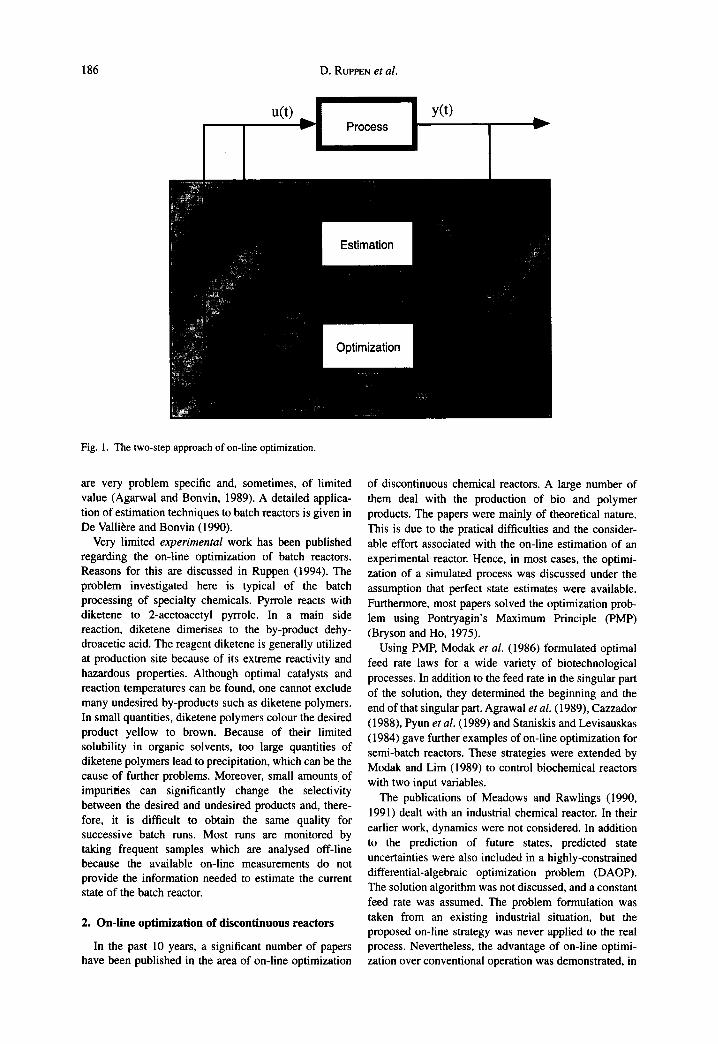
Fig. 1. The two-step approach of on-line optimization.
are very problem specific and, sometimes, of limited value (Agarwal and Bonvin, 1989). A detailed applica- tion of estimation techniques to batch reactors is given in De Valli&e and Bonvin (1990).
Very limited experimental work has been published regarding the on-line optimization of batch reactors. Reasons for this are discussed in Ruppen (1994). The problem investigated here is typical of the batch processing of specialty chemicals. Pyrrole reacts with diketene to 2-acetoacetyl pyrrole. In a main side reaction, diketene dimerises to the by-product dehy- droacetic acid. The reagent diketene is generally utilized at production site because of its extreme reactivity and hazardous properties. Although optimal catalysts and reaction temperatures can be found, one cannot exclude many undesired by-products such as diketene polymers. In small quantities, diketene polymers colour the desired product yellow to brown. Because of their limited solubility in organic solvents, too large quantities of diketene polymers lead to precipitation, which can be the cause of further problems. Moreover, small amounts, of impurities can significantly change the selectivity between the desired and undesired products and, there- fore, it is difficult to obtain the same quality for successive batch runs. Most runs are monitored by taking frequent samples which are analysed off-line because the available on-line measurements do not provide the information needed to estimate the current state of the batch reactor.
2. On-line optimization of discontinuous reactors
In the past 10 years, a significant number of papers have been published in the area of on-line optimization
of discontinuous chemical reactors. A large number of them deal with the production of bio and polymer products. The papers were mainly of theoretical nature. This is due to the pratical difficulties and the consider- able effort associated with the on-line estimation of an experimental reactor. Hence, in most cases, the optimi- zation of a simulated process was discussed under the assumption that perfect state estimates were available. Furthermore, most papers solved the optimization prob- lem using Pontryagin's Maximum Principle (PMP) (Bryson and Ho, 1975).
Using PME Modak et al. (1986) formulated optimal feed rate taws for a wide variety of biotechnological processes. In addition to the feed rate in the singular part of the solution, they determined the beginning and the end of that singular part. Agrawal et al. (1989), Cazzador (1988), Pyun et al. (1989) and Staniskis and Levisauskas (1984) gave further examples of on-line optimization for semi-batch reactors. These strategies were extended by Modak and Lim (1989) to control biochemical reactors with two input variables.
The publications of Meadows and Rawlings (1990, 199 l) dealt with an industrial chemical reactor. In their earlier work, dynamics were not considered. In addition to the prediction of future states, predicted state uncertainties were also included in a highly-constrained differential-algebraic optimization problem (DAOP). The solution algorithm was not discussed, and a constant feed rate was assumed. The problem formulation was taken from an existing industrial situation, but the proposed on-line strategy was never applied to the real process. Nevertheless, the advantage of on-line optimi- zation over conventional operation was demonstrated, in

Adaptive optimal operation
a pseudo on-line fashion, using previously-collected data from the real process.
Ponnuswamy et al. (1987) presented an experimental analysis of both open-loop and closed-loop optimal control for a batch polymerization reactor. A multi- variable feedback controller was implemented to track, in the presence of process disturbances, the optimal state trajectories previously obtained by solving an open-loop optimal control problem.
The meaning of on-line optimization as used in this work is briefly introduced. The principle is illustrated in Fig. 1. A two-step procedure of model identification (estimation) followed by the computation of an optimal control policy (optimization) on the basis of the identified model is used. This helps track a changing process over a wide range of operating conditions. In the following, the sequence of estimation and optimization is referred to as an estimation-optimization task (EOT).
Clearly, this is a closed-loop scheme. Moreover, both the estimation and the optimization are based on a model that usually is nonlinear. In the estimation step, an optimal description (i.e. estimates of parameters and
for semi-batch systems 187
states) of the actual plant is chosen based on past and present measurements. The optimization step uses this model to compute a control variable profile that optimizes a given objective function. The EOTs are repeated at selected points in time. Note that the expressions adaptive, model-based or predictive could also be associated with this type of on-line optimization. The closed-loop scheme implies a feedback structure and, if the interval between two successive EOTs is small, resembles conventional feedback control.
3. Experimental setup
The experimental work of this study was performed on the bench-scale calorimeter BSC-81, originally developed by CIBA-GEIGY. That prototype was later modified and commercialized by METTLER-TOLEDO under the name Reaction Calorimeter RC-1. Both calorimeters are ideal tools for deriving thermal informa- tion for batch or semi-batch reaction systems under conditions similar to those encountered in industrial reactors. Since several authors (Regenass, 1978; Karlsen and Villadsen, 1987; De Valli~re, 1989) have described
I I
r j i [ . I
L
i 1,4,6,8,9,10 i 2,3,S,7,11,12,21,22
Fig. 2. Reaction calorimeter with data acquisition and control hardware.

188 D. RUPPEN et al.
the BSC-81 extensively, only three extensions to the original system are discussed here. The extended BSC- 81 is schematized in Fig. 2.
As a first extension, two scales and two pumps were added to run semi-batch experiments. The inlet tem- peratures are measured to support heat-balance calcula- tions if necessary (not used in this study).
Second, the original data-logging and data-processing unit (a LSI- 11 computer) was extended. The software of the BSC-81 was modified to support a two-way data link with a PC which itself had a two-way link to a Micro- VAX computer. The PC was used to process additional inputs and outputs (e.g. from scales and pumps) as well as to control the data links. On the Micro-VAX computer, user-friendly high-level software packages were available (MATLAB, FORTRAN) with which the software used in this study was developed. Moreover, the multi-tasking capability of the Micro-VAX was used
Table 1. Estimated parameters from the validation run
Number of measurements 3 (Fig. 4) 7 (Fig. 5) 12
kA estimated 0.048 0.053 0.053 kD estimated 0.106 0.136 0.128 k o estimated 0.022 0.028 0.028 k F estimated 0.005 0.0 0.001
for user input, data display and data storage on one hand, and data processing (estimation and optimization) on the other.
As a third extension, torque, conductivity and pH sensors were added. However, these measurements were not used in this study.
Measured data were transferred in one direction and calculated or user-supplied information in the other. The controllers and the safety system originally implemented on the LSI-11 remained active. The feed rate controllers were the only controllers implemented on the Micro- VAX.
Composition measurements were carried out using a HP 5890 gas chromatograph. A 25 m long and 0.32 mm thick HP 101 methyl silicone capillary column was used. The gas chromatograph was equipped with an autosam- pier. The data from the FID detector were fed to a HP 3393 A integrator. Calibration was performed using Hexan (>99.9%) as an internal standard. Sampling was as follows: a sample of 2 ml was taken out of the reactor and poured into a flask where a known amount of cooled toluene and internal standard (0°C, 10 ml) were present. This procedure was able to practically stop the reactions. The concentrations of diketene (D), dehydroacetic acid (DHA) and 2-acetoacetyl pyrrole (PAA) were deter- mined quantitatively. Since the FID signal from pyrrole (P) and pyridine (K) could not be separated, the concentration of pyrrole was not measured. The standard
Table 2. Design of experimental runs
Run number 1 2 3 4
On-line optimization Yes No, feed profile from Run 1 Yes No, feed profile from Run 3 Init. conc. of catalyst, pyridine [mol/1] 0.253 0.126 0.189 0.189 Amount of DHA-promoter, DABCO [mol/1] 0.00025 0 0 0.00025 The initial concentration of pyrrole (cp(tst~)=0.72mol I - ' ) and the reaction temperature (TR=50°C) were identical for all runs.
Table 3. Computational characteristics for Runs 1 and 2 (Est: estimation, OPT: optimization, CON" constraints)
Run number 1 2
Task EOT 1 EOT 2 EOT 3 Off-line Est Off-line Est
Measurements 4 and 5 4 to 8 4 to 11 4 to 17 12
F.ST Number of iterations, SQP 4 4 4 Weighted sum of residuals squared 0.27 1.84 9.03 Estimated k A 0.058 0.059 0.059 Estimated ko 0.208 0.224 0.235 Estimated k o 0.034 0.034 0.036 l'f, e s t 124 179 248
OPT Number of iterations, SLP 4 5 4 Number of pivotings in the LP subproblem for each iteration [4 5 3 5] [3 4 4 4 5] [3 4 4 5] tf.o~ 319 328 336 f~*102 ~--0) 0.0925 0.0831 0.0791 tj.~ (relative to tf.~,) 178 135 75 tf (relative to tf.~,,) 195 149 88
CON Constraint (4a), violation if negative Constraint (4b), violation if positive Constraint (4c), violation if positive
4 4 57.04 28.01 0.063 0.035 0.268 0.105 0.041 0.037
+5% - 18% - 6 % -31% - 5 0 % 0 %

Adaptive optimal operation for semi-batch systems
Table 4. Computational characteristics for Runs 3 and 4 (EST: estimation, OPT: optimization, CON: constraints)
189
Run number 3 4
Task EOT 1 EOT 2 EOT 3 EOT 4 EOT 5 Off-line Est Off-line Est
Number of measurements 2 4 6 8 11 16 10
EST Number of iterations, SQP 4 4 4 4 4 5 5 Weighted sum of residuals squared 0.77 11.83 21.27 36 .81 38.49 120.9 150.18 Estimated k A 0.038 0.038 0.037 0.037 0.038 0.045 0.046 Estimated kD 0.074 0.080 0.085 0.094 0.098 0.115 0.197 Estimated ko 0.033 0.031 0.031 0.033 0.034 0.038 0.032 t~=~t 97 158 201 239 304
OPT Number of iterations, SLP 3 2 2 2 3 Number of pivotings in the LP subproblem for [2 4 0] [3 4] [4 5] [5 4] [5 10 0]
each iteration tl.o~ 214 319 350 366 378 fB.102 (f2=0) 0.164 0.130 0.099 0.085 0.068 tu, 2 (relative to tf.e~t) 149 128 120 103 55 tf (relative to tc,~t) 184 161 149 126 74
CON Constraint (4a), violation if negative +2.5% - 7% Constraint (4b), violation if positive + 5% + 27 % Constraint (4c), violation if positive - 35%
deviation of the concentration measurements was esti- mated on the basis of the sampling procedure and instruments calibration to be approximately 5%.
4. Kinetic and reactor model
There is no reported study about the acetoacetylation of pyrrole with diketene. The acetylation reaction using amines as catalysts and the kinetics of the diketene dimerization were studied by several researchers (Briody and Satchell, 1964, 1965; Knizek et al., 1985).
4.1. Kinet ic mode l
Both a simple model and a more detailed model were investigated by Ruppen (1994). The latter performed better in the conditions used for the kinetic investiga- tions (discrete, shot-wise addition of diketene). How- ever, under the operational conditions of interest (con- tinuous feed addition), the simple model performed at
least equally well as the more detailed model (for reasons given in Ruppen, 1994) and, thus, was chosen for this study.
The reaction system was approximated as follows:
K
P + D - . PAA ( la)
K
D + D ---, DHA ( lb)
K
D - . oligomers (1 c)
K
PAA+D - . F ( ld)
K
( D H A + D - - . G) ( le)
with P: pyrrole, D: diketene, K: pyridine (catalyst), PAA: 2-acetoacetyl pyrrole, DHA: dehydroacetic acid, F and G: by-products.
The corresponding rate laws are:
rPAA =kACDCp (2a)
O. 16 - - - - - - - - - - - - ~ ~
0.14
0.12
~ 0.1
0.08
0.06
0.04 0 50 100 150 200 250
reaction time [minl
300
Fig. 3. Feed rate for the model validation run.

190
rD.^ = koc 2 (2b)
ro=koc D (2c)
rF=kFCPAAC D (2d)
with the four kinetic parameters kA[l mol -~min -~], ko[l tool - Imin - i], ko[min -i] and kF[l mol - Imin -i].
The observed reaction of DHA with diketene (I e) was not considered in order to keep the model as simple as possible. In the present case, 40--45% of diketene added formed oligomers and other unknown products, and these were summarized in a single reaction (Ic). Furthermore, the rate constants depend upon the polarity of the reaction medium. Since the reaction medium changed from an initially highly apolar state to a more
polar state, the rate constants increased accordingly. This polarity effect was observed at the beginning of a run for concentrations of PAA below 0. I M. Consequently, the
D. RUPPEN et al.
kinetics were only modelled for concentrations of PAA>0.1 M. The model description is adequate but certainly not excellent, as will be seen later.
4.2. Reactor model
Since the reaction is run in semi-batch mode in which a moderately-diluted solution of diketene is added continuously, the change in reactor volume has to be taken into account. The dilution of catalyst is considered by normalizing the rate constants with respect to the reaction volume. This is realized for all rate constants except k o since it is assumed that the rate of oligomeriza- tion is also promoted by other intermediate products. In the course of the reaction, the concentrations of these intermediates increase whereby the oligomerization is accelerated. This compensates somewhat for the
Concentration D [mol/1] 0.14,
t 0.1 I
0'08! ° * ~ 0.06 . . . .
0.18
0.16
0.14
0.12
0.1
0.08
0.06
0.04
0.021 0
0.3
I I
100 200 300
time [min]
Concentration DHA [mol/l]
0.04
0.02 0
I I
100 200
Concentration PAA [mol/l] 0.35 , ,
0.25
0.2
0.15
0.1 0
0.6
0.55
0.5
0.45
0.4
0.35
0.3
0.25
0.2
0.15 0
300 I I
100 200
time [rain]
Concentration P [tool/l] i i
Not measured
I I
100 200 300 300
time [rain] time [mini
Fig. 4. Model fitting and predictions using 3 measurements. D, measurement used to define the initial condition; O, measurements used for parameter estimation and model prediction; *, subsequent measurements used for model validation; • • . , initial profiles for the SQP iterations; - - , predicted profiles using the collocation approach; - - • - - predicted profiles using numerical integration.

Adaptive optimal operation for semi-batch systems
decrease in oligomerization rate due to the dilution of catalyst. Assuming constant density and isothermal operation, the reaction model can be written as follows:
dco(t) _ _ kx Ca(t)cD(t) - 2 kD C~(t) -- koct)(t)
dt vR(t) VR(t)
kv f(t) [col- Co(t)] v-~t ) CpAA ( t )cD( t ) +
co(O)=cm, (3a)
dce(t) _ _ kA. ca(t)cD(t)-- f(~). ca(t) Cp(0)=Cm, (3b) dt vR(t) VR(t)
dCaAA(t) kA Cp(t)Co(t) - kF dt - VR(t) ~ CaAA(t)cD(t)
~t.). CpAA(t) CpAA(0 ) = CeAA0, (3c) vR(t)
dCD.A(t) = kD cg( t ) _ fit--) CDHA(t) dt VR(t) vR(t)
CDUA(0) = CDHA0, (3d)
191
dvR(0 - - =fit) VR(0)=VRo, (3e)
dt
where col, vR(t) andf(t) denote the concentration of D in the feed stream [mol/I], the volume [I] and the feed rate [l/min], respectively. The first measurement after CpAA >0.1 M defined the initial values.
4.3. Parameter est imation
An efficient method for solving nonlinear parameter estimation problems was published by Tjoa and Biegler (1991). The control and state variables are para- meterized, and the differential equations reduced to algebraic form using orthogonal collocation. The result- ing algebraic optimization problem (AOP) is solved with an infeasible-path method. Successive quadratic pro- gramming (SQP) is the infeasible-path method of choice to solve the AOP for reasons given in Ruppen et al. (1991)
The effectiveness of the SQP method is documented
Concentration D [mol/1] 0.14 , ,
0.12
0.1
0.081 ° ° o
0.06
0.04 o o
0.02 r I 0 100 200
time [min]
0.18
t i t
300
Concentration DHA [mol/1]
0.16
0.14
0.12
0.1
0.08
0.06
0.04
0.02 0
I
i00 200
time [mini
300
0.35
0.3
0.25
0.2
0.15
0.1 0
0.6
0.55
0.5
0.45
0.4
0.35
0.3
0.25
0.2 0
',oncentration PAA [mol/l] I I
° ~
I [
100 200
time [min]
Concentration P [mol/1] I I
Not measured
100 200
time [min]
300
300
Fig. 5. Model fitting and predictions using 7 measurements (see also caption of Fig. 4).

192
by the small number of iterations needed (this will be seen later in Tables 3 and 4). High-dimensional problems with 277 variables and 275 constraints were solved. Since the Hessian of the Lagrangian function approxi- mated that of the objective function after a few iterations already, the estimation converged quickly and robustly, although the problem was not scaled and was charac- terized by an ill-conditioned Hessian matrix (eigenva- lues between 10 and 105). Moreover, the initial solution profiles differed significantly from the optimal ones. Starting from different initial solutions always yielded the same estimates. No convergence problem was observed. The Hessian update formula used for the later iterations was that adapted to large residuals (Tjoa and Biegler, 1991). The advantage of the adapted BFGS Hessian update over the conventional BFGS approxima- tion was noticed.
4.4. Model validation
The extrapolative accuracy of the model is of importance with regard to on-line optimization. In order to test that property, a model validation run was performed. The feed rate profile given in Fig. 3 was pre- specified. Model fitting and predictions using the fitted model are shown in Figs 4 and 5. Parameter estimation
f(t)
level 1=fl
,9 b
'reaction part'
level 2=f 2
t12 tf 'safety part'
Fig. 6. Parameterization of the feed rate profile.
D. RUPPEN et al.
I P
t
was performed using 3 and 7 measurements, respec- tively. For the predictions presented in Fig. 4, only the first three concentration measurements for the three species D, PAA and DHA were used (as the first measurement was used to define the initial values). The dotted lines in Figs 4 and 5 indicate the initial concentration profiles used to start the SQP iterations. Once the parameters were obtained, the model was also integrated numerically using Gear's method for stiff systems in order to check the accuracy of the collocation solution. The concentration profiles using the collocation approach are given by the solid line, whereas the more accurate profiles obtained via numerical integration are represented by dash-dotted lines (in most cases not distinguishable from the solid lines).
When the estimation is based on more measurements, the accuracy of the predicted profiles improves slightly (Fig. 5). However, the deficiency of the model remains evident. The estimated parameters are given in Table 1. The decrease for kD toward the end of the batch can be explained by the neglected formation of G. Furthermore, the estimation of kF is inaccurate.This is not surprising, since it is difficult to separate the formation of F from the measurement noise. Even in the case of more measure- ments, the model mismatch remains significant and makes the identification of k F difficult.
5. Exper imenta l on-l ine opt imizat ion
The optimization objective was defined as that of minimizing the reaction time while satisfying the dynamic constraints (3a)-(3e) and the following three endtime specifications:
1. A production of at least 0.42 mol PAA is desired:
CpAA(t:)vR(t:)>--0.42 mol. (4a)
Pyrrole is an expensive compound. For Cp(0)VR(0) = 0.72 mol, at least 58% of pyrrole needs to react to PAA for productivity reasons.
2. The final concentration of DHA has to be below 0.15 mol 1 -J '
~ -initialpart --Iv i
start
"1" "2" ~' tstart t O,est
- constant feed rate = 0.0008 l/rain
-initial measurements are not considered (polarity effect)
C 4
estimation horizon ~_1~, optimization hodzon~
end of batch |
l time [min] C
• . , N-1 N N+I tf,sst tf,opt t 0,opt
I -measurement 3 defines the initial conditions
-measurements 4 to N are used for the estimation
-the time at which the estimation has been completed defines the initial time for the optimization (tO.ore = tf.est)
-the estimated states at tf, es t define the initial values for the optimization
m u n ~ , . -
Fig. 7. Sequence of operations for the EOT following the Nth measurement.

Adaptive optimal operation for semi-batch systems 193
CD.A(ty)<--O. 15 mol 1 - ~. (4b) solution of pyrrole. The mathematical formulation of the
This is of practical interest since the solubility of DHA in the reaction mixture at the reaction tem- perature (50°C) is about 0.2 mol 1 - t. The solubility decreases when the reaction mixture cools down, and the maximal allowable value of 0.15 mol 1- ' is imposed to prevent precipitation at room tem- perature.
3. The final concentration of diketene has to be below 0.025 mol I -~:
co(ff)-<0.025 mol 1 - '. (4c)
Diketene is a highly toxic compound. Therefore, a small concentration is required to ease further handling of the reaction mixture.
Since the dimerization reaction is of highest order in the concentration of diketene, the selectivity can be con- trolled by adjusting the feed rate of diketene to a given
optimization problem is given as follows:
rain t/ (5) j~t)
s.t. dynamics (3a)-(3e) endpoint constraints (4a)--(4c) f~t)---0
The feed profile was parameterized as shown in Fig. 6. The length and the level of the first interval ("reaction part") are mainly influenced by constraints (4a) and (4b), whereas those of the second interval ("safety part") by constraint (4c). The number of degrees of freedom for the optimization is four (f, f~, 42 and te). At the optimum, the three endpoint constraints are fulfilled and f2 is at its lower bound ~ = 0 ) . Thus, there is no degree of freedom left at the optimum. Other profiles with more degrees of freedom were found to give no significant improvement in the objective function.
The three rate constants kA, ko and ko were estimated. The value of k F was set to 0.001. This was the largest value found in all model evaluation runs and was
0.1
0.08 - -
0.06
0.04
0.02
0.35
0.3
0.25
0.2
0.15
0.I
0.05
O~ 0
Feed rate*f00 [l/nnn] i i l
I . . . . . . .
I
I
024 rain)
tf,opt = 319 min
I I
100 200
time [rain]
PAA [tool/l] i i
/-
/
/
/
/
i i
/ I I
100 200 300
time [min]
[ t f , ° P
3O0 4OO
400
0.07
0.06
0.05
0.04
0.03
0.02 0
0.16
0.14
0.12
0.I
0.08
0.06
0.04
0.02
0
Diketene [molA]
t
I I
I00 200 300
time [rain]
DHA [moU1] I I I
/
/
/
/
/
/
/
! C i J I
100 200 300
time [rninl
4OO
4OO
Fig. 8. Results of EOTI performed after 124 min using 2 measurements (O) and subsequently checked with 3 additional measurements (*) (Run 1).

194
considered to be an upper bound. Therefore, setting kF to a large value and neglecting the formation of G can be considered as a "worst-case assumption", i.e., on the safe side with respect to the endpoint specifications (4a) and (4b), respectively. The effect of too large a kF-value on the endpoint constraint (4c) is negligible. As was seen in Figs 4 and 5, the concentration of diketene shows the largest prediction errors. However, when the feed rate decreases, the diketene concentration is systematically overpredicted and, again, one is on the safe side with respect to the endpoint specification (4c).
The optimization strategy is here to perform several EOTs. An EOT consists of an estimation with SQP and a subsequent optimization with successive linear pro- gramming (SLP). Ruppen et al. (1991) proposed a suitable optimization strategy for batch and semi-batch chemical processes. The same strategy was also used in the present work. As was done for the estimation, the DAOP is transformed into an AOP. Here, the AOP is preferably solved by SLP rather than by SQP for the following main reasons (Ruppen, 1994):
1. There are only a few degrees of freedom (Ndof) at the
D. Ruvpr~r~ et al.
optimum, and the efficiency of SLP increases with decreasing Ndof,
2. SLP is less sensitive to poor scaling, 3. SLP is often more robust than SQP, especially when
no good estimate of the Hessian matrix (used in the SQP algorithm) is available.
The optimization utilizes the rate constants resulting from the preceding estimation step and the concentra- tions obtained from integrating the current best model from the initial time to the present time.
The measurement procedure was as follows. A sample was drawn approximately every 20 min. 28 min were necessary for preparing the sample, analyzing it and entering the results in the VAX-computer where the estimation and the optimization were performed. The computational time needed for the EOT was negligibly small compared to that for the sampling and analysis operations. Additional details regarding the sequencing of measurements and EOTs are given in Fig. 7. Each measurement consisted of three values: concentration of D, PAA and DHA.
The experimental runs given in Table 2 were per-
0 .1
0.08 - -
0.06
0.04
0.02
0.35
0.3
0.25
0.2
0.15
0.1
0.05
Feed rate* 100 [l/min] i i [
(179 rain)
I f , o p t = 3 2 8 m i n
I L
100 200
time [rain]
PAA [mol/1] i i i
:
z
/
+ /' x
I itf,oP 300 400
0.06
0.055
0.05
0.045
0.04
0.035
0.03
0.02. ¢
0.15
0.1
0.05
Diketene [mol/l] I I I
%~,J ** x
I I I
100 200 300
time [min]
DHA [mol/l]
400
0 100 200 300 400 0 400
I I I/--
/ /
/
/ x
t I
100 200 300
time [min] time [min]
Fig. 9. Results of EOT2 performed after 179 min using 5 measurements (O) and subsequently checked with 3 additional measurements (*) (Run l).

Adaptive optimal operation for semi-batch systems
formed. In two of the runs, a very small quantity of DHA-promoter (DABCO) was added to modify the rate constants. Runs 1 and 3 were carried out using the on- line optimization strategy. The resulting optimal feed profiles were then implemented in an open-loop scheme on other runs characterized by a different amount of DHA-promoter (Runs 2 and 4, respectively) to demon- strate the advantage of closed-loop operation through on-line optimization.
5.1. Run 1
A graphical representation of the successive EOTs for Run l is given in Figs 8-10. The two early measure- ments that were not considered because of the polarity effect are indicated by × . The third measurement (Fq) defines the initial conditions. Measurements 4 to N (©) are used in the estimation step. The (N+l)st and subsequent measurements (*) are used for model validation purposes only.
Figure 8 shows the results of EOT1 using only two measurements (N=5, t0.ea=56 rain, tr~,t= 124 min). The solid lines represent the estimated profiles obtained from
195
integrating the actual best model from to~, to tt~,,. The dash-dotted lines indicate the feed rate and concentration profiles predicted by the optimization step. After 124 rain, the optimization proposed an increase in the feed rate and predicted a final batch time of 319 rain. The figure also compares the prediction of EOTI with 3 additional measurements.
As the operator noticed a slight underprediction of CDn ̂(polarity effect), he decided to perform EOT2 using the five available measurements as shown in Fig. 9 ( N = 8 , t0..,=56 min, tt.,t= 179 min). Due to the observed acceleration in the formation of DHA (the estimated ko- value increased from 0.208 to 0.224), the second optimization step proposed a reduced feed rate. Conse- quently, the predicted optimal batch time increased from 319 to 328 min. The figure also compares the prediction of EOT2 with 3 additional measurements.
EOT3 was performed using the eight available measurements as shown in Fig. 10 (N= 1 I, t0.~,=56 min, tc~t=248 min). As the estimated kD-ValUe increased from 0.224 to 0.235, the optimization proposed a still lower feed rate and a slightly larger batch time (tf.opt= 336 min).
Feed rate* 100 [l/min] 0.1 , , , 0.06
0.08
0.06
0.04
0.02
0 0
0.35
0.3
0.25
0.2
0.15
0.1
0.05
(248 min)
tf, opt = 336 min
I I I
I00 200 300
time [rain]
PAA [tool/l] //'
0.05
0.04
tt 0.03
0.02
tif'°P 0.01 400 0
0.15
0.1
0.05
I ~ I t I
0 100 200 300 400
time [mill]
Diketcne [mold] I I I
I X
I
i I
I
i X
g I I I
100 200 300
time [rain]
DHA [tool/l] I I I / "
]*** / ,
X I I t
100 200 30o
time [Iv.in]
4OO
4OO
Fig. 10. Results of EOT3 perfomed after 248 rain using 8 measurements (O) and subsequently checked with 6 additional measurements (*) (Run I).

196 D. RUPPEN et al.
The figure also compares the prediction of EOT3 with 6 additional measurements. The operator decided to per- formed no additional EOT and finished the batch as proposed by EOT3. The relative deviations in the endpoint constraints were: yield(tf)=+5% (no violation); ¢DHA(tf) = - - 6 % (no violation); C D ( t f ) = - 5 0 % (no viola- tion). Additional computational elements are given in Table 3.
5.2. Run 2
The optimal feed rate profile obtained for Run 1 was implemented in Run 2 as an open-loop strategy. The results are presented in Fig. 11. Here, time 0 corresponds to t0,es t and not to the initial time of the experiment tst ~. In contrast to Run 1, there was no DHA-promoter present and a smaller concentration of catalyst was used. The relative deviations in the endpoint constraints are: yield ( t / ) = - 1 8 % (serious violation), CDHA(t:)=--31% (no violation), CD(t/)=0% (no violation).
Once the run was performed and all the measurements
available, the parameters were estimated in order to compare them with those of Run 1. The results are given in Table 3. The estimated parameters were then used to compute the concentration profiles given in Fig. 11.
5.3. Runs 3 and 4
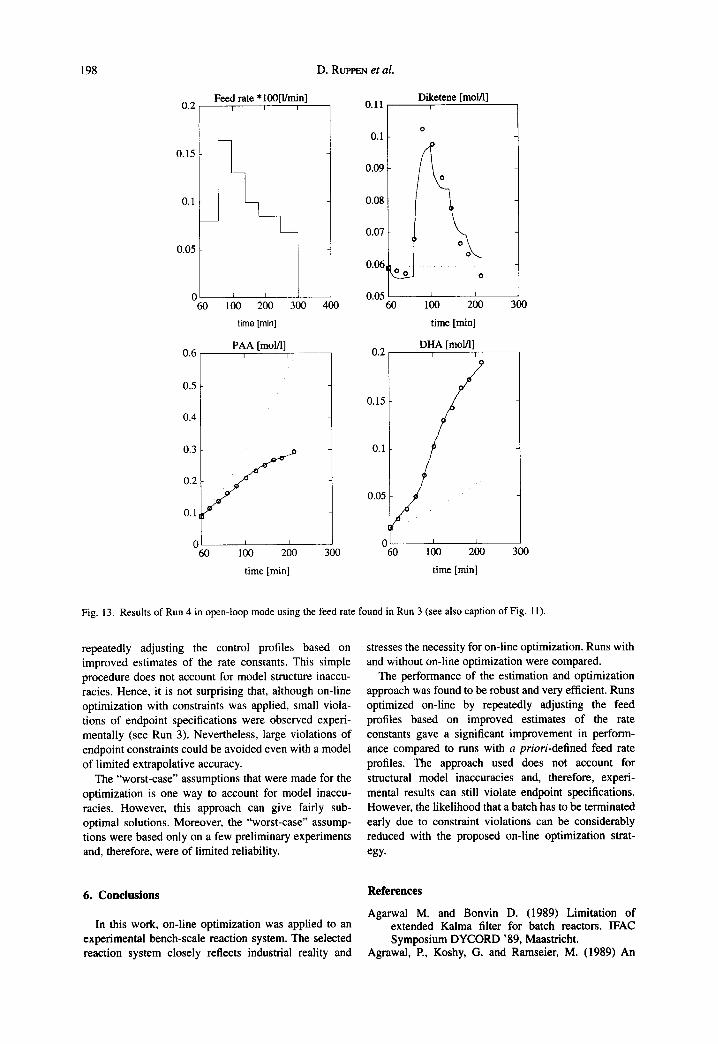
The same procedure was also applied to Runs 3 and 4. The final optimization results are illustrated in Figs 12 and 13 and summarized in Table 4. Run 4 had to be interrupted after 220 rain to prevent precipitation. The relative deviations in the endpoint constraints were: yield (ty)=- 7% (small violation); CDaA(tf)=+ 27% (seri- ous violation).
5.4. Algorithmic issues
The initial solutions for estimation (SQP) and optimi- zation (SLP) were chosen highly infeasible. Once the on-line optimization had been completed, each EOT step was repeated using two initial profiles different from that
0 . 1 - - - -
0.08 - -
0.06
0.04
0.02
Feed rate* 100 [1/min] T T - -
X-1
0 L A m 0 1~ 2 ~ 3 ~
PAA [mol/l] 0.35 ,
0.3
0.25
0.2
0.15
0.1
0.05 0 100 200 300
time [min]
0.08
0.07
0.06
0.05
0.04
0.03
0.02 0
0.12
0.1
0.08
0.06
0.04
0.02
Diketene [molA] I I
100 200 300
time [minl
DHA [mol/ll °] I I
100 200 300
time [rain]
Fig. 11. Results of Run 2 in open-loop mode using the feed rate found in Run 1...., initial concentration profiles for the SQP iterations; , model fitting using all the available concentration measurements and the collocation approach: - - . - - , estimated concentration profiles using the fitted model and numerical integration.

Adaptive optimal operation for semi-batch systems
given by the previous EOT. The converged profiles were always identical within the specified tolerances. This does not prove global convergence of the applied algorithms, but it provides a useful robustness check. For this particular on-line optimization problem, the compu- tational efficiency of the algorithms for estimation and optimization was not important, because sampling and chemical analysis were the time-limiting operations. However, the strategy used proved to be highly efficient and robust. SQP and SLP converged within a few iterations.
Since the time necessary for preparing a sample, analyzing it and processing the information (about 28 min) exceeded the sampling time of 20 min, an EOT was not repeated at each sampling time. The way the EOTs were scheduled in this study was highly heuristic. It was based both on the operator's availability and on how well the model predicted the new measurements. One could certainly try to systematize the whole procedure, for example, by selecting a larger sampling time such as 30 min and by repeating an EOT with each new set of
197
data. Alternatively, one could think of a prediction-error criterion that invokes the EOT procedure in response to observed departure from the predicted behaviour.
5.5. Practical issues
The four experimental runs were characterized by rather large differences in the rate constants. This was obtained by changing the amount of catalyst added and/ or adding DHA-promotor as an impurity. However, rate constants that are changing from batch to batch as well as large model inaccuracies (model mismatch and uncertain parameters) are commonly found in industrial practice and support the significance of this work even more. For this particular problem, difficulties can arise if unreacted pyrrole is recycled. Pyridine and promotor will then be recycled as well, since complete separation of pyrrole and pyridine, which have similar boiling points and chemical structures, would be too costly. It was shown that even a small amount of promotor had a large effect on the rate of dimerization.
In this study, the process was optimized on-line by
0.2
0.15
0.1
0.05
0.35
0.3
0.25
0.2
0.15
0.1
0.05
0 0
Feed rate* 100 [l/min]
t f , o p t = 3 7 8 m i n
i
t f , o p t
I i I l i 100 200 300 400
time [min]
PAA [mold] i I I
It*'*
X
I I I
100 200 300 400
time [rnin]
0.14
0.12
0.1
0.08
0.06
0.04
0.02
0.16
0.14
0.12
0.1
0.08
0.06
0.04
0.02 ~A
0 .x 0
Diketene [mol/l]
o
o i t . . Itit~
It
$-
I I I
100 200 300 400
time [min]
DHA [tool/l]
I t , -
I I
100 200 300
time [win]
4OO
Fig. 1 2. Results o f E O T 5 us ing 11 measurements (O) and subsequently checked with 5 additional measurements (*) (final result for Run 3).
198 D. RUPPEN et al.
F e e d rate * 100[l/rain] 0.2 ~
0.15
0.1
0.05
60
0.6
"1 I
100 200 300
l ime [rain]
PAA [mol/l]
0.5
0.4
0.3
0.2
0.1
I I
60 1 O0 200
time [rain]
Diketene [tool/l] 0 .11 ~
400 300
300 300
o 0.1
0.09 o
0.08
0.07
0.06 o
0.0~ i i 60 100 200
time [mini
DHA [mol/1] 0.2 i
0.15
0.1
0.05
1
0 i i 60 100 200
time [mini
Fig. 13. Results of Run 4 in open-loop mode using the feed rate found in Run 3 (see also caption of Fig. 1 l).
repeatedly adjusting the control profiles based on improved estimates of the rate constants. This simple procedure does not account for model structure inaccu- racies. Hence, it is not surprising that, although on-line optimization with constraints was applied, small viola- tions of endpoint specifications were observed experi- mentally (see Run 3). Nevertheless, large violations of endpoint constraints could be avoided even with a model of limited extrapolative accuracy.
The "worst-case" assumptions that were made for the optimization is one way to account for model inaccu- racies. However, this approach can give fairly sub- optimal solutions. Moreover, the "worst-case" assump- tions were based only on a few preliminary experiments and, therefore, were of limited reliability.
stresses the necessity for on-line optimization. Runs with and without on-line optimization were compared.
The performance of the estimation and optimization approach was found to be robust and very efficient. Runs optimized on-line by repeatedly adjusting the feed profiles based on improved estimates of the rate constants gave a significant improvement in perform- ance compared to runs with a priori -def ined feed rate profiles. The approach used does not account for structural model inaccuracies and, therefore, experi- mental results can still violate endpoint specifications. However, the likelihood that a batch has to be terminated early due to constraint violations can be considerably reduced with the proposed on-line optimization strat- egy.
6 . C o n c l u s i o n s
In this work, on-line optimization was applied to an experimental bench-scale reaction system. The selected reaction system closely reflects industrial reality and
R e f e r e n c e s
Agarwal M. and Bonvin D. (1989) Limitation of extended Kalma filter for batch reactors. IFAC Symposium DYCORD '89, Maastricht.
Agrawal, P., Koshy, G. and Ramseier, M. (1989) An

Adaptive optimal operation for semi-batch systems
algorithm for operating a fed-batch fermentor at optimum specific-growth rate. BiotechnoL Bioeng. 33, 115
Briody, J. M. and Satchell, D. P. N. (1964) Chem. Ind. (London) 893
Briody, J. M. and Satchell, D. P. N. (1965) J. Chem. Soc. 3778-3785.
Bryson A. E. and Ho Y. C. (1975) Applied Optimal Control. John Wiley and Sons.
Cazzador, L. (1988) On the optimal control of fed-batch reactors with substrate-inhibited kinetics. Biotech- nol. Bioeng. 31, 670
De Valli~re P. (1989) State and parameter estimation in batch reactors for the purpose of inferring on-line the rate of heat production. ETH Dissertation No. 8847.
De Valli&e, P. and Bonvin, D. (1990) Application of estimation techniques to batch reactors--II. Experi- mental studies in state and parameter estimation. Computers Chem. Engng. 13, 11-20.
Karlsen, L. G. and Villadsen, J. (1987) Isothermal reaction calorimeters, Part I: A literature review; Part II: Data treatment. Chem. Eng. Sci. 42, 1153-1173.
Knizek, J., Lejdar, E. and Vetesnik, P. (1985) Collect. Czech. Chem. Commun. 50, 365-374.
Meadows E. S. and Rawlings J. B. (1990) Simultaneous model identification and control of a semi-batch chemical reactor. Proceedings ACC 90, San Diego.
Meadows E. S. and Rawlings J. B. (1991) Model identification and control of a semi-batch chemical reactor. Proceedings ACC 91, Boston.
Modak, J. M., Lim, H. C. and Tayeb, Y. J. (1986) General characteristics of optimal feed rate profiles
199
for various fed-batch fermentation processes. Bio- technoL Bioeng. 28, 1396
Modak, J. M. and Lira, H. C. (1989) Optimal operation of fed-batch bioreactors with two control variables. Chem. Eng. J. 42, 815
Ponnuswamy, S. R., Shah, S. L. and Kiparissides, C. A. (I 987) Computer optimal control of batch polymer- ization reactors. Ind. Eng. Chem. Res. 26, 2229
Pyun, R. Y., Modak, J. M., Chang, Y. K. and Lim, H. C. (1989) Optimization of biphasic growth of Sac- charomyces carlsbergensis in fed-batch culture. Biotechnol. Bioeng. 33, I-I0.
Regenass W. (1978) Thermal and kinetic data from a bench-scale heat-flow calorimeter. Chem. Reaction Eng., ACS Symposium Series, No. 65.
Ruppen D. (1994) A contribution to the implementation of adaptive optimal operation for discontinuous chemical reactors. ETH Dissertation No. I0634.
Ruppen D., Rippin D. W. T., Bonvin D. (1991) An on- line optimization strategy for fast batch and semi- batch reaction systems. IFAC International Sympo- sium, ADCHEM '91, Oct. 14-16, Toulouse, France.
Ruppen D., Benthack C., Bonvin D. (1994) Efficient computation of batch reactor control profiles under parametric uncertainty. IFAC International Sympo- sium, ADCHEM' 94, May 25-27, Kyoto, Japan.
Staniskis, J. and Levisanskas, D. (1984) An adaptative control algorithm for fed-batch culture. Biotechnol. Bioeng. 26, 419
Tjoa, L.-B. and Biegler, L. T. (1991) Simultaneous solution and optimization strategies for parameter estimation of differential-algebraic equation sys- tems. Ind. Eng. Chem. Res. 30, 376--385.