Impaired semen quality, an increase of sperm morphological ...
Upload
manchesterCategory
view
2download
0
Original Research
Diffusion MRI-Based Cortical ComplexityAlterations Associated With Executive Functionin Multiple Sclerosis
Nils Muhlert, PhD,1* Varun Sethi, MD,1 Torben Schneider, MS,1 Pankaj Daga, MS,2
Lisa Cipolotti, PhD,3 Hamied A. Haroon, PhD,4 Geoff J.M. Parker, PhD,4
Sebastian Ourselin, PhD,2 Claudia A.M. Wheeler-Kingshott, PhD,1
David H. Miller, MD, FMedSci,1 Maria A. Ron, PhD, FRCPsych,1
and Declan T. Chard, PhD, MRCP1
Purpose: To report a novel magnetic resonance imagingmeasure (diffusion orientational complexity [DOC]) in astudy of people with multiple sclerosis (MS) and healthycontrols and to determine patterns of abnormality, corre-lations with conventional diffusion measures, and associ-ations with cognitive function.
Materials and Methods: We performed high angular reso-lution diffusion imaging (HARDI) and measured DOC, meandiffusivity (MD), and fractional anisotropy (FA) in 51 MSpatients and 28 healthy controls. All subjects had a 2-mmisotropic HARDI scan on a 3 T scanner using a 32-channelhead receiver coil. DOC, MD, and FA were measured inthree regions of interest (ROIs) in frontal cortex linked toexecutive function, two ROIs in occipital cortex thoughtunlikely to affect cognition, and in the whole cortex.
Results: Frontal cortex DOC was significantly decreasedin MS patients. DOC correlated mostly with FA but not MDin controls and with MD but not FA in people with MS. Inregression models that included all three diffusion-basedmeasures, frontal cortex DOC and frontal cortex FAindependently predicted executive function scores.
Conclusion: DOC is a new useful measure of functionallyrelevant cortical pathology in MS, providing informationthat complements conventional diffusion measures.
Key Words: multiple sclerosis; DTI; HARDI; diffusion ori-entational complexity; cognitionJ. Magn. Reson. Imaging 2013;38:54–63.VC 2012 Wiley Periodicals, Inc.
CORTICAL GRAY MATTER (GM) pathology is increas-ingly recognized as a significant feature of multiplesclerosis (MS) (1–3). Cortical demyelinating lesions areoften detected at postmortem and in some studieshave been as numerous as white matter lesions (4,5).However, imaging cortical lesions in vivo has provedchallenging: conventional T2-weighted magnetic reso-nance imaging (MRI) sequences rarely detect corticallesions, and although more are detected using doubleinversion recovery sequences (6), sensitivity is still lim-ited at standard field strengths used in clinical studies(7). Furthermore, neurodegenerative changes thatoccur in lesion and nonlesion cortex in MS, includingneuroaxonal loss and reduced dendritic arborization(3,8,9), are not visible on conventional scans.
Multiple quantitative MRI measures have identifiedglobal and/or regional cortical abnormalities in MS:these include measures of volume, magnetization trans-fer ratio, T1 relaxation time, T2* relaxation, perfusion,and spectroscopically detected metabolites (10–12),sometimes with significant clinical correlations (13,14),although none of these measures is totally specific forthe neurodegenerative changes that occur in MS cortex.
The significant correlations observed between cogni-tive function and cortical volume (15), cortical thick-ness (16), and cortical lesions counts (17) suggest arole of cortical pathology in determining cognitiveimpairment. Impairment of executive function, sugges-tive of frontal lobe involvement (18), is common in MS(19), in keeping with histopathological and in vivo MRIstudies showing a propensity for MS lesions to affectthe frontal cortex and adjacent white matter (20,21).
Diffusion MRI can measure the rate and directional-ity of the diffusion of water molecules due to diffusion
1NMR Unit, Department of Neuroinflammation, UCL Institute ofNeurology, London, UK.2UCL Centre for Medical Image Computing, London, UK.3Neuropsychology department, National Hospital for Neurology andNeurosurgery, London, UK.4Biomedical Imaging Institute, University of Manchester, Manchester,UK.
Contract grant sponsor: NMR Research Unit is supported by the MSSociety of Great Britain and Northern Ireland; UK Department ofHealth’s NIHR Comprehensive Biomedical Research Centre at UCLHand UCL; Philips Healthcare, Clinical Science Group (Best, NL).
*Address reprint requests to: N.M., NMR Research Unit, UCL Instituteof Neurology, Queen Square, London, UK WC1N 3BG.E-mail: [email protected]
Received June 27, 2012; Accepted November 2, 2012.
DOI 10.1002/jmri.23970View this article online at wileyonlinelibrary.com.
JOURNAL OF MAGNETIC RESONANCE IMAGING 38:54–63 (2013)
CME
VC 2012 Wiley Periodicals, Inc. 54

in tissues, providing sensitive and valuable informa-tion about tissue structural integrity. Diffusion tensorimaging (DTI) studies of GM in MS have assessedmean diffusivity (MD), a measure of the overallfreedom of molecular water diffusion, and fractionalanisotropy (FA), a measure of the degree of the orien-tational preference of diffusion. Increased GM MD hasbeen reported in MS patients compared with healthycontrols (22–30), indicating a reduction in the degreeof cell membrane-related and/or myelin-related hin-drance to water diffusion. Observations of GM FAabnormalities have been less consistent, with bothincreases (31) and decreases (32,33) reported.
Diffusion orientational complexity (DOC; 34,35) is arecently developed way of analyzing diffusion datathat estimates the probability of observing n distinctdiffusion orientations (n ¼ 1, 2, 3, or >3) in each voxelusing a bootstrap approach applied to high angularresolution diffusion imaging (HARDI) data. In whitematter tracts, where there is often one dominantdiffusion direction, DOC is low (with the probability ofobserving a single orientation highest). Where whitematter tracts cross, and there is more than one majordiffusion direction, DOC is higher (the probability ofobserving two or more orientations is increased). Incortical GM, where diffusion is more likely to be mul-tidirectional, due to the layered structure of the tissueand regionally varying partial volume effects withwhite matter and cerebrospinal fluid (CSF), DOCmeasurements indicate a higher probability of observ-ing three or more diffusion orientations (35). Earlystudies of DOC have indicated that the measurementsof complexity vary between cortical regions in a man-ner that is reproducible between healthy controls (35).DOC has been measured in patients with mild cogni-tive impairment and Alzheimer’s disease in compari-son with age-matched normal controls (36). DOCdifferences were detected in mild cognitive impairmentpatients compared with controls and were moremarked in Alzheimer’s disease than mild cognitiveimpairment patients, suggesting an associationbetween the degree of cognitive impairment and theseverity of cortical DOC abnormalities. Given this,DOC may also be useful to investigate, in vivo, thenature of cortical pathology in MS and its relationshipwith cognitive impairment.
In this study of patients with MS and healthy con-trols, we performed HARDI and measured corticalDOC, in addition to MD and FA, in order to addressthree main questions. 1) Is DOC abnormal in MS? 2)Does cortical DOC correlate with MD and FA or doesit provide independently useful information? 3) DoesDOC in the frontal cortex correlate with executivefunction in MS?
PATIENTS AND METHODS
Subjects
We recruited patients with clinically definite MS (37)who had not had a relapse or received corticosteroidswithin the preceding 4 weeks, and healthy volunteersnot known to have neurological or psychiatric disor-
ders. Written informed consent was obtained for par-ticipation in the study, which was approved by ourlocal Institutional Ethics Committee.
Clinical Assessment
Disability was measured in MS patients using theexpanded disability status scale (EDSS; 38). Cognitiveassessment was carried out by an experienced neuro-psychologist (N.M.). Premorbid intelligence quotient(IQ) was measured using the National Adult ReadingTest (39) and current IQ was estimated using five subt-ests from the Wechsler Adult Intelligence Scale – III(similarities, digit-span, arithmetic, picture completion,and matrix reasoning; 40). Processing speed wasassessed using the symbol digit modalities test (SDMT;41). Executive function was assessed in all participantsusing the Stroop color-word interference test (42) andthe Hayling sentence completion test (43). To reducethe number of cognitive variables included in the sta-tistical analysis, a cumulative frontal z-score was cal-culated using the Hayling and Stroop test z-scores(determined as the number of standard deviationseach patient’s score fell from the mean of the controlperformance), summed with the SDMT z-score (basedon standardized normative data).
The Hospital Anxiety and Depression Scale (HADS;44) was used to assess levels of anxiety and depres-sion. On both anxiety and depression subscalesscores of 11 or higher were considered abnormal.
MRI Sequences
MRI scans of the brain were acquired using a PhilipsAchieva 3T system (Philips Healthcare, Best, TheNetherlands) using a 32-channel head-coil. TheHARDI scan consisted of a cardiac-gated spin-echoecho-planar imaging sequence acquired axial-obliqueand aligned with the anterior commissure (AC) / pos-terior commissure (PC) line (2*2*2 mm, 61 isotropi-cally distributed diffusion-weighted directions with b¼ 1200 s/mm2, 7 nondiffusion-weighted [b ¼ 0] vol-umes, TE ¼ 68 msec, TR ¼ 24 sec [depending on thecardiac rate], SENSE factor ¼ 3.1). Dual-echo protondensity/T2-weighted axial-oblique scans aligned withthe AC-PC line (1*1*3 mm, TR ¼ 3500 msec, TE ¼19/85 msec) and a 3D sagittal T1-weighted fast fieldecho (FFE) scan (1*1*1 mm, TR ¼ 6.9 msec, TE ¼ 3.1msec) were also acquired.
MRI Processing
The HARDI scans were processed in native subjectspace. In order to extract cortical diffusion-based meas-ures, for each subject the T1-weighted FFE scan wasregistered to the HARDI dataset and segmented, as out-lined below. All registrations were carried out using Nif-tyReg (http://sourceforge.net/projects/niftyreg).
Diffusion MRI Analysis
Each of the 61 diffusion-weighted images was regis-tered to the nondiffusion-weighted b ¼ 0 volumes,
Diffusion Orientational Complexity in MS 55

and eddy current corrected using FSL (FMRIB,Oxford, UK). A mean b ¼ 0 image was created byaveraging the seven b ¼ 0 volumes. The standard sin-gle diffusion tensor fitting and calculation of FA andMD maps was performed using the Camino toolkit(45; www.camino.org.uk).
DOC was determined by iteratively resampling thediffusion data using spherical deconvolution con-strained to non-negative values, with 32 iterations ofmodel-based residual bootstrapping, as described inHaroon et al (34,35). This produced separate DOCprobability maps for the existence of 1, 2, 3, or >3dominant diffusion orientations; these maps werecombined using a maximum likelihood algorithm togenerate a single map in which each voxel representedthe greatest likelihood of containing 1, 2, 3, or >3dominant diffusion orientations.
Cortical Segmentation and Lobar Parcellation
This involved a series of registration (as shown in Fig. 1)and segmentation steps as outlined below. Tissue seg-
mentation was achieved using the T1-weighted FFEscan obtained for each subject. Segmented GM wasthen subdivided using the Oxford-Harvard lobar parcel-lation atlas (46). All parcellations were bilateral, ie, dif-fusion-based measurements were extracted from bothleft- and right-sided parcellations together. Bilateralparcellations were chosen a priori, as the frontal z-scoreis unlikely to be strongly lateralized and using bilateralROIs reduces the number of comparisons to be carriedout. Parcellations were overlaid on the DOC, FA, andMD maps, from which average values were extracted.
1) The MNI152 brain template was segmented usingSPM8, and the resulting GM mask edited manually toremove noncortical tissues using FSL (www.fmrib.ox.-ac.uk/fsl) editing tools. This cortical mask was thensplit into hemispheres and dilated by 5 voxels, butprevented from dilating into the noncortical GM tis-sues (eg, caudate and other deep GM structures)which were manually removed in the proceeding step,using image manipulation tools in the FSL package.
2) The participants’ 3D T1-weighted FFE scans weresegmented using the SPM8 ‘‘new segment’’ function
Figure 1. Registration steps. Step 1: the MNI 152 T1 atlas was nonlinearly registered to each participant’s T1-weighted scan.Step 2: each participant’s T1-weighted scan was affine registered to a pseudo T1 image, generated by subtracting the protondensity image from the T2-weighted image, using a rigid-body registration. Step 3: each participant’s T2-weighted scan was non-linearly registered to their mean b ¼ 0 image. Transformation parameters from all three steps were concatenated and used totransform cortical parcellations in MNI space into each participant’s native diffusion space. Transformation parameters fromsteps 2 and 3 were also concatenated and used to transform segmented GM from each participant’s T1-weighted image tonative diffusion space. Inclusive masking was then used to generate a subject-specific cortical mask of each parcellation.
56 Muhlert et al.

after performing lesion filling (47), and resulting tis-sue class probability maps were binarized using athreshold of 0.5. This provided a whole brain GMmask.
3) The MNI152 template was then registered nonli-nearly to a given subject’s lesion-filled T1-weightedFFE image and the MNI cortical mask (from step 1)transformed into native T1-space using the sametransformation parameters. Only voxels that fellwithin the cortical mask and the subject-specificSPM8 GM segmentation were classified as being corti-cal GM. This produced a subject specific cortical GMmask (termed ‘‘whole cortex’’).
4) Registration was undertaken between a subject’sT1-weighted FFE scan and HARDI data using the PD/T2-weighted scan as an intermediate step. A pseudo-T1 image was generated by subtracting the PD fromthe T2-weighted image (48), giving similar contrast tothe T1-weighted FFE scan. The T1-weighted FFE scanwas then rigidly registered to the pseudo-T1 image.The T2-weighted scan was nonlinearly registered tothe HARDI scan dataset. The transformation parame-ters were then used to transform the whole brain GMmask from step 2 into native HARDI-space.
5) From the Oxford-Harvard brain structures atlasin MNI space (46), three frontal cortical parcellationswere selected: superior frontal gyrus, middle frontalgyrus, and inferior frontal gyrus (created by averagingvalues from pars opercularis and pars triangularisparcellations). To clarify the specificity of any possibleassociations between frontal diffusion-based meas-ures and executive function, two occipital lobe parcel-lations (the occipital pole and the inferior division oflateral occipital cortex) were selected as regions wherepathology would be unlikely to contribute directly toimpairments of frontal executive function. All parcel-lations were selected a priori. Using the registrationparameters determined in steps 3 and 4, these parcel-lations were moved into native HARDI-space andmasked using the subjects’ GM from step 4. Diffu-sion-based measures were subsequently onlyextracted from voxels within the whole cortex (step 3)or from the selected Oxford-Harvard lobar GMparcellations.
Parcellated Tissue Volumes
GM volumes were calculated for each participant bymeasuring the volume of GM in each parcellation ineach participant. This was used to adjust for local GMatrophy as explained below.
Statistics
Independent-samples t-tests and chi-square testswere carried out to explore group differences betweenpatient and control demographic variables, clinicalscores, and diffusion measures. Diffusion-basedmeasures were also compared between groups afteradjusting for the GM volume of that parcellation byanalysis of covariance.
Correlations were assessed between each of thediffusion-based measures in each of the cortical
parcellations and in the whole cortex using Pearson’sproduct-moment correlation coefficient. Pearson prod-uct-moment correlations were also calculated betweenfrontal z-score and diffusion-based measures in eachof the cortical parcellations and the whole cortex.Multiple linear regressions were then carried out todetermine which of the diffusion-based measures(DOC, MD, or FA) best predicted the frontal z-scoresin each cortical parcellation and the whole cortex.Group differences were considered statistically signifi-cant at P < 0.05. The correlations were corrected formultiple comparisons by using a Bonferroni-correctedthreshold of P < 0.01, accounting for the five corticalparcellations. SPSS v. 11 (Chicago, IL) was used forall statistical analyses.
RESULTS
Demographics and Cognitive Performance(Table 1)
Twenty-nine patients had relapsing-remitting (RR), 16secondary progressive (SP), and six primary progres-sive (PP) MS. Their median EDSS score was 4 (range1–8.5) and their mean disease duration was 15.1years (range 2.0–45 years). Patients (mean: 46.4years, standard deviation [SD]: 10.1 years) were olderthan controls (mean: 37.8, SD: 11.6 years, P < 0.01)but there were no significant gender differences(chi-square, P ¼ 0.89).
MS patients did not differ from controls in theirestimated premorbid IQ (P ¼ 0.51), indicating that,prior to the effects of MS, the two groups would havebeen intellectually equivalent. Patients had lower cur-rent IQ and slower processing speed on the SDMTcompared to controls. Patients performed worse thancontrols on the Stroop and the Hayling sentence com-pletion tests and their cumulative frontal z-score wasalso significantly lower.
MS patients had higher depression scores than con-trols (P < 0.001), with four patients and two controlsscoring in the depression range. Eight patients andthree controls had abnormal anxiety scores, but therewas no significant difference in anxiety scores (P ¼0.35) between the two groups. No significant correla-tions were seen between frontal z-score and eitheranxiety (P ¼ 0.73) or depression (P ¼ 0.62) in patients,indicating that executive function deficits were unre-lated to disturbed mood.
Regional Diffusion-Based Measures: MS PatientsVersus Controls (Table 2)
Examples of the DOC, FA, and MD maps in a patientand a control are shown in Fig. 2. Compared withcontrols, MS patients showed significantly lower DOCin the superior frontal, middle frontal, and inferiorfrontal parcellations, but there were no group differ-ences in DOC in the occipital pole or in the lateraloccipital parcellations. MS patients showed signifi-cantly higher MD in all frontal and occipital parcella-tions and lower FA in the occipital pole and lateraloccipital but not frontal parcellations. All group
Diffusion Orientational Complexity in MS 57

differences remained significant after adjusting for theGM volume of the respective parcellation. There wasno effect of age on any of the diffusion-based valuesin healthy controls, and adjusting for age in the anal-yses did not affect the results except for DOC in themiddle frontal parcellation, in which there was a trendfor a group difference (P ¼ 0.067).
Correlations Between Regional DOC, FA, and MDMeasures (Table 3)
In controls DOC was significantly correlated with FAin four of the five cortical parcellations, but was corre-lated with MD in only one (inferior frontal) parcella-tion. In MS patients, DOC was significantly correlatedwith MD in all five cortical parcellations but with FAin only one (occipital pole) parcellation.
Associations Between Regional DOC, FA, and MDMeasures and Executive Function in MS Patients(Tables 4, 5)
In univariate analyses (Table 4), DOC and MD weresignificantly correlated with frontal z-scores in allthree frontal cortex parcellations (all P < 0.01; Fig. 3).There were no univariate correlations between corticalFA and frontal z-scores.
In regression analyses (Table 5), variance in frontalz-scores was most significantly predicted by DOC inthe superior and middle frontal parcellations (P <0.01) and least significantly in the inferior frontal par-cellation (P < 0.05). Variance in frontal z-score waspredicted least significantly by FA in the superior andmiddle frontal parcellations (P < 0.05). MD did not in-dependently predict frontal z-score.
Whole Cortex Diffusion-Based Measuresand Executive Function
In MS patients versus controls, there was a signifi-cantly lower DOC (2.92 6 0.12 vs. 2.99 6 0.09, P <0.05) and FA (0.127 6 0.008 vs. 0.135 6 0.009, P <0.001) and significantly higher whole cortex MD (0.976 0.08 vs. 0.89 6 0.05, P < 0.001). In the MS patientgroup, whole cortex DOC was correlated with MD(r ¼ �0.60, P < 0.001) but not FA (r ¼ 0.15), andalthough there were significant univariate correlationsof frontal z-score with DOC (r ¼ 0.52, P < 0.001), MD (r¼ �0.45, P < 0.01) and FA (r ¼ 0.29, P < 0.05), regres-sion analysis showed that DOC was the only wholecortex diffusion-based measure that independently pre-dicted frontal z-score (r2 ¼ 0.31, b ¼ 6.13 [95% confi-dence interval: 1.42, 10.84; P < 0.05]).
Table 2
Mean (and Standard Deviation) Diffusion-Based Measures in Patients and Controls, and Significance of Differences Between Them
DOC FA MD
Parcellation Patients Controls Patients Controls Patients Controls
SFG 2.88 (0.18)** 3.01 (0.15) 0.146 (0.013) 0.151 (0.014) 0.93 (0.05)*** 0.84 (0.06)
MFG 2.95 (0.17)** 3.05 (0.17) 0.140 (0.012) 0.144 (0.013) 0.92 (0.07)*** 0.85 (0.05)
IFG 2.92 (0.17)** 3.04 (0.12) 0.129 (0.009) 0.132 (0.009) 1.00 (0.07)*** 0.91 (0.05)
Occipital pole 3.04 (0.15) 3.07 (0.10) 0.122 (0.013)** 0.131 (0.012) 1.00 (0.09)*** 0.91 (0.06)
Lateral inferior occipital 3.10 (0.11) 3.10 (0.08) 0.123 (0.009)*** 0.132 (0.009) 0.93 (0.07)*** 0.85 (0.04)
**P < 0.01, ***P < 0.001.SFG: Superior Frontal Gyrus, MFG: Middle Frontal Gyrus, IFG: Inferior Frontal Gyrus, DOC: Diffusion Orienta-
tional Complexity, FA: Fractional Anisotropy, MD: Mean Diffusivity.
Table 1
Demographics and Cognitive Test Results in Patients and Controls
Patients Controls
N 51 (29 RR, 16 SP, 6 PP) 28
Age (mean [range]) 46.4 (25–66)** 37.8 (22–64)
Gender (F:M) 30: 21 16: 12
Duration of MS from first clinical event (mean) 15.1 years —
EDSS (median [range]) 4 (1–8.5) —
Cognitive tests
Premorbid IQ (NART) 107.4 (11.8) 109.2 (11.1)
Current IQ (WAIS-III) 100.0 (14.5)** 112.0 (15.0)
Anxiety (HADS) 6.7 (4.3) 5.8 (4.2)
Depression (HADS) 5.9 (3.4)*** 2.9 (3.5)
Hayling sentence completion 5.3 (2.0)** 6.4 (1.4)
Stroop time (seconds) 152.9 (58.9)*** 110.2 (21.4)
Symbol Digits Modalities Test (z-score) �0.9 (1.3)*** 0.5 (1.1)
Frontal z-score �1.16 (1.4)*** 0.17 (0.7)
Data are expressed as mean (standard deviation) unless otherwise indicated. **P < 0.01, ***P < 0.001. EDSS: Expanded Disease Status
Scale, NART: National Adult Reading Test, WAIS: Wechsler Adult Intelligence Scale, HADS: Hospital Anxiety and Depression Scale.
58 Muhlert et al.
DISCUSSION
We found an average of approximately three diffusiondirections using the new DOC measure in each of thefrontal and occipital parcellations that were studied inour healthy controls, and slightly, but significantlyfewer diffusion directions in frontal cortex parcella-tions in MS patients. A consideration of previous DTIstudies may help to understand these findings inadult human cortex.
Very high resolution DTI in preterm infants andadults has identified factors that can influence anisot-ropy and diffusion orientations in the cortex. Inpremature infants cortical FA is initially high and
diffusion is principally aligned perpendicular to thepial surface (50); this directional predominance isthought to be mediated by radial glia and pyramidalcells that have not yet formed basal dendrites and thatrestrict diffusion parallel to the cortical surface. Duringmaturation FA in the cortex decreases; this occursalongside the development of lateral interneuronal con-nections and complex dendritic branching parallel tothe cortical surface (50). Adult cortical GM is charac-terized by layers in which fibers are projected primarilyparallel to the cortical surface (eg, plexiform layer[layer I]) and layers that are rich in pyramidal cells,which send axons towards the white matter, perpen-dicular to the cortical surface (eg, layer V) (51). At the
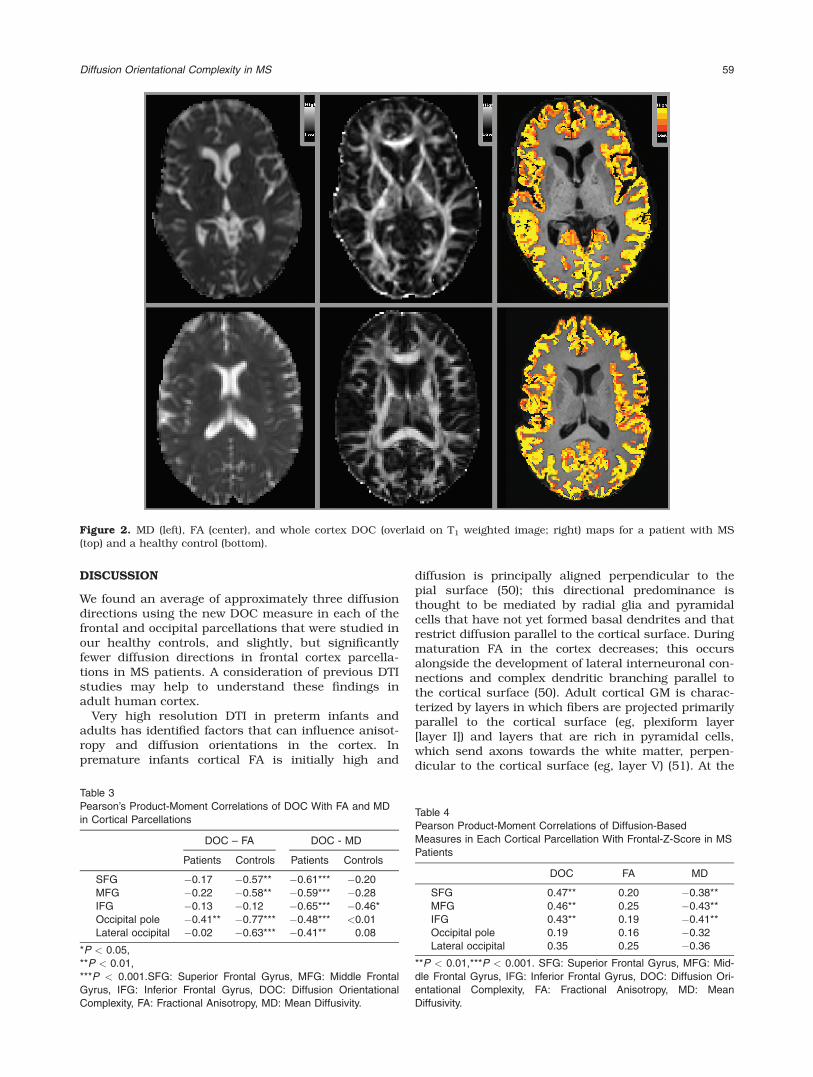
Figure 2. MD (left), FA (center), and whole cortex DOC (overlaid on T1 weighted image; right) maps for a patient with MS(top) and a healthy control (bottom).
Table 3
Pearson’s Product-Moment Correlations of DOC With FA and MD
in Cortical Parcellations
DOC – FA DOC - MD
Patients Controls Patients Controls
SFG �0.17 �0.57** �0.61*** �0.20
MFG �0.22 �0.58** �0.59*** �0.28
IFG �0.13 �0.12 �0.65*** �0.46*
Occipital pole �0.41** �0.77*** �0.48*** <0.01
Lateral occipital �0.02 �0.63*** �0.41** 0.08
*P < 0.05,
**P < 0.01,
***P < 0.001.SFG: Superior Frontal Gyrus, MFG: Middle Frontal
Gyrus, IFG: Inferior Frontal Gyrus, DOC: Diffusion Orientational
Complexity, FA: Fractional Anisotropy, MD: Mean Diffusivity.
Table 4
Pearson Product-Moment Correlations of Diffusion-Based
Measures in Each Cortical Parcellation With Frontal-Z-Score in MS
Patients
DOC FA MD
SFG 0.47** 0.20 �0.38**
MFG 0.46** 0.25 �0.43**
IFG 0.43** 0.19 �0.41**
Occipital pole 0.19 0.16 �0.32
Lateral occipital 0.35 0.25 �0.36
**P < 0.01,***P < 0.001. SFG: Superior Frontal Gyrus, MFG: Mid-
dle Frontal Gyrus, IFG: Inferior Frontal Gyrus, DOC: Diffusion Ori-
entational Complexity, FA: Fractional Anisotropy, MD: Mean
Diffusivity.
Diffusion Orientational Complexity in MS 59

resolutions normally used for in vivo DTI of adults, GMis rarely found to be anisotropic (52), but higher reso-lution DTI has revealed anisotropy in adult cortical GMwhen scanned in vivo (53,54) and postmortem (55,56).In each of these studies, an in-plane resolution ofabout 1 mm2 revealed anisotropic diffusion in corticalGM with the principal direction of diffusion generallyaligned perpendicular to the pial surface. However, inprimary sensory regions, anisotropy was reported to bealigned parallel to the pial surface (57).
The evidence from these higher resolution (�1 mm2
in plane) DTI studies for cortical anisotropy both per-pendicular and parallel to the cortical surface is con-sistent with the complex and yet organized structureof normal adult cortex (33,51) and may help toexplain why we could identify multiple diffusion direc-tions in our DOC measure, which was obtained inlarger voxels (2 mm2 in plane) in healthy controls. InMS, it is conceivable that well-reported neurodegener-ative changes including neuroaxonal loss and dendri-tic dearborization (3,9) could disrupt these multidirec-tional anisotropic effects of normal cortical anatomy,thereby reducing DOC. Reduced cortical volume inMS might affect the DOC measure (as well as MD andFA) due to partial volume effects from inclusion of ad-jacent white matter and CSF; however, DOC was stillabnormal after adjusting for the parcellation volumes,a measure of localised GM atrophy, suggesting thatthe abnormality reflects intrinsic cortical pathologyrather than a partial volume effect. As such, DOCwould seem to be a sensitive measure of the micro-scopic tissue changes that occur in cortical disease.Previous neuropathological studies have also reporteda high frequency of frontotemporal cortical lesions inMS (2), which is consistent with our finding of DOCabnormalities in frontal parcellations. While we didnot separate measurements in lesional and nonle-sional cortex in this study, future work could assessdifferences. Furthermore, a correlation study of post-mortem MRI and histopathology would also help toelucidate the pathology underlying the DOC changesobserved in the frontal cortex in MS.
We found different correlation patterns of DOC withDTI measures in healthy control and MS patients.
In controls there were significant negative correla-tions of DOC with FA (in normal cortex increasingDOC was associated with decreasing FA) in all parcel-lations except the inferior frontal gyrus. In contrast,while we did not detect a correlation between DOC
and FA in MS cortex except for the occipital pole, cor-relations between DOC and MD emerged in frontalparcellations (MS cortical MD increased as DOCdecreased). These contrasting findings are likely toreflect the multiple structural factors underlying thesemeasures, and differential effects that pathology may
Table 5
Independent Predictors of Frontal Z-Scores in Each of the Parcellations in Patients
DOC FA MD r2
SFG 6.43 (2.79,10.07)** 59.914 (12.06, 101.77)* 5.41 (�2.68, 13.50) 0.34
MFG 5.9 (2.14, 9.67)** 58.19 (11.97, 104.42)* 3.22 (�5.82, 12.26) 0.36
IFG 4.27 (0.53, 8.01)* 41.6 (�15.02, 98.22) �0.69 (�9.09, 7.69) 0.21
Occipital pole 2.18 (�2.72, 7.08) 20.22 (�28.22, 68.66) �2.72 (�10.18, 4.75) 0.12
Lateral occipital 4.55 (�0.41, 9.52) 26.58 (�52.71, 105.88) �2.44 (12.51, 7.62) 0.19
Parameter estimates (betas) are shown with 95% confidence intervals in parentheses. Significant independent predictors of frontal z-score
are marked by asterisks. *P < 0.05, **P < 0.01.
SFG: Superior Frontal Gyrus, MFG: Middle Frontal Gyrus, IFG: Inferior Frontal Gyrus, DOC: Diffusion Orientational Complexity, FA: Frac-
tional Anisotropy, MD: Mean Diffusivity.
Figure 3. Correlations between frontal z-score and DOC inthe (a) superior frontal, (b) middle frontal, and (c) inferiorfrontal parcellations.
60 Muhlert et al.

have on them. Considering the association betweenFA and DOC in controls, even in the region with thehighest correlation, the occipital pole, only �60% ofvariability in FA was mirrored by DOC (r2 ¼ 0.6), andin the inferior frontal parcellation they share less than1% of variability. Similarly, in people with MS anassociation between MD and DOC emerged, but againthe maximum shared variability was �40% (in thesuperior frontal parcellation), and so different ele-ments of pathology may exert different effects on dif-fusion measures, and again these are also not invaria-bly linked. Findings also partly differed betweenfrontal and occipital regions, which likely reflects re-gional differences in the normal structure of the cor-tex and effects of MS. In controls, the associationbetween DOC and MD was generally weaker in theoccipital lobes, while that between DOC and FA wasstronger. In the occipital pole there is known to be ahigher myelin content in layer IV (the line of Gennari;11) than other cortical areas, which may in partexplain this.
Overall, this highlights that, while MD, FA, andDOC are in part related, there is also considerablescope for normal structural features and pathologicalprocess to influence one measure without noticeablyinfluencing another.
Our univariate analyses showed robust correlationsof frontal cortex DOC with measures of executivefunction in the MS group and in regression analyses,DOC in each of the frontal but not occipital parcella-tions was an independent predictor of executive func-tion. Identification of DOC as the only independentwhole cortex measure to predict executive functionalso suggests that DOC has potential to detect func-tionally relevant cortical pathology. Neurodegenera-tion could be expected to impair cortical and hencecognitive function and, as already discussed, it mightalso reduce DOC, although MRI-pathological studieswould be needed to investigate this potential mecha-nism further.
It is nevertheless evident that most of the variancein frontal z-score was not explained by DOC or theother cortical DTI measures. There may be severalexplanations for this. First, cognitive function couldalso be determined by white matter pathology and aprevious study has reported a relationship betweenfrontal normal-appearing white matter FA and execu-tive function (59). Second, compensatory cortical ad-aptation in other frontal regions may have, to someextent, preserved executive function and hencemasked the cognitive DOC correlations in our ROIs.Third, DOC may be affected by pathological changes(eg, inflammation) that have less impact than neuro-degeneration on cognitive function. Lastly, structuralmeasurements such as those derived from diffusionMRI do not tell us directly about functional altera-tions; cellular, biochemical, and physiological dys-function is also likely to be involved in the develop-ment of cognitive defects with the subtle changes intissue microstructure that we have observed being apart of a multifactorial chain of events.
The increase in cortical MD in MS patients is inkeeping with previous reports (22–30) and has been
noticed in all cortical regions studied (24). Thesignificant univariate correlation of cortical MD in allparcellations with executive function is in keepingwith previous reports (28). However, the absence ofassociation between cortical MD and executive func-tion in the regression analyses indicates that the uni-variate associations were not independent and wereprobably explained by the significant association ofMD with DOC. This suggests that while MD is moresensitive overall to MS cortical abnormality, DOCdetects more regionally specific and clinically signifi-cant pathology.
Previous studies have reported both decreases(32,33) and increases (31) of cortical FA in MS com-pared with controls. The variable FA findings mayreflect differences between cortical lesions and nor-mal-appearing cortex (32), along with unpredictablepartial volume effects in cortical voxels: adjacent CSFtending to reduce FA and juxtacortical white mattertending to increase it (60). The voxel dimensions inour study are smaller than in previous studies of dif-fusion in the GM of people with MS (31,32) and thesignificant decrease in FA that we observed remainedafter adjusting for GM volume within each parcella-tion. FA in the superior and middle frontal parcella-tions was a weak independent predictor of executivedysfunction and decrease in FA may reflect function-ally significant disruption of cortical structure, albeitless so than DOC.
Some limitations to our study should be mentioned.First, our patients were older than our controls. How-ever, as there was no significant correlation betweenage and diffusion measures in controls, age is unlikelyto have significantly altered our results. In addition, af-ter adjusting for age, little difference was seen in theresults with the exception of DOC in the middle frontalparcellations, which still showed a trend for a groupdifference. Second, there may have been subtle regis-tration errors in regions near air sinuses, such as thefrontal and temporal lobes, but such errors wouldhave occurred in patients and controls and they wouldhave masked rather than enhanced cortical diffusion-based MRI abnormalities. Third, while the results ofthis study indicate a possible role for DOC measuresin assessing the impact MS has on cortical tissues,this work was not designed to determine the pathologi-cal processes underlying this. A combined histopatho-logical-MRI study is required, but in the meantime MRImay still be able to provide useful insight into the sub-strates of diffusion abnormalities. In particular, usingMRI it is possible to detect cortical lesions in vivo,albeit a minority (7). By assessing differences in diffu-sion characteristics in cortical lesions and normal-appearing GM, it would be possible to gain informationabout the effects that focal cortical demyelination hason these measures. Fourth, given the DTI voxel sizethere remains potential for partial volume effects tohave influenced the results, although allowing for tis-sue volumes in the statistical analyses should limitthis. Finally, our findings should not be extrapolatedto other frontal cortical regions.
In conclusion, our findings suggest that DOC, anovel diffusion-based measure, provides clinically
Diffusion Orientational Complexity in MS 61

relevant information additional to MD or FA. Measure-ment of DOC could be informative in future diffusion-based studies that investigate cortical abnormalitiesin MS and other neurological diseases.
ACKNOWLEDGMENT
We thank the people who took part in this study.
REFERENCES
1. Kidd D, Barkhof F, McConnell R, Algra PR, Allen IV, Revesz T.Cortical lesions in multiple sclerosis. Brain 1999;122:17–26.
2. Kutzelnigg A, Lucchinetti CF, Stadelmann C, et al. Cortical demy-elination and diffuse white matter injury in multiple sclerosis.Brain 2005;128:2705–2712.
3. Peterson JW, Bo L, Mork S, Chang A, Trapp BD. Transected neu-rites, apoptotic neurons, and reduced inflammation in corticalmultiple sclerosis lesions. Ann Neurol 2001;50:389–400.
4. Bø L, Vedeler CA, Nyland HI, Trapp BD, Mørk SJ. Subpial demye-lination in the cerebral cortex of multiple sclerosis patients.J Neuropathol Exp Neurol 2003;62:723–732.
5. Gilmore CP, Donaldson I, Bø L, Owens T, Lowe J, Evangelou N.Regional variations in the extent and pattern of grey matter de-myelination in multiple sclerosis: a comparison between the cere-bral cortex, cerebellar cortex, deep grey matter nuclei and thespinal cord. J Neurol Neurosurg Psychiatry 2009;80:182–187.
6. Calabrese M, De Stefano N, Atzori M, et al. Detection of corticalinflammatory lesions by double inversion recovery magnetic reso-nance imaging in patients with multiple sclerosis. Arch Neurol2007;64:1416–1422.
7. Seewann A, Kooj EJ.Roosendaal SD, et al. Postmortem verifica-tion of MS cortical lesion detection with 3D DIR. Neurology 2012;78:302–308.
8. Reynolds R, Roncaroli F, Nicholas R, Radotra B, Gveric D, HowellO. The neuropathological basis of clinical progression in multiplesclerosis. Acta Neuropathol 2011;122:155–170.
9. Wegner C, Esiri MM, Chance SA, Palace J, Matthews PM. Neo-cortical neuronal, synaptic, and glial loss in multiple sclerosis.Neurology 2006;67:960–967.
10. Chard DT, Miller DHM. Grey matter pathology in clinically earlymultiple sclerosis: evidence from magnetic resonance imaging.J Neurol Sci 2009;282:5–11.
11. Cohen-Adad J, Polimeni JR, Helmer KG, et al. T(2)* mapping andB(0) orientation-dependence at 7T reveal cyto- and myeloarchi-tecture organization of the human cortex. Neuroimage 2012;60:1006–1014.
12. D’haeseleer M, Cambron M, Vanopdenbosch L, De Keyser J. Vas-cular aspects of multiple sclerosis. Lancet Neurol 2001;10:657–666.
13. Agosta F, Rovaris M, Pagani E, Sormani MP, Comi G, Filippi M.Magnetization transfer MRI metrics predict the accumulation ofdisability 8 years later in patients with multiple sclerosis. Brain2006;129:2620–2627.
14. Fisher E, Lee JC, Nakamura K, Rudick RA. Gray matter atrophyin multiple sclerosis: a longitudinal study. Ann Neurol 2008;64:255–265.
15. Morgen K, Sammer G, Courtney SM, et al. Evidence for a directassociation between cortical atrophy and cognitive impairment inrelapsing-remitting MS. Neuroimage 2006;30:891–898.
16. Calabrese M, Rinaldi F, Mattisi I, et al. Widespread corticalthinning characterizes patients with MS with mild cognitiveimpairment. Neurology 2010;74:321–328.
17. Calabrese M, Agosta F, Rinaldi F, et al. Cortical lesions and atro-phy associated with cognitive impairment in relapsing-remittingmultiple sclerosis. Arch Neurol 2009;66:1144–1150.
18. Stuss DT, Benson DF. Neuropsychological studies of the frontallobes. Psychol Bull 1984;95:3–28.
19. Benedict RHB, Zivadinov R. Risk factors and management of cog-nitive dysfunction in multiple sclerosis. Nat Rev Neurol 2011;7:332–342.
20. Brownell B, Hughes JT. The distribution of plaques in the cere-brum in multiple sclerosis. J Neurol Neurosurg Psychiatry 1962;25:315–320.
21. Foong J, Rozewicz L, Quaghebeur G, et al. Executive function inmultiple sclerosis: the role of frontal lobe pathology. Brain 2007;120:15–26.
22. Ceccarelli A, Filippi M, Neema M, et al. T2 hypointensity in thedeep gray matter of patients with benign multiple sclerosis. MultScler 2009;15:678–686.
23. Cercignani M, Bozzali M, Iannucci G, Comi G, Filippi M. Magnet-isation transfer ratio and mean diffusivity of normal appearingwhite and grey matter from patients with multiple sclerosis. JNeurol Neurosurg Psychiatry 2001;70:311–317.
24. Hasan KM, Walimuni IS, Abid H, Datta S, Wolinsky JS, NarayanaPA. Human brain atlas-based multimodal MRI analysis of volu-metry, diffusimetry, relaxometry and lesion distribution in multi-ple sclerosis patients and healthy adult controls: implications forunderstanding the pathogenesis of multiple sclerosis and consoli-dation of quantitative MRI results in MS. J Neurol Sci 2012;313:99–109.
25. Pulizzi A, Rovaris M, Judica E, et al. Determinants of disability inmultiple sclerosis at various disease stages: A multiparametricstudy. Arch Neurol 2007;64:1163–1168.
26. Rocca MA, Ceccarelli A, Rodegher M, et al. Preserved brain adapt-ive properties in patients with benign multiple sclerosis. Neurol-ogy 2010;74:142–149.
27. Rovaris M, Bozzali M, Iannucci G, et al. Assessment of normal-appearing white and gray matter in patients with primary pro-gressive multiple sclerosis: a diffusion-tensor magnetic resonanceimaging study. Arch Neurol 2002;59:1406–1412.
28. Rovaris M, Riccitelli G, Judica E, et al. Cognitive impairment andstructural brain damage in benign multiple sclerosis. Neurology2008;71:1521–1526.
29. Yu CS, Lin FC, Liu Y, Duan Y, Lei H, Li KC. Histogram analysis ofdiffusion measures in clinically isolated syndromes and relaps-ing-remitting multiple sclerosis. Eur J Radiol 2008;68:328–334.
30. Zhou F, Shiroishi M, Gong HH, Zee CS. Multiple sclerosis: hyper-intense lesions in the brain on T1-weighted MR images assessedby diffusion tensor imaging. J Magn Reson Imaging 2010;31:789–795.
31. Calabrese M, Rinaldi F, Seppi D, et al. Cortical diffusion-tensorimaging abnormalities in multiple sclerosis: a 3-year longitudinalstudy. Radiology 2011;261:891–898.
32. Poonawalla AH, Hasan KM, Gupta RK, et al. Diffusion-tensor MRimaging of cortical lesions in multiple sclerosis: Initial findings.Radiology 2008;246:880–886.
33. Vrenken H, Pouwels PJW, Geurts JJG, et al. Altered diffusiontensor in multiple sclerosis normal-appearing brain tissue: corti-cal diffusion changes seem related to clinical deterioration.J Magn Reson Imaging 2006;23:628–636.
34. Haroon HA, Morris DM, Embleton KV, Alexander DC, ParkerGJM. Using the model-based residual bootstrap to quantifyuncertainty in fiber orientations from Q-Ball Analysis. IEEETrans Med Imaging 2009;28:535–550.
35. Haroon HA, Binney RJ, Parker GJM. Probabilistic quantificationof regional cortical microstructural complexity. In: Proc 18th An-nual Meeting ISMRM, Stockholm;2010:578.
36. Haroon HA, Reynolds H, Carter SF, et al. HARDI-based micro-structural complexity mapping reveals distinct subcortical andcortical grey matter changes in mild cognitive impairment andAlzheimer’s disease. In: Proc 19th Annual Meeting ISMRM,Montreal;2011:682.
37. Poser CM, Paty DW, Scheinberg L, et al. New diagnostic criteriafor multiple sclerosis: Guidelines for research protocols. AnnNeurol 1983;13:227–231.
38. Kurtzke JF. Rating neurologic impairment in multiple sclerosis:an Expanded Disability Status Scale (EDSS). Neurology 1983;33:1444–1452.
39. Wechsler D. Wechsler test of adult reading. San Antonio, TX:Psychological Corp.;2001.
40. Wechsler D. Wechsler adult intelligence scale – third edition. SanAntonio, TX: Psychological Corp.;1997.
41. Smith A. Symbol-digit modalities test: manual. Los Angeles, CA:Western Psychological Services;1991.
42. Trenerry M. Crosson B, DeBoe J, Lebere WR. Stroop neuropsy-chological screening test. Odessa, FL: Psychological AssessmentResources;1989.
62 Muhlert et al.

43. Burgess PW, Shallice T. Response suppression, initiation andstrategy use following frontal lobe lesions. Neuropsychologia1996;34:263–272.
44. Zigmond AS, Snaith RP. The hospital anxiety and depressionscale. Acta Psychiatr Scand 1983;67:361–370.
45. Cook PA, Bai Y, Nedjati-Gilani S, et al. Camino: open-source dif-fusion MRI reconstruction and processing. In: Proc 14th AnnualMeeting ISMRM, Seattle;2006:2759.
46. Desikan RH, S�egonne F, Fischl B, et al. An automated labellingsystem for subdividing the human cerebral cortex on MRI scansin gyral based regions of interest. Neuroimage 2006;31:968–980.
47. Chard DT, Jackson JS, Miller DH, Wheeler-Kingshott CA. Reduc-ing the impact of white matter lesions on automated measures ofbrain gray and white matter. J Magn Reson Imaging 2010;32:223–228.
48. Hickman SJ, Barker GJ, Molyneux PD, Miller DH. Technicalnote: the comparison of hypointense lesions from ‘pseudo-T1’ andT1-weighted images in secondary progressive multiple sclerosis.Mult Scler 2002;8:433–435.
49. Chard DT, Griffin CM, Parker GJM, Kapoor R, Thompson AJ,Miller DH. Brain atrophy in clinically early relapsing-remittingmultiple sclerosis. Brain 2002;125:327–337.
50. McKinstry RC, Mathur A, Miller JH, et al. Radial organization ofdeveloping preterm cerebral cortex revealed by non-invasivewater diffusion anisotropy. Cereb Cortex 2002;12:1237–1243.
51. Ross MH, Pawlina W. Histology: a text and atlas. Philadelphia,PA: Lippincott Williams & Wilkins;2006.
52. Sorensen AG, Wu O, Copen WA, et al. Human acute cerebral is-chemia: detection of changes in water diffusion anisotropy byusing MR imaging. Radiology 1999;212:785–792.
53. Heidemann RM, Porter DA, Anwander A, et al. Diffusion imagingin humans at 7T using readout-segmented EPI and GRAPPA.Magn Reson Med 2010;64:9–14.
54. Heidemann RM, Anwander A, Feiweier T, Kn€osche TR, Turner R.k-space and q-space: combining ultra-high spatial and angularresolution in diffusion imaging using ZOOPPA at 7T. Neuroimage2012;60:967–978.
55. McNab JA, Jbabdi S, Deoni SC, Douaud G, Behrens TE, MillerKL. High resolution diffusion-weighted imaging in fixed humanbrain using diffusion-weighted steady state free precession.Neuroimage 2009;46:775–785.
56. Miller KL, Stagg CJ, Douaud G, et al. Diffusion imaging of whole,post-mortem human brains on a clinical MRI scanner. Neuro-Image 2011;57:167–181.
57. McNab JA, Polimeni JR, Wald LL. Surface based analysis of diffu-sion orientation for identifying architectonic domains in the invivo human cortex. In: Proc 19th Annual Meeting ISMRM,Montreal;2011:412.
58. Schmierer K, Wheeler-Kingshott CAM, Boulby PA, et al. Diffusiontensor imaging of post mortem multiple sclerosis brain. Neuro-image 2007;35:467–477.
59. Roca M, Torralva T, Meli F, et al. Cognitive deficits in multiplesclerosis correlate with changes in fronto-subcortical tracts. MultScler 2008;14:364–369.
60. Pferfferbaum A, Sullivan EV. Increased brain white matterdiffusivity in normal adult aging: relationship to anisotropy andpartial voluming. Magn Reson Med 2003;49:953–961.
Diffusion Orientational Complexity in MS 63
Copyright © 2022 FDOKUMEN