Bond orientational order, molecular motion, and free energy of high-density DNA mesophases
Upload
independentCategory
view
0download
0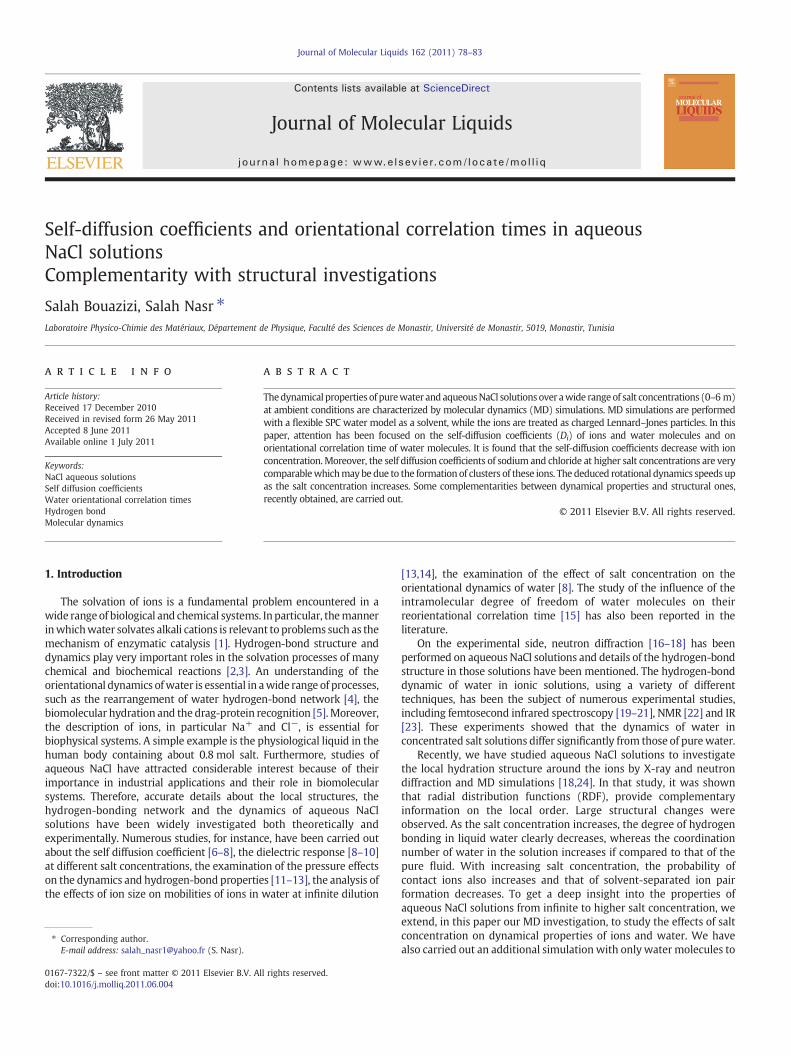
Journal of Molecular Liquids 162 (2011) 78–83
Contents lists available at ScienceDirect
Journal of Molecular Liquids
j ourna l homepage: www.e lsev ie r.com/ locate /mol l iq
Self-diffusion coefficients and orientational correlation times in aqueousNaCl solutionsComplementarity with structural investigations
Salah Bouazizi, Salah Nasr ⁎Laboratoire Physico-Chimie des Matériaux, Département de Physique, Faculté des Sciences de Monastir, Université de Monastir, 5019, Monastir, Tunisia
⁎ Corresponding author.E-mail address: [email protected] (S. Nasr).
0167-7322/$ – see front matter © 2011 Elsevier B.V. Adoi:10.1016/j.molliq.2011.06.004
a b s t r a c t
a r t i c l e i n f oArticle history:Received 17 December 2010Received in revised form 26 May 2011Accepted 8 June 2011Available online 1 July 2011
Keywords:NaCl aqueous solutionsSelf diffusion coefficientsWater orientational correlation timesHydrogen bondMolecular dynamics
Thedynamical properties of purewater andaqueousNaCl solutionsover awide rangeof salt concentrations (0–6m)at ambient conditions are characterized by molecular dynamics (MD) simulations. MD simulations are performedwith a flexible SPC water model as a solvent, while the ions are treated as charged Lennard–Jones particles. In thispaper, attention has been focused on the self-diffusion coefficients (Di) of ions and water molecules and onorientational correlation time of water molecules. It is found that the self-diffusion coefficients decrease with ionconcentration. Moreover, the self diffusion coefficients of sodium and chloride at higher salt concentrations are verycomparablewhichmaybe due to the formation of clusters of these ions. The deduced rotational dynamics speeds upas the salt concentration increases. Some complementarities between dynamical properties and structural ones,recently obtained, are carried out.
ll rights reserved.
© 2011 Elsevier B.V. All rights reserved.
1. Introduction
The solvation of ions is a fundamental problem encountered in awide rangeof biological and chemical systems. In particular, themannerinwhichwater solvates alkali cations is relevant to problems such as themechanism of enzymatic catalysis [1]. Hydrogen-bond structure anddynamics play very important roles in the solvation processes of manychemical and biochemical reactions [2,3]. An understanding of theorientational dynamics ofwater is essential in awide range of processes,such as the rearrangement of water hydrogen-bond network [4], thebiomolecular hydration and the drag-protein recognition [5]. Moreover,the description of ions, in particular Na+ and Cl−, is essential forbiophysical systems. A simple example is the physiological liquid in thehuman body containing about 0.8 mol salt. Furthermore, studies ofaqueous NaCl have attracted considerable interest because of theirimportance in industrial applications and their role in biomolecularsystems. Therefore, accurate details about the local structures, thehydrogen-bonding network and the dynamics of aqueous NaClsolutions have been widely investigated both theoretically andexperimentally. Numerous studies, for instance, have been carried outabout the self diffusion coefficient [6–8], the dielectric response [8–10]at different salt concentrations, the examination of the pressure effectson the dynamics and hydrogen-bond properties [11–13], the analysis ofthe effects of ion size on mobilities of ions in water at infinite dilution
[13,14], the examination of the effect of salt concentration on theorientational dynamics of water [8]. The study of the influence of theintramolecular degree of freedom of water molecules on theirreorientational correlation time [15] has also been reported in theliterature.
On the experimental side, neutron diffraction [16–18] has beenperformed on aqueous NaCl solutions and details of the hydrogen-bondstructure in those solutions have been mentioned. The hydrogen-bonddynamic of water in ionic solutions, using a variety of differenttechniques, has been the subject of numerous experimental studies,including femtosecond infrared spectroscopy [19–21], NMR [22] and IR[23]. These experiments showed that the dynamics of water inconcentrated salt solutions differ significantly from those of purewater.
Recently, we have studied aqueous NaCl solutions to investigatethe local hydration structure around the ions by X-ray and neutrondiffraction and MD simulations [18,24]. In that study, it was shownthat radial distribution functions (RDF), provide complementaryinformation on the local order. Large structural changes wereobserved. As the salt concentration increases, the degree of hydrogenbonding in liquid water clearly decreases, whereas the coordinationnumber of water in the solution increases if compared to that of thepure fluid. With increasing salt concentration, the probability ofcontact ions also increases and that of solvent-separated ion pairformation decreases. To get a deep insight into the properties ofaqueous NaCl solutions from infinite to higher salt concentration, weextend, in this paper our MD investigation, to study the effects of saltconcentration on dynamical properties of ions and water. We havealso carried out an additional simulation with only water molecules to
79S. Bouazizi, S. Nasr / Journal of Molecular Liquids 162 (2011) 78–83
obtain the dynamical properties of pure water. Although theproperties of pure fluid can be found in the literature, here they aresimulated under exactly the same conditions, methods, and systemsize as aqueous solutions.
The rest of the paper is organized as follows: in the next sectionwepresent the simulation methodology. In Section 2, we discuss ourresults in terms of self-diffusion coefficient, and orientational timecorrelation of water molecule. Finally, our conclusions are given inSection 3.
2. Method
The MD simulations are carried out on the (NVT) ensemble, at298 K. At each concentration, the system is made up of 256 moleculesincluding water and ions in a cubic box, to which the length L ischosen to match the experimental density. For C=0.5 m and C=6 m,another runwith 1024 particles is performed to test the possible effectof the system size on the self diffusion coefficients. The initialconfigurations of water molecules and ions were obtained by arandom displacement of the particles in the box. The simulationparameters of the studied systems are reported in Table 1 togetherwith the salt concentrations and the experimental densities. Wehave used a standard type model in which all the intermolecularinteractions are expressed as a sum of electrostatic and Lennard–Jones(12–6) potentials. The flexible SPC (simple point charge) model [25]was adopted for the water molecules. Our choice of this model wasdictated in part by its wide use and also by the fact that the diffusioncoefficient constant of the flexible SPC model are sometimes veryclose to the experimental values [26].
The ions aremodeledas the charged Lennard–Jones particles. Table 2reports the partial charge, the Lennard–Jones interaction parameters ofvarious atom types used in MD simulations [7]. The equations ofmotionswere integrated using the leap-frogmethodwith a time step of1 fs. The weak coupling scheme according to Berendsen et al. [27],periodic boundary conditions and minimum image convention wereadopted. Short-range forceswere truncated at the half of the box lengthand the Ewald summation technique [28] is employed to treat the long-range coulomb interaction. The convergence parameter isα = 5:36
L andthe maximum k in the reciprocal space is such that Kmax
2 ≤27. Initialvelocities were generated assuming a Maxwell–Boltzmann distributionand they were rescaled to guarantee momentum conservation. After
Table 1Simulation parameters and experimental densities of the studied systems.
Run
System 0 1 2 3 4 5 6 7Number of H2O 256 252 1008 244 232 224 208 832Number of ions 0 4 16 12 24 32 48 192Box length (Å) 19.62 19.56 31.20 19.53 19.44 19.41 19.36 27.87Salt concentration(m)
0 0.5 0.5 1.5 3 4 6 6
Experimental density(g/cm3)
1.010 1.018 1.018 1.053 1.100 1.128 1.580 1.580
Table 2Partial charge (q) and Lennard–Jones interaction parameters ( ε and σ) of various atomtypes used in MD simulations. Lorentz–Berthelot mixing rules were used to model theLennard–Jones interactions between atoms.
Atom q (e) ε (kj/mol) σ (Å)
O −0.82 0.65 3.1656H +0.41 0.0 0.0Na+ +1 0.544 2.35Cl− −1 0.419 4.4
equilibration, the MD simulation of each system was extended over500 ps. The velocities and coordinations of all sites are collected in 1 fsintervals. In all the simulations, the stability of the total energies wasbetter than 0.01%.
3. Results and discussion
A major objective of the present simulations is to study the effectsof ion concentration, on the dynamical properties of aqueouselectrolyte solutions. The dynamical properties of the ions can beexamined via the velocity autocorrelation functions (VACF). Thenormalized VACF, Cvvi(t), for the ith particle is defined as:
Cvvi tð Þ = vi tð Þvi oð Þh ivi 0ð Þ2� � ð1Þ
where v(t) is the velocity of the ion at time t and ⟨⟩ denotes anensemble average.
The most common quantity to describe the dynamical behavior ofa system is its diffusion coefficient D. For the ith particle, Di can becalculated From the VACFs according the relation:
Di =13∫∞
0
vi tð Þvi oð Þð Þdt ð2Þ
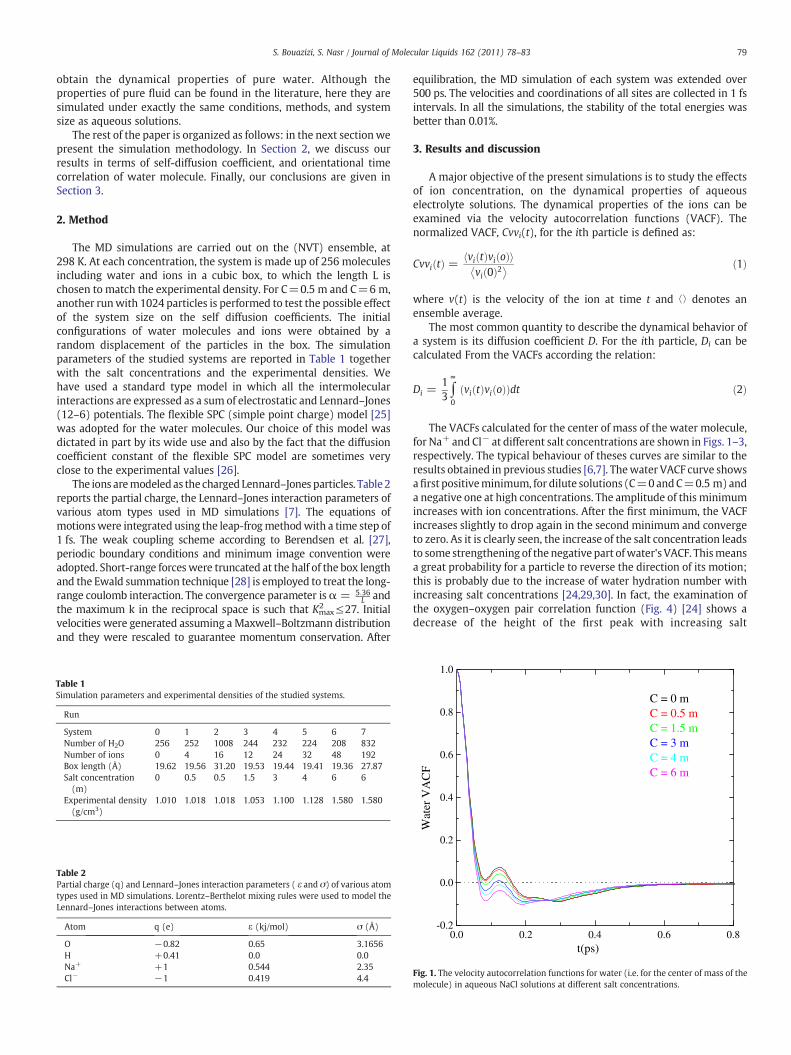
The VACFs calculated for the center of mass of the water molecule,for Na+ and Cl− at different salt concentrations are shown in Figs. 1–3,respectively. The typical behaviour of theses curves are similar to theresults obtained in previous studies [6,7]. Thewater VACF curve showsafirst positiveminimum, for dilute solutions (C=0andC=0.5 m) anda negative one at high concentrations. The amplitude of this minimumincreases with ion concentrations. After the first minimum, the VACFincreases slightly to drop again in the second minimum and convergeto zero. As it is clearly seen, the increase of the salt concentration leadsto some strengthening of the negative part ofwater's VACF. Thismeansa great probability for a particle to reverse the direction of its motion;this is probably due to the increase of water hydration number withincreasing salt concentrations [24,29,30]. In fact, the examination ofthe oxygen–oxygen pair correlation function (Fig. 4) [24] shows adecrease of the height of the first peak with increasing salt
0.0 0.2 0.4 0.6 0.8-0.2
0.0
0.2
0.4
0.6
0.8
1.0
Wat
er V
AC
F
t(ps)
C = 0 mC = 0.5 mC = 1.5 mC = 3 mC = 4 mC = 6 m
Fig. 1. The velocity autocorrelation functions for water (i.e. for the center of mass of themolecule) in aqueous NaCl solutions at different salt concentrations.
-0.2
0.0
0.2
0.4
0.6
0.8
1.0
Na+
VA
CF
t(ps)
C = 0.5 m
C = 1.5 m
C = 3 m
C = 4 m
C = 6 m
0.0 0.2 0.4 0.6 0.8
Fig. 2. The velocity autocorrelation functions for Na+ in aqueous NaCl solutions atdifferent salt concentrations.
0 2 4 6 8 100.0
0.5
1.0
1.5
2.0
2.5
3.0
3.5
4.0
4.5
g OO(r
)
r (Å)
C = 0 mC = 0.5 mC = 1.5 mC = 3 mC = 4 mC = 6 m
Fig. 4. The oxygen–oxygen pair correlation functions of aqueous NaCl solutions.
80 S. Bouazizi, S. Nasr / Journal of Molecular Liquids 162 (2011) 78–83
concentrations and a net shift of the first minimumwhichmoves fromabout 3.42 Å for pure water to 4.42 for 6 m solution. This behaviorclearly indicates a disruption of the water structure, leading to anincrease of the water coordination number.
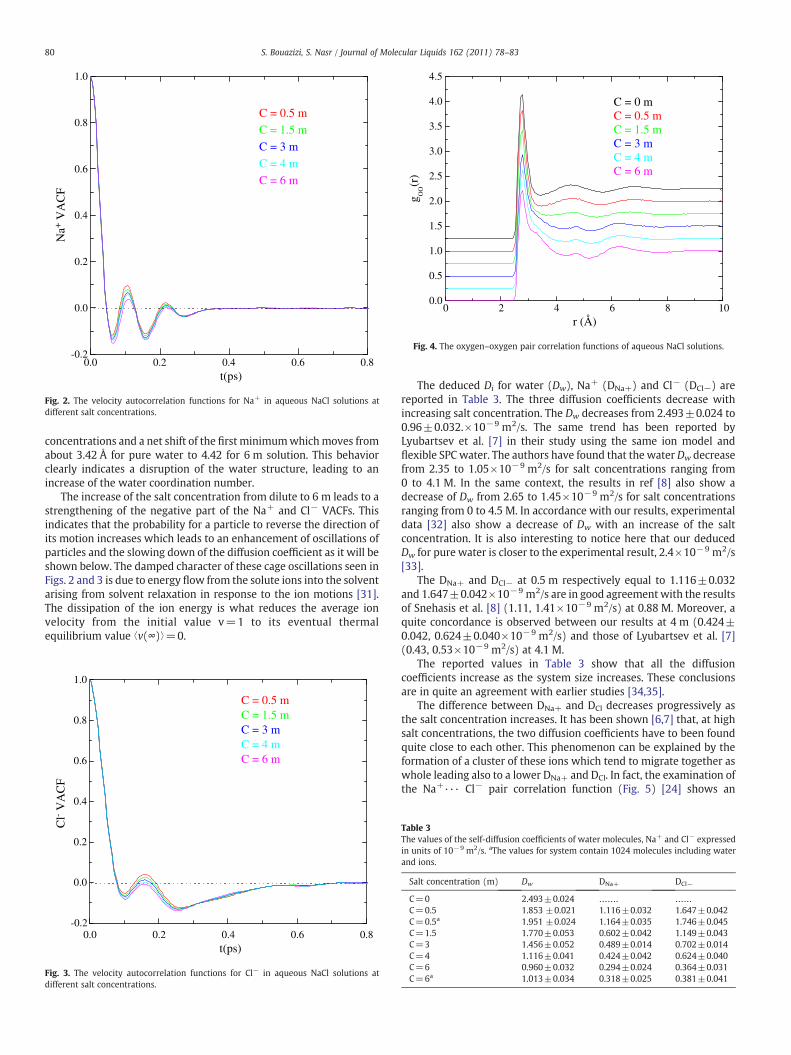
The increase of the salt concentration from dilute to 6 m leads to astrengthening of the negative part of the Na+ and Cl− VACFs. Thisindicates that the probability for a particle to reverse the direction ofits motion increases which leads to an enhancement of oscillations ofparticles and the slowing down of the diffusion coefficient as it will beshown below. The damped character of these cage oscillations seen inFigs. 2 and 3 is due to energy flow from the solute ions into the solventarising from solvent relaxation in response to the ion motions [31].The dissipation of the ion energy is what reduces the average ionvelocity from the initial value v=1 to its eventual thermalequilibrium value ⟨v(∞)⟩=0.
-0.2
0.0
0.2
0.4
0.6
0.8
1.0
C = 0.5 mC = 1.5 mC = 3 mC = 4 mC = 6 m
t(ps)0.0 0.2 0.4 0.6 0.8
Cl- V
AC
F
Fig. 3. The velocity autocorrelation functions for Cl− in aqueous NaCl solutions atdifferent salt concentrations.
The deduced Di for water (Dw), Na+ (DNa+) and Cl− (DCl−) arereported in Table 3. The three diffusion coefficients decrease withincreasing salt concentration. The Dw decreases from 2.493±0.024 to0.96±0.032.×10−9 m2/s. The same trend has been reported byLyubartsev et al. [7] in their study using the same ion model andflexible SPC water. The authors have found that the water Dw decreasefrom 2.35 to 1.05×10⁻⁹ m2/s for salt concentrations ranging from0 to 4.1 M. In the same context, the results in ref [8] also show adecrease of Dw from 2.65 to 1.45×10⁻⁹ m2/s for salt concentrationsranging from 0 to 4.5 M. In accordance with our results, experimentaldata [32] also show a decrease of Dw with an increase of the saltconcentration. It is also interesting to notice here that our deducedDw for pure water is closer to the experimental result, 2.4×10⁻⁹ m2/s[33].
The DNa+ and DCl− at 0.5 m respectively equal to 1.116±0.032and 1.647±0.042×10⁻⁹ m2/s are in good agreement with the resultsof Snehasis et al. [8] (1.11, 1.41×10⁻⁹ m2/s) at 0.88 M. Moreover, aquite concordance is observed between our results at 4 m (0.424±0.042, 0.624±0.040×10⁻⁹ m2/s) and those of Lyubartsev et al. [7](0.43, 0.53×10−9 m2/s) at 4.1 M.
The reported values in Table 3 show that all the diffusioncoefficients increase as the system size increases. These conclusionsare in quite an agreement with earlier studies [34,35].
The difference between DNa+ and DCl decreases progressively asthe salt concentration increases. It has been shown [6,7] that, at highsalt concentrations, the two diffusion coefficients have to been foundquite close to each other. This phenomenon can be explained by theformation of a cluster of these ions which tend to migrate together aswhole leading also to a lower DNa+ and DCl. In fact, the examination ofthe Na+··· Cl− pair correlation function (Fig. 5) [24] shows an
Table 3The values of the self-diffusion coefficients of water molecules, Na+ and Cl− expressedin units of 10−9 m2/s. aThe values for system contain 1024 molecules including waterand ions.
Salt concentration (m) Dw DNa+ DCl−
C=0 2.493±0.024 ……. ……
C=0.5 1.853 ±0.021 1.116±0.032 1.647±0.042C=0.5a 1.951 ±0.024 1.164±0.035 1.746±0.045C=1.5 1.770±0.053 0.602±0.042 1.149±0.043C=3 1.456±0.052 0.489±0.014 0.702±0.014C=4 1.116±0.041 0.424±0.042 0.624±0.040C=6 0.960±0.032 0.294±0.024 0.364±0.031C=6a 1.013±0.034 0.318±0.025 0.381±0.041

0 2 4 6 8 100
1
2
3
4
5
6
7
8g N
aCl(
r)
r (Å)
C = 6 mC = 4 mC = 3 mC = 1.5 mC = 0.5 m
Fig. 5. The sodium–chlorine pair correlation functions of aqueous NaCl solutions.
0.0
0.2
0.4
0.6
0.8
1.0
CO
H
1(t
)C
HH
1(t
)
0.2
0.4
0.6
0.8
0.90.0 0.2
1.0
C = 6 m C = 4 m C = 3 m C = 1.5 m C = 0.5 m C = 0 m
a
b
81S. Bouazizi, S. Nasr / Journal of Molecular Liquids 162 (2011) 78–83
increase of the first maximum and a decrease of the second and thirdones with increasing salt concentrations, which proves the formationof pairing ions and the decrease of separated ones. This tendency isparticularly in accordancewith the study of Lyubartsev et al. [7]. Otherstudies [36] have concluded that large ionic clusters stabilized byhydration molecules can be found in aqueous NaCl solution at 1 M.Ibuki et al. [37], in their study of aqueous LiCl solution, have found thatthe formation of clustering occurs at intermediate concentrations. InFig. 6, we have drawn the rdfs between the like-charged ions. Thecurves show a first peak in the Na+–Na+ and Cl−–Cl− rdfs located at3.8 and 5.3 Å, respectively. This corresponds to a situation where thepair of ions is separated by a water molecule. The rdfs for like-chargeions increase with increasing salt concentrations.
Molecular reorientational motions in liquids are usually analyzedthrough the time correlation functions:
Cβl tð Þ = Pl
→uβ tð Þ:uβ 0ð Þ� �D E
ð3Þ
0.0
0.2
0.4
0.6
0.8
1.0
1.2
0 2 4 6 8 100.0
0.2
0.4
0.6
0.8
1.0
1.2
a
C = 6 mC = 4 mC = 3 mC = 1.5 mC = 0.5 m
b
C = 6 mC = 4 mC = 3 mC = 1.5 mC = 0.5 m
g ClC
l(r)
g NaN
a(r)
r (Å)
Fig. 6. The sodium–sodium (a) and chlorine–chlorine (b) pair correlation functions ofaqueous NaCl solutions.
where Pl refers to the lth Legendre polynomial and →uβ is a unit vectoralong a given direction. We calculated C1
β(t) and C2β(t) for four
different →uβ unit vectors: a unit vector →uu along the molecular dipolemoment direction, a unit vector →uOH along the O–H direction, a unitvector→uHH along the H–H direction and a unit vector→u⊥ = →uu × →uHH
perpendicular to the molecular plane. C1u(t) and C2OH(t) are related to
dielectric and NMR relaxation measurements, respectively.In order to make a quantitative analysis of the rotational dynamics
we have evaluated the reorientational correlation times τlβ for all the
analyzed molecular directions as the time integrals:
τβl = ∫∞
0
Cβl tð Þdt ð4Þ
The time dependence of Clβ(t) curves is shown in Figs. 7 and 8.
Theoretically, it has been shown that, at short times, the decay of Clβ(t)
is generally non-exponential because of inertial and non-Markovianeffects [38,39]. At long times, when these effects are not importantand the relaxation is diffusional, Cl
β(t) decays exponentially. One cansee that the decay of these functions (for all the analyzed directions)
C1
1(t
)
0.0
0.0
0.2
0.4
0.6
0.8
μC
(t)
0 2 4 6 8 10 120.0
0.2
0.4
0.6
0.8
⊥
t(ps)
c
d
Fig. 7. The orientational correlation time functions C1β(t). (a) The unit vector →uOH is
along the O–H direction, (b) the unit vector→uHH is along the H–H direction, (c) the unitvector →uμ is along the molecular dipole moment direction and (d) the unit vector→u⊥ = →uOH × →uHH is perpendicular to the molecular plan.
0.0
0.2
0.4
0.6
0.8
1.0
0.0
0.2
0.4
0.6
0.8
0.0
0.2
0.4
0.6
0.8
0 2 4 6 8 10 120.0
0.2
0.4
0.6
0.8
t(ps)
C = 6 m C = 4 m C = 3 m C = 1.5 m C = 0.5 m C = 0 mC
OH
2(t
)C
HH
2(t
)C
22
(t)
μC
(t)
⊥
a
b
c
d
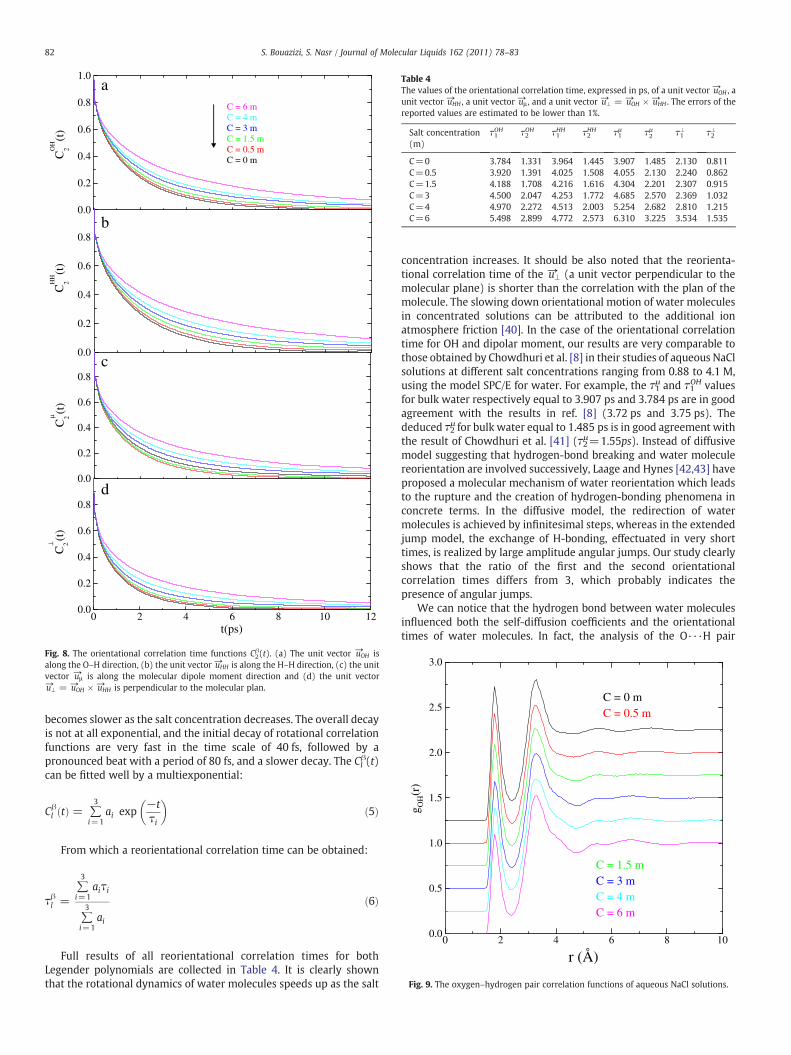
Fig. 8. The orientational correlation time functions C2β(t). (a) The unit vector →uOH is
along the O–H direction, (b) the unit vector→uHH is along the H–H direction, (c) the unitvector →uμ is along the molecular dipole moment direction and (d) the unit vector→u⊥ = →uOH × →uHH is perpendicular to the molecular plan.
Table 4The values of the orientational correlation time, expressed in ps, of a unit vector →uOH , aunit vector →uHH , a unit vector →uμ , and a unit vector →u⊥ = →uOH × →uHH . The errors of thereported values are estimated to be lower than 1%.
Salt concentration(m)
τ1OH τ2
OH τ1HH τ2
HH τ1μ τ2
μ τ1⊥ τ2
⊥
C=0 3.784 1.331 3.964 1.445 3.907 1.485 2.130 0.811C=0.5 3.920 1.391 4.025 1.508 4.055 2.130 2.240 0.862C=1.5 4.188 1.708 4.216 1.616 4.304 2.201 2.307 0.915C=3 4.500 2.047 4.253 1.772 4.685 2.570 2.369 1.032C=4 4.970 2.272 4.513 2.003 5.254 2.682 2.810 1.215C=6 5.498 2.899 4.772 2.573 6.310 3.225 3.534 1.535
0 2 4 6 8 100.0
0.5
1.0
1.5
2.0
2.5
3.0
C = 4 mC = 6 m
C = 1.5 mC = 3 m
C = 0 mC = 0.5 m
g OH(r
)
r (Å)
Fig. 9. The oxygen–hydrogen pair correlation functions of aqueous NaCl solutions.
82 S. Bouazizi, S. Nasr / Journal of Molecular Liquids 162 (2011) 78–83
becomes slower as the salt concentration decreases. The overall decayis not at all exponential, and the initial decay of rotational correlationfunctions are very fast in the time scale of 40 fs, followed by apronounced beat with a period of 80 fs, and a slower decay. The Cl
β(t)can be fitted well by a multiexponential:
Cβl tð Þ = ∑
3
i=1ai exp
−tτi
� �ð5Þ
From which a reorientational correlation time can be obtained:
τβl =∑3
i=1aiτi
∑3
i=1ai
ð6Þ
Full results of all reorientational correlation times for bothLegender polynomials are collected in Table 4. It is clearly shownthat the rotational dynamics of water molecules speeds up as the salt
concentration increases. It should be also noted that the reorienta-tional correlation time of the →u⊥ (a unit vector perpendicular to themolecular plane) is shorter than the correlation with the plan of themolecule. The slowing down orientational motion of water moleculesin concentrated solutions can be attributed to the additional ionatmosphere friction [40]. In the case of the orientational correlationtime for OH and dipolar moment, our results are very comparable tothose obtained by Chowdhuri et al. [8] in their studies of aqueous NaClsolutions at different salt concentrations ranging from 0.88 to 4.1 M,using the model SPC/E for water. For example, the τ1μ and τ1OH valuesfor bulk water respectively equal to 3.907 ps and 3.784 ps are in goodagreement with the results in ref. [8] (3.72 ps and 3.75 ps). Thededuced τ2μ for bulk water equal to 1.485 ps is in good agreement withthe result of Chowdhuri et al. [41] (τ2μ=1.55ps). Instead of diffusivemodel suggesting that hydrogen-bond breaking and water moleculereorientation are involved successively, Laage and Hynes [42,43] haveproposed a molecular mechanism of water reorientation which leadsto the rupture and the creation of hydrogen-bonding phenomena inconcrete terms. In the diffusive model, the redirection of watermolecules is achieved by infinitesimal steps, whereas in the extendedjump model, the exchange of H-bonding, effectuated in very shorttimes, is realized by large amplitude angular jumps. Our study clearlyshows that the ratio of the first and the second orientationalcorrelation times differs from 3, which probably indicates thepresence of angular jumps.
We can notice that the hydrogen bond between water moleculesinfluenced both the self-diffusion coefficients and the orientationaltimes of water molecules. In fact, the analysis of the O···H pair

83S. Bouazizi, S. Nasr / Journal of Molecular Liquids 162 (2011) 78–83
correlation function (Fig. 9) [24] shows a decrease of the firstmaximum with increasing salt concentrations implying that theaverage number of hydrogen bonds per water molecule decreaseswith increasing salt concentrations. Chandra et al. [44] in their studyof the effect of hydrogen-bond environment on dynamical propertiesof water, found that both translational and orientational relaxationoccur at the slowest rate when tagged molecules participate in fourhydrogen-bonds. The breaking of hydrogen bonds occurs in thesubpicosecond time scale and its rate is found to accelerate somewhatwith increasing ion concentrations because of a reduction ofthe effective strength of hydrogen bonds in the presence of ionatmosphere [40].
4. Conclusion
We have carried out molecular dynamics simulations of aqueousNaCl solutions at different salt concentrations. Our main goal is to givea detailed picture of the self-diffusion coefficient and orientationalcorrelation time in aqueous NaCl solutions at salt ranging from 0 to6 m. In liquid water, the hydrogen-bond network evolves continu-ously, breaking and reforming hydrogen bonds as well as reorientingand switching hydrogen bond partners. In aqueous NaCl solutions, thehydrogen bond network of water is partially or completely disrupted,depending on the concentration of NaCl salt. With increasing saltconcentrations, the water molecules are more free. Particularly thereorientational correlation time of the →u⊥ unit vector is shorter thanthe correlationwith the plan of themolecule. TheDi of water, Na+ andCl− decrease with increasing salt concentrations, whereas the DNa+
and DCl− seem to be quite close to each other at high salt concen-trations, leading to a formation of the clusters of these ions.
Acknowledgements
The authors thank Nabiha Bchir for helping in the improvement ofthe linguistic aspect of this paper.
References
[1] G.A. Jeffery, W. Saenger, Hydrogen Bonding in Biological Structures, Berlin,Springer-Verlag, 1991.
[2] G.J. Zhao, K.L. Han, J. Phys. Chem. A 111 (2007) 2469.[3] G.J. Zhao, J.Y. Liu, L.C. Zhou, K.L. Han, J. Phys. Chem. B. 111 (2007) 8940.[4] I. Ohmine, H. Tanaka, Chem. Rev. 93 (1993) 2545.[5] B. Bagchi, Chem. Rev. 105 (2005) 3197.[6] H. Uchida, M. Matsuoka, Fluid Phase Equilib. 219 (2004) 49.[7] A.P. Lyubartsev, A. Laaksonen, J. Phys. Chem. 100 (1996) 16410.[8] S. Chowdhuri, A. Chandra, J. Chem. Phys. 115 (2001) 3732.[9] A. Chandra, J. Chem. Phys. 113 (2000) 903.
[10] A.Y. Zasetsky, I.M. Svishchev, J. Chem. Phys. 115 (2001) 1448.[11] A. Chandra, S. Chowdhuri, J. Phys. Chem. B. 106 (2002) 6779.[12] S. Chowdhuri, A. Chandra, Chem. Phys. Lett. 373 (2003) 79.[13] S. Koneshan, J.C. Rasaiah, R.M. Lynden-Bell, S.H. Lee, J. Phys. Chem. B. 102 (1998)
4193.[14] S.H. Lee, J.C. Rasaiah, J. Chem. Phys. 101 (1994) 6964.[15] E. Guărdia, J.A. Padrŏ, J. Phys. Chem. 94 (1990) 6049.[16] P.H.K. de Jong, G.W. Neilson, J. Chem. Phys. 107 (1997) 8577.[17] R. Mancinelli, A. Botti, F. Bruni, M.A. Ricci, A.K. Soper, J. Phys. Chem. Chem. Phys. 9
(2007) 2959.[18] S. Bouazizi, F. Hammami, S. Nasr, M.-C. Bellissent-Funel, J. Mol. Struct. 892 (2008)
47.[19] H.J. Bakker, M.F. Kropman, A.W. Omta, J. Phys. Condens. Matter 17 (2005) S3215.[20] M.F. Kropman, H.J. Bakker, J. Chem. Phys. 115 (2001) 8942.[21] H.J. Bakker, M.F. Kropman, A.W. Omta, S. Woutersen, Phys. Scr. 69 (2004) C14.[22] H.J. Bakker, Chem. Rev. 108 (2008) 1456.[23] R. Laenen, A. Thaller, Chem. Phys. Lett. 349 (2001) 442.[24] S. Bouazizi, S. Nasr, N. Jaîdane, M.-C. Bellissent-Funel, J. Phys. Chem. B. 110 (2006)
23515.[25] K. Toukan, A. Rahman, Phys. Rev. B. 31 (1995) 2643.[26] J. Anderson, J.J. Ullo, S. Yip, J. Chem. Phys. 87 (1987) 1726.[27] H.J.C. Berendsen, J.P.M. Postma, W.F. Van Gunsteren, A. DiNola, J.R. Haak, J. Chem.
Phys. 81 (1984) 3684.[28] S.W. de Leeuw, J.W. Perram, E.R. Smith, Proc. R. Soc. London. A 373 (1980) 27.[29] M. Llano-Restrepo, W.G. Chapman, J. Chem. Phys. 100 (1994) 8321.[30] P.C. Vogel, K. Heinzinger, Z. Naturforsch. 31A (1976) 476.[31] S.A. Adelman, Rev. Chem. Intermediates 8 (1987) 321.[32] K. Muller, H.G. Hertz, J. Phys. Chem. 100 (1996) 1256.[33] M. Ferrario, M. Haughney, I.R. McDonald, M.L. Kein, J. Chem. Phys. 93 (1990) 5156.[34] D. Spångberg, K. Hermansoon, J. Chem. Phys. 119 (2003) 7263.[35] I.-C. Yeh, G. Hummer, J. Phys. Chem. B 108 (2004) 15873.[36] L. Degrève, F.L.B. da Silva, J. Chem. Phys. 111 (1999) 5150.[37] K. Ibuki, P.A. Bopp, J. Mol. Liq. 147 (2009) 56.[38] B. Bagchi, A. Chandra, Adv. Chem. Phys. 80 (1991) 1.[39] S. Ravichandran, B. Bagchi, J. Phys. Chem. 98 (1994) 11242.[40] A. Chandra, Phys. Rev. Lett. 85 (2000) 768.[41] S. Chowdhuri, A. Chandra, J. Phys. Chem. B. 110 (2006) 9674.[42] D. Laage, J.T. Hynes, Science 311 (2006) 832.[43] D. Laage, J.T. Hynes, Proc. Natl. Acad. Sci 311 (2007) 11167.[44] A. Chandra, S. Chowdhuri, Chem. Sci. 113 (2001) 591.
Copyright © 2022 FDOKUMEN