Impacts of soil management on productivity - Catch-C
59
This project has received funding from the European Union’s Seventh Framework Programme for research, technological development and demonstration under grant agreement no 289782 Project duration: January 2012 - December 2014 Impacts of soil management on productivity D3.324 Laura Zavattaro, Chiara Costamagna, Carlo Grignani, Luca Bechini, further contributing Partner(s): Heide Spiegel, Norman Schlatter, Hans-Peter Haslmayr, Taru Lehtinen +all contributors to the data base Submission date: 31/03/2014 Funded by the European Union Compatibility of Agricultural Management Practices and Types of Farming in the EU to enhance Climate Change Mitigation and Soil Health
-
Upload
khangminh22 -
Category
Documents
-
view
2 -
download
0
Transcript of Impacts of soil management on productivity - Catch-C

This project has received funding from the European Union’s Seventh Framework Programme for research, technological development and demonstration under grant agreement no 289782
Project duration: January 2012 - December 2014
Impacts of soil management on productivity
D3.324
Laura Zavattaro, Chiara Costamagna, Carlo Grignani, Luca Bechini,
further contributing Partner(s):
Heide Spiegel, Norman Schlatter, Hans-Peter Haslmayr, Taru Lehtinen
+all contributors to the data base
Submission date:
31/03/2014
Funded by the European Union
Compatibility of Agricultural Management Practices and
Types of Farming in the EU to enhance Climate Change
Mitigation and Soil Health

CATCH-C No. 289782 Deliverable number: D3.324 09 April 2014
Page 2 of 59
The CATCH-C project aims at identifying and improving the farm compatibility of sustainable soil management practices for farm productivity, climate-change mitigation, and soil quality. The project is carried out by a consortium of 12 partners, led by Stichting Dienst Landbouwkundig Onderzoek (DLO), The Netherlands.
Email: [email protected] Internet: www.catch-c.eu
Authors of this report and contact details
Name: Laura Zavattaro, Chiara Costamagna, Carlo Grignani
Partner acronym: Unito
Address: Dept. Agricultural Forest and Food Science University of Torino Via L. da Vinci 44 10095 Grugliasco, Italy
E-mail: [email protected] Name: Luca Bechini Partner acronym: Umil Address: Dept. Agricultural and Environmental Science
University of Milan Via Celoria 2 20133 Milan, Italy
E-mail: [email protected]
Disclaimer:
This publication has been funded under the CATCH-C project (Grant Agreement N° 289782) within the 7th Framework Programme for Research, Technological Development and Demonstration, Theme 2 – Biotechnologies, Agriculture & Food. Its content does not represent the official position of the European Commission and is entirely under the responsibility of the authors.
The information in this document is provided as is and no guarantee or warranty is given that the information is fit for any particular purpose. The user thereof uses the information at its sole risk and liability.
Information contained in this document will be part of the published papers of PhD students and other authors collaborating to the project. The use of reported data or the reproduction of tables and figures requires explicit authors' authorization for five years from the publication date of the present document.

CATCH-C No. 289782 Deliverable number: D3.324 09 April 2014
Page 3 of 59
Table of contents
Table of contents 3
General information 5
Executive summary 5
Specific part 7
1 Introduction 7
2 Materials and Methods 9
2.1 Shared library 9
2.2 Database 9
2.3 Main indicators 12
2.4 Data treatment 13
2.5 Statistical analysis 15
3 Results and Discussion 17
3.1 Crop rotation 17
3.1.1 Expected results from the literature 17
3.1.2 Description of cases and Reference treatment 17
3.1.3 Influencing factors 19
3.2 Intercropping 20
3.3 Harvested catch crop 20
3.3.1 Expected results from the literature 20
3.3.2 Description of cases and Reference treatment 21
3.3.3 Influencing factors 23
3.4 Green manure (not harvested) 23
3.4.1 Expected results from the literature 23
3.4.2 Description of cases and Reference treatment 24
3.4.3 Influencing factors 25
3.5 No tillage 26
3.5.1 Expected results from the literature 26
3.5.2 Description of cases and Reference treatment 26
3.5.3 Influencing factors 28
3.6 Minimum tillage 30
3.6.1 Expected results from the literature 30
3.6.2 Description of cases and Reference treatment 31
3.6.3 Influencing factors 33
3.7 Fertilization with compost 35
3.7.1 Expected results from the literature 35
3.7.2 Description of cases and Reference treatment 35
3.7.3 Influencing factors 37
3.8 Farmyard manure application 38

CATCH-C No. 289782 Deliverable number: D3.324 09 April 2014
Page 4 of 59
3.8.1 Expected results from the literature 38
3.8.2 Description of cases and Reference treatment 38
3.8.3 Influencing factors 40
3.9 Slurry application 41
3.9.1 Expected results from the literature 41
3.9.2 Description of cases and Reference treatment 41
3.9.3 Influencing factors 43
3.10 Incorporation of crop residues 43
3.10.1 Expected results from the literature 43
3.10.2 Description of cases and Reference treatment 44
3.10.3 Influencing factors 46
3.11 Burning of crop residues 46
3.11.1 Expected results from the literature 46
3.11.2 Description of cases and Reference treatment 47
3.11.3 Influencing factors 49
3.12 Irrigation 50
4 Conclusions 51
References 55

CATCH-C No. 289782 Deliverable number: D3.324 09 April 2014
Page 5 of 59
General information Task(s) and Activity code(s): Task 3.2, Activity 3.2.1, 3.2.2, 3.2.3 and 3.2.4
Input from (Task and Activity codes):
Output to (Task and Activity codes):
Related milestones: MS323
Suggested citation:
Zavattaro L., Costamagna C., Grignani C., Bechini L., 2014, Impacts of soil management on productivity. Catch-C “Compatibility of Agricultural Management Practices and Types of Farming in the EU to enhance Climate Change Mitigation and Soil Health”, www.catch-c.eu. 59 pages.
Executive summary
Agricultural practices can be considered as good if they positively affect the efficiency of resource use, soil fertility, C sequestration, or farm economic profitability. Not all effects go in the same direction, and some drawbacks can be acceptable (e.g. a slight decrease in yield) if other advantages are met (e.g. a reduction in costs, or an increase in SOM). This report presents results on the effects of a series of good management practices on crop yield, N uptake and surplus.
Multi-years averages of crop yields, N uptake and field N surplus (supply-removal) from more than 100 LTEs across Europe were analyzed. Agricultural practices considered were the use of crop rotations, harvested catch crops, crop used as green manures, no- and minimum tillage, organic fertilization with farmyard manure (FYM), bovine slurry or compost, and crop residues management. Yield obtained using each practice were divided by those obtained when the practice was not adopted, in the same conditions. The indicator obtained, a relative ratio (RR), is greater than 1 when the practice increased yield. N uptake was also analyzed using RR, while N surplus was examined using the difference between the practice and reference treatment (DIFF). A negative value indicates a reduction in surplus. A multiple linear model using climate, soil type and duration of practice (4 levels each), and crop (12 types) as nominal factors was performed to evaluate which conditions mostly affected the performance of a practice.
In more than 80% of the cases, a crop grown in a rotation outyielded the crop grown in a monoculture, and the average increase in yield was 5%. Best performances were obtained in Western Europe climate, sand or loam soils, wheat or grain maize, and in long-lasting experiments (10-20 years). N uptake was also increased and N surplus was reduced. In 60% of the cases, the use of a harvested catch crop (both leguminous and non-leguminous) resulted in a yield increase of the main crop and best results were obtained in Eastern Europe, soils other than silt, barley, maize or minor cereals, and in long-lasting experiments. N uptake was also increased in 80% of cases, and consequently N surplus was reduced. Little or no effect of green manure on yield and N uptake was observed, in all pedo-climatic conditions explored. This means that the performance of green manuring could not be predicted on the basis of the considered factors.
CATCH-C No. 289782 Deliverable number: D3.324 09 April 2014
Page 6 of 59
A reduction in yield and N uptake is to be expected when no tillage is applied, but on average this reduction was limited to 4%. Silt soils performed best. Similar but less encouraging results on yield and N indicators were obtained using minimum tillage (defined as non-inversion tillage at a shallower depth than ploughing). Furthermore, the performance of this technique on yield was not influenced by the factors here considered, whereas N uptake was increased and N surplus was reduced in Western Europe. When organic and mineral fertilizers were applied at the same N rate, similar crop yield and N uptake were observed. However, the performance of organic fertilizers depended on the soil type (best results in coarse-textured soils), climate (the colder, the better) and duration of practice (more than 5-10 years). Incorporation of crop residues caused a reduction in yield (probably because of N immobilization) especially in badly-structured soils, in all crops. Quite surprisingly, burning cereals straw positively affected yield and N uptake, while reducing N surplus, although observations were mostly located in Western Europe and sandy soils.
In conclusion, when assessing farm-compatibility of good management practices several aspects have to be considered. Promoting productivity, climate change mitigation, and soil quality at the same time can sometimes be difficult to achieve. LTEs provide plenty of information that rarely is aggregated, compared and well exploited. Nitrogen management interacts with most other farm practices. In order to reach a higher N use efficiency, a simultaneous and complete analysis of many interactions must be considered. Only when this is done it is possible to identify bottlenecks and potentially overcome the social and economic barriers that slow the adoption of good practices for an efficient N use.

CATCH-C No. 289782 Deliverable number: D3.324 09 April 2014
Page 7 of 59
Specific part
1 Introduction
Increasing crop production to feed the growing population was a major challenge to the agricultural community in the past few decades. As a result, management practices consisting of intensive tillage and high rate of fertilization were used to increase crop production. Society must now accomplish the dual objectives of improving yield levels and food stability and of preserving the quality and quantity of ecosystem services. Farming practices which ensure a maintenance of fertility and good use of resources, thus maintaining high yields, are to be promoted.
A reduction of tillage intensity, the adoption of green manuring, of crop residue incorporation and the substitution of mineral with organic fertilizers are among the most used farm management practices to maintain soil quality.
Reduced tillage techniques, aimed at minimizing soil inversion and soil structure disruption, increase soil organic matter (SOM) by reducing residue and organic matter oxidation (Lal and Kimble, 1997; West and Post, 2002; Holland, 2004; Alluvione et al., 2009, Alluvione et al., 2010). Although uncertainty remains as to the soil organic carbon (SOC)-sequestering efficacy of such techniques (Baker et al., 2007; Lal, 2009; Luo et al., 2010), there is no doubt about their fossil fuel-saving benefit. Leguminous green manure, crop residue incorporation and organic fertilizers from animal wastes are known to represent viable options as mineral N fertilizer substitutes (Bøckman, 1997; Eriksen et al., 1999; N’Dayegamiye and Tran, 2001; Tejada and Gonzalez, 2003; Tejada et al., 2008, Alluvione et al., 2013). In addition to microbial activity stimulation, soil fertility increase, pest control, and reduced soil erosion, green manures and crop residues can prevent nutrient leaching during the non-crop-growing season and supply low-energy-cost N to the subsequent crop (Crews and Peoples, 2004; Cherr et al., 2006). Organic fertilization has not only a low groundwater N pollution risk (Erhart et al., 2007), if applied at a rate that meets crop needs (Hadas et al., 2004), but also great nutritive element recycling (Ikumo, 2005) and soil C sequestering and protection potential (Spaccini et al., 2002; Piccolo et al., 2004; Lynch et al., 2006).
Crop rotation has always been used in agriculture to maintain the soil fertility over years. Long-term studies have shown that crop rotations are essential to maintain high production levels (Mitchell et al., 1991), which can be assured in monoculture only by the use of mineral fertilizers and pesticides (Crookston et al., 1991; Bullock, 1992). Monoculture in fact often result in yield decreases (Power and Follett, 1987; Peterson and Varvel, 1989).
No tillage practices are promoted mostly because of a reduction in costs and labour, but also because they may have positive effects on soil physical properties such as aggregate stability (Rhoton et al., 1993; Ghuman and Sur, 2001), soil water availability (Unger, 1994; Drury et al., 1999), number of biopores (Francis and Knight, 1993), root growth (Martino and Shaykewich, 1994). There is little consensus as to whether tillage has any influence over the N balance of the soil (Mitsch et al., 1999; Smith et al., 1990).
Cover crops and catch crops are often used to reduce environmental problems caused by intensive cropping. They can take up mineral N during the winter period, in temperate climates (Lemaire et al., 2004). A soil cover can reduce wind and water erosion. Leguminous cover crops fix N biologically and may improve the soil N fertility (Kuo and Sainju, 1998; Vaughan et al., 2000; Gselman and Kramberger, 2008).

CATCH-C No. 289782 Deliverable number: D3.324 09 April 2014
Page 8 of 59
The effects of agricultural practices can be assessed properly only in long-term experiments, where small changes can accumulate over the years up to become detectable (as often occurs in soil organic matter changes), and interaction with meteorological variability can be assessed. Johnston (1994) stated that Long-term or continuing experiments are the best practical way of assessing the sustainability of an agricultural system.
In this report the results of a literature review are presented. The review was performed to verify the hypotheses that such practices are not only effective in improving the soil quality and reducing cultivation costs, but also in maintaining high yields and quality.
The work focuses on the effect of improved practices on crop productivity indicators, through an analysis of available European literature from long term experiment on the main field crops.
CATCH-C No. 289782 Deliverable number: D3.324 09 April 2014
Page 9 of 59
2 Materials and Methods
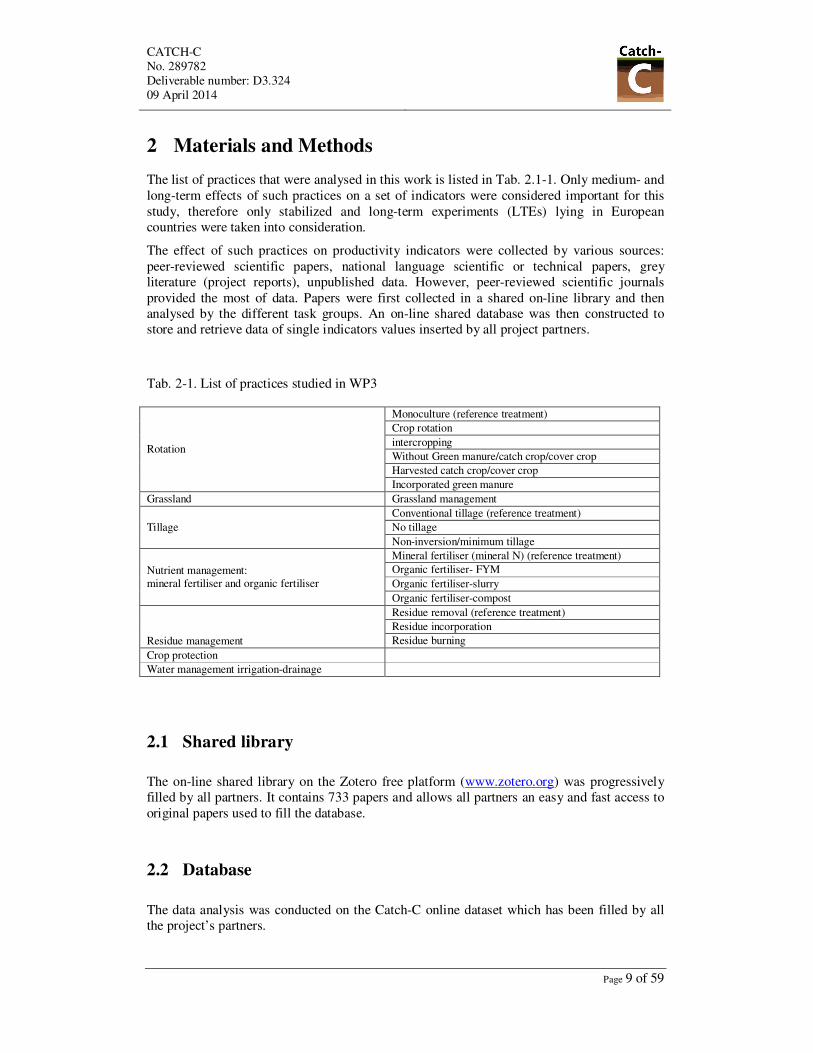
The list of practices that were analysed in this work is listed in Tab. 2.1-1. Only medium- and long-term effects of such practices on a set of indicators were considered important for this study, therefore only stabilized and long-term experiments (LTEs) lying in European countries were taken into consideration.
The effect of such practices on productivity indicators were collected by various sources: peer-reviewed scientific papers, national language scientific or technical papers, grey literature (project reports), unpublished data. However, peer-reviewed scientific journals provided the most of data. Papers were first collected in a shared on-line library and then analysed by the different task groups. An on-line shared database was then constructed to store and retrieve data of single indicators values inserted by all project partners.
Tab. 2-1. List of practices studied in WP3
Rotation
Monoculture (reference treatment) Crop rotation intercropping Without Green manure/catch crop/cover crop Harvested catch crop/cover crop Incorporated green manure
Grassland Grassland management
Tillage Conventional tillage (reference treatment) No tillage Non-inversion/minimum tillage
Nutrient management: mineral fertiliser and organic fertiliser
Mineral fertiliser (mineral N) (reference treatment) Organic fertiliser- FYM Organic fertiliser-slurry Organic fertiliser-compost
Residue management
Residue removal (reference treatment) Residue incorporation Residue burning
Crop protection Water management irrigation-drainage
2.1 Shared library
The on-line shared library on the Zotero free platform (www.zotero.org) was progressively filled by all partners. It contains 733 papers and allows all partners an easy and fast access to original papers used to fill the database.
2.2 Database
The data analysis was conducted on the Catch-C online dataset which has been filled by all the project’s partners.

CATCH-C No. 289782 Deliverable number: D3.324 09 April 2014
Page 10 of 59
The dataset consisted in 4351 records regarding productivity (yield, biomass production, nutrient content or uptake, nutrient balance). The list of European LTEs used for this study is reported in Tab. 2.2-1.
Tab. 2.2-1. Long term trials (n=106) used in this work and practices compared in each experiment. The letter in management practices columns indicates the type of relevant indicators they reported (according to paragraph 2.3): y = yield, u = N uptake, e = Nitrogen use efficiency (NUE), b = N balance. The letter in characteristics columns indicates the type of climate, soil, duration of practice and crop (according to paragraph 2.4): climate classes are N (northern), W (western), E (eastern) and S (southern); coil texture classes are C (clay), I (silt), A (sand), L (loam); duration is L (low), M (medium), H (high), and V (very high); crops are barley (B), wheat (W), minor small-grain cereals (C), grain legume (L), maize grain (M), maize/sorghum (S), rapeseed (R), potato/beet (P), sunflower (F), legume/grass ley (G), vegetables (V), various/average (A).
management practices characteristics
Experiments ro
tati
on
catc
h c
rop
gre
en m
an
ure
no
til
lag
e
min
imu
m t
illa
ge
com
po
st
FY
M
slu
rry
inco
rp.r
esid
ues
bu
rn.
resi
du
es
clim
ate
cla
ss
soil
txt
cla
ss
du
rati
on
cro
p
Agramunt y y S I L B
Agugliano y S C H W,M
Almacelles 1 y S L L M
Almacelles 2 y S L L M
Apelsvoll y y N A M C
Apelsvoll/Kise, Trial 1
y N A H C
Ås y y y y N L M B
Ascha y E A L C
Bad Lauchstädt y E I V B,W,P
Berlin-Dahlem y E A V B,W,C,P
Boigneville y,u,e,b
W L V B,W,G
Bologna 1 y y y y S I V W,M
Bologna 2 y S C H W
Bonlez y W A L S
Braunschweig FV4 y E I H,V B,W,C,L,R Brimstone Straw y,u,e
,b W C M C
Bursa y S L L M
Candasnos y y S U L B
Cordoba y S A H,V W,L,F
Coria del Río y S L L,M W,F
Dardanos y S L L M
Doazit y y W A V M
Dornburg y E I L C
Edinburgh South Road
y,u,e,b
W A M B,R
Estonian Univ. Life Sci. (EMU)
y N A L B
Ettlingen y W I L C
Flakkebjerg y,u,e,b
y,u,e,b
E A H B,W
Flakkebjerg y y E A M W
Foggia - A y S C V W
Foggia - C y y S C H W

CATCH-C No. 289782 Deliverable number: D3.324 09 April 2014
Page 11 of 59
Foggia - D y,u,e,b
y,u,e,b
S L L,M W,L,P
Foggia - tillage y S L M W
Foulum y,u,e,b
y,u,e,b
W A M B
Frick y E C L,M W,C,M,F,G Gleadthorpe y,u,e
,b y,u,e,b
W A H,M B,W,C,R
Guissona y y S U L B
Gülzow y E A L C
Güterfelde y E A L C
Hangaar y,u,e,b
W A H M,P
Herent y W I L P
Hoogveld-Bertembos
y,u,e,b
W A L,M M,P
Huldenberg 3 y,u,e,b
W I M W,S
INRA Grignon y W L H W
IOSDV Puch y y y y E I V B,W,A
Jable y y W I H W,C,M
Jyndevad y y W A M W
Kerlavic y,u,e,b
W A H W,S
Keszthely y y E A V B,W,M
Kise y y N L M C
Kortrijkdorp y,u,e W A H M,P
la Chimenea y S L L M
Lange weide y,u,e W I H M
Lanna / Lonnstorp y N C L W
Lierde y W I L P
Lodi - POC1 y S A M M
Lodi - POC2 y y y S A H G
LTE 3 Grabów y E A V B,W
LTE 4 Baborówko y,u,e,
b
y,u,e
,b
E A V W
LTE 8 VEGTILCO y,u,e,b
y,u,e,b
W A L V
LTE 9 FARMCO y W A M P,V
LTE 10 Ferti y y y W I L P,V
LTE 11 CROPRO y y y W A M S
LTE 12 Tetto Frati y,u,e,b
y,u,e,b
y,u,e,b
y,u,e,b
S L V M
LTE 13 Lombriasco y,u,e,b
y,u,e,b
y,,,b S A H W,L,M
LTE 16 Tomejil y S C H,V W,L,F,G
LTE 18 tillage y,u,e,b
E A L,M,V
B,W,L,S,P LTE 19
Alpenvorland y E I V W
LTE 19 Marchfeld y E A V W
LTE 20 IOSDV y y E A H,V B,W,P
LTE 22 Compost y y E I H,V B,W,L,S
LTE 24 Grossbeeren y,u,e,b
y,u,e,b
E I V A
LTE 25 Grossbeeren 2
y E A V A
LTE 26 GarteSud y,u,e,b
W I V L,G
LTE Braunschweig y y E I V W,A
Lyon y W U L W
Madrid (Alc. Henares)
y y S A H B,W,G
Maulde y,u,e,b
y,u,e,b
W I H,M W,M
Melle - Fert y,u,e,b
W A H S
Morley y,u,e,b
W A H,M B,W,C
Müncheberg V760 y y E A H,V B,W,C,S,P Nieuwe stal y W I H,M M,P
Nodebais y W I L S
Olite y y S L M B
Øsaker y y y y N L M B
Padova Old trial y,,,b S A V W,M,A
Papiano GM y S L V W
Papiano LTE y y S L M M

CATCH-C No. 289782 Deliverable number: D3.324 09 April 2014
Page 12 of 59
Pietranera y y,u,e,b
y S C H,V W,L Pisa y S I L,V B,W,R
Pisa 1 u,e,b y,u,e,b
S I H W,L
Pisa 2 y S L V M
Pisa 4 y S L H W,S,P,F
Pivola, Maribor y W U L M
Rakican y y W A H B,W,S
Rogoza, Maribor y W U L M
Scheyern y,u,e
,b
E A H W,M,P
Serreslous y y W I V M Sp. Hoce, Maribor y W U L M
Stuttgart 1 y W U H,M W,C,G
Stuttgart 2 y W U M W,C,L
Thibie y,u,e,b
W L H W,P,G
Trossin y E A L C
Ultuna y y y y N L V S
Vasto - tillage y S L L W
Werlte y W A L C
Zaragoza y S I L M
2.3 Main indicators
Tab. 2.2-1 shows the number of records and of LTEs regarding each of the main productivity indicators that were taken into consideration for this analysis. Crop yield, total biomass, N uptake and N surplus had enough coverage to be analyzed. Conversely, the number of data and especially of LTEs dealing with P and K uptake and surplus were not enough numerous to provide a good analysis and were therefore dropped.
The number of records regarding resource use efficiency (nitrogen use efficiency, NUE; water use efficiency, WUE; energy use efficiency, EUE) and pesticide use was too scarce to be representative, as few papers reported these information.
Tab. 2.2-1. Number of records in the Catch-C database reporting productivity indicators.
Num. of records Num. of LTEs
yield 2650 106 biomass 444 28 other expressions for yield: relative yield, cereal equivalents, forage units
198 4
crop residues 169 17 N uptake of yield 197 23 N uptake of residues or of biomass 158 17 N surplus 216 12 N content of yield or of residues or of biomass 89 8 P uptake 66 4 P surplus 56 4 K uptake 6 1 K surplus 56 4 NUE 32 3 EUE 16 2 WUE 0 0

CATCH-C No. 289782 Deliverable number: D3.324 09 April 2014
Page 13 of 59
Yield indicator was considered as the more relevant within the Productivity set of indicators. In some cases yield was expressed in alternative units, such as forage units, cereal equivalent, or relative yield with respect to a reference treatment. As all these alternative expressions were homogeneous at a site, and therefore a relative ratio could be calculated (see below), and they were analyzed together with the other data.
Crop aboveground biomass was analyzed as yield when the two were synonymous (totally harvested crops) and when no other measured value of marketable yield was reported at a site or time period of an LTE. Only 77 records of total biomass from 6 LTEs were dropped because they duplicated information already reported as marketable yield.
A measurement of crop residues that were produced at a site were considered a good indicator of the site productivity, but the number of records was too limited to provide an interesting data analysis. They could instead successfully be used to explain SOC trends.
N uptake indicates the protein production of a crop, and is therefore an indicator of crop quality. Moreover, it is also an indicator of the plant nutritional status, which, in turn, is often a more sensitive indicator than total biomass production to differentiate treatments.
As N content of yields or biomass was not sufficiently reported, and partially duplicated information of N uptake, it was dropped from analysis.
N surplus was reported in 12 LTEs, but the methodology for N surplus calculation can vary a lot, for instance it can include or not atmospheric deposition and soil stock changes, therefore data are not always comparable. Therefore, N surplus was used in this analysis only when the calculation methodology reported by authors corresponded to a simple fertilization-removal balance equation.
N use efficiency is an indicator that is frequently reported when fertilizers are compared, but again there are different methodologies to calculate it. Some include N sources other than fertilizers (atmospheric deposition, soil mineralization as estimated by control plots). The number of records reporting some N use efficiency indicator was rather scarce.
At the present status we can say that most of the existing scientific literature has been utilized to collect data of European LTEs. We expect that the number of records and the geographical coverage of P and K surplus indicators that have not been used in this work would not be satisfactory for a comprehensive study.
2.4 Data treatment
Production data were first converted into dry matter yield (where needed), and units were homogenized. If the dry matter content was not reported in the dataset and the original source was not available (unpublished data, data not reported), a realistic estimation of the DM content was made.
Ancillary data of yield dry matter content were used to convert all data into dry matter.
Yield and biomass N contents were used to calculate N uptake values, when these data were not reported separately.
A simple N field balance as the difference between supply and removal was calculated using N uptake and N supplied as fertilizers, as a sum of mineral and organic. This indicator was called ‘N surplus’. Using this methodology, 342 records from 32 LTEs could be used. The amount of N supplied with fertilizers was searched for in each paper.

CATCH-C No. 289782 Deliverable number: D3.324 09 April 2014
Page 14 of 59
The simplest formula of NUE, as the ratio of removal and fertilizer total N, was calculated for 303 records and 29 LTEs.
Data from the same crop were averaged over years by single treatments, crops and sites, to take account of the fact that in some cases single years data, while in others multi-annual averages were available. Consequently, each final ‘case’ analyzed was composed by the average of all data measured at a site and keeping crops as separated items. When different ‘levels’ of a practice could be identified (e.g. different doses of a fertilizer, or different types of cover crops – leguminous and others –, or different tillage intensities within the ‘minimum tillage’ category), data were kept separated.
Then, average yield obtained using the improved practice were divided by yields obtained in the reference treatment in the same reference period. The indicator obtained, a relative ratio (RR), is greater than one when the improved practice implies an improvement in yield, and smaller than one when yield is instead reduced.
N uptake was also analyzed using relative ratio. Similarly, the relative ratio seemed the correct way of looking at NUE rather than the difference (which has no practical meaning), as NUE decreases non-linearly when fertilization level increases. NUE was defined as removal/fertilizer ratio, therefore, when a relative ratio of NUE is calculated, the formula becomes:
reference
reference
treatment
treatment
fertilizer
removal
fertilizer
removal
RRNUE =_
but, as fertilizerreference = fertilizertreatment (otherwise yields and N uptakes could not be compared), NUE RR was numerically equal to N uptake RR. The two values differ when the treatment and the reference have received a similar but not equal amount of N fertilizer.
N surplus was instead examined using the difference between improved management practice and reference treatment (DIFF). This indicator is 0 when the N surplus of improved and reference treatments are the same. A negative value indicates a reduction in N surplus.
Crops were aggregated on the basis of their physiological or agronomical properties (Fig. 2.4-1). Oat, triticale, rye were grouped as ‘minor small-grain cereals’, while barley and wheat were kept separated because of their different requirements and response to excessive fertilization. Totally-harvested cereals were kept separated from cases where grain only was harvested, as a stronger response to factors is expected when non-reproductive parts of the plant are taken into account. Root and tuber crops (potato and sugar or fodder beet) were pooled in the statistical test, but were kept separated to calculate RRs. Legume and grass leys were pooled, and soybean, peas, beans were pooled in a unique ‘grain legumes’ category. All vegetables (cabbage, leak, carrot) were pooled. In some cases, different crops had been pooled by the authors of source papers (in particular when rotations of various crops were compared), and were left as a separated ‘various’ group in this analysis.
Different aggregation levels were tested, according to an expected crop response to the intensification of management factors. We decided to limit the aggregation to a minimum in order to better detail crop response to practices.

CATCH-C No. 289782 Deliverable number: D3.324 09 April 2014
Page 15 of 59
Fig. 2.4-1. Conceptual aggregation of crops and aggregation level used in this study.
2.5 Statistical analysis
RR and DIFF frequency distributions were tested for normality (Kolmogorov-Smirnov test) and their descriptive statistics were calculated.
A one-sample t-test (2 tails) was used to identify which RR means were significantly different from 1, and which DIFF means were significantly different from 0 (p<0.05).
A multiple linear model (generalized linear model procedure of the SPSS software) using climate, crop, soil texture class and duration of practice as single nominal factors (without interactions) was performed to evaluate which conditions mostly affected the performance of each practice, separately. Climate, soil and duration of practice were divided into 4 levels each, while 12 different crop types were considered (Tab. 2.5-1 and Fig. 2.5-1). As not all soil texture and duration of practices were known from the literature, a separate ‘unknown’ class was also considered. A type III Wald statistics for maximum likelihood estimate of regression was chosen. Then, a pairwise Bonferroni test was used to separate means of single factors different at p<0.05.
Tab. 2.5-1. Levels of the four factors considered in the linear multiple regression. Climate types were those reported by Metzger et al., 2005. ALN = Alpine north, BOR = Boreal, NEM = Nemoral, ATN = Atlantic North, ATC = Atlantic Central, ALS = Alpine South, LUS = Lusitanian, CON = Continental, PAN = Pannonian, ANA = Anatolian, MDM = Mediterranean mountains, MDN = Mediterranean North, MDS = Mediterranean South.
num. climate soil texture class duration of
practice
crop
1 northern (ALN, BOR, NEM)
clay (clay, sandy clay, silty clay)
low (< 5 yrs)
barley
2 western (ATN, ATC, ALS, LUS)
loam (loam, clay loam, sandy clay loam, silty clay loam)
medium (5-10 yrs)
wheat

CATCH-C No. 289782 Deliverable number: D3.324 09 April 2014
Page 16 of 59
3 eastern (CON, PAN) sand (sand, loamy sand, sandy loam)
high (11-20 yrs)
minor small grain cereals
4 southern (ANA, MDM, MDN, MDS)
silt (silt, silty loam)
very high (> 20 yrs)
grain legume
5 unknown unknown maize grain 6 maize/sorghum (total) 7 rapeseed 8 potato/beet 9 sunflower 10 legume/grass ley 11 vegetables 12 various (average)
Fig. 2.5-1. Levels of the four factors considered in the linear multiple regression. a) Climate (acronyms as in Tab. 2.5-1), from Metzger et al., 2005, modified; b) soil texture classes according to USDA classification.
a)
b)

CATCH-C No. 289782 Deliverable number: D3.324 09 April 2014
Page 17 of 59
3 Results and Discussion
3.1 Crop rotation
3.1.1 Expected results from the literature
Several authors reported that crops in rotation produced more than in monoculture. For instance, Grignani et al. (2007) report that introducing a ley in rotation with maize reduced the DM production of the system (owing to the low yield potential of grass compared to that of maize), reduced the system response to fertilization, and diminished the exploitation of organic N at high fertilization rates. Nevens and Reheul (2003) demonstrate the positive effects of 3-year grazed grassland breaks in an arable forage crop rotation: the crops following the grasslands showed high yields and, compared with permanent arable plots the N fertilization could be reduced substantially due to the release of the soil fertility built up under the leys. In fact, temporary grasslands in rotation ensure a high clover content, provide clean grass (uncontaminated with worm larvae) and provide an opportunity for control of perennial weeds.
Conversely, Deike et al. (2008) reported that the total yield of the entire crop rotation was higher in continuous winter wheat cropping than in winter oilseed rape–winter wheat–winter wheat–winter barley rotation. This demonstrates the importance of the structural composition of the crop rotation, including the suitability of included crops for different farming systems or management intensities.
3.1.2 Description of cases and Reference treatment
A great variety of rotation types were tested across European LTEs, mainly as comparisons between rotations differing in length or crops involved. The duration of a rotation varied from 2 to 6 years. Several complex rotations could not easily be attributed to one of the categories studied in Catch-C, i.e. rotation with cereal, with legume, with tuber/root crop, or grassland. Therefore a certain number of tested treatments could not be analyzed because a simple pairwise comparison could not be found. Monoculture was chosen as a reference treatment, when it was included among treatments tested at an LTE. If not, another rotation which differed for the absence of the tested factor was used as reference treatment (cereal vs no cereal, legume vs no legume, tuber/root crop vs no tuber/root crop, grassland vs no grassland).
Tab. 3.1-1. Main descriptive statistics for indicators in crop rotation. The t-test indicates if RR mean is significantly different from 1 and if DIFF mean is significantly different from 0 (p<0.05).
MP n. mean min max st.dev. skewness kurtosis normality test
t-test
yield RR 27 1.05 0.81 1.34 0.12 0.41 0.99 0.200 ns 0.024 + N uptake RR 3 1.03 0.90 1.15 0.13 -0.27 - - 0.718 ns NUE RR 3 1.38 1.05 1.93 0.48 1.65 - - 0.305 ns N surplus DIFF 3 -43.9 -109.3 -10.6 56.6 -1.73 - - 0.311 ns

CATCH-C No. 289782 Deliverable number: D3.324 09 April 2014
Page 18 of 59
Fig. 3.1-1. Frequency distribution of yield RR in crop rotation.
After selection, a few cases that allowed comparison of yields remained: 6 cases dealt with rotation with cereals, 12 with rotations with legume crops, 3 with rotations with tuber or root crops, and 6 with rotation with grasslands, for a total of 27 cases, that were pooled for this analysis. Observations were limited to one or two main crops (mainly cereals) common to the rotations tested in each LTE, while the other crops included in the rotation, but not part of the tested and reference treatments, were dropped.
Main statistics of analyzed cases are reported in Tab. 3.1-1 and Fig. 3.1-1, while Tab. 3.1-2 reports the number of cases in each combination of factors.
The distribution of yield RR was normal around a mean of 1.05. This mean was significantly different from 1, i.e. a positive effect of the practice could be detected. An overall increase in yield of about 5% is then expected when crop rotation is applied, thus ranging from 0.81 to 1.34. Yield RR was greater than 1 in 81.5% of cases.
The number of cases regarding N is too limited to be discussed and to obtain a statistical significance, however in all the 3 cases NUE was higher in rotated than in monoculture crops and the N surplus was reduced, probably also because of a higher crop N uptake.
Tab. 3.1-2. Number of yield data in each combination of factors.
climate soil texture class
N W E S Total cl. si. lo. sa. unkn. Total
du
rati
on
< 5 yrs
2 5
7
2
5
7
5-10
2
4 6
1 5
6
11-20
3 3 1
2
3
>20
6 5 11 1 1 3 6
11
Total
4 11 12 27 2 3 4 18
27
soil
txt
cla
ss clay
2 2
silt
1 1 1 3
loam
4 4
sand
3 10 5 18
unknown Total 4 11 12 27

CATCH-C No. 289782 Deliverable number: D3.324 09 April 2014
Page 19 of 59
climate class soil texture class duration (yrs)
N W E S Tot. cl. si. lo. sa. unkn. Tot. <5 5-10 11-20 >20 Tot. cr
op
barley
3
3
3
3
3 3
wheat
3 4 7 2
2 3
7
1 1 5 7
minor s.g.cer. 2 5
7
2
5
7 7
7
grain legume maize grain
2 2
1
1
2
1
1 2
maize/sorgh. 2 5 7 2 5 7 4 1 2 7
rapeseed
potato/beet
sunflower
leg./grass ley
1 1
1
1
1
1
vegetables various
Total
4 11 12 27 2 3 4 18
27 7 6 3 11 27
3.1.3 Influencing factors
All four tested factors significantly influenced the performance of rotation on yield (Tab. 3.1-3). Best performances of rotation on yield are expected when dealing with wheat and grain maize, in coarse-textured soils (sandy or loamy), central Europe climatic conditions (both western and eastern), and after several years of duration of this practice.
Legume or grass leys and minor small grain cereals (such as rye or triticale), and clayey soils seem to represent unfavorable conditions for a rotation.
Tab. 3.1-3. Results of the linear multiple regression of yield RR in crop rotation.
climate soil texture class duration of practice n mean n mean n mean northern - clay 2 0.84 b low 7 1.00 ab western 4 1.08 a loam 4 1.06 a medium 6 0.91 b eastern 11 0.99 ab sand 18 1.11 a high 3 1.11 a southern 12 0.96 b silt 3 1.02 ab very high 11 1.00 ab
crop n mean barley 3 1.00 bc wheat 7 1.19 a minor small grain cereals 7 0.90 c grain legume - maize grain 2 1.12 ab maize/sorghum (total) 7 0.97 bc rapeseed - potato/beet - sunflower - legume/grass ley 1 0.86 c vegetables - various (average) -

CATCH-C No. 289782 Deliverable number: D3.324 09 April 2014
Page 20 of 59
3.2 Intercropping
Intercropping means the presence of two crops at the same time, typically undersowing of legume cover crops in growing winter wheat. It is assumed to be a proficient way of enriching the soil-crop system with N and improving weed control. Relay intercropping in springtime in growing winter wheat is expected to limit competition for resources from the legume.
In all but one of the thirty-two treatments of the Amossé et al. (2013) study, wheat grain yield was not significantly disturbed by relay intercropping whatever the aerial development of legumes. Tosti and Guiducci (2010) reported that temporary intercropping of faba bean in wheat is an excellent method to improve the quality of organic durum wheat in Mediterranean environmental conditions.
Because of the small number of studies in this regard, the intercropping has not been considered in the calculation processing.
3.3 Harvested catch crop
3.3.1 Expected results from the literature
Catch-crops are fast-growing crops sown to reduce nutrient losses when the main crop is absent from the field. Cover crops are generally planted to prevent soil erosion, again in the absence of the main crop. Therefore, these two terms are generally used to indicate the main purpose for which a secondary crop is sown, although the effects of such practices can go far beyond, including soil fertility, soil organic matter increase, weed and pest control, biodiversity, and so on. Rather than focusing on one main intended purpose, we chose to classify secondary crops on the basis of their utilization, as this was also the point of view of several farmers that were interviewed in WP4. We defined here as catch corps all secondary crops that were sown and then harvested, and therefore provided some direct economic benefit. Catch and cover crops that were not harvested and were sown only for environmental or biological purposes are here called ‘green manures’.
An increase in yields of maize, cotton, sorghum, and tomato with legume cover crops has been reported by researchers in various regions of the U.S.A. (Sainju et al., 2003). The yield increase of summer crops following legume cover crops was equivalent to those produced by fertilization of 15–200 kg N ha-1. Non-legume cover crops, however, produced crop yields similar to or lower than those did without a cover crop. Cover crops may have multiple effects on productivity. In fact, several studies found that sometimes cover crop cause an initial decrease in yield of the subsequent crop, but a positive effect in later years. Torstensson and Aronsson (2000) found a considerable yield decrease with ryegrass as catch crop in cereals for the first year and thereafter an increase in three seasons. Also Tonitto et al. (2006) and Olesen et al. (2009), in intensively fertilized systems, found that cover crops had little or no benefit to subsequent crops, and in some cases they reduced yield.
Gabriel and Quemada (2011) highlight the importance of legume cover crops that increase maize yield without N fertiliser with the benefit decreasing with N fertiliser application. Kramberger et al. (2009) found that in comparison to the control (bare fallow without cover crop), clovers increased the whole aboveground maize dry matter yield, maize grain yield and N contents in whole aboveground plants and in grain. The yields and N contents of maize

CATCH-C No. 289782 Deliverable number: D3.324 09 April 2014
Page 21 of 59
following winter rape were on the same level as the control, while yields and N contents of maize following Italian ryegrass were, in two of the experiments, at the same level as the control. Torstensson et al. (2006) confirmed that repeated use of ryegrass as catch crop increases the yield levels in conventional arable systems.
Conversely, Løes et al. (2011) reported that yield levels were about equal for grains with no catch crop and a ryegrass catch crop.
Yield responses depend on many factors, but understanding N and water dynamics may help to explain maize response to a precedent cover crop (Tosti et al., 2012; Thorup-Kristensen et al., 2003).
3.3.2 Description of cases and Reference treatment
The effects of including a harvested catch crop in rotation with a main crop was tested with reference to the main crop in the absence of the cover crop.
A total of 41 cases were analyzed, pooling different types of catch crops, both leguminous, non-Nfixing (grasses or crucifers) or mixtures. When different types of crops (‘leguminous’ and ‘others’) were tested at a certain LTE, cases were considered separately. Most studied main crops were maize for grain and wheat.
Yield RR had a mean of 1.05 (significantly different from 1) and ranged from 0.75 to 1.58. Yield RR was greater than 1 in 63.3% of cases (Tab. 3.3-1 and 3.3-2, Fig. 3.3-1).
N uptake generally increased when catch crops were used, with an overall increment of 19% with respect to the absence of a cover crop that was, however, not significant due to the remarkable variability observed (from 0.81 to 1.72 in 5 cases). This tendency towards a positive effect could be due to a reduction in N losses but also to an improved availability of N from catch crop residues. The main crop N use efficiency also tended to increase. The change in N surplus was not relevant.
Tab. 3.3-1. Main descriptive statistics for indicators in catch crops. The t-test indicates if RR mean is significantly different from 1 and if DIFF mean is significantly different from 0 (p<0.05).
MP n. mean min max st.dev. skewness
kurtosis normality test
t-test
yield RR 41 1.05 0.75 1.58 0.13 1.56 5.92 0.124 ns 0.028 + N uptake RR 5 1.19 0.81 1.72 0.36 0.79 -0.38 0.200 ns 0.301 ns NUE RR 5 1.19 0.80 1.72 0.36 0.77 -0.39 0.200 ns 0.306 ns N surplus DIFF 5 -3.9 -38.0 53.3 35.2 1.29 2.02 0.16 ns 0.815 ns

CATCH-C No. 289782 Deliverable number: D3.324 09 April 2014
Page 22 of 59
Fig. 3.3-1. Frequency distribution of yield RR in catch crops.
Tab. 3.3-2. Number of yield data in each combination of factors.
climate soil texture class
N W E S Total cl. si. lo. sa. unkn. Total
du
rati
on
< 5 yrs 5 9
4 18 3 2 3 3 7 18
5-10 6 2 1
9
3 6
9
11-20
6 2
8
4 4
8
>20
2 3 1 6
4 1 1
6
Total 11 19 6 5 41 3 6 11 14 7 41
soil
txt
cla
ss clay 3
3
silt 3 4
4 11
loam 5 6 3
14
sand
2 3 1 6
unknown 7
7
Total 11 19 6 5 41
climate class soil texture class duration (yrs)
N W E S Tot.. cl. si. lo. sa. unkn. Tot. <5 5-10 11-20 >20 Tot.
cro
p
barley 2
2
4
1
3
4 2
1 1 4
wheat 3 5 3
11 3 1 2 4 1 11 4 2 4 1 11
minor s.g.cer. 6
6
3 3
6
6
6
grain legume maize grain
8
4 12
2 3 1 6 12 10
2 12
maize/sorgh. 4 1 5 1 1 3 5 2 1 1 1 5
rapeseed
potato/beet 1 1 1 1 1 1
sunflower
leg./grass ley 1
1
1
1
1
1
vegetables various
1
1
1
1
1 1
Total 11 19 6 5 41 3 6 11 14 7 41 18 9 8 6 41

CATCH-C No. 289782 Deliverable number: D3.324 09 April 2014
Page 23 of 59
3.3.3 Influencing factors
Climate, soil, duration of practice and crops significantly influenced the performance of this practice on yield (Tab. 3.3-3).
According to our results, best performances of harvested catch crops on yield are expected in minor small-grain cereals, barley and grain maize, (but unexpectedly not in wheat), in eastern Europe climatic conditions, and after 5-20 years of duration of this practice, although no clear trend of the effect of the duration could be detected.
Catch crops had a detrimental effect on yield especially in northern Europe and silt soils.
N indicators could not result influenced by the tested factors due to the low number of cases.
Tab. 3.3-3. Results of the linear multiple regression of yield RR in harvested catch crops.
climate soil texture class duration of practice n mean n mean n mean northern 11 0.88 b clay 3 1.24 a low 18 1.09 ab western 19 1.06 b loam 11 1.02 a medium 9 0.96 b eastern 6 1.24 a sand 14 1.07 a high 8 1.13 a southern 5 0.98 b silt 6 0.94 b very high 6 0.98 ab unknown 7 0.93 a crop n mean barley 4 1.14 a wheat 11 0.91 b minor small grain cereals 6 1.37 a grain legume - maize grain 12 1.10 a maize/sorghum (total) 5 0.92 b rapeseed - potato/beet 1 0.92 b sunflower - legume/grass ley 1 0.97 b vegetables - various (average) 1 1.00 ab
3.4 Green manure (not harvested)
3.4.1 Expected results from the literature
Løes et al. (2011) reported that green-manure decreased cereal yields slightly in the season when they were undersown, as usually found for non-legume catch crops (e.g., Hiitola & Eltun, 1996; Molteberg et al., 2004; Breland, 1996; Korsæth et al., 2002). However, in the subsequent season, cereal yields are usually significantly increased (Breland, 1996; Bergkvist, 2005; Askegaard & Eriksen, 2007).
Benincasa et al. (2010) showed the effect of green manure as fertilization, on grain maize yield. In the first year, maize yield was greatly affected by the presence of green manures, but not significantly affected by the incorporation date. In the second year, grain yield obtained after green manure was high, and not significantly different from that obtained with mineral N treatments up from mineral fertilization. However, yield was lower after non-legume green manures than after legumes (Benincasa et al., 2010).

CATCH-C No. 289782 Deliverable number: D3.324 09 April 2014
Page 24 of 59
Procházková et al. (2003) reported that during 32 years of winter wheat cropping, average yields with green manuring were higher than with straw incorporation into the soil, probably due to a slower decomposition and following release of nutrients by the latter.
3.4.2 Description of cases and Reference treatment
The effects of including a green manure (a catch crop whose biomass is entirely incorporated into the soil or left at the soil surface, when no till is applied) was tested with reference to the absence of the green manure.
The number of cases was only 8 and green manure crops were both leguminous and grasses: red clover, vetch, field bean but also barley, rapeseed or timothy (Tab. 3.4-1 and 3.4-2, Fig. 3.4-1).
Green manure had an overall null effect on yield, and positive cases balanced negative ones. The N uptake and N surplus of the main crop, that was reported only in 2 cases in northern Europe, with opposite trends; positive for barley, negative for wheat.
Tab. 3.4-1. Main descriptive statistics for indicators in green manure. The t-test indicates if RR mean is significantly different from 1 and if DIFF mean is significantly different from 0 (p<0.05).
MP n. mean min max st.dev. skewness kurtosis normality test
t-test
yield RR 8 1.00 0.64 1.30 0.19 -0.56 2.16 0.200 ns 0.974 ns N uptake RR 2 0.99 0.89 0.20 0.02 - - - 0.923 ns NUE RR 2 0.99 0.89 1.09 0.14 - - - 0.923 ns N surplus DIFF 2 1.5 -8.0 11.0 13.4 - - - 0.900 ns
Fig. 3.4-1. Frequency distribution of yield RR in green manure.

CATCH-C No. 289782 Deliverable number: D3.324 09 April 2014
Page 25 of 59
Tab. 3.4-2. Number of yield data in each combination of factors.
climate soil texture class
N W E S Total cl. si. lo. sa. unkn. Total
du
rati
on
< 5 yrs
5-10 2 1
2 5
3 2
5
11-20
2
2
2
2
>20 1
1
1
1
Total 3 1 2 2 8
4 4
8
soil
txt
cla
ss clay
silt 2
2 4
loam 1 1 2
4
sand unknown
Total 3 1 2 2 8
climate class soil texture class duration (yrs)
N W E S Tot.. cl. si. lo. sa. unkn. Tot. <5 5-10 11-20 >20 Tot.
cro
p
barley 1 1 1 1
1
1
wheat 1 1 1 1
1
1
minor s.g.cer. 2 2 1 1 2
2
2
grain legume
maize grain 2 2 2 2
2
2
maize/sorgh. 1 1 2 1 1 2 1 1 2
rapeseed
potato/beet
sunflower
leg./grass ley
vegetables
various
Total 3 1 2 2 8 4 4 8
5 2 1 8
3.4.3 Influencing factors
The capacity of green manure to promote a succeeding crop was not dependent on any of the tested factors: climate, soil texture class, duration of practice and type of main crop (Tab. 3.4-3). The power of the statistical test was low owing to the low number of cases, and an apparent positive effect in cold climates (northern and eastern Europe) can be noticed.
Probably, the success of a green manure is in practice the success of the incorporated crop itself as biomass produced. The failure of green manure crops can be due to short period of growth, or bad soil or climate conditions for its growth. If the biomass produced is limited, improvement of soil physical state and mobilization of nutrients can be irrelevant.
Leguminous species used as green manure provided more benefits to the main crops than non N-fixing species (yield RR = 1.00 vs 0.89, respectively, data not shown)

CATCH-C No. 289782 Deliverable number: D3.324 09 April 2014
Page 26 of 59
Tab. 3.4-3. Results of the linear multiple regression of yield RR in green manure.
climate soil texture class duration of practice n mean n mean n mean northern 3 1.12 ns clay - low - western 1 0.89 ns loam 4 1.01 ns medium 5 0.97 ns eastern 2 1.04 ns sand 4 0.93 ns high 2 0.97 ns southern 2 0.83 ns silt - very high 1 0.97 ns crop n mean barley 1 1.07 ns wheat 1 0.89 ns minor small grain cereals 2 0.89 ns grain legume - maize grain 2 0.89 ns maize/sorghum (total) 2 1.11 ns rapeseed - potato/beet - sunflower - legume/grass ley - vegetables - various (average) -
3.5 No tillage
3.5.1 Expected results from the literature
Crop yields produced by using no-tillage have been reported to be similar or higher than those produced by using conventional tillage (Sainju et al., 2003). Yield of silage maize yield was not significantly different among tillage practices, and conversely sorghum grain yield was greater with reduced tillage than with no-tillage, whereas cotton lint yield was greater with no-tillage than with mouldboard ploughing. Results of tomato varied between years. These results suggests that no-tillage may be as good as conventional tillage in producing yields of cereal crops but reduced tillage may be needed to sustain yields of vegetable crops, such as tomato. Plant residues at the soil surface in no- and minimum tillage systems have been reported to delay the germination and growth of crops compared with conventional tillage, but the final crop yields have been reported to be not influenced by tillage systems (Sainju et al., 2003).
3.5.2 Description of cases and Reference treatment
No-tillage (Tab. 3.5-1, 3.5-2 and Fig. 3.5-1) has been studied all throughout Europe, but especially in southern and western countries. Most of LTEs were started in the ‘80s, and published data are therefore referred to several years of applying this practice. Wheat and barley are the most frequent tested crops. No-tillage is sometimes applied repeatedly on all the crops in a rotation, while in some other cases some crops are directly seeded while some kind of reduced tillage is performed on other crops in the rotation. All these different management strategies were pooled for this analysis.
Reasons to adopt no tillage are mostly economic (to save fuel, machinery and labour costs) or to protect the soil (from compaction, erosion, excessive mineralization). The positive effects

CATCH-C No. 289782 Deliverable number: D3.324 09 April 2014
Page 27 of 59
of no-till are other than to increase productivity, on the contrary, a decrease in yield can be expected for the technical difficulties of applying this technique. However, our analysis shows that an overall tendency (not significant) yield decrease of only 4% can be expected, although it can range from -32% to +31% following a normal distribution, if compared to tillage (ploughing in most cases).
N uptake was also lower on 73% of cases, resulting in an average, non-significant reduction by 5%, while N surplus was enhanced up to +43 kg ha-1, or reduced up to -88 kg ha-1 of N, depending on the crop N removal. In this case, NUE RR showed an overall average tendency to increase of about 5% (Fig. 3.5-2).
Tab. 3.5-1. Main descriptive statistics for indicators in no-tillage. The t-test indicates if RR mean is significantly different from 1 and if DIFF mean is significantly different from 0 (p<0.05).
MP n. mean min max st.dev. skewness kurtosis normality test
t-test
yield RR 36 0.96 0.68 1.31 0.14 0.12 0.08 0.200 ns 0.964 ns N uptake RR 11 0.95 0.74 1.29 0.16 0.87 0.97 0.200 ns 0.296 ns NUE RR 11 1.06 0.74 1.86 0.31 1.88 4.43 0.142 0.565 ns N surplus DIFF 11 -4.2 -88.3 42.9 36.2 -1.27 2.04 0.200 ns 0.705 ns
Fig. 3.5-1. Frequency distribution of yield RR in no-tillage.

CATCH-C No. 289782 Deliverable number: D3.324 09 April 2014
Page 28 of 59
a) b)
Fig. 3.5-2. Frequency distribution of N uptake RR (a) and N surplus (b) DIFF in no-tillage.
Tab. 3.5-2. Number of yield data in each combination of factors.
climate soil texture class
N W E S Total cl. si. lo. sa. unkn. Total
du
rati
on
< 5 yrs
4 4
1 1
2 4
5-10 2 6
2 10
1 4 5
10
11-20
1
11 12 4 1
7
12
>20
3 1 6 10 5
3 2
10
Total 2 10 1 23 36 9 3 8 14 2 36
soil
txt
cla
ss clay
9 9
silt
2
1 3
loam 2 3
3 8
sand
5 1 8 14
unknown
2 2
Total 2 10 1 23 36
climate class soil texture class duration (yrs)
N W E S Tot.. cl. si. lo. sa. unkn. Tot. <5 5-10 11-20
>20 Tot.
cro
p
barley 2 4
5 11
1 4 4 2 11 3 6 1 1 11
wheat 2 1 9 12 4 1 3 4
12 1 2 3 6 12
minor s.g.cer. grain legume
3 3 2
1
3
2 1 3
maize grain
1
2 3 1 1
1
3
maize/sorgh. 3 3
rapeseed 2 2 2 2 2 2
potato/beet
sunflower 2 2 1 1 2 1 1 2
leg./grass ley 1
2 3 1
1 1
3
2 1 3
vegetables various
Total 2 10 1 23 36 9 3 8 14 2 36 4 10 12 10 36
3.5.3 Influencing factors
Among tested factors (Tab. 3.5-3), soil texture class was the only one which appeared to significantly affect yield response. Best results were in fact obtained in silt soils. The number

CATCH-C No. 289782 Deliverable number: D3.324 09 April 2014
Page 29 of 59
of years from the first application of this practice was not significant, although it is well known that specific skills and experience are needed and good results can be obtained only after some years of practice.
Barley and wheat, the most tested crops under no tillage, behaved similarly. A significant crop effect was instead observed in N indicators (tab. 3.5-4 and 3.5-5), as a remarkable improvement in N content of wheat (n=3) and maize grain (n=2) was observed, thus resulting in a reduction of N surplus by about 50 kg ha-1.
Tab. 3.5-3. Results of the linear multiple regression of yield RR in no-tillage.
climate soil texture class duration of practice n mean n mean n mean northern 2 1.03 ns clay 8 0.89 b low 4 0.92 ns western 10 0.96 ns loam 8 0.92 b medium 10 1.00 ns eastern 1 0.88 ns sand 14 0.92 b high 11 0.95 ns southern 22 1.02 ns silt 3 1.19 a very high 10 1.02 ns unknown 2 0.95 ab
crop n mean barley 11 0.94 ns wheat 12 0.96 ns minor small grain cereals - - grain legume 3 1.13 ns maize grain 3 0.88 ns maize/sorghum (total) - - rapeseed 2 1.01 ns potato/beet - - sunflower 2 0.96 ns legume/grass ley 2 0.94 ns vegetables - - various (average) - -
Tab. 3.5-4. Results of the linear multiple regression of N uptake RR in no-tillage.
climate soil texture class duration of practice
n mean n mean n mean northern - clay 1 1.39 a low - western 6 1.06 ns loam 1 0.84 b medium 5 1.00 ns eastern 1 0.88 ns sand 6 0.84 b high 4 0.95 ns southern 4 0.96 ns silt 3 0.84 b very high 2 1.02 ns unknown -
crop n mean barley 3 0.94 b wheat 3 1.09 a minor small grain cereals - - grain legume 2 0.90 b maize grain 2 1.00 b maize/sorghum (total) - - rapeseed - - potato/beet - - sunflower - - legume/grass ley - - vegetables - - various (average) 1 0.96 b

CATCH-C No. 289782 Deliverable number: D3.324 09 April 2014
Page 30 of 59
Tab. 3.5-5. Results of the linear multiple regression of N surplus DIFF in no-tillage.
climate soil texture class duration of practice n mean n mean n mean northern - clay 1 -97.1 b low - western 6 -20.3 b loam 1 -12.8 a medium 5 -33.8 ns eastern 1 -91.3 c sand 6 -12.8 a high 4 -33.8 ns southern 4 10.1 a silt 3 -12.8 a very high 2 -33.8 ns unknown -
crop n mean barley 3 -25.8 a wheat 3 -51.9 b minor small grain cereals - - grain legume 2 -22.2 a maize grain 2 -47.2 b maize/sorghum (total) - - rapeseed - - potato/beet - - sunflower - - legume/grass ley - - vegetables - - various (average) 1 -22.2 a
3.6 Minimum tillage
3.6.1 Expected results from the literature
Minimum tillage or reduced tillage indicates the practice of simplifying tillage operations with respect to ploughing, by reducing depth and limiting the inversion of soil layers that occurs using a plough. In this work minimum and reduced tillage were considered as synonymous.
The overall viewpoint of most scientists, engaged in program that involves field experiments in the UK and provided data for 175 experiment-years on responses of minimum and zero tillage, was that reduced and zero tillage could, in favorable circumstances, lead to equal or even increased yields of continuous cereals compared to the traditional cultivation methods involving moldboard ploughing (Soane and Ball, 1997). Furthermore, the interest in minimum tillage is based also on mitigating soil erosion and loss of nutrients and maintaining or increasing soil organic carbon in the upper layer of soil (Mazzoncini et al., 2008).
Ellmer et al. (2000) reviewed the effects of a reduced ploughing depth on soil parameters and crop yields. The study over 75 years showed that permanent shallow ploughing had no negative influence on the mean yields over all tested crops (potato, fodder beet, winter wheat, winter rye, and various spring cereals), and even tended to have a positive effect, reaching 102.7% as compared to the treatment with deep ploughing. Also Ozpinar (2009) found that maize biomass yield and N uptake were higher in minimum tillage than using moldboard plough.
Børresen (1999) indicated that shallow tillage and direct drilling in combination with a high amount of chopped straw can be successfully used for spring-sown cereals on loamy soils in a temperate humid climate as in southeastern Norway, without any significant reduction in crop production, but with positive effects on soil physical and chemical parameters.

CATCH-C No. 289782 Deliverable number: D3.324 09 April 2014
Page 31 of 59
In their review Sainju et al. (2003) report that on average in a number of US experiments conservation tillage does not affect crop yield production in comparison to conventional tillage.
3.6.2 Description of cases and Reference treatment
Among LTEs analyzed, a variety of different machinery were used to perform minimum tillage, all having in common that they did not imply an inversion of soil and that they were performed at a shallower depth than that normally adopted in ploughing in the same area. Deep non inversion tillage was not considered in this analysis. Experiments, mostly started in the 80s and 90s, but with a precursor in Germany started in early 20s, aimed at comparing different tillage intensities either spanning from ploughing to minimum and no-tillage, or exploring a variety of different non-inversion shallow techniques performed using different machineries (Tab. 3.6-1, 3.6-2 and Fig. 3.6-1). Crops ranged from winter cereals (36 cases) to maize for grain (14 cases) and potato or beet (16 cases), while other crops were less represented. The total number of cases was 97, that shows the great interest that the scientific community has devoted to this group of practices. Experiments were conducted all throughout Europe except in the North, and all examined soil texture classes were represented but only 9 cases were on clay soils.
The reason for adopting minimum tillage is generally to reduce costs or soil disturbance, and not no improve yield, and therefore a relative ratio of 0.97 of yield (significantly different from 1) is a very interesting results, leading to consider that this practice can be equivalent to more intensive tillage as far as yield is concerned. Nevertheless, RR ranged +52 to -46% of the yield obtained in the reference treatment, and 65% of values were smaller than 1. Most of cases lay between -10 and +5%.
N uptake and efficiency, that are more sensitive indicators than yield, were reduced in 92% of cases and by 9% on average, thus evidencing that N availability was reduced in minimum tillage practices. These reductions were also significant. N surplus was consequently increased by 13 kg ha-1 on average.
Tab. 3.6-1. Main descriptive statistics for indicators in minimum tillage. The t-test indicates if RR mean is significantly different from 1 and if DIFF mean is significantly different from 0 (p<0.05).
MP n. mean min max st.dev. skewness kurtosis normality test
t-test
yield RR 97 0.97 0.54 1.52 0.13 0.76 4.96 0.001 ++ 0.008 ++ N uptake RR 24 0.91 0.63 1.07 0.10 -1.25 2.60 0.025 + 0.000 ++ NUE RR 24 0.91 0.63 1.13 0.11 -0.60 1.35 0.012 + 0.000 ++ N surplus DIFF 23 12.6 -20.3 46.3 15.3 0.40 0.70 0.064 ns 0.001 ++

CATCH-C No. 289782 Deliverable number: D3.324 09 April 2014
Page 32 of 59
Fig. 3.6-1. Frequency distribution of yield RR in minimum tillage.
a) b)
Fig. 3.6-2. Frequency distribution of N uptake RR (a) and N surplus (b) DIFF in minimum tillage.
Tab. 3.6-2. Number of yield data in each combination of factors.
climate soil texture class
N W E S Total cl. si. lo. sa. unkn. Total
du
rati
on
< 5 yrs
5 5 7 17 3 5 3 4 2 17
5-10 2 11 4 3 20 2 4 5 4 5 20
11-20 1 8 15 14 38 2 8 4 23 1 38
>20
2 15 5 22 2 6 1 13
22
Total 3 26 39 29 97 9 23 13 44 8 97
soil
txt
class
clay
5 4 9
silt
12 5 6 23
loam 2
11 13
sand 1 8 29 6 44

CATCH-C No. 289782 Deliverable number: D3.324 09 April 2014
Page 33 of 59
unknown 6
2 8
Total 3 26 39 29 97
climate class soil texture class duration (yrs)
N W E S Tot.
.
cl. si. lo. sa. unkn.
Tot. <5 5-10 11-20
>20 Tot.
crop
barley 2 1 4 6 13
3 3 5 2 13 3 4 2 4 13
wheat 4 10 9 23 4 5 2 10 2 23 2 4 9 8 23
minor s.g.cer. 1 2 3
6 1 1
2 2 6 1 1 3 1 6
grain legume 2 3 4 9 1 3 1 3 1 9 2 2 3 2 9
maize grain
6 5 3 14 1 3 2 8
14 2 2 9 1 14
maize/sorgh. 1 4 1 6 1 1 4 6 3 1 2 6
rapeseed 1 1 2 2 2 1 1 2
potato/beet 7 7 2 16 4 2 10 16 4 1 8 3 16
sunflower 1 2 3 1 2 3 1 1 1 3
leg./grass ley 2 1 1 4 1 1
1 1 4
2 1 1 4
vegetables 1
1
1
1 1
1
various Total 3 26 39 29 97 9 23 13 44 8 97 17 20 38 22 97
3.6.3 Influencing factors
None of the tested factors proved to significantly affect yield response to minimum tillage, that means that other causes or random factors determined the variability of results around the mean (Tab. 3.6-3). Therefore, this practice can be adopted in a variety of different conditions, through adapting the type of machinery and number of passages to the type of soil and crops in rotation.
N indicators (Tab. 3.6-4 and 3.6-5) showed an increase in relative N uptake from cold to warm climate. Best performing crops were legumes, both for grain and as leys, while barley and wheat suffered for a lower N availability in soil and showed a decrease in N uptake if compared to tillage (ploughing).
Medium-term experiments (5-10 years of duration) reported the most encouraging results to the adoption of minimum tillage.
Tab. 3.6-3. Results of the linear multiple regression of yield RR in minimum tillage.
climate soil texture class duration of practice n mean n mean n mean northern 3 0.95 ns clay 9 1.02 ns low 17 0.98 ns western 26 0.99 ns loam 13 1.03 ns medium 20 1.03 ns eastern 39 1.01 ns sand 44 0.94 ns high 38 0.98 ns southern 29 0.99 ns silt 23 0.95 ns very high 22 0.97 ns unknown 8 1.00 ns
crop n mean barley 13 0.95 ns wheat 23 0.95 ns minor small grain cereals 6 0.98 ns grain legume 9 0.97 ns maize grain 14 1.04 ns maize/sorghum (total) 6 0.93 ns rapeseed 2 0.95 ns potato/beet 16 0.98 ns

CATCH-C No. 289782 Deliverable number: D3.324 09 April 2014
Page 34 of 59
sunflower 3 1.13 ns legume/grass ley 4 1.04 ns vegetables 1 0.96 ns various (average) - -
Tab. 3.6-4. Results of the linear multiple regression of N uptake RR in minimum tillage.
climate soil texture class duration of practice
n mean n mean n mean northern - clay - low 2 0.94 ns western 11 0.80 a loam 1 0.79 ns medium 8 1.00 ns eastern 9 0.96 b sand 16 0.97 ns high 9 0.84 ns southern 4 0.99 b silt 7 0.99 ns very high 5 0.88 ns unknown -
crop n mean barley 3 0.79 b wheat 6 0.83 a minor small grain cereals - - grain legume 1 1.01 a maize grain 4 0.95 a maize/sorghum (total) 1 0.83 a rapeseed - - potato/beet 4 0.96 a sunflower - - legume/grass ley 1 1.03 a vegetables 1 0.95 a various (average) 3 0.89 a
Tab. 3.6-5. Results of the linear multiple regression of N surplus DIFF in minimum tillage.
climate soil texture class duration of practice n mean n mean n mean northern - clay - low 2 7.4 c western 9 31.5 b loam 1 41.0 b medium 6 -5.6 c eastern 9 2.87 a sand 16 0.5 a high 10 21.7 b southern 5 17.8 a silt 6 10.7 a very high 5 46.1 a unknown -
crop n mean barley 3 40.3 a wheat 6 38.7 a minor small grain cereals - - grain legume 1 -28.1 b maize grain 2 9.6 b maize/sorghum (total) 1 55.2 a rapeseed - - potato/beet 4 26.6 a sunflower - - legume/grass ley 1 -23.6 b vegetables 1 27.8 ab various (average) 4 9.6 b

CATCH-C No. 289782 Deliverable number: D3.324 09 April 2014
Page 35 of 59
3.7 Fertilization with compost
3.7.1 Expected results from the literature
There are three possible scenarios relating crop yield or agronomic productivity to organic C content of soil (Lal, 2006):
1. Increase in crop yield as a consequence of organic carbon pool enhancement; 2. No or little decrease in crop yield with reduction in the organic carbon pool, and 3. Increase in crop yield with decrease in the organic carbon pool.
These apparently conflicting responses depend on several factors such as the previous organic carbon pool, soil management, and use of chemical fertilizers and organic amendments.
N dynamics in compost-amended soils could be affected by different site-specific factors, e.g. compost matrices, composting conditions, climate, soil properties and management practices (Diacono and Montemurro, 2010) . It is important to take into account that the slow release of nutrients from compost or green manures should be adequately controlled to match temporal crop demand with nutrient supply. The increase in the N-use efficiency decreases leaching losses. Zhang et al. (2006) reported that the amount of N used by crops from municipal solid waste compost for barley, wheat and canola, was 11, 3, 1, and 2 % for the first and subsequent 3 years. These results indicate the complexity of estimating N release from different composts and its relationship with plant N uptake.
Sullivan et al. (1998) observed a very low release of nitrogen during the first season following application of compost.
Butler and Muir (2006) observed the greatest tall wheat-grass dry matter yield with the highest composted dairy manure rate of about 180 t ha-1. Wheat grain yield was enhanced on average by 246%, in respect to the control, with high rate of municipal soil waste compost applied annually over 5 years (Cherif et al., 2009). Similarly, Erhart et al. (2005) investigated the agronomic performance of biowaste compost on cereals and potatoes, showing that an application rate of 23 t ha-1 increased crop yields by 10% compared with the unfertilized control, on the average of 10 years. Baldoni et al. (2002) reported 12 years of results using compost in a wheat-beet and maize rotation: good yields for all three crops were obtained using all organic materials. These findings are in contrast with those of Mantovi et al. (2005), that reported that sugarbeet yield in a winter wheat-maize-sugarbeet rotation and fertilized with sewage sludge was significantly lower than non–composted biosolid treatment (51,8 t ha-1 vs 60 t ha-1, on average). Duggan (1973) observed that compost rates minor than 38 t ha-1 had no major effects on crop yields.
3.7.2 Description of cases and Reference treatment
Compost is a general term to indicate plant-based, biowaste or sludge materials that become a valuable soil amendment through composting. The final composition of compost depends on the materials from which it derives, and on the duration of the maturation phase, thus resulting in a very variable material, which, in some cases, can also have a detrimental effect on the crop growth due to toxic substances. All these kinds of compost were pooled in this analysis, for a total of 21 experiments which were mainly conducted in central Europe (10 cases in western and 8 in eastern Europe), on sandy or silt soils (8 and 12 cases, respectively), and on a variety of arable crops, including vegetables (Tab. 3.7-1, 3.7-2 and Fig. 3.7-1).
When compared to a similar N fertilization level supplied using mineral fertilizers, compost additions showed a good supplying capacity of nutrients, as yield RR had a mean of 0.95 (not significantly different from 1). More than 70% of cases lay in the range ±6%, and in one case

CATCH-C No. 289782 Deliverable number: D3.324 09 April 2014
Page 36 of 59
in Scandinavia, with maize on a clay soil, the performance was remarkably high (+67% of yield).
The number of cases where N indicators were reported was too limited to derive general trends, however a tendency of increasing the crop capacity of utilizing N could be noted. Conversely, N surplus was apparently increased, due to one short-term trial case in Mediterranean climate (in other two cases N surplus was instead slightly reduced). The variability of results reflects the variability of chemical and biophysical characteristics of compost.
Tab. 3.7-1. Main descriptive statistics for indicators in fertilization with compost. The t-test indicates if RR mean is significantly different from 1 and if DIFF mean is significantly different from 0 (p<0.05).
MP n. mean min max st.dev. skewness kurtosis normality test
t-test
yield RR 21 0.95 0.69 1.67 0.20 2.06 7.24 0.003 ++ 0.278 ns N uptake RR 2 1.04 1.02 1.05 0.02 - - - 0.234 ns NUE RR 2 1.04 1.02 1.05 0.02 - - - 0.234 ns N surplus DIFF 3 18.7 -9.0 69.0 43.7 1.71 - - 0.536 ns
Fig. 3.7-1. Frequency distribution of yield RR in fertilization with compost.
Tab. 3.7-2. Number of yield data in each combination of factors.
climate soil texture class
N W E S Total cl. si. lo. sa. unkn. Total
du
rati
on
< 5 yrs
6
6
4
2
6
5-10
4
4
4
4
11-20
6 2 8
6
2
8
>20 1
2
3
2 1
3
Total 1 10 8 2 21
12 1 8
21
as s
clay silt
4 8
12

CATCH-C No. 289782 Deliverable number: D3.324 09 April 2014
Page 37 of 59
loam 1
1
sand
6
2 8
unknown Total 1 10 8 2 21
climate class soil texture class duration (yrs)
N W E S Tot.. cl. si. lo. sa. unkn. Tot. <5 5-10 11-
20 >20 Tot.
cro
p
barley
2
2
2
2
2
2
wheat
2 1 3
2
1
3
3
3
minor s.g.cer. grain legume
2
2
2
2
2
2
maize grain
1 1
1
1
1
1
maize/sorgh. 1 1 2 4 2 1 1 4 1 3 4
rapeseed
potato/beet 4 4 2 2 4 2 2 4
sunflower
leg./grass ley vegetables 5
5
2
3
5 4 1
5
various Total 1 10 8 2 21
12 1 8
21 6 4 8 3 21
3.7.3 Influencing factors
Best results with compost were obtained when vegetables (leeks, Brussels sprouts) and peas were cropped, while maize for grain and barley yield was notably depressed (Tab. 3.7-3). As several authors (Alluvione et al., 2013) report that compost can release nutrients slowly and immobilization can occur in the first years of supply. Therefore, it is not surprising that good results with this fertilization practice could be obtained only after some years of repeated additions (>5 years, in our classification).
The best result on yield using compost was obtained in northern Europe (but this refers to only one comparison), whereas the poorest results were yielded in Mediterranean climates on cereals (two comparisons).
Tab. 3.7-3. Results of the linear multiple regression of yield RR in fertilization with compost.
climate soil texture class duration of practice n mean n mean n mean northern 1 1.61 a clay - low 6 0.99 b western 10 0.95 b loam 1 1.04 ns medium 4 1.07 a eastern 8 0.83 bc sand 8 1.06 ns high 8 1.07 a southern 2 0.80 c silt 12 1.04 ns very high 3 1.07 a
crop n mean barley 2 0.89 d wheat 3 1.01 c minor small grain cereals - - grain legume 2 1.15 ab maize grain 1 0.93 cd maize/sorghum (total) 4 1.09 abc rapeseed - - potato/beet 4 1.09 bc sunflower - - legume/grass ley - -

CATCH-C No. 289782 Deliverable number: D3.324 09 April 2014
Page 38 of 59
vegetables 5 1.18 a various (average) - -
3.8 Farmyard manure application
3.8.1 Expected results from the literature
Manure application to spring barley in the crop rotation reduced N accumulation in grass–clover and cereal grain yield by 0.12 and 0.21 t ha−1 at Foulum and Flakkebjerg, respectively. (Olesen et al. 2009).
Zavattaro et al. (2012) reported that urea, slurry, and farmyard manure were equally utilized by maize; if distributed and incorporated just before sowing, both organic fertilizers built up the soil organic matter content and reduced N leaching by 20–50% with respect to urea. These authors also observed a lower N efficiency of farmyard manure than that of slurry when supplied at low rates, probably because the available N in farmyard manure was not sufficient at early growth stages. On the contrary, farmyard manure was utilized as well as slurry or even more efficiently when applied at high rates (Grignani et al., 2007).
Tajnsek et al. (2013) reported that within the frame of three organic fertilization management systems, the procedure with FYM did not have any advantage over the system with straw ploughed in. The yields of maize in mineral fertilization were significantly higher in the fertilization system with straw than in the system with FYM.
Kismányoky and Tóth (2013) reported that on average, manure application provided additional crop yields of 16% for wheat, 17% for barley and 12% for maize. Spiegel et al. (2010) observed a significant winter wheat yield increase after FYM and slurry application (±0.74 and 0.55 t ha-1) with respect to unfertilized control.
3.8.2 Description of cases and Reference treatment
Several farmers (Grignani and Zavattaro, 2000) and several scientists (e.g. Schröder and Neeteson, 2008) state that only a fraction of total nutrients content of FYM is really available to the crop, because of immobilization and of greater losses due to a mineralization which is delayed in time when compared to the crop requirements curve. This study pooled 60 experiments across Europe, which were mainly located in eastern climatic conditions and medium or coarse-textured soils. Very long-term experiments (>20 years) were the most represented. Most of LTEs compared treatments at the same total N content, while some not, but a treatment fertilized with a similar total N amount in the range ±20 kg ha-1 could be found in all LTEs, to be used as a reference. A great variety of crops were tested, including some that are not forages (e.g. potatoes, vegetables).
On average, a significant reduction in yield by 6% was observed, however the variability around the mean was notable; 52% of values were smaller than 1 (Tab. 3.8-1).
As the frequency distribution graph shows (Tab. 3.8-2, Fig. 3.8-1), 6 cases were observed showing a rather low yield RR. They were located in Germany and Slovenia and studied rotated cereals. N uptake (n=10, mainly located in southern Europe) was instead normally distributed around a mean yield RR of 1, and N surplus showed a non-significant increase on +24 kg ha-1, on average.

CATCH-C No. 289782 Deliverable number: D3.324 09 April 2014
Page 39 of 59
Tab. 3.8-1. Main descriptive statistics for indicators in fertilization with FYM. The t-test indicates if RR mean is significantly different from 1 and if DIFF mean is significantly different from 0 (p<0.05).
MP n. mean min max st.dev. skewness kurtosis normality test
t-test
yield RR 60 0.94 0.43 1.45 0.21 -0.75 0.67 0.000 ++ 0.035 + N uptake RR 10 1.00 0.80 1.20 0.15 0.23 -1.97 0.121 ns 0.945 ns NUE RR 10 0.92 0.71 1.16 0.15 0.43 -1.12 0.200 ns 0.122 ns N surplus DIFF 10 23.9 -36.3 71.6 36.6 -0.48 -1.00 0.200 ns 0.069 ns
Fig. 3.8-1. Frequency distribution of yield RR in fertilization with FYM.
Tab. 3.8-2. Number of yield data in each combination of factors.
climate soil texture class
N W E S Total cl. si. lo. sa. unkn. Total
du
rati
on
< 5 yrs
2
2
2
2
5-10 11-20
6 4 3 13
6
7
13
>20 1
32 12 45
19 11 15
45
Total 1 8 36 15 60
27 11 22
60
soil
txt
cla
ss clay
silt
5 20 2 27
loam 1
10 11
sand
3 16 3 22
unknown Total 1 8 36 15 60
climate class soil texture class duration (yrs)
N W E S Tot.. cl. si. lo. sa. unkn. Tot. <5 5-10 11-
20 >20 Tot.
cro
p barley
1 8
9
4
5
9
2 7 9
wheat 2 8 1 11
8
3
11
3 8 11
minor s.g.cer. 1 2
3
1
2
3
1 2 3

CATCH-C No. 289782 Deliverable number: D3.324 09 April 2014
Page 40 of 59
grain legume 1 1 1 1 1 1
maize grain
1 1 3 5
2 2 1
5
maize/sorgh. 1 1 3 9 14 1 9 4 14 1 4 5
rapeseed 2 12 14
potato/beet 1 5 6 3 3 6 1 1 4 6
sunflower
leg./grass ley 2 2 2 2 2 2
vegetables 1
1
1
1 1
1
various
8
8
6
2
8
8 8
Total 1 8 36 15 60
27 11 22
60 2
13 45 60
3.8.3 Influencing factors
Among tested factors, climate and soil texture class significantly affected yield RR (Tab. 3.8-3). Results obtained in northern Europe on fodder maize were extremely positive, although the absolute yield was rather low (<5.5 t ha-1 of DM in the manured plots). Conversely, 8 cases in western Europe with Atlantic climate showed a reduction in marketable production. Coarse-textured soils, where mineralization is enhanced, created more favourable condition for manured treatments. All tested crops responded to manure application in a similar way, according to the statistical test. However, as a tendency, summer crops could benefit more of the N mineralization of organic fertilizers because they can exploit N released from mineralization of manure, if compared with crops whose maximum requirements are asynchronous with the organic fertilizer mineralization curve. Although not necessarily relevant because only one case was represented, very good results were also obtained in vegetables (red cabbage).
Tab. 3.8-3. Results of the linear multiple regression of yield RR in fertilization with FYM.
1. climate soil texture class duration of practice
n mean n mean n mean northern 1 1.56 a clay - low 2 1.29 ns western 8 0.74 c loam 11 1.10 a medium - eastern 36 1.05 b sand 22 1.21 a high 13 1.03 ns southern 15 1.14 b silt 27 1.04 b very high 45 1.04 ns
crop n mean barley 9 1.06 ns wheat 11 1.08 ns minor small grain cereals 3 1.10 ns grain legume 1 1.17 ns maize grain 5 1.10 ns maize/sorghum (total) 14 1.11 ns rapeseed - potato/beet 6 1.18 ns sunflower - legume/grass ley 2 0.97 ns vegetables 1 1.34 ns various (average) 8 1.09 ns
The high variability of results suggests that metadata are needed to understand the different performance of organic fertilizers in different environments, such as the amount and time of spreading, type of incorporation and composition.

CATCH-C No. 289782 Deliverable number: D3.324 09 April 2014
Page 41 of 59
3.9 Slurry application
3.9.1 Expected results from the literature
Nevens and Reheul (2003) report that slurry application substantially decreased the required additional amount of mineral fertilizer N. During the following years however, the combination of slurry and compost decreased the need for additional mineral N steadily to a level of only 12 kg N ha-1. Combining slurry and compost resulted in the highest N uptake, owing to a combination of the highest DM yields.
Ceotto and Spallacci (2006) and Tomasoni et al. (2011) reported a positive effect on alfalfa productivity for pig slurry applied after cuttings in the second, third and fourth year growing lucerne.
Zavattaro et al. (2012) reported that maize utilized the nutrients from organic fertilizers as well as or even better than urea, in an LTE that compared several forage systems on a loamy soil.
The slurry contains a higher proportion of N in ammonia form than can be taken up directly by the plant in early summer, resulting in a growth promotion and higher yields. Slurry application did not affect sunflower or spelt yield as compared to inorganic fertilization (Berner et al., 2008).
3.9.2 Description of cases and Reference treatment
Bovine slurry was tested in 37 (Tab. 3.9-1, 3.9-2 and Fig. 3.9-1) experiments which were located mainly in Eastern and southern Europe (n=15 and n=18, respectively). Most of experiments lasted for more than 10 years. The analysis was limited to cattle slurry because only 3 experiments used pig slurry. The reference treatment was mineral fertilizer supplied at a similar rate of total N.
Tested crops were mainly forages, while coarse-textured soils were the most represented. In these conditions, a rapid mineralization is expected, leading to a fast release of N in the soil that is similar to that of mineral fertilizers with which it was compared in this analysis (RR not different from 1). For this reason, values of the yield RR of slurry were normally distributed around a mean of 0.98, ranging from 0.52 to 1.58, and greater than 1 in 46% of cases. Therefore, liquid manure performed even better than solid manure (section 3.8).
N uptake (n=11) was instead 8% lower (significantly different from 1) than in treatments that received mineral fertilizers. However, most of data came from an LTE located in Mediterranean climate on a loam soil and are referred to the maize crop. In these conditions, N surplus was increased by about 28 kg ha-1, but this amount was not significantly different from 0.
Tab. 3.9-1. Main descriptive statistics for indicators in fertilization with slurry. The t-test indicates if RR mean is significantly different from 1 and if DIFF mean is significantly different from 0 (p<0.05).
MP n. mean min max st.dev. skewness kurtosis normality test
t-test
yield RR 37 0.98 0.52 1.58 0.19 0.05 2.45 0.132 ns 0.491 ns N uptake RR 11 0.92 0.76 1.09 0.11 0.13 -0.66 0.200 ns 0.041 +

CATCH-C No. 289782 Deliverable number: D3.324 09 April 2014
Page 42 of 59
NUE RR 11 0.92 0.63 1.19 0.20 0.01 -1.88 0.048 + 0.236 ns N surplus DIFF 12 28.2 -46.0 119.4 55.2 0.17 -1.32 0.128 ns 0.105 ns
Fig. 3.9-1. Frequency distribution of yield RR in fertilization with slurry.
Tab. 3.9-2. Number of yield data in each combination of factors.
climate soil texture class
N W E S Total cl. si. lo. sa. unkn. Total
du
rati
on
< 5 yrs
2
2
2
2
5-10
1 1
2
2
2
11-20
1 9 3 13
13
13
>20
5 15 20
5 10 5
20
Total
4 15 18 37
7 10 20
37
soil
txt
cla
ss clay
silt
2 3 2 7
loam
10 10
sand
2 12 6 20
unknown Total
4 15 18 37
climate class soil texture class duration (yrs)
N W E S Tot.. cl. si. lo. sa. unkn. Tot. <5 5-10 11-
20 >20 Tot.
cro
p
barley 4 4 1 3 4 2 2 4
wheat 1 5 2 8 2 6 8 2 2 4 8
minor s.g.cer.
grain legume
maize grain 4 4 1 2 1 4 4 4
maize/sorgh. 1 9 10 8 2 10 2 8 10
rapeseed
potato/beet 1 5 6 1 5 6 1 5 6
sunflower
leg./grass ley 2 2 2 2 2 2
vegetables 1 1 1 1 1 1
various 1 1 2 1 1 2 2 2
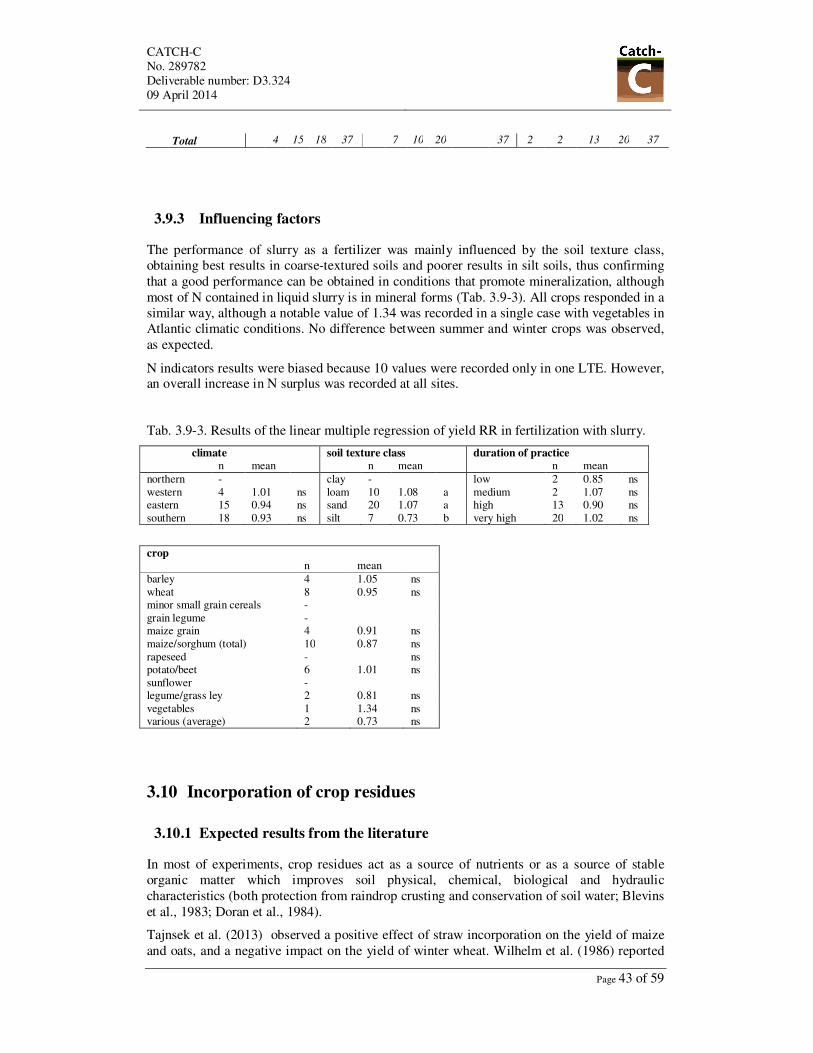
CATCH-C No. 289782 Deliverable number: D3.324 09 April 2014
Page 43 of 59
Total 4 15 18 37 7 10 20 37 2 2 13 20 37
3.9.3 Influencing factors
The performance of slurry as a fertilizer was mainly influenced by the soil texture class, obtaining best results in coarse-textured soils and poorer results in silt soils, thus confirming that a good performance can be obtained in conditions that promote mineralization, although most of N contained in liquid slurry is in mineral forms (Tab. 3.9-3). All crops responded in a similar way, although a notable value of 1.34 was recorded in a single case with vegetables in Atlantic climatic conditions. No difference between summer and winter crops was observed, as expected.
N indicators results were biased because 10 values were recorded only in one LTE. However, an overall increase in N surplus was recorded at all sites.
Tab. 3.9-3. Results of the linear multiple regression of yield RR in fertilization with slurry.
climate soil texture class duration of practice n mean n mean n mean northern - clay - low 2 0.85 ns western 4 1.01 ns loam 10 1.08 a medium 2 1.07 ns eastern 15 0.94 ns sand 20 1.07 a high 13 0.90 ns southern 18 0.93 ns silt 7 0.73 b very high 20 1.02 ns
crop n mean barley 4 1.05 ns wheat 8 0.95 ns minor small grain cereals - grain legume - maize grain 4 0.91 ns maize/sorghum (total) 10 0.87 ns rapeseed - ns potato/beet 6 1.01 ns sunflower - legume/grass ley 2 0.81 ns vegetables 1 1.34 ns various (average) 2 0.73 ns
3.10 Incorporation of crop residues
3.10.1 Expected results from the literature
In most of experiments, crop residues act as a source of nutrients or as a source of stable organic matter which improves soil physical, chemical, biological and hydraulic characteristics (both protection from raindrop crusting and conservation of soil water; Blevins et al., 1983; Doran et al., 1984).
Tajnsek et al. (2013) observed a positive effect of straw incorporation on the yield of maize and oats, and a negative impact on the yield of winter wheat. Wilhelm et al. (1986) reported
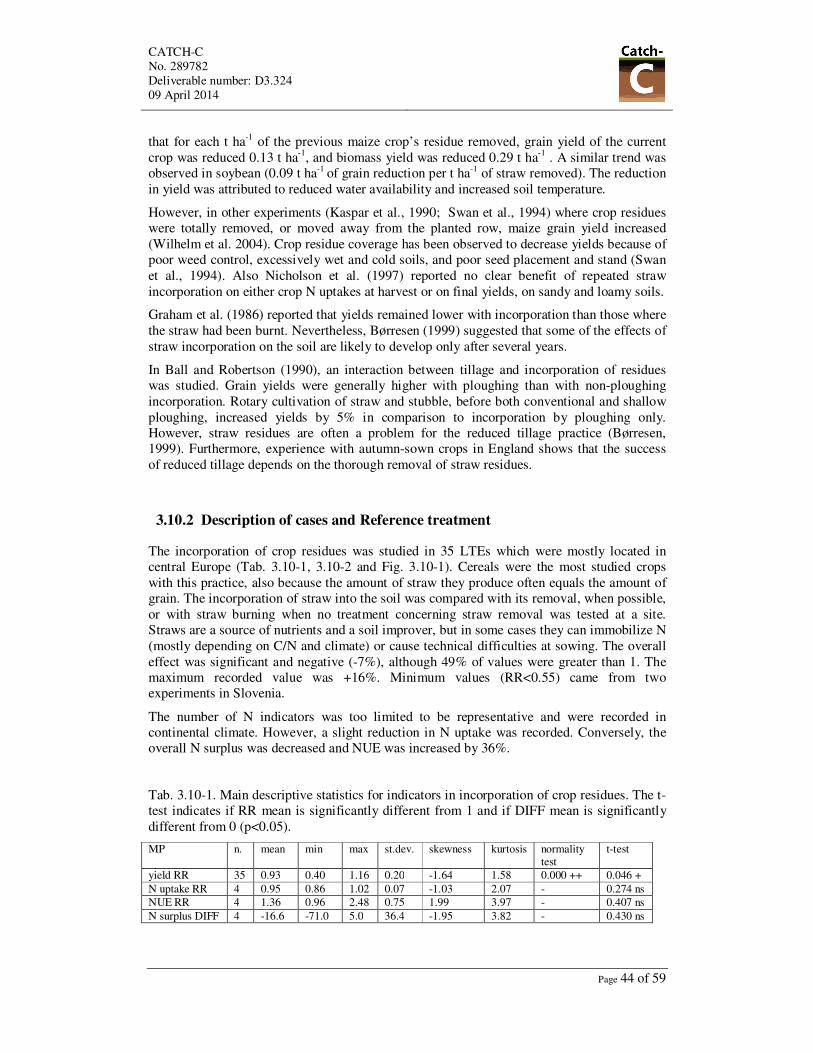
CATCH-C No. 289782 Deliverable number: D3.324 09 April 2014
Page 44 of 59
that for each t ha-1 of the previous maize crop’s residue removed, grain yield of the current crop was reduced 0.13 t ha-1, and biomass yield was reduced 0.29 t ha-1 . A similar trend was observed in soybean (0.09 t ha-1 of grain reduction per t ha-1 of straw removed). The reduction in yield was attributed to reduced water availability and increased soil temperature.
However, in other experiments (Kaspar et al., 1990; Swan et al., 1994) where crop residues were totally removed, or moved away from the planted row, maize grain yield increased (Wilhelm et al. 2004). Crop residue coverage has been observed to decrease yields because of poor weed control, excessively wet and cold soils, and poor seed placement and stand (Swan et al., 1994). Also Nicholson et al. (1997) reported no clear benefit of repeated straw incorporation on either crop N uptakes at harvest or on final yields, on sandy and loamy soils.
Graham et al. (1986) reported that yields remained lower with incorporation than those where the straw had been burnt. Nevertheless, Børresen (1999) suggested that some of the effects of straw incorporation on the soil are likely to develop only after several years.
In Ball and Robertson (1990), an interaction between tillage and incorporation of residues was studied. Grain yields were generally higher with ploughing than with non-ploughing incorporation. Rotary cultivation of straw and stubble, before both conventional and shallow ploughing, increased yields by 5% in comparison to incorporation by ploughing only. However, straw residues are often a problem for the reduced tillage practice (Børresen, 1999). Furthermore, experience with autumn-sown crops in England shows that the success of reduced tillage depends on the thorough removal of straw residues.
3.10.2 Description of cases and Reference treatment
The incorporation of crop residues was studied in 35 LTEs which were mostly located in central Europe (Tab. 3.10-1, 3.10-2 and Fig. 3.10-1). Cereals were the most studied crops with this practice, also because the amount of straw they produce often equals the amount of grain. The incorporation of straw into the soil was compared with its removal, when possible, or with straw burning when no treatment concerning straw removal was tested at a site. Straws are a source of nutrients and a soil improver, but in some cases they can immobilize N (mostly depending on C/N and climate) or cause technical difficulties at sowing. The overall effect was significant and negative (-7%), although 49% of values were greater than 1. The maximum recorded value was +16%. Minimum values (RR<0.55) came from two experiments in Slovenia.
The number of N indicators was too limited to be representative and were recorded in continental climate. However, a slight reduction in N uptake was recorded. Conversely, the overall N surplus was decreased and NUE was increased by 36%.
Tab. 3.10-1. Main descriptive statistics for indicators in incorporation of crop residues. The t-test indicates if RR mean is significantly different from 1 and if DIFF mean is significantly different from 0 (p<0.05).
MP n. mean min max st.dev. skewness kurtosis normality test
t-test
yield RR 35 0.93 0.40 1.16 0.20 -1.64 1.58 0.000 ++ 0.046 + N uptake RR 4 0.95 0.86 1.02 0.07 -1.03 2.07 - 0.274 ns NUE RR 4 1.36 0.96 2.48 0.75 1.99 3.97 - 0.407 ns N surplus DIFF 4 -16.6 -71.0 5.0 36.4 -1.95 3.82 - 0.430 ns

CATCH-C No. 289782 Deliverable number: D3.324 09 April 2014
Page 45 of 59
Fig. 3.10-1. Frequency distribution of yield RR in incorporation of crop residues.
Tab. 3.10-2. Number of yield data in each combination of factors.
climate soil texture class
N W E S Total cl. si. lo. sa. unkn. Total
du
rati
on
< 5 yrs
2 2
2
2
5-10 2 2
4 1
2 1
4
11-20
9
1 10 1 3
6
10
>20 1 2 12 4 19 1 11 2 5
19
Total 3 13 12 7 35 3 14 6 12
35
soil
txt
cla
ss clay
1
2 3
silt
4 8 2 14
loam 3
3 6
sand
8 4
12
unknown Total 3 13 12 7 35
climate class soil texture class duration (yrs)
N W E S Tot.. cl. si. lo. sa. unkn. Tot. <5 5-10 11-20
>20 Tot.
cro
p
barley 2 2 2
6
1 2 3
6
2 2 2 6
wheat 3 5 4 12 2 5 1 4
12
4 8 12
minor s.g.cer. 3
3 1 1
1
3
1 2
3
grain legume
3 2 2
7
maize grain
3 1 3 7
1 1
2 2
1 4 7
maize/sorgh. 1 1 2 1 1 2
rapeseed 1 1 1 1 1 1
potato/beet
sunflower
leg./grass ley vegetables various
4
4
4
4
4 4
Total 3 13 12 7 35 3 14 6 12
35 2 4 10 19 35

CATCH-C No. 289782 Deliverable number: D3.324 09 April 2014
Page 46 of 59
3.10.3 Influencing factors
Soil texture significantly affected the performance of this practice, that yielded best in sandy soils, where mineralization is faster (Tab. 3.10-3). As all additions that require a mineralization process, repeated years of practice are needed to obtain good results.
Although not significant at the crop level, a slight tendency can be noted between groups of crops: crop residue can improve yield if applied to summer crops, and reduce it when adopted on winter cereals (probably because of an immobilization of nutrients).
Climatic conditions do not represent a limitation to successfully apply this practice.
Tab. 3.10-3. Results of the linear multiple regression of yield RR in incorporation of crop residues.
climate soil texture class duration of practice n mean n mean n mean northern 3 1.27 ns clay 3 1.04 ab low 2 1.05 ab western 13 0.86 ns loam 6 0.91 ab medium 4 1.05 ab eastern 12 0.98 ns sand 12 1.11 a high 10 0.81 b southern 7 1.03 ns silt 14 0.93 b very high 19 1.08 a
crop
n mean barley 6 0.96 ns wheat 12 0.95 ns minor small grain cereals 3 1.09 ns grain legume - maize grain 7 0.96 ns maize/sorghum (total) 2 1.04 ns rapeseed 1 1.05 ns potato/beet - sunflower - legume/grass ley - vegetables - various (average) 4 0.95 ns
3.11 Burning of crop residues
3.11.1 Expected results from the literature
T. Børresen, (1999) reported that straw residues may lead to immobilization of nitrogen during the decay of the straw (Parr and Papendick, 1978). Plant diseases and pests are reported to be a problem where straw residues are either left on the surface or only incorporated to shallow depth just before sowing (Smith et al., 1985). McCalla and Army (1961) reported decreased yields where straw was left on the soil surface, especially in a humid climate. Riley (1983) found similar results for spring cereals on silt and silty clay, but not on morainic loams in Norway. In autumn-sown crops which were direct drilled, the yields were lower when straw residues were left on the surface than when residues were burnt (Graham et al., 1986). Incorporation of straw reduced the detrimental effect of straw on yields, but the yields remained lower than those where the straw had been burnt.
Catt et al. (1998) reported that where crop residues were burnt the mean amounts of N taken up by the crop over the winter period (i.e. sowing to spring application of fertilizer) were greater than where straw was incorporated; averaged over the four years in which winter

CATCH-C No. 289782 Deliverable number: D3.324 09 April 2014
Page 47 of 59
cereals were grown, the difference was 21% (ns). On the contrary, averaged over all five years more N was probably taken up in winter by crops grown after burning straw
3.11.2 Description of cases and Reference treatment
Burning crop residues is a cheap technique to remove them from the field. It is still widely adopted by farmers in Mediterranean areas, and in fact it has been studied in some LTEs where it was compared with incorporation but not with removal (and therefore could not be used for this analysis). The 9 cases reported were mainly located in Atlantic climate (Tab. 3.11-1, 3.11-2 and Fig. 3.11-1).
Burning had an overall slightly positive but significant effect on yield, +3%, with a very limited variability around this value. N uptake was also slightly (but not significantly) increased and consequently N surplus was slightly reduced (Fig. 3.11-2).
Tab. 3.11-1. Main descriptive statistics for indicators in burning of crop residues. The t-test indicates if RR mean is significantly different from 1 and if DIFF mean is significantly different from 0 (p<0.05).
MP n. mean min max st.dev. skewness kurtosis normality test
t-test
yield RR 9 1.03 1.01 1.06 0.02 0.79 0.24 0.200 ns 0.001 ++ N uptake RR 5 1.05 1.00 1.12 0.05 0.46 -0.76 0.200 ns 0.113 ns NUE RR 5 1.04 0.99 1.12 0.06 0.34 -0.98 0.200 ns 0.142 ns N surplus DIFF 5 -6.2 -17.0 0.3 7.1 -0.75 0.06 0.200 ns 0.122 ns
Fig. 3.11-1. Frequency distribution of yield RR in burning of crop residues.

CATCH-C No. 289782 Deliverable number: D3.324 09 April 2014
Page 48 of 59
a) b)
Fig. 3.11-2. Frequency distribution of N uptake RR (a) and N surplus (b) DIFF in minimum tillage.
Tab. 3.11-2. Number of yield data in each combination of factors.
climate soil texture class
N W E S Total cl. si. lo. sa. unkn. Total
du
rati
on
< 5 yrs 5-10 2 2
4
2 2
4
11-20
5
5
5
5
>20 Total 2 7
9
2 7
9
soil
txt
cla
ss clay
silt loam 2
2
sand
7
7
unknown Total 2 7
9
climate class soil texture class duration (yrs)
N W E S Tot.. cl. si. lo. sa. unkn. Tot. <5 5-10 11-20
>20 Tot.
cro
p
barley 2 2
4
2 2
4
2 2
4
wheat 2
2
2
2
2
2
minor s.g.cer. 2
2
2
2
1 1
2
grain legume maize grain
maize/sorgh.
rapeseed 1 1 1 1 1 1
potato/beet
sunflower
leg./grass ley vegetables various
Total 2 7
9
2 7
9
4 5
9

CATCH-C No. 289782 Deliverable number: D3.324 09 April 2014
Page 49 of 59
3.11.3 Influencing factors
Owing to the low number of cases, and also because the variability of factors was very limited, none of the tested factors resulted to affect the performance of this practice (Tab. 3.11-3).
According to the N indicators (Tab. 3.11-4 and 3.11-5), barley and wheat performed better than oat when straw was burnt.
Tab. 3.11-3. Results of the linear multiple regression of yield RR in burning of crop residues.
climate soil texture class duration of practice n mean n mean n mean northern 2 1.04 ns clay - low - western 7 1.02 ns loam 2 1.03 ns medium 4 1.04 ns eastern - sand 7 1.03 ns high 5 1.03 ns southern - silt - very high -
crop n mean barley 4 1.02 ns wheat 2 1.04 ns minor small grain cereals 2 1.02 ns grain legume - maize grain - maize/sorghum (total) - rapeseed 1 1.05 ns potato/beet - sunflower - legume/grass ley - vegetables - various (average) -
Tab. 3.11-4. Results of the linear multiple regression of N uptake RR in burning of crop residues.
climate soil texture class duration of practice n mean n mean n mean northern - clay - low - western 2 1.03 loam - medium 3 1.08 a eastern - sand 5 1.03 high 2 0.99 b southern - silt - very high -
crop n mean barley 2 1.06 a wheat 2 1.03 a minor small grain cereals 1 1.01 b grain legume - maize grain - maize/sorghum (total) - rapeseed - potato/beet - sunflower - legume/grass ley - vegetables - various (average) -

CATCH-C No. 289782 Deliverable number: D3.324 09 April 2014
Page 50 of 59
Tab. 3.11-5. Results of the linear multiple regression of N surplus DIFF in burning of crop residues.
climate soil texture class duration of practice n mean n mean n mean northern - clay - low - western 2 -4.3 loam - medium 3 -10.7 b eastern - sand 5 -4.3 high 2 2.2 a southern - silt - very high -
crop n mean barley 2 -8.3 b wheat 2 -3.8 a minor small grain cereals 1 -0.6 a grain legume - maize grain - maize/sorghum (total) - rapeseed - potato/beet - sunflower - legume/grass ley - vegetables - various (average) -
3.12 Irrigation
Following a long literature search, no evidence was found of long-term experiments or medium-term experiments (less than 5 years), regarding the comparison between irrigation systems, and in particular sprinkler or drip irrigation, compared with surface distribution methods.
Some papers were found on the comparison of different management techniques which also included irrigation. For example, Cahoon et al. (1999) shows the comparison between conventional and conservative techniques, the first characterized by the adoption of deep tillage and surface irrigation, while the second involved no tillage and sprinkler irrigation. The study shows that the conservative techniques are advantageous than the conventional ones.
Some studies compare irrigation with a control without irrigation (e.g. Flink et al., 1995).
Most of trials were conducted outside Europe (e.g. in Asia). They were not analyzed here because they were beyond the boundaries set by the project.

CATCH-C No. 289782 Deliverable number: 09 April 2014
Page 51 of 59
4 Conclusions
All tested practices had some impact on crop yield, but in all cases both positive and negative effects were observed (Fig. 4-1, Tab. 4-1). This was somehow expected, otherwise a practice would not be studied or compared to others, if it was positive (or negative) under all conditions.
Yield is the main indicator for productivity, as it is a source of income. N uptake, NUE and N surplus are less important in this respect. Among these, N uptake can in some cases have a monetary value, when the protein content of a crop determines its price. A monetary value could be assigned to NUE and N surplus through a public incentive to farmers who increase fertilizer N efficiency and reduce N excess.
If the four productivity indicators are considered in an overall evaluation (Tab. 4-2), the best practices among those tested, as far as productivity is concerned, are:
- crop rotation - catch crop (harvested) - burning crop residues
However, a practice must be evaluated also according to other aspects, such as soil chemical, physical and biological quality, and capacity to mitigate climate change. The judgment on practices that scarcely influence yield could severely be modified when these other aspects are taken into account.
Tab. 4-1. Summary of main effects of practices on productivity indicators (+ p<0.05).
Management
practices Yie
ld
(RR
)
N u
pta
ke
(RR
)
NU
E
(RR
)
N s
urp
lus
(DIF
F)
Rotation
Monoculture (baseline) 1.00 1.00 1.00 0.0
Crop rotation 1.05+ 1.03 1.38 -43.9
Intercropping n.d. n.d. n.d. n.d. Without Green manure/catch
crop/cover crop (baseline) 1.00 1.00 1.00 0.0
Harvested catch crop/cover crop 1.05+ 1.19 1.19 -3.9
Incorporated green manure 1.00 0.99 0.99 1.5
Grassland Grassland management (indicate
baseline) n.d. n.d. n.d. n.d.
Tillage
Conventional tillage (baseline) 1.00 1.00 1.00 0.0
No tillage 0.96 0.95 1.06 -4.2
Minimum non-inversion tillage 0.97+ 0.91+ 0.91+ 12.6+
Nutrient
management: mineral fertiliser and
organic fertiliser
Mineral fertiliser (mineral N –
baseline) 1.00 1.00 1.00 0.0
Organic fertiliser- FYM 0.94+ 1.00 0.92 23.9
Organic fertiliser-slurry 0.98 0.92+ 0.92 28.2
Organic fertiliser-compost 0.95 1.04 1.04 18.7
Residue management
Residue removal (baseline) 1.00 1.00 1.00 0.0
Residue incorporation 0.93+ 0.95 1.36 -16.6
Residue burning 1.03+ 1.05 1.04 -6.2

CATCH-C No. 289782 Deliverable number: 09 April 2014
Page 52 of 59
Crop protection n.d. n.d. n.d. n.d.
Water management
irrigation-drainage n.d. n.d. n.d. n.d.
Fig. 4-1. Boxplot graphs of yield RR, N uptake RR, NUE RR and N surplus DIFF obtained adopting the different improved management practices. ROT = rotation, CC = harvested cover crop, GM = green manure, NT = no-tillage, MT = minimum tillage, CPT = compost, FYM = farmyard manure, S = cattle slurry, IR = incorporation of residues, BR = burning of crop residues.

CATCH-C No. 289782 Deliverable number: 09 April 2014
Page 53 of 59

CATCH-C No. 289782 Deliverable number: 09 April 2014
Page 54 of 59
Tab. 4-2: Overall qualitative assessment of MPs.
Management
practices Yie
ld
(RR
)
N u
pta
ke
(RR
)
NU
E
(RR
)
N s
urp
lus
(DIF
F)
OV
ER
AL
L
PR
OD
UC
TIV
ITY
Rotation
Monoculture
Crop rotation + 0 + + ++
Intercropping - + + + 0 Without Green manure/catch crop/cover crop
Harvested catch crop/cover crop + + + 0 +
Incorporated green manure 0 0 0 0 0
Grassland Grassland management n.d. n.d. n.d. n.d.
Tillage
Conventional tillage
No tillage 0 - 0 0 0
Minimum non-inversion tillage - -- -- - --
Nutrient management:
mineral fertiliser and
organic fertiliser
Mineral fertiliser (mineral N) Organic fertiliser- FYM
- 0 - - -
Organic fertiliser-slurry 0 - - - -
Organic fertiliser-compost - 0 0 0 0
Residue management
Residue removal
Residue incorporation - - 0 + 0
Residue burning + + 0 0 +
Crop protection n.d. n.d. n.d. n.d.
Water management
irrigation-drainage 0 0 0 0 0

CATCH-C No. 289782 Deliverable number: 09 April 2014
Page 55 of 59
References
Alluvione, F., A.D. Halvorson, and S.J. Del Grosso. 2009. Nitrogen, tillage, and crop rotation effects on carbon dioxide and methane fluxes from irrigated cropping systems. J. Environ. Qual. 38:2023–2033.
Alluvione, F., Bertora, C., Zavattaro, L., Grignani, C., 2010. Nitrous Oxide and Carbon Dioxide Emissions Following Green Manure and Compost Fertilization in Corn. Soil Science Society of America Journal 74, 384.
Alluvione, F., Fiorentino, N., Bertora, C., Zavattaro, L., Fagnano, M., Chiarandà, F.Q., Grignani, C., 2013. Short-term crop and soil response to C-friendly strategies in two contrasting environments. Eur. J. Agron.45, 114–123.
Amosse, C., Jeuffroy, M.-H., David, C., 2013. Relay intercropping of legume cover crops in organic winter wheat: Effects on performance and resource availability. Field Crops Research 145, 78–87.
Baker, J.M., Ochsner, T.E., Venterea, R.T., Griffis, T.J., 2007. Tillage and soil carbon sequestration—What do we really know? Agric. Ecosyst. Environ 118, 1–5.
Baldoni, G., Mantovi, P., Cortellini, L., Re, L.D., Toderi, G., 2002. 12 anni di prove con rotazione frumento-bietola-mais: fertilizzare le erbacee con fanghi di depurazione. Informatore Agrario 58, 31–37.
Ball, B.C., Robertson, E.A.G., 1990. Straw incorporation and tillage methods: Straw decomposition, denitrification and growth and yield of winter barley. Journal of Agricultural Engineering Research 46, 223–243.
Benincasa, P., Tosti, G., Tei, F., Guiducci, M., 2010. Actual N Availability from Winter Catch Crops Used for Green Manuring in Maize Cultivation. Journal of Sustainable Agriculture 34, 705–723.
Berner, A., Hildermann, I., Fließbach, A., Pfiffner, L., Niggli, U., Mäder, P., 2008. Crop yield and soil fertility response to reduced tillage under organic management. Soil Tillage Res. 101, 89–96.
Blevins, R.L., Thomas G.W., Smith M.S., Frye W.W., Cornelius P.L.. 1983. Changes in soil properties after 10 years continuous non-tilled and conventionally tilled corn. Soil Tillage Res. 3:135–146.
Bøckman, O.C. 1997. Fertilizers and biological nitrogen fixation as sources of plant nutrients: Perspectives for future agriculture. Plant Soil 194:11–14.
Børresen, T., 1999. The effect of straw management and reduced tillage on soil properties and crop yields of spring-sown cereals on two loam soils in Norway. Soil Tillage Res. 51, 91–102.
Bullock, D.G., 1992. Crop rotation. Critical Reviews in Plant Science 11(4): 309-326.
Cahoon, J.E., Eisenhauer, D.E., Elmore, R.W., Roeth, F.W., Doupnik, B., Selley, R.A., Ferguson, R.B., Lorenz, M., Frank, K., Young, L.J., 1999. Corn Yield Response to Tillage with Furrow Irrigation. jpa 12, 269.
Catt, J.A., Howse, K.R., Christian, D.G., Lane, P.W., Harris, G.L., Goss, M.J., 1998. Strategies to decrease nitrate leaching in the Brimstone Farm Experiment, Oxfordshire, UK, 1988–1993: the effects of winter cover crops and unfertilised grass leys. Plant and Soil 203, 57–69.
CATCH-C No. 289782 Deliverable number: 09 April 2014
Page 56 of 59
Cherr, C.M., J.M.S. Scholberg, and R. McSorley. 2006. Green manure approaches to crop production: A synthesis. Agron. J. 98:302–319.
Crews, T.E., and M.B. Peoples. 2004. Legume versus fertilizer sources of nitrogen: Ecological tradeoff s and human needs. Agric. Ecosyst. Environ. 102:279–297.
Crookston, R.K., J.E. Kurle, P.J. Copeland, J.H. Ford & W.E. Lueschen, 1991. Rotational cropping sequence affects yield ofcom and soybean. Agronomy Journal 83: 108-113.
Deike, S., Pallutt, B., Melander, B., Strassemeyer, J., Christen, O., 2008. Long-term productivity and environmental effects of arable farming as affected by crop rotation, soil tillage intensity and strategy of pesticide use: A case-study of two long-term field experiments in Germany and Denmark. Eur. J. Agron. 29, 191–199.
Diacono, M., Montemurro, F., 2010. Long term effects of organic amendmnets on soil fertility. A review. Agronomy for Sustainable Development 30, 401–422.
Doran, J.W., Bezdicek D.F., Coleman D.C., Stewart B.A. (ed.). 1994. Defining soil quality for a sustainable environment. SSSA. Spec. Publ. 35. SSSA, Madison, WI.
Drury, C.F., Tan, C., Welacky, T.W., Olaya, T.O., Hamill, A.S., Weaver, S.E., 1999. Red clover and tillage influence on soil temperature, water content, and corn emergence. Agron. J. 91, 101–108.
Ellmer, F., Peschke, H., Köhn, W., Chmielewski, F.-M., Baumecker, M., 2000. Tillage and fertilizing effects on sandy soils. Review and selected results of long-term experiments at Humboldt-University Berlin. Journal of Plant Nutrition and Soil Science 163, 267–272.
Erhart, E., F. Feichtinger, and W. Hartl. 2007. Nitrogen leaching losses under crops fertilized with biowaste compost compared with mineral fertilization. J. Plant Nutr. Soil Sci. 170:608–614.
Eriksen, G.N., F.J. Coale, and G.A. Bollero. 1999. Soil nitrogen dynamics and maize production in municipal solid waste amended soil. Agron. J. 91:1009–1016.
Flink, M., Pettersson, R., Andrén, O., 1995. Growth dynamics of winter wheat in the field with daily fertilization and irrigation. Journal of Agronomy and Crop Science 174, 239–252.
Francis, G.S., Knight, T.L., 1993. Long-term effects of conventional and no-tillage on selected soil properties and crop yields in Canterbury, New Zealand. Soil Till. Res. 26, 193–210.
Gabriel, J.L., Quemada, M., 2011. Replacing bare fallow with cover crops in a maize cropping system: Yield, N uptake and fertiliser fate. Eur. J. Agron. 34, 133–143.
Ghuman, B.S., Sur, H.S., 2001. Tillage and residue management effects on soil properties and yields on rainfed maize and wheat in a subhumid subtropical climate. Soil Till. Res. 58, 1–10.
Giambalvo, D., Ruisi, P., Saia, S., Miceli, G., Frenda, A.S., Amato, G., 2012. Faba bean grain yield, N2 fixation, and weed infestation in a long-term tillage experiment under rainfed Mediterranean conditions. Plant and Soil 360, 215–227.
Graham, J.P., Ellis, F.B., Christian, D.G., Cannel, R.Q., 1986. Effects of straw residues on the establishment, growth and yield of autumn-sown cereals. J. Agric. Eng. Res. 24, 39-49
Grenz J.H., Manschadi A.M., DeVoil P., Meinke H., Sauerborn J., (2005). Assessing strategies for Orobanche sp. control using a combined seedbank and competition model. Agron J. 97:1551 –1559.

CATCH-C No. 289782 Deliverable number: 09 April 2014
Page 57 of 59
Grignani, C., Zavattaro, L., 2000. A survey on actual agricultural practices and their effects on the mineral nitrogen concentration of the soil solution. Eur. J. Agron.12, 251–268.
Grignani, C., Zavattaro, L., Sacco, D., Monaco, S., 2007. Production, nitrogen and carbon balance of maize-based forage systems. Eur. J. Agron.26, 442–453.
Gselman, A., Kramberger, B., 2008. Benefits of winter legume cover crops require early seeding. Australian Journal of Agricultural Research 59, 1156–1163.
Holland, J.M., 2004. The environmental consequences of adopting conservation tillage in Europe: reviewing the evidence. Agriculture, Ecosystems & Environment 103, 1–25.
Ikumo, H. 2005. Estimation of potential supply of livestock waste compost to replace chemical fertilizer use in Japan based on 2000 census of agriculture. Jpn. Agric. Res. Q. 39:83–89.
Johnston, A.E., 1994. The Rothamsted classical experiments. In: Leigh, R.A., Johnston, A.E. Eds., Long-Term Experiments in Agricultural and Ecological Sciences. Proceedings of a Conference to Celebrate the 150th Anniversary of Rothamsted Experimental Station, 14–17 July 1993. CAB International, Wallingford, UK, pp. 9–37.
Kaspar, T.C., Erbach D.C., Cruse R.M.. 1990. Corn response to seed-row residue removal. Soil Sci. Soc. Am. J. 54:1112–1117.
Kismányoky, T., Tóth, Z., 2013. Effect of mineral and organic fertilization on soil organic carbon content as well as on grain production of cereals in the IOSDV (ILTE) long-term field experiment, Keszthely, Hungary. Archives of Agronomy and Soil Science 59, 1121–1131.
Kramberger, B., Gselman, A., Janzekovic, M., Kaligaric, M., Bracko, B., 2009. Effects of cover crops on soil mineral nitrogen and on the yield and nitrogen content of maize. Eur. J. Agron.31, 103–109.
Kuo, S., Sainju, U.M., 1998. Nitrogen mineralization and availability of mixed leguminous and non-leguminous cover crop residues in soil. Biology and Fertility of Soils 26, 346–353.
Lal, R., 2009. Challenges and opportunities in soil organic matter research. European Journal of Soil Science 60, 158–169.
Lal, R., Kimble, J.M., 1997. Conservation tillage for carbon sequestration. Nutrient Cycling in Agroecosystems 49, 243–253.
Lemaire, G., Recous, S., Mary, B., 2004. Managing residues and nitrogen in intensive cropping systems. New understanding for efficient recovery by crops. In: Proceedings of the 4th International Crop Science Congress, 26 Sept–1 Oct 2004, Brisbane, Australia, www.cropscience.org.au/icsc2004/.
Løes, A.-K., Henriksen, T.M., Eltun, R., Sjursen, H., 2011. Repeated use of green-manure catch crops in organic cereal production - grain yields and nitrogen supply. Acta Agriculturae Scandinavica Section B-Soil and Plant Science 61, 164–175.
Luo, Z., Wang, E., Sun, O.J., 2010. Can no-tillage stimulate carbon sequestration in agricultural soils? A meta-analysis of paired experiments. Agriculture, Ecosystems and Environment 139, 224–231.
Lynch, D.H., R.P. Voroney, and P.R. Warman. 2006. Use of 13C and 15N natural abundance techniques to characterize carbon and nitrogen dynamics in composting and in compost-amended soils. Soil Biol. Biochem. 38:103–114
Martino, D.L., Shaykewich, C.F., 1994. Root penetration profiles of wheat and barley as affected by soil penetration resistance in field conditions. Can. J. Soil Sci. 74, 193–200.

CATCH-C No. 289782 Deliverable number: 09 April 2014
Page 58 of 59
Mazzoncini, M., Di Bene, C., Coli, A., Antichi, D., Petri, M., Bonari, E., 2008. Rainfed Wheat and Soybean Productivity in a Long-Term Tillage Experiment in Central Italy. Agronomy Journal 100, 1418 – 1429.
Metzger, M.J., Bunce, R.G.H., Jongman, R.H.G., Mucher, C.A., Watkins, J.W., 2005. A climatic stratification of the environment of Europe. Global Ecol. Biogeogr. 14, 549–563.
Mitchell, C.C., R.L. Westerman, J.R. Brown & T.R. Peck, 1991. Overview of long-term agronomic research. Agronomy Journal 83: 24-29.
Mitsch, W.J., Day, J.W., Gilliam, J.W., Groffman, P.M., Hey, D.L., Randall, G.W., Wang, N., 1999. Reducing nitrogen loads, especially nitrate-nitrogen, to surface water, groundwater, and the Gulf of Mexico: topic 5 report for the integrated assessment on hypoxia in the Gulf of Mexico. NOAA Coastal Ocean Program Decision Analysis Series No. 19, NOAA Coastal Oceans Program, Silver Spring, MD, p. 111.
N’Dayegamiye, A., and T.S. Tran. 2001. Effects of green manures on soil organic matter and wheat yields and N nutrition. Can. J. Soil Sci. 81:371–382.
Nevens, F., Reheul, D., 2003. Permanent grassland and 3-year leys alternating with 3 years of arable land: 31 years of comparison. Eur. J. Agron.19, 77–90.
Nevens, F., Reheul, D., 2003. The application of vegetable, fruit and garden waste (VFG) compost in addition to cattle slurry in a silage maize monoculture: nitrogen availability and use. European Journal of Agronomy 19, 189–203.
Olesen, J.E., Askegaard, M., Rasmussen, I.A., 2009. Winter cereal yields as affected by animal manure and green manure in organic arable farming. Eur. J. Agron.30, 119–128.
Ozpinar, S., 2009. Tillage and cover crop effects on maize yield and soil nitrogen. Bulgarian Journal of Agricultural Science 15, 533–543.
Peterson, T.A. & G.E. Varvel, 1989. Crop yield as affected by rotation and nitrogen rate. III Corn. Agronomy Journal, 81: 735-738.
Piccolo, A., R. Spaccini, R. Nieder, and J. Richter. 2004. Sequestration of biologically labile organic carbon in soils by humifi ed organic matter. Clim. Change 67:329–343.
Power, J.F., Follett, R.F. 1987. Monoculture. Scientific American 256 (3): 57-64.
Procházková B., Hrubý J., Dovrtìl J., Dostál O. (2003) Effects of different organic amendment on winter wheat yields under long-term continuous cropping. Plant Soil Environ. 49, 433–438.
Rhoton, F.E., Bruce, R.R., Buehring, N.W.B., Elkins, G., Langdale, C.W., Tyler, D.D., 1993. Chemical and physical characteristics of four soil types under conventional and no-tillage systems. Soil Till. Res. 28, 51–61.
Sainju, U.M., Whitehead, W.F., Singh, B.P., 2003. Agricultural Management Practices to Sustain Crop Yields and Improve Soil and Environmental Qualities. The Scientific World Journal 3, 768–789.
Schröder, J.J., Neeteson, J.J., 2008. Nutrient management regulations in The Netherlands. Geoderma 144 (3–4), 418–425.
Smith, S.J., Schepers, J.S., Porter, L.K., 1990. Assessing and managing agricultural nitrogen losses to the environment. Adv. Soil Sci. 14, 1–43.
Soane, B.., Ball, B.., 1998. Review of management and conduct of long-term tillage studies with special reference to a 25-yr experiment on barley in Scotland. Soil and Tillage Research 45, 17–37.

CATCH-C No. 289782 Deliverable number: 09 April 2014
Page 59 of 59
Spaccini, R., A. Piccolo, P. Conte, G. Haberhauer, and M.H. Gerzabek. 2002. Increased soil organic carbon sequestration through hydrophobic protection by humic substances. Soil Biol. Biochem. 34:1839–1851.
Spiegel, H., Dersch, G., Baumgarten, A., Hösch, J., 2010. The International Organic Nitrogen Long-term Fertilisation Experiment (IOSDV) at Vienna after 21 years. Archives of Agronomy and Soil Science 56, 405–420.
Swan, J.B., Higgs R.L., Bailey T.B., Wollenhaupt N.C., Paulson W.H., Peterson A.E.. 1994. Surface residue and in-row treatment on long-term no-tillage continuous corn. Agron. J. 86:711–718.
Tajnsek, A., Cergan, Z., Ceh, B., 2013. Results of the long-term field experiment IOSDV Jable at the beginning of the 21st century. Arch. Agron. Soil Sci. 59, 1099–1108.
Tejada, M., and J.L. Gonzalez. 2003. Effects of the application of a compost originating from crushed cotton gin residues on wheat yield under dryland conditions. Eur. J. Agron. 19:357–368.
Tejada, M., J.L. Gonzalez, A.M. Garcia-Martinez, and J. Parrado. 2008. Effects of different green manures on soil biological properties and maize yield.
Thorup-Kristensen, K., Magid, J., Jensen, L.S., 2003. Catch crops and green manures as biological tools in nitrogen management in temperate zones. Advances in Agronomy 79, 227–302.
Tomasoni, C., Borrelli, L., Ceotto, E., 2011. Effect of integrated forage rotation and manure management on yield, nutrient balance and soil organic matter. Italian Journal of Agronomy 6, 55–60.
Tonitto, C., David, M.B., Drinkwater, L.E., 2006. Replacing bare fallows with cover crops in fertilizer-intensive cropping systems: a meta-analysis of rop yield and N dynamics. Agric. Ecosyst. Environ. 112, 58–72.
Torstensson, G., Aronsson, H., Bergström, L., 2006. Nutrient use efficiencies and leaching of organic and conventional cropping systems in Sweden. Agronomy Journal , 98 , 603 615.
Torstensson, G., Aronsson, H., 2000. Nitrogen leaching and crop availability in manured catch crop systems in Sweden. Nutrient Cycling in Agroecosystems, 56,139-152.
Tosti, G., Benincasa, P., Farneselli, M., Pace, R., Tei, F., Guiducci, M., Thorup-Kristensen, K., 2012. Green manuring effect of pure and mixed barley – hairy vetch winter cover crops on maize and processing tomato N nutrition. Eur. J. Agron.136–146.
Tosti, G., Guiducci, M., 2010. Durum wheat–faba bean temporary intercropping: Effects on nitrogen supply and wheat quality. Eur. J. Agron.157–165.
Unger, P.W., 1994. Impacts of tillage practices on water-use efficiency. White Paper—Farming for a Better Environment. Soil and Water Conservation Society, Ankeny, Iowa.
Vaughan, J.D., Hoyt, G.D., Wollum II, A.G., 2000. Cover crop nitrogen availability to conventional and no-till corn: soil mineral nitrogen, corn nitrogen status, and corn yield. Communications in Soil Science and Plant Analysis 31, 1017–1041.
West, T.O., Post, W.M., 2002. Soil organic carbon sequestration rates by tillage and crop rotation: a global data analysis. Soil Sci. Soc. Am. J. 66, 1930–1946.
Wilhelm, W.W., Johnson, J.M.F., Hatfield, J.L., Voorhees, W.B., Linden, D.R., 2004. Crop and soil productivity response to corn residue removal. Agronomy Journal 96, 1–17.