Incorporating Environmental Impacts in the Measurement of Agricultural Productivity Growth
25
Journal of Agricultural and Resource Economics 29(3):436-460 Copyright 2004 Western Agricultural Economics Association Incorporating Environmental Impacts in the Measurement of Agricultural Productivity Growth V. E. Ball, C. A. K. Lovell, H. Luu, and R. Nehring Agricultural production is known to have environmental impacts, both adverse and beneficial, and it is desirable to incorporate at least some of these impacts in an environmentally sensitive productivity index. In this paper, we construct indicators of water contamination from the use of agricultural chemicals. These environmental indicators are merged with data on marketed outputs and purchased inputs to form a state-by-year panel of relative levels of outputs and inputs, including environ- mental impacts. We do not have prices for these undesirable by-products, since they are not marketed. Consequently, we calculate a series of Malmquist productivity indexes, which do not require price information. Our benchmark scenario is a con- ventional Malmquist productivity index based on marketed outputs and purchased inputs only. Our comparison scenarios consist of environmentally sensitive Malmquist productivity indexes that include indicators of risk to human health and to aquatic life from chronic exposure to pesticides. In addition, we derive a set of virtual prices of the undesirable by-products that can be used to calculate an environmentally sensitive Fisher index of productivity change. Key words: environmental impacts, productivity growth Introduction Conventional measures of productivity change are based on marketed outputs and purchased inputs. However, in many sectors of the economy,firms use purchased inputs to produce both marketed outputs and non-marketed by-products such as environmental impacts. The existence of non-marketed by-products raises three issues for productivity measurement. The first concerns whether it is analytically feasible to incorporate non- marketed environmental impacts in an environmentally sensitive productivity index. The second concerns the nature of their impact on measured productivity change, and is directly related to what has become known as the Porter hypothesis, which asserts that regulation aimed at reducing environmental impacts can lead to the discovery and adoption of new technologies that actually enhance performance. The third concerns the magnitude of the cost of abatement, which must be compared with the benefits of abatement in the design of environmental policy. V. E. Ball is an economist with the Economic Research Service, U.S. Department of Agriculture (USDA), Washington, DC; C. A. K. Lovell is a professor in the Department of Economics, University of Georgia, Athens; H. Luu is an economist with Debt Capital Markets, Merrill Lynch, London; and R. Nehring is an economist with the Economic Research Service, USDA, Washington, DC. Theviews expressed here donot necessarily represent those of the Economic Research Service or the USDA. The authors are grateful to two anonymous referees and R. R. Russell for their helpful comments on previous versions of this paper, which was written while the second and third authors were with the School of Economics, University of New South Wales, Sydney, NSW, Australia. Review coordinated by Paul M. Jakus.
-
Upload
independent -
Category
Documents
-
view
3 -
download
0
Transcript of Incorporating Environmental Impacts in the Measurement of Agricultural Productivity Growth

Journal of Agricultural and Resource Economics 29(3):436-460 Copyright 2004 Western Agricultural Economics Association
Incorporating Environmental Impacts in the Measurement of
Agricultural Productivity Growth
V. E. Ball, C. A. K. Lovell, H. Luu, and R. Nehring
Agricultural production is known to have environmental impacts, both adverse and beneficial, and it is desirable to incorporate at least some of these impacts in an environmentally sensitive productivity index. In this paper, we construct indicators of water contamination from the use of agricultural chemicals. These environmental indicators are merged with data on marketed outputs and purchased inputs to form a state-by-year panel of relative levels of outputs and inputs, including environ- mental impacts. We do not have prices for these undesirable by-products, since they are not marketed. Consequently, we calculate a series of Malmquist productivity indexes, which do not require price information. Our benchmark scenario is a con- ventional Malmquist productivity index based on marketed outputs and purchased inputs only. Our comparison scenarios consist of environmentally sensitive Malmquist productivity indexes that include indicators of risk to human health and to aquatic life from chronic exposure to pesticides. In addition, we derive a set of virtual prices of the undesirable by-products that can be used to calculate an environmentally sensitive Fisher index of productivity change.
Key words: environmental impacts, productivity growth
Introduction
Conventional measures of productivity change are based on marketed outputs and purchased inputs. However, in many sectors of the economy, firms use purchased inputs to produce both marketed outputs and non-marketed by-products such as environmental impacts. The existence of non-marketed by-products raises three issues for productivity measurement. The first concerns whether i t is analytically feasible to incorporate non- marketed environmental impacts in an environmentally sensitive productivity index. The second concerns the nature of their impact on measured productivity change, and is directly related to what has become known as the Porter hypothesis, which asserts that regulation aimed at reducing environmental impacts can lead to the discovery and adoption of new technologies that actually enhance performance. The third concerns the magnitude of the cost of abatement, which must be compared with the benefits of abatement in the design of environmental policy.
V. E. Ball is a n economist with the Economic Research Service, U.S. Department of Agriculture (USDA), Washington, DC; C. A. K. Lovell is a professor in the Department of Economics, University of Georgia, Athens; H. Luu is an economist with Debt Capital Markets, Merrill Lynch, London; and R. Nehring is an economist with the Economic Research Service, USDA, Washington, DC. Theviews expressed here donot necessarily represent those of the Economic Research Service or the USDA.
The authors are grateful to two anonymous referees and R. R. Russell for their helpful comments on previous versions of this paper, which was written while the second and third authors were with the School of Economics, University of New South Wales, Sydney, NSW, Australia.
Review coordinated by Paul M. Jakus.

Ball et al. Incolporating Environmental Impacts 437
The first issue has been resolved in the affirmative; provided only that they are quantifiable, environmental impacts can be incorporated into a Malmquist (1953) productivity index, which requires only quantity information in its construction. There is some debate about how environmental impacts should be incorporated, and we return to this unresolved issue below. However, environmental impacts cannot be incorporated into Fisher or Tiirnqvist productivity indexes without price information with which to weight the impacts. Occasionally we have access to damage estimates or information on effluent fees or market prices of tradable emissions permits that would provide price weights for the environmental impacts. Most environmental impacts are non-marketed, and so not priced, and therefore cannot be readily incorporated into Fisher or Tornqvist productivity indexes.
A Malmquist productivity index can be calculated without and with environmental impacts included. The former index ignores environmental impacts, while the latter index provides an environmentally sensitive measure of productivity change. The ratio of the environmentally sensitive index to the conventional index generates an environ- mental productivity index, which addresses the second issue raised above. Although theory does not enable us to order the two Malmquist productivity indexes, the time path of their ratio depends on the rates of change of environmental impacts relative to the rates of change of marketed outputs and purchased inputs.
A Malmquist productivity index is defined in terms of distance functions, and distance functions have an intimate relationship with shadow, or virtual, prices. It is possible to exploit this relationship to derive virtual prices for the environmental impacts. Such internally generated information on virtual prices serves two purposes. First and foremost, it addresses the third issue raised above by providing evidence on marginal abatement elasticities, expressed in terms ofrequisite adjustments to marketed outputs or purchased inputs. In addition, the virtual prices generated in the process of constructing an environmentally sensitive Malmquist productivity index can serve as virtual price weights in the construction of an environmentally sensitive Fisher or Tornqvist productivity index, which revisits the first and second issues raised above. Strictly speaking, this is unnecessary, since the environmentally sensitive Malmquist productivity index achieves these objectives. Nonetheless, it is of interest to see how closely the environmentally sensitive productivity indexes approximate each other.
In this study, we provide an integrated investigation into all three issues within the context of U.S. agriculture, in which environmental impacts have been extensive despite growing environmental protection efforts. Although U.S. agriculture generates a wide range of externalities, both adverse and beneficial, our investigation is limited to the incorporation of four adverse environmental impacts for which we have data compatible with our output and input data.
The paper is organized as follows. In the first section below, the Fisher and Malmquist productivity indexes are developed. Next, the environmentally sensitive Malmquist productivity index and the environmental productivity index are developed, and expressions are also derived for virtual prices and marginal abatement elasticities for the environmental impacts. A discussion is then provided of the empirical techniques used to construct the conventional and environmentally sensitive Malmquist produc- tivity indexes and the environmental productivity index, and also to derive expressions for virtual prices and marginal abatement elasticities. Next, the data are described, which consist of a state-by-year panel of two marketed output aggregates, three

438 December 2004 Journal of Agricultural and Resource Economics
purchased input aggregates, and four environmental impact indicators in U.S. agricul- ture over the period 1960-1996. This is followed by the presentation of our empirical results. Our principal finding is that environmentally sensitive productivity growth was initially much slower, and eventually much more rapid, than conventionally measured productivity growth. The divergent time paths reflect rapid early growth of environ- mental impacts in a period of regulatory laxity, followed by stabilization or decline in environmental impacts as regulatory controls tightened. The second finding of this analysis is that the virtual prices can be used to construct an environmentally sensitive Fisher productivity index which behaves very much like its Malmquist counterpart. Third, we find that marginal abatement elasticities are larger than abatement cost elasticities reported by others using these data. The final section gives a summary over- view and concluding remarks.
Other recent studies have used similar data to investigate a subset of the three issues we have raised. Ball et al. (2001) used output distance functions to calculate a conven- tional Malmquist productivity index, and directional distance functions to calculate an environmentally sensitive Malmquist productivity index, and then explored the "gap" between the two. Because they used only a subset of our data, based on a shorter panel covering the period 1972-1993, they missed the important pre-regulation period in which environmental impacts accumulated rapidly. Ball et al. (2002a) used output distance functions to calculate a Malmquist output quantity index, and input distance functions to calculate a Malmquist environmental quantity index, and defined the ratio of the two as an environmental performance index. They employed the identical data used here. Both of these earlier studies used mathematical programming techniques to calculate the distance functions, but neither study calculated virtual prices or marginal abatement elasticities of the environmental impacts. Two additional analyses (Ball et al., 2002b; and Paul et al., 2002) used the same data, although they included only two of the four environmental indicators. Both applied econometric techniques to estimate a cost function from which they derived abatement cost elasticities, but they did not estimate either conventional or environmentally sensitive productivity change. Finally, Chaston and Gollop (2002) also used these data, although they included only one of the four environmental indicators, to compare total factor productivity with total resource productivity. Likewise, they employed econometric techniques to estimate a cost function from which they derived abatement cost elasticities, which they then used to distinguish the two productivity indicators.
It is difficult to summarize the five studies cited above, but it is probably fair to draw three conclusions. First, in the first two studies, the inclusion of environmental impacts has a pronounced influence on measured productivity change, with this influence being generally negative in the early part, and positive in the later part, of the study periods. Second, in the other three studies, estimated abatement cost elasticities are statistically significant, ranging from less than 1% to nearly 6%. Third, both produc- tivity effects and abatement cost elasticities vary across regions having different product mixes requiring different applications of the chemicals that cause the environ- mental impacts. Our study is the first to exploit this popular data set to investigate both the influence on measured productivity change of incorporating environmental impacts and the magnitudes and temporal patterns of marginal abatement elasticities of these environmental impacts.

Ball et al. Incorporating Environmental Impacts 439
The Analytical Framework
t Let yt = (y:, ..., yM) 0 and xt = (x:, ..., x;) z 0 denote vectors of marketed outputs and purchased inputs, and let pt = (p:, ...,ph ) > 0 and wt = (w:, ..., w;) > 0 denote vectors of output and input prices, in a sequence of periods t = 1, ..., T.
A Fisher index of productivity change between periods t and t + 1 is given by:
where the Fisher output quantity index,
is the geometric mean of Laspeyres and Paasche output quantity indexes, and the Fisher input quantity index,
is the geometric mean of Laspeyres and Paasche input quantity indexes. We refer to the Fisher productivity index as an "empirical" productivity index because
it is constructed as a function of quantities and prices, and because it does not require knowledge of the structure of the underlying production technology. Use of the Fisher productivity index can be motivated on both axiomatic and economic grounds. It satis- fies many desirable axioms or tests, and it is a superlative index that can be closely related to a "theoretical" productivity index. Before exploring this relationship, the theo- retical productivity index itself is presented.
We begin by representing the structure of a benchmark technology against which productivity change is calculated. Following Fare, Grosskopf, and Lovell (1985), a basic representation is provided by the set of feasible production activities contained in the
graph
(2) G: = {(xt, yt) : xt can produce y t ), t = 1, .. . , T.
Gi is assumed to be closed, and to satisfy strong disposability of outputs and inputs. It is also assumed that Gi is a cone, whereby constant returns to scale is imposed on the benchmark technology. Grifell-TatjB and Lovell (1995) showed that the benchmark tech- nology must have a conical structure if a productivity index defined on the graph is to provide an accurate measure of productivity change. If a conical structure is not imposed, the resulting productivity index omits the contribution of scale economies.
A functional characterization of the benchmark technology is provided by a distance function defined on the graph. A hyperbolic distance function is defined by Fare, Gross- kopf, and Lovell (1985) as:
the domain ofwhich is DLc(xt, yt) E (0 , l ) V (xt, yt) E G:. The graph can be recovered from the distance function by means of:

440 December 2004 Journal ofAgricultura1 and Resource Economics
G{ = {(xt, 9 ) : DkC(d, 9) s 1), t = 1, ..., T.
DkC(d, f ) measures the maximum feasible simultaneous equiproportionate contraction of the input vector d and expansion of the output vector 9. Dkc(xt, f ) thus provides a natural index of the technical efficiency of (xt, 9). We use a hyperbolic distance function rather than a conventional output or input distance function because it treats both outputs and inputs as endogenous, and so is consistent with an economic objective of maiimization of profitability, rather than revenue maximization with exogenous inputs or cost minimization with exogenous outputs. Indeed, Dkc(d, f ) is dual to a "profit- ability" function II(p, w) = max,, {pTy/wTx} .'
A mixed-period hyperbolic distance function,
evaluates the technical efficiency of period t + 1 data (xt'', yt") relative to the period t benchmark technology Gd. If (xt+', yt+') 6 Gd, then Dkc(xt+', yt+') > 1 and (xt+', yt+') is "super-efficient" relative to Gd. The ratio of (4) to (3) provides a natural index of produc- tivity change, the hyperbolic Malmquist productivity index:
M;(xt, yt, xt+l, yt+') measures productivity change by comparing (xt+l, yt+') to (xt, yt), using D&(-) as an aggregator function and Gd as a benchmark. Since Dkc(xt, yt) s 1 but D;~(X~+', f +') > = < 1, it follows that M;(xt, yt, d", f") > = < 1, as productivity growth, stagnation, or decline has occurred between periods t and t + 1.
It is also possible to define a hyperbolic Malmquist productivity index M;'(xt, yt, d", f") relative to the period t + 1 benchmark technology, using D;;(.) as an aggre- gator function and G:' as a benchmark. It is easy to show that M;(xt, yt, xt+', yt+') = M;'(xt, yt, xt+', yt+') - DAc(xt, yt) = D;;(xt+', Yt+'). Since this is unlikely to occur, our preferred hyperbolic Malmquist productivity index is defined as the geometric mean of the two, and so:'
Following Caves, Christensen, and Diewert (1982), we refer to the Malmquist produc- tivity index (6) as a "theoretical" productivity index because it is defined directly on the
' A closely related alternative to a hyperbolic distance function is provided by a directional distance function, a restricted version of which is defined as DLc(xt, y t ) = maxlp: [ ( I - P)xt, ( 1 + P)yfl .Gh.Dh(xt, y t ) ) is dual to a profit function n ( p , w) =
max,,, ( pTy - $ X I . If (1 + P ) = 0 in (3), then ( 1 - P ) provides a fist-order Maclaurin series approximation to 0-', showing that the two nonradial distance functions generate projections to the surface of G; which are very similar. The restricted version of the directional distance function has been used to evaluate environmental performance in the Swedish pulp and paper industry by Chung, Fiire, and Grosskopf (1997), and in U.S. agriculture by Ballet al. (2001,2002a). Boyd and McClelland (1999) used hyperbolic distance functions to calculate output loss arisingfrom environmental constraints on effluent discharge in a sample of U.S. paper plants.
Since G; is conical, it is possible to relate DAc(xt, y t ) to Shephard's (1953, 1970) output distance function DAc(xt, y') - minl0: (xt , yt/O) E Gdl i 1, and input distance function Djc(yt, x t ) = max(O:(xtlO, y t ) E Gh) 2 1, by means of [Dkc(xt, yt)I2 =
DAc(xt, y t ) = [Djc( yt, xt)1-'. Consequently, the hyperbolic Malmquist productivity index can be related to the output-oriented Malmquist productivity index MA(xt, y t , xt+', yt+') = [DAc(xt*', gf*')lD~c(x', y t ) l , and input-oriented Malmquist productivity index Mj(xt, y: xl+', yt") = [D:c(yt+', X ' + ' ) ~ D ~ ~ ( ~ ~ , xt)] by means of MA(xt, yt, xt+', yl") = MA(xt, yt, xt+', yt+') = [Mj(xt, yt, xt", y"')lrl.

Ball et al. Incorporating Environmental Impacts 44 1
structure of the unknown benchmark technologies. The Fisher productivity index (1) replaces information on the structure of the unknown benchmark technologies with known information on the prices of marketed outputs and purchased inputs, and it is useful to know how closely the "empirical" Fisher productivity index approximates the "theoretical" Malmquist productivity index. As proved by Diewert (1992, theorem 9), if producers competitively maximize profit in each period, if technology satisfies constant returns to scale in each period, and if distance functions have a certain flexible func- tional form in each period, then:3
This result is stronger than the Caves, Christensen, and Diewert (1982) result, which equated the Tornqvist productivity index only to the geometric mean version of the Malmquist productivity index under the same behavioral and returns-to-scale assump- tions.
We have already noted that the third (and therefore the second) equality breaks down if producers are not equally technically efficient in each period. The first equality breaks down if the requisite behavioral and technological assumptions are violated. As an addi- tional practical matter, if the distance functions underlying the Malmquist productivity index are calculated empirically, they provide only an approximation to the structure of the unknown benchmark technology. Thus, a Malmquist productivity index constructed from quantity data is also an "empirical" productivity index. Consequently, although it is reasonable to expect a close correspondence between empirically calculated Fisher and Malmquist productivity indexes, it is equally unreasonable to view either as the "true" index.
Incorporating Environmental Impacts
t Let zt = (z:, ..., zK) 2 0 denote a quantity vector of environmental impacts in a sequence of periods t = 1, ..., T. In most circumstances, we do not observe a corresponding price vector qt = (q:, ..., qk). Our objective is to incorporate this quantity information into an environmentally sensitive productivity index, recognizing that not all environmental impacts are included in zt.
The Fisher productivity index is considered first. If the regulator is not watching, the environmental impacts are strongly disposable, and pollution is privately free. In this case, zt can be incorporated into an environmentally sensitive Fisher productivity index, but it has no impact because the corresponding price weights qt = 0. Suppose, despite strong disposability, society attaches value to a clean environment. The practical diffi- culty is that the environmental impacts zt are typically non-marketed, and consequently, although society's virtual price weights q: > 0, their values are unknown. In this case, without knowledge of the virtual price weights q:, the environmental impacts zt cannot be incorporated into an environmentally sensitive Fisher productivity index.
Diewert (1992) used an output distance function, although his proof goes through with a hyperbolic distance function. He also assumed technical efficiency in each period, although his proof goes through with equal technical inefficiency in each period.

442 December 2004 Journal of Agricultural and Resource Economics
We therefore turn to the Malmquist productivity index for help. The dimensionality of the graph is extended to include the environmental impacts, and we write
(8) GE; = {(xt, yt, zt): (xt, yt, zt) is feasible), t = 1, ..., T,
where the change in notation from (2) signals initial agnosticism toward the treatment of the environmental impact vector zt as an input vector or an output vector. As before, GE; is assumed to be closed, convex, and conical. Since GE; is conical, (xt, yt, z t )c G E ~ - (Axt, Ayt, Azt) E G E ~ , A > 0, regardless ofwhether the environmental impact vector zt is treated as an output vector or as an input vector. And since GE; is convex, so are the input sets {(xt, zt): (xt, zt, yt) E G E ~ ) and output sets { yt: (xt, zt, yt) E G E ~ ), and so are the alternative input sets {xt: (yt, zt, xt) E G E ~ ) and output sets {(yt, zt): (xt, yt, zt) E
G E ~ ) . Thus, input sets and output sets are convex regardless of whether zt is treated as an input vector (in the first pair of sets) or as an output vector (in the second pair of sets).
We now consider disposability of zt, and it is observed that (xt, yt, zt) E G E ~ does not imply (xt, yt, z I t ) E G E ~ V ztt s zt. Although some reduction in zt may be feasible, complete elimination is unlikely to be feasible within the constraints imposed by the conical bench- mark technology, much less by the currently available production technology. Thus, we extend the strong disposability assumption on the graph defined in (2) to the extended graphdefhedin(8)bywayof (xt, yt, zt)cGEh-(xtt, ytt, z ' ~ ) E G E ~ V X ' ~ 2 xt, yt t s yt, z t t 2 zt. The environmental impact vector zt is therefore treated as an input vector, an approach not inconsistent with the claim that the environment provides a receptacle into which producers can freely deposit adverse environmental by-products.4
Under this convention, the environmentally sensitive hyperbolic distance function becomes:
(9) DEAc(xt, yt, zt) = min (0: (Oxt, Ozt, y t /O) E G E ~ ) , t = 1, . . . , T,
thedomainofwhichis DE;~(X~, yt, zt) E (0,I.l V(xt, yt, zt) E G E ~ . DEflc(xt, yt, zt) measures the maximum feasible simultaneous equiproportionate contraction of both the purchased input vector xt and the environmental impact vector zt and expansion of the marketed output vector $. Dlflc(xt, yt, zt) thus provides an environmentally sensitive index of the technical efficiency of (d, $, zt), since performance is measured in terms of the ability to contract environmental impacts along with purchased inputs, and to expand marketed outputs.
The corresponding environmentally sensitive hyperbolic Malmquist productivity index becomes:
B a l l e t al. (2002b, p. 293) and Paul et al. (2002, p. 903) are explicit about the environmental receptacle, the latter stating, "... shadow values may be interpreted as the foregone marginal benefits of being able to use the environment freely, or, conversely, as the marginal amount producers ... would be willing to pay for unrestricted use of the environment." Along different lines, Cropper and Oates (1992) argued that treating environmental impacts as inputs assures a positive relation- ship between output and environmental impacts on the production frontier. Since we assume GEL is convex, this in turn assures that marginal abatement elasticities are nondecreasing in abatement. An alternative approach, developed by Fiire, Grosskopf, and Lovell(1985), and implemented by Coggins and Swinton (1996), Chung, Fiire, and Grosskopf (1997), Ball et al. (2001,2002a), Boyd and McClelland (1999), Hailu and Veeman (2000), and Reig-Martinez, Picazo-Tadeo, and Hernbdez- Sancho (2001), treats environmental impacts as weakly disposable outputs. However, this approach does not assure monotonicity of either relationship when mathematical programming techniques are used to construct GE1, and this is the principal reason we treat environmental impacts as inputs.

Ball et al. Incorporating Environmental Impacts 443
where DEkc(xt+', yt+', zt+') is a mixed-period environmentally sensitive hyperbolic dis- tance function analogous to that defined in (4). MEk(xt, yt, zt, xt+', Y~+', zt+') incorporates environmental impacts into the measurement of productivity change by comparing (xt'', f l , ztil) to (d, $, zt), using DEkc(.) as an aggregator function and GEA as a benchmark. Since DE&(x~, yt, zt) s 1, but D E ~ ~ ( X ~ + ~ , yt+', zt+') > =< 1, it follows that MEk(xt, yt, zt, xt+l, $+', zt+l) > = < 1, as productivity growth, stagnation, or decline, inclusive of environ- mental impacts, has occurred between periods t and t + 1.
As in the previous section, it is possible to define an environmentally sensitive hyper- bolic Malmquist productivity index iIdE;l(xt, yt, zt, xt+', yt +', zt+l) using DE;;(.) as an aggregator function and G E ~ ' as a benchmark. It is easy to show that MEk(xt, yt, zt, xt+l, yt+l, zt+l) =ME;~(x~, yt, z ~ , ~ ~ + l , yt+l, z ~ + ~ ) - DE&(x~, yt, zt) = DE;;(X~+~, yt+l, zt+l). Since this is an unlikely occurrence, our preferred environmentally sensitive hyperbolic Malmquist productivity index is defined as the geometric mean of the two, and so:
Environmental productivity is an elusive concept that can be defined in a number of ways. We define a Malmquist environmental productivity index as the ratio of the envi- ronmentally sensitive and conventional hyperbolic Malmquist productivity indexes (11) and (6) to generate:
which provides a framework for incorporating varying rates of growth of (xt, $, zt). EH(xt, yt, zt, xt+', yt+', zt+') > =< 1, as environmentally sensitive productivity growth exceeds, equals, or falls short of conventional productivity g r ~ w t h . ~
We now consider how to retrieve virtual prices for the environmental impacts. The environmentally sensitive Malmquist productivity index is defined in terms of hyper- bolic distance functions defined on the conical benchmark technology GEA, but virtual prices characterize the structure of the actual technology GEt. The graph of the actual technology GEt is defined as in (8), but it is not required to be conical because the actual technology may exhibit non-constant returns to scale. Allowing for the possibility of scale economies on the actual technology is important because virtual prices, and virtual price ratios, reflect curvature properties, including scale economies, of the actual technology.
Environmentally sensitive hyperbolic distance functions,
' There is no obvious way to create an environmental productivity index from (xl, y', 2 ' ) data, with or without price information. Ballet al. (2002b) defme an alternative environmental productivity index as the ratio of a Malmquist marketed output quantity index to a Malmquist environmental impact quantity index. We view ratios such as these, or analogous differences, asnothingmore sophisticated thana convenientway ofcomparingproductivity indexes that do and do not include environmental impacts.

444 December 2004 Journal of Agricultural and Resource Economics
are defined as in (9), but they are defined on the actual technology GEt rather than on the benchmark technology GE:. Since GE r G E ~ , DEkC(xt, yt, zt) < DEk(xt, yt, zt). Because GEt envelops the data more closely than does GE:, hyperbolic distance from any (xt, yt, zt) to the boundary of GEt is no more than to the boundary of GE;.
The environmentally sensitive hyperbolic distance function DEk(xt, yt, zt) projects (xt, yt, zt) along a hyperbolic path to the weakly efficient point (Oxt, Ozt, yt 10) on the boundary of the actual technology GEt. The weakly efficient projection supports a hyper- plane with normal defining virtual prices (zu:,~:, q:). Suppose that DEk(xt, yt, zt) = 1. Then, if DEk(xt, yt, zt) is differentiable, 2, [aDEk(-)layhl dyh + 2, [aDEk(.)lax~l dxi + Xk [aDE~(.)lazLI dzL = 0, and setting dy; = 0 V j + rn, dx; = 0 V j, and dz; = 0 V j + k yields the following:
The first equality states that (the negative of) the ratio of partial derivatives of DEA(xt, yt, zt) defines a slope of the boundary of GEt. The second equality defines a slope as the ratio of virtual prices of the corresponding variable^.^
The first equality in (14) can be transformed to generate partial elasticities of each of the marketed outputs with respect to each of the environmental impacts. Thus,
where these partial elasticities are also evaluated at the weakly efficient hyperbolic projection (Oxt, Ozt, ytlO) on the boundary of GEt. These partial elasticities provide infor- mation on the proportionate reduction in a marketed output that would be required to accommodate a given proportionate abatement of an environmental impact, holding all other variables constant. Consequently, we refer to them as marginal abatement elasti- ~ i t i e s . ~
The second equality in (14) can be used to derive virtual prices of the environmental impacts. If, following Fare et al. (1993), we assume one virtual price equals its corres- ponding market price, the remaining virtual prices can be retrieved. For example, if
t pum =p; for one marketed output, then virtual prices of all environmental impacts can be expressed as:
which is evaluated at the weakly efficient hyperbolic projection (Oxt, Ozt, ytlO) on the boundary of GEt. These virtual prices q: may then be used to weight the environmental impacts zt in an environmentally sensitive virtual Fisher productivity index in which
'The derivation of JyA/Jz~ in (14), of kk in (15), and of q:k in (16) all require that JDI&(. ) /J~~> 0. Also, since dDA(.)lJz: s 0, we are assured that JyklJz: 2 0, cLk 2 0, and q:, 2 0. Fiire et al. (1993) exploited the duality between output distance functions and revenue functions to obtain the second equality in (14). Without imposing constant returns to scale, we have been unable to adapt their duality approach-which treats inputs as exogenous within an output distance function framework-to our problem in which inputs and outputs are endogenous within a hyperbolic distance function framework. Although we have not exploited duality, the results obtained in (14H16) are analogous to theirs, recognizing that we use hyperbolic distance functions in which all variables are endogenous.
Ball et al. (1994) used internally generated marginal abatement elasticities to implement Pittman's (1983) environment- ally sensitive Tornqvist productivity index on aggregate U.S. agricultural data.

Ballet al. Incolporating Environmental Impacts 445
the environmental impacts are treated as inputs.' The virtual prices qik in (16) are con- ditioned on just one of M marketed outputs. Anecessary and sufficient condition for the value of qik to be independent of the output selected is that the producer be allocatively efficient in output markets. We revisit this issue in a later section on the empirical findings.
Marginal abatement elasticities eLk in (15) and virtual prices qik in (16) are derived holding (M + N + K- 2) variables fixed, and technology fixed as well. However, optimiz- ing producers would be expected to adjust more than two variables in their abatement activities, and perhaps to adopt new, more environmentally friendly technologies as well. Consequently, eLk and qik should be interpreted as upper bounds on marginal abatement elasticities and virtual prices, respe~tively.~
An alternative procedure would be to totally differentiate DE;(xt, yt, zt) and set dY/ = 0 V j , dx/ = 0 V j + n, and dz; = 0 V j + k, to derive ax: laz; and the corresponding input use elasticity e i k . Doing this for all inputs and computing the price-weighted sum would generate an abatement cost elasticity. More directly, it is possible to derive abatement cost elasticities from a cost function ct(yt, wt, zt) as aln[ct(yt, wt, zt)llaln(z;), as Ball et al. (2002b), Chaston and Gollop (2002), and Paul et al. (2002) have done. It is important to distinguish our marginal abatement elasticities from these abatement cost elasti- cities. The latter should be smaller in absolute value, since they allow for adjustment of all variables in the abatement process.
The Empirical Technique
In this section, we show how to calculate the conventional and environmentally sensitive Malmquist productivity indexes and the virtual prices and marginal abatement elasticities associated with the latter. Mathematical programming techniques developed by Fare et al. (1993) are used to calculate the requisite hyperbolic distance functions. It is assumed there are I producers indexed i = 1, . . . , O, . . . , I, each observed through T time periods indexed t = 1, . . . , T.
The within-period hyperbolic distance function DEkc(xt, yt, zt) defined on the conical benchmark technology GE: in (8) is calculated for producer """ as the solution to the non- linear program:
(17) DEkC(xot, yot, zot) = min 0 0,1
'Coggins and Swinton (1996) used this technique to calculate marginal SO, abatement elasticities for a sample of U.S. coal burning utility plants. Reig-Martinez, Picazo-Tadeo, and Hernhdez-Sancho (2001) applied this technique to calculate marginal waste abatement elasticities for use in an environmentally sensitive productivity index in a sample of Spanish ceramic producers. Similarly, this procedure was employed by Hailu and Veeman (2000) to calculate marginal abatement elasticities for various effluent discharges in the Canadian pulp and paper industry. They also constructed conventional and environmentally sensitive Malmquist productivity indexes for the industry.
'For a discussion on the likelihood that the adoption ofnew technology can reduce abatement costs, see the debate between Porter and van der Linde (1995) and Palmer, Oates, and Portney (1995).

446 December 2004 Journal of Agricultural and Resource Economics
where (xot, yot, zot) are the data for producer "o" in period t, Xt is an IN x I] matrix of all producers' purchased inputs in period t, Yt is an {M X I ] matrix of all producers' marketed outputs in period t, Zt is a {Kx I ] matrix of all producers' environmental impacts in period t, and 3L is an {I x l ] intensity vector. Program (17) is solved {I x TI times, once for each producer in each period.
The mixed-period hyperbolic distance function DE;~(X~+', yt+', zt+') is calculated exactly as in (17), with (xot+', yot+', zot+') replacing (xot, yot, zot) and retaining (Xt, Yt, Zt). This program is solved {I x (T - 1)) times, once for each producer in periods 2, . . . , T. The environmentally sensitive hyperbolic Malmquist productivity index ME;(x~, yt, zt, xt+', yt+', zt+') is calculated by substituting the solutions to the within-period and mixed- period programs into (10). ME;'(X~, yt, zt, xt+', yt+', zt+') is calculated with minor modi- fications to this procedure. The geometric mean of the two, MEH(xt, yt, zt, xt+', yttl, zt+') , provides an environmentally sensitive productivity index.
The conventional hyperbolic Malmquist productivity index M;(xt, yt, xt+', yt+') is calculated by deleting the constraints Zt3L 8zot from the within-period program (17), and by deleting the analogous constraints Zt3L 8zot+' from the mixed-period program, and substituting the solutions into (5). The geometric mean of the period t and period t + 1 conventional hyperbolic Malmquist productivity indexes, MH(xt, yt, xt+l, yt+'), pro- vides a productivity index that ignores the environmental impacts. The ratio of the two productivity indexes generates the environmental productivity indexEH(xt, yt, zt, xt+', yt+', zt+') in (12), which provides insight into the information gained by adopting an environmentally sensitive approach to production activities.
The hyperbolic distance functions DE;(x~, yt, zt) defined in (13) on the actual tech- nology GEt are calculated by adding a convexity constraint = 1 to program (171, so as to allow for varying returns to scale. The solution to this modified program defines a weakly efficient point (Oxt, 8zt, yt/8) on the boundary of GEt that supports a hyper- plane with normal defining virtual prices (w:, q:,p:). Setting = for one marketed output permits the derivation of the marginal abatement elasticities ckk from (15) and the associated virtual prices qik from (16). Both ckk and q:k vary across producers as well as through time, and qik also may vary with rn.
The Data
The data used to construct conventional indexes of productivity are described in Ball et al. (1999). The variable list contains two output aggregates, crops and livestock, and three input aggregates, capital, labor, and service flows from intermediate goods. The data are available for the 48 contiguous states for the period 1960-1996, and are used to construct a state-by-year panel. For each marketed output and purchased input, we begin with the nominal value for each state in each year. EKS multilateral price indexes are then con- structed for 1987.'' The corresponding quantity indexes are formed implicitly. Quantity indexes for the other years are obtained by chain-linking them to a base state in 1987."
lo The EKS multilateral index, proposed independently by Eltetii and Koves (1964) and Szulc (1964), satisfies Fisher's circularity test with minimum deviation from bilateral Fisher indexes. The EKS indexes are base state invariant but not base year invariant. The base year is 1987 because that is the year for which detailed price information is available.
11 A referee has asked (twice) for evidence in support of aggregation of outputs and inputs into two and three groups, respectively. We have not subjected these data to empirical testing, but Williams and Shumway (1998) and Davis, Lin, and Shumway (2000) have conducted extensive tests on aggregate U.S. data over the period 1949-1991. They tested for homo-

Ball et al. Incorporating Environmental Impacts 447
The four environmental impact variables used in this analysis are indicators of risk to human health and to aquatic life arising from exposure to pesticide runoff into surface water and pesticide leaching into groundwater. Our assessment of risk is based on the extent to which the concentration of a specific pesticide exceeds a water quality threshold. For each of 200 pesticides applied to 12 crops, we estimate the annual concen- tration a t the bottom of the root zone and the edge of the field for 4,700 representative soils. The estimated concentrations are compared to water quality thresholds that represent "safe" levels for chronic exposure. When concentration of a specific pesticide exceeds the threshold, a risk indicator is constructed using the concentration-threshold ratio. As such, the series proxy changes over time and across states in the risk from pesticide exposure. A more detailed discussion of the construction of these series is pro- vided in Kellogg et al. (2002).
The data are summarized in table 1, which reports annual values and growth rates of all nine normalized variables, aggregated across states using shares as weights. Trends in all variables, aggregated across states and indexed to unity in 1960, are depicted in figures 1 and 2. As observed from figure 1, both marketed outputs have grown faster than any purchased input, and the labor input has declined by more than half. Consequently, we expect a conventional productivity index to show productivity growth a t the aggregate level. However, this aggregation conceals considerable inter- state variation, and productivity decline is possible in some states.
In contrast to the relatively smooth time paths of the marketed outputs and the purchased inputs, the four environmental impact indicators exhibit disparate trends (figure 2). The indicators of risk to human health and to aquatic life from exposure to pesticide runoff exhibit moderate early growth in line with the early growth in the materials input. However, while the materials input continues to grow (although more slowly), the indicators of risk to human health and aquatic life from pesticide runoff begin to decline in the mid-1970s. Over the entire period, one runoff indicator increases by 20% and the other declines by 45%. In contrast, the indicators of risk to human health and aquatic life from exposure to pesticide leaching exhibit extremely rapid early growth (in excess of 20% per year, much faster than the growth of the materials input), followed by slower rates of growth and decline, although in different sequences. Over the entire period, both leaching indicators increase by more than 1,600%. In light of these divergent time paths, we have no expectation concerning the relationship between conventional and inclusive productivity indexes at the aggregate level, much less at the state level.
The Empirical Findings
We have constructed a conventional Malmquist productivity index and an environ- mentally sensitive Malmquist productivity index incorporating all four environmental indicators. The two indexes, and the environmental productivity index defined in (12), are summarized in table 2, which reports annual geometric means of individual state productivity indexes. Table 3 reports all three productivity indexes for each state. Figure 3 depicts the trends of the three productivity indexes summarized in table 2.
thetic separability, which imposes restrictions on production technology, and for two versions of the Hicks-Leontief composite commodity theorem, which imposes restrictions on price and quantity patterns. Any one of the three conditions is sufficient for consistent aggregation. Those authors found strong empirical support for exhaustive aggregation of all inputs, and for aggregation of all outputs into two groupcanimals and crops.

448 December ZOO4 Journal of Agricultural and Resource Economics
Table 1. Data Summary Statistics: Annual Values and Growth Rates of the Nine Normalized Variables (aggregated across states using shares as weights)
Year Animals Crops Materials Capital Labor HL HR FL FR
1960 36.21 70.01 43.06 60.88 169.65 8.54 5,323.39 1.95 5,893.77
1961 37.94 69.12 43.00 60.35 161.08 10.78 4,563.25 2.01 5,949.20
1962 38.94 70.39 44.03 60.04 156.35 14.32 5,458.01 2.08 5,678.77
1963 39.99 73.07 44.82 60.44 150.11 17.70 6,509.80 2.06 6,033.03
1964 40.95 71.74 45.02 61.30 141.93 18.57 6,100.93 2.00 5,437.96
1965 40.34 75.40 44.94 62.19 138.55 37.63 5,971.87 2.19 6,113.75
1966 41.30 74.91 47.74 63.98 129.35 51.90 7,085.50 2.55 6,165.63
1967 42.50 78.69 48.69 65.98 122.01 60.91 7,522.38 2.68 6,321.58
1968 42.75 80.09 48.45 68.47 116.59 60.88 6,845.15 2.77 6,362.00
1969 42.82 81.90 49.97 69.76 113.04 67.92 6,860.58 4.83 5,062.31
1970 44.55 79.12 50.61 70.57 111.10 70.04 5,897.91 20.44 5,079.62
1971 45.87 87.70 50.81 71.41 108.69 80.94 6,898.61 20.51 5,278.25
1972 46.81 87.78 52.71 72.55 107.86 88.07 6,583.14 27.57 7,108.50
1973 45.78 95.18 53.04 73.80 109.98 104.57 7,310.90 40.33 5,358.13
1974 44.75 87.42 52.36 77.35 103.54 114.64 6,975.54 61.91 5,940.33
1975 43.20 99.67 50.42 79.94 103.26 114.21 5,576.26 68.27 5,017.37
1976 45.03 98.78 54.05 82.50 105.12 143.86 4,962.22 81.52 6,138.94
1977 46.29 105.58 53.78 84.62 102.33 148.50 4,709.69 92.56 8,196.39
1978 46.35 109.56 60.54 87.01 100.19 131.93 4,404.47 83.65 6,571.05
1979 47.04 119.80 63.29 89.11 100.92 128.01 4,775.83 74.92 6,822.90
1980 48.05 110.30 63.27 92.86 103.55 130.62 4,788.24 71.68 6,300.68
1981 48.21 125.77 60.33 92.26 101.08 132.72 4,681.64 63.22 6,986.54
1982 48.40 128.25 59.85 91.42 99.63 106.41 4,677.61 57.42 6,438.35
1983 48.42 101.04 60.18 89.57 95.07 86.55 3,476.18 43.83 5,888.67
1984 48.13 121.24 58.25 85.98 94.58 102.29 4,768.43 49.90 6,361.98
1985 49.51 128.75 56.21 84.36 90.55 105.02 4,498.42 45.48 6,216.06
1986 49.92 121.68 56.59 79.91 82.33 94.00 4,080.63 39.01 6,075.51
1987 51.15 120.44 57.28 75.78 81.69 102.76 3,807.79 55.03 7,788.99
1988 51.85 103.58 56.67 73.20 83.06 108.86 4,106.64 56.16 5,729.44
1989 51.71 122.47 56.29 71.42 84.43 106.82 3,809.16 48.80 7,183.60
1990 52.80 129.05 58.97 70.56 83.31 121.64 3,813.48 45.82 8,714.34
1991 53.54 125.29 59.23 70.01 82.04 116.29 3,885.51 52.40 8,044.24
1992 55.09 140.78 59.24 68.24 77.79 123.34 4,193.45 42.17 5,686.26
1993 55.63 125.48 60.94 67.14 74.40 113.27 3,720.17 39.73 7,221.49
1994 57.15 146.68 61.97 65.45 73.58 139.65 4,046.65 36.71 8,633.12
1995 58.65 130.82 64.88 65.03 78.65 144.90 3,054.92 40.02 6,166.26
1996 58.23 142.51 62.82 63.57 77.07 167.38 2,930.98 34.53 7,094.56
Annual Growth Rates
Definitions of environmental impact indicators: HL = risk to human health from exposure to pesticide leaching; HR = risk to human health from exposure to pesticide runoff; FL = risk to aquatic life from exposure to pesticide leaching; and FR = risk to aquatic life from exposure to pesticide runoff.

Ball et al. Incorporating Environmental Impacts 449
+Animals +Crops +Materials +Capital + Labor
0.00 ~ ~ ~ ~ ~ ! ~ ~ ~ ~ ~ ~ z ~ ~ ~ l ~ l ~ r ~ r ~ ~ ~ ~ l ~ ~ ~ l r ~ ~ ~
60 62 64 66 68 70 72 74 76 78 80 82 84 86 88 90 92 94 96
Year
Figure 1. Trends in marketed outputs and purchased inputs
Year
Figure 2. Trends in environmental impact indicators

450 December 2004 Journal of Agricultural and Resource Economics
Table 2. Malmquist Productivity Indexes (annual averages)
Environmentally Year Conventional Sensitive Environmental
1.048 0.949
1.023 0.984
1.025 0.991
1.011 1.026
1.019 0.946
0.978 0.878
1.019 0.993
1.012 1.004
1.008 0.944
1.008 0.955
1.060 1.062
0.993 0.973
0.999 0.982
0.955 0.927
1.056 1.023
0.977 0.997
1.028 1.049
0.955 0.983
1.003 1.018
0.973 0.994
1.091 1.043
1.044 1.091
0.943 0.937
1.065 1.044
1.064 1.134
1.034 1.100
1.016 1.194
0.980 0.972
1.022 1.015
1.031 1.022
1.010 1.014
1.086 1.043
0.972 1.025
1.053 1.130
0.940 0.933
1.082 1.047
Annual Growth Rates

Ball et al. Incorporating Environmental Impacts 45 1
Table 3. Malmquist Productivity Indexes (state averages)
Environmentally States Conventional Sensitive Environmental
Alabama Arizona Arkansas California Colorado Connecticut Delaware Florida Georgia Idaho Illinois Indiana Iowa Kansas Kentucky Louisiana Maine Maryland Massachusetts Michigan Minnesota Mississippi Missouri Montana Nebraska Nevada New Hampshire New Jersey New Mexico New York North Carolina North Dakota Ohio Oklahoma Oregon Pennsylvania Rhode Island South Carolina South Dakota Tennessee Texas Utah Vermont Virginia Washington West Virginia Wisconsin Wyoming

Journal of Agricultural and Resource Economics 452 December 2004
1.9
Year
Figure 3. Malmquist productivity indexes (conventional, environmentally sensitive, and environmental)
The conventional Malmquist productivity index fluctuates about a trend growth rate of 1.54% per year. Productivity decline occurs in several years, typically as a result of extremes in weather, and these years correspond very closely to the negative growth years identified by Ball et al. (1997) using aggregate data and a Fisher productivity index. The weather-related declines in crop output that occurred in 1974, 1980, 1983, 1988,1993, and 1995 are reflected in the conventional Malmquist productivity index in table 2. At the individual state level (table 3), conventional productivity growth rates vary from 0.3% to 3.2% per year over the entire period.
The environmentally sensitive Malmquist productivity index also fluctuates, but with greater amplitude about a lower trend growth rate of 0.98% per year. Thus, the inclusion of the four environmental impact indicators reduces measured productivity growth by over one-third. The environmentally sensitive index exhibits annual productivity decline more frequently than does the conventional index, reflecting both extremes in weather and early years of rapid growth in the environmental impact indicators. It declines rapidly through the mid-1970s, stabilizes for a decade, and increases twice as rapidly beginning in the mid-1980s. These temporal patterns are consistent with trends in environmental regulation in U.S. agriculture. It was not until the 1970s and 1980s that environmentally benign (and effective) pesticides began to be substituted for more toxic pesticides, largely as a result of regulatory actions.12 At the individual state level, environmentally sensitive productivity growth rates vary from -7.1% to 4.9% per year over the entire period.13
l2 For more details on pesticide regulation and its impacts, see Ollinger and Fernandez-Cornejo (1998). l3 We have also calculated two additional environmentally sensitive Malmquist productivity indexes. One, based on the
two indicators of risk to aquatic life, fluctuates about a trend growth rate of 1.58% per year, virtually the same as the conventional Malmquist productivity index. The other, based on the two indicators of risk to human life, fluctuates about an intermediate trend growth rate of 1.25% per year.
Ball et al. Incorporating Environmental Impacts 453
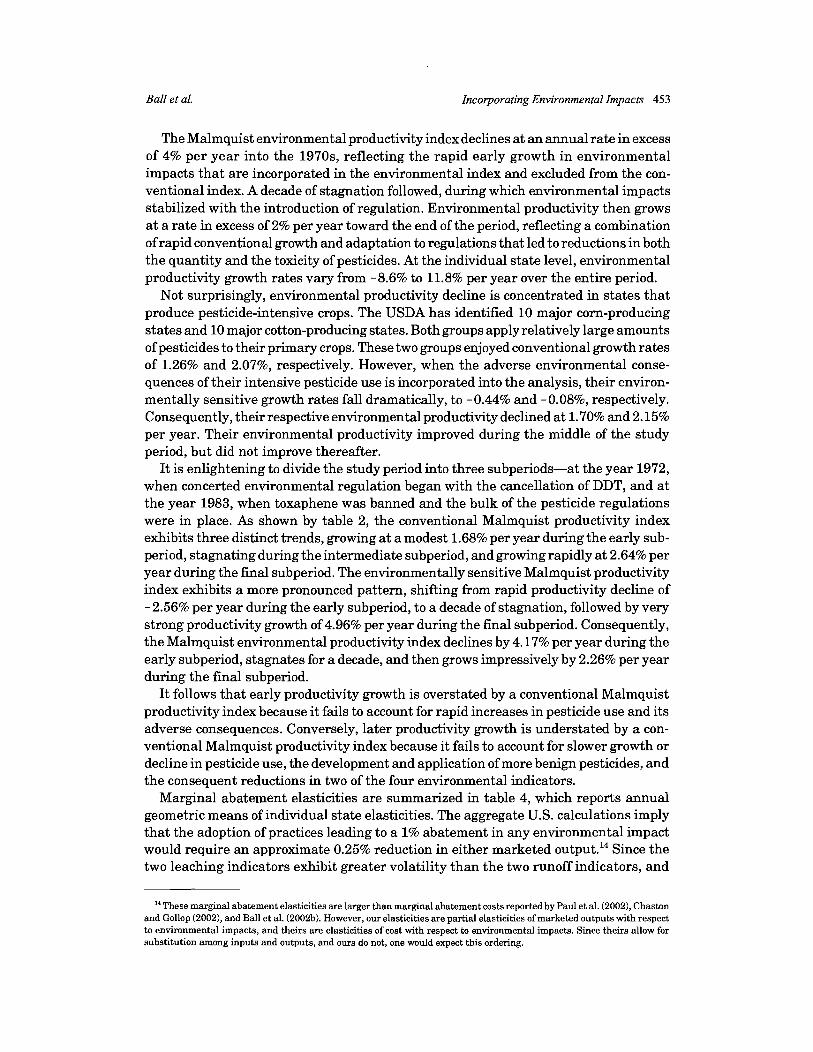
The Malmquist environmental productivity index declines at an annual rate in excess of 4% per year into the 1970s, reflecting the rapid early growth in environmental impacts that are incorporated in the environmental index and excluded from the con- ventional index. A decade of stagnation followed, during which environmental impacts stabilized with the introduction of regulation. Environmental productivity then grows at a rate in excess of 2% per year toward the end of the period, reflecting a combination of rapid conventional growth and adaptation to regulations that led to reductions in both the quantity and the toxicity of pesticides. At the individual state level, environmental productivity growth rates vary from -8.6% to 11.8% per year over the entire period.
Not surprisingly, environmental productivity decline is concentrated in states that produce pesticide-intensive crops. The USDA has identified 10 major corn-producing states and 10 major cotton-producing states. Both groups apply relatively large amounts of pesticides to their primary crops. These two groups enjoyed conventional growth rates of 1.26% and 2.07%, respectively. However, when the adverse environmental conse- quences of their intensive pesticide use is incorporated into the analysis, their environ- mentally sensitive growth rates fall dramatically, to -0.44% and -0.08%, respectively. Consequently, their respective environmental productivity declined at 1.70% and 2.15% per year. Their environmental productivity improved during the middle of the study period, but did not improve thereafter.
It is enlightening to divide the study period into three subperiods-at the year 1972, when concerted environmental regulation began with the cancellation of DDT, and at the year 1983, when toxaphene was banned and the bulk of the pesticide regulations were in place. As shown by table 2, the conventional Malmquist productivity index exhibits three distinct trends, growing at a modest 1.68% per year during the early sub- period, stagnating during the intermediate subperiod, and growing rapidly at 2.64% per year during the final subperiod. The environmentally sensitive Malmquist productivity index exhibits a more pronounced pattern, shifting from rapid productivity decline of -2.56% per year during the early subperiod, to a decade of stagnation, followed by very strong productivity growth of 4.96% per year during the final subperiod. Consequently, the Malmquist environmental productivity index declines by 4.17% per year during the early subperiod, stagnates for a decade, and then grows impressively by 2.26% per year during the final subperiod.
It follows that early productivity growth is overstated by a conventional Malmquist productivity index because it fails to account for rapid increases in pesticide use and its adverse consequences. Conversely, later productivity growth is understated by a con- ventional Malmquist productivity index because it fails to account for slower growth or decline in pesticide use, the development and application of more benign pesticides, and the consequent reductions in two of the four environmental indicators.
Marginal abatement elasticities are summarized in table 4, which reports annual geometric means of individual state elasticities. The aggregate U.S. calculations imply that the adoption of practices leading to a 1% abatement in any environmental impact would require an approximate 0.25% reduction in either marketed output.14 Since the two leaching indicators exhibit greater volatility than the two runoff indicators, and
"These marginal abatement elasticities are larger than marginal abatement costs reported by Paul et al. (20021, Chaston and Gollop (2002), and Ball et al. (2002b). However, our elasticities are partial elasticities of marketed outputs with respect to environmental impacts, and theirs are elasticities of cost with respect to environmental impacts. Since theirs allow for substitution among inputs and outputs, and ours do not, one would expect this ordering.

454 December 2004 Journal of Agricultural and Resource Economics
Table 4. Elasticities of Marketed Outputs with Respect to Environmental Impact Indicators
Animals Crops
Year FL FR HL HR FL FR HL HR
Definitions of environmental impact indicators: FL = risk to aquatic life from exposure to pesticide leaching; FR = risk to aquatic life from exposure to pesticide runoff; HL = risk to human health from exposure to pesticide leaching; and HR = risk to human health from exposure to pesticide runoff.

Ballet al. Incoiporating Environmental Impacts 455
since pesticides are applied to crops, the trends in these two abatement elasticities are depicted in figures 4 and 5. Both exhibit the same pattern, a gradual increase through the early 1980s, followed by a gradual decline. Table 4 suggests that all four crops' abatement elasticities follow this pattern: middle subperiod elasticities are larger than their early and late subperiod counterparts. The temporal pattern is consistent with the following scenario. During the early subperiod, regulation is lax, with minimal impact on producers, and abatement is relatively easy. During the middle subperiod, regulatory authority is expanded. Registration of a pesticide is allowed only if it does not cause unreasonable adverse effects to human health or the environment, all previously registered pesticides are scrutinized using new health and environmental protection criteria, and use of a number of pesticides is cancelled. As use of existing pesticides is constrained, adaptation to the new regulatory regime is slow, and abatement is rela- tively difficult. In the final subperiod, relatively benign and more effective pesticides are introduced, producers have time and experience to adapt to the new regulatory environ- ment, and abatement becomes easier.15
Finally, we have used the virtual prices obtained from the dual to program (171, modified to allow for varying returns to scale,16 to construct a pair of environmentally sensitive Fisher productivity indexes. One index uses the market price index of animals as numeraire, and the other uses the market price index of crops as numeraire. These two environmentally sensitive Fisher productivity indexes, and the environmentally sensitive Malmquist productivity index, are depicted in figure 6. Trends in the two Fisher indexes are generally consistent with that of the Malmquist index. The two Fisher productivity growth rates of 1.25% per year and 1.43% per year are both higher than the Malmquist productivity growth rate of 0.98% per year, but the temporal patterns are similar. The two Fisher indexes exhibit somewhat higher growth during the 1960-1972 and 1973-1983 subperiods, and similar growth during the 1984-1996 subperiod.
The Fisher-Malmquist comparison raises two issues. The first concerns why the two Fisher indexes grow more rapidly than the Malmquist index does. The answer lies in the virtual prices used in their construction. Virtual prices with zero values are dual reflec- tions of positive slack at the optimal hyperbolic projection. Approximately 37% of all virtual prices of environmental impacts are zero, which explains why the environment- ally sensitive Fisher productivity indexes grow more rapidly than the corresponding Malmquist productivity index. Particularly when environmental impacts are large or are growing rapidly, as in the early and middle subperiods, positive slack occurs a t the optimal hyperbolic projections, and the environmental indicators receive zero virtual price weights in the two Fisher indexes, thereby reducing their environmental sensitivity. When use is excessive, disposal is free, and consequently the Fisher indexes ignore the environmental impacts and overstate productivity growth.
The second issue concerns the choice between the two Fisher indexes, which deviate substantially. Derivation of virtual prices for environmental impacts requires normal- izing on the price of one marketed output, which leaves two choices. We prefer to
"The four animal abatement elasticities follow exactly the opposite pattern. We believe this is an artifact of the data. The growth in animal output declined dramatically (from 2.16% per year in the early subperiod to 0.31% per year during the middle subperiod) just as growth in the four environmental indicators abated. This gives the appearance of increasing abate- ment elasticities, when in fact the decline in the animalhop mix was due largely to product market forces.
l6 There is scant evidence of scale economies in the actual technology. The dual variable associated with the convexity con- straint has mean -0.013 and standard deviation 0.064, based on 1,776 state-by-year observations.

456 December 2004 Journal of Agricultural and Resource Economics
0.55 - A c t u a l - 5-Year Moving Au?rage
Year
Figure 4. Average elasticities of crops with respect to FL indicator
60 62 64 66 68 70 72 74 76 78 80 82 84 86 88 90 92 94 96
Year
0.55
Figure 5. Average elasticities of crops with respect to HL indicator
- A c t u a l -5-Year Moving Au?rage

BaN et al. Incorporating Environmental Impacts 457
60 62 64 66 68 70 72 74 76 78 80 82 84 86 88 90 92 94 96
Year
Figure 6. Cumulated productivity indexes (environmentally sensitive Fisher and environmentally sensitive Malmquist)
normalize on the animal price index, which supports a preference for the Fisher (Animals) productivity index in figure 6. The reason is that pesticides are applied to crops, and the crop price index does not incorporate the adverse environmental impacts caused by pesticide leaching and runoff. Consequently, p: < p i , particularly in the early and middle subperiods. The implication of p: <p: is clear from (16), reproduced here with p: =p: as:
If p: <p&, virtual prices of all four environmental impacts are understated when the normalization is on the crop price index, which ignores the negative externalities. Since environmental impacts are undervalued, the Fisher (Crops) productivity index over- states environmentally sensitive productivity growth. The Fisher (Animals) productivity index is not subject to this line of reasoning, and its temporal pattern is much closer to that of the environmentally sensitive Malmquist productivity index. The proximity of the Fisher (Animals) index to the Malmquist index is consistent with Diewert's (1992) approximation result, tempered by the observations beneath (7).17
l7 Of course, the animal price index does not reflect the adverse environmental consequences of excess nitrogen arising from surplus manure. However, since our environmental indicators do not include damage from excess nitrogen, this has no impact on our preference for normalizing on the animal price index in deriving virtual prices for the environmental indicators we do have.

458 December 2004 Journal of Agricultural and Resource Economics
Summary and Conclusions
The U.S. agricultural sector has recorded impressive rates of conventionally measured productivity growth. However, the sector also generates a wide range of positive and negative external effects, and it would be useful to incorporate at least some of them into the productivity calculations. We have demonstrated that the productivity story changes dramatically when four adverse environmental impacts associated with water contamination from pesticide use are incorporated into the calculations. Three environ- mentally sensitive indexes of productivity change show productivity decline during the 1960-1972 period, when pesticide use was increasing. These same indexes show relatively rapid productivity growth during the period 1984-1996, when environmental protection efforts intensified and, as a consequence, relatively benign and effective pesticides were introduced. It follows that productivity growth is overstated by a conventional Malmquist productivity index in the early years, because the latter fails to account for rapid increases in pesticide use and its adverse consequences. Conversely, productivity growth is understated by a conventional Malmquist productivity index in the later years, because the latter fails to account for reductions in water contamination. This pattern is reflected in the behavior of the environmental productivity index, which declines rapidly at over 4% per year through the mid-1970s, stabilizes through the mid-1980s, and increases at over 2% per year thereafter. Incorporating just four of many environmental impacts into an environmentally sensitive productivity index generates very large changes in an assessment of productivity growth in U.S. agriculture. The temporal pattern of these changes provides a clear indication of the impact of environ- mental regulation during the period.
As a by-product of our environmentally sensitive productivity growth calculations, we have derived a set of marginal abatement elasticities for the four environmental indicators. These elasticities suggest that a 1% reduction in pesticide leaching or runoff would require an approximate 0.25% reduction in either marketed output. They provide a rough benchmark against which to compare marginal benefit calculations in the design of environmental policies in agriculture.
Hicks (1940) first showed, in the context of new and disappearing goods, that non- existent market prices can be approximated by virtual prices in the construction of index numbers. Nonexistent prices also characterize non-marketed environmental impacts. As a second by-product of our calculations, we have constructed a pair of environment- ally sensitive Fisher productivity indexes based on virtual prices of the environmental indicators. Two problems were confronted in the construction of an environmentally sensitive Fisher productivity index, one of which led us to prefer an index based on the animal price index that is uncontaminated by the externalities associated with the crop price index. It is reassuring that, despite a multitude of zero virtual prices, this Fisher index provides a reasonably close approximation to the environmentally sensitive Malmquist productivity index.
[Received July 2003;Jinal revision received October 2004.1

Ball et al.
References
Incolporating Environmental Impacts 459
Ball, V. E., J.-C. Bureau, R. Nehring, and A. Somwaru. "Agricultural Productivity Revisited."Amer. J. Agr. Econ. 79,4 (November 1997):1045-1063.
Ball, V. E., R. F a e , S. Grosskopf, F. Hernandez-Sancho, and R. Nehring. "The Environmental Per- formance of the U. S. Agricultural Sector." In Agricultural Productivity: Measurement and Sources of Growth, eds., V . E. Ball and G. W. Norton, pp. 257-276. Boston: Kluwer Academic Publishers, 2002a.
Ball, V. E., R. F a e , S. Grosskopf, and R. Nehring. "Productivity of the U.S. Agricultural Sector: The Case of Undesirable Outputs." In New Developments in Productivity Analysis, eds., C. R. Hulten, E. R. Dean, and M. J. Harper, pp. 541-586. Chicago: University of Chicago Press, 2001.
Ball, V. E., R. G. Felthoven, R. Nehring, and C. J. Morrison Paul. "Costs of Production and Envi- ronmental Risk: Resource-Factor Substitution in U.S. Agriculture." In Agricultural Productivity: Measurement and Sources of Growth, eds., V. E. Ball and G. W. Norton, pp. 293-310. Boston: Kluwer Academic Publishers, 2002b.
Ball, V. E., F. M. Gollop, A. Kelly-Hawke, and G. P. Swinland. "Patterns of State Productivity Growth in the U.S. Farm Sector: Linking State and Aggregate Models."Amer. J. Agr. Econ. 81,1(February 1999):164-179.
Ball, V. E., C. A. K. Lovell, R. F. Nehring, and A. Somwaru. "Incorporating Undesirable Outputs into Models of Production: An Application to U.S. Agriculture." Cahiers d'economie et sociologie rurales 31(1994):60-73.
Boyd, G. A., and J. D. McClelland. "The Impact of Environmental Constraints on Productivity Improve- ment in Integrated Paper Plants." J. Environ. Econ. and Mgmt. 38,2(September 1999):121-142.
Caves, D. W., L. R. Christensen, and W. E. Diewert. "The Economic Theory of Index Numbers and the Measurement of Input, Output, and Productivity." Econometrics 50,6(1982):1393-1414.
Chaston, K A., and F. M. Gollop. "The Effect of Surface Water and Ground Water Regulation on Productivity Growth in the Farm Sector." In Agricultural Productivity: Measurement and Sources of Growth, eds., V. E. Ball and G. W. Norton, pp. 277-292. Boston: Kluwer Academic Publishers, 2002.
Chung,Y. H., R. Fare, and S. Grosskopf. "Productivity andundesirable Outputs: ADirectional Distance Function Approach." J. Environ. Mgmt. 51(1997):229-240.
Coggins, J. S., and J. R. Swinton. "The Price of Pollution: A Dual Approach to Valuing SO, Allowances." J. Environ. Econ. and Mgmt. 30,1(January 1996):5&72.
Cropper, M. L., and W. E. Oates. "Environmental Economics: A Survey." J. Econ. Lit. 30(1992):675-740. Davis, G. C., N. Lin, and C. R. Shumway. "Aggregation Without Separability: Tests of the United States
and Mexican Agricultural Production Data." Amer. J. Agr. Econ. 82,1(February 2000):214-230. Diewert, W. E. "Fisher Ideal Output, Input, and Productivity Indexes Revisited." J. Productivity Analy.
3,3(September 1992):211-248. Elteto, O., and P. Koves. "On a Problem of Index Number Computation Relating to International Com-
parison." Statisztikai Szemle 42( 1964):507-518. Fare, R., S. Grosskopf, and C. A. K Lovell. The Measurement of Eficiency of Production. Dordrecht:
Kluwer-Nijhoff Publishing, 1985. Fare, R., S. Grosskopf, C. A. K Lovell, and S. Yaisawarng. "Derivation of Shadow Prices for Undesirable
Outputs: A Distance Function Approach." Rev. Econ. and Statis. 75(1993):374-380. Fisher, I. The Making of Index Numbers. Boston: Houghton-Mifflin, 1922. Grifell-Tatje, E., and C. A. K Lovell. "A Note on the Malmquist Productivity Index." Econ. Letters
47(1995):169-175. Hailu, A., and T. S. Veeman. "Environmentally Sensitive Productivity Analysis of the Canadian Pulp
and Paper Industry, 1959-1994: An Input Distance Function Approach." J. Environ. Econ. and Mgmt. 40,3(November 2000):251-274.
Hicks, J . R. "The Valuation of the Social Income." Economica 7,26(May 1940):105-124. Kellogg, R. L., R. Nehring, A. Grube, D. W. Goss, and S. Plotkin. "Environmental Indicators of Pesticide
Leaching and Runoff from Farm Fields." InAgricultural Productivity: Measurement and Sources of Growth, eds., V. E. Ball and G. W. Norton, pp. 213-256. Boston: Kluwer Academic Publishers, 2002.

460 December 2004 Journal of Agricultural and Resource Economics
Malmquist, S. "Index Numbers and Indifference Surfaces." Trabajos de Estadistica 4(1953):209-242. Ollinger, M., and J. Fernandez-Cornejo. "Imovation and Regulation in the Pesticide Industry."Agr. and
Resour. Econ. Rev. 27,1(April 1998):15-27. Palmer, R, W. E. Oates, and P. R. Portney. "Tightening Environmental Standards: The Benefit-Cost
or the No-Cost Paradigm?" J. Econ. Perspectives 9,4(Fall 1995):119-132. Paul, C. J. M., V. E. Ball, R. G. Felthoven, A. Grube, and R. E. Nehring. "Effective Costs and Chemical
Use in United States Agricultural Production: Using the Environment as a 'Free' Input." Amer. J. Agr. Econ. 84,4(November 2002):902-915.
Pittman, R. W. "Multilateral Productivity Comparisons with Undesirable Outputs." Economic J. 93(1983):883-891.
Porter, M. E. "America's Green Strategy." Scientific American (April 1991):68. Porter, M. E., and C. van der Linde. "Toward a New Conception of the Environment-Competitiveness
Relationship." J. Econ. Perspectives 9,4(Fall 1995):97-118. Reig-Martinez, E., A. Picazo-Tadeo, and F. Hernhdez-Sancho. "The Calculation of Shadow Prices for
Industrial Wastes Using Distance Functions: An Analysis for Spanish Ceramic Pavement Firms." Internat. J. Production Econ. 69,3(February 2001):277-285.
Shephard, R. W. Cost and Production Functions. Princeton, NJ: Princeton University Press, 1953. . The Theory of Cost and Production Functions. Princeton, NJ: Princeton University Press, 1970.
Szulc, B. J. "Indices for Multiregional Comparisons." Przeglad Statystyczny 3(1964):239-254. Tornqvist, L. "The Bank of Finland's Consumption Price Index." Bank of Finland Monthly Bulletin
lO(1936): 1-8. Williams, S. P., and C. R. Shumway. "Testing for Behavioral Objective and Aggregation Opportunities
in U.S. Agricultural Data." Amer. J. Agr. Econ. 80,1(February 1998):195-207.