Development and implementation of a catch and effort data ...
106
W&M ScholarWorks W&M ScholarWorks Reports 1989 Development and implementation of a catch and effort data Development and implementation of a catch and effort data collection system for monitoring trends in fishing success on collection system for monitoring trends in fishing success on Virginia's artificial fishing reefs, 1987-1988 : for the period January Virginia's artificial fishing reefs, 1987-1988 : for the period January 1, 1988 - December 31, 1988 1, 1988 - December 31, 1988 Jon A. Lucy Virginia Institute of Marine Science Charles G. Barr Virginia Institute of Marine Science Follow this and additional works at: https://scholarworks.wm.edu/reports Part of the Aquaculture and Fisheries Commons Recommended Citation Recommended Citation Lucy, J. A., & Barr, C. G. (1989) Development and implementation of a catch and effort data collection system for monitoring trends in fishing success on Virginia's artificial fishing reefs, 1987-1988 : for the period January 1, 1988 - December 31, 1988. Virginia Institute of Marine Science, William & Mary. https://scholarworks.wm.edu/reports/2761 This Report is brought to you for free and open access by W&M ScholarWorks. It has been accepted for inclusion in Reports by an authorized administrator of W&M ScholarWorks. For more information, please contact [email protected].
-
Upload
khangminh22 -
Category
Documents
-
view
1 -
download
0
Transcript of Development and implementation of a catch and effort data ...

W&M ScholarWorks W&M ScholarWorks
Reports
1989
Development and implementation of a catch and effort data Development and implementation of a catch and effort data
collection system for monitoring trends in fishing success on collection system for monitoring trends in fishing success on
Virginia's artificial fishing reefs, 1987-1988 : for the period January Virginia's artificial fishing reefs, 1987-1988 : for the period January
1, 1988 - December 31, 1988 1, 1988 - December 31, 1988
Jon A. Lucy Virginia Institute of Marine Science
Charles G. Barr Virginia Institute of Marine Science
Follow this and additional works at: https://scholarworks.wm.edu/reports
Part of the Aquaculture and Fisheries Commons
Recommended Citation Recommended Citation Lucy, J. A., & Barr, C. G. (1989) Development and implementation of a catch and effort data collection system for monitoring trends in fishing success on Virginia's artificial fishing reefs, 1987-1988 : for the period January 1, 1988 - December 31, 1988. Virginia Institute of Marine Science, William & Mary. https://scholarworks.wm.edu/reports/2761
This Report is brought to you for free and open access by W&M ScholarWorks. It has been accepted for inclusion in Reports by an authorized administrator of W&M ScholarWorks. For more information, please contact [email protected].

Project Completion Report (Year Two of Two-Year Project)
Wallop-Breaux Project Number F-63-R (Sport Fish Restoration Act Fund)
Title:
Development and Implementation of a Catch and Effort Data Collection System for Monitoring Trends
\J\rnS SH d~~
\/5 L'i 3 1qiq
in Fishing Success on Virginia's Artificial Fishing Reefs, 1987-1988
For the Period: January l, 1988 - December 31, 1988 (Work Period Extended to March 31, 1989
Principal Investigator Mr. Jon A. Lucy, Marine Recreation Specialist
Department of Marine Advisory Services
Graduate Assistant Charles G. Barr
Department of Marine Advisory Services
Virginia Institute of Marine Science School of Marine Science
College of William and Mary Gloucester Point, Virginia 23062
Submitted to: Virginia Marine Resources Commission
P.O. Box 756 Newport News, Virginia 23607
William A. Pruitt, Commissioner
September 1989
~--.............
/ LIBRARY °\. (, of the \
VIRGINIA INSTITUTE \ I I
\ of / ''\MARINE SCIENCE;
·, ,,I
.. ,~--- .,-'"';/

ACKNOWLEDGEMENTS
INTRODUCTION
OBJECTIVE
METHODS
TABLE OF CONTENTS
Page
ii
1
2
2
General Sampling Program for Lower Chesapeake Bay and Offshore Wreck 4 Fishing Sites
Special Sampling Program for Gwynn Island Test Reef Site 5
Data Collected and Analysis 7
RESULTS AND DISCUSSION 9
Sample Population of Fishermen 9
General Sampling Program for Lower Chesapeake Bay and Offshore Sites 10
Catch Patterns 12
Quality Ratings of Fishing Experiences 24
Special Sampling Program for Gwynn Island Test Reef 28
Catch Patterns 30
Quality Rating of Fishing Experiences
Gwynn Island Test Reef, Lower Bay and Offshore Sites
Comparing 1987 Study Results with Monitoring Study
CONCLUSIONS
FIGURE
TABLES
REFERENCES
APPENDICES
i
33
34
37
38
41
42
83
85

ACKNOWLEDGEMENTS
The Wallop-Breaux funds supporting this project were matched by state
funds from the Virginia Institute of Marine Science (VIMS), School of Marine
Science of the College of William and Mary. In addition, some limited
activities assisting the project were funded through VIMS Sea Grant Marine
Advisory Services Program, e.g. some of the travel to fishing club meetings,
marinas, and meetings on artificial reef research and management issues.
Discussions of the study with persons at meetings of the Atlantic States
Marine Fisheries Commission's Artificial Reef Advisory Committee and the
Fourth International Conference on Artificial Habitats for Fisheries were
particularly beneficial in evaluating the study's results. Some of the
preliminary findings of the study were shared with participants in the
latter meeting as part of a conference poster session on Virginia's
Artificial Reef Program lead by Mr. Michael Meier, Fisheries Reef Manager
for the Virginia Marine Resources Commission (VMRC).
Mr. Meier of the VMRC was particularly helpful in discussing various
aspects of the study throughout the project and readily supplied names of
fishermen to the researchers for inclusion in the study's sample population
of reef fishermen. Mr. Jack Travelstead, Head of VMRC's Fisheries Division
was also most helpful through his role as administrator of Virginia's
"marine" Wallop-Breaux projects. Of particular assistance to the project
was Mr. Travelstead's convening of a meeting in early June 1987 involving
the principal investigator, Mr. Meier, and Dr. David Feigenbaum of Old
Dominion University. Discussions of early results of the project initiated
the idea for adding a question to fishermen's interviews concerning their
rating the overall quality of their fishing experiences on wreck and reef
ii

sites. This information proved to be extremely helpful to the researchers
in evaluating circumstances at sites which contributed to good or bad
fishing experiences. In addition to participating in the described meeting,
Dr. Feigenbaum has proven helpful on other occasions throughout the study
with regard to exchanging ideas on various aspects of the study.
The data analysis and preparation of report tables could not have
been completed without the assistance of Ms. Nancy Chartier, Project
Specialist and Mr. Edward Heist, Graduate Assistant in VIMS Department of
Marine Advisory Services. A similar contribution to the project was made by
Ms. Maxine Butler, Secretary in VIMS Department of Marine Advisory Services.
In addition to her many diverse and difficult duties, Ms. Butler found the
energy and patience to rework drafts of the project report and to produce
the final copy for printing. Her assistance, like that of Ms. Chartier and
Mr. Heist, was critical to the successful completion of the project. The
final report was printed by Ms. Sylvia Motley of VIMS Print Shop. Ms.
Cheryl Teagle, Office Services Supervisor of the Department of Marine
Advisory Services, and Ms. Jane Lopez of VIMS Finance Office provided
administrative assistance to the project.
Numerous Virginia fishing clubs and marina/tackle shop operators helped
the researchers identify wreck and reef fishermen utilizing certain
artificial reef sites. The Deltaville Fishing and Conservation Club was of
major assistance to the project. In addition to providing names of its
members who fished the Gwynn Island Test Reef, the Club also printed signs
displayed at local businesses encouraging Gwynn Island reef fishermen to
establish contact with the Club or VIMS researchers to become incorporated
into the sample population of fishermen for the project. Mr. James Wharton,
club president, Mr. Gene Sidoli, Captain Tabb Justis, and Mr. Pat Watson
iii

were particularly helpful in spreading the word on the researchers' need to
identify fishermen utilizing the Gwynn Island Reef site. Mr. Wharton also
graciously invited the researchers to join him on a fishing trip to the
reef, an experience which helped the researchers better interpret interview
information obtained from fishermen during the study.
Other individuals, fishing clubs, organizations and businesses that
went out of their way to assist the project in identifying fishermen were
the following: the Virginia Saltwater Fishing Tournament in providing
addresses of certified weigh stations for distributing flyers on the study
(Appendix A)i Mr. Dee Johnson and Mr. Bruce Easley of the Peninsula
Saltwater Sport Fisherman's Association; Messrs. Roy Cahoon and George
Cooper, Sr. of the Portsmouth Anglers Club; Mr. John Wetlaufer of the
Virginia Anglers Club; Captain Charlie Ward of the Virginia Charter Boat
Association; Mr. Carl Herring and Mr. Herb Gordon, then president and
secretary respectively of the Virginia Federation of Anglers, and Mr. Chuck
Traub of the Virginia Wildlife Federation for reprinting articles on the
project in their publications; Mr. Chuck Guthrie of Lynnhaven Marine Center
in Virginia Beach; Mr. Chris Plakas of Walden Brothers Marina in Deltaville;
Mr. Robert Reiner of Chesapeake Cove Marina in Deltaville; Mr. Wayne ~ulley
of Pulley Marine on Gwynn Island; Mr. R. S. Edwards of Edwards Marine
Railway on Gwynn Island; Mr. Ronald Belcher of R&R Bait and Tackle in
Hudgins; Ms. Gay Webster of the New Point Campground in Mathews County; Mr.
Warren Cobb, Ms. Nancy Cobb and the entire Cobb family, owners of Cobb's
Marina on Little Creek in Norfolk; Captain Fred Feller of the Virginia Beach
Fishing Center; Captains Randy Lewis and Robert Fate of the Wachapreague
Marina; Captain Gordon Eastlake, chartering out of Wachapreague; Captains
Otis Asal and Donald Stiles, charter captains working out of Kings Creek
iv

Marina in Cape Charles; Mr. Tom Armstrong of Boat U.S. in Virginia Beach;
Mr. Leigh Tighe of the Tidewater Sea Urchins dive club and Mr. Norman
Harris, recreational diver (numerous observations on fish at reef and wreck
sites). This listing does not include all of those individuals who helped
the project by encouraging wreck fishermen to participate in the data
gathering process. To such persons, as well as to those specifically
mentioned, we owe a debt of gratitude for their contribution to the study.
Special mention must be made of assistance provided to researchers by
Mr. L. T. "Curley" Edwards of North, Virginia in Mathews County. Known to
everyone who fishes the Gwynn Island Test Reef site, Mr. Edwards graciously
invited the researchers to his home to discuss productive fishing techniques
he utilized in his almost daily trips to the reef site during the fishing
season. Mr. Edwards also alerted other anglers using the Gwynn Island reef
to the researchers need for information, thereby helping significantly in
familiarizing fishermen with the study. Regardless of how things were going
for him at the time, Mr. Edwards always shared information with the
researchers about how the Gwynn Island Reef was performing for local
fishermen. The research team owes Mr. Edwards a debt of gratitude for the
unselfish amount of time and assistance he provided the project.
In a similar manner, most of the fishermen interviewed during the
project gave freely of not only their catch information but also of their
time in providing useful information about fishing situations they
experienced on various wrecks and artificial reefs. While the latter
information was impossible to quantify, it provided a very useful framework
for researchers to use in evaluating some of the project's results. A
special "thank you11 is due to all fishermen who provided their names for use
in the project's sample population of wreck and reef fishermen, as well as
V

to those who were interviewed during the course of the season. The study
could not have been done without their willingness to assist the researchers
in quantifying fishing success rates on Virginia's more popular wreck
fishing sites.
This work is a result of research sponsored in part by the National Sea
Grant College Program of the National Oceanic and Atmospheric
Administration, U.S. Department of Commerce, under Grant No. NA91AA-D-00025
to the Virginia Graduate Marine Science Consortium and the Virginia Sea
Grant College Program. The U.S. Government is authorized to produce and
distribute reprints for governmental purposes notwithstanding any copywright
notation that may appear hereon.
vi

INTRODUCTION
Recreational fishing opportunities in Virginia for species associated
with hard bottom habitats such as natural oyster reefs and man-made
structures have been enhanced since the early 1970's through an artificial
reef construction program coordinated by the Virginia Marine Resources
Commission (VMRC). This program evolved under the Commission in response to
private interests initiating reef development projects beginning as early as
1959. As more interest developed in establishing reef sites there became a
growing need for state assistance in coordinating permits and the placement
of reef materials on subaqueous bottoms under the jurisdiction of the
Commonwealth and the federal goverrunent (Lucy 1983; Meier et al. 1985).
Virginia's growing artificial reef program led the VMRC to contract with Old
Dominion University (ODU) for a three year study (1983-85) of potential reef
sites in Chesapeake Bay and offshore waters. The study effort provided an
assessment of two test reefs established inside Chesapeake Bay and one site
offshore Wachapreague on the Eastern Shore. The test reef sites were
monitored by researchers using rod and reel fishing techniques designed to
compare the results of fishing effort on each reef site and adjacent
"control° areas not containing reef materials (Feigenbaum 1984; Feigenbaum
et al. 1985a; Feigenbaum et al. 1985b; Feigenbaum et al. 1986). As part of
the study, recommendations were made for future artificial reef development
in Virginia (Feigenbaum et al. 1986).
This project is intended to complement the previous studies,
establishing a data base of recreational fishermen's catch success rates on
major reef and other popular "wreck fishing" sites. By systematically
collecting and analyzing catch and effort data from recreational fishermen
1

-
utilizing such sites, as well as recording observations about how the sites
are most effectively fished, researchers seek to provide the VMRC with
information that will assist in better placement and design of productive
reef sites. This study will also help document current use patterns and the
relative popularity of various reef and other wreck fishing sites among
recreational fishermen.
OBJECTIVE
The basic objective of the study was to identify a core population of
recreational fishermen owning private boats and fishing one or more Virginia
artificial reefs or other popular wreck fishing sites (Figure land Table l)
with some degree of regularity (making a minimum of two or three reef trips
per season). This population of fishing boat owners would be sampled
randomly, by either telephone or fishing log books, to determine fishing
effort and catch rates characterizing trips made to specific reef and other
popular wreck fishing sites during the 1987 fishing season. Examination of
the resulting data would determine whether fishing activity on all, or a
limited number of reef and wreck fishing sites, would be sampled during the
study's second year. The sample population of reef and wreck fishermen
would also be expanded in year two of the study.
METHODS
A chart showing the locations of Virginia's three test reefs and four
major reefs was printed, including the listing of LORAN C coordinates of
major materials on each site. On the reverse side of the chart were spaces
2

for reef and wreck fishermen to provide Virginia Institute of Marine Science
(VIMS) researchers with their names, mailing addresses, and telephone
numbers, in order to assist with the reef study (Appendix A). These charts,
with associated wreck fishermen identification forms on the back, were sent
to major saltwater fishing clubs of coastal Virginia, requesting that they
encourage reef and wreck fishing members to participate in the study. In
addition, the charts, with stamped return envelopes, were sent to major
marinas in the port areas serving artificial reef sites and the majority of
official weigh stations certified by the Virginia Saltwater Fishing
Tournament. In addition to these efforts, the researchers addressed fishing
clubs, visited docking and launching facilities, promoted the study at the
Virginia Sport Fishermen's Forum in 1987 and 1988, prepared news releases
for major metropolitan newspapers (Appendix B), and highlighted the need for
fishermen's participation in the study and study results in VIMS "Marine
Resource Bulletin" ( a Sea Grant quarterly newsletter with circulation of
over 6,800) (Appendix C and D). A mailing of reef charts was again made to
recreational fishing clubs early in 1988 to obtain names of new members
targeting wrecks and reefs. The popular "Chart of Wrecks and Artificial
Reefs in Virginia Waters", a cooperative publication of VIMS Sea Grant
Marine Advisory Program and VMRC's Artificial Reef Program, was re-formatted
and expanded in area to cover lower Chesapeake Bay such that all existing
reef sites were located on the chart (Lucy 1988). Through these techniques
a population of boat-owning reef and wreck fishermen was established and
regularly expanded for sampling purposes. Based upon experience gained with
studies of the offshore recreational pelagic fishery (Bochenek et. al. 1989;
3

Lucy et al. 1988b), it was decided to sample the identified population of
fishermen using a random telephone interview technique.
General Sampling Program for Lower Chesapeake Bay and Offshore Wreck Fishing
Sites
Two week (14 day) telephone sampling "wave date" intervals were
established for the general. reef and wreck sampling program, with the first
random telephone calls made on April 13-15 for the fishing (sampling) period
of March 30-April 12 during the study's first year. In 1988 telephone
interviews for the general sampling period were initiated in the third week
of April for the fishing period April 4-17. Each sampling period extended
from Monday through the second week of the two week time frame. Two
weekends, the time of most private boat fishing activity, were covered in
each telephone sample. For each sampling period a random selection of
letters was made from the alphabet using a random numbers table. These
letters were used to determine from which alphabetical group of fishermen's
names interviewees would be selected. Fishermen's names were then randomly
chosen from within each group of last names beginning with the randomly
selected letter. Calls were made to the 25-30 randomly selected fishermen
until 20 fishermen had been reached. When contacted, fishermen were asked
about reef or wreck fishing trips they might have taken aboard their boat
during the specified sampling period. Telephone calls were predominately
made in the evenings to home telephone numbers supplied by study
participants, but calls were also made to work locations during the day,
whenever such numbers were provided by fishermen. All calls were generally
4

completed on Mondays through Wednesdays of the week immediately following
the sampling period.
Catch data on reef or wreck fishing trips made one to two weeks prior
to the specified fishing period were also recorded and included in the
appropriate sampling period's data set. Such trips helped to supplement the
small total number of artificial reef trips generally accounted for in each
sampling period and provided broader coverage of numerous non-reef "wreck
fishing" trips made by fishermen. If anglers were unsure about the details
of fishing trips, the data were not used.
Fishermen's names were not reused in the telephone sampling list for at
least one month in the general sampling program. This reduced the number of
repetitive calls to the same fisherman, while also helping to insure that
the majority of the population of identified fishermen would be contacted at
least once during the fishing season (Bochenek et al. 1989).
Special Sampling Program for Gw.ynn Island Test Reef Site
The Gwynn Island Test Reef Site was of special interest to researchers
because of the relatively poor catch performance rating it received in the
ODU study (Feigenbaum et al. 1985a; Feigenbaum et al. 1986). The study
results contrasted with reports from fishermen in the local area indicating
that the site was fairly popular, producing reasonable catches of trout and
spot during the summer months and some tautog in the fall (Feigenbaum et al.
1985a; Deltaville Fishing and Conservation Club, personal communication).
Telephone interviews for the first four general sampling periods in
1987, a total of 80 fishermen, produced no trips taken to the Gwynn Island
Test Reef. Researchers were concerned that sufficient data would not be
5

obtained during the season to document catch trends at this particular reef.
A new sampling strategy was designed to address this concern. With
assistance from the Deltaville Fishing and Conservation Club and marina
operators and tackle shops in the Deltaville-Gwynn Island-Mathews County
area, a more concerted effort was initiated to identify a larger number of
boat owners fishing the Gwynn Island Test Reef. A random telephone sampling
of ten such fishermen per two-week period was begun June 1-3, 1987 for the
sampling (fishing) period May 18-31, a schedule that alternated this special
sampling effort with the general sampling schedule initiated for all reef
sites beginning in April.
Because the population of Gwynn Island fishermen was small, especially
at the beginning of the newly established special sampling program, names of
such fishermen were only withheld from the random drawing of names for one
sampling period before being put back into the Gwynn Island Reef population
of fishermen. The designated "Gwynn Island fishermen" were also left in the
total population of fishermen from which random interviews continued to be
made during 1987 in the general sampling effort for all reef sites. This
provided the opportunity at the end of the season to compare the size of
resulting data sets (number of usable interviews) recorded for the Gwynn
Island Test Reef site from the two distinctive sampling efforts. The
revised sampling protocol was continued into November 1987 (last fishing
period sampled was November 2-15).
Sampling effort for the Gwynn Island Test Reef was doubled in 1988 to
increase sample size for each month and the season overall. Sampling began
in the second week of April for the fishing period March 28-April 10. As in
1987, boat owners were interviewed randomly but at no greater frequency than
6

every other interview period (approximately once each month) to enhance
contacting the most fishermen (Lucy et al. 1988a).
Regarding fishing trips to the Gwynn Island Test Reef and other wreck
fishing sites, particular care was taken by researchers to include in the
analysis only trips during which fishing activity was either concentrated
directly on the the reef materials (structure) or within approximately 325
yards (approximately 300 meters) of the reef's periphery. Bohnsack and
Sutherland (1985), in their review paper on reef research, indicated that
the "enhanced fishing zone" around reefs was generally accepted as being
200-300 meters wide for midwater and surface fishes and up to 100 meters
wide for benthic fishes. Since both categories of fish were caught at this
site, the 325 yard zone concept was utilized in determining which recorded
trips , although occurring in the vicinity of the reef, should not be
considered strictly "reef" trips for purposes of the study's analysis. As
expected, reef fishermen sometimes had difficulty in estimating how far away
from the reef or other structure they fished. As researchers interviewed
fishermen and explained the distance problem and its importance, fishermen
became more accustomed to the· study's requirements and more precise in
describing the ways in which they fished sites, including estimating
distances fished from structrues at the site.
Data Collected and Analysis
In both sampling programs records of fishing effort (number of fishing
trips) were maintained for each sampling period and basic catch data
recorded for each reef and wreck fishing trip adequately recalled (see
telephone interview instrument, Appendix E). Concerning catches, fishermen
7

were asked to list what fish(es) they were trying to catch (targeted
species), all types of fish caught, the number kept and released of each
species, and the estimated average weight of fish kept and released by
species. In early July 1987, a question rating the overall quality of each
fishing trip experience was added to the telephone interview instrument as a
result of discussions with the project coordinator, Mr. Jack Travelstead of
VMRC. Since the recall periods were only 14-18 days long, the majority of
fishermen contacted responded quickly and in excellent detail to the
interviewer's questions. Interviewing was terminated in late November of
each year when weather constantly prevented fishermen from making reef or
wreck fishing trips and the majority of such fishermen indicated they were
"finished fishing for the season°. Since data recorded in 1987 for Gwynn
Island Test Reef fishing trips were collected in the same random manner for
both the general sampling program (14 trips) and special program (46 trips),
the data sets were combined (60 trips) for the comprehensive monthly and
seasonal analysis of the Gwynn Island site for that year.
Catch data recorded from fishing trips was organized by general target
species groups for comparison between years and locations within years. The
rationale for this approach was based upon the fact that fishermen seldom
fished for just anything that was available but rather specifically sought
(targeted) certain species. Grouping catch data otherwise would seriously
bias catch rate calculations (one index of fishing success), e.g., it would
be erroneous to include fishing effort associated with trips targeting trout
to the CBBT Islands in calcuations for catch rates of tautog at the
location. Bait selection and fishing techniques are significantly different
for each of these species, therefore fishermen would not likely catch one
species while fishing for the other. While exceptions may occur, i.e. an
8

occasional trout caught while one's line is going down rigged for tautog,
the concept of analyzing catch data by appropriate targeted species or
species groups is felt to be the most valid mechanism for meaningful
interpretation of the study results.
All data were entered on the VIMS Prime mainframe computer and analysis
conducted using SPSS-X software packages (SPSS Inc., 1986). Hours of
fishing time were rounded off to the nearest even hour (e.g., 6.5 hrs. was
rounded off to 6 hrs.). When a ~ange of average fish weight was given for
catches, the average of the "range" was used (e.g., 10 tautog caught with an
average weight of 4-6 pounds, the weight was entered into the computer as 5
pounds).
RESULTS AND DISCUSSION
Sample Population of Fishermen
Implementation of various strategies to contact and identify boat
owners fishing artificial reefs and other popular wreck fishing sites in the
Chesapeake Bay and offshore waters resulted in an initial sample population
of approximately 125 fishermen in April 1987 when sampling began. By the
end of the first year's sampling in late November 1987, the identified
population of wreck fishermen had been approximately doubled to 250 boat
owners (Lucy et al. 1988a). The Gwynn Island Test Reef sample population
consisted of 66 fishermen at the end of the 1987 fishing season, reflecting
the special sampling effort initiated to increase data from that site. The
sample population of boat-owning fishermen continued to be expanded in 1988,
totaling 427 individuals by early December 1988 when sampling was completed
for the second and final year of the study. The increased sample population
9

in 1988 (70% greater than 1987 overall) included 97 boat-owning fishermen
associated primarily with fishing the Gwynn Island Test Reef. This specific
group of fishermen, 62% larger than in 1987, was sampled more intensely in
1988 to determine whether such sampling would produce clearer patterns of
fishing preferences (species targeted) and catch rate patterns (see
Methods).
The general sampling program for lower Chesapeake Bay and offshore
sites, excluding the Gwynn Island Test Reef, captured data on 124 and 188
fishing trips in 1987 and 1988, respectively. These trips were made by 56
different boats in 1987 and 110 boats in 1988. The special Gwynn Island
Test Reef sampling effort obtained data on 60 and 83 fishing trips in 1987
and 1988, respectively, representing successful interviews with 40 and 45
different boat owners in each respective season.
General Sampling Program for Lower Chesapeake Bay and Offshore Sites
The general sampling program collected data on fishing trips to
approximately 40 specific wreck fishing locations during each year of the
study. The fifteen most commonly fished sites, indicated in Figure 1 and
Table 2, accounted for 77% and 82% of all trips captured in the general
sampling program in 1987 and 1988, respectively. The Chesapeake Bay Bridge
Tunnel Islands (CBBT Islands) ranked first among all wreck fishing sites
each year, accounting for 18% of all sampled trips in 1987 and 24% in 1988.
The most frequently fished artificial reef was the Chesapeake Light
Tower Reef ranking third overall in relative use compared to all other sites
targeted by boat owners in both study years. Efforts in 1988 to identify
more fishermen utilizing the newest reef, the East Ocean View Reef, were
somewhat successful. The site moved from a very low ranking in frequency of
10

trips in 1987 (2% of all trips sampled) to the fourth most frequently fished
site in 1988 (8% of all trips sampled). This increase in use may also have
been partially the result of the reef being one year old in July 1988,
thereby being more "mature" and more likely to attract fish, at least in the
minds of fishermen. 11 The Cell", a popular wreck fishing site for fishermen
from both sides of Chesapeake Bay, accounted for 11% of fishing trips
sampled in 1988, ranking it second in popularity only behind the Chesapeake
Bay Bridge Tunnel Islands that year. Data on fishing success rates at this
site should provide a useful baseline against which to compare future
fishing experiences if plans for enhancing the site by VMRC are implemented
(M. Meier, personal communication).
Fishing effort parameters (anglers per trip, rod hours fished, etc.)
generally remained more consistent over the two years of the study for sites
in the lower Bay compared to offshore sites (Table 3). Mean fishing effort
(rod hours per trip) varied little between years for sampled trips targeting
the Chesapeake Bay Bridge Tunnel and the Ocean View Reef. Trips to the Cell
exhibited longer fishing periods in 1988 compared to 1987, resulting in an
apparent increase in mean fishing effort at the site in the second year.
Large variances associated with the mean fishing effort estimates, however,
indicated no significant differences likely existed between years.
Examining mean fishing effort per trip for combined trips to key lower
Chesapeake sites, as compared to combined trips to offshore sites, better
distinguished broad differences in fishing patterns between the inshore and
offshore areas (Table 3).
The five most popular lower Bay sites exhibited mean fishing effort per
trip of approximately 13 rod hours during the study years. In contrast,
combined trip data for popular offshore sites indicated greater effort per
11

trip occurred in 1987 compared to 1988. The major factor causing this
distinction in effort between years appeared to be that, on the average,
more fishing rods were fished per fishing party in 1987 (5.0 rods per trip)
than in 1988 (3.4 rods per trip). Man hours fished per trip in 1987 were
also slightly greater than in 1988 (Table 3).
Fishermen's observations on the number of other boats fishing a given
site exhibited large variations for the sample sizes available, making such
estimates useless. Therefore no index was calculated for boat density at
given sites for the season, as attempted in the first study year.
Catch Patterns
Fishermen utilizing wreck fishing sites in Virginia targeted a
relatively small number of species known to have some affinity for submerged
structures. The species in question may use the structure for protection,
orientation, or as a "feeding station" or for any combination of these
factors. The distribution pattern of sampled fishing effort by primary
species targeted clearly illustrates that the species of highest priority
for wreck fishermen was tautog, Tautoga onitis, particularly in the spring
and in late fall (Tables 4 and 5). Tautog generally occur in both desirable
numbers and sizes (approximately 1-5 pounds) inside Chesapeake Bay and
offshore, unlike an associated species the black sea bass, Centropristis
striata. Both species were generally mentioned by fishermen as the target
species group being sought on offshore sites, however, inside the Bay sea
bass generally are young fish and run small in size (a pound or less).
Their numbers inside the Bay are also generally less consistent than
offshore.
12

A
During late spring and summer, other species groups besides tautog
seabass begin to be sought by wreck fishermen. This shift in the overall
pattern of targeted species was most noticeable in 1988 (Table 5). A
greater proportion of wreck fishing trips occurring inside Chesapeake Bay
was captured in the general sampling program that year (52% of all trips
sampled occurred at the more popular lower Chesapeake Bay sites listed in
Table 2 in 1988 compared to only 32% in 1987). Inside the Bay, wreck
fishermen began to shift away from fishing for tautog in May and June,
focusing more on gray trout (weakfish, Cynoscion regalis) and summer
flounder (Paralichthys dentatus). Neither of these species are commonly
thought of as "wreck fish" per~ but are known to feed around and orient to
structure as well as other types of bottom environment. As fishing
progressed into the warm summer months, spot (Leistomus xanthurus) and
croaker (Micropogonias undulatus) also began to receive more attention from
wreck fishermen at lower Bay sites, these species attracting the greatest
relative effort in August and September (Table 5). From mid September into
October, wreck fishermen inside the Bay began to shift their emphasis back
to trout, flounder and tautog. At offshore sites sea bass and tautog
continued to be the major targeted species.
One principal exception to the offshore pattern of fishing involved
amberjack (greater amberjack, Seriola dumerili), which were targeted by
fishermen, especially at the Chesapeake Light Tower, during July and August
and even into September and October. This species represents a relatively
new target fishery for Virginia's offshore fishermen and its growing
popularity was recognized in 1988 by the Virginia Saltwater Fishing
Tournament. For the first time in its history the Tournament program
offered release citations for amberjack having a minimum length of 44
13

inches. Over 450 release citations for amberjack were awarded by the
Tournament for 1988, the largest number of citations for any release
category (VSFT 1988).
Other less significant exceptions to traditional offshore wreck fishing
for sea bass and tautog concerned some bluefish (Pornatomus saltatrix) trips
targeting the Chesapeake Light Tower and lower Chesapeake Bay sites in
spring 1988 (Tables 5 and 13). In addition wreck fishermen targeted king
mackerel (Scomberomorous cavalla) and Spanish mackerel(~. maculatus) on a
few trips to lower Bay sites and the Light Tower Reef (Tables 5 and 15).
The seasonal (annual) pattern of fishing effort according to species
targeted also was strongly influenced by the relative increase in lower Bay
trips captured during the 1988 general sampling program. The sea bass
tautog species group was targeted on nearly 90% of all trips sampled in the
1987 general program compared to only 45% in 1988 (Table 4 and 5). Flounder
and gray trout together were targeted on a total of 25% of all trips sampled
in 1988 while spot and croaker trips accounted for 9% of the total (this
latter species group only accounted for lt of sampled trips in 1987's
general sampling program). Amberjack was targeted on 7% of the 1988 sampled
trips compared to 4% in 1987. Bluefish trips, while not recorded in 1987,
accounted for 4% of 1988 trips. The availability of significant numbers of
legal size (24 inch) striped bass (Morone saxatilis) to Chesapeake Bay
Bridge Tunnel wreck fishermen in November 1988 accounted for 3% of all trips
sampled in that year (Table 5).
Several lower Bay and offshore wreck fishing sites were represented by
enough trips in the general sampling program to allow examination of the
relative contribution made by various species to the overall catch (Table
6). Considering only fish which were kept by fishing parties, tautog
14

t. represented approximately 21% and 40% of total kept fish on 1988 trips to
I
the Chesapeake Bay Bridge Tunnel and The Cell, respectively, but contributed
nothing to catches at the Ocean View Reef (insufficient trips to The Cell
and Ocean View Reef were captured in the 1987 sampling program to warrant
comparisons). Black sea bass, while making only small contributions to kept
catches at lower Bay sites (approximately 2-13%), accounted for 60%-90% of
kept fish taken at the Chesapeake Light Tower Reef and Triangle Wrecks Area
(includes the Triangle Reef). Tautog correspondingly made smaller
contributions in 1988 to offshore site catches than for trips made inshore
to The Cell and CBBT Islands, the only year in which sufficient trips were
captured in the sampling program to make general comparisons. During 1988
flounder contributed approximately 11%-40% by number to total kept catches
at the three inshore wreck fishing sites, being particularly important in
trips to the Cell (40% of kept catches). Croaker strongly dominated 1988
catches only at the Ocean View Reef (76% of kept catch) with flounder the
other major contributing species (16%), Spot and croaker catches together
accounted for approximately 14% of kept catches at the CBBT Islands but were
insignificant at The Cell. Gray trout was significant only at the CBBT
Islands in 1988, representing approximately 22% of all kept fish, similar in
relative importance to tautog catches at the site.
As expected, sea bass catches dominated offshore reef sites with some
contribution also made by tautog, the two species principally targeted at
such sites. Tautog made major contributions in 1988 to two of three Bay
wreck fishing sites for which sampling captured enough trips to allow
meaningful comparisons. Flounder contributed significantly to catches at
all three Bay sites in 1988 with gray trout being a strong component of
catches only at the CBBT Islands. Spot, croaker and bluefish made small
15

.-. .
contributions to catches at the CBBT Islands and the Cell while croaker
accounted for over 75% of kept fish at the Ocean View Reef. Striped bass
catches at the CBBT Islands in November 1988 added a new component to that
site's fishing, resulting in a contribution to overall catches comparable to
that made by either sea bass, spot, croaker, bluefish or flounder.
Catch rate data compiled in the general sampling program is organized
by appropriate target species groups; sea bass-tautog, spot-croaker-trout
flounder, spot-croaker, trout, flounder, amberjack, spanish mackerel, king
mackerel and bluefish (Tables 7-15). These data groups best represent the
pattern of wreck fishing observed on reefs and wreck fishing sites in the
Bay and offshore. The spot-croaker-trout-flounder group is a catch-all
group for Bay sites since any one of the four species has a reasonable
likelihood of being caught while bottom fishing for the other species.
Catch data for all reef and the more popular wreck fishing sites are
presented in Tables 7-15. Small sample sizes for many of the sites cannot
be considered truly representative of a season's fishing at the location.
Such data is shown primarily to provide reef managers with what data was
captured in the study and to allow cursory visual comparisons among a
spectrum of wreck fishing sites. Only those fishing locations for which six
or more fishing trips were captured in the sampling programs during 1987 or
1988 will be discussed in detail, unless otherwise noted.
Sea Bass and Tautog
This species target group was sought at all major reef and wreck
fishing sites in both study years with the exception of the sampling program
not recording such trips to The Cell or the Ocean View Reef in 1987 or the
16

Parramore Reef in 1988 (Table 7). Trips generally occurred most frequently
during the months of April through May (sometimes June) and September
through November, although trips during July and occasionally August were
also captured in the sampling program.
Locations for which sufficient fishing trips were sampled to warrant
comparisons from year to year and between locations within either year were:
CBBT Islands, The Cell, Cape Henry Wrecks, Chesapeake Light Tower Reef,
Triangle Wrecks Reef, Triangle Wrecks Area, combined lower Chesapeake Bay
Sites and combined Offshore Sites (Table 7). Sea bass mean catch rates
(fish per rod hour) were greater in 1988, compared to 1987, at the
Chesapeake Light Tower Reef, the Triangle Wrecks Reefs and Triangle Wrecks
Area. Correspondingly, mean pounds of fish kept per rod hour at these sites
were also greater in 1988 than 1987. Yearly differences in sea bass mean
catch rates were not observed at lower Chesapeake sites (CBBT Islands and
the Cape Henry Wrecks. This distinction in yearly catch patterns between
lower Bay sites and offshore sites (Chesapeake Light Tower Reef, Triangle
Wrecks Reef and Triangle Wrecks Area) was further strengthened by similar
results for yearly comparisons between combined trips to major sites in each
zone. Catch rates (number fish caught and pounds kept per rod hour) were
significantly higher in 1988 than 1987 for combined trips to major offshore
sites (Table 7).
Sea bass catch rate comparisons were also made between locations within
each study year. Popular lower Bay site comparisons were limited in 1987 to
those between the CBBT Islands and Cape Henry Wrecks since no trips
targeting sea bass-tautog were captured by the sampling program for The Cell
or Ocean View Reef. Sea bass catch rates (fish per rod hour) were greater
on trips made to the Cape Henry wrecks than to the CBBT Islands. Greater
17

catch rates (pounds of fish kept per rod hour) were also experienced in 1987
offshore at the Triangle Wrecks Area in comparison to the CBBT Islands
(Table 7), The difference in catch rates was not the result of higher catch
rates at the Triangle Wrecks Area (mean fish per rod hour catch comparisons
were not significant) but attributed to larger fish being caught, the
expected situation with sea bass.
A greater range of site comparisons for sea bass catches was possible
in 1988. While no differences in catch rates could be demonstrated between
lower Bay sites (CBBT Islands, The Cell, and Cape Henry Wrecks), significant
differences in catch rates (fish caught and pounds of fish kept per rod
hour) were observed in most comparisons between inshore and offshore sites
(Table 7, footnote F). Offshore sites demonstrated greater mean catch rates
for numbers caught and pounds kept of fish compared to lower Bay sites. The
Triangle Wrecks Area (includes the Liberty Ships Reef) produced mean catch
rates of 4.0 sea bass per rod hour (5,6 pounds of fish per rod hour)
compared to catches of 1.2-1.3 fish per rod hour at the CBBT Islands and
Cape Henry Wrecks sites (Table 7).
Tautog were caught and kept in greater numbers than sea bass at two
lower Bay sites, the CBBT Islands and The Cell (1988 data only), while the
reverse trend occurred at the Cape Henry Wrecks, somewhat intermediate in
its Bay-offshore orientation. No significant yearly differences in catch
rates were detected at specific major sites inshore or offshore. A
significant decline in mean number of fish caught per rod hour was observed,
however, between years when comparing combined trips to offshore sites
(Table 8). More 0 citation size fish" (minimum weight of 9 pounds) are
caught offshore than in the Bay. Records of the Virginia Saltwater Fishing
Tournament indicate tautog citations declined 98% from 1986 through 1988
18
(VSFT 1986-1988), lending support to the decline in catch rates noted in
this study. Catch rates at major lower Bay sites (number of fish and pounds
of fish kept per rod hour) were greater than at most offshore sites in 1988
and to some extent in 1987. The CBBT Islands supported catch rates higher
than all other major sites tested except for The Cell (1988 data only) and
Cape Henry Wrecks (number of fish caught per rod hour in 1988) (Table 8).
Tautog catch rates in 1988 were greater for lower Bay sites (trips combined)
than Offshore Sites (trips combined) but this was not the case in 1987.
Capturing sea bass-tautog trips to The Cell in 1988 likely contributed to
the differences observed between lower Bay and offshore sites in that year.
Spot, Croaker. Trout and Flounder
This composite group of "bottom fish" was targeted only at lower Bay
sites, excluding the Cape Henry Wrecks. Trout and flounder were each
specified separately as target species while spot and croaker were generally
mentioned as a two-species target unit. Compared to the fishing pattern for
tautog and sea bass at Bay sites, sciaenids and flounder were principally
targeted during summer months (June-August) with trips also made in May and
the September-October period.
Species preference patterns differed seasonally at lower Bay sites,
particularly during the 1988 season. October 1988 was a major fishing
period for trips to the CBBT Islands targeting flounder and to The Cell
targeting spot and trout. Other temporal differences in species preference
patterns at the CBBT Islands and The Cell also occurred in 1988. Fishermen
principally targeted gray trout in May through July at the CBBT Islands but
targeted flounder at The Cell in June and July. Flounder and croaker were
19

-
targeted during June-July at the Ocean View Reef. These different fishing
patterns at Bay sites demonstrated the diversity of fishing opportunities
provided fishermen seasonally by the existing mixture of reefs and wreck
fishing sites in the lower Bay area.
No significant yearly differences in mean catch rates were observed for
spot at any of the Bay sites (excluding comparrisons with Gwynnisland Test
Reef), although sample sizes only provided meaningful comparisons for the
CBBT Islands and combined Lower Chesapeake Bay sites (Table 9). No
differences in catch rates could be demonstrated among the CBBT Islands, The
Cell and The Ocean View Reef in 1988, the only year in which sample sizes
were adequate for statistical comparisons.
Spot catch data, like that of croaker, trout and flounder, was examined
from two perspectives: (1) catches made during trips targeting any of the
four species of the "bottom fish" target group and (2) catches made on trips
targeting only spot-croaker (Table 9). While sample sizes were not
sufficiently large in either study year to warrant statistical comparisons
between the two trip categories at given locations, the data indicate
refinements in catch rate comparisons might be achieved by such data
aggregations. For example, breaking out trips targeting only spot-croaker
(Table 9, lower section) demonstrated that catch rates might have been
higher at the CBBT Islands for such trips than when catch rates were
calculated based upon a broader target spectrum of bottom fish. Sampling
effort capabilities and rate of capture of fishing trips targeting certain
species would determine how much data disaggregation can occur in providing
the most meaningful analysis of catch rates for desirable species.
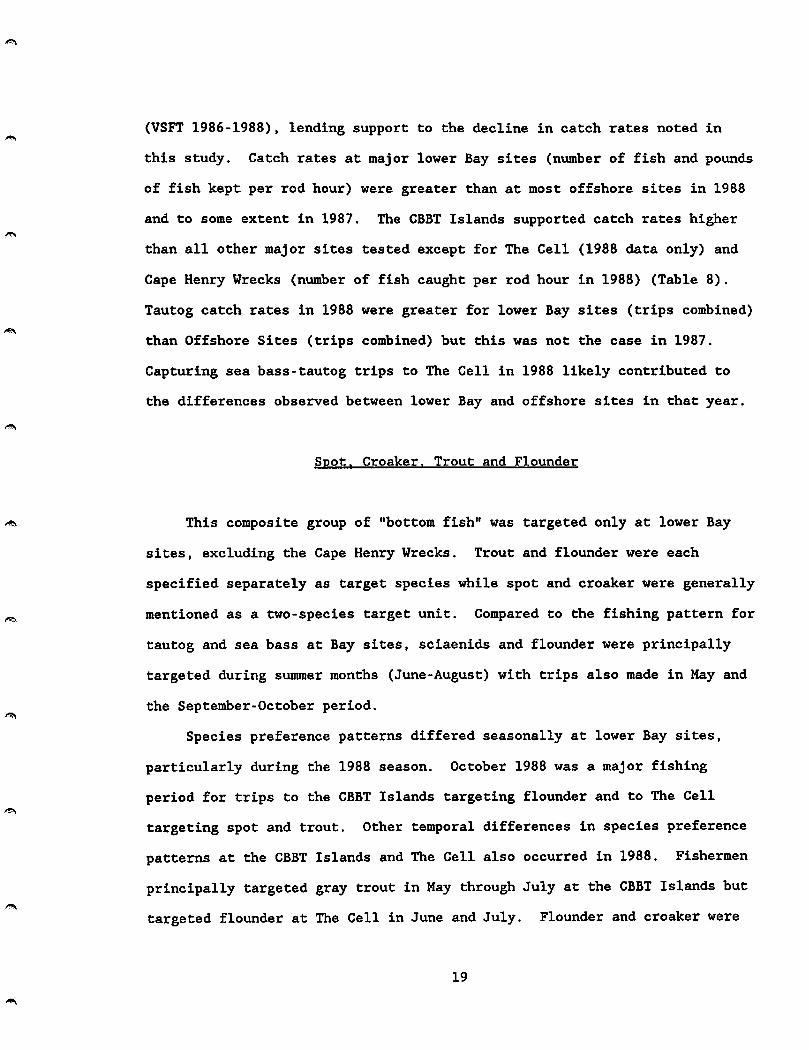
Croaker catch rates exhibited yearly differences at the CBBT Islands,
the only location with large enough sample sizes each year to justify a
20

·""'
comparison (Table 10). Significantly higher 1987 catch rates were also
observed for yearly comparisons between combined trips to major lower
Chesapeake Bay sites. Mean numbers of fish caught and, correspondingly,
pounds of fish kept were significantly greater in 1987 compared to 1988.
Significant differences in mean catch rates (number and pounds per rod hour)
between sites were observed in 1988. The Ocean View Reef produced better
croaker catches than the CBBT Islands or The Cell for trips targeting the
bottom fish group of species. Insufficient sample sizes were available to
making similar site comparisons for trips targeting only spot-croaker (Table
10).
Gray trout (weakfish) mean catch rates did not differ between years for
the CBBT Islands and combined trips to major lower Bay sites (Table 11). As
with spot and croaker small samples sizes in 1987 at The Cell and Ocean View
Reef prohibited yearly comparisons at these two sites. Virginia Saltwater
Fishing Tournament records documented a 49% reduction in Virginia citations
for gray trout (12 pound minimum) from 1986 through 1988 (VSFT 1986-88).
Since the average weight of trout kept on trips sampled in the two years
studied ranged from 1.6-1.8 pounds, study results did not reflect the
obvious decline in "trophy" fish. More intensive sampling in 1988 indicated
that mean catch rates for gray trout at the CBBT Islands exceeded those at
the Ocean View Reef (number per rod hour). In terms of pounds of kept fish
per rod hour, CBBT Island trips produced better catch rates than those to
both the Ocean View Reef and The Cell (Table 11). While few in number,
eight trips targeting gray trout specifically at the CBBT Islands produced
mean catches of 2.5 fish per rod hour and 3.1 pounds of kept fish per rod
hour.
21

Flounder catch rates at wreck fishing sites did not vary significantly
between years at the CBBT Islands or over combined trips to lower Bay sites
(Table 12). Neither were differences in catch rates observed between lower
Bay sites in 1988 when better sample sizes were obtained. Mean weights of
fish kept were approximately two pounds in both study years and only a very
small percentage of catches were released (Table 12). The number of
flounder citations (six pound minimum weight) remained stable during the
study period (VSFT 1986-1988), a trend supporting the constant catch rates
of this study for 1987 and 1988.
Bluefish
Bluefish were targeted on only two wreck fishing trips captured in the
1987 sampling and four trips in 1988 (Table 13). Since bluefish, when
around wrecks or reefs, may be caught incidentally to targeted wreck fish
species, catch rates were determined for the species. Larger bluefish were
caught at offshore than inshore sites. Catch rates ranged only from 0.1
fish per rod hour for non-bluefish trips to 2.0 fish per rod hour when the
species was targeted at a wreck fishing site. Wreck fishing sites are not
normally targeted for bluefish but the species will congregate at a site to
feed on bait fish. Sometimes such congregations of bluefish become a
nuisance to offshore wreck fishermen who may have sea bass catches damaged
by bluefish.
22

Amberjack
Fishing trips targeting amberjacks, principally at the Chesapeake Light
Tower, have increased in frequency during the past few years. The species
was also sought over offshore wrecks and the Chesapeake Light Tower Reef, a
few such trips being captured in the sampling program each year (Table 14).
One of the larger species to frequent wreck and other structures offshore
except for sharks, amberjack provided wreck fishermen with average weights
of keep fish of 40-58 pounds. Generally most fished were released,
particularly since in 1988 the Virginia Saltwater Fishing Tournament began
offering release citations of fish over 44 inches in length (VSFT 1988).
The Chesapeake Light Tower produced 1988 catch rates of 0.6 fish per rod
hour, based upon seven trips captured in the sampling program. The majority
of amberjack trips were made in July and August. Statistical comparisons
for mean catch rates were not made between years or locations within years
because sample sizes were too small.
Spanish Mackerel and King Mackerel
A few trips targeting Spanish and king mackerel were captured in the
sampling program (Table 15). Four Spanish mackerel trips were sampled in
1988 (none were captured in 1987), the third consecutive year that the
species has been abundant in Virginia inshore and offshore waters (VSFT
1988). Three Spanish mackerel trips at the CBBT Islands produced a mean
catch rate of 0.9 fish per rod hour and the fish averaged 2.4 pounds each
(Table 15).
23

King mackerel trips captured in the sampling program occurred
principally at the Cape Henry Wrecks and Chesapeake Light Tower Reef. Mean
catch rates were low, ranging from 0.1-0.2 fish per rod hour with fish
averaging 7 to 15 pounds each. Yearly and within year catch rate
comparisons were not warranted because of small sample sizes.
Striped Bass
Striped bass trips were only captured in the 1988 sampling program. A
regulation moratorium was in place on the species from December 1, 1988
through May 31, 1989. After May 31, fish caught inside Chesapeake Bay could
only be kept if they measured a minimum of 24 inches in total length. A bag
limit was also imposed on recreational fishermen of five such legal size
fish per angler per day (VMRC 1987). Five trips in November 1988 targeting
the CBBT Islands were sampled {Table 15). The mean catch rate was 1.3 fish
per rod hour with kept fish averaging 12.4 pounds each. A release rate of
34% was observed. The possible re-opening of this fishery in July 1990 may
extend and diversify wreck fishing opportunities at the CBBT Islands and
other sites in lower Chesapeake Bay.
Quality Ratings of Fishing Experiences
Fishermen's ratings of fishing experiences for trips to wreck fishing
locations provided a qualitative index of fishing expectations and success
rates at certain popular sites (Table 16). Since fishermen's target species
preferences differed at various wreck fishing sites and even within the
season at a given site, some measure of fishing satisfaction was required to
take such differences and associated expectations into account when
24

evaluating the relative fishing productivity of sites. As with the catch
data analysis, quality rating responses were assessed based on all trips
sampled to a given site and also on the basis of trips targeting certain
species or species groups. The assessment of quality ratings distribution
was seriously hampered by small sample sizes (number of trips made)
associated with some species target groups for certain sites. Only the more
popular wreck fishing sites could be evaluated for quality ratings of
fishing trips because of this limitation.
Without regard to species targeted on trips, the CBBT Islands rated
highest in quality of 1987 fishing experiences, having 30% of 23 trips rated
as being fair to good, 26% as very good, and 26% as excellent. Quality
rating questions were not asked fishermen during interviews until late June.
The resulted in such data being unavailable for many trips to other
locations, e.g. The Cell (on 73% of trips fishermen specified no quality
rating) and the Triangle Wrecks Area (88% of trips were not rated).
Sample data for quality ratings of trips for the 1988 fishing season
was better than in 1987. The Ocean View Reef received a poor rating on 56%
of its 16 trips, the highest percentage of poor ratings for any site
analyzed (Table 16). The fact that this site was only one year old in the
summer of 1988 may have been at least partially responsible for its poor
rating. Fishermen also indicated some problems in holding bottom when
anchoring on the site, another factor that might have contributed to its
poor rating. The Chesapeake Light Tower Reef, the CBBT Islands and The Cell
all received relatively low percentages of poor ratings for trips (11%-19%).
The CBBT Islands and the Chesapeake Light Tower Reef both had 45% of their
45 and 18 trips, respectively, rated as producing fair to good fishing. No
other sites rated as high in these combined categories.
25

The best measure of a site's performance over a fishing season is
likely the proportion of trips which produced 11very good11 to "excellent"
fishing in the opinions of fishermen. The Cell led these combined rating
categories with 52% of 21 trips so-rated in 1988 (Table 16). This site was
followed in the combined very good to excellent categories by the CBBT
Islands and the Chesapeake Light Tower Reef. The Ocean View Reef and
Triangle Wrecks Area were each rated as "very good" on 23%-25% of the 1988
season's trips but received no trip ratings of 11 excellent11• Chesapeake
Light Tower experienced 20% very good to excellent trips, the lowest
relative rating in these combined categories for the six sites analyzed.
Weighting ratings (Table 16B) indicated that when target species sought on
trips were not considered, the sites ranked in fishing quality as follows:
The Cell, CBBT Islands, Chesapeake Light Tower Reef, Triangle Wrecks Area,
Ocean View Reef, and Chesapeake Light Tower.
Contrasting 1988 combined trips to lower Bay sites with those made to
offshore sites, the two broad areas were closely matched in "poor" ratings
(26% and 22%, respectively). In the fair to good combined categories, the
two areas also compared favorably in relative ratings. Lower Bay sites had
relatively more trips (37%) rated in the very good to excellent combined
categories compared to trips to offshore sites (22%), but 18% of trips to
offshore sites were not rated in interviews compared to only 3% for lower
Bay sites. Weighted rating totals indicated that overall combined trips to
lower Bay sites ranked slightly higher in fishing quality than trips to
offshore sites (Table 16A).
Rating of wreck fishing locations based upon trips targeting sea bass
and tautog produced somewhat similar results to those observed when target
species were not taken into consideration. Examining very good to excellent
26

combined ratings for sites, the top rated site for sea bass-tautog trips was
The Cell (60%). Ranking second behind The Cell was the Triangle Wrecks Area
followed by the CBBT Islands and the Chesapeake Light Tower Reef. The Ocean
View Reef and Chesapeake Light Tower tied for last in the weighted ranking
of sites although too few trips for sea bass and tautog were made to these
sites for meaningful comparisons. Lower Bay sites (combined) again ranked
better than offshore sites (Table 16A).
The 1988 rating analysis for trips targeting spot, croaker, trout and
flounder was mixed and difficult to interpret. The Ocean View Reef received
the largest percentage of poor ratings (36%) compared to the Cell (27%) and
the CBBT Islands (17%). Only the CBBT Islands received excellent ratings
(17%) but The Cell received very good ratings for 45% of trips compared to
the Ocean View Reef (36%) and the CBBT Islands (4%). Weighted rating totals
indicated The Cell again received the highest relative rating in this target
species group followed by the CBBT Islands and Ocean View Reef, each of
which were ranked approximately the same.
Trips targeting spot-croaker, trout, and flounder respectively were too
few in number for meaningful comparisons among sites. Weighted combined
lower Bay site ratings, however, indicated that flounder fishing trips in
1988 provided higher rated fishing experiences than either spot-croaker or
trout trips (Table 16A). Trips targeting striped bass in November 1988 and
offshore species, i.e. Spanish and king mackerel and amberjack, were too few
in number at the sites fished for these species to provide meaningful
assessments of fishing quality ratings.
27

Special Sampling Program for Gw,ynn Island Test Reef
Doubling the number of fishermen interviews from ten per sampling
period in 1987 to twenty per period in 1988 produced usable data for 83
trips. This represented a 38% increase in sample size for the site (Table
17). Comparing the relative frequency of seasonal fishing effort captured
each month between years indicated that major increases in sample size
occurred primarily for the months of July, August and September but not for
April, May and June.
Many fishermen indicated during interviews that windy weather prevented
fishing trips planned to the site from mid April through early May.
Fishermen trying to locate the test reef in May discovered that its buoys
had been carried away in storms over the winter. Small temporary buoys were
not placed on the site until late June because of boat scheduling and
weather problems (M. Meier, personal communication). In addition to the
site being difficult to locate for fishermen early in the year, fishermen
also indicated in interviews that they were following up on good fishing
reports from the lower Piankatank and Rappahannock Rivers. They planned to
try the test reef later when fishing at the site would likely be more
productive than during mid spring. The considerable relative decline in
fishing effort in October 1988, in contrast to the previous year, was
attributed to a combination of windy weather, few reports of good tautog
fishing at the site, and the buoys disappearing once again.
Fishing effort parameters (anglers per trip, hours fished, rods fished,
etc.) for each month and the season overall changed somewhat between years
(Table 18). Relative declines in mean fishing effort (rod hours fished per
trip) between years were apparent in June, August and September. Large
variances associated with mean estimates of fishing effort indicated that
28

the slight overall seasonal decline in mean fishing effort was not
significant
Fishing patterns relative to species targeted over the season were
slightly different between years (Table 19). The 1987 sampling program
captured one trip targeting tautog in May and several trips targeting trout
in June and July. A dissimilar pattern was observed in 19.88 with only a few
trips targeting flounder, bluefish and spot captured in the sampling effort
during May and June. Trips targeting trout did not appear in sample
interviews until August, continuing into October when tautog trips began to
occur. The few trips sampled in November 1988 all targeted tautog, following
the same pattern as in 1987 (Table 19).
Bait use patterns at the Gwynn Island Test Reef were not examined in
detail for 1988 since a broad spectrum of baits was consistently utilized by
fishermen. In general, fishermen targeting spot, croaker or trout used
bloodworms, cut bait, squid and peeler crab (or hard crab). Bloodworms, as
as in 1987, were by far the most frequently used bait at the site (Lucy~
al. 1988a). When fishing for tautog in the fall, fishermen utilized hard
crab for bait or occasionally clam.
Numbers of boats fishing the site were not estimated during each month
of the season in 1988, as had been attempted in 1987 (Lucy et al. 1988a).
As with fishermen's estimates of numbers of boats fishing lower Bay and
offshore sites, too much variation occurred in the observations to make the
data reliable.
Targeted species preferences at the site were also reflected in the
distribution of species comprising major components of 11kept" catches (Table
20). During both study years spot dominated catches throughout most of the
fishing season. Croaker and trout catches also contributed consistently to
29

catches in the first half of the 1987 season but not to the same degree in
1988. Trout accounted for a larger proportion of August through October
catches in 1988 compared to the previous year. As previously mentioned,
fishermen were slower to fish the reef in May 1988 compared to 1987 and
primarily targeted flounder or bluefish. This change in fishing pattern was
reflected in the composition of May 1988 catches. Tautog contributed to
catches in October in both years, making a stronger contribution in 1988
than 1987. Black sea bass were not caught on the reef in 1988, making
tautog the only species recorded in November 1988 catches. For the season as
a whole spot accounted for approximately 79%-82% of all kept fish with trout
in a distant but consistent second place. Croaker supplied approximately 5%
of the catch in 1987 and 2% in 1988 while tautog also contributed 2% of the
kept catch in 1988. While not caught in great numbers in 1988, scup,
whiting and northern puffers were also taken at the reef from July into
October, occurring in greater numbers than in 1987.
Catch Patterns
Catch rates for major species sought at the Gwynn Island Test Reef were
analyzed based upon the same target species groups utilized for lower Bay
sites. Spot, the major species contributing to catches at the Gwynn Island
site, generally exhibited consistent mean catch rates between years for each
month of the season for combined trips targeting spot, croaker, trout and
flounder. Catch rates (pounds of fish kept per rod hour) in September 1987,
however, were greater than those for the same month in 1988 (Table 21).
Since mean weights of fish kept were only slightly different in the two
study years for September catches (0.8 pounds in 1987 and 0.7 pounds in
1988), the differences can only be attributed to catches of a few large spot
30

-
in 1987. The one month of distinctive catch rates between years for spot
did not result in significantly different catch rates for the season
overall. Breaking out trips targeting spot and croaker only indicated that,
while catch rates were slightly improved over the more general target
species grouping, significant differences in catch rates between years did
not exist {Table 21).
Croaker, caught in much fewer numbers than spot, also exhibited a
pattern of mean catch rates over the season similar to that for spot.
Significant differences in mean catch rates {number caught and pounds kept
per rod hour) only occurred between years in September for combined trips
targeting the composite "bottom fish" group (Table 22). Catch rates were
higher in September 1987 compared to the same period in 1988, Average
weights of kept croaker were also greater in September 1987 than September
1988. The one month of different catch rates was not sufficient to result
in significant differences in catch rates between years for the season as a
whole, regardless of target species preferences.
Gray trout catch patterns were slightly more distinctive between years
than either spot or croaker (Table 23). Mean catch rates (number caught and
pounds kept per rod hour) were significantly different between years for
July catches at the test reef. The higher catch rates of July 1987 resulted
in significant differences between 1987-1988 seasonal catch rates for trout
when examining combined trips targeting spot, croaker, trout and flounder.
Analyzing the small number of trips specifically targeting trout did not
reveal distinctive seasonal catch rates between years (Table 23). This may
have been partially the result of smaller sample sizes in the latter
analysis.
31

Because fishermen targeted the reef site for bluefish on several trips
and incidental bluefish catches occurred when they were bottom fishing for
sciaenids and flounder, bluefish catch rates were examined separately (Table
24). Catch rates were low with catches occurring primarily in May and June.
A few fish averaging four to eight pounds each were caught at the site
during this period in 1988 compared to only August 1987 catches of small
bluefish, all of which were released. Bluefish contributed to the diversity
of catches in spring 1988 but were largely incidental to the major fishing
activity at the site.
Sea bass and tautog, principally the latter species, were targeted at
the reef only in October and November, except for one trip made in July 1988
when no fish were caught (Tables 25 and 26). Unfortunately only a small
number of such trips were captured in the sampling program each year. The
population of fishermen who pursue tautog at the site in the cooler and more
windy fall weather is much smaller than that fishing the site during summer
months. In addition, weather conditions reduce the frequency of trips that
can be made to the site by those seeking tautog. This combination of
factors naturally produced small sample sizes in the random sampling
program.
Mean catch rates for tautog (number of fish caught and pounds kept per
rod hour) appeared to improve from 1987 to 1988 but the small sample sizes
failed to demonstrate statistically significant differences in catch rates
between months or the seasons overall for the two years of the study (Table
26). For the few trips targeting tautog captured in the sampling program
each season, mean catch rates were three times higher in 1988 and fish
averaged four pounds compared to 0.6 pounds in 1987. Improved catches in
1988, although not shown to be statistically higher than those in 1987, were
32

also suggested by reports obtained from R&R Bait and Tackle shop in Hudgins,
Virginia, where tautog fishermen bought bait and compared fishing
experiences (R. Belcher, personal communication).
Incidental sea bass catches also occurred at the reef in 1987 when
fishermen were seeking tautog with the majority of the catches released
because of fish averaging less than one pound in weight. No catches of even
small sea bass were recorded in the 1988 sampling program (Table 25),
Quality Rating of Fishing Experiences
Fishermen's quality ratings for trips to the test reef site indicated
that when not considering targeted species preferences, 1988 produced
slightly better quality fishing for the season than in-1987 (Table 16 A,B).
The fact that quality ratings were not requested from fishermen until late
in June 1987 affected the yearly comparison. If the fishing quality
question had been included in interviews at the beginning of the 1987
sampling program, the comparative seasonal ratings would have been closer.
For example, if the 271 of 1987 trips for which quality ratings were not
specified had been rated only as 11 fair 11 by fishermen interviewed, the 1987
total seasonal rating would have been the same as that for 1988. Therefore
it must be concluded that, in general, fishing quality during 1987 was rated
approximately as high as in 1988,
The same pattern existed for quality rating comparison~ between years
for the bottom fishing target species group of spot, croaker, flounder and
trout (Table 16 A,B). Examining trips specifically targeting only spot and
croaker indicated that slightly better satisfaction was gained by fishermen
seeking these species during 1987 compared to 1988, even when allowing for
1987 trips for which quality ratings were not obtained. This result may be
33

affected by the 11very good" spot catches made on the reef in October 1987
(Table 21) which were not matched by catches in the same period in 1988.
Unfortunately small sample sizes in October '88 prevented detecting
significant differences in mean catch rates for the months between years.
Quality ratings for trout trips to the reef indicated that fishermen
were better satisfied with catches in 1988 although, in general, catch rates
were slightly higher in 1987 (Table 16 A,B). Release rates were lower in
1988, possibly contributing to the slightly better rating (Table 23),
Ratings for sea bass-tautog trips, primarily targeting tautog in
actuality, were difficult to compare between years because of small sample
sizes and the fact that half of the 1987 trips were not rated for quality.
In spite of these problems, it can be stated that 1988 likely produced
somewhat higher satisfaction for tautog fishermen than the previous year,
given the observed weights of fish caught that year (Table 26). This
conclusion is based upon the observation that if all of the three 1987
tautog trips had been rated "very good" for fishing, the total rating for
the season (28.3) would still have been less than that for 1988 (Table 16
A,B). Only if these 1987 trips had each been rated as "excellent11 would the
1987 total rating for tautog trips (33.3) have exceeded that for 1988.
Gl'lYJln Island Test Reef, Lower Bay and Offshore Sites
The Gwynn Island Test Reef, being further up Bay than other popular
wreck fishing sites sampled in the study, was compared to other sites to
determine whether catch rates of targeted species were similar or different
within each study year (Table 28). During 1988 spot catch rates (mean fish
per rod hour) were higher at the Gwynn Island site than at other lower Bay
sites having large enough sample sizes for meaningful comparisons, i.e. The
34

Cell, Ocean View Reef, CBBT Islands and combined trips to these sites. Spot
were targeted on a greater percentage of trips to the Gwynn Island Reef
(53%-1987, 76%-1988) than at other sites in the lower Bay (Table 5 and 19).
Corresponding to higher catch rates for spot in terms of numbers of fish
caught per unit fishing effort, the Gwynn Island sites also produced more
pounds of spot caught per rod hour than other lower Bay sites. Spot catch
rates at the Gwynn Island Test Reef in 1987 were only significantly higher
than those for combined trips to lower Bay sites and not different from
those at the CBBT Islands (Table 28).
Croaker and trout catches at the Gwynn Island site were not as
consistent as spot, nor were these species targeted as frequently by
fishermen. Comparisons with lower Bay sites indicated the test reef
produced lower mean catch rates for croaker than the Ocean View Reef in 1988
and at the CBBT Islands and combined trips to lower Bay sites in 1987 (Table
28). Mean catch rates for croaker in 1988 were not different from those
determined for trips to the CBBT Islands, The Cell and lower Bay sites
combined. Trout catch rates at the Gwynn Island Reef in 1988 exhibited a
similar pattern to croaker when compared to other lower Bay sites. In 1987
no differences in trout catch rates were observed between the Gwynn Island
Test Reef, the CBBT Islands and combined trips to lower Bay sites (Table
28). Comparisons for flounder were not warranted since the species was only
caught on several trips at Gwynn Island in each study year,
Sea bass and tautog catch rates at the Gwynn Island site were more
difficult to compare to other lower Bay and offshore sites because of small
sample sizes at the test reef. Sea bass were only caught in small numbers
at Gwynn Island in 1987 and none caught in trips sampled during 1988.
Because sea bass catches were also sporadic in both years at other lower Bay
35

sites, no significant differences could be shown for sea bass catches
between any of the Bay sites. In 1988 the Gwynn Island Test Reef produced
no sea bass catches, this "zero catch rate" being significantly lower than
those at the Chesapeake Light Tower Reef and Triangle Wrecks Areas offshore.
The same problems occurred with tautog catch rate comparisons between
lower Bay and offshore sits. Only in 1987 were tautog catch rates
significantly lower at the Gwynn Island Test Reef compared to those at the
CBBT Islands, Otherwise, significant differences could not be demonstrated
between the test reef and other sites (Table 28). Larger sample sizes were
needed at the test reef site to make meaningful comparisons between tautog
catch rates at the various lower Bay and offshore sites.
Comparing fish quality ratings for trips made to the Gwynn Island Test
Reef and other lower Bay and offshore wreck fishing sites indicated that the
site ranked about in the middle of group when target species were not
considered (Tables 16B and 27B). Since quality ratings were not obtained
during interviews in the early portion of the 1987 fishing season, the 1988
season provided better comparisons between sites. Ignoring target species
preferences and combining all trips for respective sites in 1988, the Gwynn
Island Test Reef exhibited a weighted total quality rating of approximately
24 (Table 27B). This rating was exceeded by comparable ratings given The
Cell, the CBBT Islands and the Chesapeake Light Tower Reef. The Gwynn
Island site weighted rating exceeded that for the Triangle Wrecks Area, the
Ocean View Reef and the Chesapeake Light Tower (Table 16B).
Comparing fishing quality ratings on a target species basis indicated
that the Gwynn Island site ranked slightly lower than other lower Bay sites
combined. This was the case for trips targeting "bottom fish" (spot,
croaker, trout and flounder), spot and croaker, trout only, and flounder
36

only (Tables 16B and 27B). Comparisons based upon sea bass-tautog trips
ranked the Gwynn Island Test Reef higher than all sites except The Cell.
Ratings for such trips were obviously responsible for pulling up the ranking
of the site when target species preferences were ignored.
Comparing 1987 Study Results with Monitoring Study
Fishermen were interviewed for this study during the 1987 fishing
season while a monitoring study of the test reef site was also being
undertaken by researchers from Old Dominion University (Feigenbaum et al.
1988). The objectives and designs of the two studies were quite different
but some brief comparisons of results are appropriate. Fourteen randomly
scheduled trips to the reef site in the monitoring study (Feigenbaum et al.
1988), taking into account month and tidal cycle, produced catch rate data
on the reef for key species similar in magnitude to that documented for
fishermen (Lucy et al. 1988). Spot catch rates (mean number of fish caught
per rod hour) ranged from 1.0 to 5.2 in the study targeting fishermen with a
seasonal rate of 3.2 fish per rod hour (Lucy et al. 1988) compared to catch
rates of 1.9-2.3 spot per rod hour in the monitoring study (Feigenbaum et
al. 1988). Seasonal croaker catch rates (0.2 fish per rod hour) were lower
in the study of fishermen's catches than in the monitoring study (1.2
croaker per rod hour) but sea bass catch rates were similar in magnitude (0-
1.2 fish per rod hour from August through November compared to 0.4-0.8 fish
per rod hour in the monitoring study). A higher seasonal catch rate of
"desirable species" (spot, croaker, gray trout, flounder, bluefish, sea bass
and tautog) was observed in the study of fishermen's catches (4.2 fish per
rod hour) compared to 1.7 desirable fish per rod hour in the monitoring
study. The difference is likely attributed to the fact that fishermen
37

specifically targeted certain species and fished the test reef site longer
during trips than possible in the monitoring study. The former study was
also able to obtain data from fishermen on 60 trips during the season
compared to the monitoring study's 14 trips.
The monitoring study documented oyster toadfish utilizing the test reef
sites (Feigenbaum et al. 1988). Catches of this "trash fish" were not
mentioned in 1987 random telephone interviews of fishermen (Lucy et al.
1988). It was found that fishermen did not consider catches of toadfish to
be worthy of mention in 1987, but by specifically asking about such catches
in 1988, mean catch rates of up to 0.2 toadfish per rod hour were documented
with all but an occasional fish released.
In general fishing patterns and seasonal availability of species were
found to be similar in both studies. Both studies documented the popularity
of the site for local fishermen. The study of fishermen's experiences on
the test reef indicated that the quality of fishing was rated fair to good
(Lucy et al. 1988), an element not measured in the monitoring study
(Feigenbaum et al. 1988). The results of the two studies complimented each
other and helped clarify some of the local aspects of reef fishing which
make a site useful to fishermen.
CONCLUSIONS
The sampling program initiated by the study has provided the VMRC
Artificial Reef Program with a workable system for assessing fishing success
rates on existing and newly established artificial reefs. The concepts
developed in the study also provided a mechanism for comparing recreational
fishermen's experiences on artificial reefs with those customarily obtained
38

at other popular "wreck fishing" sites. This facet of the project opened up
new opportunities for evaluating fishing productivity of artificial reef
sites as viewed through the eyes and fishing experiences of reef users.
Distinctions in target species preferences of fishermen were clearly
demonstrated for various reef sites in the Bay as well as offshore. The
important contribution of sciaenids (spot, croaker and trout) to Bay reef
fishing was documented, particularly for the Gwynn Island Test Reef and
Ocean View Reef. The lack of sea bass and tautog at the Ocean View Reef
indicated that the igloo structures forming the reef do not provide the
necesary habitat to attract and hold these species. A mix of structures and
materials at different test reef sites attract both species in the Bay,
particularly tautog in the fall. The study results suggested that
diversifying materials on the Ocean View Reef could enhance the mix of
species available there.
The fishing experience quality rating component of the study provided
valuable insight into how fishermen evaluate wreck fishing experiences.
Catch rates, consistency of the site in producing desirable fish, and size
of fish caught all played important roles in determining the quality of
fishing experiences at a site. Remarks from fishermen utilizing the Ocean
View Reef and Gwynn Island Test Reef also indicated that difficulties
encountered in locating or fishing a site, i.e. buoys missing, bottom hard
to hold, etc., affected use rates and quality of fishing experiences.
Ranking popular wreck fishing sites in terms of their fishing quality rating
strongly supported planned enhancement of The Cell site by the VMRC Reef
Program. This site consistently ranked above existing artificial reefs in
the Bay in terms of quality of fishing experiences.
39

A
Increasing the sampling effort for the Gwynn Island Test Reef and
concentrating efforts on identifying a greater number of lower Bay fishermen
targeting wreck fishing sites produced better sample data in 1988 for the
Gwynn Island site as well as the CBBT Islands, Ocean View Reef and The Cell.
The increased sampling effort at the Gwynn Island site, however, was not
able to overcome weather and missing buoy problems in 1988 to produce larger
sample sizes for May, June and October. This in~icated the negative impact
such factors can have on implementing any sampling program dependent upon
obtaining catch data from fishermen. On the positive side, identifying more
fishermen targeting The Cell in 1988 provided an excellent opportunity to
compare future fishing experiences at the proposed enhan~ed site with those
documented in 1988.
Analyzing catch data in the study by species groups provided a
mechanism to compare fishing sucess rates at sites in a way tpat may prove
meaningful to fishermen and fishery managers. This concept provided another
tool that reef managers can utilize to evaluate established sites and, more
importantly, explain the results of their projec~s to fishermen. This type
of analysis also pointed out the need to expand sample sizes to derive
better information from data collected.
The study also provided much new visability for Virginia's Artifiical
Reef Program. It also established a core of wreck fishermen which, once
updated, could be utilized in the future to provide catch assessments on
existing, modified or new reef sites. The study results established a
baseline of catch information on popular wreck fishing sites, including
artificial reefs, which should prove useful in examining fishing benefits
associated with reef site modifications planned for the future.
40

Figure 1. Locations of artificial reefs and other popular wreck fishing
sites in lower Chesapeake Bay and offshore waters of Virginia.
41

76°50'
76'50'
76'00'
~ ,.~
t • • . h-~
Chesapeake
Bay
76"00'
4
• Tugbost Wnick
75°20'
• Pa,amo19 Tnt Reel • Paramo .. Reel
Trianglo Wnicka RMI•
• Ch8,ap,auU1htTo-r • Ught ToMr Roof
• Santore Wnick
38"00'
37"00'
75"20'

Table 1. Description of Chesapeake Bay and offshore "wreck fishing" sites and artificial reefs targeted most frequently by fishermen interviewed in 1987 and 1988.a
Fishing Site
Ches. Bay Bridge Tunnel
The Cell
Ches. Light Tower Reef
E. Ocean View Reef
Triangle Wrecks Reef
Triangle Wrecks Area
Ches. Light Tower
Location Water Depth {Ft.)
Mouth of Ches. Bay {N36°54.3'; W75°42.8') NOAA Chart 12221
Buoy R"WT211 off mouth of Hunger Creek. Eastern Shore {LORAN C 41598/27245 approx.) NOAA chart 12221
Center of Reef approx. 0.6 nm WSW of Ches. Light Tower; {LORAN C 41286.2/27103.0 - 4 60'X 80' drydock sections); NOAA Chart 12221
2500 yards west of entrance to Little Creek. Norfolk and 900 yards off beach; originally known as
0 "ODU" reef; (N36 56.5'; W76°12.2') NOAA Chart 12256
Vicinity of 11GA11 Buoy marking NE corner of reef (N37°00':W75°21.5') NOAA Chart 12200
Vicinity of 11GA11 Buoy marking NE corner of area. including Liberty Shigs Reef (N37°00'; W75 21.5'); area approx. 3 miles x 2 miles; NOAA Chart 12200
Approx. 13 nm off Virginia Beach. Rudee Inlet (N36°S4.3'; W75°42.8') NOAA Chart 12221
25'-100'
44' with as little as 3' clearance
60'-80'
28'
100 1
1001
45'-55'
42
Material-Structure
Completed 1964; 17.6 miles long; 12 miles trestled roadway; 2 mile-long tunnels with granite boulder islands at ends (4 islands)
Navy degauzing station abandoned late 1940 1s or early 1950's; concrete. timber. pipes
Established in 1970 and expanded periodically; variety of structures, e.g. tire-in concrete units, drydocks, landing craft, pontoon sections etc; VMRC Reef Program took over from Tidewater Artificial Reef Assoc. of VA
40 concrete igloos set in clusters of 3-4 units over 5 acre site; igloos have 7 foot profile; established 1987 by VMRC Reef Program
4 Liberty Ships sunk in mid 1970 1s {Webster, Garrison, Haviland, Clark) by VMRC Reef Program
John Morgan {Liberty Ship); Lillian Luckenbach bulk carrier sunk in collisions 1943 plus other wrecks, Navy landing craft, etc.; 4 Liberty Ships sunk as reef 1974-1977
Built 1965 to replace Chesapeake Light Ship; stands on 4 piles 117' above water

Table 1. (continued)
Fishing Site Location
Santore Wreck Approx. 3.3 nm west of Ches. Light Tower; LORAN C - 41277.7/ 27117.1; NOAA Chart 12221
Water Depth (Ft.}
47'
Concrete Ships Immediately offshore of Kiptopeke forming breakwater for former ferry dock. just north of Cape Charles. Eastern Shore; NOAA Chart 12221
Cape Henry Wrecks Wrecks and obstructions located N to NE of Cape Henry Light approx. 2 nm off beach; Chilore -LORAN C 41294.2/27180.3) marked by "2CH" Buoy; NOAA Chart 12221
Tugboat Wreck
Cape Charles Wreck
Parramore Reef
Approx. 4-5 nm off Cavalier Hotel. Virginia Bch.; N36°51.8'; W75°S3.8' NOAA Chart 12221
Approx. 2.5 m NW Plantation Light (approx. LORAN C 41487/27233; NOAA Chart 12221
Approx. 8.7 run from Parramore Coast Guard Tower immed. NW of "R-1011 Buoy off Wachapreague Inlet. Eastern Shore; LORAN C 41746.3/ 27095.5 (Page); 41744.0/ 27096.0 (Mona Island); NOAA Chart 12210
27 I
50'
so•
40 1-60'
72'-75'
Parramore Test Reef
Approx. 3.8 nm from 72 1-75' Parramore Coast Guard Tower; LORAN C 41747.5/ 27125.2 and 41741.0/ 27126.1; NOAA Chart 12210 appears to have sanded in and difficult to locate for many fishermen
43
Material-Structure
Freighter sunk 6-17-42 by mine from German U-boat
Concrete hull ships made during World War II
Chilore wreck - bulk carrier sunk 7-24-42 (550' long)
Shown as two obstructions on chart
May be steel hull vessel Peconic sunk 7-15-50
2 Liberty ships sunk in mid 1970 1s by VMRC Reef Program with assistance of Seaside Sports Fishing Improvement Assoc.
Established by ODU as experimental site in June 1983 under contract to VMRC; concrete pipe stacks and 6 concrete igloos

Table 1. (continued)
Fishing Site
Cape Charles Test Reef
Gywnn Island Test Reef
Location Water Depth (Ft.)
NNW of entrance to 29 1-38' Cherrystone Inlet and east of Buoy C-12; LORAN C 41541.2/27231.0 and 41539.4/27230.8; buoys hard to maintain and difficult to locate for many fishermen; NOAA Chart 12221
Approx. 1.3 run NE of "Hole in the Wall" off southern tip of Gwynn Island; LORAN C - 41637.2/ 27299.4; NOAA Chart 12235
22'
Material-Structure
Established by ODU as experimental test reef site June 1983; 6 concrete igloos and stacks of concrete pipe
Established by ODU as experimental test reef in June 1984; 89 tire in concrete units. 6 concrete igloos. modified tire modules
alnformation compiled from Lucy (1983.1988); Meier et. al. (1985); Feigenbaum et. al. (1986); VMRC (1989); C. Ward (personal communication); U.S. Coast Guard (personal communication); Chesapeake Bay Bridge and Tunnel District Office (personal communication); background information on local wrecks compiled by J.G. Robinson. Peninsula Salt Water Sport Fishermen's Association in 1970 (mimeograph, personal communication); listing of mid-Atlantic wrecks compiled by J. Cummings (personal communication).
44

Table 2. Distribution of fishing effort among lower Chesapeake Bay and offshore "wreck fishing" sites targeted most frequently by boat owners interviewed during 1987 and 1988 (excluding trips to Gwynn Island Test Reefa).
Targeted Fishing Sites
Ches. Bay Bridge Tunnel Islands
The Cell
Chesapeake Light Tower Reef
E. Ocean View Reef
Triangle Wrecks Area (Liberty Ships & other wrecks)
Triangle Wrecks Reef
Chesapeake Light Tower
Santore Wreck
Concrete Ships
Cape Henry Wrecks
Tugboat Wreck (off Va. Beach)
Cape Charles Wreck
Parramore Reef
Parramore Test Reef
Cape Charles Test Reef
Fishing Trip Interviews 1987 (N=l24 trips) 1988 (N=l88 trips) No. Rel. Freq. No. Rel. Freq.
23
4
11
3
16
10
4
1
2
9
7
1
2
2
1
18%
3
9
2
13
8
3
1
2
7
5
1
2
2
1
45
21
18
16
13
5
10
8
5
6
0
4
0
3
1
24%
11
10
8
7
3
5
4
3
3
2
2
1
ain 1987 boat owners identified as targeting the Gwynn Island Test Reef were included in the general sampling program for all wreck-fishing sites, as well as singled out and sampled separately {Lucy et al. 1988); in 1987 the general sampling program captured 14 trips targeting the Gwynn Island Reef {11% of the total trips captured in sampling); in 1988 sampling of Gwynn Island Reef fishermen remained totally separate from that for all other
.wreck fishing locations. 0 Relative distribution of fishing effort among all wreck-fishing sites targeted by fishermen during the sampling program in 1987 and 1988, respectively; non-artificial reef sites receiving less than three trips in either year's sampling program are not listed (23% and 18% of all trips sampled in 1987 and 1988, respectively).
45

Table 3. Fishing effort parameters of sampled trips targeting lower Chesapeake Bay and offshore "wreck fishing" sites in 1987 and 1988.
Fishing Effort Parameters (mean and S.D.) Anglers Hours Fished Rods Fished Rod Hours
Total8 Per Trip Per Trip Per Trip Per Trip Location Trips 1987 1988 1987 1988 1987 1988 1987 1988
Ches. Bay Br. 23/45 2.8 2.8 4.6 4.0 3.2 3.1 14.5 13.1 Tunnel Islands (0.6) (1.2) (1.8) (1.9) (1.4) (1.8) (10.4) (7.3)
The Cell 4/21 2.8 3.2 4.2 5.2 3.0 3.6 11.0 19.0 (1.0) (1.1) (1. 7) (2.3) (1.8) (1.2) (6.2) (10.6)
Ches. Light 11/18 2.8 2.8 3.9 3.2 4.4 3.4 18.6 12.3 Tower Reef (1.3) (1.2) (1.5) (1.9) (2.6) (1. 7) (16.1) (13.0)
E. Ocean View 3/16 2.0 2.9 2.7 2.3 2.7 3.0 7.7 7.6 Reef ( 0 ) (1.2) (1.5) (1.8) (0.6) (1.0) (5.1) (8.0)
Triangle Wrecks 10/5 3.8 3.6 4.8 5.6 5.8 3.6 25.2 20.4 Reef (1.1) (1.1) (1.6) (1.8) (4.0} (1.1) (12.0} (9.6)
Triangle Wrecks 16/13 3.5 3.5 5.4 5.0 5.6 3.5 30.3 18.8 Area (1.0} (1. 7) (2.1) (2.2) (3.5} (1.5} (22.4) (12.0}
Ches. Light 4/10 2.8 2.7 3.0 2.9 4.2 2.9 13.8 9.1 Tower (1.0) (1.4) (0.8) (1.4) (2.6} (1.2} (12.2) (7.0)
Santore Wreck 1/8 2.0 3.0 3.0 3.9 4.0 3.6 12.0 13.0 (---) (0.9) (---) (2.1) (---) (2.0) (----) (8.4)
Concrete Ships 2/5 2.5 2.6 5.5 3.8 3.5 2.6 20.5 9.2 (0.7) (0.6} (3.5) (3.0) (0.7) (0.6) (16.3) (5.8)
Cape Henry 9/6 2.4 3.3 3.4 2.7 3.0 3.5 11.0 9.0 Wrecks (0.5) (0.5} (1.9) (1.0} (0.9) (0.6) (8.3) (2.4)
'<!'\
Tugboat Wreck 7/0 3.3 4.1 5.3 20.6 (1.0) (2.0) (2.1) (8. 7)
Cape Charles 1/4 3.0 2.8 1.0 4.2 3.0 3.2 3.0 12.5 Wreck (---) (1.0) (---) (2.4) (---) (1.0) (----) (6.2)
Parramore Reef 2/0 4.0 2.0 4.5 9.0 co. 7) ( 0 } (0.7) (1.4)
Parramore Test 2/3 3.0 5.0 1.0 4.0 3.0 6.7 3.0 12.5 Reef ( 0 ) (1.0) ( 0 ) (2.0) ( 0 ) (3.1) ( 0 ) (26.6)
---------------------------------------------------------------------------------------
46

Table 3. (continued)
Location Tota18
Trips
LowerbChes. Bay 41/93 Sites
Offshore Sitesc 39/49
Fishing Effort Parameters (mean and Anglers Per Trip
1987 1988
2.6 (0.7)
3.2 (1.1)
2.9 (1.1)
3.0 (1.4)
Hours Fished Rods Fished Per Trip Per Trip
1987 1988 1987 1988
4.2 (1.9)
4.4 (1.9)
3.9 (2.2)
3.7 (2.0)
3.1 (1.2)
5.0 (2.9)
3.2 (1.4)
3.4 (1.6}
8Total trips sampled in 1987 and 1988. respectively.
S.D.) Rod Hours
Per Trip 1987 1988
13.2 13.0 (7 .8) (10.2}
23.1 13.5 (18.2} (11.3}
bCombined trips to CBBT Islands. The Cell, E. Ocean View Reef. Concrete Ships. Cape Henry Wrecks.
cCombined trips to Ches. Light Tower Reef. Triangle Wrecks Reef and Area, Ches. Light Tower. Santore Wreck. Tugboat Wreck.
47

~
~
Table 4. Distribution of 1987 fishing effort by targeted species for trigs made to lower Chesapeake Bay and offshore "wreck fishing" sites (excludes Gwynn Island Test Reef).
Total Targeted SEecies b - 1987 Month Trips Sea Bass Tautog Flounder Trout Spot Croaker Amberj ack Other
February 1 --% 100% --% --% --% --% --% --%
March 3 100
April 18 94 6
May 17 12 69 19
June 13 31 54 8 8
July 16 50 50
August 12 50 25 25
September 13 23 38 8 31c
October 26 35 62 4C
November 5 2 80 ----------------------------------------------------------------------------Season 123 27 61 2 1 1 4 4C
aincludes trips to sites listed in Table 1 (96 trips) and trips to less frequented sites captured in the sampling program, e.g. the Tiger, Powell, and Hanks wrecks offshore and locations in the Bay such as a barge (C-10 buoy) and plane wreck off Cape Charles, etc.
bif several "targeted species" were specified during an interview, the first species mentioned was considered the principal species sought.
cKing mackerel trips (4% of sample for season).
48

Table 5. Distribution of 1988 fishing effort by targeted species for trigs made to lower Chesapeake Bay and offshore "wreck fishing" sites (excludes Gwynn Island Test Reef).
Tarseted S2eciesb- 1988 Month Trips Sea Bass Tautog Flounder Trout Spot Croaker Amberjack Other
April 13 8% 66% --% --% --% --% --% 31%c
May 35 17 63 --% 17 3C
June 19 16 11 53 11 5 5
July 21 14 5 19 29 5 14 14
August 19 5 5 11 16 11 37 16c
September 23 35 4 9 22 9 17d/4e
October 32 41 9 28 9 3 3 6c
November 25 32 36 4 5 lc/20f
----------------------------------------------------------------------------Season 187 23 25 14 11 6 3 7 11c-f
a Includes trips to sites listed in Table 1 (155 trips) and trips to other less frequented sites captured in the sampling program. e.g. the Tiger. Ricks. and Doxy Girl wrecks offshore and locations in the Bay such as a plane wreck off Cape Charles. obstructions near Fort Monroe. the Hampton Roads Bridge-Tunnel islands, etc.
bif several "targeted species" were specified during an interview. the first species mentioned was considered the principal species sought.
cBluefish trips (4% of sample for season).
dKing mackerel trips (2% of sample for season).
eSpani~h mackerel trips (2% of sample for season).
£Striped bass trips (3% of sample for season).
49

)
V1 0
) } ) } )
Table 6. Relative contribution of species to the total "kept" catch for the E. Ocean View Reef. Chesapeake Bay Bridge Tunnel Islands. Chesapeake Light Tower Reef. and Triangle Wrecks Area.
Relative Freguency {%) No. a No. Kept b Tautog Sea Bass Spot Croaker Bluefish Other
Location
E. Ocean View Reef
Trips
3/16
Fish
NAc/171
1987 1988 1987 1988
0 4.6
1987 1988 1987 1988 1987 1988 1987 1988
3.5 76.0 0 15.7d
Ches. Bay Br. Tunnel Islands
23/45 1307/1002 35.8 21.4 13.0 6.8 5.2 8.6 31.7 5.6 3.9 7.4 1.od 50.0e
The Cell 4/21
Ches. Light 11/18 Tower Reef
Triangle Wrks. Area
16/13
NA/291
289/558 37.4
382/1023 11.3
39.8 1.7
6.9 60.6 88.0
1.4 88.7 92.8
0
0
0.6
0
0
0
0
1.7
0
0
0.3
0
5.5
0
1.0
~umber of fishing trips sampled in 1987 and 1988. respectively. Total number of fish recorded as "kept" for trips sampled in 1987 and 1988. respectively.
~Not appropriate since sample size too small to be representative of site. Flounder.
0
eGray trout - 21.6%: flounder - 11.2%; striped bass - 8.4%: Spanish mackerel - 5.0%: sea mullet -1.6%; oyster toadfish - 0.8%; sand shark - 0.4%; conger eel {Conger oceanicus) - 0.4%; false
£albacore {Euthynnus alletteratus) - 0.2%. Flounder - 40.2%; porgy (scup. Stenatomus chrysops) - 5.2%; gray trout - 4.4%: northern puffer {Sphoeroides maculatus) - 0.6%.
:spanish mackerel. Spanish mackerel - 3.8%; amberjack - 0.5%; king mackerel - 0.4%: spiny dogfish (Sgualus acanthias) -
.0.4%. 1i.ing cod (Urophycis chuss) - 4.2%; gray trout - 0.4%.
)

Table 7. Sea bass catches on trips targeting sea bass-tautog at lower Chesapeake Bay and offshore "wreck fishing" sites in 1987 and 1988.
SEA BASS--TARGET SPECIES: SEA BASS-TAUTOG Catchl, No. No. Total Mean Wt. Release Catch8
Trips Rod Hours .Kept Kept (lbs) Rate(%) Rate (lbs) Rate (ii) Location 1987 1988 1987 1988 1987 1988 1987 1988 1987 1988 1987 1988 1987 1988
""" Ches. Bay 15 14 253 118 65 49 1.4 1.5 56 68 0.4e 0.6f 0.6e 1.3f Br. Tun. Is.
The Cell 0 10 146 0 100 of o.2f
Ches. Light 9 12 161 139 175 438 1.2 2.2 15 4 1.2 1.1*f 1.3 3.3*f Tower Reef
Ches. Light 3 1 47 15 41 0 1.5 --- 0 0 1.3 0 0.9 0 Tower
"" E. Ocean 0 3 12 0 --- 0 --- 100 --- 0 0.5 View Reef
Tri.Wrks .Rf. 9 5 236 102 192 500 2.0 1.5 0 12 1.6 7.4*£ 0.8 5.6*f
Tri. Wrks. 14 13 460 244 291 884 2.0 1.5 0 9 1.3e 6*f 0.6 4.o*f 5. ""' Area
Santore Wrk. 0 6 76 90 1.3 43 1.5 2.1
Cape Henry 7 6 51 54 84 66 1.2 1.0 34 0 2.0 1.2f 2.5e 1.2£ Wrecks
~
Cape 1 3 3 34 0 0 --- --- 0 --- 0 0 0 0 Charles Wreck
Parramore 2 3 6 88 15 550 2.0 0.9 73 24 5.0 5.5 9.2 8.2 Test Reef
Parramore 2 0 18 --- 125 --- 1.0 --- 32 --- 6.9 --- 10.0 ---Reef -----------------------------------------------------------------------------------------
51

Table 7 (continued).
SEA BASS--TARGET SPECIES: SEA BASS-TAUTOG Catch8 No. No. Total Mean Wt. Release
Trips Rod Hours Kept Kept (lbs) Rate(%) Rate (lbs) Location 1987 1988 1987 1988 1987 1988 1987 1988 1987 1988 1987 1988
Lower Ches. 22 34 304 336 149 115 1.3 1.2 Bay Sites C
Offshgre 32 32 808 474 521 1412 1. 7 1.7 Sites
aPounds caught per rod hour (kept fish only).
b Catch per rod hour for kept and released fish combined.
46 54 0.6 0.4f
8 11 1.1 5.2*f
Catchb Rate (ii)
1987 1988
1.0 0.9f
0.7 3.4*f
cCombined trips to CBBT Islands, The Cell, E. Ocean View Reef, Cape Henry Wrecks.
dCombined trips to Ches. Light Tower Reef, Ches. Light Tower, Triangle Wrecks Reef and Area, Santore \.Jreck.
Statistical test results (Mann-Whitney U-Test, corrected for ties).
* ' Catch rates significantly different between years (P~0.05).
8 1987 catch rates significantly different (P~0.05): CBBT Is. vs. Cape Henry Wrecks; CBBT Is. vs. Tri. Wrks. Area.
f1988 catch rates significantly different (P<0.05): CBBT Is. vs. Ches. Light Tower Reef and Tri. Wrks. Area: Ches. Light Tower Reef-vs. Cape Henry Wrecks and The Cell; The Cell vs. Tri. Wrks. Reef, Tri. Wrks. Area, and Offshore Sites; Lower Ches. Bay Sites vs. Offshore Sites.
52

Table 8. Tautog catches on trips targeting sea bass-tautog at lower Chesapeake Bay and offshore "wreck fishing" sites in 1987 and 1988.
TAUTOG--TARGET SPECIES: SEA BASS-TAUTOG Catch8 l,
No. No. Total Mean Wt. Release Catch Trips Rod Hours Kept Kept (lbs) Rate(%) Rate (lbs) Rate (/#)
Location 1987 1988 1987 1988 1987 1988 1987 1988 1987 1988 1987 1988 1987 1988
Ches. Bay 15 14 253 118 418 214 2.7 3.7 3 9 4.5e 6.7f 1. 7e 2.of Br. Tun. Is.
The Cell 0 10 146 116 3.7 2 3.0f o.8£ ~
Ches. Light 9 12 161 139 108 39 3.5 3.7 3 0 2.3 1.0£ 0.7e 0.3f Tower Reef
Ches. Light 3 1 47 15 4 0 3.5 --- 82 0 0.3 of 0.5 of Tower
~
E. Ocean 0 3 12 0 --- --- 0 0 0 View Reef
Tri. Wrks. Rf. 9 5 236 102 23 0 3.2 36 100 0.3e of 0.2e O.lf
Tri. Wrks. 14 13 460 244 39 15 4.6 5.5 40 40 0.4e 0.3£ O.le O.lf ~ Area
Santore Wrk. 0 6 76 21 5.0 0 1.4 0.3
Cape Henry 7 6 51 54 6 31 2.5 3.0 0 0 0.3e 1.7£ O.le 0.6 Wrecks
""' Cape 1 3 3 34 0 32 --- 2.7 100 29 0 2.5 0.3 1.3 Charles Wreck
Parramore 2 3 6 88 2 30 3.0 4.5 0 17 1.0 1.5 0.3 0.4 Test Reef
Parramore 2 0 18 --- 0 --- --- --- 0 --- 0 0 Reef -----------------------------------------------------------------------------------------
53

Table 8 (continued).
TAUTOG--TARGET SPECIES: SEA BASS-TAUTOG
Location
Lower Ches. Bay Sites C
Offshgre Sites
No. Trips
1987 1988
22 34
32 32
No. Rod Hours 1987 1988
304 336
808 474
Total Kept
1987 1988
424 361
285 75
a Pounds caught per rod hour (kept fish only).
Mean Wt. Release Catch8
Kept (lbs) Rate(%) Rate (lbs) 1987 1988 1987 1988 1987 1988
2.7 3.6 3 6 3.8 1.lf
3.4 4.4 17 12 1.2e 0.7f
b Catch per rod hour for all kept and released fish combined.
Catch Rate (ii)
1987 1988
1.4 3.9f
0.4e o.2*f
cCombined trips to CBBT Islands. The Cell. E. Ocean View Reef. Cape Henry Wrecks.
dCombined trips to Ches. Light Tower Reef. Ches. Light Tower. Triangle Wrecks Reef and Area. Santore Wreck.
Statistical test results (Mann-Whitney U-Test. corrected for ties).
* Catch rates significantly different between years (P!0.05).
e1987 catch rates significantly different (P!0.05): Light Tower Reef. Tri. Wrks. Reef. Tri. Wrks. Area. vs. Offshore Sites: Ches. Light Tower Reef vs. Tri. Tri. Wrks. Reef and Tri. Wrks. Area.
CBBT Is. vs. Cape Henry Wrecks, Ches. and Offshore Sites: Cape Henry Wrecks Wrks. Reef: Lower Ches. Bay Sites vs.
fl988 catch rates significantly different (P<0.05): The Cell vs. Tri. Wrks. Reef, Tri. Wrks. Area. and Offshore Sites: CBBT Is. vs-: Cape Henry Wrecks. Ches. Light Tower Reef, Tri. Wrks. Reef, Tri. Wrks. Area, and Offshore Sites: Lower Ches. Bay Sites vs. Tri. Wrks. Reef, Tri. Wrks. Area, and Offshore Sites.
54

Table 9. Spot catches for trips targeting "bottom fish" (spot-croaker-trout-flounder) and spot-croaker only at lower Chesapeake Bay "wreck fishing" sites in 1987
Location
and 1988.
SPOT--TARGET SPECIES: SPOT-CROAKER-TROUT-FLOUNDER
No. Trips
1987 1988
No. Rod Hours 1987 1988
Total Kept
1987 1988
Mean Wt. Release Catch Kept (lbs) Rate(%) Rate (lbs) 1987 1988 1987 1988 1987 1988
Catch Rate (ti)
1987 1988
Ches. Bay Bridge Tunnel Is.
7 23 72 323 68 63 1.1 0.8 42 39 1.1 0.2 1.6 0.3
The Cell
E. Ocean View Reef
Concrete Ships
2
3
1
11
11
4
14 253
23 77
9 40
0
0
0
2
6
0.8
0.5
0 --- ---
0
0
0 0
0 0
0 100 0
0
0 0.1
0 0 0.2
Lower Che9. 13 Bay Sites
49 118 693 68 71 1.1 0.7 42 40 0.6 0.1 1.0 0.2
SPOT--TARGET SPECIES: SPOT-CROAKER
Ches. Bay 3 4 29 41 68 50 1.1 0.8 27 44 2.6 0.9 3.2 2.2 Bridge Tunnel Is.
The Cell 0 3 62 2 0.8 0 oc oc
E. Ocean 2 7 21 45 0 6 0.5 0 0 0 0.1 0 0.1 View Reef
Concrete 0 0 --- --- --- --- --- --- --- --- --- --- --- ---Ships ----------------------------------------------------------------------------------------Lower Ches. Bay Sites
5 14 50 148 68 58 1.1 0.7
:Pounds caught per rod hour (kept fish only).
27 41 1.5 0.3 1.9 0.7
Catch per rod hour for kept and released fish combined. ~Fish caught but catch rate!. 0.05 (catch rates rounded off to nearest 0.1).
Combined trips to CBBT Islands. The Cell. E. Ocean View Reef, Concrete Ships.
55
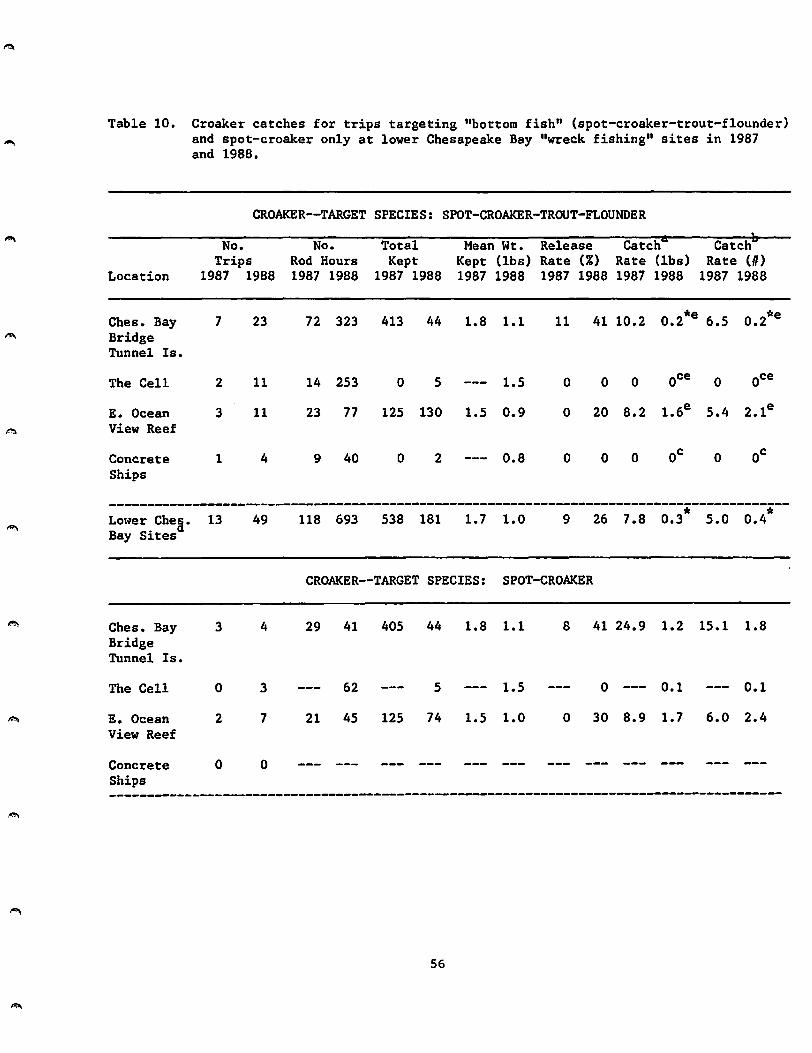
~
~
~
Table 10. Croaker catches for trips targeting "bottom fish" (spot-croaker-trout-flounder} and spot-croaker only at lower Chesapeake Bay "wreck fishing" sites in 1987 and 1988.
CROAKER--TARGET SPECIES: SPOT-CROAKER-TROUT-FLOUNDER
No. No. Total Mean Wt. Release Catch Catch Trips Rod Hours Kept Kept (lbs) Rate(%) Rate (lbs) Rate(#)
Location 1987 1988 1987 1988 1987 1988 1987 1988 1987 1988 1987 1988 1987 1988
Ches. Bay 7 23 72 323 413 44 1.8 1.1 11 41 10.2 o.2*e 6.5 o.2*e Bridge Tunnel Is.
The Cell 2 11 14 253 0 5 1.5 0 0 0 oce 0 oce
E. Ocean 3 11 23 77 125 130 1.5 0.9 0 20 8.2 1.6e 5.4 2.le View Reef
Concrete 1 4 9 40 0 2 --- 0.8 0 0 0 oc 0 oc Ships
-------~--~---------------------------------------------------------------------------7.8 * * Lower Chea. 13 49 118 693 538 181 1.7 1.0 9 26 0.3 5.0 0.4
Bay Sites
CROAKER--TARGET SPECIES: SPOT-CROAKER
Ches. Bay 3 4 29 41 405 44 1.8 1.1 s 41 24.9 1.2 15.1 1.8 Bridge Tunnel Is.
The Cell 0 3 62 5 1.5 0 0.1 0.1
E. Ocean 2 7 21 45 125 74 1.5 1.0 0 30 8.9 1.7 6.0 2.4 View Reef
Concrete 0 0 --- --- --- --- --- --- --- --- --- --- --- ---Ships -----------------------------------------------------------------------------------------
56

~-
Table 10 (continued).
CROAKER--TARGET SPECIES: SPOT-CROAKER-TROUT-FLOUNDER
Location
No. Trips
1987 1988
No. Rod Hours 1987 1988
Total Kept
1987 1988
Mean Wt. Release Catch Kept (lbs) Rate(%) Rate (lbs) 1987 1988 1987 1988 1987 1988
Catch Rate(#)
1987 1988
Lower Ches. Bay Sites
5 14 50 148 530 123 1.7 1.1 6 34 18.2 0.9* 11.3 1.2*
a Pounds caught per rod hour (kept fish only).
b Catch per rod hour for kept and released fish combined.
cFish caught but catch rate~ 0.05 (catch rates rounded off to nearest 0.1).
dCombined trips to CBBT Islands. The Cell. E. Ocean View Reef. Concrete Ships.
Statistical test results (Mann-Whitney U-Test. corrected for ties).
* Catch rates significantly different between years (P~0.05).
8 1988 catch rates significantly different (P~0.05): CBBT Is. vs. E. Ocean View Reef; The Cell vs. E. Ocean View Reef.
57

~
Table 11. Gray trout c·atches for trips targeting "bottom fish" (spot-croaker-troutflounder) and gray trout only at lower Chesapeake "wreck fishing" sites in 1987 and 1988.
GRAY TROUT--TARGET SPECIES: SPOT-CROAKER-TROUT-FLOUNDER
No. No. Total Mean Wt. Release Catch Catch Trips Rod Hours Kept Kept (lbs) Rate(%) Rate (lbs) Rate (fl)
Location 1987 1988 1987 1988 1987 1988 1987 1988 1987 1988 1987 1988 1987 1988
Ches. Bay 7 23 72 323 103 216 2.0 1.5 47 17 2.9 1.of 2.7 o.at Bridge Tunnel Is.
The Cell 2 11 14 253 0 13 3.6 0 0 0 0.2£ 0 oc
E. Ocean 3 11 23 77 0 0 0 0 0 of 0 of View Reef
Concrete 1 4 9 40 23 13 1.0 2.0 0 0 2.6 0.7 2.6 0.3 Ships ---------~---------------------------------------------------------------------------Lower Ches. 13 49 118 693 126 242 1.8 1.6 42 15 2.0 0.6 1.8 0.4 Bay Sites C
GRAY TROUT--TARGET SPECIES: GRAY TROUT
Ches. Bay Bridge Tunnel Is.
The Cell
1 8
1 2
12 102 102 214 2.0 1.5
8 20 0 9 --- 3.9
47 17 17.0 3.1 16.0 2.5
0 0 0 1.8 0 0.4
Lower Ches. 3d 12e 29 142 125 230 1.8 1.6 42 16 7.8 2.5 7.4 1.9 Bay Sites
a bPounds caught per rod hour (kept fish only). Catch per rod hour for kept and released fish combined.
~Combined trips to listed sites. Includes one "trout" trip to the Concrete Ships.
:Includes one "trout" trip each to the Concrete Ships and the E. Ocean View Reef. 1988 catch rates significantly different (P!.0.05): CBBT Is. vs. The Cell and E. Ocean View Reef
58

"'"I
Table 12. Flounder catches for trips targeting "bottom fish" (spot-croaker-troutflounder) and flounder only at lower Chesapeake Bay "wreck fishing" sites in 1987 and 1988.
TARGET SPECIES: SPOT-CROAKER-TROUT-FLOUNDER
No. No. Total Mean Wt. Release Catch Catch Trips Rod Hours Kept Kept (lbs) Rate(%) Rate (lbs) Rate (II)
Location 1987 1988 1987 1988 1987 1988 1987 1988 1987 1988 1987 1988 1987 1988
Ches. Bay 7 23 72 323 10 100 1.9 2.1 29 8 0.3 0.6 0.2 0.3 Bridge Tunnel Is.
The Cell 2 11 14 253 14 117 1.5 2.4 0 0 1.5 1.1 1.0 0.5
E. Ocean 3 11 23 77 0 22 2.4 0 19 0 0.7 0 0.4 View Reef
Concrete 1 4 9 40 0 49 --- 2.5 0 0 0 3.1 0 1.2 Ships
---------------------------------------------------------------------------------------Lower Ches. 13 49 118 693 24 228 1.7 2.3 14 5 0.3 1.0 0.2 0.4 Bay Sites C
TARGET SPECIES: FLOUNDER
Ches. Bay 3 11 31 180 5 99 3.1 2.1 0 5 0.9 1.1 0.5 0.6 Bridge Tunnel Is.
The Cell 1 6 6 171 14 116 1.5 2.3 0 0 3.5 1.6 2.3 0.7
E. Ocean 1 3 2 24 0 10 3.1 0 17 0 1.3 0 0.5 View Reef
Concrete 0 3 28 48 --- 2.5 0 --- 4.3 --- 1.7 Ships ---------------------------------------------------------------------------------------Lower Ches. 5 23 39 403 19 273 1.9 2.3 0 2 0.9 1.5 0.5 0.7 Bay Sites
:Pounds caught per rod hour (kept fish only). Catch per rod hour for kept and released fish combined.
cCombined trips to listed sites.
59

Table 13. Bluefish catches for trips targeting desirable species (spot-croaker-trout-sea bass-tautog-flounder-bluefish-Spanish mackerel-king mackerel-amberjack) and bluefish only at lower Chesapeake Bay and offshore "wreck fishing" sites where bluefish were caught in 1987 and 1988.
BLUEFISH--TARGET SPECIES: ALL DESIRABLE SPECIES e No. No. Total Mean Wt. Release Catch4 Catch Trips Rod Hours Kept Kept (lbs) Rate(%) Rate (lbs) Rate (fl)
Location 1987 1988 1987 1988 1987 1988 1987 1988 1987 1988 1987 1988 1987 1988
Ches. Bay 21 41 301 493 36 74 1.5 2.0 0 41 0.2 0.3 0.1 0.3 '""I Br. Tun. Is.
The Cell 3 21 34 399 1 16 7.0 1.5 0 0 0.2 0.1 oc oc
Ches. Light 11 18 205 221 1 0 9.0 0 0 oc 0 oc 0 Tower Reef
Ches. Light 4 10 55 91 0 32 --- 9.9 0 20 0 3.5 0 0.4 Tower
Concrete 2 5 41 46 1 0 3.2 --- 67 0 0.1 0 0.1 0 Ships
Triangle 7 5 168 102 12 11 15.5 10.7 0 0 1.1 1.2 0.1 0.1 Wrks. Reef
Triangle 13 13 401 244 12 11 15.5 10.7 8 0 0.5 o.s oc oc Wrks. Area
Cape Henry 9 6 99 54 24 0 2.0 --- 0 0 0.5 0 0.2 0 Wrecks ----------------------------------------------------------------------------------------Lower Che5. 38 88 498 1085 62 90 1.8 1.9 3 37 0.2 0.2 0.1 0.1 Bay Sites
Offshore 36 49 817 660 13 43 15.0 10.1 7 16 0.2 0.7 oc 0.1 Sites e
60

Table 13 (continued).
BLUEFISH--TARGET SPECIES: BLUEFISH
Lower Ches. Bay Sites
52 6 2 12 5.1 1.2
Ches. Light Tower
0 2 8 8 6.5
aPounds caught per rod hour (kept fish only).
b Catch per rod hour for kept and released fish combined.
50 0 0.2 2.5
50 --- 6.5
cFish caught but catch rate~ 0.05 (catch rates rounded off to nearest 0.1).
0.1 2.0
2.0
dCombined trips to CBBT Islands, The Cell, E. Ocean View Reef (3 trips - 1987; 15 trips - 1988, on which no bluefish were caught), Concrete Ships. Cape Henry Wrecks.
eCombined trips to Ches. Light Tower Reef. Light Tower. Triangle Reef Wrecks and Area. Santore Wreck (1 trip - 1987; 8 trips - 1988 on which no bluefish were caught).
£Combined trips to Concrete Ships (1) and The Cell (1).
Scombined trips to CBBT Islands (1) and E. Ocean View Reef (1).
61

Table 14. Amberjack catches for trips targeting amberjack at offshore "wreck fishing" sites in 1987 and 1988.
AMBERJACK--TARGET SPECIES: AMBERJACK
No. No. Total Mean Wt. Release Catch Catch Trips Rod Hours Kept Kept (lbs) Rate(%) Rate (lbs) Rate (/J)
Location 1987 1988 1987 1988 1987 1988 1987 1988 1987 1988 1987 1988 1987 1988
Santore 0 1 12 9 --- 35.0 --- 0 --- 26.2 --- 0.8 Wreck
Ches. Light 1 7 8 68 0 3 --- 58.0 0 93 0 2.6 0 0.6 Tower
Ches.Light 1 3 36 63 0 3 --- 50.0 0 50 0 2.4 0 0.1 Tower Reef
Tri. Wrks. 2 0 25 --- 4 --- 40.0 --- 50 --- 6.4 --- 0.3 ---Area
Offshore 69 143 4 15 40.0 42.6 50 73 2.3 4.5 0.1 0.4
a Pounds caught per rod hour (kept fish only).
b Catch per rod hour for all fish (kept and released).
cCombined trips to listed sites.
62

Table 15. Spanish mackerel. king mackerel and striped bass catches for trips targeting these species. respectively. at "wreck fishing" sites in 1987 and 1988.
No. No. Total Mean Wt. Release Catch Catch Trips Rod Hours Kept Kept (lbs) Rate(%) Rate (lbs) Rate (fl)
Location 1987 1988 1987 1988 1987 1988 1987 1988 1987 1988 1987 1988 1987 1988
SPANISH MACKEREL--TARGET SPECIES: SPANISH MACKEREL
Ches. Bay 0 3 --- 50 --- 47 --- 2.4 0 --- 2.2 --- 0.9 Br. Tun. Is.
Santore 0 1 --- 16 2 --- 2.0 0 --- 0.2 --- 0.1 Wreck
KING MACKEREL--TARGET SPECIES: KING MACKEREL
Santore 1 0 12 4 12.0 --- 0 -- 4.0 --- 0.3 ---Wreck
Cape Henry 2 0 48 8 7.0 --- 0 --- 1.2 --- 0.2 ---Wrecks
Ches. Light 1 2 8 16 0 2 --- 15.0 0 0 0 1.9 0 0.1 Tower Reef
Offshore Sites
24 16 4 2 12.0 15.0 0 0 2.0 1.9 0.2 0.1
STRIPED BASS--TARGET SPECIES: STRIPED BASS
Ches. Bay 0 5 --- 107 --- 89 12.4 --- 34 --- 12.0 --- 1.3 Br. Tun. Is.
a Pounds caught per rod hour (kept fish only).
b Catch per rod hour for all fish (kept and released).
cCombined trips sites listed plus Tugboat Wreck (1).
d Chesapeake Light Tower Trips (2).
63

Table 16A. Distribution of fishing quality ratings for certain lower Chesapeake Bay and offshore "wreck fishing" sites with and without consideration for species targeted on trips in 1987 and 1988 {sites fished less than 10 times overall in the sampling program are not listed).
Relative Freguencz of Fishing gualitz Rating No. Poor Fair Good Very Good Excellent Unspecified
Location Trips a 1987 1988 1987 1988 1987 1988 1987 1988 1987 1988 1987 1988 ""'
TARGET SPECIES NOT CONSIDERED
Ches. Bay 23/45 4% 16% 13% 29% 17% 16% ---% 4% 26% 31% 39% 4% Br. Tun. Is.
The Cell 4/21 19 25 10 25 19 38 14 50
Ches. Light 4/10 25 30 30 10 10 75 20 Tower
Ches. Light 11/18 9 11 9 28 9 17 17 17 73 11 Tower Reef
E. Ocean 3/16 --- 56 67 19 25 33 View Reef
Tri. Wrks. 16/13 --- 38 6 31 23 6 88 ""' Area
------------------~-----------------~----------------------------------------------------Lower Cheg. 41/93 7 26 12 17 24 16 2 18 17 19 37 3 Bay Sites
AO!\ Offshore 39/49 8 22 2 16 8 20 14 2 8 79 18 Sites C
TARGET SPECIES: SEA BASS-TAUTOG
Ches. Bay 15/14 7 21 13 38 13 7 7 27 14 40 14 Br. Tun. Is.
The Cell 0/10 10 20 10 30 30
Ches. Light 3/1 100 100 1!11\\ Tower
Ches. Light 9/12 -- 8 11 42 11 8 17 78 17 Tower Reef
E. Ocean 0/3 100 View Reef
""' 64

Table 16A (continued).
Relative Frequency of Fishing Quality Rating No. Poor Fair Good Very Good Excellent
Location T . a rips 1987 1988 1987 1988 1987 1988 1987 1988 1987 1988
Tri. Wrks. 14/13 --Area
Lower Ches. 22/34 14 Bay Sites
Offshore 32/32 ---Sites C
Ches. Bay 7/23 Br. Tun. Is.
The Cell 2/11
E. Ocean 3/11 View Reef
TARGET SPECIES: SEA BASS-TAUTOG (continued)
38 31 23 7
29 14 24 14 10 4 21 23 17
19 3 22 3 16 12 9
TARGET SPECIES: SPOT-CROAKER-TROUT-FLOUNDER
17 14 35 29 26 4 14 17
27 50 27 45
36 67 27 36
Unspecified 1987 1988
93 8
31 10
94 22
43
50
33
---------------------------------------------------------------------------------------------Lower Che&• 13/49 --- 24 15 18 31 24 22 8 10 46 Bay Sites
TARGET SPECIES: SPOT-CROAKER
Ches. Bay 3/4 25 67 50 20 25 Br. Tun. Is.
The Cell 0/3 67 33
E. Ocean 2/7 29 100 43 29 View Reef ---------------------------------------------------------------------------------------------Lower Ches. 5/14 --Bay Sitesc
36 80
65
36 21 20 7

Table 16A (continued).
Relative Frequency of Fishing Quality Rating Poor Fair Good Very Good Excellent
Location No. Tripsa 1987 1988 1987 1988 1987 1988 1987 1988 1987 1988
Ches. Bay 1/8 Br. Tun. Is.
The Cell 1/2
Lower Ches. 3?12f --Bay Sites
Ches. Bay 3/11 ---Br. Tun. Is.
The Cell
E. Ocean View Reef
1/6
1/3
Lower Ches. 5/23 --Bay Sitesc
25
so 100
25 33
9 33
67
17 20
TARGET SPECIES: TROUT
25 25
50
25 25
TARGET SPECIES: FLOUNDER
55 18
33
26 17
8
9
67
33
30
25
17
9
9
Unspecified 1987 1988
100
67
67
100
100
80
8Number of trips sampled in 1987 and 1988, respectively, for targeted species groups indicated.
bincludes sites listed plus trips to Concrete Ships and Cape Henry Wrecks.
cincludes sites listed plus trips to Santore Wreck and Tugboat Wreck (1987 only).
dCombined trips to listed sites.
eincludes one "trout" trip to Concrete Ships.
f Includes one "trout" trip each to Concrete Ships and E. Ocean View Reef.
66

Table 16B. Weighted quality ratings for certain lower Chesapeake Bay and offshore "wreck fishing" sites with and without consideration for species targeted on trips in 1988.
Weighted Quality Ratings
~ Location Poor Fair Good Very Good Excellent Total Rank
TARGET SPECIES NOT CONSIDERED
Ches. Bay 1.6 5.8 4.8 1.6 15.5 29.3 2
"" Br. Tunn. Is.
The Cell 1.9 2.0 5.7 15.2 7.0 31.8 1
Ches. Light 3.0 9.0 4.0 5.0 21.0 6 Tower
""I Ches. Light 1.1 5.6 5.1 6.8 8.5 27.1 3 Tower Reef
E. Ocean 5.6 5.7 10.0 21.3 5 View Reef
""' Tri. Wrks. 3.8 9.3 9.2 22.3 4 Area -----------------~-------------------------------------------------------------Lower Ches. 2.6 3.4 4.8 7.2 9.5 27.5 l Bay Sites
~
Offshore 2.2 3.2 6.0 5.6 4.0 21.0 2 Sites
TARGET SPECIES: SEA BASS-TAUTOG ".!.'\
Ches. Bay 2.1 7.6 2.1 2.8 7.0 21.6 3 Br. Tun. Is.
The Cell 1.0 4.0 3.0 12.0 15.0 35 1 A
Ches. Light 10.0 10.0 5 Tower
Ches. Light 0.8 8.4 3.2 8.5 20.9 4 Tower Reef
67

Table 16B (continued).
Weighted Quality Ratings Location Poor Fair Good Very Good Excellent Total Rank
TARGET SPECIES: SEA BASS-TAUTOG {continued)
E. Ocean 10.0 10.0 5 View Reef
Tri. Wrks. 3.8 4.4 4.8 4.8 4.5 22.3 2 '"°I Area
Lower Ches. 2.9 4.8 3.0 8.4 8.5 27.6 1 Bay Sites
Offshore 1. 9 4.4 4.8 4.8 4.5 20.4 2 ~ Sites
TARGET SPECIES: SPOT-CROAKER-TROUT-FLOUNDER
Ches. Bay 1.7 7.0 7.8 1.6 8.5 26.6 2 Br. Tun. Is.
The Cell 2.7 8.1 18 28.8 1
E. Ocean 3.6 8.1 14.4 26.1 3 View Reef
~
Lower Ches. Bay Sites 2.4 4.8 7.2 8.8 5.0 28.2
TARGET SPECIES: SPOT-CROAKER
"" Lower Ches. Bay Sites 2.4 3.6 7.2 8.8 5.0 27.0
TARGET SPECIES: TROUT
~ Lower Ches. Bay Sites 2.5 5.0 1.5 3.2 8.5 26.7
TARGET SPECIES: FLOUNDER
Lower Ches.
"" Bay Sites 1.7 5.2 5.1 12 4.5 28.5
8weighted values obtained by assigning values of 10.20.30.40.50 to respective quality rankings (poor. fair. good. very good. excellent) and multiplying
b!asfgned values times relative frequencies in Table 16A. • Same as in Table 16A.
68

Table 17. Distribution of fishing effort sampled at Gwynn Island Test Reef !!", in 1987 and 1988.
Fishins Effort No. Trifs Rel. Freg,. Rod-Hours Rel. Freg.
Month 1987 1988 1987 1988 1987 1988 1987 1988
May 4 4 6.7% 4.8% 10 31 1.4% 3.8%
June 7 5 11.7 6.0 104 44 14.9 5.4
July 11 22 18.3 26.5 88 207 12.6 25.6
August 11 21 18.3 25.3 157 247 22.5 30.5
September 7 22 11.7 26.5 93 180 13.3 22.2
October 17 6 28.3 7.2 227 66 32.6 8.2
November 3 3 5.0 3.6 18 34 2.6 4.2 ----------------------------------------------------------------------------Season Total 60 83 697 809
"""I
69

Table 18. Fishing effort parameters of sampled trips targeting the Gwynn RI Island Test Reef in 1987 and 1988.
Fishing Effort Parameters (mean and S.D.) Anglers Hours Fished Rods Fished Rod Hours
Total8 Per Trip Per Trip Per Trip Per Trip -"" Month Trips 1987 1988 1987 1988 1987 1988 1987 1988
May 4/4 2.5 2.0 1.8 3.0 2.5 2.5 2.5 7.8 (0.6) (0.0) (1.0) (1.4) (0.6) (0.6) (1.4) (4.9)
"'I June 7/5 3.6 2.4 3.7 2.8 3.7 2.8 14.9 8.8 (2.0) (2.1) (2.0) (1.1) (1.8) (1.8) (11. 7) (8.7)
July 11/22 2.8 3.1 2.6 2.7 2.9 3.4 8.0 9.4 (1.3) (1.3) (1.3) (1.1) (1.3) (1.5) (6.5) (6.0)
"""' August 11/21 3.6 3.2 3.6 3.1 3.7 3.4 14.3 11.8 (1.2) (1.6) (1.9) (1. 7) (1.1) (1.8) (9.1) (10.8)
September 7/22 3.4 3.0 3.4 2.7 3.7 2.9 13.3 8.2 (1.5) (1.3) (1.8) (1. 7) (1.4) (1.3) (8.9) (6.3)
~ October 17 /6 3.3 3.7 3.5 2.8 3.4 3.8 13.4 11.0 (1.4) (1.0) (1. 7) (1.3) (1.4) (0.8) (10.8) (5. 8)
November 3/3 2.3 2.3 2.7 4.3 2.3 2.3 6.0 11.3 (0.6) (0.6) (1.2) (3. 2) (0.6) (0.6) (2.0) (11.0)
--------------------------~---------------------------------------------------n,,, Season 60/83 3.2 3.0 3.2 2.9 3.3 3.2 11.6 9.8
(1.4) (1.4) (1.7) (1.5) (1.3) (1.4) (9.3) (7.7)
8Total trips sampled in 1987 and 1988. respectively.
70

Table 19. Distribution of Gwynn Island Test Reef fishing effort by targeted species in 1987 and 1988.
Month
May
June
July
August
Totalb Trips
4/4
7/5
11/22
11/21
September 7/22
October 17/6
November 3/3
Season 60/83
Sea Bass Tautog 1987 1988 1987 1988
--% --% 25% --%
5
6 6 33
100 100
2 8 7
T S . a arget peci.es
Trout 1987 1988
Spot 1987 1988
--% --% 25%
29
9
27
14
24
18
10
18
33
10
43
64
64
86
47
53
80
95
86
82
33
76
Other 1987 1988
50%c 100%d
29e 20f
27e
18 7
8 If several "targeted species" were specified during an interview. the first species mentioned was considered the principal species sought.
bTotal trips sampled in 1987 and 1988, respectively.
c"Bottomfish"
d25%-flounder; 25% bluefish; 50%-unspecified.
eUnspecified target species.
£Bluefish
g12%-flounder; remainder unspecified.
71

Table 20. Relative contribution of species to total "kept" catch for the Gwynn Island Test Reef in 1987 and 1988.
No. 8
Trips
b -=--------R_e-l_a;...;t;.;;i;..;;v..;;e...;;.Fr-e-9.u_e_n_c,y....,..(%-')'-----------No. Kept Tautog Sea Bass Spot Croaker Trout Other
Month Fish 1987 1988 1987 1988 1987 1988 1987 1988 1987 1988 1987 1988
May
June
July
4/4 45/41 0
7/5 235/93 0
11/22 419/815 0
August 11/21 437/630 0
7/22 440/625 0
0
0
0
0
0
0
0
0
0
0
0
0
0
0
0 Sept.
Oct. 17/6 873/88 0.8 10.2 2.4 0
Nov. 3/3 23/37 43.5 100 52.2 0
Season 60/83 2472/2329 0.7 2.0 1.3 0
22.2 0 60.0 0 17.8 0
51.9 84.9 17.9 7.5 30.2 4.3 0
82.1 92.5 8.1 3.6 9.8 0.4 0
84.0 87.1 0 1.9 15.8 7.3 0.2f 3.68
89.8 12.8 s.2 1.4 s.o 13.4 o 12.3h
83.0 73.8 0.7 0 12 9 11 4 0.3i 4.5j . . 0 0 0 0 0 0
79.4 81.6 5.3 2.4 13.1 6.4 k 0.2 7.5
~umber of fishing trips sampled in 1987 and 1988. respectively. Total number of fish recorded as "kept" for trips sampled in 1987 and 1988. respectively.
~Flounder - 85.4%; bluefish - 14.6%. Bluefish.
8 Bluefish - 1.3%; "sea mullet" (whiting. Menticirrhus sp.) - 1.3%; sand shark (likely juv. Carcharhinus milberti) - 0.2%; oyster toadfish (Opsanus !!!:!_) - 0.2%; puffers (Sphoeroides
fmaculatus) - 0.1%. Flounder
:sea mullet. Sea mullet - 5.1%; porgy (scup. Stenatomus chrysops) - 4.3%; bluefish - 1.9%; puffers -
.1.0%. 7Flounder - 0.1%; sea mullet - 0.2%. ~Sea mullet - 3.4%: bluefish - 1.1%.
Sea mullet - 3.0%: flounder - 1.5%; bluefish - 1.4%: porgy - 1.2%: oyster toadfish -0.1%.
72

""'I Table 21. Spot catches for trips targeting "bottom fish" (spot-croaker-trout-flounder)
and spot-croaker only at the Gwynn Island Test Reef in 1987 and 1988.
TARGET SPECIES: SPOT-CROAKER-TROUT-FLOUNDER
No. No. Total Mean Wt. Release Catch Catch Trips Rod Hours Kept Kept (lbs) Rate(%) Rate (lbs) Rate(#)
Month 1987 1988 1987 1988 1987 1988 1987 1988 1987 1988 1987 1988 1987 1988
May 3 1 12 15 10 0 1.0 38 0.8 0 1.3 0
June 7 4 106 40 122 79 0.6 0.6 0 0 0.6 1.2 1.2 2.0
July 11 21 88 182 344 754 0.6 0.1 8 6 2.1 2.7 4.2 4.4
August 11 21 157 247 364 549 0.7 0.6 0 37 1.6 1.3 2.3 3.6
September 7 22 93 180 395 455 0.8 0.7 8 47 3.4 1.8* 4.6 4.8
October 15 4 188 54 725 65 0.9 0.9 21 0 3.5 1.1 4.9 1.2
November oc 0
----------------------------------------------------------------------------------------Season 54 73 644 718 1960 1902 0.8 0.7 12 29 2.3 1.7 3.5 3.8
TARGET SPECIES: SPOT-CROAKER
May 2 0 6 1 1.0 86 0.2 1.2
June 5 4 72 40 92 79 0.5 0.6 0 0 0.6 1.2 1.3 2.0
July 10 21 78 182 326 754 0.6 0.7 8 6 2.3 2.7 4.6 4.4
~ August 8 18 109 216 340 497 0.7 0.6 0 39 2.1 1.4 3.1 3.8
September 6 18 91 156 386 439 0.8 0.7 8 42 3.4 2.0 4.6 4.8
October 9 2 78 24 692 58 0.9 1.0 21 0 8.3 2.4 11.2 2.4
November 0 0
----------------------------------------------------------------------------------------Season 40 63 434 618 1387 1827 o.8 2.0 12 27 3.2 2.0 4.8 4.0
:Pounds caught per rod hour (kept fish only). combined. Catch per rod hour for kept and released fish
~No trips made for targeted species. (P~0.05). Mann-Whitney U-Test. Catch rates signficantly different between years
73

Table 22. Croaker catches for trips targeting "bottom fish" (spot-croaker-trout-flounder) and spot-croaker only at the Gwynn Island Test Reef in 1987 and
,.....,. 1988.
CROAKER--TARGET SPECIES: SPOT-CROAKER-TROUT-FLOUNDER
No. No. Total Mean Wt. Release Catch Catch Trips Rod Hours Kept Kept (lbs) Rate(%) Rate (lbs) Rate (/1)
""-'I Month 1987 1988 1987 1988 1987 1988 1987 1988 1987 1988 1987 1988 1987 1988
May 3 1 12 15 4 0 1.2 0 1.2 0 0.3 0
June 7 4 106 40 42 7 1.5 1.5 0 0 0.6 0.3 0.4 0.2
July 11 21 88 182 32 30 0.8 0.9 0 46 0.3 0.2 0.4 0.3
August 11 21 157 247 0 12 0.7 100 64 0 oc oc 0.1
September 7 22 93 180 23 9 1.3 0.5 58 86 0.3 oc* 0.6 0.4 *
~
October 15 4 188 54 6 0 1.2 0 oc 0 oc 0
November od 0
----------------------------------------------------------------------------------------Season 54 73 644 718 107 58 1.2 0.9 27 64 0.2 0.1 0.2 0.2
CROAKER--TARGET SPECIES: SPOT-CROAKER
May 2 0 6 1 1.2 0 0.2 0.2 ~
June 5 4 70 40 25 7 1.9 1.5 0 0 0.7 0.3 0.4 0.2
July 10 21 78 182 32 30 0.8 0.9 0 46 0.3 0.2 0.4 0.3
August 8 18 109 216 0 12 0.7 100 64 0 oc 0.1 0.2
September 6 18 91 156 23 9 1.3 0.5 58 86 0.3 oc* 0.6 0.4
October 9 2 78 24 6 0 1.2 0 0.1 0 0.1 0
November 0 0 ""1\ -------------------------------------------------------~------------------------------
Season 40 63 434 618 87 58 1.3 0.9 32 64 0.3 0.1 0.3 0.3
bPounds caught per rod hour (kept fish only). Catch per rod hour for kept and released fish combined.
~Fish caught but catch rate~ 0.05 (catch rates rounded off to nearest 0.1). *No trips made for targeted species.
Catch rates significantly different between years (P~0.05) Mann-Whitney U-Test.
74

Table 23. Gray trout catches for trips targeting "bottom fish" (spot-croaker-trout-flounder) and gray trout only at the Gwynn Island Test Reef in 1987 and 1988.
~
GRAY TROUT--TARGET SPECIES: SPOT-CROAKER-TROUT-FLOUNDER
No. No. Total Mean Wt. Release Catch Catch Trips Rod Hours Kept Kept (lbs) Rate(%) Rate (lbs) Rate (/J)
-, Month 1987 1988 1987 1988 1987 1988 1987 1988 1987 1988 1987 1988 1987 1988
May 3 1 12 15 8 0 2.5 11 100 1.7 0 0.8 0.1
June 7 4 106 40 71 4 1.1 1.5 0 0 0.7 0.2 0.7 0.1
July 11 21 88 182 41 4 1.1 1.4 0 20 0.5 oc* 0.5 oc*
August 11 21 157 247 69 46 1.3 1.0 3 2 0.6 0.2 0.4 0.2
September 7 22 93 180 22 84 1.7 1.2 44 7 0.4 0.6 0.4 0.5
October 15 4 188 54 37 10 2.1 1.0 23 0 1.3 0.2 0.8 0.2
November od 0
-------------------------------~------------------------------------------------------Season 54 73 644 718 332 148 1.6 1.2 15 6 0.8 0.2* 0.6 0.2*
GRAY TROUT--TARGET SPECIES: GRAY TROUT
May 1 od 6 8 2.5 0 3.3 1.3 ~
June 2 0 34 11 1.5 0 0.5 0.3
July 1 0 10 12 0.8 0 0.9 1.2
August 3 3 48 31 1 36 0.8 1.0 67 0 od 1.2* 0.1 1.2 ~
September 1 4 2 24 4 57 0.9 1.3 0 0 0.9 3.1 2.0 2.4
October 4 2 78 30 38 4 3.3 1.0 0 0 1.6 0.1 o.s 0.1
November 0 0
""' ----------------------------------------------------------------------------------------Season 12 9 178 85 74 97 2.4 1.2 3 0 1.0 1.4 0.4 1.1
bPounds caught per rod hour (kept fish only). Catch per rod hour for kept and released fish combined.
~Fish caught but catch rate~ 0.05 (catch rate rounded off to nearest 0.1). *No trips made for targeted species.
(P~0.05). Mann-Whitney U-Test. Catch rates significantly different between years
75

Table 24. Bluefish catches for trips targeting desirable species (spot-croaker-troutsea bass-tautog-flounder-bluefish} at the Gwynn Island Test Reef in 1987 and 1988.
Month
May
June
July
August
September
October
November
BLUEFISH--TARGET SPECIES: ALL DESIRABLE SPECIES
No. Trips
1987 1988
4
7
11
11
7
17
3
4
5
22
21
22
6
3
No. Rod Hours 1987 1988
16 31
106 44
88 207
157 247
93 180
227 66
18 34
Total Kept
1987 1988
0
0
6
3
0 11
0 0
0 12
0
0
0
0
Mean Wt. Release Catch Kept (lbs} Rate(%) Rate (lbs) 1987 1988 1987 1988 1987 1988
8.4
4.5
1.7
1.5
0 45 0 1.6
0
0
100
0
0
0
0 0 0.3
0 0 0.1
0 0 0
0 0 0.1
0 0
0 0
0
0
Catch Rate (IJ)
1987 1988
0 0.4
0 0.1
0
0 0.1
0
0
0
0
...,_ ----------------------------------------------------------------------------------------d Season 58 82 673 794 0 32 --- 3.1
8 Pounds caught per rod hour (kept fish only).
b Catch per rod hour for kept and released fish combined.
100 14 --- 0.1
cFish caught but catch rate~ 0.05 (catch rates rounded to nearest 0.1).
dOnly one May and one June trip captured in the 1988 sampling program targeted bluefish; no trips targeting bluefish were recorded in 1987.
76

A.
Table 25. Sea bass catches for trips targeting sea bass-tautog at the Gwynn Island Test Reef in 1987 and 1988.
SEA BASS--TARGET SPECIES: SEA BASS - TAUTOG
No. No. Total Mean Wt. Release Catch Trips Rod Hours Kept Kept (lbs) Rate(%} Rate (lbs)
Month 1987 1988 1987 1988 1987 1988 1987 1988 1987 1988 1987 1988
May
June
July
August
September
October
November
Season
1
0
0
0
0
2
3
6
0
0
1
0
0
2
3
6
4
25
39 12
18 34
61 71
0
6
12
18
0
0 1.0
0 0.8
0 0.8 ---
aPounds caught per rod hour (kept fish only).
b Catch per rod hour for kept and released fish combined.
77
0
83
45
69
0
0 0
0 0.2 0
0 0.5 0
0 0.2 0
Catch Rate (II)
1987 1988
0
0
0.9 0
1.2 0
1.0 0

Table 26. Tautog catches for trips targeting sea bass-tautog at the Gwynn Island Test Reef in 1987 and 1988.
TAUTOG--TARGET SPECIES: SEA BASS - TAUTOG
No. No. Total Mean Wt. Release Catch Catch Trips Rod Hours Kept Kept (lbs) Rate(%) Rate (lbs) Rate (fl)
Month 1987 1988 1987 1988 1987 1988 1987 1988 1987 1988 1987 1988 1987 1988
May 1 0 4 0 0 0 0
June 0 0
July 0 1 25 0 0 0 0
August 0 0
September 0 0
October 2 2 39 12 2 9 4.5 4.0 0 0 0.2 3.0 oc 0.8
November 3 3 18 34 10 37 3.0 6.7 0 0 1. 7 7.3 0.6 1.1
----------------------------------------------------------------------------------------Season 6 6 61 71 12 46 3.2 6.2 0 0 0.6 4.0 0.2 o.6
aPounds caught per rod hour (kept fish only).
b Catch per rod hour for kept and released fish combined.
cFish caught but catch rate< 0.05 (catch rates rounded off to nearest 0.1).
78

Table 27A. Distribution of fishing quality ratings for the Gwynn Island Test Reef with and without consideration for species targeted on trips in 1987 and 1988.
Month No. T
. a rips
Relative Frequency of Fishing Quality Rating Poor Fair Good Very Good Excellent
1987 1988 1987 1988 1987 1988 1987 1988 1987 1988
TARGET SPECIES NOT CONSIDERED
Unspecified 1987 1988
May 4/4
7/5
--% --% --% 25% --% 50% --% 25% --% --% 100% --%
June
July 11/22 18
August 11/21 36
September 7/22
October 17 /6
November 3/3
41
Season 60/83 22
Season 50/73b 24
Season 39/63 18
Season 9/9 33
Season 6/6 17
20
32
52
45
50
33
40
29
9
9
6
33
10
40
23
10
17
13
64
18
57
6
23
40
23
19
23
22
9
18
29
18
13
9
14
23
17
14
TARGET SPECIES: SPOT-CROAKER-TROUT-FLOUNDER
41 6 14 28 22 16 15
TARGET SPECIES: SPOT-CROAKER
43 3 13 31 21 21 21
TARGET SPECIES: TROUT
33 22 11 22 33 22
TARGET SPECIES: SEABASS-TAUTOG
50 33
9
12
5
6
14
14
5
9
17
67
11
8
8
50
~mber of trips sampled during 1987 and 1988, respectively. Number of trips for which indicated species were targeted by fishing party.
79
71
9
14
18
67
27
20
10
22
50
21

Table 27B. Weighted quality ratings for overall seasonal fishing experiences at the Gwynn Island Test Reef with and without consideration for species targeted on trips in 1987 and 1988.
Weighted Quality Ratings Poor Fair Good Very Good Excellent Total
1987 1988 1987 1988 1987 1988 1987 1988 1987 1988 1987 1988
TARGET SPECIES NOT CONSIDERED
2.2 4 2 2.6 6.9 6.6 5.2 5.6 2.5 5.5 18.8 24.3
TARGET SPECIES: SPOT-CROAKER-TROUT-FLOUNDER
2.4 4.1 1.2 2.8 8.4 6.6 6.4 6.0 3.0 4.0 21.4 23.5
TARGET SPECIES: SPOT-CROAKER
1.8 4.3 0.6 2.6 9.3 6.3 8.4 8.4 7.0 4.0 27.1 25.6
TARGET SPECIES: TROUT
3.3 3.3 4.4 2.2 6.6 9.9 --- 8.8 --- 14.3 24.2
TARGET SPECIES: SEA BASS-TAUTOG
1. 7 5.0 6.6 25.0 8.3 30.0
8weighted values obtained by assigning values of 10, 20, 30. 40, 50 to respective quality rankings (poor. fair. good, very good, excellent) and multiplying assigned values times relative frequencies in Table 27A.
80

Table 28. Catch rate comparisons between Gwynn Island Test Reef and other major "wreck fishing" sites with consideration for certain target species in 1987 and 1988.
Location
Gwynn Island Test Reef
The Cell
E. Ocean View Reef
Ches. Bay Br. Tun. Is.
Lower Ches. Ba Sitesc
Gwynn Island Test Reef
The Cell
E. Ocean View Reef
Ches. Bay Br. Tun. Is.
Lower Ches. Ba Sites
Gwynn Island Test Reef
The Cell
E. Ocean View Reef
Ches. Bay Br. Tun. Is.
Lower Ches. Ba Sites
Mean Catch Rates No. Trips
1987 1988 Lbs. Kept Per Rod Hr. No. Caught Per Rod Hour
1987 1988 1987 1988
SPOT--TARGET SPECIES: SPOT-CROAKER-TROUT-FLOUNDER
54
2
3
7
13
73
11
11
23
49
a
1.1
* 1.7
* 0.1
1.6
1. a"
CROAKER--TARGET SPECIES: SPOT-CROAKER-TROUT-FLOUNDER
54
2
3
7
13
73
11
11
23
49 1.s°
* 0.1
0.2
* 0.3
6.s°
TROUT--TARGET SPECIES: SPOT-CROAKER-TROUT-FLOUNDER
54
2
3
7
13
73
11
11
23
49
0.8
2.9
2.0
81
* 0.2
0.2
o*
1.0
0.6
0.6
2.7
1.8
3.8*
* 0.1
* 0.2
* 0.2
* 2.1
0.2
0.4
* 0.2
o*
0.8
0.4

Table 28 (continued).
Mean Catch Rates No. Trips Lbs. Kept Per Rod Hr. No. Caught Per Rod Hour
Location 1987 1988 1987 1988
Gwynn Island Test Reef
The Cell
6
0
Ches. Bay Br. 14 Tun. Is.
Cape Henry Wrks. 7
Lower Che3. 21 Bay Sites
Ches. Light 9 Tower Reef
Tri. Wrecks Area 11
Gwynn Island Test Reef
The Cell
6
0
Ches. Bay Br. 14 Tun. Is.
Cape Henry Wrks. 7
Lower Che3. Bay Sites
Ches. Light Tower Reef
Tri. Wrks. Area
21
9
11
SEA BASS--TARGET SPECIES: SEA BASS-TAUTOG
6
10
14
6
34
12
13
0.2
0.4
2.0
0.1
2.3
0.5
0.6
1.2
0.4
* 1.0
* 0.3
TAUTOG--TARGET SPECIES: SEA BASS-TAUTOG
6
10
14
6
34
12
13
0.6
4.3
0.3
3.6
2.3
0.5
4.0
3.0
6.7
1. 7
1.1
1.0
0.3
1987 1988
1.0
0.6
2.5
1.0
0.7
0.2
0.1
1.4
0.7
0.2
o*
0.2
1.3
1.2
0.7
* 0.3
* 0.1
0.6
0.8
2.0
0.6
3.9
0.3
0.1
:Insufficient trips sampled to adequately represent fishing activity. Fish caught but catch rate< 0.05 (catch rates rounded off to nearest 0.1).
~Combined trips to CBBT Is.,-The Cell, E. Ocean View Reef, Concrete Ships. Combined trips to CBBT Is., The Cell, E. Ocean View Reef, Cape Henry Wrecks.
jtatistical test results {Mann-Whitney U-Test, corrected for ties). 1987 catch rates are significantly different between G.I. Test Reef and other
*indicated site{s), (P~0.05), Mann-Whitney U-Test. 1988 catch rates are significantly different between G.I. Test Reef and other indicated site{s), (P~0.05), Mann-Whitney U-Test.
82

REFERENCES
Belcher, Mr. Ronald. 1987; 1988. Manager, R&R Bait and Tackle shop, Hudgins, VA, personal communication.
Bochenek, E., N. Chartier, and J. Lucy. 1989. Virginia's recreational marlin and tuna fishery, 1983-1988: a report to the fishermen. Spec. Rept. in Applied Marine Sci. and Ocean Engineering No. 298, Sea Grant Marine Advisory Services, Virginia Institute of Marine Science, College of William and Mary, 25p.
Bohnsack, J, and D. Sutherland. 1985. Artificial reef research: a review with recommendations for future priorities. Bull. Marine Sci. 37(1):11-39.
Chesapeake Bay Bridge and Tunnel District Office. 1989. Cape Charles, VA, brochure and personal communication.
Cununings, J. 1986. Shipwrecks data base compiled from numerous sources, Cununingsware Products, Joppa, MD, personal communication.
Deltaville Fishing and Conservation Club. 1987. Mr. James 'Wharton, Deltaville, VA; personal communication.
Feigenbaum, D. 1984. Artificial reef study - year I report (1983). Prepared for the Virginia Marine Resources Commission, Newport News, VA, 29 p.
Feigenbaum, D., C. Blair, M. Bell, J. Martin and M. Kelly. 1985b. artificial reef program - description and results of Year I. Mar. Sci. 37:179-188.
Virginia Bull.
Feigenbaum, D. C. Blair, M. Bushing. L. Parker, D. Devereaux and A. Friedlander. 1986. Artificial reef study: final report prepared for Virginia Marine Resources Commission, Newport News, VA. Old Dominion University Dept. of Oceanography Tech. Rept. no. 86-2, 93 p.
Feigenbaum, D., C. Blair and A. Provenzano. 1985a, Artificial reef study -Year II report (1984). Prepared for the Virginia Marine Resources Commission, NewportNews, VA, 57 p.
Feigenbaum, D., M. Bushing, A. Friedlander and B. Lowe. 1988. Monitoring of the Gwynn's Island Test Reef, Final Contract Report prepared for Virginia Marine Resources Commission, Newport News, VA, Old Dominion University Dept. of Oceanography Tech. Rept. No. 88-1, 33 p.
Lucy, J. 1983. Development of Virginia's artificial fishing reefs: a historical outline (1959-1977). Marine Resource Report No. 83-6, Virginia Institute of Marine Science, College of William and Mary, 5 p.
Lucy, J. 1988. Chart of wrecks and artificial reefs in Virginia waters. Marine Resource Advisory No. 22, Virginia Institute of Marine Science, College of William and Mary and Artificial Reef Program, Virginia Marine Resources Commission.
83

Lucy, J., C. Barr, and W. DuPaul. 1988a, Development and implementation of a catch and effort data collection system for monitoring trends in fishing success on Virginia's artificial fishing reefs. Project Completion Report, Year One. Wallop-Breaux Project No. F-63-R, Virginia Institute of Marine Science, College of William and Mary. Submitted to Virginia Marine Resources Commission, Newport News, VA, 67 p.
Lucy, J., N. Chartier, and W. DuPaul. 1988b. Catch trends and fish utilization in Virginia's offshore recreational pelagic fishery. Contract report, Wallop-Breaux Project No. F-62-R. Submitted to Virginia Marine Resources Commission, Newport News, VA, 44 p.
Meier, Mr. Michael. 1988; 1989, Fisheries Reef Manager, Virginia Marine Resources Commission, Commonwealth of Virginia, Newport News, VA, personal communication.
Meier, M., J. Martin, D. Feigenbaum and M. Bell. 1985. Artificial reefs in Virginia: old beginnings and new directions. Ch, 12 in Artificial Reefs, Marine and Freshwater Applications. F. D'Itri (ed.), Lewis Publ., Chelsea, MI, 589 p.
Robinson, J. 1970. Member, Peninsula Saltwater Sport Fishermen's Assoc., personal communication.
SPSS-X. 1986. SPSS-X User's Guide, 2nd Ed. SPSS-X, Inc., Chicago, IL, 988 p.
U.S. Coast Guard. 1989. Group Hampton Roads Public Service Office, Portsmouth, VA, personal communication.
Virginia Marine Resources Commission. 1987. Fishing in Virginia tidal waters: legal sizes, limits, and other restrictions. Information Leaflet No. 86-1 (revised), 2 p.
Virginia Marine Resources Commission (VMRC). 1989. Virginia's artificial reef program: Where's the reef. Brochure, 1 p.
Virginia Saltwater Fishing Tournament (VSFT) 1986; 1987; 1988. Annual summary reports, Department of Economic Development, Commonwealth of Virginia, Virginia Beach, VA. (C. Bain, Director)
Ward, Captain Charles (USN Retired). 1988; 1989. Charter captain and experienced tautog fisherman. Assisted in placing materials on Chesapeake Light Tower Reef, Virginia Beach, VA, personal communication.
84

ARTIFICIAL REEF FISHING STUDY Virginia Institute of Marine Science, Gloucester Point, VA 23062
(Funded by Sport Fish Restoration (Wallop-Breaux) Funds Through the Virginia Marine Resources Commission)
77° 00'
CHESAPEAKE BAY
ARTIFICIAL REEF ANO WRECK STUDY SITES (Sites to be Re-Buoyed By Late Spring 1987)
LOCATION
PARRAMORE TEST REEF 3.8 N.M. from Parramore Coast Guard Tower on Course 115 degrees T
PARRAMORE REEF (Buoy "R-10") 8.7 N.M. from Parramore Coast Guard Tower on Course 102 degrees T
TRIANGLE WRECKS (GA Buoy) 18 N.M. from Chesapeake Light Station on Cou11e 071 degrees T
LIGHT TOWER REEF S.W. of Chesapeake Light Station
GWYNN ISLAND TEST REEF 1.35 N.M. NE cf "Hole-in-the-Wall"
CAPE CHARLES TEST REEF N/NW of Entrance to Cherrystone Inlet immediately east of Buoy "C 12"
LITTLE CREEK (after Aug, 1, 19871 900 yds. off Ocean View Beach W. of Little Creek Entrance
LORAN BEARINGS
41784. 1 /27125.4 41 7 41.0/27126.0 41747.5/27125.2 41744.0/27125.2 41738.0/27126.3
41746.3/27095.5 41744.0/27095.0
41391.4/27020.2 41390. 7 /27020.5 41389.6/27020.0 41386.2/27018.9
41286.2/27103.0
41637 .2 /27299.4
41541.2/27231.0 41539.0/27231.2 41539.4/27230.8
41259.8/27225.3 41259. 7 /27225.0
PARIW«lRE REEF
ATLANTIC OCEAN 37°
* TRIANGLE QQ' WRECl-5
* LIGHT TOWER REEF
REEF MATERIAL
Concrete Pipes Concrete Igloos Concrete Pipes Tire Modules Tire Modules
Vessel: Walter Hines Page Vessel: Mona Island
Vessel: Webster Vessel: George P. Garrison Vessel: James Haviland Vessel: Edgar Clark
60' X 80' Orydock
Tire Modules/Concrete Igloos
Concrete Igloos Tire Modules Concrete Pipes
Concrete Igloos Concrete Igloos
Appendix A. Chart showing locations of artificial reef study sites.
85
ATTENTION WRECK & ARTIFICIAL REEF
FISHERMEN WE NEED YOUR HELP! The Virginia Institute of Marine Science (VIMS) is beginning a two-year
study to develop catch and effort information for determining trends in recreational fishing on Virginia's artificial fishing reefs. Offshore and Chesapeake Bay sites will be studied. (See chart, reverse side).
The study will help document fishing success rates of experienced fishermen on the reef sites. Study results will be useful to the Virginia Marine Resources Commission (VMRC) in maintaining and expanding its reef program. Primary funding for the study is provided by Sport Fish Restoration (Wallop-Breaux) Funds administered by VMRC.
PARTICIPATION BY PRIVATE BOAT FISHERMEN IS NEEDED! If you occasionally fish reef sites, please fill in a line below so we can contact you several times during the fishing season about your catches. We promise to be brief and appreciate your help!
NAME ADDRESS PHONE NO. BOAT NAME
Appendix A (cont.) Form for soliciting names and addresses of boating owning wreck and reef fishermen,
86

A
Outdoors 812 Daily Press, Sunday, May JO, 1987
VIMS needs help to see if anglers catch fish at reefs
GLOUCESTER POINT - Re· searchers al the Virginia Institute uf Marine Science need our help. They need to know if we're catch· ing fish on the artificial reefs that's been planted around the lower Chesapeake Bay.
For the past dozen years, the Marine Resource Commission has spent roughly $350,000 building artificial reefs in the Atlantic at such locations as the Chesapeake Light Tower, some 15 miles east of the Chesapeake Bay Bridge, and the Triangle Wrecks, another 15 miles beyond the Light Tower.
Today these reefs are not only providing excellent recreational fishing for such species as black sea bass and tautog, but also pro• vide a sizable commercial catch for watermen.
there.
Jay Mundy
Fishing
"What we need to know nuw," he added. "is ir the fish have started lo hang around the reef all season, like they do on the orf• shore reefs, or if they're just moving in and out. say with the tide, or when they're ,·basing baitfish."
The C,wynn Island site, as with all the sites, were constructed of the best material known at this time, according lo Mike Meier, reef director for VMRC.
The Gwynn Island site was constructed from concrete igloos and old tires, and fashioned after designs perfected by the Japa. nese, world leaders in artificial reef construction.
Artlflclal reef sites
---No.t u----c:-o_r_ ... _, .. ,,s-.-r PanafflOte tMf No. 2 (Duo, "A,10") 8? navt1c.1 mi• lrom Patramor• Coa11 Gwi•d Tower on COUflO 101 de,gfNt T T--(0,\.....,, 1, ___ "-1'8111 811Doi\..,_011T . . . _ l.""1T_..., SWol~UQh•..,_..._.. ........ ·::-.".a,:\··~. 1.a,--NECll,"llall la ..... ~ClwlN--NIHWolon1r ..... toa..rr,......,-. _,.,.,, E 01 Buoy ·-c.1r Latc:-IIC-..... t,1"1) ·
at7114.tf27UU 41f'1.0lj712t,O '41747.5/27125.2 41744.012712U 417311.0/27120.3
"1•e 3121cm s 41 ,., 01270H 0
'1»1.AnJ'WU 41SIO.fl27020.I •ta.tnl'QIDJI 41aJl/27DIU •12en12110, o
··~~ 415"11.2127231 0 41$39 0127231 2 41$3941272301
412111.9121UU
-·00' ......
CGncrtlll "* Conotftl ,.._ C-.plpot ·n.Tn-
VesHt Wates, HINI Pag,ro v..,..., Mona l:Mand ~-":.:°:".="' Y-tdgorci.t.
eo • ao ft "'-" ____ ,.._ ~ ..... ~h· .. -.
C.--oglom ,,,.~ Conc:roto pc- •.
Since 1983, VMRC has planted four reefs in the bay itself, with a fifth scheduled to be completed on the old ODU site off east Ocean View by August of this year. Two more are located in the Atlantic just off Parramore on the Eastern Shore.
They're laid out in a ragged line. much like the ballast rocks that make up the foundation for Bluefish Rock, a popular fishing spot located just off Grandview Beach in Hampton. The water depth around the Gwynn Island site is about 20 feet.
:OJ~=:--=- .. ,11ae.rnnn.o 1·==; Jon Lucy, coordinator for the
VIMS project. said the reefs In· side the bay are perfect for such species as croaker, spot and floun• der, but there is little proof that fish have taken up residence.
"Part of the problem may be the sites are really test sites and rather small in size. and anglers simply can't locate them." he said.
For example, the Gwynn Js· land site. located at the southern lip of the mouth of the Rappahannock River a little more than a mile northeast of the "Hole-in-theWall, " the passage between the island and the mainland, is only about 50 yards by 75 yards.
"We know this site marks well on a fish finder." Lucy said. "We know also that some spot, croaker and even flounder have been caught there, because we've al· ready spoken with some fisher• men who had good results fishing
The reef is normally marked with three small. white spar buoys bearing the words "Gwynn·s Island Reef." At the moment there are only two of the buoys in place. the third having blown away with the last north· easter.
"In fact," Meier said, "our big, gest problem right now is keeping the buoys on the site. Anytime you notice one is missing or dam· aged, please call me."
Meier said the buoys will be replaced this spring.
Lucy said it's interesting lo note that more croaker are caught off the concrete igloos than th,• tires.
"I don't know why at this time," he said. "Maybe you fishermen have an idea."
Speculation is because the igloos, which measure nine feet by seven feet, stand higher off the bottom than the tire modules.
"Anything standing off the bottom will grow barnacles and such much quicker, which attract bottom-feeder likes croaker," Lucy said.
The other site in the lower bay is located north/northwest of the entrance to Cherrystone Inlet on the Chesapeake side of the Eastern Shore, immediately east of Buoy C-12.
The buoys there have all blown away said Meier.
The reer lies in 25 to 35 feet of water and is laid out in more of a square than the Gwynn Island
reef. "There's a little different
situation here than on the west· ern side of the bay," Meier noted. "The Cape Charles site has produced a few more fish thari Gwynn's Island, especially small sea bass, called Black Wills."
Neither marine expert could say if the reefs were attracting large species such as bluefish, red and black drum, or cobia.
To reach Lucy or Charles Barr. a graduate student helping on the project. call VIMS at Gloucester Point (804) 642-7166 during work hours, or after hours leave a message on the instltute's answering machine. at 642·7000.
Meier can be reached at VMRC's headquarters in Newport News by calling 247-2263.
Appendix B. Newspaper and periodical articles on Wallop-Breaux reef study
87

WILLIAM AND MARY NEWS
Wednesday, May 13, 1987
VIMS seeks information on fishing reefs
The .lnstitute's Sea Grant Marine AdvisOI)' Servicea Program is conducting a reef fishing study to provide the Virginia Marine Resources Commission with an analysis or catch and fishing effort data. The study will assist in evaluating the maintenance and expansion of exisitinJ as well as new reef sites. Jon Lucy, professor of marine science, is coordinator for the study and is being assisted by Charles Barr, a graduate student on the project. The worlc is primiuily funded from Sport F1Sh Restoration (WallopBreaux) Funds adminislCRd by VMRC.
The Virginia Institute or Marine Science has begun collecting Clllch information from recreational fishermen using Virginia's anificial fishing reefs.
Appendix B. (cont,)
88
VIMS Continued/romp. 2.
Lucy is requesting that f1Shcnnen who f1Sh the reef sites contact him al VIMS. Fishermen who call will be randomly contacted at various times during the fishing season. All information on catches will be lccpt confidential and only summariud in the study report.
Lucy and Barr recently mailed flyers to marinas and Virginia Saltwater Fishing Tournament weight stations in another at• ICmpl to reach fishermen.
Fishermen may also contact Lucy at the following address: Reef Fishing Study, Virginia Institute of Marine Science, Gloucester Point, 23062. He can be reached by phone during working hours at 642-7166. After hours, callers may leave a message with the lnstitute's answering service at 642-7000.
-n 0 ::s M'
}) ) J ) ) )
Hi~hmund Tim..,.•Di•patrh, Tu.....tu~ •. \lu, :i, I •JR7 C-3
Harlow's determination lands 22-pound turkey '.Nt'..-s from all ovrr .• lfrrt'0
S one, of th~ 1ntrresling things that can happen t(( ~ou If you·11 get out in the woods during spring turltey .uson instead of lying in bed dreaming about Jane l'iutey.
"David Harlow of Richmond was in the woods i,ear a Coochland County Ille a few moruings ago at ~ a.m.
:At that Umeof day (day?). boot owls arestlll calling and you can bump into trN:S without even suspectln1 they're tl~tt
• Just after dawn. David beard a gotilller tune ap aaoss tllt lab. He called and called. The gobbler would answer bot wouldn"t walk around the lake. •
. David decided to go to the gobbler, so be sneaked a(ound the lat.e. then called again.
A hc.-n ramt to the call and walked right past him and ntto the br11Sh. Then she started c.-lucltlng for David. so to sprak ··1 dtt1ded to shut up and see bow well she could c19:· he said.
:Th<' gobbler came to her, but got between the real hen and David. David began to think he'd better start sounding gpod again It was now or ntver.
· This time.-. hen and gobbler came to David's call. "She '"'.35 leading him," said David.
• Tht'y were still out of range when something went -:rong. They saw David bat an eye or maybe Just got s~sp1c1ous Both Rew.
David waited half an hour, then walked to where the bJrds had flushed. He hit the caller once; the gobbler
1 ....... =_~_v ___ iJ answered.
It took 30 minutes to work him back but finally. after that three-hour game of musical chairs. the rtobbler returned to David.
He was a beaut - 22 pounds with an l l·mch beard . If at first you don·t succeed •.
award goillg Into the Alabama contest. The Alabama tournament wu WOii by Teun Ricky
Cham. .Finl place WU wortll Sl2,000.
• Tbe fishing game, or -Wng closely related. hu recognized another Virginian.
Martin Clavert of Virginia Beacb be.at • field of seven finalists with a cut of 692 feet (that's more than two football fields laid aid to eadl to win the Du Pont Stren Longcutlng Virgillla/Carollnu rqlonal tournament.
Don Koblmaa of Newport News made a cast of 6$0 feet to lintsh second.
The winnen went home with a truckload of lishing gear and outdoor merchanlse. In addition. Calvert won ISOO in cash. He now advances to the June linal la Montana.
• As part of a national campaign ca!INI "Take Pride in • Woo Daves lteeps racking up points 1n nauonal bass America." refuge penonnel at the Cre.at Dismal Swamp
fishing competition. National Wildlife Refuge near Suffolk are mat.ing an This past wttkend. the Chl'Ster rl'l<1d('nt <'aught 37"a effort to better acquaint visitors with the lore. history and
pounds of lighting largemouth bass during th(' $137.000 wildlife of the swamp. Bassmaster Invitational tournament at Cunlcrsv1lle. Ala. On Saturdays and Sundays In May, staff members will
That was good enough to take ISth place in a field of 40 be stationed at Dismal Town parking lot on Wasblngton of the country's top bass lishermen. Daves· seven bass Ditch to provide information and answer questions. Hours were worth Sl.$00 prize money. are from II a.m. to 7 p.m.
With only one more tournament to go before the Bass Information will available on pubhr use programs. Classic in Louisville. Ky .• in August. Daves· outstanding grouptoursandshdepresentatlons.AcccsstoLakeDrum· year of competitive bass fishing has assured him a place mond will be permitted II weather allows. in what is often called the World S.-rirs of angling. I -~~. If you fish saltwater. spe.:ifocally the ship wrecks and
Also. be was in fourth place for bass anglfr of the year ~ficial reefs in Virginia waters. The Virginia Institute
of Marine, Science (VIMS) at GIOllt'eSler Point needs your belp.
VIMS Is coaducting a reef study. TIie purpose as 10 aaalyie how much the reefs are being used by anglers. as well as attempt to measure the success of the reef pro-gram in helping lish populations. .
"We need to identify a cross,section of charter and private boat lisbennen who lisb wrecks and artificial reefs for the study to be suc.-c.-essful." said Jon Lucy. VIMS coordinator for the study.
Over the past several year5. a variety of artifiC'ial reel~ have been formed off the V1rg1nia coast and in the Chesa· peake Bay by sinking barges of tires and even old Liberty ships.
Lucy uks fishermen who fish thf' reefs to contact him He in tum will randomly call anglers at various tam~ during the fishing season for brief informalion about wreck or artifical reef tripi; All information ..-111 ~ krpt confidential.
Contact Jon Lucy. Reef Fishing Study. Virfinia Inst•· lute of Marine Science. Clouc.-ester Point 2lliii . LUC!' can 'be reached durangllie work week at 804-642·7166. or all<"r work or on weekends at the VIMS answering servic-c, at 804-642,7000.
A chart of reel sites and their Loran coordinates •~ available free from VIMS.
The reef study is being fundNI primarily throui:h Sport F~h Restoration (Wallop-Breaux) funds raised through an e:mse In on Gsh1ng equipmenT.
)

·'
REEF FISHING STUDY NEEDS FISHERMEN
The Virginia Institute of Marine Science of the College of William and Mary recently began collecting catch Information from recreational fishermen fishing the Commonwealth's artificial fishing reefs. The lnstltute's Sea Grant Marine Advisory Services Program Is conducting a Reef Fishing Study to help provide the Virginia Marine Resources Commission (VMRC) with an analysis of catch and flshng effort data from experienced fishermen utilizing the state's reef sites. The study will assist VMAC's Artlflclal Reef Program in evaluating the maintenance and expansion of existing as well as new reef sites.
"We need to Identify a significant cross section of charter and private boat fishermen who fish wrecks and artiflclal reefs for the study to be successful," said Jon Lucy, coordinator for the study.
The work is primarily funded through Sport Fish Restoration (Wallop-Breaux) Funds administered by VMRC.
Lucy and Charles Barr, a graduate student working on the project, tiave identified approximately 100 fishermen who periodically fish the various wreck and artificial reef sites. A much larger cross section of fishermen is required for the study to meet its objective of defining utilization and productivity of the sites.
Lucy is requesting that fishermen, who fish the reef sites. contact him at VIMS. Fishermen who contact Lucy will be randomly called at various times during the fishing season tor brief Information about recent wreck or artificial reef trips. All information on catches will be kept confidential and only. summarized in the study report.
Lucy and Barr recently mailed flyers to marinas and Virginia Saltwater Fishing Tournament weigh stations concerning the study's need
• llL I l~HLHMAN
JUNE 18. 1987 5
to identify fishermen. Fishermen who have yet to be contacted by the researchers are encouraged to place their name on these flyers, which then wlll be returned to VI MS. Fishermen may alao contact Lucy at the following address: Reef Fishing Study, Virginia Institute of Marine Science, Gloucester Point, VA 23062. Lucy can also be reached during the work week at (804) 642-7166 or after work hours and on weekends by leaving a message on the lnstitute'sanswering service (804) 642-7000.
Reef sites included In the study are the Light Tower Reef, Triangle Wrecks Reef, Parramore Reef and the test reef sites established by Old Dominion University under contract to VMAC. One test reef site Is located off Parramore Island on the Eastern Shore. Others are located inside Chesapeake Bay just north of Cape Charles and off Gynn's Island near Oeltaville. A diagramatic chart of reef sites and their Loran coordinates is available free upcn request.
Appendix B. (cont.) The Fisherman, Delaware, Virginia, Maryland Edition,
DELMAF Publ. Corp. Sag Harbor, N.Y.
90

after-school seminars for ceachers who are interested in furthering their knowledge for future teaching about the Bay. There is no cost IO the classroom teacher, and participating teachers receive packelS of information about the Bay. According to Lee Lawrence, the Bay Team is a "foot in the door" in bringing water resources education into Virginia's curriculum.
The Bay Team has achieved national recognition from the Environmental Protection Agency (EPA) as one of eight oulStanding environmental education programs. The Bay Team is administered by the Virginia Institute of Marine Science through a grant from Virginia's Council on the Environment. For more information or to request an inschool visit, write to: The Bay Team. Virginia Institute of Marine Science, Gloucester Point, VA 23062.
New Artificial Reef Site for Virginia Fishermen
Virginia's artificial reef program recently expanded fishing opponunities for recreational fishermen in the lower Chesapeake Bay. Coordinated by the Virginia Marine Resoun:es Commission (VMRC), the reef program used "'Wallop-Breaux" Sport Fish Restoration Funds to establish its 1hird bay reef site in July. Consisting of forty concrete igloo structures and designated a~ the East Ocean View
Reef, the buoyed site is located 2,500 yards west of the entrance to Little Creek off the Ocean View area in Norfolk (site is shown on NOAA Charts No. 12220, 12221, 12256).
The new reef is located on the site of an earlier experimental reef project initiated in the late J 960"s by Old Dominion University (ODU) and local recreational fishing interests. Appro,i.imately one hundred wrecked car bodies and at least one menhaden vessel were initially placed on the site. Prior to deployment of the igloos, a side-scan sonar Slll\ley of the site was conducted by the Virginia Institute of Marine Science (VIMS). ODU researchers dove on the site to take sediment samples and to help verify the sonar survey results. As expec1ed, only portions of the original materials remained in the area. By fall the site is expected to begin attracting sea bass and tautog. Spot, croaker and trout may also be attracted to the reef.
The design of the concrete igloos is the result of a three-year study conducted on test reefs established by ODU under contract 10 VMRC. These 11,000-pound, dome-shaped structures, approximately twelve feet in diameter at the base and seven feet high, have proven to be stable, staying in place on test reef sites in the Bay off Gwynn's Island and Cape Charles, as well as off Parramore Island on the Eastern Shore. "The redevelopment of this site is especially significant in that the concrete igloos were specifically developed for use as artificial reef structures," according to Mr. Mike Meier, fisheries reef manager for VMRC.
As pan of an ongoing WallopBreaux funded study of fishing success rates on the state's artificial reefs, VIMS' researchers are seeking to identify fishermen using the East Ocean View Reef.
The VIMS study, beginning in the late fall of 1986, has to date obtained fishing information from over two hundred boat owners who fish the siaie reefs. Through random telephone interviews, VIMS' scientisL\ are seeking to learn which reef sites are producing the most successful fishing trips. The telephone interviews are
brief, no longer than S to 7 minuces, and are designed to gain information on fishing trips made to any reef site during the two-week period preceeding the call. Interviewers ask questions such as how long the reef site was fished. how many rods were used, whac was caught, the state of the tide and current, water temperature and depth of the water. Also, researchers are interested in learning which part of the reef was fished: Were catches made directly over the reef structure or around the perimeter of the reef!
VIMS needs to broaden its existing list of identified boat owners fishing reef sites both in the Bay as well as those offshore (the Light Tower, Triangle Wreck, and Parramore Reefs). The study requires information from a large cross-section of reef/wreck fishermen IO adequately document how the reefs are performing. ·The VIMS" study is designed to take advantage of fishermen's knowledge and fishing experience,· says the study's coordinator, Mr. Jon Lucy. ·By permitting VIMS' researchers to contact them about reef fishing trips, recreational fishermen are contributing to future improvemenlS in the artificial reef program.·
If not already contacted by Lucy or graduate assistant, Charles Barr, boat owners periodically fishing the Bay or offshore artificial reef sites are requested to get in touch with the VIMS' researchers. Charts with Loran coordinates of the reef sites, as well as locations of major wrecks and obstructions found out to 30 miles offshore of Virginia Beach, can be obtained by contacting: Artificial Reef Study, Sea Grant Advisory Services, Virginia Institute of Marine Science, Gloucester Point, VA 23062, (804) 642-7166.
For more information about the reef program, contact Mr. Mike Meier, Fisheries Reef Manager for VMRC, P. 0. Box 756, Newport News, VA 23607, (804) 247-2263.
Appendix C. Virginia Marine Resources Bulletin article on Wallop-Breaux reef study. Va. Mar. Res, Bull. 19(3) Fall 1987: 20-21. VA. Sea Grant College Program, VIMS
91

Artificial Reefs Enhance Recreational Fishing
Data amassed by Marine Advisory Services (MAS) is
providing a clearer picture of how artificial reefs attract both fish and those who fish. The shldy. conducted over the past two years, is being used by the Virginia Marine Resources Commission (VMRC) in evaluating its artificial reef program; the pwpose of the VMRC reef program is to enhance fishing, provide fishing in easy reach of anglers, and to diffuse the fishing effort. so that no one particular area is rJShed too heavily. MAS' role has been to document the use of these sites, and also the species to be found there. Jon Lucy. MAS Marine Recreational Specialist, and Charles Barr, a graduate student. conducted the shldy at MAS.
Any number of structure types can be used in artificial reef construction. Above is an "igloo", a concrete structure weighing about 11,000 pounds.
Succinctly put, made-made or natural materials placed in salt or fresh water attract fish. The surface of the reef becomes colonized by encrusting plants and animals, which. in hlm, provide food for fish and other organisms; the reef structure provides a point of orientation and a feeding station for larger predator fish.
2 Appendix o. Virginia Marine Resource Bulletin, Vol. 20, No. 3, Winter 1989: 2-6, Virginia Sea Grant College Program, VIMS.
92

Rudimentary artificial reefs have gray b'Out, flo1D1der, spot, croaker, sea loosens, causing the load to shift during been used for centuries. However, the bass, tautog, bluefJSh, sea trout, and deployment. technology and the methods for testing weakfish. Offshore, there were some TJJCS, either lashed together with the effectiveness of these structures amberjack, Spanish mackerel and cable or embedded in concrete, were have rapidly evolved only since around sharks, the latter found especially near also used. Keeping these modules sta-the 19SO's. Japan has a long history of shipwrecks. tionary was the biggest challenge. In heavy seafood utili7.ation, and it comes Test results indicate that some this category, tires in concrete did the as no surprise that it would energetical- recreational fishermen do target artifi. besL The concrete base actually settled ly pursue reef construction and technol- cial reefs, but often the structures into the sediments and was, as a conse-ogy. The othei- major counlly involved served as an alternate fishing spoL quence, more stable. in artificial reef coostruction, the Anglers usually have special fishing A reef is often made up of many United States, had far less of a need to "holes", but stop by reefs when the structures; for instance, at Gwynn Is-be so systematic. usual spots are not as productive as nor- land there are six igloos, eight stacked
In the U.S. it was primarily private mal. tire units and 89 tire-in-concrete units. concerns-that is, individuals, There are a number of different ap- Funding for this study was from a sportfishing clubs and diving clubs- proaches to artificial reef construction; variety of sources, including Sport Fish
""" which initialed artificial reef construe- the main objective is to use a non-toxic, Restoration (Wallop Breaux), Sea lion in the pasL Building on the early durable structure which will be station- Grant and the Virginia Institute of efforts of the Tidewater Artificial Reef ary, and which will attract fish. Marine Science. Countless individuals, Association of Virginia (which dates Igloos weigh about 11,000 pounds organizations and businesses went out from 1959), the VMRC began looking and stand seven feet tall. Igloos proved of their way to help MAS. + into reef consttuction in the 1960's.
In the last two years, the Virginia MAS study focused on these sites (also see the map): Triangle Wrecks Reef, Light Tower Reef, Gwynn Island Test Reef, Cape Charles Test Reef, Ocean View Reef, and Parramore Test Reef and Parramore Reef. Researchers have also been interested in fishing results from the Chesapeake Bay Bridge tun-nel. Although it was obviously not in-tended as an artificial reef, the bridge tunnel, which spans the mouth of the Bay, acts as one.
~ In the MAS study, researchers
went directly to the source for their in-formation: the recreational fishermen. A data base of fishermen's catch sue-cess rates on major reef sites was created. This involved systematically collecting and analyzing catch and ef-fort data from recreational fishermen utilizing the reef sites, and recording
... j observations about how reefs are most
effectively fished. The core population .: of this study consisted of recreational - .t .. ~
fishermen who own private boats, and This attifical reef st!Ucture is a who fish one of the Virginia artificial stable, and they maintained their struc- concrete pipe stack. Artifidal reefs reef sites at least twice a season. Boat tural integrity through storms. serve as shelter for smaller fish, as owners were called in a random fashion Concrete pipe stacks were made of a point of orientation for fish, and to ensure a mix typical of the acbJal concrete pipes (inside diameter two - importantly for anglers-a feeding fJShing population. Of the 450-SOO feel) and were stacked in a 3-2-1 con- station for larger predator fish. f ishennen in the general survey, 20 figuration; a 7 /8" steel cable held them
""" were contacted each week. together and the total weight was close
Predictably, the reefs were eff ec- to an igloo: 12,000 pounds. These live in attracting fish and anglers. The modules dido 't appear to work as well species commonly found included: as igloos; the strapping sometimes
3 Appendix D (cont.)
93

I".':\
l"'.l\
!"'-I
4 ,...,
ARTIFICIAL REEF FISHING STUDY Virginia Institute of Marine Science. Gloucester Point. VA 23062
Funded by Sport Fish Restoration (Wallop-Breaux) Funds Through the Virginia Marine Resources Commission
77°0J' 76°0J'
ATLANTIC OCEAN
TUANCU! nEaS * IEEF
Ll<an' 'ro!Ea * REEF
36°00'
37°00'
ARTIFICIAL REEF AND WRECK STUDY SITES (Adapted from Feigenbaum and Blair 1986)
LOCATION LORAN BEARINGS REEF MATERIAL
PARRAMORE TEST REEF 41764.1/27125.4 Concrete Pipes 3.6 N.M. from Parramore 417 41.0/27126.0 Concrete ~loos Coast Guard Tower on 41747 .5/27125.2 Concrete pes Course 115 degrees T 417 44.0/27125.2 Tire Modules
41738.0/27126.3 Tire Modules
PARRAMORE REEF 417 46.3/27095.5 Vessel: Walter Hines Page (Buoy "R-10" - Liberty Ships) 417 44.0/27095.0 Vessel: Mona Island 8.7 N.M. from Parramore Coast Guard Tower on Course 102 degrees T
TRIANGLE WRECKS REEF 41391.4/27020.2 Vessel: Webster (GA Buoy - Liberty Ships) 41390. 7 /27020.5 Vessel: George P. Gamson 16 N.M. from Chesapeake Light 41389.6/27020.9 Vessel: James Haviland Station on Course 071 degrees T 41366.2/27018.9 Vessel: Edgar Clark
LIGHT TOWER REEF 41266.2/27103.0 f:/J' X 60' Orydock S.W. of Chesapeake Light Station
GWYNN ISLAND TEST REEF 41637 .2/27299.4 Tire Modules/Concrete Igloos 1.35 N.M. NE of "Hole-In-the-Wall"
CAPE CHARLES TEST REEF 41541.2/27231.0 Concrete Igloos N/NW of Entrance to Chenystone 41539.0/27231.2 Tire Modules Inlet Immediately east of Buoy ·c 12· 41539.4/27230.6 Concrete Pipes
OCEAN VIEW REEF 41259.8/27225.3 Concrete Igloos 900 yds. off Ocean View Beach 41259.7 /27225.0 Concrete Igloos W. of Little Creek Entrance
Appendix D {cont.) 94

Artificial Reef Catch Trends: The Survey Results
Virginia anglers fishing wrecks, artificial reefs, and other sttuc
tmes principally targeted tautog, seabass and amberjack on offshore reefs, according to a study conducted by Marine Advisory Services of lhe Virginia Institute of Marine Science. Tautog and seabass were also sought at sites in the lower Bay, while anglers found good quantities of spot and grey trout at Gwynn Island Reef.
Preliminary 1988 Results
Based upon preliminary analysis of the 1988 catch data compiled by fishennen utilizing offshore and Bay reef sites, the following observations can be made:
Offshore Reefs-Seabass catch rates, while still relatively low, were up somewhat on offshore reefs during 1988 compared to 1987, but ave,age weights of fJSh were still small (l.S-2 pounds); tautog calCb trends between years were mixed with slightly better catch rates and larger fJSh on the average occurring this season at the Triangle Wrecks, while the Light Tower Reef provided lower 1988. catch rates but also larger tautog than during 1987. The Light Tower Reef was rated by fishennen as fair to good.
Chesapeake Bay Bridge Tunnel-Tautog catch rates were down and seabass catches about the same in 1988 compared to 1987; tautog kept by fJShennen in 1988 averaged about one pound less than those taken last year. While spot catch rates remained fairly constant between years and croaker catches were down in 1988, trout catch rates improved slightly between years, however the fJSh kept averaged only one pound. Striped bass catches during the summer drew new attention to the Bridge-Tunnel, and November catches were good for legal size fish (24 inch minimum).
Bay Reefs-In the lower Bay the Ocean View Reef received less attention from fishermen than expected,
Spot
Apendix D (cont}
being used primarily as a stopping off point when other more favorite areas, e.g. the Bridge-Tunnel, were not as productive as anticipated. For the few fishennen targeting the site in the spring and again in the fall, some good flounder catches were made in the vicinity of the reef. Croaker catch rates were lower at the Ocean View Reef in 1988 than the previous year, but some good catches were recorded in September. The mid-Bay Gwynn Island Reef provided similar catch rates for spot in both years from 1 une through September and for croaker (July through October). Spring provided beuer flounder and bluefish catches than last year, and fall (October-November) produced good catches of tautog. Tautog catch rates were three times those in 1987, resulting in fJSh averaging over five pounds each, twice the average size of fJSh reported at the Bridge-Tunnel.
1987 Results
Fishermen customarily fishing popular offshore wrecks and reefs early in the season reported poor catches of tautog and seabass, when catches were nonnally expected to be good. A cool spring and heavy freshwater runoff from Chesapeake Bay were felt to be
95
negatively influencing offshore wreck fJShing. The Virginia Saltwater F'.IShing Tournament Program reported a significant decline in citations for tautog during 1987, further substantiating low catches for the season.
Mean tautog catches ranged from 0.03 fJSh per rod hour at the Gwynn Island Reef to 1.4 fJSh per rod hour ~ the third island of the Bay Bridge Tunnel. No tautog trips were recorded in the spring and summer months for the Gwynn Island site, only for late October and November. Comparable to tautog catches at the Chesapeake Bay Bridge Tunnel (CBBT) third island, catches elsewhere along the Bridge Tunnel complex averaged 1.0 fJSh per rod hour. The Tugboat Wreck site off Cape Henry produced tautog catch rates of 1.3 fish per rod hour while the Chesapeake Light Tower Reef provided catch rates of 0.8 fJSh. The Triangle Wrecks exhibited low catch rates of 0.2 per tautog per rod hour, and a relatively high release rate of fish. The only location with a higher release rate was the Chesapeake Light Tower (the tower structure itself), where only half as many trips resulted in 82% of all tautog caught being released, the released fish weighing generally less than one pound.
5

Of tautog kept, average weighlS ranged from 2.0 pounm at lhe Gwynn Island site to 3.9 pounm on the Triangle Wreck-Liberty Ships.
Seabass catch rates also appeared somewhat low at the targeted fJShing areas. ranging from 0.1 fish per rod hour at the Gwynn Island site to 2.4 fish per rod hour at the Triangle WreckLiberty Ships. As with tautog, no seabass catches were recorded at the Oceanview Reef, but trips to the site recorded in the sampling effort occurred just before and after lhe site was enhanced with 40 large concrete igloos. Some tautog were caught on the site by a few anglers in the fall. In contrast to seabass catches on other sites, the Parramore Reef produced calChes of 10.1 fish per hour. Unfortunately. only four trips were recorded in the sampling effort. making it impossible to know whether this catch rate was typical for the site over the entire season. Seabass catch rates at the Parramore Reef were two to ten times as great as those for tautog at the Gwynn Island Reef. the Chesapeake Light Tower Reef. Cape Henry Wrecks, Chesapeake Light Tower (structure only). and both portions of the Triangle Wrecks. At most fishing sites, more small sea~ were caught and released in comparison to tautog catches.
Most sea~ kept by flShermen weighed 1-2 pounds each. Combined catch rates of tautog and seabass ranged from 0.1 fish per rod hour at Gwynn Island. to 3.4 fl.sh per rod hour at the Triangle Wrecks. The Oceanview and Pamunore Reef sites were the exception to these catch rates, exhibiting respeclive catches of zero and 10.1 tautog-seabass per rod hour.
For those fishing areas where tautog and seabass were among the principal targeted species for the entire fishing season-CBBT-thinl island; Cape Henry Wrecks; Tugboat Wreck; Chesapeake Light Tower Reef; Triangle Wrecks, all trips combined; and the Parramore Reef-die mean quality rating of the fishing experience for the trips reconled ranged from 2.0 to 3.7. Since tautog and sea~ were the most often sought species at these sites. the quality rating largely refleclS
Appendix D (cont) 6
fishennen •s satisfaction with catches of these species. (A rating of 1 indicates that the overall fishing experience for the day was rated "poor"; 2 indicates "fair .. ; 3, "good"; 4, "very good ... and s. "excellent".)
Spot, Croaker and Gray Trout Catches
As expected, spot, croaker and gray bOut were primarily caught only at wreck/reef fishing areas in the mouth of the Bay and further up the estuary. Catch rates for spot and croaker ranged from 0.0 to S.4 ftsh per rod hour. with trout exhibiting catches of 0.0 to 0.9 fish per rod hour. The lowest C8lCh rates for spot were at the CBBT (third island), where the fish was not actually targeted by anglers (only tautog. seabass and flollllder were targeted), and the Oceanview Reef. where none were caught The Gwynn Island Reef produced the highest mean catch rates for spot (2.9 ftsh per rod hour). While only one croaker was included in the CBBT (third island) catches, 125 fish were caught in two trips on the Oceanview Reef, producing the highest catch rate for croaker among all areas from which trips were recorded.
Significant numbers of gray uout were recorded only in catches for trips made to non-third island areas of the CBBT and the Gwynn Island Reef. Only one or two bOut occurred in catches recorded at the Cape Henry Wrecks and CBBT (thinl island).
In comparing species preference patterns between the Gwynn Island Reef. Bridge Tunnel, and the Cape Henry Wrecks. fishermen targeted seabass or tauaog in over 60% of the trips and king mackerel in 33% of the trips to the latter site. In contrast. Gwynn Island reef fishermen targeted tautog in the spring (May) and fall (late October into November). then shifted their efforlS almost totally to spot, croaker and/or bOut from June through early October. Flounder were also sought by fishennen at the site during October, but no catches were recorded in trip interviews.
96
Bluefish, Flounder and Combined Catches of
Desirable Species
In light of their low catch rates. bluefish and flounder were almost incidental catches at those sites where catches occurred. although flounder were mentioned occasionally as targeted species for trips to the CBBT. Gwynn Island Reef and the Oceanview reef. Flounder were only recorded in catches for trips to the CBBT. the mean catch rates for the season being low (0.1 ftsh per rod hour). BlueflSh were never targeted by wreck flShennen in any of the trip interviews. A few bluefish were caught at the CBBT, the Chesapeake Light Tower Reef. the Cape Henry Wrecks, the Triangle Wrecks, and the Chesapeake Light Tower. with mean seasonal catch rates being 0.006 tQ 0.3 fish per rod hour. The fish were generally sought by fishermen targeting seabass, trout. or flounder at the CBBT: sea~ or tautog at the Light Tower Reef; king mackerel at the Cape Hemy Wrecks; and amberjack at the Triangle Wrecks, as well as at the Chesapeake Tower.
An examination of mean seasonal catch rates for all desirable (customarily edlole) species and flShing experience catch ratings indicated that only about half of the wreck/reef sites produced catches considered "good". Species generally not considered desirable (and generally released) were small "sand sharks" and "spiny" dogfish. most likely Squalus acanthias. The majority of the major f1Shing areas targeted by wreck/reef fishermen produced overall catch rates of 1.2-S.7 desirable fish per rod hour. The one e»-. ception was the Parramore Reef (10.3 f1Sh per rod hour). for which only four trips were recorded. The Gwynn Island Reef produced mean catch rates for desirable species of 3. 7 fish per rod hour. a rate only exceeded by the CBBT non- third island areas (S. 7 fish per rod hour). the Oceanview (S.4 fish per rod hour. based upon croaker caught during two trips). and the pre· viously mentioned Parramore Reef. <-

ARTIFICIAL REEF STUDY INTERVIEW LOG
DATE CAPT BOAT LENGTH ---- ----------- ------------ ----PRIVATE_CHARTER_PORT ___________ TARG SPEC __________ tl ANGLERS
H20 DEPTH §OTHER BOATS AREAl_...,,.. _________ T.EMP_(FT) _FISHING REEF ___________ _
TOTAL ti
RODS USED____fLHOOKS/ROD BAIT----------------------
TIME STARTED FISHING HOURS: ANCHORED DRIFT TROLL --------' ------ ---- ----STAGE OF TIDE (FLOOD.EBB.HI/LO SLACK) ----------------------------SE A COND'S./WATER CLARITY/CURRENTS: -----------------------
H20 DEPTH UOTHER BOATS AREA2.,_..-=----------T.EMP __ (FT) __ FISHING REEF ________ _
TOTAL fl RODS USED __ #HOOKS/ROD BAIT ____________________ _
TIME STARTED FISHING _______ HOURS ANCHORED ____ DRIFT ____ TROLL ___ _
STAGE OF TIDE (FLOOD.EBB.HI/LO SLACK) ----------------------------SE A COND'S./WATER CLARITY/CURRENTS:
SPECIES HOOKED # KEPT Sea bass Tautog Flounder Oyster toadfish Searobins Gray trout Spot Croaker Bluefish Amberjack King Mackerel Spanish Mackerel---Shark: ---Other: __ _
----------------------AVG. WT. II RELEASED AVG. WT. CATCH/ AREA FISHED
FISHING STRATEGY EACH AREA:---------------------------
AREA A. FISHING EXPERIENCE QUALITY RATING: POOR () FAIR ( ) GOOD () VERY GOOD () EXCELLENT ()
AREA B. FISHING EXPERIENCE QUALITY RATING: POOR () FAIR ( ) GOOD ( ) VERY GOOD ( ) EXCELLENT ()
Appendix E. Telephone survey instrument for the 1987 and 1988 sampling programs.