Constructal tree-shaped microchannel networks for maximizing the saturated critical heat flux
Upload
un-lincolnCategory
view
0download
0
ORIGINAL ARTICLE
Impacts of devegetation on the temporal evolution of soilsaturated hydraulic conductivity in a vegetated sand dune area
Tiejun Wang • Erkan Istanbulluoglu •
David Wedin • Paul Hanson
Received: 9 May 2014 / Accepted: 4 December 2014
� Springer-Verlag Berlin Heidelberg 2014
Abstract Soil saturated hydraulic conductivity (KS) is
partly affected by vegetation activities, which can either
increase KS by enhancing macropore flow or reduce KS by
clogging pore space. Despite the complex interactions of
KS with vegetation, the impact of devegetation on KS has
not been adequately addressed, particularly in regions that
are prone to drought-induced devegetation. In this study,
the impacts of devegetation on KS in a native grassland-
stabilized sand dune area were investigated by artificially
controlling surface vegetation at an experimental site in the
Nebraska Sand Hills. The experimental results revealed
that the temporal evolution of KS at the site was mainly
affected by the erosion processes triggered by devegeta-
tion. Over a short-term (about 1 year), the impact of de-
vegetation on KS was negligible, owing to that the
existence of dead root systems prevented erosion pro-
cesses. By comparison, the long-term impact of devegeta-
tion on KS emerged when devegetation-induced erosion
processes exposed deeper soil layers with higher KS. Par-
ticularly, the dunetop locations that experienced higher
erosion rates had larger temporal changes in KS. Thus, the
impacts of devegetation on KS mainly depended on two
factors (i.e., time and topographic locations) that were
related to erosion processes in this native grassland-stabi-
lized sand dune area. To further investigate the ecohydro-
logical implications of the temporal change in KS, a newly
developed ecohydrological model was also employed, and
the simulation results showed that the impacts of changes
in KS on water balance components and biomass produc-
tion were non-negligible and highly nonlinear. In spite of
previous studies, the findings presented here demonstrate
the close tie between near-surface hydrology and land
surface evolution processes controlled by vegetation in
sand dune areas, and highlight the importance of coupling
eco-hydro-geomorphic interactions in the context of cli-
mate change.
Keywords Saturated hydraulic conductivity � Nebraska
Sand Hills � Devegetation � Erosion processes �Ecohydrology
Introduction
Soil saturated hydraulic conductivity (KS) is an important
soil hydraulic property that affects subsurface movements
of water and solute (Amadi 2013; Zhang et al. 2013; Wang
et al. 2014a; Zhou et al. 2014). The spatiotemporal varia-
tions in KS are reflections of complex interactions among
different geological, biological, hydrological, and geo-
morphic processes (Wosten et al. 2001; Wilcox et al. 2003;
Lohse and Dietrich 2005). Among those processes, vege-
tation plays a pivotal role in modifying KS through dif-
ferent mechanisms. Depending on vegetation types, it may
either increase KS by enhancing macropore flow due to root
activities (Rasse et al. 2000; Green et al. 2003; Wilcox
et al. 2003; Li et al. 2008; Lichner et al. 2011), or reduce
KS by clogging pore space (Doerr et al. 2000; Belnap et al.
2003; Yair 2003). Despite the complex interactions of KS
with vegetation, the impact of devegetation on KS has been
rarely investigated, particularly in regions with fragile
ecosystems such as the Nebraska Sand Hills (NSH).
T. Wang (&) � D. Wedin � P. Hanson
School of Natural Resources, University of Nebraska-Lincoln,
Hardin Hall, 3310 Holdrege Street, Lincoln, NE 68583, USA
e-mail: [email protected]
E. Istanbulluoglu
Department of Civil and Environmental Engineering, University
of Washington, Seattle, WA, USA
123
Environ Earth Sci
DOI 10.1007/s12665-014-3936-8
The 58,000 km2 Nebraska Sand Hills is the largest
native grassland-stabilized sand dune area in the Western
Hemisphere, and poses unique ecological and hydrological
importance in the region (Loope and Swinehart 2000;
Wang et al. 2009a); however, severe drought-induced de-
vegetation had caused several times of dune mobilizations
in the past 10,000 years (Miao et al. 2007). Meanwhile, the
high infiltration capacity of sandy soils in the region makes
the NSH an important recharge area for the Ogallala
aquifer and leads to a unique hydrological system driven by
groundwater (Bleed and Flowerday 1998; Istanbulluoglu
et al. 2012a). To understand the spatial distribution patterns
of KS in the NSH, Wang et al. (2008) analyzed the effects
of depth and topographic positions on KS, and found that
KS was significantly correlated with both depth and ele-
vation. Wang et al. (2009b) further indicated that vegeta-
tion in the NSH may affect KS through altering soil organic
matter contents. However, given the vulnerability of the
NSH to devegetation and subsequent destabilizations, it
still remains unclear about which processes would affect
the temporal evolution of KS during the process of de-
vegetation, which may have important ecohydrological
implications for the NSH under climate change conditions.
To this end, field campaigns were carried out to measure
in situ KS at an experimental site in the NSH, at which
surface vegetation was artificially controlled. The objec-
tives of this study were twofold. The first goal was to
investigate the dominant mechanisms, through which de-
vegetation affected KS in the NSH. Second, to evaluate the
ecohydrological implications induced by changes in KS due
to devegetation, a newly developed ecohydrological model
was employed to simulate water balance and biomass
production in the NSH.
Materials and methods
Study site
This study was conducted at the Grassland Destabilization
EXperiment (GDEX) site in the eastern NSH (42�140N,
99�390W), which was constructed to investigate the eco-
logical and geomorphic stability of the sand dunes in the
NSH. The detailed information on the study site and the
experimental designs can be found elsewhere (Wang et al.
2008; http://snr.unl.edu/sandhills-biocomplexity/index.
htm), and only a brief overview is given here. The local
climate is semiarid with mean annual precipitation of
576 mm year-1. The landscape is mainly composed of
sand dunes covered by native warm season (C4) grasses
with aboveground biomass productivities ranging from 200
to 400 g m-2 year-1 (Istanbulluoglu et al. 2012b). Surface
soils in the top 10 cm are sandy at both ridges and swales
with average sand contents of 94.4 and 91.2 %, respec-
tively. Beneath 10 cm depths, average sand contents
slightly increase up to 97 %, regardless of topographic
positions. Soils are classified either as the Valentine series,
a mixed, mesic Typic Udipsamments that lacks any diag-
nostic subsurface horizon, or where A horizon exceeds
25 cm, as the Dunday series, a sandy, mixed, mesic Entic
Haplustolls with a diagnostic mollic epipedon. Optically
stimulated luminescence dating of the dune sediments in
the area indicated that the upper 5–7 m of the dunes were
typically 700–900 years old, suggesting the approximate
time of the last dune destabilization in the region (Miao
et al. 2007).
Ten circular plots, each with 120 m in diameter, were
constructed at the GDEX site. To study the impact of
vegetation on dune stability, vegetation covers were
experimentally controlled at the GDEX site. Among those
plots, Plot 2 was used as a control plot and represented
natural conditions without any disturbances (e.g., grazing),
vegetation at Plot 7 was completely removed by herbicide
and raking in May 2004, and vegetation at Plot 8 was also
killed by herbicide but left intact since May 2005. In
addition, erosion pins were installed at Plot 7 and Plot 8 to
monitor surface erosion rates at different topographic
locations.
In-situ measurements of KS
In-situ KS at the depths of 20, 50, and 100 cm was mea-
sured using a compact constant-head permeameter (Am-
oozegar 1989a; Fig. 1). The permeameter maintained a
constant water head in a borehole and measured the
Fig. 1 Schematic of the compact constant-head permeameter used
for measuring saturated hydraulic conductivity in this study (modified
from Amoozegar 1989a)
Environ Earth Sci
123
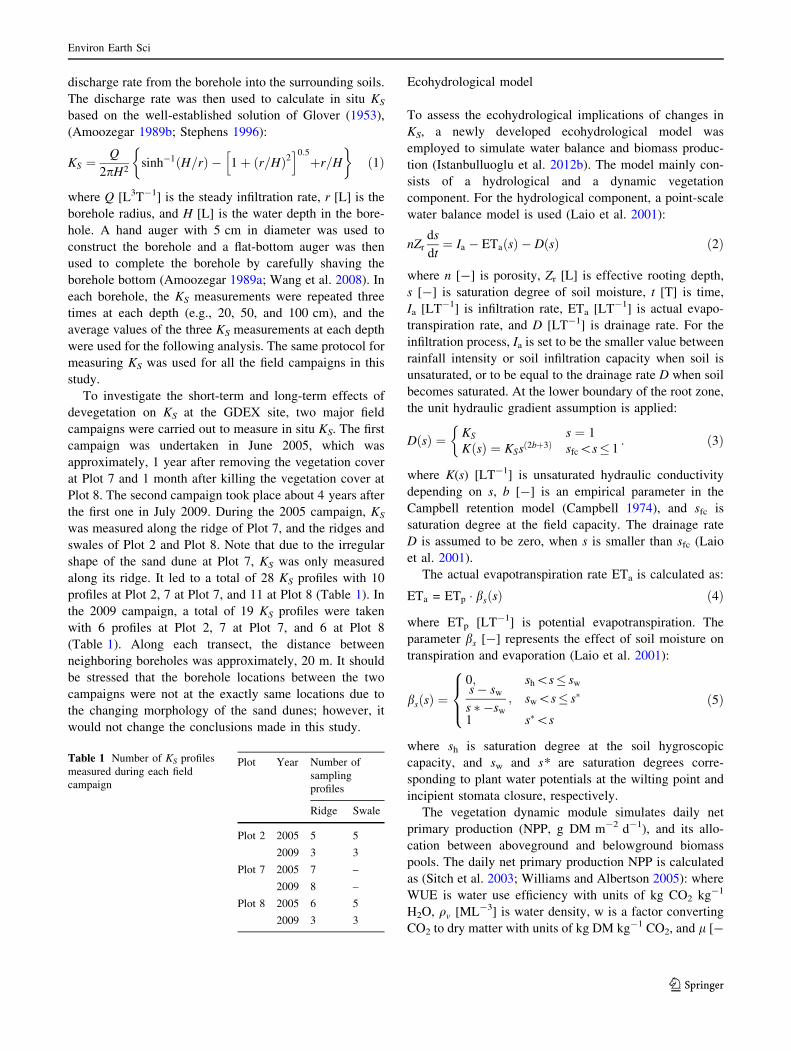
discharge rate from the borehole into the surrounding soils.
The discharge rate was then used to calculate in situ KS
based on the well-established solution of Glover (1953),
(Amoozegar 1989b; Stephens 1996):
KS ¼Q
2pH2sinh�1 H=rð Þ � 1þ r=Hð Þ2
h i0:5
þr=H
� �ð1Þ
where Q [L3T-1] is the steady infiltration rate, r [L] is the
borehole radius, and H [L] is the water depth in the bore-
hole. A hand auger with 5 cm in diameter was used to
construct the borehole and a flat-bottom auger was then
used to complete the borehole by carefully shaving the
borehole bottom (Amoozegar 1989a; Wang et al. 2008). In
each borehole, the KS measurements were repeated three
times at each depth (e.g., 20, 50, and 100 cm), and the
average values of the three KS measurements at each depth
were used for the following analysis. The same protocol for
measuring KS was used for all the field campaigns in this
study.
To investigate the short-term and long-term effects of
devegetation on KS at the GDEX site, two major field
campaigns were carried out to measure in situ KS. The first
campaign was undertaken in June 2005, which was
approximately, 1 year after removing the vegetation cover
at Plot 7 and 1 month after killing the vegetation cover at
Plot 8. The second campaign took place about 4 years after
the first one in July 2009. During the 2005 campaign, KS
was measured along the ridge of Plot 7, and the ridges and
swales of Plot 2 and Plot 8. Note that due to the irregular
shape of the sand dune at Plot 7, KS was only measured
along its ridge. It led to a total of 28 KS profiles with 10
profiles at Plot 2, 7 at Plot 7, and 11 at Plot 8 (Table 1). In
the 2009 campaign, a total of 19 KS profiles were taken
with 6 profiles at Plot 2, 7 at Plot 7, and 6 at Plot 8
(Table 1). Along each transect, the distance between
neighboring boreholes was approximately, 20 m. It should
be stressed that the borehole locations between the two
campaigns were not at the exactly same locations due to
the changing morphology of the sand dunes; however, it
would not change the conclusions made in this study.
Ecohydrological model
To assess the ecohydrological implications of changes in
KS, a newly developed ecohydrological model was
employed to simulate water balance and biomass produc-
tion (Istanbulluoglu et al. 2012b). The model mainly con-
sists of a hydrological and a dynamic vegetation
component. For the hydrological component, a point-scale
water balance model is used (Laio et al. 2001):
nZr
ds
dt¼ Ia � ETaðsÞ � DðsÞ ð2Þ
where n [-] is porosity, Zr [L] is effective rooting depth,
s [-] is saturation degree of soil moisture, t [T] is time,
Ia [LT-1] is infiltration rate, ETa [LT-1] is actual evapo-
transpiration rate, and D [LT-1] is drainage rate. For the
infiltration process, Ia is set to be the smaller value between
rainfall intensity or soil infiltration capacity when soil is
unsaturated, or to be equal to the drainage rate D when soil
becomes saturated. At the lower boundary of the root zone,
the unit hydraulic gradient assumption is applied:
DðsÞ ¼ KS s ¼ 1
KðsÞ ¼ KSsð2bþ3Þ sfc\s� 1
�: ð3Þ
where K(s) [LT-1] is unsaturated hydraulic conductivity
depending on s, b [-] is an empirical parameter in the
Campbell retention model (Campbell 1974), and sfc is
saturation degree at the field capacity. The drainage rate
D is assumed to be zero, when s is smaller than sfc (Laio
et al. 2001).
The actual evapotranspiration rate ETa is calculated as:
ETa = ETp � bsðsÞ ð4Þ
where ETp [LT-1] is potential evapotranspiration. The
parameter bs [-] represents the effect of soil moisture on
transpiration and evaporation (Laio et al. 2001):
bsðsÞ ¼0; sh\s� sws� sw
s � �sw
; sw\s� s�
1 s�\s
8><>:
ð5Þ
where sh is saturation degree at the soil hygroscopic
capacity, and sw and s* are saturation degrees corre-
sponding to plant water potentials at the wilting point and
incipient stomata closure, respectively.
The vegetation dynamic module simulates daily net
primary production (NPP, g DM m-2 d-1), and its allo-
cation between aboveground and belowground biomass
pools. The daily net primary production NPP is calculated
as (Sitch et al. 2003; Williams and Albertson 2005): where
WUE is water use efficiency with units of kg CO2 kg-1
H2O, qv [ML-3] is water density, w is a factor converting
CO2 to dry matter with units of kg DM kg-1 CO2, and l [-
Table 1 Number of KS profiles
measured during each field
campaign
Plot Year Number of
sampling
profiles
Ridge Swale
Plot 2 2005 5 5
2009 3 3
Plot 7 2005 7 –
2009 8 –
Plot 8 2005 6 5
2009 3 3
Environ Earth Sci
123
] is the ratio of nighttime to daytime CO2 exchange and
assumed to be 0.4 (Williams and Albertson 2005). The
annual NPP of the ecosystem (ANPP) is defined as the
maximum NPP during a year. The onsets of growing (GT:
growth threshold) and dormancy (DT: dormancy threshold)
seasons are dictated by a 30-day running average of ETp,
which is used as a surrogate for climatic conditions that
control the growth of vegetation.
The growth and decay of aboveground (i.e., Bg) and
belowground (i.e. Br) biomass are described by a com-
monly used first-order kinetic growth model. More spe-
cifically, NPP is partitioned between Bg and Br using an
allocation coefficient a that depends on available space
(Williams and Albertson 2005):
dBg
dt¼ NPP� a� ksgBg ð7Þ
dBr
dt¼ NPP� ð1� aÞ � ksrBd ð8Þ
dBr
dt¼ ksgBg � kddcBr ð9Þ
where Bd is dead biomass, ksg, ksr, and kdd are decay
coefficients for aboveground, root, and dead biomass,
respectively, and c is the dead biomass loss rate.
Results and discussions
Comparison of short-term and long-term effects
of devegetation on KS
To have an overall view of the short-term and long-term
effects of devegetation on KS, the profiles of average KS at
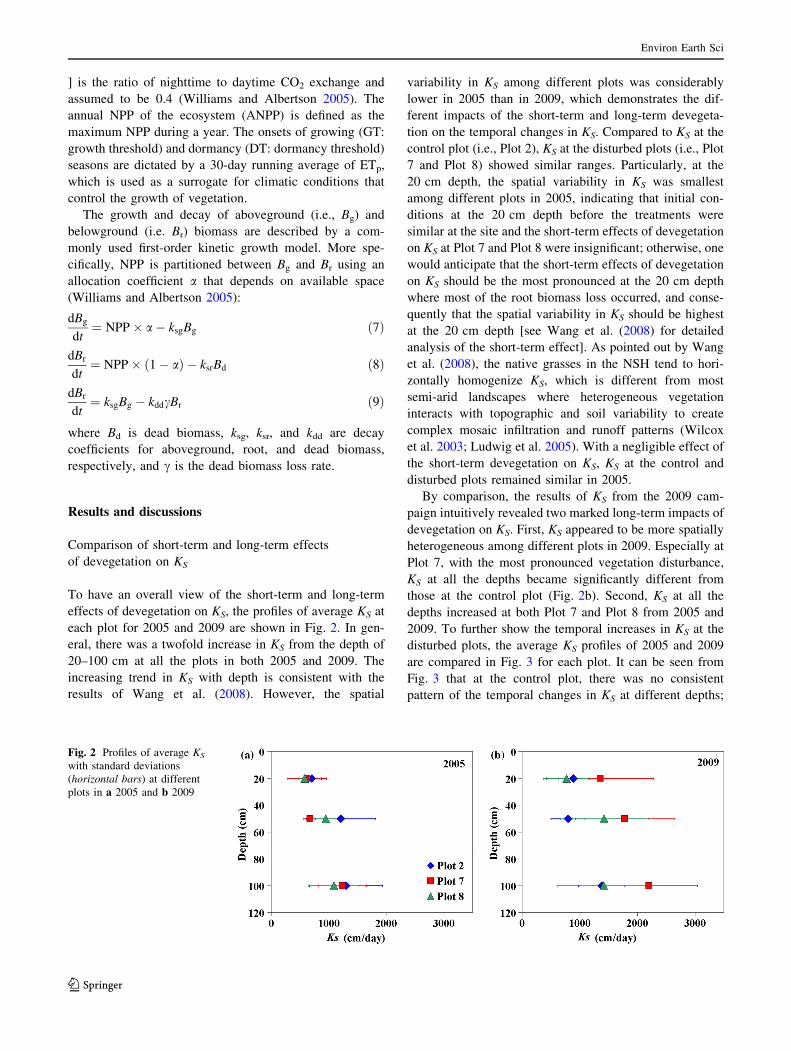
each plot for 2005 and 2009 are shown in Fig. 2. In gen-
eral, there was a twofold increase in KS from the depth of
20–100 cm at all the plots in both 2005 and 2009. The
increasing trend in KS with depth is consistent with the
results of Wang et al. (2008). However, the spatial
variability in KS among different plots was considerably
lower in 2005 than in 2009, which demonstrates the dif-
ferent impacts of the short-term and long-term devegeta-
tion on the temporal changes in KS. Compared to KS at the
control plot (i.e., Plot 2), KS at the disturbed plots (i.e., Plot
7 and Plot 8) showed similar ranges. Particularly, at the
20 cm depth, the spatial variability in KS was smallest
among different plots in 2005, indicating that initial con-
ditions at the 20 cm depth before the treatments were
similar at the site and the short-term effects of devegetation
on KS at Plot 7 and Plot 8 were insignificant; otherwise, one
would anticipate that the short-term effects of devegetation
on KS should be the most pronounced at the 20 cm depth
where most of the root biomass loss occurred, and conse-
quently that the spatial variability in KS should be highest
at the 20 cm depth [see Wang et al. (2008) for detailed
analysis of the short-term effect]. As pointed out by Wang
et al. (2008), the native grasses in the NSH tend to hori-
zontally homogenize KS, which is different from most
semi-arid landscapes where heterogeneous vegetation
interacts with topographic and soil variability to create
complex mosaic infiltration and runoff patterns (Wilcox
et al. 2003; Ludwig et al. 2005). With a negligible effect of
the short-term devegetation on KS, KS at the control and
disturbed plots remained similar in 2005.
By comparison, the results of KS from the 2009 cam-
paign intuitively revealed two marked long-term impacts of
devegetation on KS. First, KS appeared to be more spatially
heterogeneous among different plots in 2009. Especially at
Plot 7, with the most pronounced vegetation disturbance,
KS at all the depths became significantly different from
those at the control plot (Fig. 2b). Second, KS at all the
depths increased at both Plot 7 and Plot 8 from 2005 and
2009. To further show the temporal increases in KS at the
disturbed plots, the average KS profiles of 2005 and 2009
are compared in Fig. 3 for each plot. It can be seen from
Fig. 3 that at the control plot, there was no consistent
pattern of the temporal changes in KS at different depths;
Fig. 2 Profiles of average KS
with standard deviations
(horizontal bars) at different
plots in a 2005 and b 2009
Environ Earth Sci
123
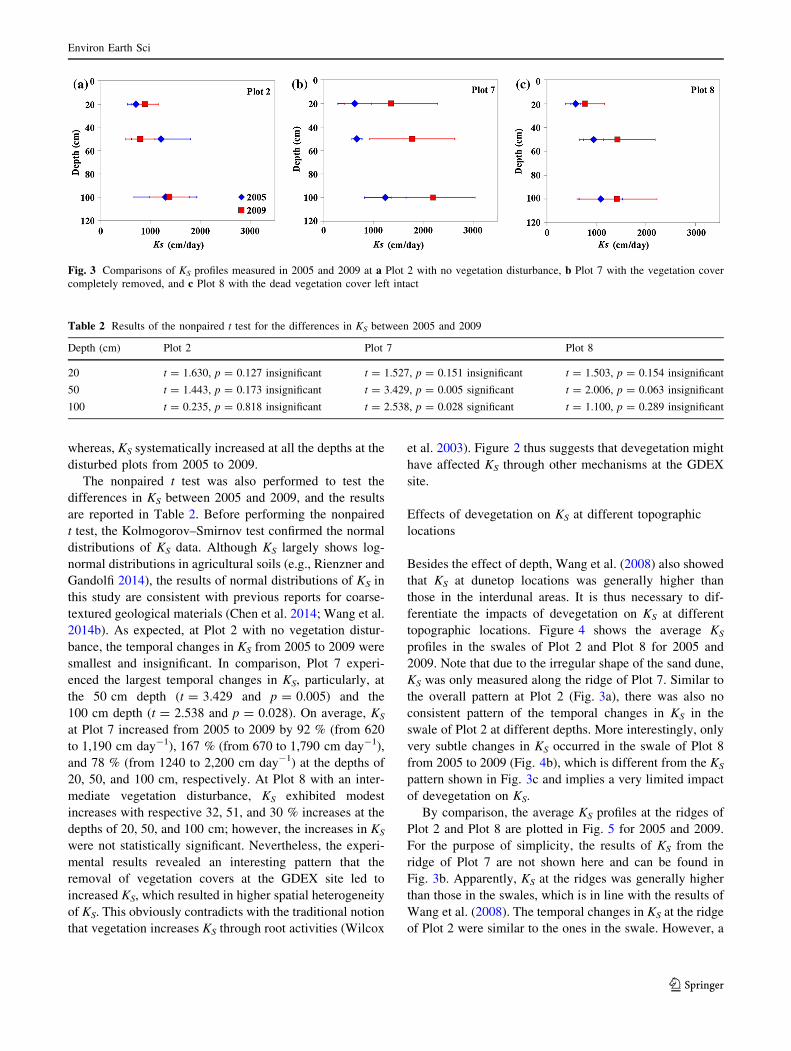
whereas, KS systematically increased at all the depths at the
disturbed plots from 2005 to 2009.
The nonpaired t test was also performed to test the
differences in KS between 2005 and 2009, and the results
are reported in Table 2. Before performing the nonpaired
t test, the Kolmogorov–Smirnov test confirmed the normal
distributions of KS data. Although KS largely shows log-
normal distributions in agricultural soils (e.g., Rienzner and
Gandolfi 2014), the results of normal distributions of KS in
this study are consistent with previous reports for coarse-
textured geological materials (Chen et al. 2014; Wang et al.
2014b). As expected, at Plot 2 with no vegetation distur-
bance, the temporal changes in KS from 2005 to 2009 were
smallest and insignificant. In comparison, Plot 7 experi-
enced the largest temporal changes in KS, particularly, at
the 50 cm depth (t = 3.429 and p = 0.005) and the
100 cm depth (t = 2.538 and p = 0.028). On average, KS
at Plot 7 increased from 2005 to 2009 by 92 % (from 620
to 1,190 cm day-1), 167 % (from 670 to 1,790 cm day-1),
and 78 % (from 1240 to 2,200 cm day-1) at the depths of
20, 50, and 100 cm, respectively. At Plot 8 with an inter-
mediate vegetation disturbance, KS exhibited modest
increases with respective 32, 51, and 30 % increases at the
depths of 20, 50, and 100 cm; however, the increases in KS
were not statistically significant. Nevertheless, the experi-
mental results revealed an interesting pattern that the
removal of vegetation covers at the GDEX site led to
increased KS, which resulted in higher spatial heterogeneity
of KS. This obviously contradicts with the traditional notion
that vegetation increases KS through root activities (Wilcox
et al. 2003). Figure 2 thus suggests that devegetation might
have affected KS through other mechanisms at the GDEX
site.
Effects of devegetation on KS at different topographic
locations
Besides the effect of depth, Wang et al. (2008) also showed
that KS at dunetop locations was generally higher than
those in the interdunal areas. It is thus necessary to dif-
ferentiate the impacts of devegetation on KS at different
topographic locations. Figure 4 shows the average KS
profiles in the swales of Plot 2 and Plot 8 for 2005 and
2009. Note that due to the irregular shape of the sand dune,
KS was only measured along the ridge of Plot 7. Similar to
the overall pattern at Plot 2 (Fig. 3a), there was also no
consistent pattern of the temporal changes in KS in the
swale of Plot 2 at different depths. More interestingly, only
very subtle changes in KS occurred in the swale of Plot 8
from 2005 to 2009 (Fig. 4b), which is different from the KS
pattern shown in Fig. 3c and implies a very limited impact
of devegetation on KS.
By comparison, the average KS profiles at the ridges of
Plot 2 and Plot 8 are plotted in Fig. 5 for 2005 and 2009.
For the purpose of simplicity, the results of KS from the
ridge of Plot 7 are not shown here and can be found in
Fig. 3b. Apparently, KS at the ridges was generally higher
than those in the swales, which is in line with the results of
Wang et al. (2008). The temporal changes in KS at the ridge
of Plot 2 were similar to the ones in the swale. However, a
Fig. 3 Comparisons of KS profiles measured in 2005 and 2009 at a Plot 2 with no vegetation disturbance, b Plot 7 with the vegetation cover
completely removed, and c Plot 8 with the dead vegetation cover left intact
Table 2 Results of the nonpaired t test for the differences in KS between 2005 and 2009
Depth (cm) Plot 2 Plot 7 Plot 8
20 t = 1.630, p = 0.127 insignificant t = 1.527, p = 0.151 insignificant t = 1.503, p = 0.154 insignificant
50 t = 1.443, p = 0.173 insignificant t = 3.429, p = 0.005 significant t = 2.006, p = 0.063 insignificant
100 t = 0.235, p = 0.818 insignificant t = 2.538, p = 0.028 significant t = 1.100, p = 0.289 insignificant
Environ Earth Sci
123
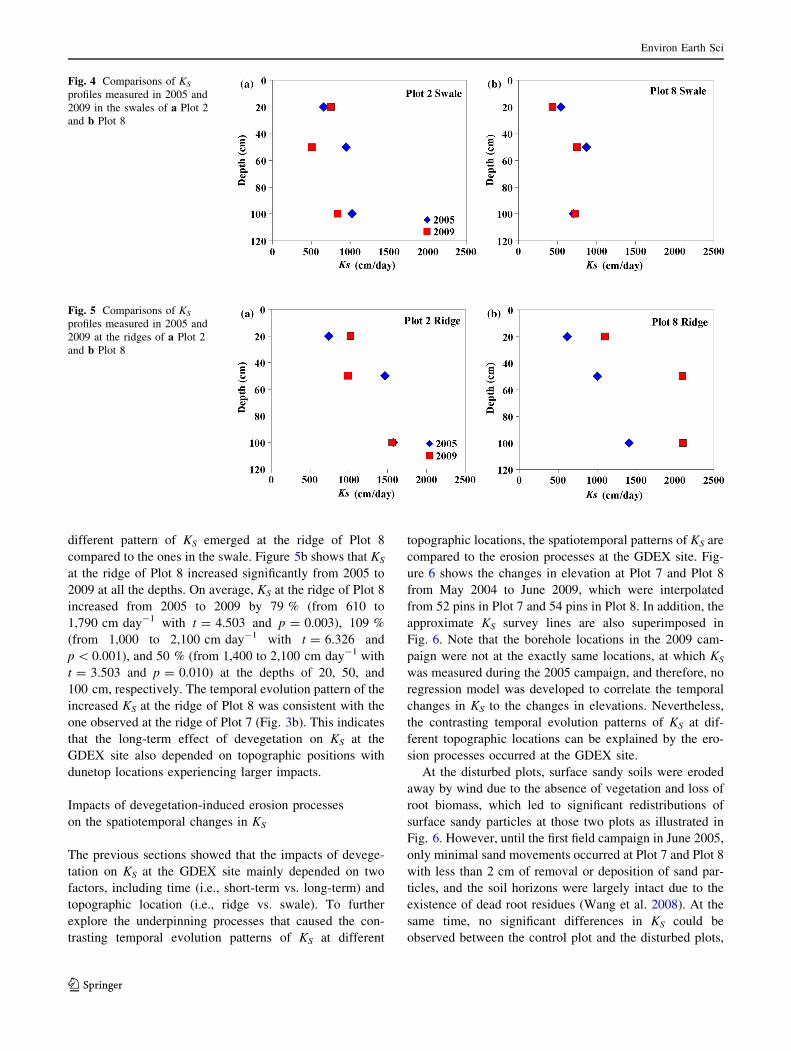
different pattern of KS emerged at the ridge of Plot 8
compared to the ones in the swale. Figure 5b shows that KS
at the ridge of Plot 8 increased significantly from 2005 to
2009 at all the depths. On average, KS at the ridge of Plot 8
increased from 2005 to 2009 by 79 % (from 610 to
1,790 cm day-1 with t = 4.503 and p = 0.003), 109 %
(from 1,000 to 2,100 cm day-1 with t = 6.326 and
p \ 0.001), and 50 % (from 1,400 to 2,100 cm day-1 with
t = 3.503 and p = 0.010) at the depths of 20, 50, and
100 cm, respectively. The temporal evolution pattern of the
increased KS at the ridge of Plot 8 was consistent with the
one observed at the ridge of Plot 7 (Fig. 3b). This indicates
that the long-term effect of devegetation on KS at the
GDEX site also depended on topographic positions with
dunetop locations experiencing larger impacts.
Impacts of devegetation-induced erosion processes
on the spatiotemporal changes in KS
The previous sections showed that the impacts of devege-
tation on KS at the GDEX site mainly depended on two
factors, including time (i.e., short-term vs. long-term) and
topographic location (i.e., ridge vs. swale). To further
explore the underpinning processes that caused the con-
trasting temporal evolution patterns of KS at different
topographic locations, the spatiotemporal patterns of KS are
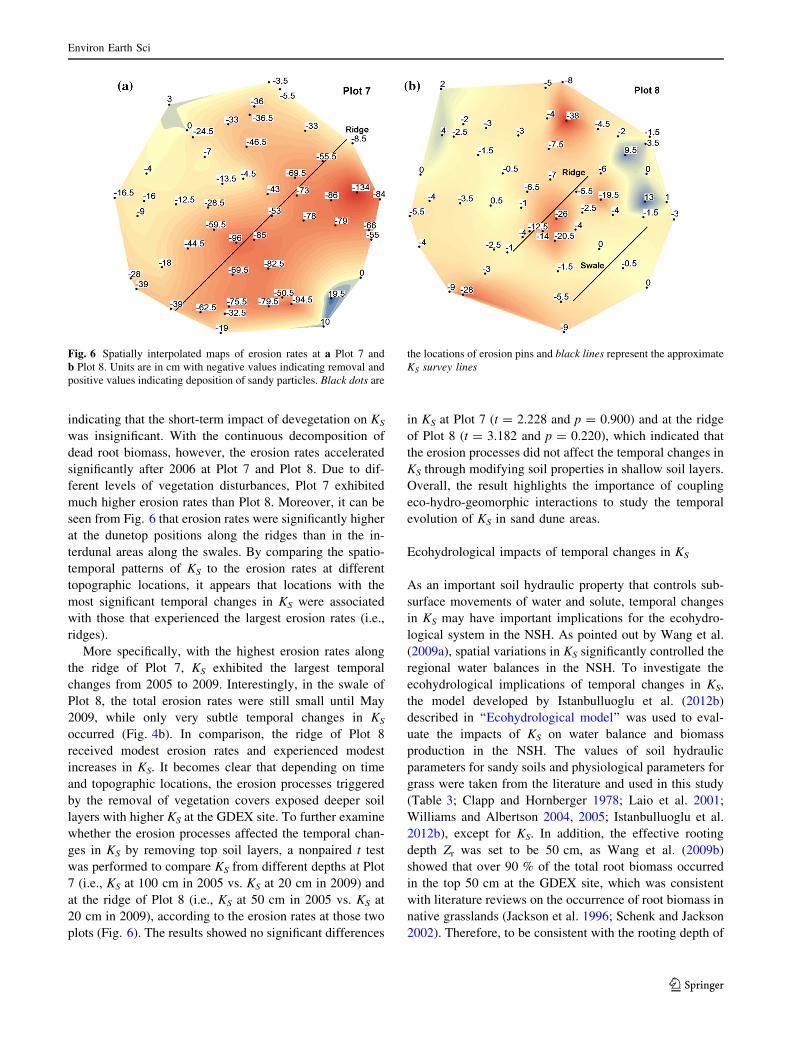
compared to the erosion processes at the GDEX site. Fig-
ure 6 shows the changes in elevation at Plot 7 and Plot 8
from May 2004 to June 2009, which were interpolated
from 52 pins in Plot 7 and 54 pins in Plot 8. In addition, the
approximate KS survey lines are also superimposed in
Fig. 6. Note that the borehole locations in the 2009 cam-
paign were not at the exactly same locations, at which KS
was measured during the 2005 campaign, and therefore, no
regression model was developed to correlate the temporal
changes in KS to the changes in elevations. Nevertheless,
the contrasting temporal evolution patterns of KS at dif-
ferent topographic locations can be explained by the ero-
sion processes occurred at the GDEX site.
At the disturbed plots, surface sandy soils were eroded
away by wind due to the absence of vegetation and loss of
root biomass, which led to significant redistributions of
surface sandy particles at those two plots as illustrated in
Fig. 6. However, until the first field campaign in June 2005,
only minimal sand movements occurred at Plot 7 and Plot 8
with less than 2 cm of removal or deposition of sand par-
ticles, and the soil horizons were largely intact due to the
existence of dead root residues (Wang et al. 2008). At the
same time, no significant differences in KS could be
observed between the control plot and the disturbed plots,
Fig. 4 Comparisons of KS
profiles measured in 2005 and
2009 in the swales of a Plot 2
and b Plot 8
Fig. 5 Comparisons of KS
profiles measured in 2005 and
2009 at the ridges of a Plot 2
and b Plot 8
Environ Earth Sci
123
indicating that the short-term impact of devegetation on KS
was insignificant. With the continuous decomposition of
dead root biomass, however, the erosion rates accelerated
significantly after 2006 at Plot 7 and Plot 8. Due to dif-
ferent levels of vegetation disturbances, Plot 7 exhibited
much higher erosion rates than Plot 8. Moreover, it can be
seen from Fig. 6 that erosion rates were significantly higher
at the dunetop positions along the ridges than in the in-
terdunal areas along the swales. By comparing the spatio-
temporal patterns of KS to the erosion rates at different
topographic locations, it appears that locations with the
most significant temporal changes in KS were associated
with those that experienced the largest erosion rates (i.e.,
ridges).
More specifically, with the highest erosion rates along
the ridge of Plot 7, KS exhibited the largest temporal
changes from 2005 to 2009. Interestingly, in the swale of
Plot 8, the total erosion rates were still small until May
2009, while only very subtle temporal changes in KS
occurred (Fig. 4b). In comparison, the ridge of Plot 8
received modest erosion rates and experienced modest
increases in KS. It becomes clear that depending on time
and topographic locations, the erosion processes triggered
by the removal of vegetation covers exposed deeper soil
layers with higher KS at the GDEX site. To further examine
whether the erosion processes affected the temporal chan-
ges in KS by removing top soil layers, a nonpaired t test
was performed to compare KS from different depths at Plot
7 (i.e., KS at 100 cm in 2005 vs. KS at 20 cm in 2009) and
at the ridge of Plot 8 (i.e., KS at 50 cm in 2005 vs. KS at
20 cm in 2009), according to the erosion rates at those two
plots (Fig. 6). The results showed no significant differences
in KS at Plot 7 (t = 2.228 and p = 0.900) and at the ridge
of Plot 8 (t = 3.182 and p = 0.220), which indicated that
the erosion processes did not affect the temporal changes in
KS through modifying soil properties in shallow soil layers.
Overall, the result highlights the importance of coupling
eco-hydro-geomorphic interactions to study the temporal
evolution of KS in sand dune areas.
Ecohydrological impacts of temporal changes in KS
As an important soil hydraulic property that controls sub-
surface movements of water and solute, temporal changes
in KS may have important implications for the ecohydro-
logical system in the NSH. As pointed out by Wang et al.
(2009a), spatial variations in KS significantly controlled the
regional water balances in the NSH. To investigate the
ecohydrological implications of temporal changes in KS,
the model developed by Istanbulluoglu et al. (2012b)
described in ‘‘Ecohydrological model’’ was used to eval-
uate the impacts of KS on water balance and biomass
production in the NSH. The values of soil hydraulic
parameters for sandy soils and physiological parameters for
grass were taken from the literature and used in this study
(Table 3; Clapp and Hornberger 1978; Laio et al. 2001;
Williams and Albertson 2004, 2005; Istanbulluoglu et al.
2012b), except for KS. In addition, the effective rooting
depth Zr was set to be 50 cm, as Wang et al. (2009b)
showed that over 90 % of the total root biomass occurred
in the top 50 cm at the GDEX site, which was consistent
with literature reviews on the occurrence of root biomass in
native grasslands (Jackson et al. 1996; Schenk and Jackson
2002). Therefore, to be consistent with the rooting depth of
Fig. 6 Spatially interpolated maps of erosion rates at a Plot 7 and
b Plot 8. Units are in cm with negative values indicating removal and
positive values indicating deposition of sandy particles. Black dots are
the locations of erosion pins and black lines represent the approximate
KS survey lines
Environ Earth Sci
123
Zr, average KS values measured in the top 50 cm were used
for calibrating the model and for the rest of the simulations.
To be more specific, after the model was calibrated to the
field observations at the GDEX site, two sets of simulations
were performed with different KS values. For the first set of
simulations, KS was set to be 600 cm day-1 (e.g., at Plot 2)
that represented pre-treatment conditions, while for the
second set of simulations, KS was set to be 1,500 cm day-1
(e.g., at Plot 7) that represented post-treatment conditions.
To calibrate the model, KS was first set to be
600 cm day-1, and the vegetation decay parameter for live
biomass (i.e., ksg) and the two phenological parameters
(i.e., GT and DT) were varied to match the observed and
simulated soil moisture content and live biomass in Plot 2.
The detailed calibration procedure is given in Istan-
bulluoglu et al. (2012b), and calibrated values of those
physiological and phenological parameters are also repor-
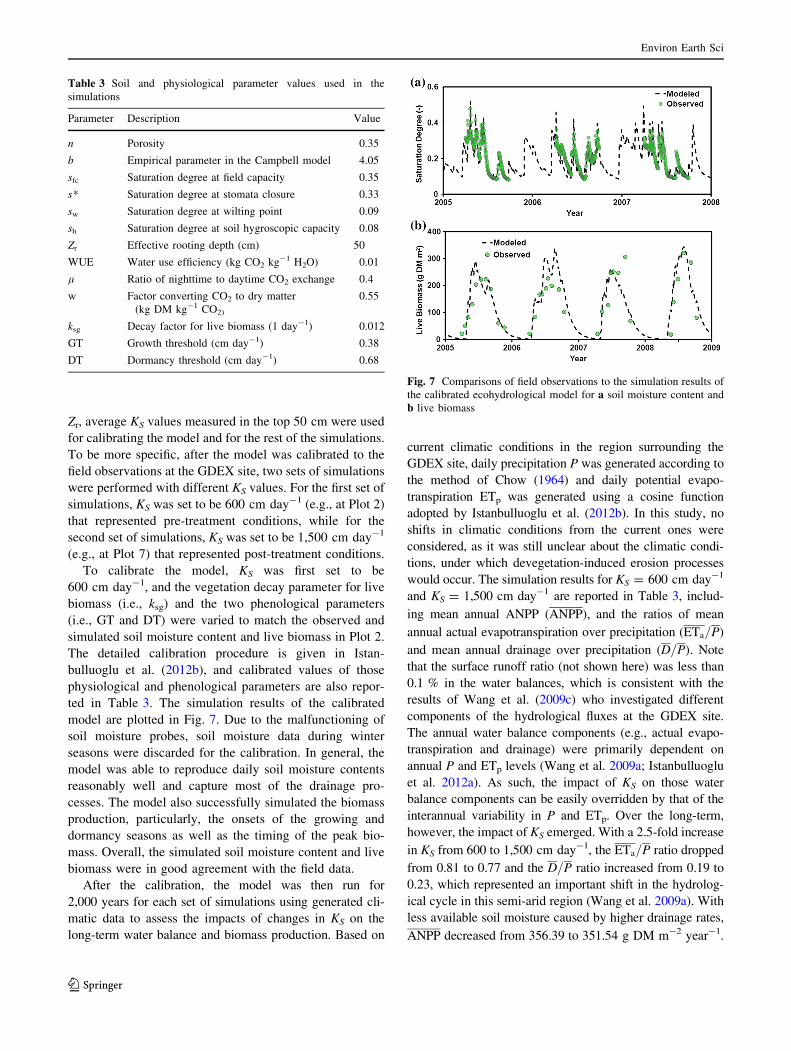
ted in Table 3. The simulation results of the calibrated
model are plotted in Fig. 7. Due to the malfunctioning of
soil moisture probes, soil moisture data during winter
seasons were discarded for the calibration. In general, the
model was able to reproduce daily soil moisture contents
reasonably well and capture most of the drainage pro-
cesses. The model also successfully simulated the biomass
production, particularly, the onsets of the growing and
dormancy seasons as well as the timing of the peak bio-
mass. Overall, the simulated soil moisture content and live
biomass were in good agreement with the field data.
After the calibration, the model was then run for
2,000 years for each set of simulations using generated cli-
matic data to assess the impacts of changes in KS on the
long-term water balance and biomass production. Based on
current climatic conditions in the region surrounding the
GDEX site, daily precipitation P was generated according to
the method of Chow (1964) and daily potential evapo-
transpiration ETp was generated using a cosine function
adopted by Istanbulluoglu et al. (2012b). In this study, no
shifts in climatic conditions from the current ones were
considered, as it was still unclear about the climatic condi-
tions, under which devegetation-induced erosion processes
would occur. The simulation results for KS = 600 cm day-1
and KS = 1,500 cm day-1 are reported in Table 3, includ-
ing mean annual ANPP (ANPP), and the ratios of mean
annual actual evapotranspiration over precipitation (ETa=P)
and mean annual drainage over precipitation (D=P). Note
that the surface runoff ratio (not shown here) was less than
0.1 % in the water balances, which is consistent with the
results of Wang et al. (2009c) who investigated different
components of the hydrological fluxes at the GDEX site.
The annual water balance components (e.g., actual evapo-
transpiration and drainage) were primarily dependent on
annual P and ETp levels (Wang et al. 2009a; Istanbulluoglu
et al. 2012a). As such, the impact of KS on those water
balance components can be easily overridden by that of the
interannual variability in P and ETp. Over the long-term,
however, the impact of KS emerged. With a 2.5-fold increase
in KS from 600 to 1,500 cm day-1, the ETa=P ratio dropped
from 0.81 to 0.77 and the D=P ratio increased from 0.19 to
0.23, which represented an important shift in the hydrolog-
ical cycle in this semi-arid region (Wang et al. 2009a). With
less available soil moisture caused by higher drainage rates,
ANPP decreased from 356.39 to 351.54 g DM m-2 year-1.
Fig. 7 Comparisons of field observations to the simulation results of
the calibrated ecohydrological model for a soil moisture content and
b live biomass
Table 3 Soil and physiological parameter values used in the
simulations
Parameter Description Value
n Porosity 0.35
b Empirical parameter in the Campbell model 4.05
sfc Saturation degree at field capacity 0.35
s* Saturation degree at stomata closure 0.33
sw Saturation degree at wilting point 0.09
sh Saturation degree at soil hygroscopic capacity 0.08
Zr Effective rooting depth (cm) 50
WUE Water use efficiency (kg CO2 kg-1 H2O) 0.01
l Ratio of nighttime to daytime CO2 exchange 0.4
w Factor converting CO2 to dry matter
(kg DM kg-1 CO2)
0.55
ksg Decay factor for live biomass (1 day-1) 0.012
GT Growth threshold (cm day-1) 0.38
DT Dormancy threshold (cm day-1) 0.68
Environ Earth Sci
123
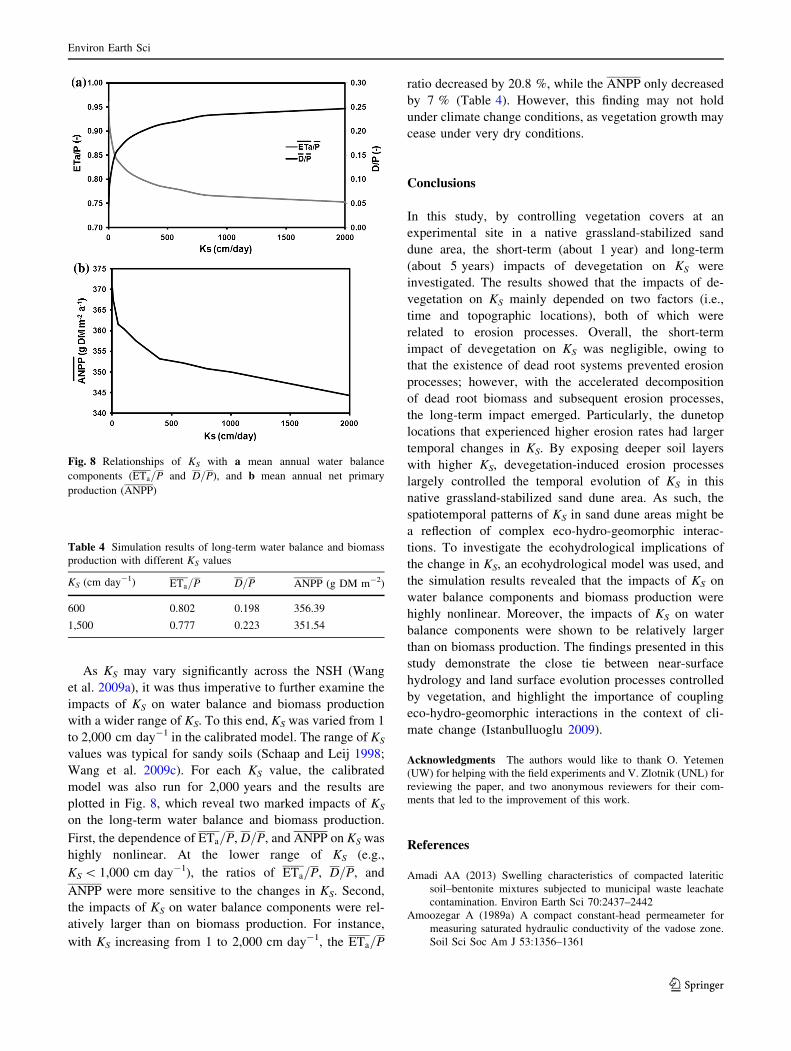
As KS may vary significantly across the NSH (Wang
et al. 2009a), it was thus imperative to further examine the
impacts of KS on water balance and biomass production
with a wider range of KS. To this end, KS was varied from 1
to 2,000 cm day-1 in the calibrated model. The range of KS
values was typical for sandy soils (Schaap and Leij 1998;
Wang et al. 2009c). For each KS value, the calibrated
model was also run for 2,000 years and the results are
plotted in Fig. 8, which reveal two marked impacts of KS
on the long-term water balance and biomass production.
First, the dependence of ETa=P, D=P, and ANPP on KS was
highly nonlinear. At the lower range of KS (e.g.,
KS \ 1,000 cm day-1), the ratios of ETa=P, D=P, and
ANPP were more sensitive to the changes in KS. Second,
the impacts of KS on water balance components were rel-
atively larger than on biomass production. For instance,
with KS increasing from 1 to 2,000 cm day-1, the ETa=P
ratio decreased by 20.8 %, while the ANPP only decreased
by 7 % (Table 4). However, this finding may not hold
under climate change conditions, as vegetation growth may
cease under very dry conditions.
Conclusions
In this study, by controlling vegetation covers at an
experimental site in a native grassland-stabilized sand
dune area, the short-term (about 1 year) and long-term
(about 5 years) impacts of devegetation on KS were
investigated. The results showed that the impacts of de-
vegetation on KS mainly depended on two factors (i.e.,
time and topographic locations), both of which were
related to erosion processes. Overall, the short-term
impact of devegetation on KS was negligible, owing to
that the existence of dead root systems prevented erosion
processes; however, with the accelerated decomposition
of dead root biomass and subsequent erosion processes,
the long-term impact emerged. Particularly, the dunetop
locations that experienced higher erosion rates had larger
temporal changes in KS. By exposing deeper soil layers
with higher KS, devegetation-induced erosion processes
largely controlled the temporal evolution of KS in this
native grassland-stabilized sand dune area. As such, the
spatiotemporal patterns of KS in sand dune areas might be
a reflection of complex eco-hydro-geomorphic interac-
tions. To investigate the ecohydrological implications of
the change in KS, an ecohydrological model was used, and
the simulation results revealed that the impacts of KS on
water balance components and biomass production were
highly nonlinear. Moreover, the impacts of KS on water
balance components were shown to be relatively larger
than on biomass production. The findings presented in this
study demonstrate the close tie between near-surface
hydrology and land surface evolution processes controlled
by vegetation, and highlight the importance of coupling
eco-hydro-geomorphic interactions in the context of cli-
mate change (Istanbulluoglu 2009).
Acknowledgments The authors would like to thank O. Yetemen
(UW) for helping with the field experiments and V. Zlotnik (UNL) for
reviewing the paper, and two anonymous reviewers for their com-
ments that led to the improvement of this work.
References
Amadi AA (2013) Swelling characteristics of compacted lateritic
soil–bentonite mixtures subjected to municipal waste leachate
contamination. Environ Earth Sci 70:2437–2442
Amoozegar A (1989a) A compact constant-head permeameter for
measuring saturated hydraulic conductivity of the vadose zone.
Soil Sci Soc Am J 53:1356–1361
Fig. 8 Relationships of KS with a mean annual water balance
components (ETa=P and D=P), and b mean annual net primary
production (ANPP)
Table 4 Simulation results of long-term water balance and biomass
production with different KS values
KS (cm day-1) ETa=P D=P ANPP (g DM m-2)
600 0.802 0.198 356.39
1,500 0.777 0.223 351.54
Environ Earth Sci
123
Amoozegar A (1989b) Comparison of the Glover solution with the
simultaneous equation approach for measuring hydraulic con-
ductivity. Soil Sci Soc Am J 53:1362–1367
Belnap J, Prasse R, Harper KT (2003) Influence of biological soil
crusts on soil environments and vascular plants. In: Belnap J,
Lange OL (eds) Biological soil crusts: structure, function, and
management, 2nd edn. Springer, Berlin, pp 281–300
Bleed AS, Flowerday CA (1998) An Atlas of the Sand Hills.
Conservation and Survey Division, University of Nebraska-
Lincoln, Lincoln, Nebraska
Campbell GS (1974) A simple method for determining unsaturated
conductivity from moisture retention data. Soil Sci
117:3311–3314
Chen X, Mi H, He H, Liu R, Gao M, Huo A, Cheng D (2014)
Hydraulic conductivity variation within and between layers of a
high floodplain profile. J Hydrol 515:147–155
Chow VT (1964) Handbook of applied hydrology. McGraw-Hill,
New York
Clapp RB, Hornberger GM (1978) Empirical equations for some
hydraulic properties. Water Resour Res 14:601–604
Doerr SH, Shakesby RA, Walsh RPD (2000) Soil water repellency: its
causes, characteristics and hydro-geomorphological significance.
Earth Sci Rev 51:33–65
Glover RE (1953) Flow for a test hole located above groundwater
level. In: Zangar CN (ed), Theory and Problems of Water
Percolation. Engineering Monograph, 8, US Bureau of Recla-
mation, p 60
Green TR, Ahujaa LR, Benjamin JG (2003) Advances and challenges
in predicting agricultural management effects on soil hydraulic
properties. Geoderma 116:3–27
Istanbulluoglu E (2009) An Eco-hydro-geomorphic perspective to
modeling the role of climate in catchment evolution. Geogr
Compass. doi:10.1111/j.1749-8198.2009.00229.x
Istanbulluoglu E, Wang TJ, Wright OM, Lenters JD (2012a)
Interpretation of hydrologic trends from a water balance
perspective: the role of groundwater storage in the Budyko
hypothesis. Water Resour Res 48:WOOH16
Istanbulluoglu E, Wang TJ, Wedin D (2012b) Evaluation of
ecohydrologic model parsimony at local and regional scales in
a semiarid grassland ecosystem. Ecohydrology 5:121–142
Jackson RB, Canadell J, Ehleringer JR, Mooney HA, Sala OE,
Schulze ED (1996) A global analysis of root distributions for
terrestrial biomes. Oecologia 108:389–411
Laio F, Porporato A, Ridolfi L, Rodriguez-Iturbe I (2001) Plants in
water controlled ecosystems: active role in hydrological pro-
cesses and response to water stress II. Probabilistic soil moisture
dynamics. Adv Water Resour 24:707–723
Li XY, Contreras S, Sole-Benet A (2008) Unsaturated hydraulic
conductivity in limestone dolines: influence of vegetation and
rock fragments. Geoderma 145:288–294
Lichner L, Eldridge DJ, Schacht K, Zhukova N, Holko L, Sır M,
Pecho J (2011) Grass cover influences hydrophysical parameters
and heterogeneity of water flow in a sandy soil. Pedosphere
21:719–729
Lohse KA, Dietrich WE (2005) Contrasting effects of soil develop-
ment on hydrological properties and flow paths. Water Resour
Res 41:W12419
Loope D, Swinehart J (2000) Thinking like a dune field: Geologic
history in the Nebraska Sand Hills. Great Plains Res 10:5–35
Ludwig JA, Wilcox BP, Breshears DD, Tongway DJ, Imeson AC
(2005) Vegetation patches and runoff-erosion as interacting
ecohydrological processes in semiarid landscapes. Ecology
86:288–297
Miao X, Mason JA, Swinehart JB, Loope DB, Hanson PR, Goble RJ,
Liu X (2007) A 10,000 year record of dune activity, dust storms,
and severe drought in the central Great Plains. Geology
35:119–122
Rasse DP, Smucker A, Santos D (2000) Alfalfa root and shoot
mulching effects on soil hydraulic properties and aggregation.
Soil Sci Soc Am J 64:725–731
Rienzner M, Gandolfi C (2014) Investigation of spatial and temporal
variability of saturated soil hydraulic conductivity at the field-
scale. Soil Tillage Res 135:28–40
Schaap MG, Leij FJ (1998) Database-related accuracy and uncer-
tainty of pedotransfer functions. Soil Sci 163:765–779
Schenk HJ, Jackson RB (2002) The global biogeography of roots.
Ecol Monogr 72:311–328
Sitch S, Smith B, Prentice IC, Arneth A, Bondeau A, Cramer W,
Kaplan JO, Levis S, Lucht W, Sykes MT, Thonicke K, Venevsky
S (2003) Evaluation of ecosystem dynamics, plant geography
and terrestrial carbon cycling in the LPJ dynamic global
vegetation model. Glob Change Biol 9:161–185
Stephens DB (1996) Vadose Zone Hydrology. CRC Press, Lewis
Publishers, New York
Wang TJ, Zlotnik VA, Wedin D, Wally KD (2008) Spatial trends in
saturated hydraulic conductivity of vegetated dunes in the
Nebraska Sand Hills: effects of depth and topography. J Hydrol
349:88–97
Wang TJ, Istanbulluoglu E, Lenters J, Scott D (2009a) On the role of
groundwater and soil texture in the regional water balance: An
investigation of the Nebraska Sand Hills, USA. Water Resour
Res 45:W10413
Wang TJ, Wedin D, Zlotnik VA (2009b) Field evidence of a negative
correlation between saturated hydraulic conductivity and soil
carbon in a sandy soil. Water Resour Res 45:W07503
Wang TJ, Zlotnik VA, Simunek J, Schaap MG (2009c) Using
pedotransfer functions in vadose zone models for estimating
groundwater recharge in semiarid regions. Water Resour Res
45:W04412
Wang J, Bai Z, Yang P (2014a) Mechanism and numerical simulation
of multicomponent solute transport in sodic soils reclaimed by
calcium sulfate. Environ Earth Sci 72:1–13
Wang TJ, Chen X, Tang AM, Cui YJ (2014b) On the use of the
similar media concept for scaling soil air permeability. Geoder-
ma 235:154–162
Wilcox BP, Breshears DD, Turin HJ (2003) Hydraulic conductivity in
a pinon-juniper woodland: influence of vegetation. Soil Sci Soc
Am J 67:1243–1249
Williams CA, Albertson JD (2004) Soil moisture controls on canopy-
scale water and carbon fluxes in an African savanna. Water
Resour Res 40:W09302
Williams CA, Albertson JD (2005) Contrasting short- and long-
timescales effects of vegetation dynamics on water and carbon
fluxes in water-limited ecosystems. Water Resour Res
41:W06005
Wosten JHM, Pachepsky YA, Rawls WJ (2001) Pedotransfer
functions: Bridging the gap between available basic soil data
and missing soil hydraulic characteristics. J Hydrol 251:123–150
Yair A (2003) Effects of biological soil crusts on water redistribution
in the Negev desert, Israel: A case study in longitudinal dunes.
In: Belnap J, Lange OL (eds) Biological soil crusts: structure,
function, and management, 2nd edn. Springer, Berlin,
pp 303–314
Zhang WJ, Zhang GG, Chen YM (2013) Analyses on a high leachate
mound in a landfill of municipal solid waste in China. Environ
Earth Sci 70:1747–1752
Zhou Z, Wang J, Huang Y, Xu H (2014) Conceptual data model and
method of settlement calculation for deformation and water
release from saturated soft soil. Environ Earth Sci 71:4235–4245
Environ Earth Sci
123
Copyright © 2022 FDOKUMEN