Infants' & Toddlers' Social Evaluations of Trustworthy and ...
Upload
independentCategory
view
1download
0
This article appeared in a journal published by Elsevier. The attachedcopy is furnished to the author for internal non-commercial researchand education use, including for instruction at the authors institution
and sharing with colleagues.
Other uses, including reproduction and distribution, or selling orlicensing copies, or posting to personal, institutional or third party
websites are prohibited.
In most cases authors are permitted to post their version of thearticle (e.g. in Word or Tex form) to their personal website orinstitutional repository. Authors requiring further information
regarding Elsevier’s archiving and manuscript policies areencouraged to visit:
http://www.elsevier.com/copyright
Author's personal copy
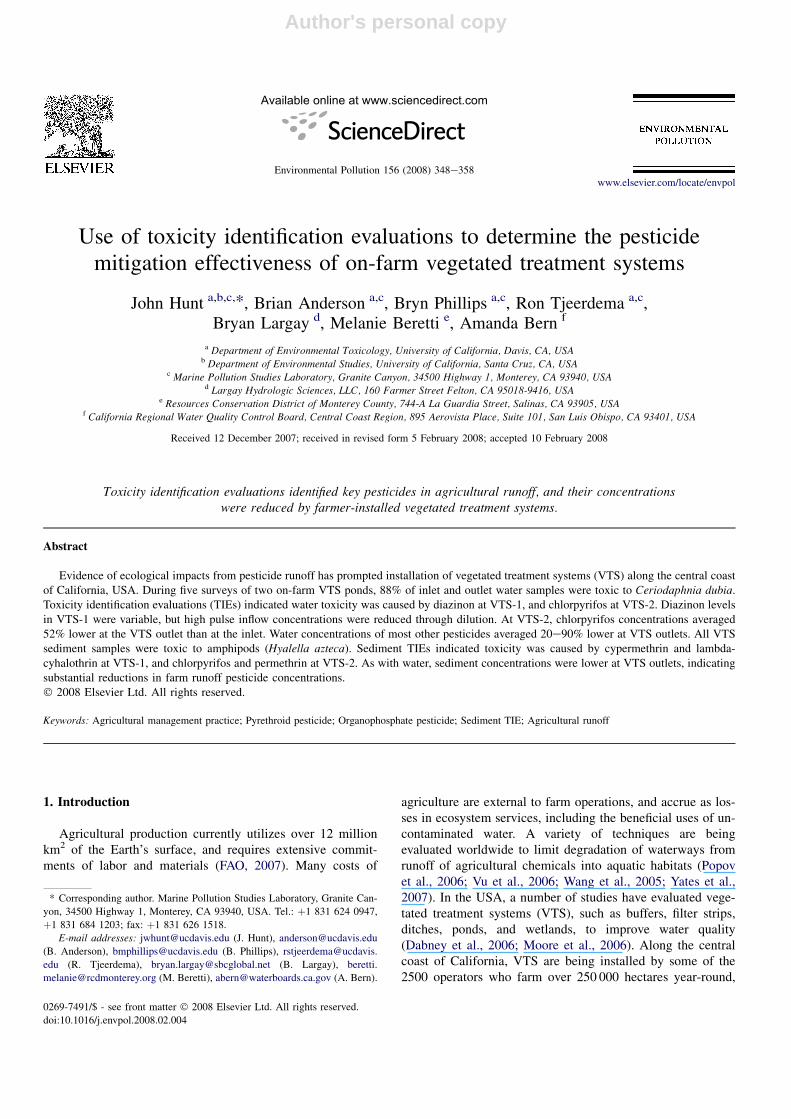
Use of toxicity identification evaluations to determine the pesticidemitigation effectiveness of on-farm vegetated treatment systems
John Hunt a,b,c,*, Brian Anderson a,c, Bryn Phillips a,c, Ron Tjeerdema a,c,Bryan Largay d, Melanie Beretti e, Amanda Bern f
a Department of Environmental Toxicology, University of California, Davis, CA, USAb Department of Environmental Studies, University of California, Santa Cruz, CA, USA
c Marine Pollution Studies Laboratory, Granite Canyon, 34500 Highway 1, Monterey, CA 93940, USAd Largay Hydrologic Sciences, LLC, 160 Farmer Street Felton, CA 95018-9416, USA
e Resources Conservation District of Monterey County, 744-A La Guardia Street, Salinas, CA 93905, USAf California Regional Water Quality Control Board, Central Coast Region, 895 Aerovista Place, Suite 101, San Luis Obispo, CA 93401, USA
Received 12 December 2007; received in revised form 5 February 2008; accepted 10 February 2008
Toxicity identification evaluations identified key pesticides in agricultural runoff, and their concentrationswere reduced by farmer-installed vegetated treatment systems.
Abstract
Evidence of ecological impacts from pesticide runoff has prompted installation of vegetated treatment systems (VTS) along the central coastof California, USA. During five surveys of two on-farm VTS ponds, 88% of inlet and outlet water samples were toxic to Ceriodaphnia dubia.Toxicity identification evaluations (TIEs) indicated water toxicity was caused by diazinon at VTS-1, and chlorpyrifos at VTS-2. Diazinon levelsin VTS-1 were variable, but high pulse inflow concentrations were reduced through dilution. At VTS-2, chlorpyrifos concentrations averaged52% lower at the VTS outlet than at the inlet. Water concentrations of most other pesticides averaged 20e90% lower at VTS outlets. All VTSsediment samples were toxic to amphipods (Hyalella azteca). Sediment TIEs indicated toxicity was caused by cypermethrin and lambda-cyhalothrin at VTS-1, and chlorpyrifos and permethrin at VTS-2. As with water, sediment concentrations were lower at VTS outlets, indicatingsubstantial reductions in farm runoff pesticide concentrations.� 2008 Elsevier Ltd. All rights reserved.
Keywords: Agricultural management practice; Pyrethroid pesticide; Organophosphate pesticide; Sediment TIE; Agricultural runoff
1. Introduction
Agricultural production currently utilizes over 12 millionkm2 of the Earth’s surface, and requires extensive commit-ments of labor and materials (FAO, 2007). Many costs of
agriculture are external to farm operations, and accrue as los-ses in ecosystem services, including the beneficial uses of un-contaminated water. A variety of techniques are beingevaluated worldwide to limit degradation of waterways fromrunoff of agricultural chemicals into aquatic habitats (Popovet al., 2006; Vu et al., 2006; Wang et al., 2005; Yates et al.,2007). In the USA, a number of studies have evaluated vege-tated treatment systems (VTS), such as buffers, filter strips,ditches, ponds, and wetlands, to improve water quality(Dabney et al., 2006; Moore et al., 2006). Along the centralcoast of California, VTS are being installed by some of the2500 operators who farm over 250 000 hectares year-round,
* Corresponding author. Marine Pollution Studies Laboratory, Granite Can-
yon, 34500 Highway 1, Monterey, CA 93940, USA. Tel.: þ1 831 624 0947,
þ1 831 684 1203; fax: þ1 831 626 1518.
E-mail addresses: [email protected] (J. Hunt), [email protected]
(B. Anderson), [email protected] (B. Phillips), rstjeerdema@ucdavis.
edu (R. Tjeerdema), [email protected] (B. Largay), beretti.
[email protected] (M. Beretti), [email protected] (A. Bern).
0269-7491/$ - see front matter � 2008 Elsevier Ltd. All rights reserved.
doi:10.1016/j.envpol.2008.02.004
Available online at www.sciencedirect.com
Environmental Pollution 156 (2008) 348e358www.elsevier.com/locate/envpol

Author's personal copy
producing nearly 200 different crops worth over $5 billion(CCRWQCB, 2004), while applying 7500 MT of pesticidesannually (active ingredient; PAN, 2007).
Numerous studies have documented pesticide toxicity andecological impacts in central coast streams (e.g., Andersonet al., 2003; CCAMP, 2007; Hunt et al., 1999; Phillips et al.,2006). An innovative regional program has been establishedto regulate non-point source pollution through adoption ofconditional agricultural discharge permit waivers. Waiverconditions require farm water quality management plans,which often include installation of VTS to mitigate runoff ofnutrients and pesticides (CCRWQCB, 2007). Many localfarmers have installed VTS with assistance from the countyResource Conservation Districts and the National ResourceConservation Service. In this study, VTS built by growerswere evaluated to provide feedback for system design andinformation for other growers considering VTS projects.Because this study evaluated VTS on working farms thatreceive intermittent runoff containing mixtures of unknownchemicals, it is distinct from previous studies that adminis-tered specific pesticides under controlled conditions intoexperimentally constructed VTS prototypes (e.g., Mooreet al., 2001, 2006; Sherrard, 2004). For this reason, toxicityidentification evaluations (TIEs) were employed here to iden-tify chemicals most likely to cause biological impacts, so thatVTS improvements could emphasize mitigation of theseconstituents. A number of advanced water and sediment TIEprocedures were employed (e.g., Anderson et al., 2007;Wheelock et al., 2004).
We investigated two vegetated pond systems to evaluatetheir effectiveness in reducing concentrations of pesticidesand nutrients. Both systems were originally constructed bythe farm operators to retain sediment. Vegetation, primarilyfloating pennywort (Hydrocotyle ranunculoides), was estab-lished to provide shade and a carbon source for denitrification,as well as plant and microbial substrate for pesticide retentionand breakdown. The fields draining to these VTS ponds havebeen treated with numerous pesticides, each potentially bestmitigated by different VTS components that promote photoly-sis, hydrolysis, volatilization, sorption to plant surfaces,microbial metabolism, or deposition in sediments (Hapemanet al., 2003). To evaluate mitigation of these mixtures, thisstudy employed a phased approach that began with toxicitytesting of VTS inlets and outlets, followed by TIEs of waterand sediment to identify chemicals of concern, and thenchemical analysis to measure the differences in contaminantconcentrations at the VTS inlets and outlets.
2. Methods
2.1. Vegetated treatment systems (VTS)
VTS-1 is a two-pond system vegetated with floating pennywort (Hydroco-
tyle ranunculoides), which formed a floating mat of roots and stems 0.5 to
1.0 m thick, with a typical biomass of 800 g/m2. The primary inlet drained
50 hectares, and the secondary inlet drained 3.5 hectares of irrigated row
crop vegetables. Water samples were collected just above the inlet (Fig. 1,
A) and near the pond outlets (Fig. 1, B and C). Sediment samples were
collected just above the inlet at A, and in the pond at C. VTS-2 is a single
pond system vegetated with three aquatic plants: duckweed (Lemna sp.),
watercress (Nasturtium sp.), and pennywort (Hydrocotyle ranunculoides),
which formed a floating mat of roots and stems 0.01 to 1.0 m thick. The
main inlet drained 35 hectares of greenhouse flower growing operations, and
the secondary inputs drain three 1-hectare outdoor flower nursery areas. Water
samples were collected just above the inlet (Fig. 2, A), and just below the
outlet (Fig. 2, B). Sediment samples were collected in the input ditch at A,
and in the pond immediately in front of the outlet culvert at B.
To evaluate VTS effectiveness in reducing pesticide concentrations, water
samples were collected at VTS inlets and outlets during five surveys, and
sediment was collected once. Water samples at VTS inlets were collected as
composites of three daily grab samples, while outflows were characterized
by a single grab sample taken on the third day. This was done because parcels
of water were presumed to channel through the ponds at rates faster than
nominal residence times (Table 1). Compositing was selected as a means of
obtaining an inlet sample that might be adequately compared to a day 3 outlet
sample, in which constituent concentrations were ‘‘smeared’’ by mixing as the
parcels passed through the ponds. Continuous sampling devices were not used
because of the inconsistent pulsed nature of the runoff inflows. All sampling
and analysis followed protocols and met objectives described by Puckett
(2002). Details for all methods are given by Hunt et al. (2007).
Flow at the VTS-1 inlet was measured in an HS flume (Brakensiek et al.,
1979), with an estimated error of less than 10%. Outflow at VTS-1 and inflow
at VTS-2 were calculated from depth measured near the pipe inlets and rating
curves developed using the broad crested weir equation and HEC-RAS 3.1.3
software (Brunner, 2002), with an estimated error of <25%.
Fig. 1. Schematic diagram of ponds at VTS-1, with sampling stations A, B,
and C. Upper pond is 27 m � 12 m � 1 m deep, and lower pond is 24 m �12 m � 2 m deep.
Fig. 2. Schematic diagram of pond at VTS-2, with sampling stations A and B.
The pond is 70 m by 12 m � 1 to 2.5 m deep.
349J. Hunt et al. / Environmental Pollution 156 (2008) 348e358

Author's personal copy
2.2. Toxicity testing and toxicity identification evaluation
Water toxicity was evaluated using the 7-day chronic test with the
planktonic crustacean Ceriodaphnia dubia (USEPA, 2002). Sediment toxicity
was assessed using the 10-day growth and survival test with the epibenthic
amphipod Hyalella azteca (USEPA, 2000).
Toxicity identification evaluations (TIEs) were performed on water sam-
ples using C. dubia, and on sediment solid-phase and interstitial water samples
using H. azteca. Each TIE manipulated the original sample (baseline) using
specific treatments to increase, decrease, or transform the bioavailable chem-
ical fractions of the sample to provide lines of evidence to identify constituents
causing observed test organism mortality (USEPA, 1991, 1993). The following
treatments were performed on a dilution series for both water and sediment
interstitial water samples (0% (treatment blank), 10%, 25%, 50%, and 100%).
1. Centrifugation e to reduce toxicity associated with particulates, and as
a pre-treatment for the solid-phase extraction columns.
2. Cation solid-phase extraction (SPE) column (Supelco Supelclean LC-
WCX, 3 mL, St. Louis, MO, USA) e to remove cationic metals.
3. Cation column eluate e 1 N hydrochloric acid (HCl) passed through
column to recover metals. The HCl was then added to 150 mL of clean
water and neutralized for toxicity testing.
4. HLB column (Oasis Hydrophilic-Lipophilic Balance (HLB)�, 6 mL,
500 mg, Waters Corporation, Milford, MA, USA) e to remove non-polar
organic chemicals.
5. HLB column eluate e methanol passed through the column to recover
sorbed organics. The methanol was evaporated to 1.5 mL and added to
150 mL of clean water for toxicity testing.
6. Sequential cation and HLB SPE columns e used in sequence to deter-
mine if toxicity was caused by both metals and organics.
7. Sequential column eluate e each column was individually eluted, as
above, to recover chemicals and toxicity.
8. Carboxylesterase enzyme (Sigma-Aldrich, St. Louis, MO) e added to
hydrolyze pyrethroid pesticides and reduce their toxicity (Wheelock
et al., 2004).
9. Bovine serum albumin (BSA, Sigma-Aldrich, St. Louis, MO) e added as
a control for the carboxylesterase enzyme, to differentiate between
carboxylesterase-specific pyrethroid hydrolysis and any general
sequestration of contaminants by proteins (Wheelock et al., 2004).
10. Piperonyl butoxide (PBO, Sigma-Aldrich, St. Louis, MO) e added to the
interstitial water to block metabolic transformation of organophosphate
(OP) pesticides into the toxic oxon form, thus reducing their toxicity.
PBO also synergizes pyrethroid toxicity (Kakko et al., 2000).
11. Carboxylesterase/PBO combination to resolve effects due to mixtures of
OP and pyrethroid pesticides.
Treatment blanks were employed for all treatments, and consisted of
control water that underwent the same manipulation as the sample.
For solid-phase sediment TIEs, a baseline sample was tested, and the
following treatments were performed on undiluted solid-phase sediment (see
Anderson et al., 2007 for complete methods):
1. Ambersorb 563� (Rohm and Haas, Spring House, PA, USA) e
carbonaceous, non-polar resin added to sorb non-polar organic com-
pounds from the sediment.
2. Ambersorb eluate e Ambersorb was sieved from the sediment at test
termination, and eluted in a column with acetone. After evaporation
and concentration, 1 mL of acetone was added to 100 mL of clean water
for toxicity testing.
3. Powdered coconut charcoal (PCC; 90e96%, Calgon Carbon, Pittsburgh,
PA, USA) e pyrolized, activated coconut husk ground to <45 mm. Like
Ambersorb, PCC is added to sediment to sorb organics, but its greater
surface area increases efficiency (Ho et al., 2004).
4. SIR-300 (ResinTech, West Berlin, NJ) e a macroporous weak acid cat-
ion exchange resin added to chelate heavy metal ions.
5. SIR-300 eluate e SIR-300 was sieved from the sediment, then eluted in
a column with 1 N hydrochloric acid. One milliliter of acid was then
combined with 100 mL of clean dilution water and neutralized for
toxicity testing.
6e8. Carboxylesterase enzyme, BSA, and PBO were added to sediment
overlying water as in the water treatments described above.
Each TIE included a dilution control, which consisted of 90% sample
sediment and 10% control sediment (v:v). This control was used to measure
any effects due to simple toxicant dilution arising from addition of treatment
resins. Control sediment was equal parts reference site sediment and kiln-dried
sand, with 0.75% added organic peat moss.
The magnitude of sample toxicity was characterized using toxic units
(TU). A sample TU equals 100 divided by the LC50 calculated using mortality
data from the sample dilution series. (LC50 is the median lethal concentration,
at which test organism mortality is 50%.) To characterize the potential toxicity
of individual chemicals measured in a sample, chemical specific TUs were
calculated as the concentration of the chemical in the sample divided by
that chemical’s known LC50 value.
2.3. Chemical analysis
Water samples were analyzed by gas chromatography mass spectrometry
(GCMS) using the following methods: organochlorines (USEPA, Method
8080), organophosphates (USEPA, Method 8140/8141), pyrethroids (USEPA,
8081BM). Chlorpyrifos and diazinon were also measured using enzyme-linked
immunosorbent assays (ELISA, Strategic Diagnostics Inc, Newark, DE),
following recommendations by Sullivan and Goh (2000). The following
methods were used for sediment analysis: organochlorines (USEPA, Method
8081), organophosphates (USEPA, Method 8141), and pyrethroids (USEPA,
Method 1660). All sediment concentrations are given in dry weight units,
except when normalized to organic carbon, as indicated.
To describe differences in contaminant concentrations between VTS
inflows (A) and outflows (B), the relative percent difference (RPD) was
calculated as:
100%��
0� ½A� � ½B�½A�
�
with negative results indicating a decrease. RPD values for water samples are
presented as the average for the five surveys.
3. Results
3.1. VTS hydrology
Runoff flow rates and pond residence times were calculatedto better interpret differences between inlet and outlet
Table 1
Summary of hydrologic data for sites VTS-1 and VTS-2
VTS-1 VTS-2
Production type Row crops Greenhouses
Drainage area (hectares) 50 35
Vegetated treatment system area including perimeter roads (hectares) 0.15 0.2
Vegetated treatment system volume (m3) 640 1350
Mean flow rate (L/s) 1.0 6.8
Nominal residence time (volume/flow rate in days) 7.4 2.3
350 J. Hunt et al. / Environmental Pollution 156 (2008) 348e358
Author's personal copy
pesticide concentrations. No rain events or stormwater runoffoccurred during the study; discharge to the ponds consistedsolely of irrigation runoff. Tile drainage was not used on eitherfarm, and there was no evidence of groundwater seepage intothe ponds.
The runoff hydrology on the two sites varied considerably.VTS-1 was characterized by highly variable inlet flow rates.Irrigation events typically lasted about 12 h, and runoffstopped within 4 h of the end of irrigation. Irrigation eventsoccurred as frequently as three times in 4 days, and asinfrequently as once in 5 days. Absent an irrigation event,no flow occurred. The mean flow rate measured during thestudy period (including periods of no flow) was 1.0 L/s (Table1). VTS-2 was characterized by continuous and relativelyconsistent flow averaging 6.8 L/s.
3.2. VTS-1 water toxicity and chemistry
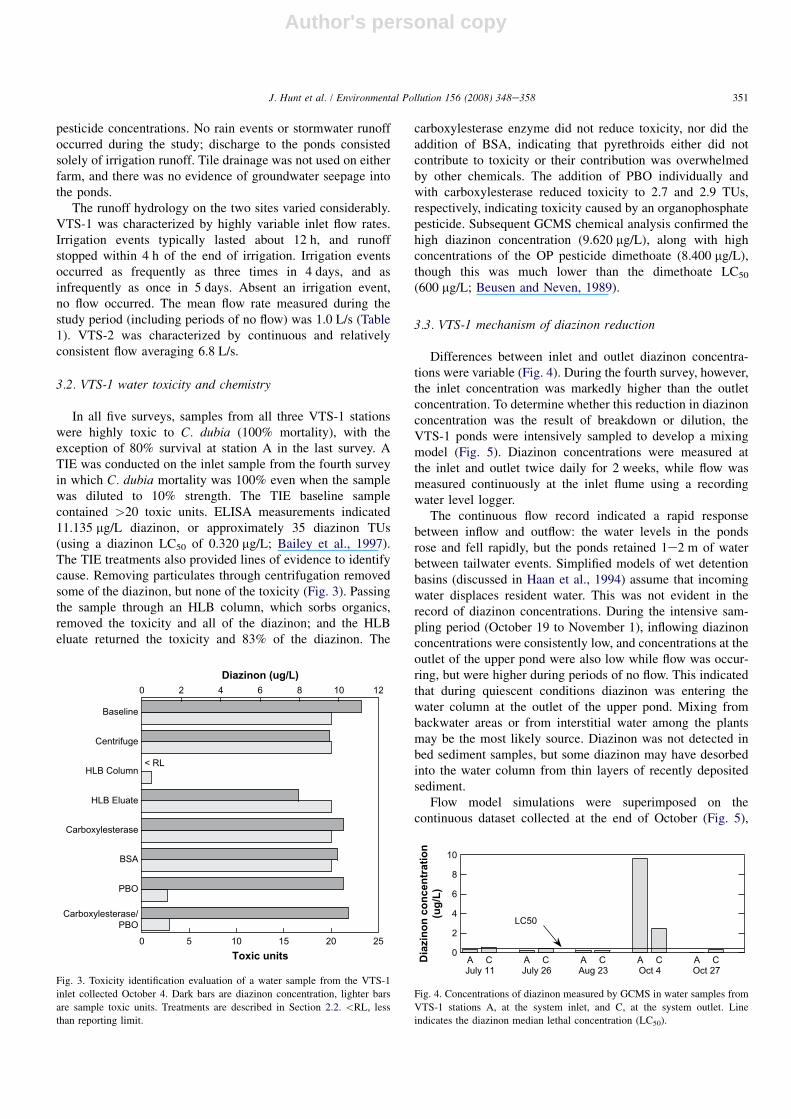
In all five surveys, samples from all three VTS-1 stationswere highly toxic to C. dubia (100% mortality), with theexception of 80% survival at station A in the last survey. ATIE was conducted on the inlet sample from the fourth surveyin which C. dubia mortality was 100% even when the samplewas diluted to 10% strength. The TIE baseline samplecontained >20 toxic units. ELISA measurements indicated11.135 mg/L diazinon, or approximately 35 diazinon TUs(using a diazinon LC50 of 0.320 mg/L; Bailey et al., 1997).The TIE treatments also provided lines of evidence to identifycause. Removing particulates through centrifugation removedsome of the diazinon, but none of the toxicity (Fig. 3). Passingthe sample through an HLB column, which sorbs organics,removed the toxicity and all of the diazinon; and the HLBeluate returned the toxicity and 83% of the diazinon. The
carboxylesterase enzyme did not reduce toxicity, nor did theaddition of BSA, indicating that pyrethroids either did notcontribute to toxicity or their contribution was overwhelmedby other chemicals. The addition of PBO individually andwith carboxylesterase reduced toxicity to 2.7 and 2.9 TUs,respectively, indicating toxicity caused by an organophosphatepesticide. Subsequent GCMS chemical analysis confirmed thehigh diazinon concentration (9.620 mg/L), along with highconcentrations of the OP pesticide dimethoate (8.400 mg/L),though this was much lower than the dimethoate LC50
(600 mg/L; Beusen and Neven, 1989).
3.3. VTS-1 mechanism of diazinon reduction
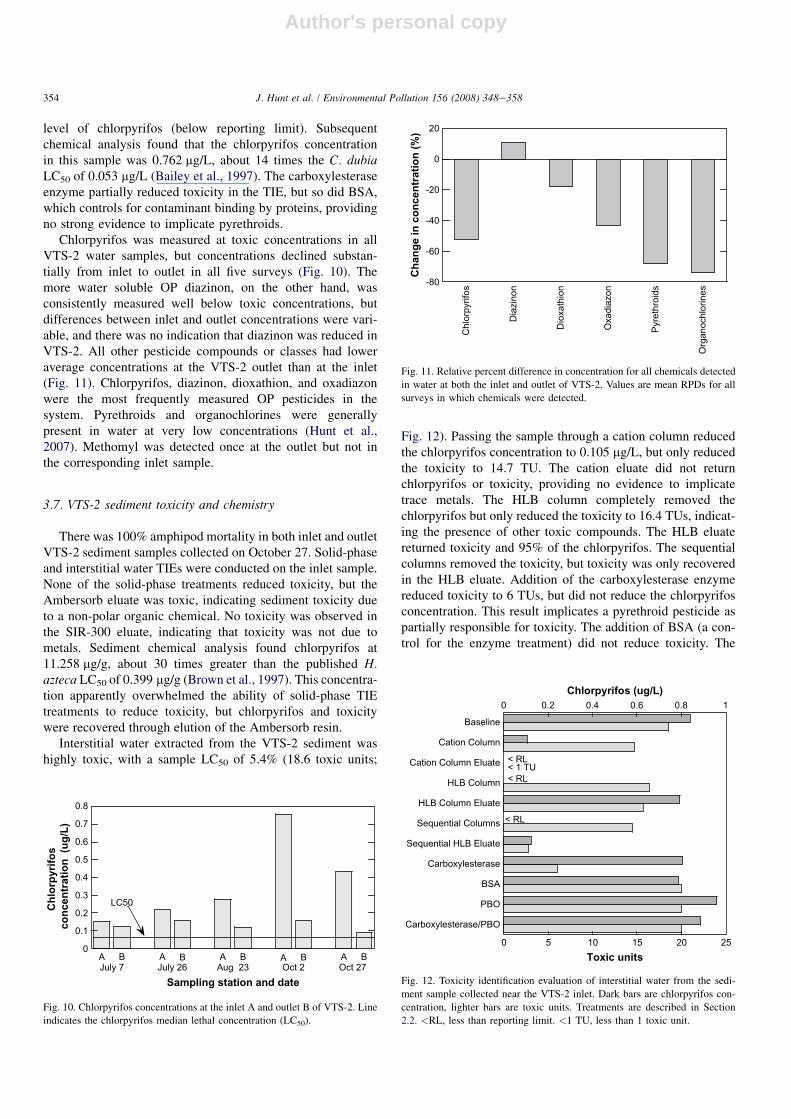
Differences between inlet and outlet diazinon concentra-tions were variable (Fig. 4). During the fourth survey, however,the inlet concentration was markedly higher than the outletconcentration. To determine whether this reduction in diazinonconcentration was the result of breakdown or dilution, theVTS-1 ponds were intensively sampled to develop a mixingmodel (Fig. 5). Diazinon concentrations were measured atthe inlet and outlet twice daily for 2 weeks, while flow wasmeasured continuously at the inlet flume using a recordingwater level logger.
The continuous flow record indicated a rapid responsebetween inflow and outflow: the water levels in the pondsrose and fell rapidly, but the ponds retained 1e2 m of waterbetween tailwater events. Simplified models of wet detentionbasins (discussed in Haan et al., 1994) assume that incomingwater displaces resident water. This was not evident in therecord of diazinon concentrations. During the intensive sam-pling period (October 19 to November 1), inflowing diazinonconcentrations were consistently low, and concentrations at theoutlet of the upper pond were also low while flow was occur-ring, but were higher during periods of no flow. This indicatedthat during quiescent conditions diazinon was entering thewater column at the outlet of the upper pond. Mixing frombackwater areas or from interstitial water among the plantsmay be the most likely source. Diazinon was not detected inbed sediment samples, but some diazinon may have desorbedinto the water column from thin layers of recently depositedsediment.
Flow model simulations were superimposed on thecontinuous dataset collected at the end of October (Fig. 5),
0 5 10 15 20 25
0 2 4 6 8 10 12
Carboxylesterase/PBO
PBO
BSA
Carboxylesterase
HLB Eluate
HLB Column
Centrifuge
Baseline
Toxic units
Diazinon (ug/L)
< RL
Fig. 3. Toxicity identification evaluation of a water sample from the VTS-1
inlet collected October 4. Dark bars are diazinon concentration, lighter bars
are sample toxic units. Treatments are described in Section 2.2. <RL, less
than reporting limit.
0
2
4
6
8
10
A C A C A C A C A CDia
zino
n co
ncen
trat
ion
(ug/
L)
July 11 July 26 Aug 23 Oct 4 Oct 27
LC50
Fig. 4. Concentrations of diazinon measured by GCMS in water samples from
VTS-1 stations A, at the system inlet, and C, at the system outlet. Line
indicates the diazinon median lethal concentration (LC50).
351J. Hunt et al. / Environmental Pollution 156 (2008) 348e358

Author's personal copy
and illustrated the dominant effect of the October 4 spike onconcentration data collected through the rest of the month. Itis likely that the change in concentration between inlet andoutlet was due primarily to in-pond dilution of the October4 spike, despite other potential loading events and degradationof diazinon during this period. Diazinon photolysis half-livesin water are on the order of weeks to months at pH 7e9(Novartis, 1997). It therefore appears that for this watersoluble pesticide, the critical function of the pond was to serveas a reservoir to dilute peak inflow concentrations. Othertreatment mechanisms likely apply to the more hydrophobiccompounds discussed below.
3.4. Overall changes in water pesticideconcentrations at VTS-1
Twenty-three synthetic organic pesticides were detected byGCMS analysis of VTS-1 water samples, including five organ-ophosphates, three carbamates, four pyrethroids, and tenorganochlorines (Hunt et al., 2007). Of these, only diazinon(9.620 mg/L) and p0,p0-DDT (0.094 mg/L) were measuredabove available LC50 values (Bailey et al., 1997; Phippset al., 1995, respectively). While changes in diazinon concen-trations were variable, other OP pesticides and carbamates(carbaryl and carbofuran) had lower average concentrationsin the outlet samples than in the corresponding inlet samples(Fig. 6). The same was true for the organochlorines, whichwere generally found at low concentrations. The averagedifference in pyrethroids reflects generally low concentrations,including many non-detects at one station or the other thattended to skew the mean. In the one case in which a relativehigh pyrethroid concentration was measured (608 ng/L cyper-methrin at the inlet), this compound was not detected at theoutlet (Hunt et al., 2007). (Note that all pyrethroid concentra-tions are given here in units of ng/L.) Chlorpyrifos, diazinon,permethrin, dacthal, DDE( p,p0) and methomyl were detectedin some outlet samples when not found in the corresponding
inlet samples. Possible explanations for this include fluxfrom pond sediments or variability in residence times forcontaminants entering the ponds in pulse runoff events.
3.5. VTS-1 sediment toxicity and chemistry
Amphipod mortality was high in sediments collected fromboth VTS-1 stations (A and C), with 100% mortality at theinlet, and 72% mortality at the outlet. A sediment TIE wasconducted on the inlet sample, and produced the followinglines of evidence to identify the cause of toxicity. The additionof powdered coconut charcoal to the sediment decreasedmortality to 50%, indicating toxicity was caused by a non-polar organic compound (Fig. 7). Addition of Ambersorb didnot reduce toxicity, but the Ambersorb eluate caused 100%mortality, further supporting the implication of a non-polarorganic. In separate treatments, the addition of carboxylester-ase to the sediment overlying water reduced mortality to 22%,indicating toxicity caused by a pyrethroid.
0
2
4
6
8
10
12
9/30 10/5 10/10 10/15 10/20 10/25 10/30
Dia
zino
n co
ncen
trat
ion
(ug/
L)
inlet A (measured)pond 1 outlet B (measured)
pond 2 outlet C (measured)inlet A (model)pond 1 outlet B (model)pond 2 outlet C (model)
inlet pulse
Fig. 5. VTS-1 diazinon concentrations from field measurements and as predicted by a hydraulic mixing model, assuming diazinon behavior as a non-reactive tracer
(i.e., no degradation). Measured diazinon concentrations are indicated by the symbols, which are connected by ‘‘measured’’ curves for the 2-week intensive
sampling period, lower right. Smooth curves indicate modeled concentrations at stations B and C, assuming the measured elevated diazinon inflow pulse, shown
by the rectangular curve for the 3-day composite sample at the inlet A.
-100
-80
-60
-40
-20
0
20
Dim
etho
tae
Ethi
on
Mal
athi
on
Thio
nazi
n
Car
bary
l
Car
bofu
ran
Pyre
thro
ids
Org
anoc
hlor
ines
Cha
nge
in
conc
entr
atio
n (%
)
Fig. 6. Relative percent difference between VTS-1 inlet and outlet concentra-
tions for all pesticide compounds or classes detected in water samples. Values
are means for all surveys in which chemicals were detected. Negative values
indicate lower outlet concentrations.
352 J. Hunt et al. / Environmental Pollution 156 (2008) 348e358

Author's personal copy
In the corresponding interstitial water TIE, water ex-tracted from VTS-1 sediment contained 6.3 TUs, but only0.234 mg/L diazinon, well below the amphipod H. aztecaLC50 of 6.210 mg/L (Phipps et al., 1995). The HLB columnreduced toxicity to 2.4 TUs, and baseline toxicity wasrecovered in the HLB eluate (Fig. 8). Addition of theenzyme to the interstitial water removed nearly all toxicity,while the addition of BSA reduced toxicity by only 1.5TUs. Addition of PBO, which synergizes pyrethroidtoxicity, increased toxicity to 20 TUs, and the addition ofcarboxylesterase and PBO in combination reduced thetoxicity to 3.5 TUs. These results provide strong evidencethat toxicity was caused by a pyrethroid. SubsequentGCMS analysis measured 66.4 ng/g of the pyrethroidpesticide cypermethrin in the sediment. This dry weightvalue is equivalent to an organic carbon normalized concen-tration of 2800 ng/g OC, which is well above the LC50 of400 ng/g OC (Maund et al., 2002). The pyrethroid pesticidelambda-cyhalothrin was also present at toxic concentrationsin this sample: 18.8 ng/g dry weight, compared to an LC50
of 5.6 ng/g (Amweg et al., 2005), and an organic carbonnormalized concentration of 0.79 ng/g OC, compared toan LC50 value of 0.45 ng/g OC.
Trends in sediment chemical concentrations at VTS-1 weremost pronounced for the pyrethroid pesticides. Cypermethrinand lambda-cyhalothrin, both implicated as causes of sedimenttoxicity, were measured at higher concentrations in sedimentscollected at the inlet than at the outlet. Cypermethrin wasmeasured at 66.4 ng/g at the inlet, and was below the 2 ng/gdetection limit at the outlet. Lambda-cyhalothrin was mea-sured at 18.8 ng/g at the inlet and 5.75 ng/g at the outlet. Therewas little change in the already lower concentrations of otherpyrethroids, and there was only a slight decrease in the totalorganic carbon concentration (2.37% inlet; 2.07% outlet).Organophosphate compounds were not detected in VTS-1sediments, and organochlorine pesticide concentrations weregenerally low, with mixed trends between inlet and outlet.Total DDT declined from an inlet sediment concentration of0.546 mg/g to an outlet concentration of 0.470 mg/g, perhapsreflecting ambient variability for this ubiquitous compound.
3.6. VTS-2 water toxicity and chemistry
Water samples collected from both VTS-2 stations in fourof five surveys were significantly toxic to C. dubia. However,in the second survey, survival was 80% at both stations. A TIEwas conducted on a water sample from the fourth survey, inwhich 100% mortality was observed. There were nearly 5TUs and 0.238 mg/L chlorpyrifos in the baseline sample(Fig. 9). Toxicity was reduced by centrifugation, the cationcolumn, and the HLB column. Chlorpyrifos was decreasedto 0.168 mg/L by centrifugation, and to non-detectable levelsby treatment with the cation and HLB columns. Nearly 2TUs were returned in the HLB eluate, along with a detectable
0 20 40 60 80 100
BSA
Carboxylesterase
10% SIR-300
10% PCC
Ambersorb Eluate
10% Ambersorb
10% Control Sediment
Baseline
Mortality (%)
Fig. 7. Toxicity identification evaluation of the solid-phase sediment sample
collected near the VTS-1 inlet. Treatments are described in Section 2.2.
0 5 10 15 20 25
Carboxylesterase/PBO
PBO
BSA
Carboxylesterase
HLB Eluate
HLB Column
Baseline
Toxic units
Fig. 8. Toxicity identification evaluation of interstitial water from the sediment
sample collected near the VTS-1 inlet. Treatments are described in Section
2.2.
0 1 2 3 4 5
0 0.05 0.1 0.15 0.2 0.25
BSA
Carboxylesterase
HLB Eluate
HLB Column
Cation Eluate
Cation Column
Centrifuge
Baseline
Toxic units
Chlorpyrifos (ug/L)
ND
ND
ND
< RL
< 1
NA
< 1
Fig. 9. Toxicity identification evaluation of a water sample from the VTS-2 in-
let collected Oct 2. Dark bars are chlorpyrifos concentration, lighter bars are
sample toxic units. Treatments are described in Section 2.2. ND, not detected;
<RL, less than reporting limit; NA, not applicable due to blank toxicity.
353J. Hunt et al. / Environmental Pollution 156 (2008) 348e358
Author's personal copy
level of chlorpyrifos (below reporting limit). Subsequentchemical analysis found that the chlorpyrifos concentrationin this sample was 0.762 mg/L, about 14 times the C. dubiaLC50 of 0.053 mg/L (Bailey et al., 1997). The carboxylesteraseenzyme partially reduced toxicity in the TIE, but so did BSA,which controls for contaminant binding by proteins, providingno strong evidence to implicate pyrethroids.
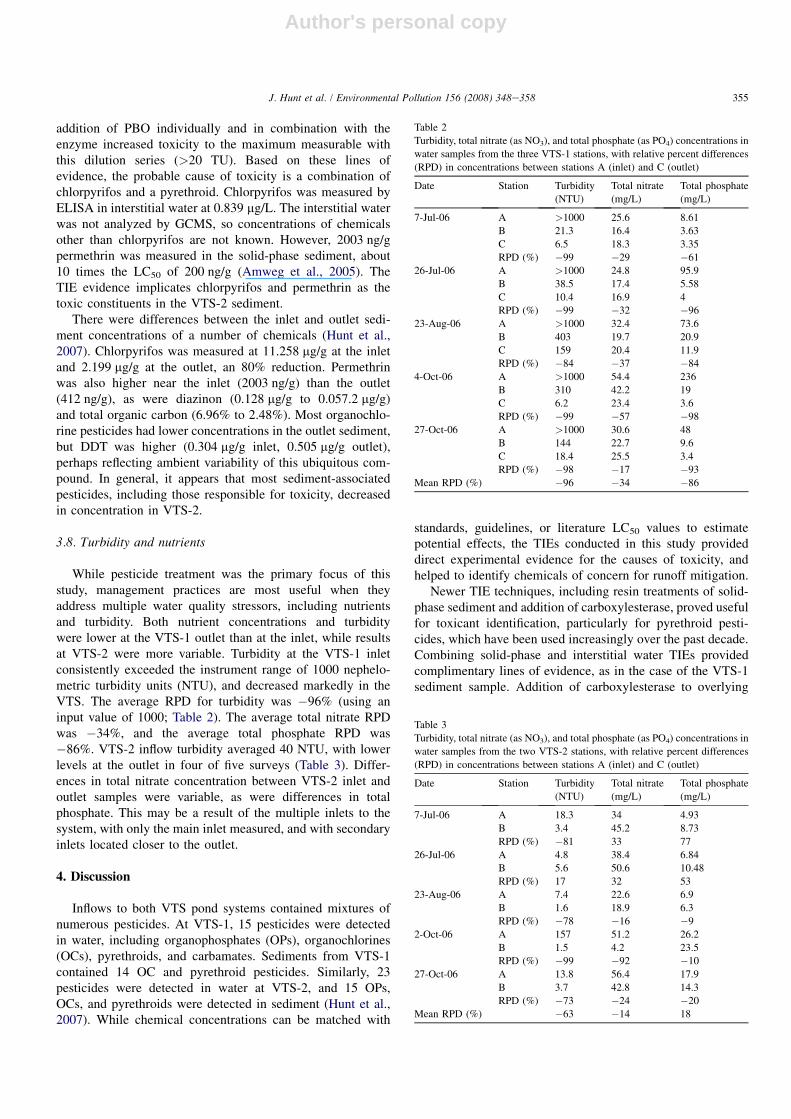
Chlorpyrifos was measured at toxic concentrations in allVTS-2 water samples, but concentrations declined substan-tially from inlet to outlet in all five surveys (Fig. 10). Themore water soluble OP diazinon, on the other hand, wasconsistently measured well below toxic concentrations, butdifferences between inlet and outlet concentrations were vari-able, and there was no indication that diazinon was reduced inVTS-2. All other pesticide compounds or classes had loweraverage concentrations at the VTS-2 outlet than at the inlet(Fig. 11). Chlorpyrifos, diazinon, dioxathion, and oxadiazonwere the most frequently measured OP pesticides in thesystem. Pyrethroids and organochlorines were generallypresent in water at very low concentrations (Hunt et al.,2007). Methomyl was detected once at the outlet but not inthe corresponding inlet sample.
3.7. VTS-2 sediment toxicity and chemistry
There was 100% amphipod mortality in both inlet and outletVTS-2 sediment samples collected on October 27. Solid-phaseand interstitial water TIEs were conducted on the inlet sample.None of the solid-phase treatments reduced toxicity, but theAmbersorb eluate was toxic, indicating sediment toxicity dueto a non-polar organic chemical. No toxicity was observed inthe SIR-300 eluate, indicating that toxicity was not due tometals. Sediment chemical analysis found chlorpyrifos at11.258 mg/g, about 30 times greater than the published H.azteca LC50 of 0.399 mg/g (Brown et al., 1997). This concentra-tion apparently overwhelmed the ability of solid-phase TIEtreatments to reduce toxicity, but chlorpyrifos and toxicitywere recovered through elution of the Ambersorb resin.
Interstitial water extracted from the VTS-2 sediment washighly toxic, with a sample LC50 of 5.4% (18.6 toxic units;
Fig. 12). Passing the sample through a cation column reducedthe chlorpyrifos concentration to 0.105 mg/L, but only reducedthe toxicity to 14.7 TU. The cation eluate did not returnchlorpyrifos or toxicity, providing no evidence to implicatetrace metals. The HLB column completely removed thechlorpyrifos but only reduced the toxicity to 16.4 TUs, indicat-ing the presence of other toxic compounds. The HLB eluatereturned toxicity and 95% of the chlorpyrifos. The sequentialcolumns removed the toxicity, but toxicity was only recoveredin the HLB eluate. Addition of the carboxylesterase enzymereduced toxicity to 6 TUs, but did not reduce the chlorpyrifosconcentration. This result implicates a pyrethroid pesticide aspartially responsible for toxicity. The addition of BSA (a con-trol for the enzyme treatment) did not reduce toxicity. The
0
0.1
0.2
0.3
0.4
0.5
0.6
0.7
0.8
A B A BA B AB A B
Chl
orpy
rifos
c
once
ntra
tion
(ug/
L)
July 7 July 26 Aug 23 Oct 2 Oct 27
LC50
Sampling station and date
Fig. 10. Chlorpyrifos concentrations at the inlet A and outlet B of VTS-2. Line
indicates the chlorpyrifos median lethal concentration (LC50).
-80
-60
-40
-20
0
20
Chl
orpy
rifos
Dia
zino
n
Dio
xath
ion
Oxa
diaz
on
Pyre
thro
ids
Org
anoc
hlor
ines
Cha
nge
in c
once
ntra
tion
(%)
Fig. 11. Relative percent difference in concentration for all chemicals detected
in water at both the inlet and outlet of VTS-2. Values are mean RPDs for all
surveys in which chemicals were detected.
0 5 10 15 20 25
0 0.2 0.4 0.6 0.8 1
Carboxylesterase/PBO
PBO
BSA
Carboxylesterase
Sequential HLB Eluate
Sequential Columns
HLB Column Eluate
HLB Column
Cation Column Eluate
Cation Column
Baseline
Toxic units
Chlorpyrifos (ug/L)
< RL
< RL
< RL< 1 TU
Fig. 12. Toxicity identification evaluation of interstitial water from the sedi-
ment sample collected near the VTS-2 inlet. Dark bars are chlorpyrifos con-
centration, lighter bars are toxic units. Treatments are described in Section
2.2. <RL, less than reporting limit. <1 TU, less than 1 toxic unit.
354 J. Hunt et al. / Environmental Pollution 156 (2008) 348e358
Author's personal copy
addition of PBO individually and in combination with theenzyme increased toxicity to the maximum measurable withthis dilution series (>20 TU). Based on these lines ofevidence, the probable cause of toxicity is a combination ofchlorpyrifos and a pyrethroid. Chlorpyrifos was measured byELISA in interstitial water at 0.839 mg/L. The interstitial waterwas not analyzed by GCMS, so concentrations of chemicalsother than chlorpyrifos are not known. However, 2003 ng/gpermethrin was measured in the solid-phase sediment, about10 times the LC50 of 200 ng/g (Amweg et al., 2005). TheTIE evidence implicates chlorpyrifos and permethrin as thetoxic constituents in the VTS-2 sediment.
There were differences between the inlet and outlet sedi-ment concentrations of a number of chemicals (Hunt et al.,2007). Chlorpyrifos was measured at 11.258 mg/g at the inletand 2.199 mg/g at the outlet, an 80% reduction. Permethrinwas also higher near the inlet (2003 ng/g) than the outlet(412 ng/g), as were diazinon (0.128 mg/g to 0.057.2 mg/g)and total organic carbon (6.96% to 2.48%). Most organochlo-rine pesticides had lower concentrations in the outlet sediment,but DDT was higher (0.304 mg/g inlet, 0.505 mg/g outlet),perhaps reflecting ambient variability of this ubiquitous com-pound. In general, it appears that most sediment-associatedpesticides, including those responsible for toxicity, decreasedin concentration in VTS-2.
3.8. Turbidity and nutrients
While pesticide treatment was the primary focus of thisstudy, management practices are most useful when theyaddress multiple water quality stressors, including nutrientsand turbidity. Both nutrient concentrations and turbiditywere lower at the VTS-1 outlet than at the inlet, while resultsat VTS-2 were more variable. Turbidity at the VTS-1 inletconsistently exceeded the instrument range of 1000 nephelo-metric turbidity units (NTU), and decreased markedly in theVTS. The average RPD for turbidity was �96% (using aninput value of 1000; Table 2). The average total nitrate RPDwas �34%, and the average total phosphate RPD was�86%. VTS-2 inflow turbidity averaged 40 NTU, with lowerlevels at the outlet in four of five surveys (Table 3). Differ-ences in total nitrate concentration between VTS-2 inlet andoutlet samples were variable, as were differences in totalphosphate. This may be a result of the multiple inlets to thesystem, with only the main inlet measured, and with secondaryinlets located closer to the outlet.
4. Discussion
Inflows to both VTS pond systems contained mixtures ofnumerous pesticides. At VTS-1, 15 pesticides were detectedin water, including organophosphates (OPs), organochlorines(OCs), pyrethroids, and carbamates. Sediments from VTS-1contained 14 OC and pyrethroid pesticides. Similarly, 23pesticides were detected in water at VTS-2, and 15 OPs,OCs, and pyrethroids were detected in sediment (Hunt et al.,2007). While chemical concentrations can be matched with
standards, guidelines, or literature LC50 values to estimatepotential effects, the TIEs conducted in this study provideddirect experimental evidence for the causes of toxicity, andhelped to identify chemicals of concern for runoff mitigation.
Newer TIE techniques, including resin treatments of solid-phase sediment and addition of carboxylesterase, proved usefulfor toxicant identification, particularly for pyrethroid pesti-cides, which have been used increasingly over the past decade.Combining solid-phase and interstitial water TIEs providedcomplimentary lines of evidence, as in the case of the VTS-1sediment sample. Addition of carboxylesterase to overlying
Table 2
Turbidity, total nitrate (as NO3), and total phosphate (as PO4) concentrations in
water samples from the three VTS-1 stations, with relative percent differences
(RPD) in concentrations between stations A (inlet) and C (outlet)
Date Station Turbidity
(NTU)
Total nitrate
(mg/L)
Total phosphate
(mg/L)
7-Jul-06 A >1000 25.6 8.61
B 21.3 16.4 3.63
C 6.5 18.3 3.35
RPD (%) �99 �29 �61
26-Jul-06 A >1000 24.8 95.9
B 38.5 17.4 5.58
C 10.4 16.9 4
RPD (%) �99 �32 �96
23-Aug-06 A >1000 32.4 73.6
B 403 19.7 20.9
C 159 20.4 11.9
RPD (%) �84 �37 �84
4-Oct-06 A >1000 54.4 236
B 310 42.2 19
C 6.2 23.4 3.6
RPD (%) �99 �57 �98
27-Oct-06 A >1000 30.6 48
B 144 22.7 9.6
C 18.4 25.5 3.4
RPD (%) �98 �17 �93
Mean RPD (%) �96 �34 �86
Table 3
Turbidity, total nitrate (as NO3), and total phosphate (as PO4) concentrations in
water samples from the two VTS-2 stations, with relative percent differences
(RPD) in concentrations between stations A (inlet) and C (outlet)
Date Station Turbidity
(NTU)
Total nitrate
(mg/L)
Total phosphate
(mg/L)
7-Jul-06 A 18.3 34 4.93
B 3.4 45.2 8.73
RPD (%) �81 33 77
26-Jul-06 A 4.8 38.4 6.84
B 5.6 50.6 10.48
RPD (%) 17 32 53
23-Aug-06 A 7.4 22.6 6.9
B 1.6 18.9 6.3
RPD (%) �78 �16 �9
2-Oct-06 A 157 51.2 26.2
B 1.5 4.2 23.5
RPD (%) �99 �92 �10
27-Oct-06 A 13.8 56.4 17.9
B 3.7 42.8 14.3
RPD (%) �73 �24 �20
Mean RPD (%) �63 �14 18
355J. Hunt et al. / Environmental Pollution 156 (2008) 348e358

Author's personal copy
water in the solid-phase TIE reduced toxicity, while addition ofPBO to the interstitial water strongly increased toxicity, bothproviding strong complimentary evidence to implicatepyrethroids.
The findings of water toxicity due to diazinon and chlorpyr-ifos were consistent with previous results from agriculturalwatersheds on the central coast and elsewhere (e.g., Andersonet al., 2003; de Vlaming et al., 2000; Hunt et al., 2003; Schulz,2004). Chlorpyrifos concentrations were consistently lower atthe VTS-2 outlet (Fig. 10), indicating retention or breakdownin the pond. Chlorpyrifos is less water soluble than diazinon,and is more likely to sorb to plant surfaces and settling partic-ulates (e.g., Sherrard et al., 2004). In contrast, there was littleevidence that VTS-1 reduced diazinon concentrations by anyprocess other than dilution of high pulse concentrations(Figs. 4 and 5). The relatively high solubility of diazinonlimits its retention in VTS systems, and mitigation dependson hydrolysis and photolysis (Watanabe and Grismer, 2001).Because diazinon half-lives are on the order of weeks tomonths at neutral pH (Novartis, 1997), VTS systems wouldneed to be large to increase residence time or shallow topromote photolysis, both requiring increased dedication ofvaluable farm land. A recently proposed solution is the addi-tion of enzyme to catalyze hydrolysis in VTS mixing basins,resulting in rapid breakdown of OP pesticides (unpublisheddata, Orica Watercare, Inc., Watkins, CO, USA). This addi-tional treatment step may be necessary for chlorpyrifos aswell, since concentrations were markedly reduced in VTS-2,but not to a level low enough to eliminate toxicity to C. dubia.
Implication of pyrethroid pesticides as causes of sedimenttoxicity is also consistent with recent studies (e.g., Amweget al., 2005; Anderson et al., 2006; Hendley et al., 2001;Weston et al., 2004). These hydrophobic compounds readilysorb to plant surfaces and sediments and tend to settle out inretention systems (e.g., Moore et al., 2001; Schultz, 2004).In VTS-1, cypermethrin and lambda-cyhalothrin were bothmeasured at higher concentrations in inlet sediments; andthe same was observed for permethrin at VTS-2, indicatingearly deposition of pyrethroids in both ponds. Based on half-lives in water, pyrethroids would have to remain in the VTSfor weeks to months to allow significant degradation (Hendleyet al., 2001). However, Bennett et al. (2005) calculated half-lives of bifenthrin and lambda-cyhalothrin to be 6.1 and1.4 days, respectively, in vegetated ditch systems, with ditchplants being the major sink and/or sorption site responsiblefor the rapid aqueous pyrethroid dissipation. The present studydid not have the resources to characterize chemical fate inVTS water, vegetation, or sediment.
Overall, the VTS installed by farmers were effective atreducing pesticide concentrations in agricultural runoff (Figs.6 and 11). Effectiveness could be increased by careful posi-tioning of inlets and outlets to minimize short circuiting, byensuring that vegetation extends throughout the water column,and perhaps by enzyme additions to treat organophosphates.The conditional discharge permit waiver program has requiredall farm operations to develop and implement water qualitymanagement plans that may include installation of VTS.
Currently 93% of the irrigated acreage in the region hasbeen enrolled in the program. As management practices,including vegetated treatment systems, are adopted, effective-ness monitoring will allow continued VTS modifications toincrease the effectiveness of treatment systems for the specificchemicals of concern in agricultural runoff.
5. Conclusions
Inflows of agricultural runoff to both VTS ponds were highlytoxic to C. dubia. Toxicity identification evaluations weresuccessful in identifying the chemicals responsible for toxicity,including diazinon and chlorpyrifos in water; and chlorpyrifos,permethrin, cypermethrin, and lambda-cyhalothrin in sediment.VTS-2 outlet water concentrations of chlorpyrifos weresubstantially lower than inlet concentrations, while differencesin diazinon at VTS-1 were variable and likely affected mainlyby dilution. Concentrations of most pesticides, pesticideclasses, turbidity, and nutrients were lower at VTS outletsthan at inlets, indicating overall VTS effectiveness in reducingnon-point source pollution. Monitoring VTS effectiveness andidentifying chemicals of concern are key components in thedesign and optimization of conservation practices to mitigatethe effects of agricultural runoff.
Acknowledgements
We are grateful to our cooperators in the Central Coastagricultural community for their interest, willingness, andability to install vegetated treatment systems on their land toimprove water quality. We thank Sara Clark, Jason Flynn,Witold Piekarski, Katie Siegler, and Jennifer Voorhees of theUC Davis Marine Pollution Studies Laboratory at GraniteCanyon for conducting field surveys, toxicity tests, and datamanagement. Dave Crane, Abdu Mekebre, Mary Curry, andLoc Nguyen of the California Department of Fish and GameWater Pollution Control Laboratory conducted the pesticidechemical analyses. Ruthie Schafer and Karminder Brown ofthe Resource Conservation District of Monterey Countycoordinated project operations and communications. Thiswork was funded in part by a grant from the California StateWater Resources Control Board as part of the PesticideResearch and Investigation of Source and Mitigation (PRISM)program. Additional funding was provided by the USEPA,through its STAR graduate fellowship program.
References
Amweg, E.L., Weston, D.P., Ureda, N.M., 2005. Use and toxicity of pyrethroid
pesticides in the Central Valley, CA, USA. Environmental Toxicology and
Chemistry 24 (4), 966e972 (erratum 24, 1300-1301).
Anderson, B.S., Hunt, J.W., Phillips, B.M., Nicely, P.A., de Vlaming, V.,
Connor, V., Richard, N., Tjeerdema, R.S., 2003. Ecotoxicologic impacts
of agriculture drainwater in the Salinas River (California, USA). Environ-
mental Toxicology and Chemistry 22, 2375e2384.
Anderson, B.S., Phillips, B.M., Hunt, J.W., Richard, N., Connor, V.,
Tjeerdema, R.S., 2006. Evidence of pesticide impacts in the Santa Maria
356 J. Hunt et al. / Environmental Pollution 156 (2008) 348e358
Author's personal copy
River watershed (California, USA). Environmental Toxicology and
Chemistry 25, 1160e1170.
Anderson, B.S., Hunt, J.W., Phillips, B.M., Tjeerdema, R.S., 2007. Navigating
the TMDL Process: Sediment Toxicity. Water Environmental Research
Foundation, Alexandria, VA. Final Report.
Bailey, H.C., Miller, J.L., Miller, M.J., Wiborg, L.C., Deanovic, L., Shed, T.,
1997. Joint acute toxicity of diazinon and chlorpyrifos to Ceriodaphnia
dubia. Environmental Toxicology and Chemistry 16, 2304e2308.
Bennett, E.R., Moore, M.T., Cooper, C.M., Smith, S., Shields, F.D.,
Drouillard, K.G., Schulz, R., 2005. Vegetated agricultural drainage ditches
for the mitigation of pyrethroid-associated runoff. Environmental
Toxicology and Chemistry 24, 2121e2127.
Beusen, J.M., Neven, B., 1989. Toxicity of dimethoate to Daphnia magna and
freshwater fish. Bulletin of Environmental Contamination and Toxicology
42, 126e133.
Brakensiek, D.L., Osborn, H.B., Rawls, W.J., 1979. Field Manual for Research
in Agricultural Hydrology, Agricultural Handbook 224, revised. US
Department of Agriculture, February, 547 p.
Brown, R.P., Landre, A.M., Miller, J.A., Kirk, H.D., Hugo, J.M., 1997.
Toxicity of sediment-associated chlorpyrifos with the freshwater inverte-
brates Hyalella azteca (amphipod) and Chironomus tentans (midge).
DECO-ES-3036. Health and Environmental Research Laboratories, Dow
Chemical, Midland, MI, USA.
Brunner, G.W., 2002. HEC-RAS, River Analysis System Hydraulic Reference
Manual, CPD-69, November, Version 3.1). US Army Corps of Engineers
Hydrologic Engineering Center, 350 p.
CCAMP, 2007. Central Coast Ambient Monitoring Program. http://www.
ccamp.org/.
CCRWQCB, 2004. Central Coast Regional Water Quality Control Board
Staff Report. http://www.waterboards.ca.gov/centralcoast/AGWaivers/
documents/CopyofItem3StaffRpt.pdf.
CCRWQCB, 2007. Central Coast Regional Water Quality Control Board.
http://www.waterboards.ca.gov/centralcoast/AGWaivers/documents/
CopyofItem3StaffRpt.pdf.
Dabney, S.M., Moore, M.T., Locke, M.A., 2006. Integrated management of in-
field, edge-of-field, and after-field buffers. Journal of the American Water
Resources Association 42, 15e24.
de Vlaming, V., Connor, V., DiGiorgio, C., Bailey, H.C., Deanovic, L.A.,
Hinton, D.E., 2000. Application of whole effluent toxicity test procedures
to ambient water quality assessment. Environmental Toxicology and
Chemistry 19, 42e62.
FAO, 2007. FAOSTAT Statistics Database. Food and Agriculture Organization
of the UN, Rome, Italy. http://faostat.fao.org/site/340/default.aspx.
Haan, C.T., Barfield, B.J., Hayes, J.C., 1994. Design Hydrology and Sedimen-
tology for Small Catchments. Academic Press, San Diego, CA, 588 p.
Hapeman, C.J., McConnell, L.L., Rice, C.P., Sadeghi, A.M., Schmidt, W.F.,
McCarty, G.W., Starr, J.L., Rice, P.J., Angier, J.T., Harman-Fetcho, J.A.,
2003. Current United States Department of Agriculture e Agricultural
Research Service research on understanding agrochemical fate and
transport to prevent and mitigate adverse environmental impacts. Pest
Management Science 59, 681e690.
Hendley, P., Holmes, C., Kay, S., Maund, S.J., Travis, K.Z., Zhang, M., 2001.
Probabilistic risk assessment of cotton pyrethroids: III. A spatial analysis
of the Mississippi, USA, cotton landscape. Environmental Toxicology
and Chemistry 20, 669e678.
Ho, K.T., Burgess, R.M., Pelletier, M.C., Serbst, J.R., Cook, H.,
Cantwell, M.G., Ryba, S.A., Perron, M.M., Lebo, J., Huckins, J.,
Petty, J., 2004. Use of powdered coconut charcoal as a toxicity
identification and evaluation manipulation for organic toxicants in
marine sediments. Environmental Toxicology and Chemistry 23,
2124e2131.
Hunt, J.W., Anderson, B.S., Phillips, B.M., Tjeerdema, R.S., Puckett, H.M., de
Vlaming, V., 1999. Patterns of aquatic toxicity in an agriculturally
dominated coastal watershed in California. Agriculture, Ecosystems, and
Environment 75, 75e91.
Hunt, J.W., Anderson, B.S., Phillips, B.M., Nicely, P.A., Tjeerdema, R.S.,
Puckett, H.M., Stephenson, M., Worcester, K., de Vlaming, V., 2003.
Ambient toxicity due to chlorpyrifos and diazinon in a central
California coastal watershed. Environmental Monitoring and Assess-
ment 82, 83e112.
Hunt, J.W., Anderson, B.S., Phillips, B.M., Largay, B., Watson, F., Harris, K.,
Hanson, E., Beretti, M., Schafer, R., Brown, K., Bern, A.L., 2007.
Effectiveness of agricultural management practices in reducing concentra-
tions of pesticides associated with toxicity to aquatic organisms. Central
Coast Regional Water Quality Control Board, San Luis Obispo, CA.
http://www.ccamp.org/ccamp/Reports.html#toxicity Data Summary and
Final Report.
Kakko, I., Toimela, T., Tahti, H., 2000. Piperonyl butoxide potentiates the syn-
aptosome ATPase inhibiting effect of pyrethrin. Chemosphere 40, 301e305.
Maund, S.J., Hamer, M.J., Lane, M.C.G., Farrelly, E., Rapley, J.H.,
Goggin, U.M., Gentle, W.E., 2002. Partitioning, bioavailability, and toxic-
ity of the pyrethroid insecticide cypermethrin in sediments. Environmental
Toxicology and Chemistry 21, 9e15.
Moore, M.T., Bennett, E.R., Cooper, C.M., Smith, S., Shields, F.D.,
Milam, C.D., Farris, J.L., 2001. Transport and fate of atrazine and
lambda-cyhalothrin in a vegetated drainage ditch in the Mississippi Delta.
Agriculture, Ecosystems, and Environment 87, 309e314.
Moore, M.T., Bennett, E.R., Cooper, C.M., Smith, S., Farris, J.L.,
Drouillard, K.G., Schulz, R., 2006. Influence of vegetation in mitigation
of methyl parathion runoff. Environmental Pollution 142, 288e294.
Novartis, 1997. An ecological risk assessment of diazinon in the Sacramento
and San Joaquin River basins. Novartis Crop Protection, Inc., Greensboro,
NC. Technical report, 11/97.
PAN, 2007. Pesticides database. Pesticide Action Network. http://www.
pesticideinfo.org/Index.html.
Phillips, B.M., Anderson, B.S., Hunt, J.W., Huntley, S., Tjeerdema, R.S.,
Kapellas, N., Worcester, K., 2006. Solid-phase sediment toxicity identifi-
cation evaluation in an agricultural stream. Environmental Toxicology
and Chemistry 25, 1671e1676.
Phipps, G.L., Mattson, V.R., Ankley, G.T., 1995. The relative sensitivity of
three benthic test species to 10 chemicals. Archives of Environmental
Toxicology and Chemistry 28, 281e286.
Popov, V.H., Cornish, P.S., Sun, H., 2006. Vegetated biofilters: the relative
importance of infiltration and adsorption in reducing loads of water-soluble
herbicides in agricultural runoff. Agriculture, Ecosystems, and
Environment 114, 351e359.
Puckett, M., 2002. Quality Assurance Management Plan for the State of
California’s Surface Water Ambient Monitoring Program (SWAMP).
Prepared for the State Water Resources Control Board, Sacramento, CA.
California Department of Fish and Game, Monterey, CA. http://www.
swrcb.ca.gov/swamp/qamp.html, 145 p. plus Appendices.
Schulz, R., 2004. Field studies and exposure, effects, and risk mitigation of
aquatic non-point source insecticide pollution: a review. Journal of
Environmental Quality 33, 419e449.
Sherrard, R.M., Bearr, J.S., Murray-Gulde, C.L., Rodgers, J.H., Shah, Y.T., 2004.
Feasibility of constructed wetlands for removing chlorothalonil and chlor-
pyrifos from aqueous mixtures. Environmental Pollution 127, 385e394.
Sullivan, J.J., Goh, K.S., 2000. Evaluation and validation of a commercial
ELISA for diazinon in surface waters. Journal of Agricultural and Food
Chemistry 48, 4071e4078.
USEPA, 1991. Methods for aquatic toxicity identification evaluations. Phase I.
Toxicity Characterization Procedures. EPA 600/6-91/003. Office of
Research and Development, US Environmental Protection Agency, Wash-
ington, DC.
USEPA, 1993. Methods for aquatic toxicity identification evaluations. Phase
II. Toxicity Identification Procedures for Samples Exhibiting Acute and
Chronic Toxicity. EPA 600/R-92/080. Office of Research and
Development. US Environmental Protection Agency, Washington, DC.
USEPA, 2000. Methods for measuring the toxicity and bioaccumulation of
sediment-associated contaminants with freshwater invertebrates. Office
of Research and Development. US Environmental Protection Agency,
Washington, DC.
USEPA, 2002. Methods for measuring the acute toxicity of effluents
and receiving waters to freshwater and marine organisms. EPA-821-R-
02-012. Office of Water, US Environmental Protection Agency,
Washington, DC.
357J. Hunt et al. / Environmental Pollution 156 (2008) 348e358

Author's personal copy
Vu, S.H., Ishihara, S., Watanabe, H., 2006. Exposure risk assessment and
evaluation of the best management practice for controlling pesticide runoff
from paddy fields. Part 1: Paddy watershed monitoring. Pest Management
Science 62, 1193e1206.
Wang, X.H., Yin, C.Q., Shan, B.Q., 2005. The role of diversified landscape buffer
structures for water quality improvement in an agricultural watershed, North
China. Agriculture Ecosystems and Environment 107, 381e396.
Watanabe, H., Grismer, M.E., 2001. Diazinon transport through inter-row
vegetative filter strips: micro-ecosystem modeling. Journal of Hydrology
247, 183e199.
Weston, D.P., You, J., Lydy, M.J., 2004. Distribution and toxicity of sediment-
associated pesticides in agriculture-dominated water bodies of California’s
Central Valley. Environmental Science & Technology 38, 2752e2759.
Wheelock, C.E., Miller, J.L., Miller, M.J., Gee, S.J., Shan, G.,
Hammock, B.D., 2004. Development of toxicity identification evaluation
procedure for pyrethroid detection using esterase activity. Environmental
Toxicology and Chemistry 23, 2699e2708.
Yates, A.G., Bailey, R.C., Schwindt, J.A., 2007. Effectiveness of best manage-
ment practices in improving stream ecosystem quality. Hydrobiologia 583,
331e344.
358 J. Hunt et al. / Environmental Pollution 156 (2008) 348e358
Copyright © 2022 FDOKUMEN