NEUROBEHAVIOURAL EFFECTS OF PESTICIDE exposure ...
446
NEUROBEHAVIOURAL EFFECTS OF PESTICIDE EXPOSURE AMONG EMERGING FARMERS IN THE WESTERN CAPE By Zelda Holtman Thesis presented for the Degree of DOCTOR OF PHILOSOPY (PhD) In the School of Public Health and Family Medicine Faculty of Health Sciences UNIVERSITY OF CAPE TOWN November 2013 University of Cape Town
-
Upload
khangminh22 -
Category
Documents
-
view
2 -
download
0
Transcript of NEUROBEHAVIOURAL EFFECTS OF PESTICIDE exposure ...

NEUROBEHAVIOURAL EFFECTS OF PESTICIDE
EXPOSURE AMONG EMERGING FARMERS IN
THE WESTERN CAPE
By
Zelda Holtman
Thesis presented for the Degree of
DOCTOR OF PHILOSOPY (PhD)
In the School of Public Health and Family Medicine
Faculty of Health Sciences
UNIVERSITY OF CAPE TOWN
November 2013
Univers
ity of
Cap
e Tow
n

The copyright of this thesis vests in the author. No quotation from it or information derived from it is to be published without full acknowledgement of the source. The thesis is to be used for private study or non-commercial research purposes only.
Published by the University of Cape Town (UCT) in terms of the non-exclusive license granted to UCT by the author.
Unive
rsity
of C
ape
Town

NEUROBEHAVIOURAL EFFECTS OF PESTICIDE
EXPOSURE AMONG EMERGING FARMERS IN
THE WESTERN CAPE
By
Zelda Holtman
Thesis presented for the Degree of
DOCTOR OF PHILOSOPY (PhD)
In the School of Public Health and Family Medicine
Faculty of Health Sciences
UNIVERSITY OF CAPE TOWN
November 2013
Supervisor: Professor Leslie London
Co-supervisor: Associate Professor Mohamed Aqiel Dalvie
This thesis is presented in fulfilment of the requirements for the degree of Doctor of
Philosophy (PhD) in the School of Public Health and Family Medicine, Faculty of
Health Sciences, University of Cape Town. The work on which this thesis is based is
original research and has not, in whole or in part, been submitted for another degree
at this or any other university. The contents of this thesis are entirely the work of the
candidate. The university is empowered to reproduce either the whole or any portion
of the contents for the purposes of research.
____________________________
Zelda Holtman
November 2013

ABSTRACT
Background: The number of emerging farmers is increasing in South Africa. This
study investigated neurotoxic effects resulting from long-term low-level exposure to
organophosphate pesticides amongst emerging farmers.
Methods: A cohort study involving 319 (66% male and 34% female) emerging
farmers in the Western Cape was conducted between 2009 and 2010. Testing
included a questionnaire exploring demographic details, work history, medical
history; the Q16 and the Brief Symptom Inventory (BSI). Additionally,
neurobehavioural performance was assessed on the following: Digit span forward
and backward, Digit Symbol, Santa Ana Pegboard, Pursuit Aiming, Benton Visual
Retention and Vibration sense as measured by vibration sense threshold using a 256
Hz frequency tuning fork. Exposure to OP’s was derived from three metrics: (i) OP
applicator status, (ii) cumulative OP exposure weighted for task/activity, (iii)
diagnosed past poisoning.
Two sets of analyses were conducted: a cross-sectional analysis at baseline (N=319),
and a cohort analysis (N=273), comparing change in neurobehavioural performance
over the 12 month follow up period. The exposure variable for cumulative
occupational OP exposure in the baseline cross-section was generated from the job
history data in the farmer questionnaire based on the exposure obtained during the
current job and preceding three jobs. This represented long-term past OP exposure.
In both the baseline cross-section and the cohort analysis, the relationship
investigated was between dichotomised outcomes and four models for OP exposure.
Three models used each of the metrics for OP exposure and a fourth model used the
metric of cumulative OP exposure adjusted for diagnosed past poisoning. The
difference between the analysis in the cohort was that both cumulative exposure and
acute poisoning were restricted to the 12 months of follow up, whereas the baseline,
both cumulative and acute poisoning were based on any past exposure without a time
period. Further, for the cohort study (n=273), the outcomes were the difference in
scores (measured as the ratio of the repeat measure at one year to the baseline score)
which were regressed in the four exposure models outlined above. All models were

controlled for confounders including age, gender, schooling, language, current
alcohol consumption, previous head injuries, psychological illness and socio-
economic status. Model building led to the inclusion of additional co-variates for
some of the analyses.
Results: The majority of the farmers (66%, n=211) who participated in the baseline
study were male. The sample had a wide age distribution with a median of 39 years
and inter-quartile range (IQR) of 30 to 48 years. The median years of schooling was
9 (IQR: 7-11), equal to Grade 8 or Standard 6 in South Africa. Of the 319, 8 %
reported 1 year or less of formal schooling. Twelve per cent (n=38) completed junior
school (Grade 7) and 8% (n=27) matriculated (completed Grade 12). Logistic
regression results for the baseline study showed a threefold risk for decreased
vibration sense (OR=3.08; 95% CI 1.05 to 9.05) following prolonged cumulative OP
exposure (quartile 3) and an almost six-fold risk for decreased vibration sense
following past poisoning (OR=5.97; 95% CI 2.14 to 16.66) adjusted for covariates.
When cumulative OP exposure was adjusted for past poisoning, the association with
vibration sense was attenuated and was of borderline significance (OR=2.34; 95% CI
0.70 – 7.86). Overall, neurobehavioural outcomes mostly tended to be adversely
affected by past pesticide poisoning, though none of the other associations were
statistically significant. There were no other associations involving cumulative
exposure in the baseline study.
Of these who attended final (F3) follow-up visit (n=273), 186 (67%) were male, 91
(33%) were female and 154 were applicators (56%) who provided details of pesticide
applications. There were no significant associations between cumulative OP days
weighted by activity and neurobehavioural deficits in the cohort study. However,
logistic regression results for the cohort study showed that participants with recent
poisoning experiences during the study period had a more than two and-a-half risk of
showing a decline on the Digit Span Forward test over time (OR 2.67; 95% CI 1.05
to 6.80). When recent poisoning was included in the regression model with
cumulative OP exposure, the previously non-significant association for cumulative
exposure (high versus no exposure) changed to a significant association showing a

decline in performance on the Digit Span WAIS (OR=3.95; 95% CI 1.03 to 15.08)
over time.
The results for both the baseline and cohort studies showed consistently significant
associations between age, schooling, previous head injury, language and psychiatric
illness as strong predictors of neurobehavioural performance. Younger participants
consistently performed better than older participants and those with higher schooling
levels performed better than those with lower schooling levels. Participants with
higher levels of schooling were significantly more likely to perform better than those
with lower schooling levels on tests of memory (Digit Span Backward), visuo-spatial
ability (Benton) and fine motor control (Santa Ana non-dominant hand). Those with
low-schooling were also more likely to report increased symptoms (Q16) than those
with higher schooling.
Conclusions: Results from this study provide very modest evidence to support
findings of other studies suggesting associations of neurobehavioural outcomes with
chronic exposure in the absence of an acute OP pesticide poisoning episode. In
contrast, there is strong consistency from the results in this study with findings from
other studies that reported long-term effects as a result of acute OP pesticide
poisoning. On-going research is required with this cohort of farmers over a longer
period of time to investigate the effects of long-term OP exposure in the absence of
acute poisoning. Better exposure characterisation and longer follow up will
strengthen the evidence base from future studies. The findings confirm the
vulnerability of this population to neurotoxic effects of pesticide exposures and
warrant important preventive actions.

ACKNOWLEDGEMENTS
A thesis is often described as a solitary endeavour yet in reality it comprises the input
of a large academic, financial and social support network. I would therefore like to
thank the following individuals who contributed to the successful completion of this
dissertation:
Firstly, to my supervisor Professor Leslie London - thank you for the
opportunity to conduct this research – this was indeed a mammoth learning
curve for me. Thank you for your patience, support and guidance from
conception to the completion of this longitudinal research study. I am so
fortunate to have had the benefit of your knowledge, insight and wisdom.
Thank you also to my co-supervisor Associate Professor Mohammed Aqiel
Dalvie for being willing to walk patiently alongside me on this journey –
thank you for your encouragement, assistance and advice with exposure
modeling and analysis.
Thank you to Dr Hans Kromhout, Utrecht University in The Netherlands
who, through the generous Universiteit Utrecht Africa Fellowship, made it
possible for me to spend time at Utrecht University to learn how to make
sense of loads of exposure data collected in the field.
Thank you to Associate Professor Andrea Rother for the gentle manner in
which you provide encouragement on many levels. Dr Maria Stuttaford,
mentor and occasional visitor to our shores, thank you for all the
encouragement and laughter.
Thank you to Dr Di McIntyre who supported the PhD mentees with generous
Mellon Foundation funded productive Writers’ Retreats.
Thank you to Dr Anna Strebel – for her consistent and constant
encouragement and going the distance with the Mellon mentees.

Thank you to the team of fieldworkers who tirelessly traveled to remote
farms in the Western Cape at the crack of dawn, assisted with data collection
through all four seasons in unyielding weather conditions and inadequate
facilities, contending with heat, dust and tired farmers and returning home
exhausted long after sunset – Algernon Africa, Tracy McClinton, Shaheema
Johaardien, Margo Arends, Deon September, Lungiswa Ziwane, Sharief
Abrahams, Nancy Malgas, Jean May, Farieda Nair, Mary Mouton, Yolandi
Arendse , Carin Burger, Dylan Holtman, Taryn Augustine, and Zolani Kupe.
Thank you to Ms Jhureen van Niekerk and Nizaam Amlay for data
management and data entry.
Grateful thanks also for the helpful comments and statistical advice from
colleagues in the department – Anne Achieng, Roslynn Baatjies and
Nkosilesisa Mpofu. Thank you also to Leticia Kamupire, Anesu Mbizvo for
helping with the updating of results Tables.
I also appreciate the many words of advice and encouragement from friends
(Adeline Africa, Bonnie Anderson, Michael Pather, Narima Panday, Vicky
Major, Cheryl Arends) and colleagues in corridors and at coffee stations, the
daily lattes from the Wolfson coffee station (Benny, Amira, Christine, Faiza)
and the constant encouragement from Professor Muazzam Jacobs at the
Wolfson coffee station – a word fitly spoken is like apples of gold in settings
of silver (Prov. 25:11).
Thank you to my very patient, very supportive and amazingly long-suffering
family: John, Dylan and Alexandra-Naledi for your love, financial support
and for being so understanding about the time constraints of PhD data
collection, analyses, the hasty on-the-go meals and many absences from
home while writing up and editing the many draft chapters.
Thank you to Professors Rodney Ehrlich, Jonny Myers, Derek Hellenberg
and Mohammed Jeebhay in the School of Public Health and Family Medicine
for being outstanding examples of academic excellence and scholarship.

Thank you to the Financial Hub staff, Joy Fuller, Natalie Strydom, Delene
Martin and Rosina Mbobo in the School of Public Health and Family
Medicine at the University of Cape Town.
Grateful thanks also to Patricia Bevie and Merle Christians from Central
Research Finance in Mowbray for providing assistance with a smile and
sometimes even a warm encouraging hug.
To the farm managers I wish to express my grateful thanks for assisting with
appointments and making office facilities available for test administration and
interviews and for always welcoming me and the team with a warm smile.
Finally, I am so grateful to the farmers for making time available to be tested
and interviewed without complaining. What I learnt from you and life in the
rural Western Cape extends far beyond neurobehavioural function and
academic pursuit - I was deeply enriched by your gentle manner and humble
spirit.
Grateful thanks go to the South Africa-Netherlands Research Programme on
Alternatives in Development (SANPAD), Universiteit Utrecht Africa
Fellowship, the Medical Research Council (MRC) particularly Dr Thabi
Maitin and the National Research Foundation (NRF) for financial support.
Finally, I thank and praise the Lord my God for sustaining me throughout this
mammoth research study that became my PhD.
Oh give thanks to the Lord,
for He is good
For His mercy endures forever
(Psalm 106:1)

Dedication
I dedicate this dissertation to the memory of my beloved family:
my parents: Stoffel (Lattie) and Gladys du Plessis (neè Springfield),
my brothers and sisters; and to the memories of our lives lived at
Modern Bricks, Gonubie, East London.

TABLE OF CONTENTS
DECLARATION
ABSTRACT
ACKNOWLEDGEMENTS
Page
CHAPTER 1
1. 1. INTRODUCTION 1
1.1.1. Organophosphate pesticides and neurobehavioural function 2
1.1.2 OP pesticides and emerging farmers 3
1.2 PROBLEM STATEMENT 5
1.3 AIM, OBJECTIVES AND HYPOTHESES 6
1.3.1 Aim of the study 6
1.3.2 Objectives of the study 6
1.3.3 Study hypotheses 7
1.4 IMPORTANCE OF THE STUDY 8
1.5 STRUCTURE OF THE THESIS 9
1.6 REFERENCES 11
CHAPTER 2: A REVIEW OF NEUROBEHAVIOURAL
EFFECTS OF ORGANOPHOSPHATE PESTICIDE EXPOSURE
2.1 INTRODUCTION 18
2.2 ORGANOPHOSPHATE PESTICIDES 19
2.2.1 Routes of OP pesticide exposure 20
2.2.2 Factors affecting occupational exposure 21
2.3 NEUROBEHAVIOURALEFFECTS OF OP PESTICIDES 21
2.3.1 Acute cholinergic effects 22
2.3.2 Intermediate Syndrome (IMS) 23
2.3.3 Organophoshorous ester-induced delayed neurotoxicity 24
(OPIDN)
2.3.4 Chronic neurotoxicity from acute exposures 24
2.4 MEASURING NEUROBEHAVIOURAL EFFECTS OF
PESTICIDE EXPOSURE 25
2.4.1 The need for psychological measurement 26

2.4.2 Evaluating and screening for neurotoxicity 26
2.4.3 The development of neurobehavioural testing 28
2.4.4 Neurobehavioural effects following OP pesticide exposure:
methods for a review of the literature 29
2.4.5 Central nervous system sequelae of acute OP exposure 31
2.4.5.1 Cognitive effects following acute OP pesticide exposure 31
2.4.5.2 Neuropsychiatric symptoms and affect following acute 33
OP pesticide exposure
2.4.5.3 Altered vibration sense following acute OP poisoning 35
2.4.6. Central nervous system effects following long-term
low-level OP pesticide exposure in the absence of an acute
OP poisoning episode 37
2.4.6.1 Cognitive effects following long-term low-level OP
pesticide exposure in the absence of an acute OP
poisoning episode 38
2.4.6.2 Neuropsychiatric symptoms and affect following
long-term low-level OP pesticide exposure in the absence
of an acute OP poisoning episode 44
2.4.6.3 Altered vibration sense following long-term low-level
OP pesticide exposure in the absence of an acute OP
poisoning episode 49
2.5 LIMITATIONS TO THE LITERATURE 60
2.5.1 Summarising the literature 64
2.6 NEUROBEHAVIOURAL INSTRUMENTS USED IN THE STUDY 67
2.7 EMERGING FARMERS IN SOUTH AFRICA 69
2.7.1 Agrichemical use in South Africa 69
2.7.2 OP pesticide exposure and emerging farmers 72
2.8 MONITORING PESTICIDE POISONING 73
2.8.1 Intervention strategies to reduce acute poisoning 74
2.8.2 Pesticide Regulation 76
2.9 Conclusion 78
2.10 REFERENCES 80
CHAPTER 3: METHODS USED IN THE STUDY
3.1 INTRODUCTION 102
3.2 STUDY AREA AND POPULATION 102

3.2.1 Cape Winelands District 104
3.2.2 Overberg District 104
3.2.3 West Coast District 105
3.3 STUDY DESIGN AND SAMPLING
3.3.1 Study design 105
3.3.2 Sampling 106
3.4 MOTIVATION FOR FARMER PARTICIPATION 109
3.5 MAIN STUDY MEASUREMENTS 109
3.5.1 Farmer Questionnaire 110
3.5.2 Neurobehavioural testing 112
3.5.2.1 World Health Organisation Neurobehavioural Core Test
Battery (WHO NCTB) 112
3.5.2.2 The Brief Symptom Inventory (BSI) 117
3.5.2.3 The Swedish Q16 119
3.5.2.4 Vibration Sense Threshold 120
3.6 EXPOSURE ASSESSMENT
3.6.1 Life residential and job history sub-section of farmer
questionnaire 121
3.6.1.1 Quarterly audit 121
3.6.1.2 Job exposure matrix 122
3.7 PILOT STUDIES
3.7.1 The Mpumalanga pilot study 123
3.7.2 The West Coast pilot study 124
3.7.3 The Cape Winelands pilot study 124
3.7.4 The Overberg pilot study 125
3.8 LOGISTICS 125
3.9 DATA MANAGEMENT AND QUALITY CONTROL 126
3.10 DATA ENTRY 127
3.11 DATA ANALYSIS 128
3.11.1 Analysis of the baseline study 128
3.11.1.1 Exposure variables 128
3.11.1.2 Outcome variables 131
3.11.2 Statistical analysis of the baseline study 133

3.12 THE COHORT STUDY 137
3.12.1 Outcome: change in performance over time
(Difference variables) 137
3.12.2 Cohort outcome variables 137
3.12.3 Cohort exposure variables 139
3.13 VARIABLES INCLUDED IN MULTIVARIATE MODELS 144
3.14 STATISTICAL ANALYSIS 145
3.14.1 Statistical power 146
3.15 ETHICS 147
3.16 REFERENCES 149
CHAPTER 4: BASELINE STUDY RESULTS AND DISCUSSION
4.1 INTRODUCTION 158
4.1.1 Study participation 158
4.2 UNIVARIATE RESULTS 158
4.2.1 Demographic characteristics and injury history 158
4.2.2 Current occupational status 163
4.2.2.1 Current job description 165
4.2.2.2 Non-occupational exposure to pesticides 166
4.2.2.3 Pesticide use on farms 167
4.2.2.4 Exposure measures 168
4.2.2.5 Past pesticide poisoning 169
4.2.2.6 Neurobehavioural outcomes
4.2.2.6.1 Scoring of neurobehavioural outcomes 170
4.2.2.6.2 Descriptive findings: neurobehavioural outcomes 170
4.3 BIVARIATE RESULTS
4.3.1 Neurobehavioural outcomes by covariates, exposure variables
and past diagnosed poisoning 172
4.3.2 Neurobehavioural outcomes by applicator status 186
4.3.3 Neurobehavioural outcomes by OP applicator status 188
4.3.4 Neurobehavioural outcomes by past pesticide poisoning status 190
4.4. MULTIVARIATE ASSOCIATIONS
4.4.1. Multivariate association between outcomes and OP applicator 194
status

4.4.2. Multivariate associations between outcomes and OP jemdays 200
4.4.3. Multivariate associations between outcomes and diagnosed
past pesticide poisoning 204
4.4.4. Multivariate associations between outcomes and cumulative
OP days exposure weighted by activity (B_OPjemdays)
adjusted for acute past poisoning 206
4.5 DISCUSSION 211
4.6 REFERENCES 222
CHAPTER 5: COHORT STUDY RESULTS AND DISCUSSION
5.1 INTRODUCTION 229
5.2 STUDY PARTICIPATION 229
5.3 UNIVARIATE RESULTS
5.3.1 Demographic characteristics and injury history 232
5.3.2 Pesticide exposure information
5.3.2.1 Occupational and residential exposure status at final visit 236
5.3.2.2 Exposure measures 240
5.3.2.3 Pesticide poisoning 241
5.3.3 Neurobehavioural outcomes
5.3.3.1 Scoring of neurobehavioural outcomes 242
5.3.3.1.1 Descriptive results for the difference between baseline
and final on follow-up scores neurobehavioural tests 244
5.4 BIVARIATE RESULTS
5.4.1 Neurobehavioural outcomes by applicator status 249
5.5 MULTIVARIATE ASSOCIATIONS
5.5.1 The relationship between dichotomised outcomes and OP applicator
status 258
5.5.2 The relationship between dichotomised outcomes and
AllOPjemdays: crude and adjusted associations 260
5.5.3 The relationship between dichotomised outcomes and recent
poisoning: crude and adjusted associations 263
5.6 DISCUSSION 264
5.7 REFERENCES 280

CHAPTER 6: OVERVIEW, CONCLUSIONS AND
RECOMMENDATIONS
6.1 OVERVIEW 285
6.2 STRENGTHS AND LIMITATIONS 289
6.3 NEUROBEHAVIOURAL PERFORMANCE IN AFRICA 292
6.4 PESTICIDE EXPOSURE AND SOUTH AFRICAN EMERGING 293
FARMERS
6.5 PESTICIDE REGULATION 295
6.6 CONCLUSION 296
6.7 RECOMMENDATIONS 297
6.7.1 Interventions to improve farmer occupational health and safety 298
6.7.2 Strategies to address high alcohol use and mental illness 300
6.7.3 Strategies to improve the social determinants of health 301
6.7.4 Pesticide knowledge and safety practices 301
6.7.5 Legislation and policies 302
6.8 FUTURE RESEARCH
6.8.1 Neurobehavioural testing and emerging farmers 304
6.8.2 Exposure characterisation 305
6.8.2.1 Preventive biomonitoring 305
6.8.2.2 Environmental exposure monitoring 306
6.8.3 Ensuring future participation in the cohort 307
6.9 REFERENCES 309
LIST OF TABLES
Table 2.1 Levels and effects of neurotoxicity 27
Table 2.2 Neurobehavioural studies conducted among OP exposed
populations: non-acute neurotoxic effects in humans 52
Table 2.3 Number of neurobehavioural tests by domain and exposure
level 59
Table 2.4 WHO Neurobehavioural Core Test Battery with functional
domains 68
Table 2.5 Annual organophosphate pesticide sales as at 2007 73
Table 3.1 Distribution of emerging farmer projects by district 108

Table 3.2 Weightings used in an agricultural Job Exposure Matrix
(JEM) 129
Table 3.3 Exposure variables for the baseline study 130
Table 3.4 Outcome variables and scoring 131
Table 3.5 Outcomes (25th
percentile) included in multivariate logistic
regression analysis 132
Table 3.6 Covariates included in multivariate logistic regression
analysis 136
Table 3.7 Difference outcomes (25th
percentile) in multivariate logistic
regression analysis 140
Table 3.8 Cohort weighted and unweighted exposure variables 142
Table 3.9 Baseline exposure variables used to calculate cumulative
exposure 143
Table 3.10 Cohort exposure variables used to calculate cumulative
exposure 144
Table 3.11 Sample size calculation 146
Table 4.1 Summary of eligible farmers from participating farms per
district 160
Table 4.2 Demographic, lifestyle and socio-economic status
characteristics of the study sample (N=319) 162
Table 4.3 Emerging farmers occupational status and gender (N=319) 163
Table 4.4 Emerging farmers work history by gender (N=312) 164
Table 4.5 Cumulative days in pesticide-related job tasks in current jobs
(N=153) 165
Table 4.6 Residential pesticide exposure and crop cultivation on farms
(N=319) 166
Table 4.7 Number of cumulative days over current and previous jobs
for different exposure activities (N=169) 168
Table 4.8 Number of cumulative exposure days for different exposure
activities for all jobs 169
Table 4.9 Neurobehavioural outcomes score range 170
Table 4.10 Univariate results for neurobehavioral outcome measures 171
Table 4.11 Neurobehavioural outcomes by age 173
Table 4.12 Neurobehavioural outcomes by schooling 174
Table 4.13 Neurobehavioural outcomes by gender 176
Table 4.14 Neurobehavioural outcomes by language 177

Table 4.15 Neurobehavioural outcomes and current alcohol
consumption 179
Table 4.16 Neurobehavioural outcomes and CAGE score 180
Table 4.17 Neurobehavioural outcomes and previous head injury 182
Table 4.18 Neurobehavioural outcomes and psychiatric illness 183
Table 4.19 Neurobehavioural outcomes and low socio-economic status 184
Table 4.20 Neurobehavioural outcomes by applicator status 186
Table 4.21 Global Severity Index Dimension results by applicator status 188
Table 4.22 Neurobehavioural outcomes by OP applicator status 188
Table 4.23 Global Severity Index Dimension results by OP applicator
status 190
Table 4.24 Neurobehavioural outcomes by diagnosed poisoning status 190
Table 4.25 Covariates included in multivariate logistic regression
analyses 192
Table 4.26 Outcomes (25th
percentile) included in multivariate logistic
regression analyses 193
Table 4.27 Outcome, covariates and exposure variables included in
regression models 196
Table 4.28 Crude and adjusted logistic regression results for
neurobehavioural outcome-exposure relationships:
OP applicators (n=70) versus non-OP applicators (n=249) 198
Table 4.29 Exposure variables used to calculate cumulative exposure 200
Table 4.30 Adjusted logistic regression results for dichotomous
neurobehavioural outcome-exposure relationships:
Total OP exposure days weighted by activity (OPjemdays) 201
Table 4.31 Adjusted logistic regression results for dichotomous
neurobehavioural outcome-exposure relationships:
past poisoning diagnosed by a health professional versus
no past poisoning 205
Table 4.32 Baseline adjusted logistic regression results for dichotomous
neurobehavioural outcome-exposure relationships: cumulative
OP exposure days weighted by activity (B_OPjemdays)
adjusted for diagnosed past poisoning 207
Table 5.1 Study participation by district at final visit 232
Table 5.2 Demographic, lifestyle and socio-economic status
characteristics of the study sample (N=273) 234

Table 5.3 Residential pesticide and crop cultivation status of participants
(N=273) 237
Table 5.4 A comparison of emerging farmers baseline and cohort
occupational status and gender 238
Table 5.5 Cumulative days in pesticide-related job tasks over a
one year period for F1, F2 and F3 visits (N=277) 239
Table 5.6. Number of days using pesticides in the cohort follow-up
period (N=277) 240
Table 5.7 Cumulative exposure days for all pesticides and OP pesticides
(N=277) 241
Table 5.8 Neurobehavioural outcome scores for the cohort at baseline
and final visit 243
Table 5.9 Neurobehavioural outcome scores for the baseline, follow-up
and ratio outcome scores 245
Table 5.10 Change in neurobehavioural outcomes by age 246
Table 5.11 Change in neurobehavioural outcomes by schooling 247
Table 5.12 Change in neurobehavioural outcomes by applicator status 250
Table 5.13 Change in neurobehavioural outcomes by OP applicator 251
status
Table 5.14 Change in neurobehavioural outcomes by recent diagnosed
poisoning status (N=201) 253
Table 5.15 Outcomes, covariates and exposure variables included in
regression models 255
Table 5.16 Odds ratio interpretation for multivariate logistic
regression results 257
Table 5.17 Crude and adjusted logistic regression results for
neurobehavioural outcome-exposure relationships:
(33 OP applicators and 249 non-OP applicators) 259
Table 5.18 Adjusted logistic regression results for dichotomous
neurobehavioural outcome-exposure relationships:
Total OP exposure days weighted by activity
(AllOPjemdays) (N=273) 261

Table 5.19 Adjusted logistic regression results for dichotomous
neurobehavioural outcome-exposure relationships using
recent diagnosed poisoning as an exposure variable (N=201) 265
Table 5.20 Adjusted logistic regression results for dichotomous
neurobehavioural outcome-exposure relationships:
chronic cumulative OP exposure days weighted by activity
(AllOPjemdays) adjusted for acute recent poisoning 266
LIST OF FIGURES
Figure 3.1 Study districts in the Western Cape 103
Figure 3.2 A diagrammatic representation of the data collection phases 105
Figure 3.3 Study participation 107
Figure 3.4 Order of tests and questionnaire administration during
baseline and final follow-up studies 126
Figure 4.1 Study participation summary 159
Figure 5.1 Cohort study participation summary 231
APPENDICES

CHAPTER 1
1. 1. INTRODUCTION
Neurobehavioural tests have been conducted since the 1980s in a number of studies
to measure the effects of neurotoxic chemicals on adults and children, first in
occupational and later in agricultural settings (Anger, 1990; 2003; Anger et al.,
1997). While the effects of acute and high dose exposure to neurotoxic chemicals are
well described in the literature (Beseler & Stallones, 2008; Delgado et al., 2004;
Miyaki et al., 2005; Nishiwaki et al., 2001; Roldan-Tapia et al., 2006; Wesseling et
al., 2002, 2010), the early sub-clinical effects of long-term low-dose exposure to
neurotoxic chemicals such as pesticides are not immediately obvious to exposed
workers in agricultural and industrial contexts as well as for health care workers
treating these workers. For this reason tests were developed that could identify sub-
clinical effects in the central and peripheral nervous systems as a result of long-term
low dose exposure to pesticides (Johnson, 1997). The tests were non-invasive,
mainly requiring the use of pencil and paper and measured human cognitive, sensory
and motor capabilities (Anger, 1990; Anger et al., 1997).
One of the main groups of chemicals associated with neurotoxic effects is pesticides
(Costa, 2006; Terry, 2012). While the benefits of pesticide use in agriculture to
control insects and other pests, to increase crop production, and as vector control
agents in public health and residential contexts are well known (Terry, 2012), the
widespread use of pesticides has been associated with a wide range of adverse health
consequences amongst humans. Besides problems of central and peripheral nervous
system dysfunction (Kamel & Hoppin, 2004; Rohlman, Lucchini, Anger, Bellinger
& van Thriel, 2008; Rohlman, Anger & Lein, 2011), other adverse outcomes include
cancer (Zahm & Ward, 1998), asthma (Hernández, Parrón & Alarcón, 2011),
endocrine disruption (Dalvie et al., 2004; Landrigan, Garg & Droller, 2003) and birth
defects (Heeren, Tyler & Mandeya, 2003).
Farmers and farm workers are particularly vulnerable to the insidious effects of
harmful pesticides (Cole et al., 1997; Rohlman et al., 2007; London, 2011). Other
factors that burden the wellbeing of farmers and farm workers are high alcohol use,
1

low education levels psychosocial conditions such as ill-health and conditions of
poverty (London et al., 1997; London, 1999; London, et al., 2012).
1.1.1. Organophosphate pesticides and neurobehavioural function
Organophosphate (OP) pesticides are a class of chemicals that were developed as
insecticides in the 1940s (Costa, 2006) for use in agricultural, commercial and
domestic settings. OPs have also been associated with affective disorders (Stallones
& Beseler, 2002; Wesseling et al., 2002) and are used in acts of self-harm (Gunnell
& Eddleston, 2003; Konradsen, van der Hoek & Peiris, 2006; Sebe, Satar, Alpay,
Kozaci & Hilal, 2005). Globally, OPs represent the largest group of insecticides sold
(Costa, 2006). The widespread use of OP pesticides in public health programs
combined with its escalating use in agriculture for crop protection have resulted in
global concern about the effects OP pesticides might have on human and animal
health (Rohlman, Anger & Lein, 2011).
Exposure to OP pesticides can result in four forms of neuropathy including an acute
cholinergic syndrome, (ii) an intermediate syndrome (IMS), (iii) distal symmetrical
sensori-motor polyneuropathy known as organophosphorous ester-induced delayed
neuropathy (OPIDN) and (iv) chronic organophosphate-induced neuropsychiatric
disorder (COPIND). Acute cholinergic effects as a result of an acute poisoning
episode such as accidental spills in occupational settings or when OPs are ingested in
acts of self-harm are associated with the inhibition of the enzyme
acetylcholinesterase (AChE). Clinical symptoms that manifest in acute OP exposure
include dizziness, nausea, salivation, sweating, bronchial secretion, reduced
consciousness, seizures, respiratory failure and death in extreme instances. An
intermediate syndrome (IMS) may manifest up to four days later in two-thirds of
patients who have recovered from an acute poisoning episode. IMS is characterised
by weakness of the neck, proximal skeletal and respiratory muscles which may
continue up to 6 weeks. OPIDN may follow within 4 weeks after an acute poisoning
episode or as a result of repeated OP exposure and may manifest in sudden muscle
cramps with progressive weakness (Brown & Brix, 1998; Terry, 2012). Peripheral
nerves may also degenerate resulting in flaccid paralysis which is followed by central
2

nervous system degeneration which is long lasting. Effects of long-term chronic and
low-dose exposure to OP pesticides are more contradictory (Ismail, Bodner &
Rohlman, 2012; Rohlman et al., 2011).
Studies investigating the association between neurobehavioural function and
pesticide exposure specifically OP exposure have been conducted with children,
adolescents, adults and pregnant mothers in developing and developed countries.
Impaired neurobehavioural function as a result of OP exposure have been reported in
studies with adolescent agricultural farm workers (Abdel Rasoul et al., 2008;
Rohlman et al., 2007) and associations between OP exposure and neurobehavioural
impairment in adult populations abound. For example, decreased neurobehavioural
performance have been reported among exposed OP manufacturing factory workers
(Albers et al., 2004), farmers and farmworkers (Baldi et al., 2011; Kamel et al., 2003;
Rohlman et al., 2007), chemical factory workers (Srivastava et al., 2000), pesticide
applicators (Horowitz, 1999), greenhouse workers (Bazylewicz-Walczak et al.,
1999), sheep dippers (Mackenzie et al., 2010; Pilkington et al., 2001), army veterans
(Proctor, Heaton, Heeren, T. & White, 2006) and members of the general population
(Yokoyama et al., 1998; Zhang, Stewart, Phillips, Shi, & Prince, 2009). Chapter 2
discusses the neurobehavioural effects of OP pesticide exposure in more detail.
1.1.2 OP pesticides and emerging farmers
The decline of the South African economy has also affected the contribution of the
agricultural sector to the country’s Gross Domestic Product (GDP) over the last
decade (Integrated Growth and Development Plan, Department of Agriculture,
Forestry & Fisheries, (DAFF), 2012). Currently agriculture contributes 3% to the
GDP of the country and rising food prices have necessitated a re-examination of the
economic and social roles that this sector has in the broader economic framework. In
the face of declining employment opportunities, the DAFF has turned its attention to
improving national and house-hold food safety and security which includes the
intensification of agriculture which in turn, implies increased pesticide use
(Schreinemachers & Tipraqsa, 2012).
3

There are three groups of farmers in South Africa: a) about 40 000 commercial
farmers who are predominantly white and who farm on approximately 82 million
hectares of land and produces in excess of 90% of the country’s agricultural output;
b) about 225 000 small holder or emerging farmers who are predominantly black and
occupy 14 million hectares of agricultural land, located mainly in the previously
designated black homeland regions of the country; and c) a smaller group of
subsistence farmers who comprise approximately 2.8 million households produce
crops in vegetable gardens or practice small-scale animal husbandry and are not
regarded as self-sufficient but rather produce food at a very basic level of nutrition
for their own consumption (DAFF, 2012). It is the second group of farmers that are
the focus of this research for reasons detailed below.
In recognition of the needs of vulnerable communities especially in rural areas,
DAFF has committed to increasing rural employment economic opportunities by
providing financial assistance to small holder or emerging farmers and subsistence
farmers. This is complementary to a land claims redistribution and restitution process
that was initiated in 1994 and with the passing of the Broad based Black Economic
Empowerment Act 53 of 2003 in South Africa, which set the stage for effective
expansion of black ownership in agriculture. Specifically, new emerging farmers
were encouraged to enter commercial markets and adopt forms of agriculture
consistent with high output. In order to expedite and facilitate the progress from
emerging small holder farmers into commercially viable farmers, the South African
government designed programs to facilitate farmer support and development by
assisting small farmers with access to credit, technical training, advisory services,
post-settlement support and drought assistance schemes (National Department of
Land Affairs, 1997). However, the need to become commercially viable brought
along with it the potential to increase pesticide use (Rother, Hall & London, 2008).
Farm workers in South Africa are a marginalized vulnerable group with poor living
and working conditions, low levels of education and high alcohol use (London et al.,
1997; London, 2000). In the absence of safer less toxic pesticide management
practices (such as the use of integrated pesticide management (IPM) and crop
rotation methods), availability and use of adequate personal protective equipment
(PPE), adequate health and safety training and sufficient awareness and knowledge
4

about pesticide hazards, emerging farmers who are resource poor, face the potential
to suffer short and long-term health effects (London, 2009, 2011; London et al.,
2012; Rother et al., 2008).
1.2 PROBLEM STATEMENT
Concern has been expressed about the neurobehavioural and neuropsychological
effects of chemicals on agricultural communities in developed and developing
countries over the past four decades. The use of pesticides though necessary in
agricultural settings, may result in short or long-term ill-health among farmers, farm
workers and their families especially in rural settings in developing countries. South
Africa is currently the largest market for pesticides in sub-Saharan Africa and the
Western Province of South Africa where this present study was conducted produces
almost half of the deciduous fruit, wheat and grapes in the country. Deciduous fruit
and grapes are pesticide intense crops (London et al., 1997).
Emerging farmers are particularly at risk of pesticide exposure given the demands of
entering the commercial agricultural market that imply higher use of agrichemicals
and the marketing of chemicals in South Africa is as yet inadequately supported by
technical programs. In addition, there is an absence of a systematic and accurate
pesticide poisoning surveillance and monitoring system resulting in likely under-
reporting of pesticide poisoning. This presents a major problem for South African
emerging farmers with inadequate pesticide knowledge and limited assistance from
government extension services. The low literacy levels and high alcohol
consumption that characterise South African fruit farms further exacerbates the
situation and thus have implications for the health and safety of these emerging
farmers and their use of hazardous pesticides. For example, the long-term excessive
use of alcohol may negatively affect the learning skills of emerging farmers and this
in turn, may result in accidental pesticide poisoning. Furthermore, alcohol
intoxication may mask the symptoms of pesticide poisoning resulting in under-
reporting of the incidence of pesticide poisoning on South African fruit farms.
5

While there is evidence for the association between acute OP pesticide exposure and
long-term neurobehavioural deficits, there is a paucity of studies that report long-
term effects in the absence of an acute poisoning episode. Farmers and farm workers
may be more at risk for low-level OP pesticide exposure than acute poisoning
episodes. In addition, existing conditions that predispose emerging farmers to
hazardous pesticide exposure such as low education levels and an inadequate
understanding of pesticide toxicity and pesticide labels may render farmers at greater
risk of not taking the necessary precautions when using pesticides. Combined with
the lack of pesticide monitoring and surveillance in the agricultural sector, lack of
safer integrated pesticide management practices (IPM), inadequate personal
protective equipment (PPE), low literacy levels and high alcohol consumption,
questions about the health and safety of emerging farmers remain unanswered. More
importantly, the long-term effects of OP pesticide exposure on the neurobehavioural
performance require further investigation.
1.3 AIM, OBJECTIVES AND HYPOTHESES
1.3.1 Aim of the study
A study was conducted between 2009 and 2010 to investigate the neurobehavioural
function of emerging farmers with long-term OP pesticide exposure in three selected
agricultural districts in the Western Cape, South Africa to address the research
question framed in the problem statement above. The aim of the study was to
investigate the hypothesis that long-term exposure to OP pesticides is associated with
impaired neurobehavioural performance.
1.3.2 Objectives of the study
In order to meet the above-mentioned aim, the study had the following objectives:
To measure and describe the neurobehavioural performance of the study
participants on a set of neurobehavioural tests of cognition, motor speed,
dexterity, vibration sense, neurological symptoms and the change over a 1 year
period
6

To describe long-term and annual exposure to organophosphate pesticides and
other neurotoxic pesticides and chemicals, acute and chronic, retrospective and
prospective, amongst emergent farmers, identifying those who are highly and less
highly exposed
To describe and measure the covariates of neurobehavioural performance
(age, gender, education, alcohol dependence, psychiatric illness, head injury
and low socio-economic status).
To determine the relationship between long-term OP exposure and
neurobehavioural outcomes controlling for covariates
To determine the relationship between OP exposure experienced over a one year
period and the change in neurobehavioural performance in that period controlling
for covariates
To determine the relationship between past poisoning experiences and
neurobehaviuoral performance as well as one year change in neurobehavioural
performance controlling for covariates.
1.3.3 Study hypotheses
1. OP applicators will exhibit:
a) poorer neurobehavioural performance compared to applicators who do not
apply OP pesticides;
b) a greater decline in neurobehavioural performance compared to applicators
who do not apply OP pesticides over a one year interval
2. Farmers with higher cumulative OP pesticide past exposure will exhibit:
a) poorer neurobehavioural performance in the baseline cross-sectional study
compared to farmers with lower cumulative OP pesticides past exposure;
7
b) a greater decline in neurobehavioural performance compared to
applicators who do not apply OP pesticides over a one year interval
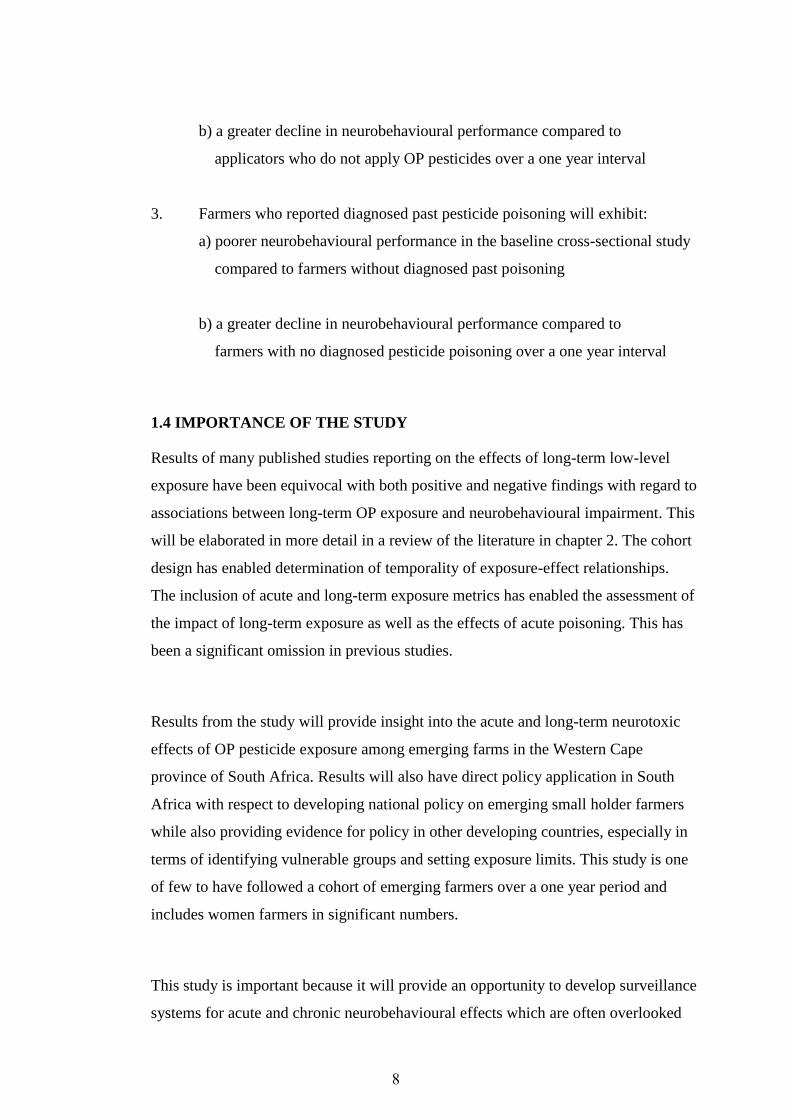
3. Farmers who reported diagnosed past pesticide poisoning will exhibit:
a) poorer neurobehavioural performance in the baseline cross-sectional study
compared to farmers without diagnosed past poisoning
b) a greater decline in neurobehavioural performance compared to
farmers with no diagnosed pesticide poisoning over a one year interval
1.4 IMPORTANCE OF THE STUDY
Results of many published studies reporting on the effects of long-term low-level
exposure have been equivocal with both positive and negative findings with regard to
associations between long-term OP exposure and neurobehavioural impairment. This
will be elaborated in more detail in a review of the literature in chapter 2. The cohort
design has enabled determination of temporality of exposure-effect relationships.
The inclusion of acute and long-term exposure metrics has enabled the assessment of
the impact of long-term exposure as well as the effects of acute poisoning. This has
been a significant omission in previous studies.
Results from the study will provide insight into the acute and long-term neurotoxic
effects of OP pesticide exposure among emerging farms in the Western Cape
province of South Africa. Results will also have direct policy application in South
Africa with respect to developing national policy on emerging small holder farmers
while also providing evidence for policy in other developing countries, especially in
terms of identifying vulnerable groups and setting exposure limits. This study is one
of few to have followed a cohort of emerging farmers over a one year period and
includes women farmers in significant numbers.
This study is important because it will provide an opportunity to develop surveillance
systems for acute and chronic neurobehavioural effects which are often overlooked
8

in primary health care systems, in agricultural and labour legislation and policies that
govern the marketing and distribution of pesticides.
1.5 STRUCTURE OF THE THESIS
The thesis comprises 6 chapters which are set out as follows:
• Chapter 1 sets out the background to the study, the purpose, aims and objectives
of the study and provides motivation for the study
• Chapter 2 reviews the literature on organophosphate action, neurotoxic,
neurobehavioral effects of pesticides, neuropsychological symptoms,
vibration sensitivity and potential confounders.
• Chapter 3 sets out the methods used in the baseline cross-sectional and cohort
study to assess the association between neurobehavioural function and OP
exposure. It also provides a description of exposure characterisation with
reference to self-reported job history and job activity and crop type weighting
using a job exposure matrix
• Chapter 4 presents the univariate, bivariate and multivariate results of the baseline
study with a discussion of the baseline study findings. Limitations of the baseline
cross-sectional study are discussed.
• Chapter 5 presents the univariate, bivariate and multivariate results of the cohort
study with a discussion of the cohort study findings. Limitations of
this study are discussed.
• Chapter 6 provides conclusions with a summary of the important findings
in the study. It also provides a comparison of neurobehavioural performance
in developing and developed countries. Recommendations for on-going and future
research in this field are proposed.
9

Each chapter includes a brief introduction and outlines the structure the chapter will
follow. The introductory chapter provides a background to the thesis and sketches the
context of South African emerging farmers and their exposure to harmful pesticides.
The need for the investigation of neurobehavioural effects as a result of OP pesticide
exposure among emerging farmers is outlined. This is followed by a review of the
health effects of OP pesticide exposure with specific focus on neurobehavioural
effects of OP pesticide exposure in chapter 2. Details of the study methods are
discussed in chapter 3. Chapters 4 and 5 present the results and discussion for (i) a
cross-sectional baseline study and (ii) the cohort study. The final chapter provides
conclusions with recommendations for on-going and future research.
The term ‘neurobehavioural’ is used in this study as an all-embracing term to
describe and evaluate all aspects of Central Nervous System (CNS) functioning using
a variety of psychological tests and neurological symptoms. These tests originate
within the paradigm of neuropathology (or neuropsychology) and are used to
measure such functioning.
The American Psychological Association (APA) referencing method was used in this
study.
10

1.6 REFERENCES
Abdel Rasoul, G. M., Abou Salem, M. E., Mechael, A. A., Hendy, O. M., Rohlman,
D. S. & Ismail A. A. (2008). Effects of occupational pesticide exposure on
children applying pesticides. Neurotoxicology, 29, 833-838.
Albers, J. W., Garabrant, D. H., Schweitzer, S. J., Garrison, R. P., Richardson, R. J.
& Berent, S. (2004). The effects of occupational exposure to chlorpyrifos on the
peripheral nervous system: a prospective cohort study, Occupational and
Environmental Medicine, 61, 201-211.
Anger, W. K. (1990). Worksite behavioral research: Results, sensitive methods, test
batteries and the transition from laboratory data to human health. Neurotoxicology
11, 629-720.
Anger, W. K. (2003). Neurobehavioral tests and systems to assess neurotoxic
exposures in the workplace and community. Occupational and Environmental
Medicine, 60, 531-538.
Anger, W. K., Sizemore, O. J., Grossmann, S., Glasser, J., Letz, R. & Bowler, R.
(1997). Human neurobehavioral research methods: impact of subject variables,
Environmental Research, 73, 18-41.
Baldi, I., Gruber, A., Rondeau, V., Lebailly, P., Brochard, P. & Fabrigoule, C.
(2011). Neurobehavioral effects of long-term exposure to pesticides: results from
the 4-year follow-up of the PHYTONER Study. Occupational & Environmental
Medicine, 68, 108-115.
Bazylewicz-Walczak, B., Majczakowa, W., Szymczak, M. (1999). Behavioral effects
of occupational exposure to organophosphorous pesticides in female greenhouse
planting workers. Neurotoxicology, 20, 819-826.
Beseler, C. & Stallones, L. (2008). A cohort study of pesticide poisoning and
depression in Colorado farm residents. Annals of epidemiology, 18(10), 768-774.
11

Brown, M. A. & Brix, K. A. (1998). Review of health consequences from high-,
intermediate- and low-level exposure to organophosphorus nerve agents. Journal
of Applied Toxicology, 18(6), 393-408.
Cole, D. C., Carpio, F., Julian, J., Leon, N., Carbotte, R. & De Almeida, H. (1997).
Neurobehavioral outcomes among farm and nonfarm rural Ecuadorians.
Neurotoxicology and Teratology, 19(4), 277-286.
Costa, L. G. 2006). Current issues in organophosphate toxicology. Clinica Chimica
Acta, 366, 1-3.
Dalvie, M. A., Myers, J. E., Thompson, M. L., Dyer, S., Robins, T. G., Omar, S.
… Millar, R., (2004). The hormonal effects of long-term DDT exposure on
malaria vector-control workers in Limpopo Province, South Africa.
Environmental Research, 96 (1), 9-9.
Delgado, E., McConnell, R., Miranda, J., Keifer, M., Lundberg, I., Partanen, T. &
Wesseling, C. (2004). A two-year follow-up of central nervous system effects of
acute organophosphate poisoning. Scandinavian Journal of Work, Environment &
Health, 30, 362-370.
Department of Agriculture, Forestry and Fisheries (DAFF). (2012). Integrated
Growth and Development Plan, Department of Agriculture, Forestry & Fisheries.
Pretoria, South Africa.
Gunnell, D. & Eddleston, M. (2003). Suicide by intentional ingestion of pesticides:
a continuing tragedy in developing countries. International Journal of
Epidemiology, 32, 902-909.
Heeren, G. A., Tyler, J. & Mandeya, A. (2003). Agricultural chemical exposures and
birth defects in the Eastern Cape Province, South Africa: a case-control study.
Environmental Health, 2(1), 11. Retrieved January 31, 2013 from Website:
http://www.ehjournal.net/content/2/1/11
12

Hernández, A. F, Parrón, T. & Alarcón, R. (2011). Pesticides and asthma. Current
Opinion in Allergy & Clinical Immunology, 11(2), 90-96.
Horowitz, S. H., Stark, A., Marshall, E. & Mauer, M. P. (1999). A multi-modality
assessment of peripheral nerve function in organophosphate-pesticide applicators.
Journal of Occupational & Environmental Medicine, 41(5), 405-408.
Ismail, A. A., Bodner, T. E. & Rohlman, D. S. (2012). Neurobehavioral performance
among agricultural workers and pesticide applicators: a meta-analytic study.
Occupational and Environmental Medicine, 69, 457-464.
Johnson, B. L. (1997). The Triennial international symposium on neurobehavioral
methods: The History and Hope. Environmental Research, 73, 2-8.
Kamel, K., & Hoppin, J. A. (2004). Association of pesticide exposure with
neurologic dysfunction and disease. Environmental Health Perspectives, Annual
Review Issue, 112(9), 950-958.
Kamel, F., Rowland, A. S., Park, L. P., Anger, W. K. Baird, D. D., Gladen, B. C.
… Sandler, D. P. (2003). Neurobehavioral Performance and work Experience in
Florida Farmworkers. Environmental Medicine, 111(14), 1765-1772.
Konradsen, F., van der Hoek, W. & Peiris, P. (2006). Reaching for the bottle of
pesticide – A cry for help. Self-inflicted poisonings in Sri Lanka. Social Science
& Medicine, 62, 1710-1719.
Landrigan, P. J., Garg, A. & Droller, D. B. J. (2003). Assessing the effects of
endocrine disruptors in the national children’s study. Environmental Health
Perspectives, 111(13), 1678-1682.
London, L. (1999). The `dop' system, alcohol abuse and social control amongst farm
workers in South Africa: a public health challenge. Social Science & Medicine,
48, 1407-1414.
13

London, L. (2000). Alcohol consumption amongst South African farm workers: a
challenge for post-apartheid health sector transformation. Drug and Alcohol
Dependence, 59, 199-206.
London, L. (2009). Neurobehavioural methods, effects and prevention: Workers’
human rights are why the field matters for developing countries. Neurotoxicology,
30, 1135-1143.
London, L. (2011). Human rights and health: opportunities to advance rural
occupational health. International Journal of Occupational Environmental
Health, 17, 80-92.
London, L., Beseler, C., Bouchard, M., Bellinger, D. C., Colosio, C., Grandjean, P.
… Stallones, L. (2012). Neurobehavioral and neurodevelopmental effects of
pesticide exposures. Neurotoxicology, 33, 887-896.
London, L., Myers, J. E., Nell, V., Taylor, T. Thompson, M. L. (1997). An
investigation into neurologic and neurobehavioural effects of long-term
agrochemical use among deciduous fruit farm workers in the Western Cape,
South Africa. Environmental Research, 73 (1-2), 132-145.
Mackenzie Ross, S. J., Brewin, C. R., Curran, H. V., Furlong, C. E., Abraham-Smith,
K. M. & Harrison, V. (2010). Neuropsychological and psychiatric functioning in
sheep farmers exposed to low levels of organophosphate pesticides,
Neurotoxicology & Teratology, 32(4), 452-459.
Miyaki, K., Nishiwaki, Y., Maekawa, K., Ogawa, Y., Asukai, N., Yoshimura, K.
… Omae, K. (2005). Effects of sarin on the nervous system of subway workers
seven years after the Tokyo subway sarin attack. Journal of Occupational Health,
47(4), 299-304.
14

National Department of Land Affairs. (1997). Procedures for farm worker equity
schemes. Reference: PC.DOC.9/1997. Pretoria: Land Reform Policy Committee.
Retrieved January 31, 2013 from Website:
http://land.pwv.gov.za/legislation_policies/policies.htm
Nishiwaki, Y., Maekawa, K., Ogawa, Y., Asukai, N., Minami, M. & Omae, K. and
Sarin Health Effects Study Group. (2001). Effects of sarin on the nervous system
in rescue team staff members and police officers 3 years after the Tokyo subway
sarin attack. Environmental Health Perspectives, 109(11), 1169-1173.
Pilkington, A., Buchanan, D., Jamal, G. A., Gillham, R., Hansen, S., Kidd, M.
… Soutar, C. A. (2001). An epidemiological study of the relations between
exposure to organophosphate pesticides and indices of chronic peripheral
neuropathy and neuropsychological abnormalities in sheep farmers and dippers.
Occupational and Environmental Medicine, 58, 702-710.
Proctor, S. P., Heaton, K. J., Heeren, T. & White, R. F. (2006). Effects
of sarin and cyclosarin exposure during the 1991 Gulf War on neurobehavioral
functioning in US army veterans. Neurotoxicology, 27, 931-939.
Rohlman, D. S., Lasarev, M., Anger, W. K., Scherer, J., Stupfel, J. & McCauley, L.
(2007). Neurobehavioral performance of adult and adolescent agricultural
workers. Neurotoxicology, 28(2), 374-380.
Rohlman, D. S., Lucchini, R., Anger, W. K., Bellinger, D. C. & van Thriel, C.
(2008). Neurobehavioral testing in human risk assessment. Neurotoxicology, 29,
556-567.
Rohlman, D. S., Anger, W. K. & Lein, P. J. (2011). Correlating neurobehavioral
performance with biomarkers of organophosphorous pesticide exposure.
Neurotoxicology, 32, 268-276.
15

Roldan-Tapia, L., Nieto-Escamez, F. A., del Aguila, E. M., Laynez, F., Parron, T. &
Sanchez-Santed, F. (2006). Neuropsychological sequelae from acute poisoning
and long-term exposure to carbamate and organophosphate pesticides.
Neurotoxicology and Teratology, 28, 694-703.
Rother, H. A., Hall, R. & London, L. (2008). Pesticide use among emerging
participants in South Africa: contributing factors and stakeholder perspectives.
Development Southern Africa, 25(4), 399-424.
Schreinemachers, P. & Tipraqsa, P. (2012). Agricultural pesticides and land use
intensification in high, middle and low income countries. Food Policy, 37, 616-
626.
Sebe, A., Satar, S., Alpay, R., Kozaci, N. & Hilal, A. (2005). Organophosphate
poisoning associated with fetal death: A Case Study. The Mount Sinai Journal of
Medicine, 72(5), 354-356.
Stallones, L. & Beseler, C. (2002). Pesticide illness, farm practices, and neurological
symptoms among farm residents in Colorado. Environmental Research, Section
A, 90, 89-97.
Srivastava, A. K., Gupta, B. N., Bihari, N., Muthur, L. P., Srivastava, B. S., Pangtey,
R. S. ... Kumar, P. (2000). Clinical, biochemical and neurobehavioural studies of
workers engaged in the manufacture of quinalphos. Food and Chemical
Toxicology, 38(1), 65-69.
Terry Jr, A. V. (2012). Functional consequences of repeated organophosphate
exposure: potential non-cholinergic mechanisms. Pharmacology & Therapeutics,
134(3), 355-365.
Wesseling, C., Keifer, M., Ahlbom, A., McConnell, R., Moon, J., Rosenstock, L. &
Hogstedt, C. (2002). Long-term neurobehavioural effects of mild poisonings with
organophosphate and n-methyl carbamate pesticides among banana workers.
International Journal of Occupational and Environmental Health, 8(1), 27-34.
16

Wesseling, C., van Wendel de Joode, B. , Keifer, M., , London, L., Mergler, D. &
Stallones, L. (2010). Symptoms of psychological distress and suicidal ideation
among banana workers with a history of poisoning by organophosphate or n-
methyl carbamate pesticides. Occupational & Environmental Medicine, 67, 778-
784.
Yokoyama, K., Araki, S., Murata, K., Nishikitani, M., Okumura, T., Ishimatsu, S.
… White, R. F., (1998). Chronic neurobehavioral effects of Tokyo subway sarin
poisoning in relation to posttraumatic stress disorder. Archives of
Environmental Health, 53(4), 249-256.
Zahm, S. H. & Ward, M. H. (1998). Pesticides and childhood cancer. Environmental
Health Perspectives, 106(3), 893-908.
Zhang, J., Stewart, R., Phillips, M., Shi, Q. & Prince, M. (2009). Pesticide exposure
and suicidal ideation in rural communities in Zhejiang province, China. Bulletin of
the World Health Organization, 87, 745-753.
17

CHAPTER 2: A REVIEW OF NEUROBEHAVIOURAL EFFECTS OF
ORGANOPHOSPHATE PESTICIDE EXPOSURE
2.1 INTRODUCTION
The last three decades have witnessed a global increase in the use of pesticides in
public health programs, industry and agriculture (Rotterdam Convention, 2011).
Pesticides are used in developed and developing countries across the globe to
prevent and control health risks from insect vectors such as malaria, to improve food
production through protection of crops and as pest control measures in domestic
contexts (Loewenherz et al., 1997; Whyatt et al., 2002). Chemicals are also sprayed
by flight attendants in aircraft as part of international health regulations to prevent
intercontinental transfer of disease vectors including malaria, yellow fever, typhus,
viral encephalopathy amongst others (Kilburn, 2004). Exposure to pesticides as a
result of acute poisoning or due to chronic long-term exposure has resulted in
diverse health problems ranging from developmental (Eskenazi et al., 2007;
Grandjean et al., 2006), allergic (Jeebhay et al., 2007; Hoppin et al., 2009; Ndlovu,
Dalvie & Jeebhay, 2011), carcinogenic (Alavanja et al., 2004), endocrine disruptive
(Mnif et al., 2011), neurological (Colosio et al., 2003; Kamel & Hoppin, 2004) and
reproductive effects (Dalvie et al., 2004; English et al., 2012; Perry, 2008) and
neurobehavioural impairment (Anger et al., 1997, 2000, 2003; Colosio et al., 2003;
London et al., 1997; Mackenzie Ross et al., 2012; Rohlman et al., 2007; Wesseling
et al., 2002.).
The term ‘pesticides’ is a broad term encapsulating insecticides, herbicides,
fungicides and fumigants. These substances are used to control insects, weeds and
plant diseases (Kamel & Hoppin, 2004). These groups are further classified by
chemical type into organophosphates, carbamates, pyrethroids and organochlorines.
Individuals are often exposed to various pesticides at a particular time, in aircraft
cabins as described above, following residential fumigation or, in the case of
agricultural workers, repeatedly over a long period of time. Often these classes of
18

pesticides are combined or mixed making it difficult to identify related health
effects.
This review will focus on the neurobehavioural effects of exposure to
organophosphate (OP) pesticides which are widely used as insecticides in the
agricultural sector and are more accurately described as organophosphorous
compounds. Briefly, epidemiologic studies published between 1975 and March
2013 that investigated the relationship between OP exposure and neurobehavioural
performance were selected for the review. Databases including PubMED,
MEDLINE, EBSCO and Google Scholar were searched using keywords including
neurobehavioural, attention, memory, cognitive tests, pesticides, farmers, farm
workers, neuropsychological, and OPs. Journals and dissertations accessed through
the electronic library at the University of Cape Town and reference lists from
relevant articles were also scanned for further sources that may have been missed in
the primary search strategy.
2.2 ORGANOPHOSPHATE PESTICIDES
Organophosphate (OP) pesticides are a class of chemicals derived from phosphinic,
phosphonic and phosphoric acids synthesized in the early 1800s and later developed
as insecticidesin the 1940s (Costa, 2006) for agricultural, commercial and domestic
use. OPs have also been used as agents in acts of self-harm (Gunnell & Eddleston,
2003; Konradsen, van der Hoek & Peiris, 2006; Sebe et al., 2005), as chemical
weapons of warfare and more recently as nerve agents to conduct low-level or urban
warfare (Miyaki et al., 2005; Nishiwaki et al., 2001; Yokoyama et al., 1998).OPs
have also been used as pharmaceutical drugs in the treatment of glaucoma and as
anthelmintic in controlling schistosamiasis (Costa, 2006). However, because of its
widespread use in public health programs and agriculture there is global concern
about the effects of OP pesticides on human and animal health.
19

The toxicity of organophosphorous compounds may manifest in cholinergic
syndromes, cardiovascular disorders and central nervous system dysfunction (Balai-
Mood & Saber, 2012). The central and peripheral nervous systems are particularly
vulnerable to OP pesticide exposure. OP exposure includes four types of
neurotoxicity (explained in more detail in section 2.3 below): (i) an acute cholinergic
crisis with excessive stimulation of nicotinic and muscarinic receptors; (ii) an
intermediate syndrome (IMS) occurring between 1 and 4 days after acute
intoxication; (iv) in some instances a delayed form of neuropathy may follow six
weeks later known as Organophosphate-induced delayed Neuropathy (OPIDN) and;
(iv) lastly, chronic neurotoxicity, which is caused by a large acutely toxic dose of OP
pesticides such as in the case of previously OP poisoned subjects who evidenced
central nervous system dysfunction years after an acute poisoning episode (COT
Report, 1999; Miyaki et al., 2005; Nishiwaki et al., 2001; Proctor et al., 2006;
Rosenstock et al., 1991; Savage et al., 1988; Srivastava et al., 2000; Steenland et al.,
1994, 2000).
2.2.1 Routes of OP pesticide exposure
Pesticide poisoning may occur in various ways of which the most common
manifestation of effects are evident in instances of acute poisoning during accidental
spills or as an agent in suicide and suicide attempts. A common form of exposure in
occupational settings occurs where farm workers become exposed through dermal
absorption through the skin, accidental or deliberate oral ingestion of OP pesticides
and may also inhale agrichemical spray while in close proximity to spray activities
(Balali-Mood & Saber, 2012; Chaudhry et al., 1998). Pesticide residues may also be
found in the food of farmers (Bradman et al., 2007; Curl, Fenske & Elgethun, 2003;
Lu, Kedan, Fisker-Andersen, Kissel & Fenske, 2004) and in the water of those who
store pesticides inside their homes (Naidoo et al., 2010). Developmentally, OPs
cross the human placental barrier which might have negative consequences for the
neurological development of the foetus (Sebe et al., 2005) and the neurodevelopment
20

of children whose mothers are exposed to pesticides during pregnancy (Grandjean et
al., 2006).
2.2.2 Factors affecting occupational exposure
Application method, use of personal protective equipment which is particularly
limited in developing countries (Cole et al., 1997), work practices related to hygiene,
spills, and attitudes toward risk factors that influence the degree of pesticide
exposure can be incorporated into exposure estimates (London & Myers, 1998). In
addition, Coronado et al., (2004) found that timing and type of job tasks might shed
more light on patterns of pesticide accumulation and provide insight into the
pathway of exposure between workplace and residence.
The relationship of these factors to exposure can be complex. For example, wearing
gloves can increase exposure under some circumstances, perhaps because fabric (as
opposed to chemically impervious gloves) can become impregnated with pesticide
and serve as a reservoir of exposure or latex gloves that may tear and allow
pesticides to leak onto the skin (Hines, Deddens, Tucker & Hornung, 2001; London,
2003). The same may be true of other types of protective clothing. In developing
countries, use of closed pesticide mixing and loading systems may increase exposure
when the equipment is used to speed up work and increase productivity rather than
to protect workers (Hruska et al., 2002; McConnell et al., 1992).
2.3 NEUROBEHAVIOURAL EFFECTS OF OP PESTICIDES
Throughout the lifespan, studies have shown the presence of neurodevelopmental
toxicity of OP pesticides. Studies conducted with children prenatally exposed to OP
pesticides have shown developmental disorders in cognitive measures such as
attention deficits in performance (Bouchard et al., 2011; Eskenazi et al., 2007;
Grandjean et al., 2006). Studies investigating the effects of OP exposure in
adolescents working in agriculture have also reported deficits in neurobehavioural
performance (Abdel Rasoul et al., 2008; Rohlman et al., 2007). Associations
21

between OP exposure and neurobehavioural impairment in adult populations
abound. Decreased neurobehavioural performance have been reported among
exposed chemical manufacturing factory workers (Albers et al. 2004), farmers and
farmworkers (Baldi et al., 2001, 2011; Bosma et al., 2000;Ciesielski et al., 1994;
Cole et al., 1997; Daniell et al., 1992; Gomes et al., 1998; Kamel et al., 2003;
London et al., 1997; Rohlman et al., 2007; Wesseling et al., 2002), pesticide
applicators (Ames et al., 1995; Horowitz et al., 1999; Kamel et al., 2005; Maizlish et
al., 1987; Misra et al., 1985; Starks et al., 2012a, 2012b; Steenland et al., 1994),
green house workers (Bazylewicz-Walczak et al., 1999; Roldan-Tapia et al., 2005,
2006), sheep dippers (Jamal et al., 2002b; Mackenzie Ross et al., 2007, 2010;
Pilkington et al., 2001; Stephens et al., 1995; Solomon et al., 2007), army veterans
and members of the general population (Proctor et al., 2006; Kilburn & Thornton,
1995; Miyaki et al., 2005; Nishiwaki et al., 2001; Yokoyama et al., 1998) and
chemical factory workers (Srivastava et al., 2000). In general, the neurotoxic effects
of organophosphate pesticides may be considered to lie in four categories namely,
acute cholinergic effects, intermediate syndrome (IMS), organophoshorous ester-
induced delayed neurotoxicity (OPIDN) and chronic neurotoxicity from acute
exposures. A discussion of each of these categories follows.
2.3.1 Acute cholinergic effects
Acute exposure to OP pesticides as a result of accidental poisoning or intentional
self-harm can result in death following the inhibition of respiratory centres in the
brainstem and ultimate paralysis of the respiratory muscles. The site of exposure is
important in acute exposure for example, contact with the eyes or skin or ingestion
determines the severity of effects. Ambient temperature may also exacerbate the
resultant effects in dermal exposure e.g. accidental spills, which is the most common
form of poisoning in farm settings. Acute effects of OPs depend largely on the
Acetylcholine (Ach) which is a neurotransmitter necessary for the optimal
functioning of the cholinergic nervous system. Acetylcholine is released as a
response to depolarisation at a nerve ending and transmits the nerve impulse across a
synaptic junction. Normally, the enzyme acetylcholinesterase (AChE), present in the
22

intersynaptic junction, breaks down acetylcholine so as to maintain a steady state
and avoid under- or over-stimulation of the nerves. Acute exposure to OP pesticides
leads to the inhibition of AChE (and the related enzyme butyrylcholinesterase)
which results in the accumulation and overstimulation of acetylcholine in the central
nervous system and at the nicotinic (excitatory) and muscarinic (inhibitory) receptors
of the peripheral nervous system (Costa, 2006).This results in cholinergic effects
including salivation, sweating, bronchial secretion and constriction of the bronchi,
muscle twitching, reduced consciousness, seizures and in extreme instances,
respiratory failure and death. Initially, the enzyme inhibition can be reversed, but
within a few hours, the enzyme-OP complex ‘ages’ and the chemical bond becomes
irreversible, requiring generation of new acetylcholinesterase to reverse the effects in
the CNS and manifest in clinical recovery. While OP poisoning may result in clinical
manifestations up to 5 days later, in severe poisoning it may also result in death if
intoxication is severe (Brown & Brix, 1998; Lotti, 1992).
2.3.2 Intermediate Syndrome (IMS)
Patients recovering from an acute poisoning event may manifest an intermediate
syndrome between 1 to 4 days later and is characterized by weakness of the neck,
proximal skeletal and respiratory muscles which may continue up to 6 weeks. The
syndrome comprises presence of presynaptic and postsynaptic dysfunction and is not
associated with delayed neuropathy. Thus symptoms of the intermediate syndrome
may appear several hours before signs of any organophosphate-induced delayed
neuropathy (OPIDN – see below) but after the beginning of symptoms of severe
cholinergic over-stimulation. The intermediate syndrome follows cholinergic over
activity at the neuromuscular junction which results in extensive levels of
cholinesterase depression and is not a result of necrosis of the muscle fibres (Balali-
Mood & Saber, 2012).Sensory functions appear unaffected and patients recover fully
within 3 weeks. The intermediate syndrome has been evidenced in poisoning with
dichlorvos, dimethoate, fenthion, methamidophos, methylparathion and parathion
but not following poisoning with nerve agents (Balali-Mood & Saber, 2012; Delgado
et al., 2004; Senanayake & Karalliede, 1987; Singh & Sharma, 2000).
23

2.3.3 Organophoshorous ester-induced delayed neurotoxicity (OPIDN)
A third form of neuropathy which follows up to 4 weeks after an acute or repeated
exposure to OP esters is known as organophosphorous ester-induced delayed
neuropathy (OPIDN) which is characterised by distal symmetrical sensori-motor
polyneuropathy. OPIDN can present with sudden cramping muscle pain with
progressive weakness. Early changes in OPIDN are caused by the degeneration of
peripheral nerves resulting in flaccid paralysis and this is usually followed by
degeneration in the central nervous system which is long lasting. Progression of
neurological deficits may occur in four phases in some patients, namely, a latent,
progressive, stationary phase and improvement phase depending on the nature of the
chemical, route of exposure, dose size, duration and frequency of exposure, exposure
to other chemicals and individual genetic differences. This type of toxicity is most
severe in the long axons and recovery from this condition may take up to 12 months
or longer and may be incomplete (Lotti & Moretto, 2005; Singh & Sharma, 2000).
2.3.4 Chronic neurotoxicity from acute exposures
Long-term neurological impairment has been evidenced in epidemiological studies
investigating individuals years after exposure to a single large toxic dose of OP
compounds (Ray & Richards, 2001) and has been widely reported (Baldi et al.,
2011; Blanc-Lapierre et al., 2013; Delgado et al., 2004; McConnell et al., 1994;
Rosenstock et al., 1991; Savage et al., 1988; Stallones & Beseler 2002; Steenland et
al., 1994; Yokoyama et al., 1998). In these studies, a central nervous system disorder
was evidenced involving neurobehavioural and neuropsychological consequences.
These studies have shown that individuals who recovered following an acute
poisoning may manifest long-term persistent symptoms that are unrelated to
inhibition of AChE. Common symptoms include anxiety, confusion, depression,
fatigue, social isolation and irritability (Beseler & Stallones, 2002; Jamal et al.,
2002a; Savage et al., 1988). Long-term effects may also include cognitive
dysfunction, difficulty concentrating, tremors, lack of motor control, generalized
24

weakness, impairment in visual memory and a decrease in verbal attention (Baldi et
al., 2011; Blanc-Lapierre et al., 2013; Bosma et al., 2000; Cole et al., 1997; Farahat
et al., 2003; Kamel et al., 2003; Mackenzie et al., 2007, 2010; Rohlman et al., 2007;
Roldan-Tapia et al., 2005, 2006; Srivastava et al., 2000; Starks et al., 2012a, 2012b;
Stephens & Sreenivasan, 2004). Cognitive effects following OP exposure include
impairment of several domains including working memory and attention, visual
memory, executive function, fine motor control, psychomotor speed and mood.
Recovery from this condition, where damage is present in the peripheral and central
nervous system, is slow ranging from weeks to years with a possibility that the
patient might be left with residual disability.
The evidence for long-term neuropsychological effects following acute intoxication
is discussed further in section 2.4.5 below, along with a review of the literature
regarding long-term neurobehavioural effects arising from long-term exposures to
OP’s in the absence of acute intoxication. However, in order to critically appraise the
epidemiological evidence, it is important to have an understanding of the field of
neurobehavioural testing. Accordingly, the following section 2.4 reviews the growth
and practice of neurobehavioural testing for chemical toxicity.
2.4 MEASURING NEUROBEHAVIOURAL EFFECTS OF PESTICIDE
EXPOSURE
The trajectory of neurobehavioural studies has seen steady growth and spans five
decades of investigations beginning with case studies of acute pesticide poisoning
with resultant psychiatric sequelae, through studies focusing on effects of chronic
exposure (Pilkington et al., 2001), intermediate syndrome, delayed neuropathy and a
current attention to the effects of low-dose, long-term organophosphate exposure
(Cole et al., 1997). These studies have included the effects of pesticide exposure on
adults and children and more recently have begun to examine the long-term
neurobehavioural effects of prenatal or in utero exposure to pesticides (Eskenazi et
al., 2004; Grandjean, Harari, Barr & Debes, 2006).
25

2.4.1 The need for psychological measurement
As early as 1973, the need was recognized for the use of psychological and
neurological methods to detect the effects of toxicity in the workplace to the nervous
system (Johnson, 1997). In the modern world, the first behavioural symptom was
diagnosed 280 years ago in Venice where workers manufacturing mirrors evidenced
motor impairment following mercury exposure (cited by Johnson, 1997). Areas of
concern (such as the need for selectivity and rigorous criteria for field studies;
assessment of the significance of neurobehavioural data in health impairment;
standardizing methods; ascertaining the relationship between exposure and response;
the role of confounding and modifying factors when administering neurobehavioural
tests and interpreting findings) that were raised at the first Symposium on
Neurobehavioral Methods in Milan in 1982 remain as relevant in the 21st century as
it did then. It was only at the 2nd
Symposium on Neurobehavioral Methods held in
Copenhagen in 1985 that the importance of the role that neurobehavioural methods
could play became evident when it was remarked by Grandjean (cited by Johnson,
1997) that neurobehavioural effects may well be evident earlier in the course of a
condition, while more severe functional and physical effects manifest later. Training
and educating workers, government agencies and the business sector were seen as
the only ways to prevent disease from neurotoxicants.
2.4.2 Evaluating and screening for neurotoxicity
The central nervous system is a complex system and a single test is insufficient to
determine the extent of impairment following exposure to neurotoxicants. It
therefore warrants a number of tests to determine the range of effects of hazardous
agrochemicals (Simonsen et al., 1994). Investigations should at least include
behavioural, neurological and biochemical batteries of tests to determine the extent
of neurotoxic effects. Simonsen and colleagues (1994) have argued that the
symptoms and effects of neurotoxicity can manifest along a continuum ranging from
reversible subjective symptoms at the weakest strength of neurotoxicity evidence to
irreversible effects where neurological and morphological changes such as cell death
26

and axonopathy occur equating to the highest level of toxicity as can be seen in
Table 2.1. The strength or level of neurotoxicity is dependent on the nature and dose
of the chemical, the duration of exposure and the complex relationships between
these factors.
Table 2.1. Levels and effects of neurotoxicity
a Humans only. Source: Simonsen et al., 1994.
Low-dose exposure may result in reversible subjective symptoms but with increasing
dose and duration effects may no longer be reversible as reflected in the table in
levels 2 and above. It is also important that both human and animal data be used to
evaluate the weight of evidence for neurotoxicity. While caution should be used in
extrapolating neurotoxic effects on animals to humans, effects of specific chemical
reactions in animals may, for practical reasons, be interpreted as being neurotoxic in
humans (Simonsen et al., 1994).
Level Effect Explanation/examples
6 Morphological changes Cell death and axonopathy, as well as
subcellular morphological changes
5a
Neurological changes Findings from neurological examinations of
single individuals
4 Physiological/behavioural
changes
Experimental findings in groups of animals or
humans as changes in evoked potentials and
electroencephalography or changes in
psychological and behavioral tests
3 Biochemical changes Changes in relevant biochemical parameters
(eg, transmitter level, content of glial fibrillary
acidic protein, or enzyme activities)
2a Irreversible, subjective
symptoms
Symptoms not verified by a neurological
examination or measurements
1a Reversible, subjective
symptoms
Symptoms not verified by a neurological
examination or measurements
27

2.4.3 The development of neurobehavioural testing
Behavioural tests in epidemiologic studies in the 1960s primarily relying on the keen
perception of clinicians and results from animal studies, have been used to measure
sensory, motor and cognitive abilities to detect early low-level neurotoxic
impairment (Anger et al., 1997; Jamal et al., 2002a). These studies were primarily
designed to measure and compare inter-group scores between exposed and non-
exposed workers. It was not until the 1980s and following some 250 individual
behavioural tests used in almost as many cross-sectional studies that the World
Health Organisation (WHO) Neurobehavioural Core Test Battery was established.
This was to be a consensus behavioural test battery to assess effects of neurotoxic
chemicals. The aim of the panel of experts convened and sponsored by the WHO
and the United States National Institute of Occupational Safety and Health (NIOSH)
charged with this task was to develop a database of common tests for the purpose of
screening and to propose a core set of tests for research in epidemiological studies
(Anger et al., 2000).
The need for early recognition of subjective, sub-clinical complaints following low-
dose long-term pesticide exposure (Ihrig, Triebig & Dietz, 2001) that is not invasive
has long been recognized especially given the financial constraints of the use of
Magnetic Resonance Imaging (MRI) or Positron Emission Tomography (PET)1
imaging to detect early neurobehavioural defects (Bowler et al., 2003). Changes in
the nervous system functions due to chemical exposure can be measured through the
application of neurobehavioural test batteries.
Batteries have been applied to measure the effects of acute and chronic exposure to
neurotoxicants in many populations, including children, adolescents, adults, farmers,
farm workers, greenhouse workers, paint factory workers, deciduous fruit farm
1 Positron Emission Tomography is a diagnostic examination that involves the acquisition of
physiologic images based on the detection of radiation from the emission of positrons. Positrons are
tiny particles emitted from a radioactive substance administered to the patient. The subsequent images
of the human body developed with this technique are used to evaluate a variety of diseases.
28

workers, pesticide applicators, sheep dippers, army veterans and nerve agent
exposed general members of the population.
Having clarified the history of, and approaches to neurobehavioural testing, the
sections that follow now turn to the evidence for possible neurotoxicity of OP
exposure derived from application of these batteries (summarized in Table 2.3 in
terms of the nature of exposure (acute or chronic) and the nature of the cognitive
domain affected).
2.4.4 Neurobehavioural effects following OP pesticide exposure: methods for a
review of the literature
Neurobehavioural tests have been used over the past three decades and in a number
of studies to measure the effects of neurotoxic chemicals in adults exposed
occupationally while working in chemical manufacturing factories and in
environmental settings where farmers and farm workers are exposed to pesticides in
agricultural settings. Recent studies have also investigated neurobehavioural effects
on children prenatally exposed to pesticides in non-occupational settings (Lu, Kedan,
Fisker-Andersen, Kissel & Fenske, 2004; Bouchard et al., 2011; Harari et al., 2010)
Tests were developed as a response to the recognition that impairments of cognitive
and sensorimotor performance and of affect may, in the absence of acute poisoning
instances, be subclinical therefore highlighting the need for early markers of
neurotoxicity that precede clinical effects (Johnson, 1987, 1997).
A review was conducted of neurobehavioural studies involving pesticide exposure
among farmers and farm workers, flower growers, sheep dippers and pesticide
applicators in rural and urban settings in developed and developing countries.
Epidemiologic studies published between 1975 and March 2013 were selected in
order to include studies that investigated the relationship between acute and chronic
OP exposure and neurobehavioural performance. The primary search strategy
involved searching databases including PubMED, MEDLINE, EBSCO and Google
29

Scholar. Key words for the search included neurobehavioural, attention, memory,
cognitive tests, pesticides, farmers, farm workers, neuropsychological, and
organophosphates (OPs). Sources included journals and theses accessed through the
electronic library at University of Cape Town. As a secondary search strategy
reference lists from all relevant articles sourced were scanned to look for other
articles that may have been missed in the initial searches. In addition, a pesticide list
server that circulates abstracts of recent studies in the Centre for Occupational and
Environmental Health Research in the School of Public Health & Family Medicine
at the University of Cape Town was scanned for relevant studies. Data were
collected for studies that included neurobehavioural and neuropsychological tests
and acute and chronic pesticide exposure. The search yielded results for 107 studies.
Studies that did not include any primary human data such as animal studies and
reviews were excluded. Studies investigating neurobehavioural performance among
adults exposed to OP pesticides were selected and those investigating the
relationship between OP pesticide exposure and health conditions other than
neurobehavioural performance such as cancer, Parkinson’s disease, respiratory
conditions and endocrine disruption were excluded. Articles focussing solely on
methodological approaches without discussing findings from data investigating
neurobehavioural effects of OP exposure were also excluded resulting in 65 studies
that were finally included in the review. Table 2.2 lists the 65 studies selected for
inclusion in the review. These studies were conducted between 1977 and 2013.
Of these, 17 were studies investigating neurobehavioural effects following acute OP
exposure, while 48 sought to investigate neurobehavioural effects after long-term
low-level OP exposure.
Of the 17 studies looking at the effects of acute exposure, 13 were cross-sectional in
design and 4 were cohort studies. The central and peripheral nervous systems are
vulnerable to acute OP pesticide exposure and symptoms may persist long after an
acute poisoning incident (Keifer & Mahurin, 1997; Terry, 2012). The effects of
30

acute OP exposure suggested in the literature are broadly in three categories:
impairment in neurobehavioural performance (particularly on cognitive testing), an
increase in neuropsychiatric symptoms, and impaired nerve function and decreased
vibration sensitivity. The literature is discussed in relation to these three categories
below.
2.4.5 Central nervous system sequelae of acute OP exposure
2.4.5.1 Cognitive effects following acute OP pesticide exposure
Studies investigating cognitive dysfunction as a result of OP intoxication or
poisoning have shown that effects can last up to 10 years after an acute poisoning
event. Savage et al., (1988) compared 100 individuals whose exposure was in the
form of acute poisoning to 100 unexposed population-based controls in a cohort
study. Controls performed significantly better in cognitive and psychomotor tests
than poisoned cases on selected WAIS subtests (Digit Span, Digit Symbol) and
motor speed tests (grooved pegboard) tests. Rosenstock et al., 1991 also reported
worse performance on five out of six WHO neuropsychological tests and on half of
the tests measuring visual and verbal attention, visuo-motor speed, dexterity and
motor steadiness for a poisoned group of Nicaraguan farm workers two years after
poisoning when compared with matched controls in a cross-sectional study.
Similarly Reidy et al., (1992) in their cross-sectional study found that the 11
unexposed controls performed better than the 21 farm workers on motor speed
(grooved pegboard) and coordination measures, visuo-spatial memory (Benton
visual retention), anxiety and depression (neurotoxic symptom profile results) two
years after poisoning. Steenland et al., (1994) also reported significantly worse
performance on sustained visual attention tests (Symbol Digit, Pattern Memory) and
mood scales (tension, anger, confusion) for 36 hospitalized poisoned subjects when
compared to unexposed controls and friends up to 8 years after poisoning. Although
there was an association between past poisoned participants who took more days off
from work and worse performance on the Santa Ana dexterity and Pursuit Aiming
tests, the associations were not significant at the p<0.05 level. Results showing a
31

decline in cognitive function following acute poisoning experiences were found by
Delgado et al., (2004) in their study. They reported worse performance on the Digit
Symbol test for hospitalized Nicaraguans who had ingested pesticides through
suicide attempts described in the study as ‘severe non-occupational poisonings
through the oral route’ and were categorised as highly exposed compared to those
with low and medium exposure to OP pesticides. Wesseling et al., (2002) also found
significantly worse visuo-motor speed function (Digit Symbol) in poisoned banana
plantation workers than non-poisoned workers. Poisoned participants performed
worse than non-poisoned participants on Digit Span Forward, Digit Symbol, Benton
Visual Retention tests but the associations were not significant. Roldan-Tapia et al.,
(2006) compared the neurobehavioural performance of groups of Spanish farmers
with acute poisoning, with high (more than 10 years exposure) and low chronic
exposure (less than 10 years exposure) and an unexposed control group (who had not
worked on farms and had no contact with OPs or carbamates). The group with no
exposure served as the control group. Significant differences in performance on
memory tasks (Benton Visual Retention test) were observed between exposed and
unexposed groups but not for attention (Digit Span Backward) and memory (Digit
Span Forward).
In Japan, Yokoyama et al., (1998) measured the cognitive functioning among 18
Tokyo subway commuters who had suffered acute sarin poisoning 6 to 8 months
before testing and reported a significant decrease in psychomotor performance (Digit
Symbol) when compared to unexposed controls. Three years later Nishiwaki et al.,
(2001) reported significantly worse performance on the Digit Span Backward test of
working memory and attention for the high exposed group which included the rescue
team, staff members and police officers who had worked at the sarin exposed
subway after the attack. The 56 exposed male workers performed worse than the 52
unexposed members of the control group in the Digit Span Backward. Miyaki et al.,
(2005) reported similar deficits in memory (Digit Span Backward) and psychomotor
function (dominant and non-dominant Finger Tapping) in 23 exposed workers and
13 unexposed subway workers (referents) 7 years after the sarin attack. Of the 23
32

exposed 5 had been hospitalized for poisoning immediately after the attack and were
assigned to the high exposure group while 18 were treated at the hospital as
outpatients were assigned to the low exposure group following the attack. The
exposed group (n=23) performed significantly worse than the 13 referents who were
subway workers providing evidence for the association between acute poisoning and
chronic neurobehavioral dysfunction.
2.4.5.2 Neuropsychiatric symptoms and affect following acute OP pesticide
exposure
The association between OP poisoning and neuropsychiatric symptoms is well
described in the literature. The inhibition of the neurotransmitter Acetylcholine that
occurs with acute OP intoxication has been associated with central and peripheral
nervous system impairment evidenced in psychological symptoms including anxiety,
irritability and depression. These increased symptoms following acute poisoning
appear to be a consistent effect reported in the literature and are considered early
indicators of chronic central nervous system impairment in the battery of
neurobehavioural tests (Delgado et al., 2004).
Distinct from immediate sequelae, evidence showing positive associations between
acute OP poisoning and chronic increased psychological symptoms and decreased
mood and affect is mounting. London et al., (1998) found strong evidence for an
association between past OP poisoning and symptom outcomes among deciduous
fruit pesticide applicators. Savage et al., (1988) reported abnormalities in mood tests
among poisoned cases when compared to unexposed controls. Relatives’ assessment
of the cases supported the test findings in their reports of poisoned cases’ disability
and distress. Rosenstock et al., (1991) also reported higher symptoms among farm
workers when compared to matched controls using the Q16 test. Significant
associations between previous poisoning and 10 symptoms including weakness,
irritability, tiredness, sleep problems and memory amongst others, were reported by
8 previously poisoned applicators in a study by Steenland et al., (2000). High Post
33

Traumatic Stress Disorder (PTSD) scores with mood changes and other psychiatric
complaints were reported by Yokoyama et al., (1998) in their study of sarin poisoned
subjects in Japan 6 to 8 months after the poisoning event when compared to
unexposed controls.
Borderline significant associations were also reported for impaired concentration and
depression. Stallones & Beseler (2002) compared Colorado farm residents with self-
reported pesticide poisoning (n=69) with those who sought medical attention (n=24)
with those who had not sought medical attention (n=45) and found higher Odds
ratios for those using OP pesticides classified as depressed and who had reported eye
irritation and chest discomfort. Six years later Beseler & Stallones (2008) reported
increased somatic symptoms among poisoned individuals which were consistent
over time. Also, individuals who were poisoned at baseline were more likely to be
depressed using the 20 item Center for Epidemiologic Studies Depression (CES-D)
Scale in subsequent years compared to lower rates of depression among non-
poisoned individuals in the second year of the study.
In a study conducted amongst patients who had been hospitalised for acute OP
poisoning in Nicaragua Delgado et al., (2004) categorised OP poisoning cases
according to three levels of severity (low, moderate and high exposure) and
demonstrated that the greatest increase in symptoms over 2 years occurred in the
medium exposure group which may indicate gradual but subtle central nervous
system change that may be permanent. The authors argued that the symptoms may
be a manifestation of central nervous system damage that is progressive. Wesseling
et al., (2002) found significant differences on the Brief Symptom Inventory Global
Severity Index between a mildly poisoned group of banana plantation workers who
did not require hospitalisation and non-poisoned group of Costa Rican banana
workers. Poisoned workers showed significantly more neuropsychiatric symptoms
on the Q16 and the BSI. Wesseling et al., (2010) revisited the data collected in 1994
(Wesseling et al., 2002) to examine long-term symptoms of psychological distress
34

including suicidal ideation among the previously poisoned workers and compare
results between those who had sought medical attention between 1 and 3 years
previously and those who had not. The study found that OP poisoned workers had
reported more symptoms than those who were not poisoned on eight of the nine
dimensions. Significant trends were reported for those with increasing number of
poisonings specifically for somatisation, obsessive-compulsive disorder,
interpersonal-sensitivity, anxiety and depression. Those with previous OP poisoning
had an almost four-fold risk of suicidal ideation (OR: 3.72; 95%CI: 1.41 – 9.81)
compared to those without previous poisoning.
2.4.5.3 Altered vibration sense following acute OP poisoning
Vibration threshold score can be used to estimate the somatosensory function of the
peripheral nervous system (Stokes et al., 1995). A few studies have investigated the
effects of acute OP exposure on vibration sensitivity in pesticide applicators and
sheep dippers. McConnell et al., (1994) evaluated three groups of 36 male workers
between 10 and 34 months after hospitalization stratifying between those who had
acute poisoning with methamidophos, those poisoned by OPs other than
methamidophos and those never poisoned. The study found that more than 25% of
patients previously poisoned with the OP methamidophos, had abnormal vibrotactile
thresholds. Steenland et al., (1994) reported abnormal vibration thresholds in the toes
and fingers of 83 subjects with definite OP poisoning as well as in the 36 subjects
who had been hospitalised because of acute OP poisoning in California. Cole et al.,
(1998) also reported significantly higher mean vibration scores among applicators
than the female farm members and unexposed local town residents.
Summary of studies investigating neurobehavioural effects of acute OP
exposure
Except for Delgado et al., (2004) and Wesseling et al., (2002), the studies discussed
above compare heterogeneous groups such as poisoned groups with unexposed, non-
poisoned comparison groups. The study conducted by Wesseling et al., (2002) was
35

the only study where the unexposed group also consisted of farmers who had
substantial exposure since they were selected from the same population. It is
possible that the comparison group were also farmers who were not significantly
different from the exposed group in terms of exposure which would explain the
mainly non-significant results of the study. Even though the control group had
experienced pesticide-related symptoms, they did not require medical attention and
were not hospitalized.
The most frequently reported neurobehavioural impairment as a result of acute OP
exposure was psychomotor function (Digit Symbol) as reported in five studies
(Savage et al., 1988; Rosenstock et al., 1991; Steenland et al., 1994; Delgado et al.,
2004; Wesseling et al., 2002). In three of these studies the poisoned group was
compared to unexposed population-based controls (Miyaki et al., 2005; Nishiwaki et
al., 2001; Savage et al., 1988).Visuo-spatial function (Benton Visual Retention test)
was impaired in three studies involving exposed poisoned workers compared to
unexposed controls (Rosenstock et al., 1991; Reidy et al., 1992; Roldan-Tapia et al.,
2006). Fine motor dexterity (Santa Ana Pegboard) was significantly impaired in
three studies (Savage et al., 1988; Rosenstock et al., 1991; Reidy et al., 1992),
attention (Digit Span backward), memory (Digit Span forward), affective or mood
disturbance (Q16, BSI) and motor hand steadiness (Pursuit Aiming) in eight studies
(Miyaki et al., 2005; Nishiwaki et al., 2001; Reidy et al., 1992; Roldan-Tapia et al.,
2006; Savage et al., 1988; Wesseling et al., 2002, 2010; Yokoyama et al., 1998).
Symptoms including depression, confusion, anger, irritability, paranoia and social
withdrawal appear to be consistently reported in studies investigating effects of acute
poisoning (Beseler & Stallones, 2008; Delgado et al., 2004; London et al., 1997;
Rosenstock et al., 1991; Stallones & Beseler, 2002, Steenland et al., 2000; Wesseling
et al., 2002; 2010). It is also possible that low education levels could explain lower
performance on tests requiring verbal memory and visuo-spatial motor functions
(Delgado et al., 2004).
36

Thus it appears that neurobehavioural deficits, including impaired memory,
attention, psychomotor speed and increased symptoms, were most frequently
reported following acute OP exposure. Acute OP exposure consistently results in
neurobehavioural deficits notwithstanding differences in sample size, occupational
groups (greenhouse workers, agricultural workers, farm workers, commercial
pesticide applicators, poisoned subway workers) and method of exposure
characterization. Most studies compared exposed groups to unexposed population-
based controls (Miyaki et al., 2005; Nishiwaki et al., 2001; Reidy et al., 1992;
Roldan-Tapia et al., 2006; Steenland et al., 2000) and few studies compared exposed
agricultural workers to unexposed agricultural workers (London et al., 1997;
Stallones & Beseler, 2002; Wesseling et al., 2002, 2010).
2.4.6. Central nervous system effects following long-term low-level OP pesticide
exposure in the absence of an acute OP poisoning episode
It has been postulated that more individuals are likely to be at risk of ongoing low
level pesticide exposure than acute poisoning (Mackenzie Ross et al., 2012) and thus
clarification with regard to the health effects following low level exposure over
prolonged periods is necessary. Agricultural workers are especially vulnerable to
long-term low level pesticide exposure which can be defined as prolonged repeated
exposure resulting in subclinical symptoms that often remain unrecognized and
without the required medical attention and intervention. The findings of studies
investigating the effects of low-level OP exposure are equivocal with some studies
reporting positive associations on certain neurobehavioural tests while others report
negative findings.
For this review of the literature, 65 studies were surveyed and 48 investigated
neurobehavioural effects resulting from chronic or long-term low-level OP exposure.
Forty-six (n=46) studies were cross-sectional in design, 1 was a case-control study
and 18 were cohort studies.
37

2.4.6.1 Cognitive effects following long-term low-level OP pesticide exposure in
the absence of an acute OP poisoning episode
Associations between long-term low-level exposure in the absence of an acute
poisoning and neurobehavioural dysfunction are less consistent in the literature.
While deficits in cognitive, psychomotor and altered vibration sense have been
documented as a result of OP pesticide exposure in most studies, some have reported
no associations and the pattern across studies is inconsistent (Ismail et al., 2012;
Mackenzie et al., 2012).Increased psychiatric symptom prevalence and depressed
mood have been reported in several studies following chronic exposure to OP
pesticides. Cole et al., (1997) reported significant differences between exposed farm
workers on potato farms and non-farm rural groups in Ecuador on a number of tests
where farm workers consistently performed worse on the Digit Span, Digit Symbol
Substitution, Benton Visual Retention tests, Santa Ana Pegboard and Pursuit Aiming
tests. Stephens et al., (1995) found significant differences between 146 sheep
farmers and 143 quarry workers where the sheep farmers performed significantly
worse on Simple Reaction time, Symbol-Digit Substitution and Syntactic Reasoning
test but not on the Digit Span test. Exposed greenhouse workers also performed
worse than non-exposed greenhouse workers on tests measuring reaction time and
motor steadiness (Bazylewicz-Walczak et al., 1999). Similarly, Kamel et al., (2003)
compared the neurobehavioural performance of 288 farm workers in Florida with 51
controls and found significant differences between the two groups on Digit Span and
Santa Ana Pegboard tests but not on Digit Symbol latency. Farahat et al., (2003)
reported significantly lower performance for exposed pesticide applicators when
compared to 50 male administrators working in offices in Egypt on Digit Span, Digit
Symbol and Benton Visual Retention tests. Gomes et al., (1998) also reported poorer
performance among established farm workers (n=226) who had been exposed to
multiple pesticides when compared to unexposed referents (n=226) on aiming and
Digit Symbol tests.
Subtle changes in cognitive function were also reported in exposed Dutch arable
farmers in a prospective cohort study conducted by Bosma et al., (2000) using verbal
38

learning tests and letter digit coding tests. In a cross-sectional study, Baldi et al.,
(2001) reported worse performance among exposed French vineyard workers
compared to unexposed vineyard workers on tests measuring working memory and
selective attention (Benton Visual Retention test). These workers were followed up 4
years later and exposed workers were found to have a five-fold risk of long term
cognitive impairment over time (Baldi et al., 2011). Roldan-Tapia et al., (2005)
reported a positive association between cumulative exposure and impaired
perception (Benton Visual Form Discrimination) among the OP exposed greenhouse
workers compared to a control group of unexposed hotel and restaurant staff in a
cross-sectional study. Similar results were reported by Proctor et al., (2006) who
investigated neurobehavioural effects in war veterans who had been exposed up to 5
years prior to testing to OP agents used in warfare, sarin and cyclosarin. Studies
investigating neurobehavioural effects in US migrant farm workers (Rohlman et al.,
2007; Rothlein et al., 2006), pesticide applicators (Starks et al., 2012a, 2012b), sheep
dippers (Mackenzie Ross et al., 2007, 2010), have also reported cognitive deficits
among exposed versus unexposed control groups.
Workers exposed to chronic low-dose various chemicals in a quinalphos
manufacturing factory for 5 years were found to have deficits in lower limb reflexes
and nervous system functions such as memory, vigilance and learning (Srivastava et
al., 2000). Exposed respondents reported significantly lower scores for memory on
the Digit Span, Digit Symbol and vigilance test than the control group. Members of
the general population such as residents of an apartment block sprayed with mixtures
of chlorpyrifos and chlordane also performed worse on cognitive tests when
compared with unexposed controls (Kilburn & Thornton, 1995).
Anomalous findings have been reported in an investigation by Stephens &
Sreenivasan (2004) who found that a group of orchard sprayers were slower than
unexposed construction workers in their performance on a processing speed test but
found different results on another processing speed test administered in the study,
39

the NES2 Symbol-Digit test. They noted that it could either be a specific processing-
speed effect or a deficit evidenced on the most sensitive test used in their battery.
Other studies found no associations between long-term low-level exposure and
neurobehavioural impairment. Ames et al., (1995) did not find any significant
differences on Pursuit Aiming between 45 Californian Hispanic pesticide applicators
and 90 unexposed friends who were the controls in the study. A number of other
studies have investigated neurobehavioural outcomes and found no significant
differences between exposed groups with long-term exposure compared to controls.
These studies have included comparison of exposed US fruit tree farmers and
unexposed berry growers and hardware store owners (Fiedler et al., 1997), US apple
orchard workers and beef slaughterhouse workers (Daniell et al., 1992), US migrant
farm workers and unexposed farm workers (Rodnitzky et al., 1975), highly exposed
South African deciduous fruit farm workers compared to less exposed controls
(London et al., 1997), US pest control applicators and unexposed non-applicators
(Maizlish et al., 1987), highly exposed South African table and wine grape farm
workers compared to less exposed controls (Major, 2010) and commercial
termiticide applicators and unexposed controls (Steenland et al., 2000).
The reasons for the varying results include differences in study design, exposure
measurement, selection of exposed and control groups, small sample size and failure
to match groups on age and education levels. The majority of the studies (positive
and negative) were cross-sectional in design while only a few were cohort studies
(Baldi et al., 2011; Bosma et al., 2000; Daniell., 1998; Proctor et al., 2006; Starks et
al., 2012a, 2012b). Cross-sectional studies provide a snapshot of neurobehavioural
function as a result of exposure at a point in time, based on current or past exposure
(Katzenellenbogen, Joubert & Abdool Karim, 1997). Cohort or follow-up studies
may provide more accurate information about exposure and associated
neurobehavioural effects of such exposure over time and stronger temporal
relationships can be inferred from the data. The cost constraints of cohort studies
40

make cross-sectional studies an easier method of assessing exposure-outcome
relationships.
The studies discussed above differ in terms of exposure characteristics on a few
levels for example, most of the studies compared farm workers to non-farm workers
such as town residents, quarry workers, waiters and cooks (Cole et al., 1997; Farahat
et al., 2003; Kamel et al., 2003; Rohlman et al., 2007; Roldan-Tapia et al., 2005,
2006; Rothlein et al., 2006; Stephens et al., 1995). The control groups in these
studies are not comparable to the exposed group in terms of OP exposure and can be
expected to perform better than exposed groups. In some studies the exposure metric
is crude and subjects with some exposure may be mistakenly allocated to control
groups. Conversely, it could also be the case that, where exposure is based on job
title, an exposed group may in fact have little or no exposure and may have better
protection because of PPE use than field workers who are exposed to pesticide
residues through re-entry.
Studies also differ in terms of intensity, frequency and duration of exposure
(Mackenzie et al., 2012). Longer periods of exposure are more like to show deficits
in more neurobehavioural tests. For example, Gomes et al., (1998) reported poorer
neurobehavioural performance on two tests namely, aiming and psychomotor speed
(Digit Symbol) for farm workers exposed to OP pesticides for up to 2 years. Cole et
al., (1997) reported 16 years mean exposure and found significant associations
between exposure and impaired neurobehavioural function on a number of tests. In
the absence of more accurate exposure information, studies have used increased
years of working in agriculture as an exposure measure and have reported
associations between such indirect exposure measures and neurobehavioural
impairment (Kamel et al., 2003; Rohlman et al., 2007; Roldan-Tapia et al., 2005;
Rothlein et al., 2006). Other proxies of exposure have included the use of structured
interviews and job exposure questionnaires (Baldi et al., 2001, 2011; Kamel et al.,
2003; Farahat et al., 2003; Roldan-Tapia et al., 2005), air pollution and
41

contamination of skin, clothes and house dust samples (Bazylewicz-Walczak et al.,
1999; Rothlein et al., 2006).Biological markers such as urine and blood plasma have
also been used to assess recent but not long-term exposure since toxins are rapidly
metabolized and eliminated from the human body (Cole et al., 1997; Farahat et al.,
2003; Gomes et al., 1998; Roldan-Tapia et al., 2005). For example, the inhibition of
plasma butylcholinesterase lasts a few weeks while erythrocyte acetylcholinesterase
(AChE) can last 3 to 4 months and unless quarterly specimens are collected to
monitor on-going exposure, these biomarkers are not useful to assess long-term OP
exposure.
The use of indirect exposure measures may present the possibility of contamination
from other substances. For example, using house dust may contain pyrethroid-based
pesticides which are generally used in residential homes. Also, crops may change
over time necessitating the use of different types of pesticides (Mackenzie et al.,
2012; Rothlein et al., 2006). Using years of work in agriculture can also be an
inaccurate exposure proxy (Rohlman et al., 2007) which may be subject to the same
vagaries as using self-reported exposure information in which case recall bias and
subsequent potential exposure misclassification (Rohlman et al., 2007) are possible
problems for example, some studies provide inadequate exposure history Bosma et
al., 2000; Starks et al., 2012a, 2012b). There are also questions with regard to
selecting exposed participants using poisoning surveillance systems which may be
problematic since the exposed group is not as representative of the specific
occupationally exposed population (Mackenzie et al., 2012). Small sample size may
make it difficult to detect significant associations between exposure and
neurobehavioural impairment (Ames et al., 1995; Daniell et al., 1992; Rodnitzky et
al., 1975; Maizlish et al., 1987; Steenland et al., 2000). Furthermore testers that are
not blinded to participants’ exposure status may also unwittingly influence the
behaviour of the participants and bias the results in the process.
It is also important that exposed and control groups are comparable for age. It is well
known that younger participants perform better than older participants (Ames et al.,
42

1995; Rohlman et al., 2007) and if the exposed group is older on average, a younger
control group may well perform better on neurobehavioural tests that require visual
acuity and fine motor dexterity. The exposed group with the least exposure in a
study by Roldan-Tapia et al., (2006) was significantly younger than the high exposed
and poisoned groups and scored significantly higher than the other groups including
the unexposed control group on the Benton Visual Retention test. However, it has
also been noted that tests of memory such as the Digit Span may not be affected by
age whereas tests of motor performance such as the Santa Ana may slow with age
(Williamson, 1995). Age and education were significantly related to tests of working
memory (Digit Span) in study by London et al., (1997). Age and education were also
strongly predictive of performance on fine motor control tests (Pursuit Aiming,
Santa Ana Pegboard) among South African paint factory workers (Colvin et al.,
1993; Myers et al., 1999). Practice may also minimise the differences of age between
participants. Education as a known strong predictor of neurobehavioural
performance could unfairly advantage the control group if more educated than the
exposed group (Ames et al., 1995; Baldi et al., 2001; Fiedler et al., 1997). Rohlman
et al., (2007) reported that performance on the Digit Span (memory) and Symbol
Digit increased with education. The control group with higher education levels in a
study by Srivastava et al., (2000) performed better on tests of memory (Digit Span)
and on a psychomotor test that has a learning ability component (Digit Symbol) than
the exposed group with lower education levels. Also, in the event of there being no
overlap in distribution of age and education between exposed and unexposed groups,
statistical adjustment is not possible and even then adjustment in the analysis may
not completely remove confounding effects.
Tests of cognitive function most often studied include tests of attention and working
memory (Digit Span Forward and Backward), visuo-spatial tests (Benton Visual
Retention tests), psychomotor tests of speed (Digit Symbol), fine motor control
(dexterity) tests requiring hand-eye coordination (Santa Ana Pegboard test) and tests
of mood and affect (BSI, Q16). It is often the case that studies administer only some
of the available neurobehavioural tests, and the selection of tests is not consistent
43

across studies, complicating comparison between studies (Colosio et al., 2009). Tests
of attention and working memory (Digit Span) were most often administered in
studies with groups varying in mean duration of exposure between 5 and 10 years
(Roldan-Tapia et al., 2005; Srivastava et al., 2000) and between 10 and 16 years
(Cole et al., 1997; Kamel et al., 2003; Farahat et al., 2003; Rohlman et al., 2007).
Visuo-spatial tests (Benton Visual Retention tests) have also been shown to be
significantly associated with chronic exposure for more than 10 years (Baldi et al.,
2001; Cole et al., 1997; Farahat et al., 2003; Rohlman et al., 2007; Roldan-Tapia et
al., 2005). Psychomotor speed (Digit Symbol) (Farahat et al., 2003; Rothlein et al.,
2006; Stephens et al., 1995; Srivastava et al., 2000) and fine motor dexterity tests
requiring hand-eye coordination (Santa Ana Pegboard, Pursuit Aiming) are less
often included in a battery to assess exposure effects (Cole et al., 1997; Gomes et al.,
1998).
2.4.6.2 Neuropsychiatric symptoms and affect following long-term low-level OP
pesticide exposure in the absence of an acute OP poisoning episode
There is mounting evidence that suggests that symptoms may be the strongest
indicators of neurobehavioural impairment in the absence of acute poisoning. For
example, Kamel et al., (2005) in their study among licensed Agricultural Health
Study (AHS) private pesticide applicators found that a history of OP exposure for
more than a year was associated with a twofold risk of increased symptoms (≥10)
using a neurological symptom questionnaire based on the Q16 questionnaire even
after having excluded those with previous pesticide poisoning. Kamel et al., (2005)
still found a significant association between cumulative pesticide use and symptom
prevalence even after having excluded individuals with past poisoning and/or a High
Personal Pesticide Exposure Episode. Similarly, Amr et al., (1997) found that
pesticide applicators exposed for at least 2 years manifested more psychiatric
disorders, specifically dysthymic disorder, than controls and the number of
psychiatric disorders was found to be higher than reported for the general
population. Psychiatric disorders were higher in pesticide applicators and
formulators with more than 20 years of exposure.
44

Earlier studies corroborate the association between increased symptom prevalence
and long-term OP exposure in the absence of acute poisoning. Increased tension,
greater depression and fatigue, more frequent symptoms of central nervous system
disturbances were observed in the OP exposed greenhouse workers compared to the
unexposed controls (Bazylewicz-Walczak et al., 1999). Psychiatric symptoms
(generalized anxiety, major depression) were also reported in a sample of
agricultural workers experiencing chronic long-term low-level organophosphate
exposure (Salvi et al., 2003). OP exposed Indian factory workers in Srivastava et al.,
(2000) reported more symptoms of fatigue and weakness than unexposed controls.
Current and past termiticide applicators in Steenland et al., (2000) who had been
exposed to chlorpyrifos for over 2 years suffered from significantly more memory
problems and fatigue than unexposed controls. Roldan-Tapia et al., (2005; 2006)
also reported increased anxiety levels among Spanish OP exposed greenhouse
workers compared to unexposed controls.
Increased symptom prevalence such as sweating and fainting were reported in
studies investigating the effects of sheep dip exposure and psychiatric symptoms
among UK sheep dippers (Pilkington et al., 2001). Jamal et al., (2002b) found
significant differences between the three groups of UK sheep dipper (no, possible
and probable or definite neuropathy) with greater anxiety and depression inferred for
those with probable or definite neuropathy.
In the absence of exposure work history, studies have also found associations
between depressed AChE levels and increased symptom levels. Gomes et al., (1998)
measured erythrocyte acetyl cholinesterase (AChE) activity and correlated
neurological dysfunction with AChE levels and type of job. They found an
association between depressed erythrocyte AChE levels and increased symptom
prevalence (restlessness, headache, sleeplessness, amongst others) for exposed
United Arab Emirates farm workers compared to controls. They also found that the
type of job was a highly significant predictor of weakness, restlessness and
45

sleeplessness. In a study by Ciesielski et al., (1994) the mean acetyl cholinesterase
levels of farm workers were compared to non-farm workers. Exposed farm workers
had significantly lower acetyl cholinesterase levels (30.18 U/g haemoglobin) than
non-farm workers (32.20 U/g haemoglobin) and farm workers were three time more
likely to have diarrhoea (OR =3.1; 95% CI= 1.18 – 8.0) than non-farm workers.
However, blood plasma and urine samples are only useful biological markers of
recent and on-going exposure, it cannot be used to assess long-term exposure since
the body is able to metabolize and eliminate toxins rapidly (Rohlman et al., 2011).
A recent study among South African rural women exposed to pesticides on farms
performed worse on the Q16 than women from neighbouring towns (Dalvie et al.,
2012, unpublished). The only other studies where the lower exposed participants
were also farm workers, were in previous studies by Major (2010) and London et al.,
(1997) also conducted in the Western Cape in which no association between
neurotoxicity and long-term low-level OP exposure were found. In these studies
(Dalvie et al., 2012; Major, 2010; London et al., 1997), the control groups were also
farm workers which could mean that exposure misclassification could be one of the
explanations for the negative results found in the latter two studies. As indicated
above, non-applicators are also a highly exposed group, for instance high pesticide
residue levels were previously reported in farm as well as non-farm workers in
recent studies in the Western Cape (Dalvie et al., 2003, 2004).
However, there are other studies that reported no associations between long-term
low-level exposure and increased symptoms or decreased mood. Ames et al., (1995)
did not find any significant differences on any of the Mood Scales (tension,
depression, anger, fatigue) amongst 45 Californian Hispanic pesticide applicators
and 90 unexposed friends who were the controls in the study. Fiedler et al., (1997)
also did not find any significant differences in emotional status or personality
alterations between exposed US fruit tree farmers and unexposed berry growers and
hardware store owners following long-term OP exposure. It is often the case that
46

studies include individuals who had experienced past poisoning making it difficult to
assess the relationship between symptom prevalence and exposure. Ames et al.,
(1995) and Fiedler et al., (1997) excluded poisoned participants and did not find a
relationship between long-term low exposure OP exposure and symptom prevalence.
No clear evidence of significant neuropsychological deficits was reported in studies
investigating effects of OP exposure on UK sheep dippers (Maizlish et al., 1987),
South African table and wine grape farm workers (Major, 2010). Cherry et al.,
(2012) also did not find an association between OP pesticides in 2 cohorts of grain
farmers in the US who had been exposed for approximately 7 years. They concluded
that the intensity of the OP exposure may have been too low and intermittent to
show any evidence of increased symptoms.
Similar concerns have been noted in studies that measure symptom prevalence as
have been noted with cognitive impairment as a result of OP exposure. Concerns
often noted include the difference in study designs, the exposure metric used, the
duration and intensity of exposure, the occupation of the exposed group compared to
the control group and the appropriate matching of exposed and control groups in
terms of age and education levels. A further difficulty is that checklists used to
assess associations between pesticide exposure and symptom prevalence include a
broad range of symptoms that often vary from one study to the next, which
complicate the evidence for specificity (Kamel & Hoppin, 2004). Increased
symptoms have been reported in studies varying in terms of type of occupation of
the exposed group for example, greenhouse workers, farm workers, pesticide
applicators, sheep dippers and commercial applicators were investigated
(Bazylewicz-Walczak et al., 1999; Gomes et al., 1998; London et al., 1998; Kamel et
al., 2005; Mackenzie et al., 2007, 2010; Ohayo-Mitoko et al., 2000; Pilkington et al.,
2001; Roldan-Tapia et al.,2005, 2006; Steenland et al., 2000). Studies reporting
higher years of exposure duration do not appear to report more symptoms than those
in studies with fewer years of exposure. For example, Kamel et al., (2005) found an
47

association between a history of 1 year OP exposure and a two-fold risk of 10 or
more symptoms in the AHS private pesticide applicators. Roldan-Tapia et al., (2005)
categorized participants into 3 exposure groups (2-4 years; 5-10 years; 11-30 years)
and reported that while more than 5 years exposure led to lower anxiety scores in
exposed participants, the relationship between duration of exposure and anxiety
scores was inconsistent. Sample size and not blinding the testers to participants’
exposure status were limitations in this study.
It has also been noted that the use of serum cholinesterase (BuChE) levels to detect
relationships between exposure to pesticides that inhibit cholinesterase and affect
and mood dysfunction is not useful since BuChE (and AChE) levels can vary
according to season, differences in individual ability to detoxify chemicals and
alcohol consumption (Gomes et al., 1998; Kamel & Hoppin, 2004; Roldan-Tapia et
al., 2005). Ciesielksi et al., (1994) did not find an association between increased
symptoms and erythrocyte AChE; however they found an association between
increased symptoms and self-reported exposure. Exposure to mixtures of pesticides
presents problems particularly for applicators in the agricultural sector for example,
using cholinesterase inhibition as a proxy for OP pesticide exposure presents
difficulties for studies investigating neurobehavioural effects of OP pesticides since
OP pesticide applicators may also have sprayed carbamates which also lower
cholinesterase levels (Kamel & Hoppin, 2004).
A further concern often noted is the subjective nature of symptoms and self-selection
(London et al., 1998; Steenland et al., 2000). Individuals participating in such studies
may do so because of their awareness of the potential health effects resulting from
pesticide exposure (Salvi et al., 2003). Often the symptoms are self-reported or the
participant’s response may be prone to recall bias. The converse is also possible
especially in cross-sectional studies where workers who are depressed may have left
their jobs leaving behind healthy workers with no evidence of association between
exposure and affect. In populations where alcohol use is high, it is highly likely that
48

the effects of exposure may also be masked (Major, et al., 2010; London et al.,
2012). It has also been noted that the study of symptoms lends itself to the difficulty
of the exposed group not being representative of all exposed workers (Steenland et
al., 2000).
2.4.6.3 Altered vibration sense following long-term low-level OP pesticide
exposure in the absence of an acute OP poisoning episode
Few studies have investigated vibration sense and of these, some are positive and
some are negative. The few studies that have reported decreased vibration sensitivity
may be a function of the low number of studies using vibration sense as an outcome.
Starks and colleagues reported significant association between ever-use of
dichlorvos and tetrachlorvinphos (OPs) and decreased toe vibration sense in their
investigation of licensed pesticide applicators in the Agricultural Health Study
(AHS) (Starks et al., 2012b).
However, Misra et al., (1988) found no association between exposure and peripheral
neuropathy in 24 exposed Indian workers who regularly sprayed fenthion (OP) and
who had been exposed for an average of 8.5 years. Horowitz et al., (1999)
investigated the health effects of 90 US OP pesticide applicators and found clinical
evidence of increased vibration sensitivity thresholds in a subgroup of nine pesticide
applicators. Four of the nine US male pesticide applicators showed peripheral
nervous system dysfunction compared to population based controls. Stokes et al.,
(1995) reported decreased vibration sensation in 68 orchard pesticide sprayers’ index
fingers compared to 68 unexposed population-based controls. These applicators had
been exposed on average for more than 20 years. Manjra et al., (as cited in London
et al., 1998) found impaired vibration sensitivity among South African exposed
pesticide applicators when compared to unexposed packstore workers, however
London et al., (1998) using a job exposure matrix to characterize direct and indirect
exposure found no significant associations between long-term exposure and
vibration sense among exposed deciduous fruit farm workers. They also used a
49

questionnaire, farm records and biomonitoring (plasma cholinesterase) to measure
recent OP exposure. Engel et al., (1998) also reported no peripheral nerve
conduction impairment among US farm workers exposed to low-level OP pesticides.
There may be a number of reasons for the mixed findings regarding vibration sense.
Studies of impaired peripheral nervous system function differ in exposure
characterization, the use of tests to measure peripheral nervous system function and
the selection of comparison groups. Small sample size and not including height as a
possible covariate are possible limitations in some of the studies described.
Questionnaires were used to assess long-term exposure in some studies (Engel et al.,
1998; London et al., 1998; Starks et al., 2012a, 2012b; Stokes et al., 1995) and
biomonitoring (venous blood samples) to assess recent exposure (Engel et al., 1998;
London et al., 1998). In their study Stokes et al., (1995) found that vibration sense
was impaired in applicators’ upper extremities (index fingers) but not the lower
extremities (toes) where it would be expected to manifest first (COT Report, 1999)
and where it is expected to manifest larger effects (Gerr et al., 1990). Stokes et al.,
(1995) hypothesized that exposure to OP pesticides accelerates the aging process of
the nervous system. The limitations in their study included small sample size, not
measuring height as a possible confounder and possible under-reporting of
alcoholism which could have affected the power of their study. Engel et al (1998)
also reported small sample size and lack of more accurate exposure measures as
possible reasons for not finding significant associations between long-term OP
exposure and impaired vibration sense. They also did not include height as a possible
confounder in their study.
Studies also differed in terms of the age of their study participants (Table 2.2). Age
has been shown to be predictive of impaired vibration sense in a study of British
sheep dippers (Pilkington et al., 2001). Those older than 45 years tended to evidence
worsening vibration sensitivity in this study confirming the role of age as a strong
predictor of vibration sense. For example, the mean age of the participants in a study
50

by London et al., (1998) was 33 years making them much younger than those in
Starks et al.’s (2012a, 2012b) study where the participants’ mean age was 61years.
This may indicate a trend between advancing age and decreasing vibration
sensitivity in participants with longer duration of exposure. However, decreased
vibration sense was reported among younger farm workers in a study among OP
exposed South African deciduous fruit farm workers (London et al., 1998). The
authors also argued that high alcohol use in this population may have masked the
effects of long-term OP exposure effects on vibration sense in their study.
51

Table 2.2 Neurobehavioural studies conducted among OP exposed populations: non-acute neurotoxic effects in humans (N=65)
* Chronic exposure,**Acute exposure
Neurobehavioural
studies
Study design/
sample size (n for
exposed/controls)
Exposed Group
Comparison Group
Ch
emic
al
C
ogn
itiv
e
Psy
chom
oto
r
Sym
pto
ms/
A
ffec
t
Vib
rati
on
sen
se/n
erve
Fu
nct
ion
Y= effect found/N= No effect found
Albers et al., (2004) Prospective
cohort:12 mnths
(N=53/58)
Dow OP factory Production
workers
Unexposed
plastic film
(Saran) factory
workers
OP*2
(air sample
chlorpyrifos)
N N N
Ames et al., (1995)
Cross-sectional
(N=45/90) Agric. pesticide applicators
Unexposed
controls/friends OP*
N
N
N
N
Baldi et al., (2001)
(Phytoner study) Cross-sectional
(N=701/216) French vineyard
workers Unexposed Vineyard wrkrs
Fng.*
Y
Y
Baldi et al., (2011)
(Phytoner study) Cohort: 3 - 4 yrs
(N=495/119) French vineyard
workers Unexposed Vineyard wrkrs
Fng.*
Y
Y
Bazylewicz-Walczak
et al., (1999)
Cohort: 12 years
(N=26/25)
Polish female
greenhouse
workers
Unexposed
female
greenhouse
wrkrs OP*
Y
Y
Y
Beseler & Stallones
(2008) Cohort: 3 yrs (N=653)
US farmers
Non- poisoned farmers
OP**
Y
Blanc-Lapierre et al.,
(2013) Cohort: 4yrs (N=443/171)
French Phytoner
vine workers Unexposed
agric. wrkrs OP*
Y
Bosma et al., (2000)
Cohort: 3 yrs (N=17/774)
Dutch MAAS
farmers Unexposed farmers
Mult*
Y
Y
Cherry et al., (2012)
2 cohorts: ~7yrs
(N=1074/1352)
Canadian Grain
farmers
Exposure
compared to
medical records OP*
N
52

Neurobehavioural
studies
Study design/
sample size (n for
exposed/controls)
Exposed Group
Comparison Group
Ch
emic
al
Cogn
itiv
e
Psy
chom
oto
r
Sym
pto
ms/
A
ffec
t
Vib
rati
on
sen
se/n
erve
Fu
nct
ion
Ciesielski et al.,
(1994) Cross-sectional
(N=202/42)
US Farm
workers
Non-farm
workers Mult*
Y
Cole et al., (1997)
Cross-sectional
(N=144/72) Equador,
Farmrs/applic's
Matched
controls /local
population OP,*
Carb,Fng Y N
Cole et al., (1998)
Cross-sectional
(N=144/72) Equador,
Farmrs/applic's Unexposed town
residents OP,*
Carb,Fng
Y
Dalvie & London
(Unpub, 2012) Cross-sectional
(N=121/90) SA rural women
farmers Farm and town
residents Mult*
Y
Daniell et al., (1992)
Cohort: 6mnths (N=49/40)
US apple
orchard workers
Beef
slaughterhouse
workers OP*
Y
Delgado et al., (2004)
Cohort: 2 years after
poisoning
(N=53/28) Poisoned
Nicaraguan men Fisherman /
cattle farmers OP**
Y
Y
Engel et al., (1998)
Cross-sectional
(N=67/68) US farm workers
Matched
reference
cntrls/local
population OP*
N
Farahat et al., (2003) Cross-sectional
(N=52/50) Egypt, cotton
farmers Clerks and
administrators OP,*
Carb,Pyr
Y
Y
Fiedler et al., (1997)
Cross-sectional
(N=57/42)
US Fruit tree
farmers
Unexposed
berry growers
and hardware
store owners
OP*
N
Y
N
Gomes et al., (1998)
Cross-sectional
(N=226/318) UAE Farm workers
Unexposed new
farm wrkrs Mult*
Y
Y
Y
53

Neurobehavioural
studies
Study design/
sample size (n for
exposed/controls)
Exposed Group
Comparison Group
Ch
emic
al
Cogn
itiv
e
Psy
chom
oto
r
S
ym
pto
ms/
A
ffec
t
V
ibra
tion
sen
se/n
erve
Fu
nct
ion
Holtman et al.,
(Unpublished, 2013)
Cohort: 12 - 17 mnths (N=273)
SA emerging Farmers
Less exposed Farmers
OP* Pyr,
Carb
Y
Y
Y
Y
Horowitz (1999)
Cohort: 4 years
(N=4/5)
US pesticide
applicators
Unexposed
population-
based controls
OP*
Y
Jamal (2002)
Case-control (N=79)
UK sheep
dippers
No exposure
sheep farmers OP*
Y
Y
Kamel et al., (2003) Cross-sectional
(N=288)
Farm workers
Unexposed non-
farm wrkrs Mult*
Y
Y
N
Kamel et al., (2005)
AHS Cohort
(N=18,872) used a
cross-sectional
design US pesticide
applicators Less exposed
applicators OP*
Y
Kilburn & Thornton
(1995) Cross-sectional
(N=216/174)
Adults
Unexposed
OP&* Chlordane Y
Y Y
Korsak & Sato (1977) Cross-sectional (N=59)
US occupational exposure
Low exposed
individuals OP*
Y
N
London et al., (1997)
Cross-sectional
(N=163/84) SA fruit farm
workers Non-spraying
labourers OP*
N
Y
N
London et al., (1998) Cross-sectional
(N=163/84) SA fruit farm
workers Non-spraying
labourers OP*
Y
N
Mackenzie Ross et al.,
(2007) Cross-sectional
(N=127/78)
UK sheep
dippers
Healthy
volunteers OP*
Y
Y
54

Neurobehavioural
studies
Study design/
sample size (n for
exposed/controls)
Exposed Group
Comparison Group
Ch
emic
al
Cogn
itiv
e
Psy
chom
oto
r
S
ym
pto
ms/
A
ffec
t
V
ibra
tion
sen
se/n
erve
Fu
nct
ion
Mackenzie Ross et al.,
(2010) Cross-sectional
(N=25/22)
UK sheep
dippers
Unexposed
controls
OP* Y Y
Y
Maizlish et al., (1987)
Pre and post shift
(N=46/56)
US pest control
workers
Unexposed Non-applicators
OP*
N
N
N
Major (Unpub, 2010) Cross-sectional
(N=817)
SA fruit farmers
Less exposed farmers
OP*
N
McConnell et al.,
(1994) Cross-sectional
(N=36/36) Nicaragua Farm
workers
Matched
population-
based controls OP**
Y
Miranda et al., (2002) Cross-sectional
(N=62/39) Nicaragua OP
poisoned men Cattle ranchers/
fisherman OP**
Y Miranda et al., (2004) Cohort
(N=62/39) Nicaragua OP
poisoned men Cattle ranchers/
fisherman OP** Y
Misra et al., (1985)
Cross-sectional
(N=32/25)
Commercial
applicators
Unexposed and
matched
OP*
Y
Miyaki et al., (2005)
Cross-sectional
(N=23/13)(7yrs
after) Japan/Sarin
exposed wrkrs Unexposed
controls OP**
Y
Y
Nishiwaki et al.,
(2001)
Cross-sectional
(N=56/52)(3yrs
after) Japan/Sarin exposed wrkrs
Unexposed
controls OP**
Y
N
N
Ohayo-Mitoko et al.,
(2000) Cross-sectional
(N=259/149) Farmworker
applicators Unexposed
agric. workers OP/* Carb
Y
Peiris-John (2002)
Cross-sectional
(N=30/30) Sri Lankan sprayers
Unexposed
fishermen OP*
Y
55

Neurobehavioural
studies
Study design/
sample size (n for
exposed/controls)
Exposed Group
Comparison Group
Ch
emic
al
Cogn
itiv
e
Psy
chom
oto
r
S
ym
pto
ms/
A
ffec
t
V
ibra
tion
sen
se/n
erve
Fu
nct
ion
Pilkington et al.,
(2001) Cross-sectional
(N=612/160) Sheep dippers
Farmers/ceramic
workers OP*
Y N
Proctor et al., (2006) Cohort: 4 years
(N=140) US Army Veterans
Low to no
exposure vetrns OP*
Y
Y
Reidy et al., (1992)
Cross-sectional
(N=21/11) US migrant farm wrks
Volunteer
cannery workers OP/** Carb Y Y Y
Rodnitzky et al.,
(1975) Cross-sectional
(N=23/23) US migrant farm wrks
Unexposed farmers
OP*
N
Rohlman et al., (2007)
Cross-sectional ( N=119/56)
US migrant farm wrks
Non-agric wrkers
OP*
Y
Roldan-Tapia et al.,
(2005)
Cross-sectional ( N=40/26)
Spanish Greenhouse
wrks
Unexposed
waiters and
cooks OP/Carb*
Y
Y
Y
Roldan-Tapia et al.,
(2006) Cross-sectional
(N=20/26)
Spanish Greenhouse
wrks Non-exposed
residents OP/** & *
Carb
Y
Y
Y
Rosenstock et al.,
(1991) Cross-sectional
(N=64/26) Farm workers
Matched
controls/friends OP**
Y
Y
Y
Rothlein et al., (2006)
Cross-sectional
(N=92/45) US migrant farm
wrks Non-agric.
workers OP*
Y
Y
Salvi et al., (2003)
Cohort: 3 mnths (N=37)
Brazilian
tobacco wrkrs
25 of initial 37
workers
followed up
OP*
Y
Savage et al., (1988)
Cohort: >10yrs
(N=100/100)
US pesticide
poisoned cases
Matched
cntrls/multiple
sources
OP**
Y
Y
Y
56

Neurobehavioural
studies
Study design/
sample size (n for
exposed/controls)
Exposed Group
Comparison Group
Ch
emic
al
Cogn
itiv
e
Psy
chom
oto
r
S
ym
pto
ms/
Aff
ect
V
ibra
tion
s
en
se/n
erve
F
un
ctio
n
Smit et al., (2003)
Cross-sectional
(N=216/44)
Sri Lankan Farmers
Control group of
fishermen Mult**
Y
Solomon et al., (2007)
Cross-sectional
(N=3735/6109)
UK sheep Dippers
Unexposed who
had never
worked with
pesticides
Mult*
Y
Srivastava et al.,
(2000)
Cross-sectional
(N=59/17)
Indian OP factory wrks
Unexposed tea
vendors, street
hawkers
OP*
Y
Y
Stallones & Beseler
(2002) Cross-sectional (N=761)
Farmers/ spouses
Farm residents
OP**
Y
Starks et al., (2012a,
2012b)
Cohort: (N=701)
AHS pesticide Applicators
AHS pesticide Applicators
OP* Carb
Y
Y
Steenland et al.,
(1994) Cross-sectional
(N=128/90) Pesticide registry
Matched
controls/friends OP**
Y
Y
Y
Y
Steenland et al.,
(2000) Cross-sectional
(N=191/189) Commercial
applicators Office workers
and friends OP*
N
Y
Y
N
Stephens et al., (1995)
Cross-sectional
(N=146/143) UK, Sheep Dippers
Unexposed
quarry wrkrs OP*
Y
Stephens &
Sreenivasan (2004) Cross-sectional
(N=37/31) UK, Orchard
sprayers Pig farmers and
construct wrkrs OP*
Y
Stokes et al., (1995)
Cohort: 3 - 9 mnths
(N=68/68 Apple orchard
applicators Unexposed
population OP*
Y
Y
Wesseling et al.,
(2002) Cross-sectional
(N=81/130) Costa Rica,
Farm wrkrs
Farm workers
OP,** Carb Y Y Y
Wesseling et al.,
(2010) Cross-sectional
(N=81/130) Costa Rica,
Farm wrkrs Non-poisoned
banana workers OP,** Carb
Y
57

Neurobehavioural
studies
Study design/
sample size (n for
exposed/controls)
Exposed Group
Comparison Group
Ch
emic
al
Cogn
itiv
e
Psy
chom
oto
r
Sym
pto
ms/
A
ffec
t
V
ibra
tion
s
en
se/n
erve
Fu
nct
ion
Yokoyama et al.,
(1998)
Cross-sectional
(N=18/15)
Japanese sarin-
exposed wrkrs
Non-poisoned controls
OP**
Y
N
Y
Zhang et al., (2009)
Cross-sectional
(N=4941/4218)
Chinese rural
residents
Storage of
pesticides in the
home and
suicide ideation
OP*
Y
58

Table 2.3 Number of neurobehavioural tests by domain and exposure level
Number of Exposure Positive
Functional Domain Test studies Acute# Long-term
# Association (%)
Working memory Digit Span Forward 21 2/6 7/15 9 (43)
Attention Digit Span Backward 15 4/6 6/9 10 (67)
Visual memory Benton Visual Retention 16 5/6 9/10 14 (88)
Psychomotor speed Digit Symbol 18 5/7 10/11 15 (83)
Symbol Digit 8 1/1 2/7 3 (38)
Fine motor control
(speed) Pursuit Aiming 8 3/3 5/5 8 (100)
Fine motor control
(dexterity) Santa Ana dominant hand 8 1/2 4/6 5 (63)
Santa Ana non-dominant hand 2 0/1 1/1 1 (50)
Mood and affect Brief Symptom Inventory 5 2/3 0/2 2 (40)
Q16 8 6/6 2/2 8 (100)
Symptoms* 33 6/6 19/27 25 (76)
Peripheral somatosensory Vibration sense 16 3/4 5/14 8 (50) *Studies using variations of symptom prevalence checklists excluding the Q16;
# Studies listed as the proportion of all studies
in an exposure group which showed a positive association between exposure and the domain outcome.
59

Table 2.3 shows that studies included symptom prevalence questionnaires more frequently
than any other test (n=33) to assess the relationship between long-term OP exposure and
neurobehavioural impairment. Tests of working memory and psychomotor speed are also
often selected to assess effects of OP exposure. Fine motor and dexterity tests (Pursuit
Aiming, Santa Ana Pegboard) are less often included in test batteries for reasons that include
difficulty in test administration and reliability of scoring (Anger et al., 1997). The following
section provides a discussion of the findings and limitations in studies that have used these
tests.
2.5 LIMITATIONS TO THE LITERATURE
The limitations discussed in the studies are summarized in this section. Several studies have
reported deficits in tests of cognitive function as a result of exposure to OP pesticides
(Bazylewicz-Walczak et al., 1999; Cole et al., 1997, 1998; Farahat et al., 2003; Stephens et
al., 1995). While some studies have reported impaired neurobehavioural function in certain
tests as a result of OP exposure, others using the same tests have not (Ames et al., 1995;
Fiedler et al., 1997). Furthermore, it is often the case that agricultural workers are exposed to
multiple pesticides making it difficult to identify specific agents causing neurobehavioural
impairment (Blanc-Lapierre et al., 2013). A review of the literature shows that both cross-
sectional and cohort studies are similar in terms of associations found between chronic OP
exposure and neurobehavioural deficits on some levels and differ from each other on other
levels. Both study designs have limitations with regard to exposure characterization, the
selection of comparison groups and controlling for known relevant confounders (Colosio et
al., 2003, 2009; Kamel & Hoppin, 2004; Mackenzie Ross et al., 2012; Rohlman et al., 2007).
Most cross-sectional and cohort studies report associations between long-term OP exposure
and increased symptom prevalence, attention, memory, visuo-spatial and psychomotor speed
deficits in the absence of an acute poisoning episode or very high exposure. Deficits between
fine motor control and long-term OP exposure are less frequently observed than the afore-
going domains but more frequently reported than decreased vibration sensitivity following
long-term OP exposure in the absence of an acute poisoning episode.
60

Of the cross-sectional studies surveyed 24 investigated symptom prevalence and found that
67% (n=16) reported significant associations between long-term OP exposure and increased
symptoms and 33% (n=8) reporting no association. Increased symptoms were reported in
cross-sectional and cohort studies investigating greenhouse workers, farmers, sheep dippers
commercial applicators and tobacco workers with sample sizes that ranged from 33
participants (Yokoyama et al., 1998) to 18 872 participants from the AHS cohort (Kamel et
al., 2005). Twenty-one studies also investigated cognitive effects following OP exposure and
71% (n=15) reported positive associations involving tests of attention, memory and visuo-
spatial function. Twenty-nine percent (n=6) reported no associations following long-term OP
exposure. Of these 43% reported significant associations as a result of acute exposure or
poisoning.
Fewer cohort studies have been conducted. Of the 17 studies examining associations between
neurobehavioural function and long-term OP exposure, most (n=15) reported significant
associations between exposure and neurobehavioural deficits. Occupational groups
investigated included greenhouse workers, vineyard workers, fruit farmers, pesticide
applicators, commercial applicators, poisoned individuals, army veterans and tobacco
workers. Four cohort studies investigated vibration sense in the absence of an acute episode
and three found a significant association between impaired vibration sense and long-term OP
exposure. In a cohort study by Albers et al., (2004) participants followed-up 12 months later
showed no associations between cognitive deficits and impaired vibration sense. However,
some study results are inconsistent for example, studies with short exposure duration
reported associations between OP exposure and cognitive deficits (Bazylewicz-Walczak et
al., 1999) while studies with longer exposure duration such as Cherry et al., (2012) who
reported exposure duration of approximately 7 years with a large sample size (n=2426 for 2
cohorts) found no association between prolonged exposure and increased symptoms.
Reasons for the varying results in studies investigating the neurobehavioural effects of OP
pesticides include differences in study design, exposure measurement, selection of exposed
and control groups, small sample size, the inclusion of age, education, gender, and other
61

confounders such as height, past diagnosed poisoning and previous head injury. Because of
the cost associated with cohort studies, there are more cross-sectional studies. Typically,
cross-sectional studies provide information about participants’ neurobehavioural function as
a result of past or current exposure at one point in time (Katzenellenbogen, Joubert & Abdool
Karim, 1997). Despite the cost of cohort or follow-up studies, more information about on-
going exposure is provided in this manner and more reliable associated neurobehavioural
effects can be determined over time.
Furthermore, not all cohort studies provide adequate exposure history (Bosma et al., 2000;
Starks et al., 2012a, 2012b). Questionnaires, occupational status or job title, biological
indicators (plasma and urine), years of agricultural work and job exposure matrices have
been used to estimate exposure. In addition, indirect exposure measures have also been used
to infer exposure such house dust, air pollution, skin or dermal exposure.
Impairment in psychomotor function has been reported as a result of exposure to OP
pesticides particularly the impairment of sensory input, motor output or associative delays in
Digit Symbol, Santa Ana Pegboard and Pursuit Aiming tests (Baldi et al., 2001). Studies
reporting significant associations between OP exposure and affective symptoms such as
depression, confusion and paranoia note that participants may have difficulty with cognitive
function (Delgado et al., 2004). Because of the subjective nature of symptoms, it remains
extremely difficult to measure the severity of symptoms that may be crippling such as
disturbances of memory, changes in concentration, fatigue, nausea, dizziness amongst others
(Beseler & Stallones, 2008; Jamal et al., 2002b; London et al., 1998; Steenland et al., 2000).
Affective symptoms are self-reported and as Beseler & Stallones (2008) noted, information
on psychiatric comorbidity, a history of depression and family history of comorbidity are not
always collected studies investigating the association between OP exposure and
neuropsychiatric illness (Beseler et al., 2006). Furthermore in some instances following
chronic exposure, symptoms may cease while others continue (Albers et al., 2004). Given
that participants have often experienced acute as well as chronic exposure studies often do
not distinguish between the two types of exposure (Kamel et al., 2005). This highlights the
importance of detailed and accurate exposure characterization when assessing the
62

relationship between long-term exposure and neurobehavioural effects in the absence of
acute poisoning or high dose exposure. Kamel et al., (2005) excluded individuals with past
pesticide poisoning and found that symptoms persisted. However, London et al., (1997) and
Ohayo-Mitoko et al., (2000) when distinguishing between those participants with and
without poisoning experience in their analyses concluded that acute and not chronic exposure
was related to increased symptoms.
The peripheral nervous system is complicated in terms of how motor and sensory fibers are
affected (Horowitz, 2002). Subjectivity enters the process when subjects are relied upon to
recognize and report symptoms experienced. Symptom recognition is also dependent on
alertness, sites of study and stimulation, and cooperation of the subject. The concern raised
by Salvi et al., (2003) was that two or more compounds were often used by these workers
which may result in interactions between the compounds and their metabolites and that
makes it difficult to identify specific effects. In addition, a concern expressed by Alavanja et
al., (2004) was that studies employing self-report exposure measures might have recall bias
as a confounder explaining increased symptom prevalence.
Exposure duration in the studies surveyed ranged from 3 months (Salvi et al., 2003) to more
than 20 years (London et al., 1997). While participants with longer duration of exposure
reported a wider range of deficits across cognitive, psychomotor, symptom and vibration
sensitivity (Savage et al., 1988), increased symptom prevalence and cognitive deficits were
the most common effects reported as a result of OP exposure. Four (n=4) of the few cross-
sectional studies investigating vibration sense in the absence of an acute episode (n=10)
found a significant association between impaired vibration sense and long-term OP exposure.
Using years of exposure as an exposure metric some studies have shown significant
associations between longer duration of exposure and deficits across a range of
neurobehavioural domains for example, Cole et al., (1997) reported significant associations
between 16 mean years of exposure and impaired neurobehavioural function on a number of
tests and Kamel et al., (2003) found that the greatest deficits in cognitive and psychomotor
functions were reported as long as 10 or more years of working. However Gomes et al.,
63

(1998) reported poorer neurobehavioural performance on two tests of aiming and
psychomotor speed (Digit Symbol) for farm workers exposed to OP pesticides for up to 2
years. This implies that neurobehavioural deficits may take time to develop and may only
manifest after many years of chronic exposure.
The limitations of the use of exposure proxies, such as years of work and self-reported
exposure information are subject to recall bias and potential exposure misclassification
(Rohlman et al., 2007). There are potential problems with selecting exposed participants
from poisoning surveillance systems that may not be representative of the specific
occupationally exposed population (Mackenzie Ross et al., 2012). Testers that are not
blinded to participants’ exposure status may unknowingly influence participants’
performance on neurobehavioural tests and questionnaires. It may also be difficult to detect
significant associations between exposure and neurobehavioural function when the study
sample size is small.
In terms of measuring the effects of exposure on symptom prevalence, concerns are often
noted about the subjective nature of symptoms where individuals self-select because of their
awareness of the potential effects of exposure on their health (London et al., 1998; Salvi et
al., 2003; Steenland et al., 2000). Matching exposed and comparison groups for age,
education, gender and other relevant covariates are vitally important. Even though practice
effects might minimise the effects of age between participants, studies have shown that
younger participants tend to perform significantly better than older participants on
neurobehavioural tests especially tests of psychomotor speed and fine motor control though
this may not be the case on tests of memory. The same holds true for education where
participants with higher levels of education invariably tend to outperform those with lower
education levels on neurobehavioural tests.
2.5.1 Summarising the literature
Two recent meta-analyses conducted by Ismail et al., (2012) and Mackenzie Ross et al.,
(2012) provided evidence for neurobehavioural deficits following long-term low-dose OP
64

pesticide exposure. The goal of the meta-analysis conducted by Ismail et al., (2012) was to
identify and quantify neurobehavioural deficits among pesticide applicators and agricultural
workers as exposure categories and investigated the potential covariates of neurobehavioural
deficits. The meta-analysis investigated the findings of 17 studies with 21 independent cohort
groups and reported on 16 neuropsychological tests with 23 different neurobehavioral
constructs. They found significant deficits for exposed participants in all tests of
neurobehavioural function that measured attention, visuo-motor integration, verbal
abstraction and perception constructs. They reported significantly larger mean deficits for
agricultural workers than for applicators on Digit Symbol (visual motor processing) and Trail
Making A (visual motor processing) tests at the p<0.05 level. The study showed a significant
association between neurobehavioural deficits and exposure duration, age and the percentage
of male participants in the studies. For example, increased duration of exposure was
significantly associated with measures of perception (Block design) and motor speed and
coordination (Finger Tapping non-preferred hand) at the p<0.05 significance level. The study
also showed that neurobehavioural deficits were smaller in older people than young people
which indicate that younger people may be more vulnerable to pesticide exposure than older
people. While noting that most of the participants in the studies were male, the results of the
meta-analysis also demonstrated that the percentage of males in studies significantly
moderated the effect of pesticide exposure for Block Design and Finger Tapping indicating
that female agricultural workers may be more vulnerable than male agricultural workers.
The results of the meta-analysis conducted Mackenzie et al., (2012) demonstrated a
significant association between 14 studies that investigated neurobehavioural function and
long-term low-dose OP exposure. Study populations investigated in the meta-analysis
included chemical factory workers, greenhouse workers, pest control applicators, sheep
dippers, fruit tree sprayers and crop sprayers. Participants in the studies differed in terms of
exposure duration (between 2 and 20 years) and type of OP pesticide exposure. Results of the
meta-analysis demonstrated a significant association between low-level exposure to OP
pesticides and neurobehavioral deficits in tests of psychomotor speed, visuo-spatial ability,
working, visual memory and executive function which were consistent and small to moderate
in magnitude. Furthermore, the results showed a significant association between low-level
65

OP exposure and greater deficits in tests of working and visual memory, attention,
psychomotor speed, visuo-spatial ability and executive function than in tests of general
knowledge and language. The results of the two meta-analyses demonstrate the sensitivity
and validity of the tests used in identifying neurobehavioural effects of OP pesticide
exposure.
Limitations cited in the meta-analyses include inconsistencies in the type of exposure
variables used in the studies, which range from categorical classification (agricultural
workers and applicators compared to control groups to more quantitative indices of exposure
level which include measurement of exposure across time; and that not all neurobehavioral
measures are used in all studies and cohorts. Exposure information providing adequate
information on dose, duration, frequency and intensity of exposure are seldom included in
studies (Mackenzie Ross et al., 2012). While biological monitoring is not useful in studies
that assess long-term OP pesticide exposure because of the speed in which the human body
metabolizes and eliminates toxins, not many studies include such monitoring. Furthermore,
individuals in different occupational contexts are often exposed to many different OP
compounds and are genetically different and their capacity to metabolize OP pesticides
which may complicate dose-response relationships. Other mediating factors cited in the
meta-analyses that complicate interpretation of study results include synergistic effects of
chemical combination where OP pesticides may only represent one of the chemicals.
The two meta-analyses are broadly consistent with the preceding review in this chapter. .
Reasons for the inconsistency in the findings from epidemiological studies investigating the
neurobehavioural effects of long-term low dose OP exposure include methodological
differences between studies, differences in study design and exposure characterization,
differences in occupational groups and small sample size. Of the 65 studies reviewed in this
chapter, 47 (72%) were cross-sectional while only 17 (26%) were cohort studies. Prospective
cohort studies are necessary to monitor the relationship between on-going exposure and
neurobehavioural effects over time but are cost and labour intensive resulting in more cross-
66

sectional studies having been conducted. Cross-sectional studies provide information about
neurobehavioural performance as a result of past OP exposure at a single time point.
Studies differed in terms of exposure characterization for example, in many studies exposure
is not clearly defined and proxies such as ‘agricultural worker’ or ‘farm worker’ and self-
report exposure information are gathered using questionnaires. This makes it difficult to
determine frequency, duration and dose-response relationships (Mackenzie Ross et al., 2012).
Duration of exposure also varied between studies from a few months (Daniell et al., 1992;
Salvi et al., 2003; Stokes et al., 1995) to decades and life time exposure (Kamel et al., 2005;
Savage et al., 1988; Starks et al., 2012a). The classification and selection of exposed and
control groups can also confound results especially where control groups may also have been
indirectly exposed. It is also often the case that study participants may be exposed to
pesticide mixtures in which case little or no information about specific pesticides is collected
(Ismail et al., 2012). Exposed groups should also be matched for important covariates such as
age, education and gender amongst others.
Most studies reported significant associations between long-term low dose OP exposure and
deficits in tests of working and visual memory, attention, psychomotor speed and mood and
affect which demonstrate the sensitivity and validity of these tests. In the majority of these
studies age and education were also strong predictors of neurobehavioural performance.
2.6 NEUROBEHAVIOURAL INSTRUMENTS USED IN THE STUDY
This section provides an overview of the neurobehavioural battery considered for use in this
study. The individual tests are described in more detail in Section 3.5.2 of the chapter on
methods (Chapter 3).
Neurobehavioural core tests
The WHO Neurobehavioural Core Test Battery (NCTB) (WHO, 1986) comprises 7 tests as
shown in Table 2.4 (Digit Symbol, Digit Span, Pursuit Aiming II, Benton Visual Retention
Test, Simple Reaction Time, Santa Ana Pegboard and the Profile of Mood States or POMS)
67

(Johnson, Baker & Batawi, 1987). These tests were recommended on the basis of having
displayed established sensitivity to neurotoxic chemicals. A subsequent battery was adapted
from 5 of the NCTB and developed for computer use, the Neurobehavioural Evaluation
System (NES) by Baker, Letz & Fidler (1985). The need for the evaluation and medical
surveillance of populations living near hazardous waste sites and using some tests from the
NCTB and NES resulted in the formulation of the Adult Environmental Neurobehavioural
Test Battery (AENTB) in the early 1990s.
Table 2.4 WHO Neurobehavioural Core Test Battery with functional domains
Source Functional domain Test
WHO (Johnson et
al., 1987)
Manual dexterity (rapid
eye-hand movements)
Santa Ana Pegboard
Perceptual motor speed/
associations
Digit symbol substitution
Visuo-spatial memory Benton Visual Retention
Test
Attention / short-term
auditory memory
Digit span
Motor speed Pursuit Aiming II
Motor speed Simple Reaction Time
Mood Profile of Mood States
(POMS)
The WHO NCTB is used in many developing countries because of the ease within which it is
administered. It requires only paper and pencils as equipment and is administered orally in
contrast to the NES which relies on electricity and the use of computers. Ironically, the fast
pace with which computer systems are currently being updated render older less complex
systems required to run NES tests almost obsolete and therefore difficult to obtain. This
notwithstanding, some concerns have been raised in terms of the specificity and sensitivity of
the WHO NCTB tests. These tests have been standardized in western countries on western
populations (Chung et al., 2003).
68

Earlier studies were conducted mainly in the United States of America and Nicaragua in the
1990s among male and female respondents between the ages of 16 and 65 to determine the
cross-cultural and language feasibility among different groups and to develop baseline data
(Anger et al, 1997). Educational level and demographic context (urban, rural) emerged as
important considerations for some of the WHO NCTB sub-tests such as the results of the
Santa Ana Pegboard test in Nicaragua where performance on this test was much lower than
results from other countries due to the low level of number of years of education among rural
Nicaraguan respondents. Cole et al., (1997) found for example that scores on the Digit
Symbol Substitution test decline with decreasing levels of education and increasing age.
Decreased scores were also reported on spatial and attention tests for older respondents with
lower education levels.
While the tests were developed and standardised in Western countries they have been
administered with success in indigenous populations with low education levels (Colvin et al.,
1993; Myers et al., 1999; London et al, 1997). In addition pilot studies conducted in
Groblersdal, Mpumalanga in 2005 (London et al., 2005) and in Piketberg and Worcester in
2008 (Major, 2010) confirmed that it was possible to translate and apply the
Neurobehavioural Core Test Battery to indigenous populations in South Africa.
2.7 EMERGING FARMERS IN SOUTH AFRICA
2.7.1 Agrichemical use in South Africa
The South African economy relies strongly on agriculture in terms of provision of food,
labour as well as contributing to the Gross Domestic Product. Eight percent of South Africa’s
total exports is contributed by the agricultural sector (Quinn et al., 2011). According to
Statistics South Africa (2007), the formal agricultural sector generated a gross farming
income of R79.6 million in 2007, of which field crops contributed 21%. Compared to 1993
income from field crops and horticultural products increased by 32% from R39 million in
1993 to R53 million in 2002 (Liebenberg, 2010) and by 49% in 2007 to R79.6 million. The
69

agricultural sector has experienced a decline in terms of its contribution to South Africa’s
GDP since 2005 and employs in excess of one million farm workers (Liebenberg, 2010).
Prior to 1994, the agricultural sector had been divided into large-scale white commercial
farmers and resource-poor, subsistence black farmers. Legislation such as the Natives Land
Act No. 27 of 1913, the Group Areas Act No. 41 of 1950 and the Conservation of
Agricultural Resources, Act No. 43 of 1983 sought to deny the majority of South Africans
from owning and working land for subsistence and economic gain. The Abolition of Racially
Based Land Measures Act No. 108, passed in 1991, effectively repealed all discriminatory
legislation in terms of land access and ownership and opened the way for land claims
redistribution and restitution processes and the passing of the Broad based Black Economic
Empowerment Act 53 of 2003. These pieces of legislation set the stage for effective redress
of past inequity and the expansion of black ownership in agriculture (National Department of
Land Affairs (NDLA), 1997). The new political dispensation in 1994 sought to bring about
change in the agricultural sector by providing support to small-scale or emerging black
farmers.
South African emergent farmers are defined as small-scale predominantly black farmers who
are economically disadvantaged compared to white commercial farmers (Integrated Growth
and Development Plan, Department of Agriculture, Forestry and Fisheries, 2012; Rother,
Hall & London, 2008). Emerging farmers received assistance from the government’s land
restitution policies and have been encouraged to enter commercial farming which may result
in increased pesticide use. The South African government designed programs to eliminate
inequity and to facilitate farmer support and development by assisting small farmers by
providing assistance in the form of projects that provide access to credit, technical training,
advisory services, post-settlement support and drought assistance schemes. Many of these
emergent farmers had previously been employed as labourers on deciduous fruit, citrus and
grape farms where pesticide use has generally been high. As emerging farmers it is likely that
their knowledge of the effects of pesticides is inadequate (London et al., 1997; Rother et al.,
70

2008) and combined with low literacy levels and high alcohol use, there is concern for the
health and safety of this group of farmers.
The South African agricultural sector is the largest pesticide user in sub-Saharan Africa
(Dalvie, Africa & London, 2009; London, 2003) and a smaller proportion of pesticides is
used for malaria control and to control domestic pests. Over 500 pesticides are currently
registered in South Africa Pesticide Action Network (PAN), (2010). An audit conducted by
London & Myers, (1995a &1995b) based on 1989 data reported the use of pesticides for crop
protection to be in the region of 7400 x 103 kg for the Western Cape and Eastern Cape
province up to East London. A fourfold increase in pesticide expenditure between 1985 and
1998 from over ZAR 320 million to ZAR 1,400 million (USD 192 million) bears testimony
to the high use of pesticides in South Africa (London, 2003). The average intensity of
insecticide use in terms of active ingredients (a.i.) per kilogram for every 1000 USD per crop
output for South Africa is nearly 2kg a.i. per 1000 USD compared to less than 1kg a.i. per
1000 USD for Argentina and Venezuela (Schreinemachers & Tipraqsa, 2012). Table 2.5
shows a report detailing pesticide sales in kilograms per litre shows that over 4,450 000 kg of
OP pesticides sold in South Africa in 2006 with the biggest user being table and wine grape
producers (Statistics South Africa, 2007).
Emerging farmers in South Africa are encouraged to enter the commercial agricultural
market and as a result, may be pressurized towards increased pesticide use. The global
increase in pesticide use is cause for concern both in the developed as well as in rural
developing settings where farm workers may be at a disadvantage in terms of lack of
knowledge about their own safety as well as lack of knowledge about pesticides when used
to protect their crops. It is precisely in this area that test measures become relevant. Although
emerging farmers from rural areas in developing countries cannot a priori be assumed to be
educationally lagging behind their counterparts in rural developed countries, research has
shown that farm workers generally report low levels of years in education (<7 years) in
developing countries (Colvin et al., 1993; London et al., 1997; Major, 2010) and in
developed countries (Cole et al., 1997; Smit et al., 2003). Familiarity with the classroom
71

context where paying attention, ability to use a pencil and following test instructions are
important considerations when conducting neurobehavioural tests among farm populations
who may have low education levels (Nell, 2000). Discrepancies in levels of education
between exposed workers and controls could result in differences in the test performance of
the groups. Previous research in South Africa has shown that low education levels among
farm workers can affect their performance on neurobehavioural test batteries (Colvin et al.,
1993; London et al., 1997; Myers et al., 1999). Emerging farmers can be expected to have
low education levels since many of these farmers were previously farm workers on existing
farms and given that neurobehavioural tests are so sensitive to the effects of formal
education, the effect of education as a powerful confounder for tests of attention,
psychomotor speed and fine motor control and must be controlled for in neurobehavioural
testing of emerging farmers.
2.7.2 OP pesticide exposure and emerging farmers
The South African government committed in 2009 to transfer 30 percent of 82-million
hectares of agricultural land (i.e. 24.5million hectares) to black people by 2014 as part of its
land restitution programme. Despite this goal, by 2012 the Integrated Development Plan of
the National Department of Agriculture, Forestry & Fisheries (DAFF) acknowledged that the
South African government has failed to meet its land restitution targets (DAFF, 2012).
Specific concern has been expressed about the neurologic and neuropsychological effects of
OP pesticides on agricultural communities in developed and developing countries especially
in rural settings. South African emerging farmers are particularly at risk for pesticide
exposure given the demands to enter the commercial agricultural market and the high usage
of pesticides in SA agriculture, as shown above.
72

Table 2.5 Annual organophosphate pesticide sales as at 2007
Crop description OP sales Planted
in kg or litre (%) hectares
Deciduous fruit 872 051.22 (20%) 80 510
Grapes (Table and wine) 1,800 497.50 (40%) 111 325
Citrus 1,383 976.80 (31%) 66 430
Vegetables 396 345.76 (9%) 118 275
Other crops (Flowers, cotton etc.) * 54 425
Any combination 1,113 217.80** 86 193
Total 4,452 871.20 430 965
Source: Census of commercial agriculture, Report No. 11-02-01 (2007), Statistics South Africa.
* No Pesticide sales figures available for Other crops and Any combination of crops
** OP sales figure for Any comb is an average of Deciduous fruit, Grapes, Citrus and Vegetables
Additionally, those farmers who have been beneficiaries of land restitution have received
ineffective support and remain under-resourced in terms of pesticide knowledge, the use of
personal protective equipment and integrated pesticide management practices (Rother &
London, 1998). To compound the problem, marketing of chemicals in South Africa is as yet
inadequately supported by technical programs (Rother, 2000).
2.8 MONITORING PESTICIDE POISONING
As the need to enter the commercial markets grows, developing countries are under
increasing pressure to use more pesticides to protect their crops. This could result in
increased use of agricultural as well as non-agricultural pesticides in countries such as South
Africa (Rother et al., 2008). Despite the fact that pesticide poisoning is a notifiable condition
in South Africa, inadequate legislation and inaccurate records of pesticide poisoning impede
monitoring and surveillance (London & Bailie, 1998; London & Rother, 2000) especially in
rural contexts of developing countries (Murray et al., 2002; Wesseling et al., 2002).
Surveillance and monitoring of pesticide poisoning falls within in the ambit of the
Department of Environmental Health which in turn, is subject to the Department of Health.
The Department of Health (DOH) assumes responsibility for the overall monitoring and
73

evaluation of the Environmental Health Services. There are 7 pieces of legislation that
govern the use and marketing of pesticides in this country. Relevant legislation is fragmented
and spread across 7 ministries (Agriculture, Forestry and Fisheries, Health, Labour, Water
Affairs, Environmental Affairs, Trade and Industry, Transport) affecting monitoring
compliance among pesticide companies and farmers and farm workers. Poor implementation
of health and safety legislation is a further result of the lack of a coherent legislative and
policy framework (Naidoo et al. 2008; Rother et al. 2008). This is further exacerbated by
inadequate surveillance strategies in health facilities which result in inaccurate pesticide
poisoning estimates (London & Bailie, 2001).
Recently, an algorithm was developed to enable healthcare professionals to improve the
diagnosis and notification of pesticide poisoning health care professionals at a local
children’s hospital in Cape Town. A review of records of 80 suspected pesticide poisoning
cases admitted between 2004 and 2006 at the local children’s hospital in Cape Town
demonstrated a link between pesticides bought on the streets of Cape Town and suspected
poisoning (Rother, 2012).
2.8.1 Intervention strategies to reduce acute poisoning
The reporting of pesticide poisoning presents its own problems especially in developing
countries where it is suspected that a sizable proportion of poisonings (between 80 and 95%)
are not reported (London & Bailie, 1998, 2001). Victims of poisoning fall in any one or more
of three possible categories: self-poisoning, occupational and accidental poisoning and
homicide. Thus the need for intervention strategies to address these specific areas is crucial.
Hierarchies have been identified that include devising high and most effective, to low and
least effective strategies that can be used to reduce exposure to the population (Cole et al.,
2002; Hruska & Corriols, 2002; London et al., 1997; Murray & Taylor, 2000; Murray et al.,
2002; Smit et al., 2003; Wesseling et al., 2002). Those controls noted as most effective by
these authors begin with the elimination of the most toxic compounds. This has been shown
to be effective in reducing hospital poisoning admissions in one district in Sri Lanka where
Eddleston and colleagues assessed the effects a ban on the sale of two highly class II toxicity
74

OP pesticides (dimethoate and fenthion) and reported a 43% reduction in such hospital
poisoning admissions (Eddleston et al., 2012). Other safer treatments include substituting
highly toxic pesticides with equally effective but less toxic alternatives, the use of crop
rotation, labeling products appropriately for users with low education levels (Rother, 2008)
and training applicators in safer handling practices, promoting the use of personal protective
equipment and isolating people from such toxic substances.
Other strategies are those that include the modification of equipment such as adjusting the
spray nozzles and formulations in an attempt to reduce use and direct exposure (Cole et al.,
2002). Locking pesticides in storerooms or storage cabinets and labeling and training of
applicators are attempts to limit the problem and reduce individual exposure but do not
reduce potential exposure by eliminating and substituting such harmful chemicals.
Changes in farming practices that employ the use of ecological approaches such as Integrated
Pest Management (IPM) that encourage the conservation of natural enemies (e.g. parasitism
and predation) to assist in pest management are widely accepted and implemented as newer
more cost effective methods of pest control. IPM methods encourage the use of fewer
pesticide applications, the use of pesticides that have low acute toxicity and low chronic
toxicity and have safe packaging and an easy method of application (Damalas &
Eleftherohorinos, 2011; Konradsen et al., 2003; Murray & Taylor, 2000). The decreased
applications of toxic pesticides are carefully monitored and use is made of alternative
physical and biological control methods which could reduce health and environmental risks
to farmers (Cole et al., 2002; Hruska & Corriols, 2002; Mancini, Jiggins & O’Malley, 2009;
Smit et al., 2003). Cole et al., (2007) reported improved performance on neurobehavioural
tests and reduced skin exposure among Andean farmers as a result of IPM training. The
positive impact on farmers in Bangladesh following the introduction of Farmer field schools
in the 1990s to train farmers in the effective use of IPM practices have been reported
(Rahman, 2009; Rahman, 2013). IPM treatments encourage alternating toxic with organic
biopesticides and result in higher crop yields which are more cost effective (Reddy, 2011).
75

Pesticide restriction programs and Minimum Pesticide Lists with an identified and restricted
number of less toxic pesticides are suggested for specific tasks within an IPM system are
medium and long-term measures that are cost-effective and may be safer in terms of public
health (Eddleston et al., 2002; Murray et al., 2002).The training of emerging farmers and
extension officers should incorporate educating emerging farmers and extension officers
about observing relevant re-entry time limits since re-entry into previously sprayed vineyards
and orchard sections may well be an overlooked route of exposure especially for emerging
farmers not involved with pesticide application who may not consider themselves to be at
risk (Ciesielski, Loomis, Rupp Mims & Auer, 1994). Closed-circuit loading systems used in
crop dusting have also proven to be more hazardous than expected. A study of Nicaraguan
crop duster pilots who were not adequately trained on the safe use of closed circuit systems
were found to have higher exposure than those not using these systems (Hruska et al., 2002;
McConnell et al., 1992).
2.8.2 Pesticide Regulation
Pesticides are necessary to control pests and sustain food supply and pesticide regulation
should balance the risks to human and environmental health. In South Africa for example,
though fragmented, a substantial corpus of legislation, regulations and policies exist for the
protection of humans and the environment against pesticide poisoning (London & Rother,
2000).
Many areas of pesticide use are subsumed within a regulatory framework such as import and
export practices as well as formulation of pesticides and its use in South Africa. Under
review presently is the Fertilizer, Farm Feeds and Agricultural Remedies Act 36 of 1947
which controls registration of pesticides, pesticide labeling and the efficacy of pesticides.
The Occupational Health and Safety Act (OHSA) of 1993 (No. 85 of 1993) focuses on the
safety of workers in the workplace and the act on Hazardous Chemical Substances
Regulation of 1995 in terms of the OHSA confirms workers’ right-to-know, their rights to
training and the role of biological monitoring and risk assessment for the prevention of
adverse effects on workers’ health from pesticides.
76

Notwithstanding existing legislation, standards and codes that are in place to guide the use of
pesticides, the absence of a regulatory body that could oversee pesticides use and control
hampers effective monitoring and surveillance. Legislation that impacts upon the use and
distribution of pesticides in South Africa is spread across the departments of Agriculture,
Forestry and Fisheries, Water Affairs, Environmental Affairs, Trade and Industry, Labour
and Transport (Naidoo, 2010; Rother, 2005; Rother & London, 1998). The fragmentation of
relevant legislation hampers the effective monitoring of safe pesticide use and compliance
with Occupational Health and Safety requirements among pesticide companies and end users.
This is further exacerbated by inadequate surveillance strategies in health facilities and health
care professionals who are not trained in the accurate identifying of poisoning symptoms that
further add to inaccurate pesticide poisoning estimates (London & Bailie, 2001; London,
2011). The European parliament is currently developing community-wide standards for the
adoption of IPM methods that will be mandatory in farming in Europe from 2014 and South
African farmers exporting to markets in the European Union would be subject to these
standards (Hillocks, 2012).
The Association of Veterinary and Crop Associations of South Africa (AVCASA) is a rather
weak form of self-regulatory umbrella Association representing South African Animal
Health Association (SAAHA), Croplife SA and Agricultural Chemical Distribution
Association of South Africa (ACDASA) as affiliates. The Chemical and Allied Industries'
Association (CAIA) is another South African organization that represents pesticide
companies in terms of public concerns about the manufacture, storage, transport, use and the
disposal of chemicals. Responsible use and Responsible Care are two of the requirements for
membership with these organizations. However, what is conspicuously absent is the
participation of all sectors of the farming community especially small-scale emerging
farmers. Internationally, the Director of the Food and Agriculture Organization of the United
Nations (1990) noted in the International Code of Conduct on the Distribution and Use of
Pesticides that the pesticide industry should bear some of the responsibility in terms of the
safe use and distribution among countries importing pesticides (Eddleston et al.,
2002).Whether this injunction is observed by pesticide manufacturers and distributors in
developing countries remains debatable (Murray, 1994; Murray & Taylor, 2000).
77

2.9 Conclusion
This chapter has shown evidence that chronic neurobehavioural effects may follow long-term
OP exposure. This was most evident in studies investigating mood and affect (symptom
prevalence) following long-term OP exposure. This pattern is not always consistent since
some studies have reported no positive associations between long-term OP exposure and
impaired neurobehavioural function. Furthermore, OPs are often not specified, or may differ
between studies as do exposure patterns which are always unknown. Tests most often
selected to assess neurobehavioural effects of long-term OP exposure include tests of
working memory, attention, visual memory and psychomotor speed. These tests were often
included in different combinations for example; some studies included Digit Span and not
Digit Symbol while others would include Digit Symbol and Benton Visual Retention and not
Digit Span Backward.
Most studies showed significant neurobehavioural impairment in exposed groups compared
to unexposed control groups following long-term OP exposure. However, methodological
differences between studies make it difficult to draw firm conclusions for example;
occupational groups studied included farm workers, green house workers, commercial
pesticide applicators, banana plantation workers, sheep dippers and tobacco workers where
exposed groups were compared to unexposed population-based control groups. Exposure
measures differed between studies where exposure was self-reported measures using
questionnaires while others reported using job exposure matrices and biological markers.
Furthermore, some studies were cross-sectional while others were prospective cohort studies.
Differences also included control groups that were younger than exposure groups and control
groups that were more educated than exposed groups in some studies making comparison
problematic.
There is a need for more prospective cohort studies with longer follow-up periods to
investigate the long-term neurobehavioural effects OP exposure. Emerging farmers in South
Africa are a poorly resourced cohort within the agricultural sector. They have limited
pesticide knowledge and low education levels and in the absence of adequate pesticide
78

regulation, monitoring and surveillance, they are vulnerable to the effects of on-going OP
pesticide exposure.
79

2.10 REFERENCES
Abdel Rasoul, G. M., Abou Salem, M. E., Mechael, A. A., Hendy, O. M., Rohlman, D. S. &
Ismail, A. A. (2008). Effects of occupational pesticide exposure on children applying
pesticides. Neurotoxicology, 29, 833-838.
Alavanja, M. J., Hoppin, J. A. & Kamel, F. (2004). Health effects of chronic pesticide
exposure: cancer and neurotoxicity. Annual Review of Public Health, 25, 155-197.
Albers, J. W., Garabrant, D. H., Schweitzer, S. J., Garrison, R. P., Richardson, R. J. & Berent,
S. (2004). The effects of occupational exposure to chlorpyrifos on the peripheral nervous
system: a prospective cohort study. Occupational and Environmental Medicine, 61, 201-
211.
Ames, R. G., Steenland, K., Jenkins, B., Chrislip, D. & Russo, J. (1995). Chronic neurologic
sequelae to cholinesterase inhibition among agricultural pesticide applicators. Archives of
Environmental Health, 50(6), 440-444.
Amr, M. M., Halim, Z. S. & Moussa, S. S. (1997). Psychiatric disorders among
Egyptian pesticide applicators and formulators. Environmental Research, 73, 193-199.
Anger, W. K., Sizemore, O. J., Grossmann, S., Glasser, J., Letz, R. & Bowler, R. (1997).
Human neurobehavioral research methods: impact of subject variables. Environmental
Research, 73, 18-41.
Anger, W. K. (2003).Neurobehavioural tests and systems to assess neurotoxic exposures in the
workplace and community. Occupational and Environmental Medicine, 60, 531-538.
Anger, W. K., Liang, Y. X., Nell, V., Kang, S. K., Cole, D., Bazylewicz-Walczak, B. (2000).
Lessons learned – 15 years of the WHO-NCTB: a review. Neurotoxicology, 21, 837-846.
80

Baker, E. L., Letz, R. & Fidler, A. (1985). A computer administered neurobehavioral
evaluation system for occupational and environmental epidemiology. Rationale,
methodology, and pilot study results. Journal of Occupational & Environmental Medicine,
27, 206-212.
Balali-Mood, M. & Saber, H. R. (2012). Recent advances in the treatment of
organophosphorous poisonings. Iranian Journal of Medical Science, 37(2), 74-91.
Baldi, I., Filleul, L., Mohammed-Brahim, B., Fabrigoule, C., Dartiques, J. F., Schwall, …
Brochard, P. (2001). Neuropsychologic effects of long-term exposure to pesticides: results
from the French Phytoner study. Environmental Health Perspectives, 109(8), 839-844.
Baldi, I., Gruber, A., Rondeau, V., Lebailly, P., Brochard, P. & Fabrigoule, C. (2011).
Neurobehavioral effects of long-term exposure to pesticides: results from the 4-year follow-
up of the PHYTONER Study. Occupational & Environmental Medicine, 68, 108-115.
Bazylewicz-Walczak, B., Majczakowa, W., Szymczak, M. (1999). Behavioral effects of
occupational exposure to organophosphorous pesticides in female greenhouse planting
workers. Neurotoxicology, 20, 819-826.
Beseler, C., Stallones, L., Hoppin, J. A., Alavanja, M. C., Blair, A., Keefe, T. & Kamel, F.
(2006). Depression and pesticide exposures in female spouses of licensed pesticide
applicators in the Agricultural Health Study cohort. Journal of Occupational and
Environmental Medicine, 48, 1005-1013.
Beseler, C. & Stallones, L. (2008). A cohort study of pesticide poisoning and depression in
Colorado farm residents. Annals of epidemiology, 18(10), 768-774.
81

Blanc-Lapierre, A., Bouvier, G., Gruber, A., Leffondré, K., Lebailly, P.,
Fabrigoule, C. & Baldi, I. (2013).Cognitive Disorders and Occupational Exposure to
Organophosphates: Results from the PHYTONER Study. American Journal of
Epidemiology, Retrieved April 5, 2013, from Web site: http://aje.oxfordjournals.org.
Bouchard, M. F., Chevrier, J., Harley, K. G., Kogut, K., Vedar, M., Calderon, N., … Eskenazi,
B. (2011). Prenatal exposure to organophosphate pesticides and IQ in 7-year-old children.
Environmental Health Perspectives, 119, 1189-1195.
Bosma, H., van Boxtel, M. P. J., Ponds, R. W. H. M., Houx, P. J. & Jolles, J. (2000). Pesticide
exposure and risk of mild cognitive dysfunction. The Lancet, 356, 912-913.
Bowler, R., Gysens, S., Diamond, E., Booty, A., Hartney, C. & Roels, H. A. (2003).
Neuropsychological sequelae of exposure to welding fumes in a group of occupationally
exposed men. International Journal of Hygiene and Environmental Health, 206, 517-529.
Bradman, A., Whitaker, D., Quiros, L., Castorina, R., Claus Henn, B., Nishioka, M. …Morgan
Eskenazi, B. (2007). Pesticides and their metabolites in the homes and urine of farmworker
children living in the Salinas Valley, CA. Journal of Exposure Science and Environmental
Epidemiology, 17, 331-349.
Brown, M. A. & Brix, K. A. (1998). Review of health consequences from high-, intermediate-
and low-level exposure to organophosphorus nerve agents. Journal of Applied Toxicology,
18, 393-408.
Cherry, N., Burstyn, J., Beach, J. & Senthilselvan, A. (2012). Mental health in Alberta grain
farmers using pesticides over many years. Occupational Medicine, 62, 400-406.
Chaudhry, R., Lall, S. B., Mishra, B. & Dhawan, B. (1998). A foodborne outbreak of
organophosphate poisoning. British Medical Journal, 317(7153), 268-269.
82

Chung, J., Sakong, J., Kang, P., Kim, C., Lee, K., Jeon, M., … Won, K. (2003). Cross-cultural
comparison of neurobehavioural performance in Asian workers. Neurotoxicology, 24(4-5),
533-540.
Ciesielski, S., Loomis, D. P., Rupp Mims, S. & Auer, A. (1994). Pesticide exposures,
cholinesterase depression, and symptoms among North Carolina migrant farmworkers.
American Journal of Public Health, 84(3), 446-451.
Cole, D. C., Carpio, F., Julian, J., Leon, N., Carbotte, R. & De Almeida, H. (1997).
Neurobehavioral outcomes among farm and nonfarm rural Ecuadorians. Neurotoxicology and
Teratology, 19(4), 277-286.
Cole, D. C, Carpio, F., Julian, J. & Léon, N. (1998). Assessment of peripheral nerve function
in an Ecuadorian rural population exposed to pesticides. Journal of Toxicology &
Environmental Health A, 55(2), 77-91.
Cole, D. C., Sherwood, S., Crissman, C., Barrera, V. & Espinosa, P. (2002). Pesticides and
health in highland Ecuadorian potato production: assessing impacts and developing
responses. International Journal of Occupational and Environmental Health, 8, 182-190.
Cole, D. C., Sherwood, S., Paredes, M., Sanin, L. H., Crissman, C., Espinosa, P. &
Muños, F. (2007). Reducing pesticide neurotoxic effects in farm households. International
Journal of Occupational & Environmental Health, 13, 281-289.
Colosio, C., Tiramani, M. & Maroni, M. (2003). Neurobehavioural effects of pesticides: State
of the Art. Neurotoxicology, 24, 577-591.
Colosio, C., Tiramani, M., Brambilla, G., Colombi, A. & Moretto, A. (2009).
Neurobehavioural effects of pesticides with special focus on organophosphorus compounds:
Which is the real size of the problem? Neurotoxicology, 30, 1155-1161.
83

Colvin, M., Myers, J. E., Nell, V. N., Rees, D. & Cronje, R. (1993). A cross-sectional survey of
neurobehavioral effects of chronic solvent exposure on workers in a paint manufacturing
plant. Environmental Research, 63, 122-132.
Coronado, G. D., Thompson, B., Strong, L., Griffith, W. C. & Islas, I. (2004). Agricultural
task and exposure to organophosphate pesticides among farmworkers. Environmental Health
Perspectives, 112, 142-147.
COT Report. (1999). Committee on Toxicity of Chemicals in Food, Consumer Products and
the Environment (Department of Health). Organophosphates. Crown Copyright. Retrieved
August 21, 2013, from Web site: http://cot.food.gov.uk/pdfs/opchap.pdf
Costa, L. G. (2006). Current issues in organophosphate toxicology. Clinica Chimica Acta, 366,
1-13.
Curl, C. L., Fenske, R. A. & Elgethun, K. (2003). Organophosphorous pesticide exposure of
urban and suburban preschool children with organic and conventional diets. Environmental
Health Perspectives, 111, 377-382.
Dalvie, M. A., Africa, A. & London, L. (2009). Change in the quantity and acute toxicity of
pesticides sold in South African crop sectors, 1994-1999. Environment International, 35,
683-687.
Dalvie, M. A., Cairncross, E., Solomon, A. & London, L. (2003). Contamination of rural
surface and ground water by endosulfan in farming areas of the Western Cape, South Africa.
Environmental Health, 2(1), 1.
Dalvie, M. A., Myers, J. E., Thompson, M. L., Robins, T. G. & Dyer, S. (2004). The hormonal
effects of long term DDT exposure on malaria vector control workers in Limpopo Province,
South Africa. Environmental Research, 96(1), 9-19.
84
http://www.ncbi.nlm.nih.gov/pubmed?term=Cairncross%20E%5BAuthor%5D&cauthor=true&cauthor_uid=22771522

Dalvie, M. A. & London, L. (2012, March). Neurotoxic effects of pesticide exposure
amongst women from the rural Western Cape of South Africa. Paper presented at the 12th
International Symposium on neurobehavioral methods & effects in occupational &
environmental health, Cape Town, South Africa.
Damalas, C. A. & Eleftherohorinos, I. G. (2011). Pesticide exposure, safety issues, and risk
assessment indicators. International Journal of Environmental Research and Public Health,
8, 1402-1419.
Daniell, W., Barnhart, S., Demers, P., Costa, L. G., Eaton, D. L., Miller, M. & Rosenstock, L.
(1992). Environmental Research, 59(1), 217-228.
Delgado, E., McConnell, R., Miranda, J., Keifer, M., Lundberg, I., Partanen, T. &
Wesseling, C. (2004). A two-year follow-up of central nervous system effects of
acute organophosphate poisoning. Scandinavian Journal of Work, Environment &
Health, 30, 362-370.
Department of Agriculture, Forestry and Fisheries (DAFF). (2012). Integrated
Growth and Development Plan, Department of Agriculture, Forestry & Fisheries.
Pretoria, South Africa.
Department of Labour. Regulations for Hazardous Chemical Substances Occupational
Health and Safety Act (Act No. 85 of 1993). Pretoria.
Eddleston, M., Adhikari, S., Egodage, S., Ranganath, H., Mohamed, F., Manuweera, G., …
Buckley, N. A. (2012). Effects of a provincial ban of two toxic organophosphorus
insecticides on pesticide poisoning hospital admissions. Clinical Toxicology, 50, 202-209.
Eddleston, M., Karalliedde, L., Buckley, N., Fernando, R., Hutchinson, G., Isbister, G., …
Smit, L. (2002). Pesticide poisoning in the developing world – a minimum pesticide list.
Lancet, 12, 1163-1167.
85

Engel, L.S., Keifer, M.C., Checkoway, H., Robinson, L.R. & Vaughan, T.L. (1998).
Neurophysiological function in farm workers exposed to organophosphate pesticides.
Archives of Environmental Health, 53(1), 7-14.
English, R. G., Perry, M., Lee, M. M, Hoffman, E., Delport, S. & Dalvie, M. A.
(2012). Farm residence and reproductive health among boys in rural South Africa.
Environment International, 47, 73-79.
Eskenazi, B., Harley. K., Bradman, A., Weltzien, E., Jewell, N. P., Barr, D., B., …
Holland, N. T. (2004). Association of in utero organophosphate pesticide exposure and fetal
growth and length of gestation in an agricultural population. Environmental Health
Perspectives, 112, 1116-1124.
Eskenazi, B., Marks, A. R., Bradman, A., Harley, K., Barr, D. B., Johnson, C,, Morga. N. &
Jewell, N. P. (2007). Organophosphate pesticide.exposure and neurodevelopment in young
Mexican-American children. Environmental Health Perspectives, 115, 792-798.
Farahat, T. M., Abdelrasoul, G. M. & Amr, M. M., Shebl, M. M., Farahat, F. M. & Anger, W.
K. (2003). Neurobehavioral effects among workers occupationally exposed to
Organophosphate pesticides. Occupational Environmental Medicine, 60, 279-286.
Fiedler, N., Kiepen, H., Kelly-McNeil, K. & Fenske, R. (1997). Long-term use of
organophosphates and neuropsychological performance. American Journal of Industrial
Medicine, 32, 487-496.
Gerr, F. E., Hershman, D. & Letz, R. (1990). Vibrotactile threshold measurement
for detecting neurotoxicity: reliability and determination of age and height
standardized normative values. Archives of Environmental Health, 45, 148-154.
86

Gomes, J., Lloyd, O., Revitt, M. D. & Basha, M. (1998). Morbidity among farm workers in a
desert country in relation to long-term exposure to pesticides. Scandinavian Journal of Work,
Environment and Health, 24(3), 213-219.
Grandjean, P., Harari, R., Barr, D. B. & Debes, F. (2006). Pesticide exposure and stunting as
independent predictors of neurobehavioral deficits in Ecuadorian school children. Pediatrics,
117(3), 546-556.
Gunnell, D. & Eddleston, M. (2003). Suicide by intentional ingestion of pesticides: a
continuing tragedy in developing countries. International Journal of Epidemiology, 32, 902-
909.
Harari, R., Julvez, J., Murata, K., Barr, D., Bellinger, D. C., Debes, F. …Grandjean, P. (2010).
Neurobehavioral deficits and increased blood pressure in school-age children prenatally
exposed to pesticides. Environmental Health Perspectives, 118, 890-896.
Hillocks, R. J. (2012). Farming with fewer pesticides: EU pesticide review and resulting
challenges for UK agriculture. Crop Protection, 31, 85-93.
Hines, C. Deddens, J. Tucker, S. & Hornung, R. (2001). Distributions and determinants of pre-
emergent herbicide exposures among custom applicators. Annals of Occupational Hygiene,
45, 227-239.
Hoppin, J. A., Umbach, D. M., London, S. J., Henneberger, P. K., Kullman, G. J., Coble, J., …
Sandler, D. P. (2009). Pesticide use and adult onset asthma among male farmers in the
Agricultural Health Study. European Respiratory Journal, 34, 1296-1303.
Horowitz, S. H. (2002). Criteria for the diagnosis of peripheral neuropathies. Editorial.
Diagnosis. Is there a “gold standard”. Occupational and Environmental Medicine, 59, 425-
426.
87

Horowitz, S. H., Stark, A., Marshall, E. & Mauer, M. P. (1999). A Multi-Modality Assessment
of peripheral nerve function in organophosphate-pesticide applicators. Journal of
Occupational & Environmental Medicine, 41(5), 405-408.
Hruska, A. J. & Corriols, M. (2002). The impact of training in Integrated
Pest Management among Nicaraguan maize farmers: Increased net returns and reduced
health risk. International Journal of Occupational and Environmental Health, 8,191-200.
Ihrig, A., Triebig, G. & Dietz, M. C. (2001). Evaluation of a modified German version of the
Q16 questionnaire for neurotoxic symptoms in workers exposed to solvents. Occupational
and Environmental Medicine, 58, 19-23.
Ismail, A. A., Bodner, T. E. & Rohlman, D. S. (2012). Neurobehavioral performance among
agricultural workers and pesticide applicators: a meta-analytic study. Occupational and
Environmental Medicine, 69,457-464.
Jamal, G. A., Hansen, S. & Julu, O. O. (2002a). Low level exposures to organophosphorus
esters may cause neurotoxicity. Toxicology, 181-182, 23-33.
Jamal, G. A., Hansen, S., Pilkington, A., Buchanan, D., Gillham, R. A., Abdel-Azis, M., …
Ballantyne, J. P. (2002b). A Clinical neurological, neurophyssiological, and
neuropsychological study of sheep farmers and dippers exposed to organophosphate
pesticides. Occupational and Environmental Medicine, 59, 434-441.
Jeebhay, M. F., Baatjies, R., Chang, Y. S., Kim, Y. K., Kim, Y. Y., Major, V. & Lopata, A. L.
(2007). Risk factors for allergy due to the two-spotted spider mite (Tetranychus urticae)
among table grape farm workers. International Archives of Allergy and Immunology, 144(2),
143-149.
Johnson, B. L., Baker, E. L. & Batawi, M. (Eds.) (1987). Prevention of neurotoxic illness in
working populations. New York: John Wiley & Sons.
88

Johnson, B. L. (1997). The Triennial International Symposium on Neurobehavioral Methods:
The History and Hope. Environmental Research, 73, 2-8.
Kamel, F., Engel L. S. Gladen, B. C., Hoppin, J. A., Alavanja, M. C. R. & Sandler, D. P.
(2005). Neurologic symptoms in licensed pesticide applicators in the Agricultural Health
Study. Environmental Health Perspectives, 113(7), 877-882.
Kamel, K., & Hoppin, J. A. (2004). Association of pesticide exposure with neurologic
dysfunction and disease. Environmental Health Perspectives, Annual Review Issue, 112 (9),
950-958.
Kamel, F., Rowland, A. S., Park, L. P., Anger, W. K. Baird, D. D., Gladen, B. C. … Sandler,
D. P. (2003). Neurobehavioral performance and work experience in Florida farmworkers.
Environmental Medicine, 111(14), 1765-1772.
Katzenellenbogen, J. M. Joubert, G. & Abdool Karim, S. S. (Eds.) (1997). Epidemiology: A
manual for South Africa. Cape Town: Oxford University Press Southern Africa.
Keifer, M. & Mahurin, R. (1997). Chronic neurologic effects of pesticide over exposure.
Occupational Medicine, 12, 291-304.
Kilburn, K. H. & Thornton, J. C. (1995). Protracted neurotoxicity from chlordane sprayed to
kill termites. Environmental Health Perspectives, 103(7-8), 690-694.
Kilburn, K. H. (2004). Effects of onboard insecticide use on airline flight attendants. Archives
of Environmental Health, 59(6), 284-291.
Konradsen, F., van der Hoek, W. & Peiris, P. (2006). Reaching for the bottle of pesticide – A
cry for help. Self-inflicted poisonings in Sri Lanka. Social Science & Medicine, 62, 1710 -
1719.
89

Konradsen, F., van der Hoek, W., Cole, D. C., Hutchinson, G., Daisley, H., Singh, S. &
Eddleston, M. (2003). Reducing acute poisoning in developing countries – options for
restricting the availability of pesticides. Toxicology, 192, 249-261.
Liebenberg, F. (2010). South African Agricultural Productivity and Research Performance in
the Twentieth Century. Unpublished PhD dissertation. South Africa, University of Pretoria.
Loewenherz, C., Fenske, R. A., Simcox, N. J., Bellamy, G. & Kalman, D. (1997).Biological
monitoring of organophosphorous pesticide exposure among children of agricultural workers
in central Washington State. Environmental Health Perspectives, 105, 1344-1353.
London, L. (2003). Human Rights, environmental justice and the health of farm workers in
South Africa. International Journal of Occupational and Environmental Health, 9, 59-68.
London, L. (2011). Human rights and health: opportunities to advance rural occupational
health. International Journal of Occupational and Environmental Health, 17, 80-92.
London, L. & Bailie, R. (1998). An elusive target: enhanced surveillance for pesticide
poisoning in the Western Cape. South African Medical Journal, 88, 1105-1109.
London, L. & Bailie, R. (2001). Challenges for improving surveillance for pesticide
poisoning: policy implications for developing countries. International Journal of
Epidemiology, 30, 564-570.
London, L., Beseler, C., Bouchard, M. F., Bellinger, D. C., Colosio, C., Grandjean, P., …
Stallones, L. (2012). Neurobehavioral and neurodevelopmental effects of pesticide
exposures. Neurotoxicology, 33, 887-896.
London, L. & Myers, J. E. (1995a). Agrichemical usage patterns and workplace exposure in
the major farming sectors in the southern region of South Africa. South African Journal of
Science, 91, 515-522.
90

London, L. & Myers, J. E. (1995b). General patterns of agrichemical usage in the Southern
Region of South Africa. South African Journal of Science, 91, 509-514.
London. L. & Myers, J. E. (1998). Use of a crop and job specific exposure matrix for
retrospective assessment of long term exposure in studies of chronic neurotoxic effects of
agrichemicals. Occupational & Environmental Medicine, 55, 194-201.
London, L. & Rother, H. A. (2000). People, pesticides and the environment: who bears the
brunt of backward policy in South Africa? New Solutions, 10, 339-350.
London, L., Myers, J. E., Nell, V., Taylor, T. Thompson, M. L. (1997). An investigation into
neurologic and neurobehavioural effects of long-term agrochemical use among deciduous
fruit farm workers in the Western Cape, South Africa. Environmental Research, 73 (1-2),
132-145.
London, L., Nell, V., Thompson, M. L., Myers, J. E. (1998). Effects of long-term
organophosphate exposure on neurologic symptoms, vibration sense and tremor among
South African farm workers. Scandinavian Journal of Work And Environmental Health, 24,
18-29.
London, L., Ngowi, A. V. N., Perry, M., Rother, H. A., Cairncross, E., Solomon, A., … Ajayi,
O. (2005). Health and Economic Consequences of Pesticide Use: The experience of the
Health, Environment and Economic Development (HEED) programme on pesticides in
Southern Africa. Epidemiology 16, S29.
Lotti, M. (1992). Central neurotoxicity and behavioural effects of anticholinesterases. In B.
Ballantyne, T. M. Marrs & W. N. Aldridge, (Eds), Clinical and experimental toxicology of
organophosphates and carbamates, (pp. 465-487). Stoneham, MA: Butterworth.
Lotti, M. & Moretto, A. (2005). Organophosphate-induced delayed polyneuropathy.
Toxicological Reviews, 24(1), 37-49.
91

Lu, C., Kedan, G., Fisker-Andersen, J., Kissel, J. C. & Fenske, R. A. (2004).
Multipathway organophosphorus pesticide exposures of preschool children living in
agricultural and non-agricultural communities. Environmental Research, 96, 283-289.
Mackenzie Ross, S. J., Brewin, C. R., Curran, H. V., Furlong, C. E., Abraham-Smith, K. M. &
Harrison, V. (2010). Neuropsychological and psychiatric functioning in sheep farmers
exposed to low levels of organophosphate pesticides. Neurotoxicology & Teratology, 32(4),
452-459.
Mackenzie Ross, S. J., Clark, J. S., Harrison, V. & Abraham, K. M. (2007). Cognitive
impairment following exposure to organophosphate pesticides: a pilot study. Journal of
Occupational Health & Safety: Australia & New Zealand, 23(2), 133-142.
Mackenzie Ross, S., McManus, I. C., Harrison, V. & Mason, O. (2012). Neurobehavioral
problems following low-level exposure to organophosphate pesticides: a systematic and
meta-analytic review. Critical Reviews in Toxicology, 43(1), 21-44.
Maizlish, N., Schenker, M., Weisskopf, C., Seiber, J., Samuels, S. (1987). A behavioral
evaluation of pest control workers with short-term, low-level exposure to the
organophosphate diazinon. American Journal of Industrial Medicine, 12, 153-172.
Major, V. J. (2010). The role of organophosphate exposure in the aetiology of depression and
suicidality amongst farm workers on wine and table grape farms in the Worcester area of the
Western Cape Province, South Africa. Unpublished Masters Dissertation. South Africa,
University of Cape Town.
Mancini, F., Jiggins, J. L. S. & O’Malley, M. (2009). Reducing the incidence of acute pesticide
poisoning by educating farmers on Integrated Pest Management in South Africa.
International Journal of Occupational and Environmental Health, 15, 143-151.
92

McConnell, R., Cordon, M. Murray, D. L. & Magnotti, R. (1992). Hazards of closed pesticide
mixing and loading systems: the paradox of protective technology in the Third World. British
Journal of Industrial Medicine, 49, 615-619.
McConnell, R., Keifer, M. & Rosenstock, L. (1994). Elevated quantitative vibrotactile
threshold among workers previously poisoned with methamidophos and other
organophosphate pesticides. American Journal of Industrial Medicine,25(3), 325-334.
Misra, U., Nag, D., Bushan, V. & Ray, P. K. (1985). Clinical and biochemical
changes in chronically exposed organophosphate workers. Toxicology Letters 24, 187-193.
Misra, U. K., Nag, D., Khan, W. A. & Ray, P. K. (1988). A study of nerve conduction velocity,
late responses and neuromuscular synapse functions in organophosphate workers in India.
Archives of Toxicology, 61(6), 496-500.
Miyaki, K., Nishiwaki, Y., Maekawa, K., Ogawa, Y., Asukai, N., Yoshimura, K., … Omae, K.
(2005). Effects of sarin on the nervous system of subway workers seven years after the
Tokyo subway sarin attack. Journal of Occupational Health, 47(4), 299-304.
Mnif, W., Hadj Hasine, A. I., Bouaziz, A., Bartegi, A., Thomas, O. & Roig, B. (2011). Effect
of endocrine disruptor pesticides: a review. International Journal of Environmental Research
and Public Health, 8, 2265-2303.
Murray, D. L. (1994). Cultivating crisis: The human cost of pesticides in Latin America.
Austin: University of Texas Press.
Murray, D. L. & Taylor, P. L. (2000). Claim No Easy Victories: Evaluating the pesticide
industry’s global safe use campaign. World Development, 28(10), 1735-1749.
93

Murray, D., Wesseling, C., Keifer, M., Corriols, M. & Henao, S. (2002). Surveillance of
pesticide-related illness in the developing world: Putting the data to work. International
Journal of Occupational and Environmental Health, 8, 243-248.
Myers, J. E, Nell, V., Colvin, M., Rees, D. & Thompson, M. L. (1999). Neuropsychological
function in solvent-exposed South African paint makers. Journal of Occupational &
Environmental Medicine, 41(11), 1011-1018.
Naidoo, S., London, L., Burdorf, A., Naidoo, R. N, Kromhout, H. (2008). Agricultural
activities, pesticide use and occupational hazards among women working in small-scale
farming in Northern KwaZulu-Natal, South Africa. International Journal of Occupational
and Environmental Health, 14(3), 218-224.
Naidoo, S., London, L., Rother, H. A., Burdorf, A., Naidoo, R. N. & Kromhout, H. (2010).
Pesticide safety training and practices in women working in small-scale agriculture in South
Africa. Occupational and Environmental Medicine, 67, 223-229.
National Department of Land Affairs (NDLA). (1997). Procedures for farm worker equity
schemes. Reference: PC.DOC.9/1997. Pretoria: Land Reform Policy Committee. Retrieved
January 31, 2007, from Web site: http://land.pwv.gov.za/legislation_policies/policies.htm.
Ndlovu, V., Dalvie, M. A. & Jeebhay, M. F. (2011). Pesticides and the airways: a review of the
literature. Current Allergy & Clinical Immunology, 24(4), 212-217.
Nell, V. (2000). Cross-Cultural Neuropsychological Assessment. Theory and Practice.
London: Lawrence Erlbaum Associates, Publishers.
Nishiwaki, Y., Maekawa, K., Ogawa, Y., Asukai, N., Minami, M. & Omae, K. and
Sarin Health Effects Study Group. (2001). Effects of sarin on the nervous system
in rescue team staff members and police officers 3 years after the Tokyo subway
sarin attack. Environmental Health Perspectives, 109(11), 1169-1173.
94

Ohayo-Mitoko, G. J. A., Kromhout, H., Simwa, J. M., Boleij, J. S. M. & Heerderik, D.
(2000).Self-reported symptoms and inhibition of acetylcholinesterase activity among Kenyan
agricultural workers. Occupational and Environmental Medicine, 57, 195-200.
PAN, (2010). PAN Pesticide database.Retrieved April 5, 2013, from Web site:
http://www.pesticideinfo.org.
Perry, M. J. (2008). Effects of environmental and occupational pesticide exposure on human
sperm: a systematic review. Human Reproduction Update, 14(3), 233-242.
Pilkington, A., Buchanan, D., Jamal, G. A., Gillham, R., Hansen, S., Kidd, M., … Soutar,
C.A. (2001). An epidemiological study of the relations between exposure to organophosphate
pesticides and indices of chronic peripheral neuropathy and neuropsychological
abnormalities in sheep farmers and dippers. Occupational and Environmental Medicine, 58,
702-710.
Proctor, S. P., Kristin J. Heaton, K. J., Heeren, T. & White, R. F. (2006). Effects
of sarin and cyclosarin exposure during the 1991 Gulf War on neurobehavioral
functioning in US army veterans. Neurotoxicology, 27, 931-939.
Quinn, L. P., de Vos, B. J., Fernandes-Whaley, M., Roos, C., Bouwman, H., Kylin, H., Pieters,
R. & van den Berg, J. (2011). Pesticide use in South Africa: One of the largest importers of
pesticides in Africa, pesticides in the modern world - pesticides use and management, Dr. M.
Stoytcheva (Ed.), ISBN: 978-953-307-459-7, InTech, Retrieved July 9, 2012, from Web
site:http://www.intechopen.com/books/pesticides-in-the-modern-world-pesticidesuse-and-
management/pesticide-use-in-south-africa-one-of-the-largest-importers-of-pesticides-in-
africa
Rahman, M. M. (2009). Vegetable IPM in Bangladesh. Radcliffe's IPM World Text Book.
USA: University of Minnesota.
95

Rahman, S. (2013). Pesticide consumption and productivity and the potential of IPM in
Bangladesh. Science of the Total Environment, 445–446, 48-56.
Ray, D. E., Richards, P. G. (2001). The potential for toxic effects of chronic, low-dose
exposure to organophosphates. Toxicological Letters, 120, 343-351.
Reddy, G. V. P. (2011). Comparative effect of integrated pest management and farmers’
standard pest control practice for managing insect pests on cabbage (Brassica spp.). Pest
Management Science, 67, 980-985.
Reidy, T. J., Bowler, R. M., Rauch, S. S. & Pedroza, G. I. (1992). Pesticide exposure and
neuropsychological impairment in migrant farm workers. Archives of Clinical
Neuropsychology, 7, 85-95.
Rodnitzky, R. L. (1975). Occupational exposure to organophosphate pesticides: a
neurobehavioral study. Archives of Environmental Health, 30, 98-103.
Rohlman, D. S., Anger, K.W. & Lein, P. J. (2011). Correlating neurobehavioral
performance with biomarkers of organophosphorus pesticide exposure. Neurotoxicology,
32, 268-276.
Rohlman, D. S., Lasarev, M., Anger, W. K., Scherer, J., Stupfel, J. & McCauley, L. (2007).
Neurobehavioral performance of adult and adolescent agricultural workers. Neurotoxicology,
28(2), 374-380.
Roldan-Tapia, L., Parron, T. & Sanchez-Santed, F. (2005).Neuropsychological effects of long-
term exposure to Organophosphate pesticides. Neurotoxicology and Teratology, 27, 259-266.
96

Roldan-Tapia, L., Nieto-Escamez, F. A., del Aguila, E. M., Laynez, F., Parron, T. &
Sanchez-Santed, F. (2006). Neuropsychological sequelae from acute poisoning
and long-term exposure to carbamate and organophosphate pesticides.
Neurotoxicology and Teratology, 28, 694-703.
Rosenstock, L. (1991). Chronic central nervous system effects of acute organophosphate
pesticide intoxication. Lancet, 338, 223-227.
Rother, H. A. (2005). Risk perception, risk communication, and the effectiveness ofpesticide
labels in communicating hazards to South African farm workers. (Unpublished doctoral
dissertation), Michigan State University, Michigan.
Rother, H. A. (2000). Influences of pesticide risk perception on the health of rural South
African women and children. African Newsletter on Occupational Health and Safety, 10, 42-
46.
Rother, H.A. (2012). Improving poisoning diagnosis and surveillance of street pesticides.
South African Medical Journal, 102(6), 485-488.
Rother, H. A., Hall, R. & London, L. (2008). Pesticide use among emerging farmers in South
Africa: contributing factors and stakeholder perspectives. Development Southern Africa,
25(4), 399-424.
Rother, H. A. & London, L. (1998). Pesticide health and safety policy mechanisms in South
Africa: The state of the debate. Occupational and Environmental Health Research Unit
Working Paper 1. Department of Community Health. Cape Town: University of Cape Town.
Rothlein, J., Rohlman, D., Lasarev, M., Phillips, J., Muniz, J. & McCauley, L. (2006).
Organophosphate pesticide exposure and neurobehavioral performance in agricultural and
non-agricultural Hispanic workers. Environmental Health Perspectives, 114(5), 691-696.
97

Rotterdam Convention. Severely Hazardous Pesticide Formulation (SHPF).Retrieved July 9,
2011, from Web site:
http://www.pic.int/TheConvention/Overview/TextoftheConvention/tabid/1048/
language/en-US/Default.aspx
Salvi, R. M., Lara, D. R., Ghisolfi, E. S., Portela, L. V., Dias, R. D. & Souza, D. O. (2003).
Neuropsychiatric evaluation in subjects chronically exposed to organophosphate pesticides.
Toxicological Sciences, 72, 267-271.
Savage, E. P., Keefe, T. J. & Mounce, L. M., Heaton, R. K. Lewis, J. A. & Burcar, P. J. (1988).
Chronic neurological sequelae of acute pesticide poisoning. Archives of Environmental
Health, 43, 38-45.
Schreinemachers, P. & Tipraqsa, P. (2012). Agricultural pesticides and land use intensification
in high, middle and low income countries. Food Policy, 37, 616-626.
Sebe, A., Satar, S., Alpay, R., Kozaci, N. & Hilal, A. (2005). Organophosphate poisoning
associated with fetal death: A Case Study. The Mount Sinai Journal of Medicine, 72(5), 354-
356.
Senanayake, N. & Lakshman Karalliedde, L. (1987). Neurotoxic effects of organophosphorus
insecticides. New England Journal of Medicine, 316, 761-763.
Simonsen, L., Johnsen, H., Lund, S. P., Maitkainen, E., Midtgard, U. & Wennberg, A. (1994).
Methodological approach to the evaluation of neurotoxicity data and the classification of
neurotox chemicals. Scandinavian Journal Of Work and Environmental Health, 20, 1-12.
Singh, S. & Sharma, N. (2000). Neurological syndromes following organophosphate
poisoning. Neurology India, 48, 308-313.
98

Smit, L. A. M., van-Wendel-de-Joode, B. N., Heerderik, D., Peiris-John, R. & van der Hoek,
W. (2003). Neurological symptoms among Sri Lankan farmers occupationally exposed to
acetylcholinesterase-inhibiting insecticides. American Journal of Industrial Medicine, 44,
254-264.
Solomon, C., Poole, J., Palmer, K. T. Peveler, R. & Coggon, D. (2007). Neuropsychiatric
symptoms in past users of sheep dip and other pesticides, Occupational and Environmental
Medicine, 64, 259-266.
Srivastava, A. K., Gupta, B. N., Bihari, N., Muthur, L. P., Srivastava, B. S., Pangtey, R. S., ...
Kumar, P. (2000). Clinical, biochemical and neurobehavioural studies of workers engaged in
the manufacture of quinalphos. Food and Chemical Toxicology, 38(1), 65-69.
Stallones, L. & Beseler, C. (2002). Pesticide illness, farm practices, and neurological
symptoms among farm residents in Colorado. Environmental Research, Section A, 90,
89-97.
Starks, S. A., Gerr, F., Kamel, F., Lynch, C. F., Jones, M. P., Alavanja, M. C.,
Sandler, D. P. & Hoppin, J. A. (2012a). Neurobehavioral function and
organophosphate insecticide use among pesticide applicators in the Agricultural
Health Study. Neurotoxicology and Teratology, 34, 168-176.
Starks, S. A., Hoppin, J. A., Kamel, F., Lynch, C. F., Jones, M. P., Alavanja, M. C.,
Sandler, D. P. & Gerr, F., (2012b). Peripheral nervous system function and
organophosphate pesticide use among licensed pesticide applicators in the
Agricultural Health Study. Environmental Health Perspectives, 120(4), 515-520.
Statistics South Africa. (2007). Census of Agriculture Provincial statistics: Financial and
production statistics: Western Cape, 2007. Pretoria.
99

Steenland, K., Jenkins, B., Ames, R. G., O’Malley, M., Chrislip, D. & Russo, J. (1994).
Chronic neurological sequelae to organophosphate pesticide poisoning. American Journal of
Public Health, 84(5), 731-736.
Steenland, K., Dick, R. B., Howell, R. J., Chrislip, D. W., Hines, C., Reid, T. M. … Knotff, C.
(2000). Neurologic function among termiticide applicators exposed to chlorpyrifos.
Environmental Health Perspectives, 108(4), 293-300.
Stephens, R., Spurgeon, A., Calvert, A., Beach, J., Levy, L. S., Berry, H. & Harrington, J. M.
(1995). Neuropsychological effects of long-term exposure to organophosphates in sheep dip.
Lancet, 6, 1135-1139.
Stephens, R. & Sreenivasan, B. (2004). Neuropsychological effects of long-term
low-level organophosphate exposure in orchard sprayers in England. Archives of
Environmental Health, 59(11), 566-574.
Stokes, L., Stark, A., Marshall, E. & Narang, A. (1995). Neurotoxicity among pesticide
applicators exposed to organophosphates. Retrieved September 7, 2012, from Web site:
http://oem.bmj.com/content/52/10/648.full.pdf+html.
Terry Jr, A. V. (2012). Functional consequences of repeated organophosphate
exposure: potential non-cholinergic mechanisms. Pharmacology & Therapeutics,
134(3), 355-365.
Wesseling, C., Keifer, M., Ahlbom, A., McConnell, R., Moon, J., Rosenstock, L. & Hogstedt,
C. (2002). Long-term neurobehavioural effects of mild poisonings with organophosphate
and n-methyl carbamate pesticides among banana workers. International Journal of
Occupational and Environmental Health, 8(1), 27-34.
100

Wesseling, C., van Wendel de Joode, B., Keifer, M., London, L., Mergler, D. & Stallones, L.
(2010). Symptoms of psychological distress and suicidal ideation among banana workers
with a history of poisoning by organophosphate or n-methylcarbamate pesticides.
Occupational & Environmental Medicine, 67, 778-784.
Whyatt, R. M., Camann, D. E., Kinney, P. L., Reyes, A., Ramirez, J., Dietrich, J., Diaz, D.,
Holmes, D. & Perera, F. P. (2002). Residential pesticide use during pregnancy among a
cohort of urban minority women. Environmental Health Perspectives, 110(5), 507-514.
Williamson, A. M. (1995). Neurobehavioural test batteries: current status, critical evaluation
and new directions. Toxicology Letters, 82/83, 203-209.
World Health Organization (WHO) (1986). “Operational Guide for the WHO
Neurobehavioral Core Test Battery.” World Health Organization Office of Occupational
Health, Geneva, Switzerland.
Yokoyama, K., Araki, S., Murata, K., Nishikitani, M., Okumura, T., Ishimatsu, S., Takasu, N.,
White, R. F., (1998). Chronic neurobehavioral effects of Tokyo subway sarin poisoning in
relation to posttraumatic stress disorder. Archives of Environmental Health, 53(4), 249-256.
101

Chapter 3: Methods used in the study
3.1 INTRODUCTION
This chapter details all the methods used in the study that was conducted over a period of
12 to 17 months from December 2008 to May 2010. Firstly, an overview of the overall
study area will be presented followed by the study population, the study design and
sampling. The pilot studies conducted prior to the main study will be outlined followed by
the process by which farmers were motivated to participate. A description of the study
instruments together with the reasons for the choice of instruments selected, the study
logistics, data management and analysis of all the data sets will follow. The statistical
analysis and power calculation will be outlined followed by a description of the ethical
issues that arose and the measures taken to address them.
3.2 STUDY AREA AND POPULATION
The population of interest for this study was emerging farmers in the deciduous, citrus
fruit and grape industry in the Western Cape of South Africa. Agriculture is one of the
central economic pillars of South Africa. The Western Cape is an important agricultural
area in South Africa spanning a total of 11,5 million hectares (ha). The climatic conditions
of this province make it ideal for the cultivation of crops such as grapes, deciduous and
citrus fruit. In 2004 the Western Cape contributed approximately 20% of South Africa’s
total agricultural production and 5.2% to the province’s Gross Regional Product of R185.4
billion. The Western Cape produces 11 commodities of which fruit, grapes and vegetables
contribute 56 % of the regional revenue. It exports approximately half of South Africa’s
total agricultural produce which is valued at more than R7 billion (Department of
Agriculture, Forestry and Fisheries (DAFF), 2011).
Emergent farmers are defined as small-scale predominantly black farmers who are
economically disadvantaged compared to white commercial farmers (Rother, Hall &
London, 2008). Emerging farmers have benefited from the government’s land restitution
policies or may be subsistence farmers aspire to enter commercial farming which implies
increased pesticide use. Given that these are farmers who in many instances have
previously been workers on deciduous fruit, citrus and grape farms where pesticide use is
high and where employees awareness is low, it is likely that their knowledge of the effects
102

of pesticides is inadequate (London, Myers, Nell, Taylor & Thompson, 1997; Rother et al.
2008). Given low literacy levels and high alcohol use, the health and safety of this group
of farmers is of concern. According to the Director for Farmer Support and the Department
of Agriculture, Forestry & Fisheries, there were an estimated 14 624 emergent farmers in
183 farmer projects in the Western Cape in 2009 (J. Arries, personal communication,
September 6, 2007).
The Western Cape comprises 1 metropolitan municipality, 5 district municipalities and 24
local municipalities. For logistical reasons three districts viz., the Cape Winelands, West
Coast and Overberg Districts were selected as study areas since the farms are situated
nearby (between 70 and 170 kilometres from Cape Town.) The emergent farmers were
selected from farms situated in these three districts (Figure 3.1).
Figure 3.1 Study districts in the Western Cape
Source: Department of Agriculture, Forestry & Fisheries, 2013
103

3.2.1 Cape Winelands District
The 3 most important agricultural towns in this district are Ceres, Stellenbosch and
Worcester. The region is a major producer of South Africa's deciduous fruit and is
situated in the Warmbokkeveld which is Afrikaans for "warm antelope field". The
surrounding highlands are known as the Kouebokkeveld which is Afrikaans for "cold
antelope field".
The town of Stellenbosch lies 55 kilometers east of Cape Town and has a
Mediterranean climate. Stellenbosch is ideal as a wine growing region and is the
centre for South African viticulture and viticulture research. More than 1 billion
liters of wine are produced in this area annually.
Worcester lies 120 kilometers north-east of Cape Town and serves as the
administrative capital of the Breede Valley Local Municipality. Wine as well as table
grapes are grown in this area for export as well as local consumption (The local
Government Handbook, 2012).
3.2.2 Overberg District
Grabouw is the most important agricultural town in this district and lies 65
kilometers south-east of Cape Town. It is the largest deciduous fruit producer for
export in South Africa and lies in the Elgin Valley which produces 65% of South
Africa’s apples for export.
Another important agricultural town is Kleinmond which lies 90 kilometers east of
Cape Town on the coast of the Overberg region. Barrydale and Suurbraak are small
villages bordering the Overberg region that are also important agricultural areas with
mixed crops of deciduous fruit and citrus fruit as well as grapes and vegetables (The
local Government Handbook, 2012).
104

3.2.3 West Coast District
The most important agricultural towns in this area Citrusdal, Piketbetg and
Goedverwacht. Citrusdal is a small town in the Cederberg local Municipality that lies
170 kilometers north of Cape Town. Piketberg is the centre of the Bergrivier local
Municipality and Goedverwacht is a settlement in the West Coast District
Municipality. This area produces predominantly citrus fruit (The local Government
Handbook, 2012).
3.3 STUDY DESIGN AND SAMPLING
3.3.1 Study design
A one year cohort study consisting of a baseline cross-sectional study, three quarterly
follow-ups (F1, F2, F3) and a final 12 month follow-up (FF) of emerging farmers
and family members in the Western Cape was conducted over 17 months between
December 2008 and May 2010 (Figure 3.2). A full questionnaire, all
neurobehavioural tests and a vibration sense threshold test were conducted at the first
visit (baseline study) and at the final 12 month visit while the quarterly visits
consisted of collection of exposure and injury information only relevant to the 3 to 4
months preceding the date of visit. The final quarterly visit (F3) and final follow-up
(F4) overlapped and was implemented at the same time.
Figure 3.2 A diagrammatic representation of the data collection phases
Time 0 Time 1 Time 2 Time 3 Time 4
Dec 2008 March 2009 July 2009 Dec 2009 Dec 2009
to to to to to
May 2009 Aug 2009 Dec 2009 May 2010 May 2010
Data collection phases
First visit
(Baseline)
(N=319)
1st
Follow-up
(F1)
(N=274)
2nd
Follow-up
(F2)
(N=285)
3rd
Follow-
up
(F3)
(N=277)
Final
visit
(N=273)
105

3.3.2 Sampling
The six agricultural districts in the Western Cape have 183 emerging farmer projects
comprising approximately 14 624 members. The three selected agricultural districts
are representative of the other three districts and include the Cape Winelands,
Overberg and West Coast where deciduous fruit, citrus fruit, grapes and vegetables
are grown, respectively. Agrichemical use is known to be high in these crop sectors
(London & Myers, 1995; London et al. 1997; Major, 2010; Statistics SA, 2007).
Each district has an agricultural manager with extension officers reporting directly to
him/her. The District Manager who reports to the Director of Farmers Support &
Development, Provincial DAFF for the Western Cape provided permission for the
study. The Provincial Director of the Western Cape Provincial Land Reform Office
provided a list of 183 farmer projects registered with the Land Reform Office in the 6
selected districts for participation in the research and farmers from 22 farmer projects
in 3 districts agreed to participate by providing signed consent.
Farmer projects that were earmarked for the study included only projects with
emerging farmers using pesticides for crop growing and all projects that followed
organic methods of crop cultivation were excluded. These farmer projects produce
crops such as deciduous fruit, vegetables, grapes, cotton, flowers and livestock. Of
the six agricultural districts, three districts were selected on the basis of
representivity and accessibility. Within the three districts, there were 63 farmer
projects supporting 5074 farmers. Of the 63 projects, 34 projects (supporting 1391
farmers) were recommended as fitting the study entry requirements (see inclusion
and exclusion criteria) by the DAFF managers responsible for the development and
support of emerging farmers in the 3 selected districts. The number of farmers on
the recommended projects varied from 3 to 37 and the crops cultivated on these
farms included deciduous fruit, vegetables and grapes. All these farms reported the
use of pesticides on their crops. The selection of districts enabled the study to include
a sample of emerging farmer projects that captured a range of different project sizes.
106

The projects that were ineligible included dairy farms, farms that were in the process
of switching over to organic farming methods and have stopped using pesticides and
farms that were geographically remote. Of the 326 farmers who agreed to participate,
from 21 farm projects, seven were absent for various reasons on the day that data
collection started bringing the total number of participants to 319 emerging farmers
who participated in the study. These 21 projects represented 62% of the 34 eligible
emerging farmer projects that were approached in 3 agricultural districts in the
Western Cape. Figures 3.2 and 3.3 illustrate the study participation.
Figure 3.3 Study participation
Farmer projects that
Six agricultural districts
Emerging farmer population (n= 14 624)
Total number of projects (n=183)
Eligible farmer projects
(n=34)
Population size (n=1391)
3 districts selected
(Cape Winelands, Overberg, West Coast)
Emerging farmer population (n= 5074)
Total number of projects (n=63)
Ineligible farmer
projects (n=29)
Farmer projects that declined
participation (n=11)
Participating Farmer projects (n=21)
Eligible number of participants in 3 districts
(n=326)
Pilot studies
(n=2)
Participants who had agreed to participate
but were absent at the first visit (n=7)
Final number of projects (n=21)
Final participants (n=319)
107

The process of recruitment relied on extension officers, who are in close contact with
the farmers and farmer groups and provide support and advice in terms of training
and pesticide usage. The researcher met with the extension officers servicing these
63 projects to explain the project. They identified emerging farmer groups in each
agricultural district and approached the farm managers of the selected projects to
participate in the study. The researcher and the respective extension officers arranged
meetings with farm managers and members of the emerging farmer projects to
describe the research study to them and to request their participation. This facilitated
the process since the farmers have a relationship of trust with the extension officers.
Farm managers were requested to arrange meetings with potential project members
to describe the research to the farmers and request their consent to participate in the
research study. Thirty-five projects initially expressed an interest in participating in
the study of which 22 agreed to participate. Within participating farms, all farmers on
the participating farms agreed to participate but 7 farmers who had agreed to
participate in the study during the initial information sessions were absent at the first
data collection visit resulting in a total sample of 21 projects and 319 farmers (Table
3.1).
Table 3.1 Distribution of emerging farmer projects by district
District Eligible
projects
(n)
Participating
projects
(n)
Eligible
individuals
(n)
Participating
individuals
(n)
Cape Winelands 31 9 (158) 682 158
Overberg 14 7 (76) 335 77
West Coast 18 5 (84) 428 84
Total number of
projects
63 21 (319) 1445 319
Inclusion criteria:
Inclusion criteria for participants were:
Adults (those who were 18 years and older)
Emerging farmer or adult family members
On emergent farms using pesticides
108

Farms located in one of three selected districts
No adults with alcohol dependence were excluded because of the
widespread use of alcohol in this province. Alcohol consumption was
controlled for in the analysis.
Similarly, adults with a history of head injury and loss of consciousness
were included and this variable controlled for in the analysis.
Exclusion criteria
Emerging farmers have shares in existing farmer projects and there were no hired
labourers and seasonal workers in these groups. Adults with a visibly obvious
deformity or abnormality of lower limbs that might interfere with peripheral
sensation (n=4) were excluded from vibration sense testing with the tuning fork only.
Organic and non-pesticide using farms were excluded from the study.
3.4 MOTIVATION FOR FARMER PARTICIPATION
Difficulties in recruiting and retaining farmers for the study over a long period of
time necessitated a form of financial compensation after completion of the study.
Reasonable compensation for participating in the research project was negotiated
with farm project members. An agreement was reached between farm project
members and the study coordinator to make R1000-001 available (equivalent of US$
140 at the time) to every project as a collective contribution, rather than payment to
individual members. In this manner each project benefitted from participation in the
study. Refreshments were also made available to participants following each data
collection visit.
3.5 MAIN STUDY MEASUREMENTS
The study instruments used in the study included a questionnaire named the “Farmer
Questionnaire” and neurobehavioural testing instruments used in the baseline and
1 The recent labour unrests on farms in the Western Cape in November 2012 increased the monthly
wage for a farm worker on a commercial farm from R320 to R600 per month. The R1000 was
given to the farmer project as a whole for participation in the research study and is the
equivalent of approximately two months’ wages on a commercial farm for a single worker.
109

final follow-up including a quarterly journal used every three months to collect
exposure information. Pesticide bio-monitoring (urine and blood plasma) was
conducted during all the data collection phases to detect excessive OP pesticide
exposure. Additionally, an Iconic Daily Journal was developed and piloted with a
subsample of the farmers in the three agricultural districts. Each instrument is
discussed below.
3.5.1 Farmer Questionnaire
The Farmer Questionnaire (Appendix C) contained sections on demographics, socio-
economic status, lifestyle factors, job-history household pesticide use and as well as
the Brief Symptom Inventory (BSI) and the Swedish Q16 Symptom questionnaire
which are described in the following sections. Questionnaire items were based on
previous local studies (Dalvie et al., 1999; Dalvie, 2002; London et al., 1995;
London et al., 1997; Major, 2010). The Farmer Questionnaire was piloted in three
agricultural districts and translated from English into Afrikaans by the study
coordinator and into Xhosa and back translated into English and Afrikaans by the
Language Service, Language Centre at Stellenbosch University.
The items in the various sections mentioned above include the following:
Demographic section.
This section contained items on gender, age, level of education (schooling,
tertiary education) and language spoken at home.
Socio-economic factors
This section contained items on type of accommodation, ownership of
household items such as a radio, a refrigerator, a television set and a cell
phone or landline telephone, constructed as a score out of 4 for which each
item was equally weighted. This approach to estimating socio-economic
status has been used in other studies of farm workers in the region (London et
al., 1997; Major, 2010) and was used in this study to describe socio-economic
status.
110

Life residential history
This section collected information on how long the participants had been
living on the farm, type of crops grown on the farm, approximate distance
between the participant’s home and the orchard or vineyard, pesticide
application on the farm, family members involved in pesticide application
and hand washing before eating.
Lifestyle factors
This section included items on alcohol use, smoking and drug use (e.g.
Marijuana (Cannabis), Mandrax, Heroine, Crack/Cocaine, Ecstasy,
Methamphetamines (Tik). A section entitled ‘Other’ was included to record
the use of any other substance not listed. Heavy alcohol consumption was
measured using the C.A.G.E (cutting down, annoyance by criticism, guilt,
eye-openers) questionnaire (Mayfield, McCleod & Hall, 1974; Bernhardt,
Mumford, Taylor & Smith, 1982). A score of ≥ 2 positive answers indicates
‘problem’ alcohol users and has been used with farm workers in South Africa
by London et al. (1997) and Major, (2010) with good face validity. The
smoking item elucidated information about current and past smoking and the
item on drug use elucidated substance use information over the past 30 days.
Job history
The job-history section contained details of the current job and previous jobs,
going back to 3 farm jobs prior to the interview. Data collected included for
each job years of employment, job title, job tasks and crop type. If the
respondent was a pesticide applicator, details were obtained about which
pesticides were applied, the application methods (mixing, driver of tractor
with boomsprayer, driver of tractor with mistblower; quadbike; backpack and
manual or hand application), frequency of applying pesticide (days per week,
weeks per month and months per year).
111

Household pesticide use
This section contained items on use of pesticides at home or in the home
garden and the use and disposal of empty pesticide containers.
3.5.2 Neurobehavioural testing
Neurobehavioural assessment involved testing with tests drawn from the WHO
Neurobehavioral Core Test Battery (WHO NCTB), the Brief Symptom Inventory
(BSI), the Swedish Q16 Symptom questionnaire and Vibration Sense Threshold
Testing. Each component of the test battery is described below, including the
rationale for inclusion in the study.
3.5.2.1 World Health Organisation Neurobehavioural Core Test Battery (WHO
NCTB)
Five subtests from the World Health Organisation Neurobehavioral Core Test
Battery (WHO NCTB) were used in this study including the Digit Span forward and
backward, Digit Symbol, Santa Pegboard, Pursuit Aiming and the Benton Visual
Retention Test (WHO, 1986). The WHO NCTB (described in the preceding chapter
– see pages 38 to 39/section 2.3) was developed in 1983 at a meeting of field
investigators using behavioral and neurologic tests which were sponsored by the
WHO and the US National Institute for Occupational Safety and Health (NIOSH).
Following consensus among the field investigators seven field behavioral tests with
established sensitivity to neurotoxic chemicals were recommended (Anger et al.
1997). The WHO NCTB subtests are mainly pencil-and-paper tests that are
administered orally, are easy to use in rural settings in developing countries where
electricity may not be available and the tests can be used with success among
participants with lower education levels (Anger et al. 1997; London et al. 1997). The
WHO NCTB tests have also consistently identified neurotoxic effects in
occupational settings (Johnson, Baker & Batawi, 1987; Johnson, 1997).
The chosen tests have been shown to be very sensitive in measuring neurotoxicity
due to chemicals and have become the battery used in developing countries because
112

of the ease with which it can be administered compared to other instruments that are
not paper-based and relies on more sophisticated instrumentation (Anger, 2003;
London et al., 1997). Although the tests were developed and standardised in Western
countries they have been successfully used among indigenous language speaking
populations in South Africa with low education levels (Colvin et al., 1993; Myers et
al., 1999; London et al, 1997). Pilot studies conducted in the Western Cape province
as well as in Groblersdal in Mpumalanga province in 2005 (London et al., 2005) and
in Piketberg and Worcester in 2008 (Major, 2010) confirmed that it was possible to
translate and administer the Neurobehavioural Core Test Battery to non-Western
populations.
The robustness and utility of the WHO tests have been demonstrated in their wide
application across a number of studies to assess neurobehavioural performance
following pesticide exposure across a range of exposed groups such as Egyptian
cotton farmworkers (Farahat et al., 2003), deciduous fruit farm workers in South
Africa (London et al., 1997), migrant farm workers in North America (Rohlman et
al., 2007), farm workers in Costa Rica (Wesseling et al., 2002), UK sheep dippers
(Mackenzie Ross et al., 2010; Pilkington et al., 2001), commercial pesticide
applicators (Maizlish et al., 1987; Misra et al., 1985) and positive associations were
reported between exposure and neurobehavioural impairment. While the tests were
developed and standardised in Western countries they have been administered with
success in non-Western populations with low education levels (Cole et al., 1997;
Farahat et al., 2003; London et al., 1997; Wesseling et al., 2002). In addition, pilot
studies conducted in Groblersdal, Mpumalanga in 2005 (London et al., 2005) and in
Piketberg and in the Cape Winelands in 2008 confirmed that it was possible to
translate and apply the Neurobehavioural Core Test Battery to indigenous language
speaking South Africans.
The following section gives an overview of the different WHO NCTB tests selected
for use in the study.
113

Benton Visual Retention test
The Benton Visual Retention test is a test of short-term visual memory. It measures
the ability to organise geometric shapes in space and to remember them. Twenty (20)
cards are presented to the participant in ten (10) pairs of two. The first of each pair
contains the shape to be memorised for 10 seconds and the second card contains four
shapes with the correct one included among the confounders to be identified. These
shapes increase in complexity with the last pair being the most difficult to memorise.
The participant has 10 seconds to identify the correct shape. Each correctly identified
shape is awarded one point and the participant’s score is the number of shapes
correctly identified. A total possible score is 10 if all shapes are correctly identified.
Digit Symbol Test
The Digit Symbol test is a subtest of the Wechsler Adult Intelligence Scale (WAIS
and WAIS-III) intelligence test and is included in the WHO NCTB test battery
(WHO, 1986). It measures perceptual fine motor control and speed as well as
incidental learning of association (visuo-motor, speed and attention). It contains a list
of numbers that are associated with certain simple symbols and a list of random
digits from one through nine with blank squares below each digit. Each number is
associated with a particular symbol and the participant’s task is to recognise the
symbol associated with a particular number. The test consists of a random sequence
of five of these numbers with a blank square under each number. The participant’s
task is to fill the blank squares with the symbols paired to their corresponding digits.
The participant has to complete as many tests as possible in 90 seconds.
The participant’s score is the number of symbols correctly filled in in 90 seconds.
The score possibilities range from 0 to 67. Raw scores are used to assign
standardised scores from the WAIS-III norms (Human Sciences Research Council
(HSRC), 2001; Nell, 2000) and recorded for each participant.
114

Digit Span Tests
The Digit Span Test is a test of immediate short term auditory memory and focussed
attention (attention span). It comprises two parts: Digit Span Forward which tests
attention and Digit Span Backward which tests memory. A sequence of numbers is
read out to the participant starting with 3 numbers and the participant repeats the
numbers in the same order as was read out by the test administrator. For example, the
test administrator will read: 3, 6, 7 and the participant repeats the number sequence
in the same order and says 3, 6, 7. The following number sequence read to the
participant will be longer and will have more numbers, for example 5, 9, 4, 3 which
the participant has to repeat in the same order. Each part has 7 pairs of random
numbers that become longer in sequence and more complex to memorise and repeat.
For Digit Span Forward participants must repeat the digit sequence in the same order
as is read out to him and for Digit Span Backward the participant repeats the digit
sequence in reverse order. For example, for the Digit Span Backward part, the test
administrator will read a number sequence 5, 3 which the participant has to repeat
but in reverse order for example, 3, 5. For both Digit Span Forward and Backward a
score of 0 is given for incorrectly repeating the digit sequence pair; 1 for repeating
one of the pairs correctly and 2 for repeating both pairs of the digit sequence
correctly. The overall possible score is the sum of both Digit Span Forward and Digit
Span Backward. A total score of between 0 and 28 is possible for Digit Span
Forward and Digit Span Backward. The total Digit Span Forward and Backward raw
scores are standardised with the WAIS-III norms. The Digit Span Forward, Digit
Span Backward and Digit Span WAIS standardised scores were used as outcome
variables in the analyses.
Pursuit Aiming Test II
The Pursuit Aiming Test II originates from Fleischman’s 1954 (cited in Nell, 2000)
psychomotor battery of tests. It is a test of visuo-motor speed, hand steadiness/
immediate memory, attention span, hand tremor, eye-hand coordination and
measures the ability to make quick and accurate dot movements with the hand. The
task is to place the dots in the centre of a 2mm diameter circle using a sharp HB
pencil without touching the boundary lines. The participant is given time to practice
before the actual timed trial starts. The participant is then requested to start making
115

dots in the circles as fast as possible while being timed by the test administrator to
see how many pencil dots can be made without touching the boundary lines for 60
seconds (one minute). The participant is then told to stop and rest for 30 seconds
after which the second trial is started and timed for 60 seconds.
Two score totals are calculated for each participant: one score total for all correctly
made dots and one score total for all incorrect (attempted) dots from each trial. A
total score of 750 is possible. The total correct score is used as an outcome variable
in the analyses.
Santa Ana Pegboard Test
Santa Ana Pegboard is a test of manual dexterity and rapid eye-hand
coordination (manual fine manipulative dexterity, motor speed). The test is
conducted using a rectangular board with 48 square depressions into which pegs
having a cylindrical upper part and a square base fits. The participant has to lift
each peg out of its slot, turn it 180 degrees and place it back in the slot as fast as
possible. Separate measurements are taken for the preferred hand (dominant hand)
and the non-preferred hand (non-dominant hand). The administrator demonstrates
how the test is performed and allows the participant to practice with the first four
pegs. The participant has to perform the test while standing and the administrator has
to stand next to the participant. After the practice session the participant performs
two trials each for the dominant and non-dominant hand (four trials in total) which
are timed for thirty (30) seconds per trial.
The number of correctly turned pegs is recorded for each trial and for each hand as
well as the number of pegs that were dropped or upset during the trial. The score for
each participant comprises the total number of correctly turned pegs for the dominant
and non-dominant hand as well as the number of dropped and upset pegs for the
dominant and non-dominant hand. A total score range of 0 to 48 is possible for all
correctly turned pegs per dominant and non-dominant hands.
116

3.5.2.2 The Brief Symptom Inventory (BSI)
The BSI was included in the study to investigate the effects of acute and long-term
OP exposure and neuropsychiatric function among emerging farmers. Previous
studies have reported positive associations between acute OP exposure and
neuropsychiatric function among farm workers (Rosenstock et al., 1991; London et
al., 1997; Wesseling et al., 2002). Past poisoned farm workers were for example four
times more likely to report increased neuropsychiatric symptoms compared to non-
poisoned farm workers (London et al., 1997). Similarly, increased symptoms of
psychological distress including depression and suicidal thoughts were reported in
previously OP poisoned workers in a study by Wesseling et al., (2002, 2010).
Rosenstock et al., (1991) reported more somatic complaints among the poisoned
group compared to controls. There is also evidence for the long-term effects of OP
exposure in the absence of an acute poisoning episode and increased
neuropsychiatric symptoms. Termiticide applicators evidenced symptoms of fatigue
after 2.5 years’ exposure to OP pesticides compared to non-exposed controls
(Steenland et al., 2000).
The Brief Symptom Inventory (BSI) is a validated brief psychological self-report
symptom questionnaire that comprises 53 items (Derogatis & Melisaratos, 1983;
Derogatis, 1993) and was included in the Farmers Questionnaire. It is a questionnaire
that assesses participant’s level of psychological, physical and physiological distress
for the past seven (7) days including the day of the interview. Each item is rated on a
5-point scale of distress ranging from 0 to 4 with ‘4’ rated as the highest level of
distress. The BSI thus has a score range of 0 to 212.
A second set of scores is derived from forty-nine of these items which are divided
into nine primary symptom dimensions namely ‘somatization’, ‘obsessive-
compulsive’, ‘interpersonal sensitivity’, ‘depression’, ‘anxiety’, ‘hostility’, ‘phobic
anxiety’, ‘paranoid ideation’ and ‘psychoticism’. The values for the items in each of
the nine dimensions are summed and divided by the number of items endorsed in that
dimension. Additionally, there are three global indices that provide an overall
assessment of participants’ past and current psychological status. These are the
117

‘Global Severity Index’ (GSI), ‘Positive Symptom Total’ (PST) and ‘Positive
Symptom Distress Index’ (PSDI). Information from each of these global indices
combine to provide an integrated profile of the nature of the participant’s current
psychological distress on a global, dimensional and discrete symptom level.
However, the GSI is recognised as the most sensitive single indicator of an
individual’s level of distress and was used in this study. The GSI raw score is
calculated by totalling the sum of the nine symptom dimensions plus the four
additional items and dividing by the total number of items to which the individual
responded. For example if the individual responded to all 53 items, the GSI will then
be the mean of the 53 items or divided by 50 if there are 3 (3) missing items. These
raw scores were converted to standardised T scores for each participant by dividing
by normal values (Norm Group B values for adult non-patients with separate norms
for females and males (Derogatis, 1993).
The BSI GSI T score was used as the continuous outcome variable for BSI in
statistical analysis. Additionally the score was dichotomised using a cut-off of 63 (T
score ≥63), considered a positive diagnosis or case for the GSI.
Test-retest reliability coefficient for the primary symptom dimensions is moderate to
high and ranges from 0.68 to 0.90 and 0.91 for the Global Severity Index (Derogatis
& Melisaratos, 1983). While validity and reliability of the BSI have been established
in international studies, locally not many studies have been conducted. Hitherto, only
two studies conducted in South Africa have used the BSI. In an unpublished
agricultural study the BSI was used as one of the instruments to investigate the
neuropsychiatric effects of organophosphate pesticide exposure among farm workers
(Major, 2010) and in a non-agricultural study, to investigate the chronic
neurobehavioural effects of mercury poisoning among chemical workers in a
mercury processing plant in South Africa (Powell, 2000). The psychometric
properties of the BSI used in the former study were evaluated by Kootbodien using
confirmatory factor analysis and, in general, a high Cronbach alpha coefficient of
0.91 was obtained, suggesting good validity in this population (Kootbodien, 2011).
118

3.5.2.3 The Swedish Q16
The Q16 has been used in studies with farm worker populations, sheep dippers and
commercial pesticide applicators and increased symptoms have been reported among
exposed subjects when compared to non-exposed control groups (Dalvie et al., 2012;
Delgado et al., 2004; Steenland et al., 2000; Wesseling et al., 2002). Dalvie et al.,
(2012) reported increased symptoms among a group of South African rural women
exposed to pesticides on farms using the Q16 compared to women from
neighbouring towns. The Q16 was included in this study to investigate the acute and
long-term neuropsychiatric effects of OP exposure among emerging farmers.
The Swedish Neuropsychiatric Questionnaire (the Q16) is a subjective mood
symptom neuropsychiatric questionnaire developed by Axelson and Hogstedt, (1988)
as a screening instrument to detect and monitor early sub-clinical effects of
neurotoxic exposure on the central nervous system. In this study the Swedish Q16
was used to measure the early neurological effects of long-term exposure to pesticide
exposure. In a review of 21 studies to identify effects induced by solvents, Ihrig,
Tribig & Dietz, (2001) reported that in 15 out of 21 studies (71%), the Swedish Q16
was sensitive and identified effects as a result of exposure to solvents.
It contains 16 short questions with ‘Yes’ ‘No’ response options that tap memory and
concentration difficulties, fatigue, irritability and sadness, dizziness and neurological
symptoms such as loss of sensitivity, problems with sleeping, numbness, tingling.
Each item is rated ‘0’ and ‘1’ with ‘1’ for ‘Yes’ and ‘0’ for ‘No’ responses. The Q16
has a score range of 0 to 16. A pilot study of the Q16 conducted among a group of
Sesotho farmers in Mpumalanga in South Africa in 2005 (London et al., 2005)
necessitated leaving out item 16 relating to male sexual potency because of cultural
sensitivity, however pilot studies conducted among predominantly Afrikaans-
speaking farmers revealed no difficulties with this particular item and all 16 items
were included in the administration of the Q16. It is recommended that a participant
with a score of seven (7) or more ‘Yes’ answers be referred for further evaluation
(Ihrig et al., 2001; Lundberg, Högberg, Michélsen, Nise & Hogstedt, 1997).
119

3.5.2.4 Vibration Sense Threshold
Positive associations have been reported between OP exposure and altered vibration
sense among farm worker populations where exposed groups reported decreased
vibration sensitivity compared to unexposed control groups (Cole et al., 1998;
London et al., 1997). For this reason vibration sensitivity as an outcome measure was
included in the study to assess the possible effects of OP exposure on vibration
sensitivity among South African emerging farmers. Vibration sensitivity was
measured using a 256-Hz frequency tuning fork to detect early peripheral neuropathy
(London, Thompson, Capper & Myers, 2000).
A cylindrical resin hold with a slot for the prongs of the tuning fork was developed
by the Biomedical Engineering Department at UCT to standardise the vibration
amplitude delivered by the tuning fork. The test was performed by inserting the two
prongs of the tuning fork into the resin hold, releasing the prongs sharply and placing
the base of the fork immediately on the medial malleolus of the participant’s non-
dominant lower limb while the participant was sitting comfortably with his/her foot
resting on a raised surface. The participant was then asked whether he/she could feel
the vibration sensation and to inform the examiner when the vibration sensation was
no longer felt.
The test was explained to each participant and demonstrated on the wrist bone to
ensure that farmers understood the test and that they could distinguish between
sensing the vibration from the tuning fork and other possible sources. Extinction time
was taken in seconds from the time the fork was released from the resin hold until
the participant reported no longer feeling the vibration. Diminished vibration
sensitivity indicates impaired peripheral nerve function. Three readings were
recorded and the average reading of the last two was used as the final extinction time
for each participant.
3.6 EXPOSURE ASSESSMENT
The difficulty of accurate exposure estimation makes it necessary to combine various
measurement tools to improve exposure characterization (Jamal et al. 1997;
120

Steenland et al., 1994). In this study, exposure to pesticides was assessed in the ‘Life
Residential History’ and ‘Job History’ subsections of the farmer questionnaire where
information was collected on current and past three jobs on farms as well as in a
quarterly audit. The quarterly audit was administered by trained interviewers to all
participants every three to four months to collect information retrospectively on
pesticide activities for the past interval of three to four months.
3.6.1 Life residential and job history sub-section of farmer questionnaire
Section 4 of the farmer questionnaire, ‘Life History’, collected information from
every participant about pesticide applications on the farm. Information about method
and frequency of pesticide application on farms was also collected in this subsection.
Section 8 of the farmer questionnaire, ‘Work History’, collected information about
the frequency, type and duration of current and previous work activities (jobs). Every
job was explored for the type (e.g. type of job and type of farm), frequency and
duration in 8 hour days, weeks, months and years of possible exposure to
agrichemicals.
3.6.1.1 Quarterly audit
During each of the three monthly follow-up visits, a quarterly audit was conducted
which involved the collection of retrospective exposure information for the
preceding three to four months. The use of icons to characterise and describe
exposure duration has been shown to improve the accuracy of pesticide exposure
assessment (Monge et al., 2004). Pilot studies revealed that the quarterly audit was
easy to understand and took 10 minutes to administer. The quarterly audit was
conducted by the same trained interviewers who administered the Farmer
Questionnaire. The audit report sheet (Appendix D) contained sections on:
Pesticide applications in the 3 to 4 months preceding the date of the visit
Method of application and frequency of application in the 3 to 4 months
preceding the date of the visit
121

Instances of pesticide poisoning in the 3 to 4 months preceding the date of the
visit
Whether or not participant mixed the pesticide him/herself
Type of Personal Protective Equipment used
Details of lifetime pesticide poisoning included date, whether or not medical
attention was sought, medication received and whether time was taken off from
work.
3.6.1.2 Job exposure matrix
Job-exposure matrices (JEMs) have been included in studies since the 1980s as a
method to assist with the accurate estimation of exposure in the workplace (Benke et
al., 2001; Dalvie et al., 2009; Garcia et al., 2013; London & Myers, 1998; Teschke et
al., 2002; Young, Mills, Riordan & Cress, 2004). While the job exposure matrix is
not an absolute exposure measurement instrument it is helpful as an adjunct to self-
reported job history in the absence of accurate spray schedules and has been
described as a reasonable proxy for exposure (Young et al., 2004). Longitudinal
studies are particularly vulnerable to participants’ potential inability to remember
names and dates of pesticide application over an extended period of time.
While concerns have been expressed about the sensitivity of JEM estimates and job
activity weightings, a study by London and Myers (1998) showed that a JEM can be
used with good repeatability to determine dose-response relationships. In their study
London and Myers (1998) made use of secondary industry data and expert opinion
to estimate cumulative lifetime and average lifetime intensity organophosphate (OP)
exposure for deciduous fruit farm pesticide applicators (n=163) and controls (n=84).
They repeated the questionnaire to a subsample of 29 participants three months later
and reported moderately good correlation coefficients for cumulative exposure
variables (0.67 to 0.99) but not for average exposure intensity. However, they
reported adequate repeatability of the JEM as a tool to characterise chemical
exposure in agriculture.
122

In the present study every lifetime job was explored for the duration and frequency
of possible agrichemicals. The JEM incorporated weightings for specific job tasks
such as mixing pesticides indoors or outside, applying pesticides with a backpack,
tractor spraying with hand-directed nozzles or quad bike application.
3.7 PILOT STUDIES
A study conducted in 2005 in Mpumalanga served as a pilot study for this study.
However, 3 further pilot studies were conducted one each in the three study districts
to determine any logistical difficulties with administering the neurobehavioural tests
and questionnaire and with the clarity and language of the questionnaire. These are
described below.
3.7.1 The Mpumalanga pilot study
The first pilot study was conducted in among 40 emerging farmers in 2005 in
Groblersdal in Mpumalanga (Holtman & London, 2006). Testing included a general
and exposure questionnaire, neurobehavioural testing (the Santa Ana Pegboard, the
Benton Visual Retention Test, Digit Span forward and backward, Digit Symbol Test,
Vibration Sense Threshold using a 256-Hz frequency tuning fork, the Brief Symptom
Inventory and the Swedish Q16 Neurotoxicity Symptom questionnaire) and pesticide
bio-monitoring in blood and urine. The study provided clarity on the length and
clarity of the questionnaire and showed that it was possible to administer the
neurobehavioral tests to rural farmer populations in developing countries. The
demographic section was found to be too long and was shortened for the study. Item
16 of the Swedish Q16 Neurotoxicity Symptom questionnaire, which refers to male
sexual potency, was found to be culturally too sensitive for the population in this
pilot.
The Mpumalanga study also showed that participants were tired by mid-afternoon
and that this could influence their responses to tests like the Santa Ana Pegboard, the
Benton Visual Retention, Digit Span and Digit Symbol where manual dexterity and
speed are combined with attention. Therefore neurobehavioural testing was planned
between 10am and 2pm for the study.
123

3.7.2 The West Coast pilot study
The second pilot study was conducted in Piketberg on the West Coast in 2008 among
7 literate Afrikaans-speaking male participants who had been given shares in the
commercial farm where they had been working for many years. The Farmer
Questionnaire was piloted and the neurobehavioural tests described to the farmers.
Item 16 of the Swedish Q16 Neurotoxicity Symptom questionnaire was discussed
among the male participants to determine their comfort in answering the question.
The male participants were not uncomfortable with item 16 of the Swedish Q16
Neurotoxicity Symptom questionnaire and a female researcher administered the Q16
among these participants. However, it was decided to use male interviewers to
administer the Swedish Q16 Neurotoxicity Symptom questionnaire to circumvent
any problems of cultural sensitivity among older male Xhosa and Sesotho speaking
males in the main study. Each neurobehavioural test took 2 minutes to explain to
each individual farmer and 3 to 5 minutes for each farmer to complete. The
neurobehavioural testing and questionnaire administration lasted an hour and fifteen
minutes with each participant. While it was preferable to have testing done in the
morning over a period of 3 hours per group depending on the size of the group, this
was not always possible and testing had to be conducted in the afternoon as farming
duties allowed. Refreshments were always served on completion of the questionnaire
and test administration.
3.7.3 The Cape Winelands pilot study
In the third pilot study a daily iconic journal for literate and semi-literate participants
was piloted among 19 literate Afrikaans-speaking (9 male and 10 female)
participants and 1 semi-literate Afrikaans-speaking male participant in 2008. The
farmers completed the journal for a period of two weeks (including weekends) and
reported back on follow-up visits. A focus group discussion was held with the groups
after the two week period to investigate language and face validity of the iconic
pictures as well as time taken to complete the journal on a daily basis. The same
interviewers administered the Farmer Questionnaire and assisted with the collection
of data from other testing for the Iconic Daily journal.
124

3.7.4 The Overberg pilot study
The fourth pilot study was conducted among 13 literate Afrikaans-speaking (5 male
and 8 female) and 2 male semi-literate Xhosa participants in 2008. The farmers
completed the journal for a period of two weeks (including weekends) and reported
back on follow-up visits. A discussion was held with the groups after the two week
period to investigate language and face validity of the iconic pictures as well as time
taken to complete the journal on a daily basis.
It took the farmers between 5 and 10 minutes each day to complete the iconic journal
and 45 minutes to administer the questionnaire.
3.8 LOGISTICS
Six fieldworkers were trained as interviewers to administer questionnaires, to assist
with Iconic Daily Journal data collection and quarterly audit. Two of these were
psychology graduates who were trained to conduct all the neurotoxic tests including
the researcher. Fieldworkers were not from the study areas due to financial
constraints in terms of geographical distance. All six fieldworkers participated in the
pilot studies.
The baseline study took 5 months to complete as farmers were recruited to start the
study. Follow-up visits to collect exposure data using the quarterly audit checklist
were conducted every third to fourth month. This meant that the average duration of
exposure data for each farmer ranged between 12 and 13 months. The baseline study
and final follow-up tests were administered immediately after the participants’
information was recorded and each participant was provided with an envelope which
included the neurobehavioural test forms, a farmer questionnaire and the signed
consent forms (Figure 3.4).
During all the data collection phases, a vehicle was hired to transport the research
team to the fieldwork venue. Accommodation was arranged for the team in nearby
towns when testing continued over two or more days. Interviews and
125

neurobehavioural testing were conducted in offices; boardrooms; store rooms; farm
crèches; community halls and open areas on farms weather permitting.
Figure 3.4 Order of tests and questionnaire administration during
baseline and final follow-up studies
3.9 DATA MANAGEMENT AND QUALITY CONTROL
Each participant was assigned a unique identification study number which was
recorded in a record book next to the participant’s name. All data collection
instruments as well as biological specimen containers were labelled with the
identification study number. Each participant received an A4 envelope containing a
questionnaire, a score sheet for each neurobehavioural test and the participant’s
signed consent forms. A checklist was pasted on the envelope listing all tests to be
conducted with tick boxes marked on the right hand-side to indicate whether the test
Entrance to and exit from the study
venue Study coordinator records personal details of each
participant entering the research venue and
provides each participant with a numbered
envelope containing a questionnaire
Administration of WHO NCTB,
the BSI, Q16 & vibration sense
testing by 2 Psychology graduates
Study coordinator checks each
participant’s envelope with checklist to
ensure all tests have been completed before
participants exit the study venue
Administration of questionnaires by
three interviewers
126

had been conducted. Reasons for tests that were not conducted were recorded on the
checklist as well as in a record book for each district.
The participant’s name and telephone number (where possible) was recorded on the
checklist together with the farm name and the agricultural district. Each envelope
was numbered which was also the unique identifier for each farmer.
Two psychology graduates trained and supervised by the study coordinator conducted the
neurobehavioural tests. An adaptation of the Operational Guide ‘Bypassing Culture
Performance Process Probes for Neuropsychological Assessment’ developed by Nell and
Taylor, (1992) was used to develop a protocol (Fieldwork User Guide) with detailed
instructions for the administration of the WHO NCTB sub-tests in the study (Appendix G).
The WHO NCTB tests were administered first before the questionnaire given the effects of
fatigue on neurobehavioural and neuropsychological test performance (London et al., 1997;
Johnson et al., 1987). On completion of all tests and questionnaires, farmers handed their
envelopes back to the study coordinator for checking before leaving the research venue. In
the event of missing information the participant was called back or the research team
arranged with the participant to collect the information on subsequent farm visits or
telephonically.
3.10 DATA ENTRY
All envelopes collected during all the data collection phases were arranged in
numerical order and data was entered in Excel spreadsheets. The data of the baseline
study and three quarterly audits was entered by the two research assistants who were
psychology graduates with random sections checked conducted by the study
coordinator. The Excel spreadsheets were checked for consistencies and transported
into STATA 10 programme for statistical analysis. A glossary of variable names was
constructed (Appendix G). The data from the Final follow-up visit was entered by
the data capturing service at UCT of which 20 percent (n = 55) was double entered.
Pesticides reported in the farmers’ questionnaire were classified into chemical
classes and groups. This was done for the baseline and all follow-up visits. The data
127

from the baseline study, the three follow-up visits (F1. F2, F3) using the quarterly
audits and the final visit were checked for inconsistencies and outliers and cleaned by
the study coordinator.
3.11 DATA ANALYSIS
3.11.1 Analysis of the baseline study
3.11.1.1 Exposure variables
The baseline study investigated the effect of long-term occupational exposure to
organophosphate pesticides on neurodevelopment amongst these emerging farmers.
The exposure variables for long-term past occupational pesticide exposure were
generated from the job history data in the farmer questionnaire in the baseline study
and was therefore based on the exposure obtained during the current job and the
preceding three jobs. From the trade names of pesticides reported by applicators,
active ingredients were categorised in chemical groups and classes. In instances
where a trade name had more than one active ingredient, each active ingredient was
categorised and allocated to its relevant chemical group and the number of days
applied calculated accordingly. The exposure variables generated included indices of
long-term cumulative exposure to all pesticides and organophosphates unweighted
and weighted for application method. These exposure variables were calculated as
follows:
(a) Unweighted long-term exposure variables
Each participant was interviewed about whether or not pesticides had been applied
for the past 3 jobs, including type, method, duration and frequency of pesticide
applications. The pesticides reported for each job was classified as into groups
(insecticides, herbicides, fungicides, fertilizers, leaf wetters and other agrichemicals
applied) and chemical classes (organophosphates, carbamates, pyrethroids and
‘unclassified’ for all instances where participants did not know and/or could not
remember names of pesticides. For each pesticide group and class, the total number
of days applying pesticides in the reported jobs was then determined. The number of
days applying pesticides for each job was the product of the number of years in that
job and the number of days per year reported each for mixing, hand or back-
spraying, tractor spraying with boom sprayer, tractor spraying with mistblower and
128

quadbike spraying. Cumulative exposure to all pesticides (B_Allpestdys) was the
sum of the number of days applying all pesticide groups in all reported jobs.
Similarly cumulative exposure to organophosphates (B_OPdys) was the sum of the
number of days applying organophosphate pesticides in all reported jobs. From each
of the two cumulative exposure indices which are continuous variables, a
dichotomous variable (applicator/non-applicator) was also generated for applicators
of all pesticides (B_ALLpestappl) and for applicators of OP pesticides (B_OPappl).
For the latter, unidentified pesticides which were classified as unclassified chemical
group and chemical class were not included as exposed days (pesticide days and
organophosphate days) but sensitivity analyses was conducted treating these as
exposed and also excluding them from the analyses.
(b) Long-term exposure variables weighted for job activity
Cumulative long-term exposure indices weighted for job activity (B_Allpestjmdys,
B_OPjmdys) were determined in the same way as for the unweighted indices but the
number of days was weighted for pesticide application method using the weightings
in the job-exposure matrix (JEM) developed by London and Myers (1998) for the
Western Cape. The weightings are shown in Table 3.2. Spraying with a quadbike,
which is not included in the JEM used by London and Myers (1998), was given a
weighting of 0.70 as it was considered similar to spraying with a tractor, a boom
sprayer or a tractor with mist blower.
Table 3.2 Weightings used in an agricultural Job Exposure Matrix (JEM)
Job task description Weighting
Mixing indoors 1.00
Mixing outdoors 0.80
Tractor spraying with mistblower 0.70
or boom sprayer
Backpack spraying 0.70
Quadbike spraying 0.70
129

Non-applicator duties were listed as general farm work which included harvesting of
fruit and vegetables, pruning, irrigation and other maintenance work in the orchards
and vineyards, gardening and dipping of cattle and sheep.
The exposure measures for all pesticides and OP pesticides are listed in Table 3.3.
The Shapiro-Wilks test showed that the different exposure variables were not
normally distributed (p<0.05) and log transformation did not normalise these
distributions. The implications for analysis are discussed in section 3.11.2.
(c) Diagnosed past poisoning
Diagnosed poisoning was determined by asking the participants whether they had (i)
become sick while applying pesticides after having applied pesticides; after having
inhaled pesticides or having had skin contact with pesticides such as pesticide spills
on any part of the body and (ii) had sought medical treatment from a health
professional. This variable was generated for all participants who had experienced
pesticide poisoning in their jobs in the past and was included in the baseline analysis
as an exposure variable to determine the association between diagnosed past
poisoning and neurobehavioural performance.
Table 3.3 Exposure variables for the baseline study
Exposure variable Type of variable Scoring
All pesticides exposure variables
1. Applicator (unweighted)
(B_ALLpestappl)
Categorical Applicator and non-applicator
Yes = 1 / No = 0
2. All unweighted
pesticide total exposure
days (B_Allpestdys)
Continuous Total number of all pesticides
exposure days
3. All pesticides jemdays
weighted by activity
(B_Allpestjmdys)
Continuous Number of pesticide days
weighted by activity
OP exposure variables
1. OPapplicator
(B_OPappl)
Categorical OP Applicator and non-
applicator
Yes = 1 / No = 0
2. All unweighted OP
pesticide total exposure
days (B_OPdys)
Continuous Total number of all OP
pesticides exposure days
130

3. All OP pesticides
jemdays weighted by
activity (B_OPjmdys)
Continuous Number of OP pesticide days
weighted by activity
Diagnosed past
poisoning
Categorical Diagnosed past poisoning
Yes = 1 / No = 0
3.11.1.2 Outcome variables
The outcome variables for the baseline and cohort studies are listed in Table 3.4.
Eleven continuous outcome variables were generated from the scores of the
neurobehavioural tests. Shapiro-Wilks tests showed that the distributions of the
outcome variables were not normally distributed (p<0.05). Medians, inter-quartile
range (IQR), means and standard deviations are reported.
In most instances log transformation of the neurobehavioural outcomes and vibration
sense threshold did not normalise the distribution. The outcome variables were then
dichotomised across the quartile demarcating good from poor performance (Table
3.5). For outcomes where higher scores indicate better performance (Digit Span,
Digit Symbol, Benton Visual Retention, Santa Ana Pegboard, Pursuit Aiming,
vibration sense threshold), scores falling within the lowest quartile (≥25th
) were used
to indicate poor neurobehavioural performance. Similarly, for outcomes where
higher scores indicated poorer performance (BSI, Q16), the upper 75th
percentile
score value was used to represent the lowest dichotomised score value since high
values on these two outcomes indicate poor performance. The BSI scores were
calculated by the two psychology graduates and checked by the study coordinator.
Table 3.4 Outcome variables and scoring
Neurobehavioural tests Score range
Digit Span forward 0.0 – 14.0
Digit Span backward 0.0 – 14.0
Digit Span total possible score 0.0 – 28.0
Digit Span WAIS-III 1.0 – 19.0
Benton Visual Retention Test 0.0 – 10.0
Digit Symbol Substitution Test 0.0 – 67.0
Digit Symbol WAIS-III 1.0 – 19.0
131

Santa Ana Pegboard (dominant hand) 0.0 – 48.0
Santa Ana Pegboard (non-dominant hand) 0.0 – 48.0
Pursuit Aiming II 0 – 750.0
The Brief Symptom Inventory (BSI) 0.0 – 212.0
The BSI Global Severity Index (GSI) Tscore ≥ 63 is a positive
case
The BSI Symptom Dimension Tscore ≥ 63 on any 2
dimensions is a
positive case
The Swedish Neuropsychiatric Questionnaire
(the Q16).
0.00 – 16.0
A score of ≥7
requires referral for
further investigation
Vibration Sense Threshold – 3 readings in
seconds
No fixed score
Table 3.5 Outcomes (25th
percentile) included in multivariate logistic regression
analysis
Dichotomized outcome 25th
Percentile
value
Coded
Digit Span forward 5 ≤ 5 = low performance
> 5 = high performance
Digit Span backward 2 ≤ 2 = low performance
> 2 = high performance
Digit Span
WAIS-III Std Score 6 ≤ 6 = low performance
> 6 = high performance
Digit Span
Log transformed score* 0.78 ≤ 0.78 = low performance
> 0.78 = high performance
Digit Symbol
WAIS-III Std Score 5 ≤ 5 = low performance
> 5 = high performance
Digit Symbol
Log transformed score* 0.70 ≤ 0.70 = low performance
> 0.70 = high performance
Benton Visual Retention
Test - Number Correct 4 ≤4 = low performance
>4 = high performance
Santa Ana Pegboard
Dom. hand total 31 ≤31 = low performance
>31 = high performance
Santa Ana Pegboard
Non-dom. hand total 30 ≤30 = low performance
>30 = high performance
132

Pursuit Aiming II Test
Total correct 39 ≤39 = low performance
>39 = high performance
Brief Symptom Inventory
GSI 60 ≥60 = low performance
<60 = high performance
Brief Symptom Inventory
Log transformed score* 1.78 ≥1.78 = low performance
<1.78 = high performance
Swedish Q16
6 ≥6 = low performance
<6 = high performance
Vibration Sense threshold
9.5 ≤9.5 = low performance
>9.5 = high performance
Vibration Sense threshold
Log transformed score* 0.98 ≤0.98 = low performance
>0.98 = high performance
3.11.2 Statistical analysis of the baseline study
Statistical analyses were conducted using STATA 10 (Stata Corporation. 2007).
Univariate graphs and summary statistics were used to describe characteristics of the
study, to assess the need for possible transformations and to identify possible
outliers. Log transformation of non-normally distributed data did not improve
normality in all cases or change associations and therefore untransformed data are
presented for the univariates. Bivariate analyses were then used to explore
relationships between each potential predictor and the outcome(s) of interest in order
to identify possible confounders and factors to be included in multivariate modelling.
The Shapiro-Wilks test (p < 0.05) showed that the continuous exposure variables for
all pesticides (total exposure days) were not normally distributed.
Tests used in bivariate analysis for two continuous variables included Pearson
correlation coefficient (for normally distributed data) or ranksum correlations (for
data not normally distributed) and t-tests (for normally distributed data) to compare
differences in means across groups. Wilcoxon rank sum tests (for data not normally
distributed) were used to compare the differences in medians across groups.
Potential confounders for neurobehavioural outcomes in the literature include
gender, age, education, language, smoking, psychiatric illness, current alcohol
133

consumption, the CAGE score (Claassen, 1999; Steinweg & Worth, 1993) and
Marijuana (Cannabis) use (Cole et al., 1997; Farahat et al., 2003; London et al.,
1998; London, 2011; Nell, 2000; Roldan-Tapia, Parron & Sanchez-Santed, 2005;
Smit, van-Wendel-de-Joode, Heerderik, Peiris-John & van der Hoek, 2003; Starke et
al., 2012) and previous head injury. Schooling (education) was coded from 1 for less
than one year of schooling to 13 indicating completion of senior school
(matriculation). Low socioeconomic status and height have also been known to
influence the results of vibration sense (London, Nell, Thompson & Myers, 1998;
London et al., 2000). All these confounders were measured in the study.
Confounders included in multivariate models were selected on an a priori basis or
those identified following bivariate testing, if p <0.1 and these are shown in Table
3.6. All a priori selected covariates were included in subsequent model building.
Firstly, a baseline binary model with the lowest Aikaikis Information Criterion (AIC)
statistic was determined including the outcome and the potential covariate. Other
covariates were then added to the baseline model and the best model selected being a
combination of variables (containing one outcome and significant covariate(s)) with
the lowest AIC.
Forward and Backward Stepwise regression procedures were also conducted and
results compared to the results of model building to identify statistically significant
covariates. A priori covariates (age, schooling, gender) that were not significantly
associated with some of the outcomes in bivariate analyses, in model building and
stepwise regression procedures were then forced into the regression models. For
example, age was not significantly associated with the Brief Symptom Inventory
(BSI), the Q16 and vibration sense; schooling was not significantly associated with
the BSI and vibration sense and gender was not significantly associated with Digit
Span, Benton Visual Retention, Santa Ana and the BSI. A known covariate for
neurobehavioural performance is current alcohol use which was also not significantly
associated with 9 of the 11 outcomes but was included in the set of a priori
covariates. Thus, a priori covariates that were forced into all regression models
include age, gender, schooling, current alcohol use, psychiatric illness, previous head
134

injury and low socio economic status. Model building showed that language was
significantly associated with Digit Symbol, the Benton Visual Retention test, Santa
Ana non-dominant hand and the Q16 and was included in regression models with the
a priori covariates. Exposure variables were then added to the model one by one to
test for exposure-outcome relationships.
Multiple logistic regression analyses were used to test exposure-outcome
relationships for dichotomous outcomes using the same covariates as for the
continuous outcomes. Regression diagnostics were applied to determine the
goodness of fit for the model and to assess for influential points and outliers.
Sensitivity analyses were also conducted by including those participants who could
not identify or remember pesticides in the analyses as (1) OP applicators and then (2)
as non-OP applicators and finally (3) as missing data. However this procedure did
not produce different results. Results were also stratified by current alcohol use to
determine the effect of alcohol use in the multivariate models.
Since outcomes were not normally distributed, nor could they be converted to
normality, linear regression analyses were not used. Associations between
neurobehavioural outcomes and exposure were investigated further by dichotomizing
outcomes and using logistic regression analyses.
Outcomes (Digit Span, Digit Symbol, Benton Visual Retention Test, Santa Ana
Pegboard, Pursuit Aiming and vibration sense threshold) where higher scores
indicated better performance were dichotomized at the 25th
percentile with those
lower than this centile indicating poor performance while those where higher scores
indicated poorer performance (Brief Symptom Inventory, Swedish Q16) outcomes
were dichotomized at the 75th
percentiles with those higher than this centile
indicating poor performance (Table 3.5).
135

For multiple linear regression analysis, collinearity was identified if correlation was
greater than 0.9 (> 0.9) or if a variance inflation factor (VIF) was greater than 10 (>
10), and the effect of outliers/influential points, identified by DFBETAs was greater
than 1 (>1), if Cook’s Distance was greater than 0.5 (D >0.5) or if the Student
residuals were greater than 2.5 (>2.5). Regression diagnostics were applied to
Table 3.6 Covariates included in multivariate logistic regression analyses
Covariate Type of variable Coded
Low age Categorical 1 = low age (below the median
0 = high age (above the median)
Low education Categorical 1 = low education (below the
median
0 = high education (above the
median)
Gender Categorical 1 = male
0 = female
Language Categorical 1 = speaks Afrikaans
0 = does not speak Afrikaans
Alcohol consumption
(Current use)
Categorical 1 = current alcohol consumption
0 = does not use alcohol
Previous head injury Categorical 1 = previous head injury
0 = no previous head injury
Psychiatric illness Categorical 1 = psychiatric illness
0 = no psychiatric illness
Socio-economic status
(SES)
Categorical 1 = low SES (<4 items)
0 = high SES (≥4 items)
determine the goodness of fit for multiple logistic regression models. Outliers and
influential points were identified if standardized residuals were greater than 2 (> 2)
or less than 2 (< −2) or if leverage patterns were noticeably far from the average
covariate pattern. Removing outliers did not improve models and were thus left in
the models.
136

3.12 THE COHORT STUDY
3.12.1 Outcome: change in performance over time (Difference variables)
In contrast to the baseline study, the focus of the cohort study was to assess change in
neurobehavioural performance over time of follow-up. The data from the final
follow-up study was captured and entered on computer using the same format as
reported for the baseline study. The absolute outcome scores from the final follow-up
visit were calculated as well as the difference in score from baseline. The difference
scores were generated by subtracting the baseline scores from the final follow-up
scores to produce absolute difference scores. A percentage difference score was also
generated by dividing the final score by the baseline score and multiplying the result
by 100 to produce the percentage by which the participant’s score had increased,
decreased or if the score remained unchanged. These are further explained below.
3.12.2 Cohort outcome variables
Difference outcome variables were generated from the difference in scores between
the baseline and final follow-up visit for each participant. Three difference outcome
models were generated to show the difference between the final follow-up and the
baseline outcome scores in the following manner:
1. Absolute difference in outcome score between baseline and final follow-up
(final - baseline)
A variable showing the absolute difference in score was generated by subtracting the
baseline score from the final follow-up score to produce the absolute difference
between the baseline and final follow-up and thus indicate whether the participant’s
performance had improved, deteriorated or remained unchanged. For example if the
participant had score 8 at baseline and 6 at final follow-up, the equation would be (6-
8) = -2 producing a negative result and indicates a decrease in the participant’s
follow-up score by 2 points.
(final – baseline)
137

The absolute difference score shows the status of neurobehavioural performance
between baseline and final follow-up and thus whether the participant performed
better, worse or whether there was no change in performance.
2. Relative difference showing percentage increase or decrease from baseline –
((final – baseline)/baseline x 100)
A second set of relative difference variables were generated for the outcome scores
showing a relative change in percentage between final follow-up and baseline scores.
For this difference variable the baseline score was deducted from the final score and
the result divided by the baseline and multiplied by 100 to produce a percentage
change from baseline i.e. the percentage shown at final follow-up is the percentage
by which the participant’s score had either increased, decreased or remained
unchanged. For example if the participant had score 8 at baseline and 6 at Final
follow-up, the equation would be (6-8)/8 x 100 = -25% which would indicate a
decrease in the participant’s performance at final follow-up by 25%.
(final - baseline)/Baseline x 100
3. Ratio score showing final follow-up performance expressed as a percentage of
baseline performance – ((final/baseline) x 100)
A third set of percentage difference variables were generated for the outcome scores
which show the participant’s ratio score expressed as a percentage of the baseline
score at final follow-up. For the ratio score the final score was divided by the
baseline score and the result multiplied by 100 to produce a ratio score of the
participant’s baseline score. Instead of showing negative values, the ratio score
expressed as a percentage will be positive and will either be equal to 100 which
would indicate no change between baseline and final follow-up score; if the ratio
score is less than 100 it would indicate that the participant’s performance had
declined over time; however if the ratio score is greater than 100 it would indicate
that the participant’s performance had improved over time. For example if the
participant had a score of 8 at baseline and a score of 6 at final follow-up, the
equation would be (6/8) x 100 = 75% which would indicate that the participant’s
138

score at final follow-up is 75% of his/her baseline score which indicates a 25%
decline in the participant’s performance over time since the score is less than 100.
(final/baseline) x 100
Since continuous outcomes were not normally distributed, associations between
neurobehavioural outcomes and exposure were investigated further by dichotomizing
outcomes and using logistic regression analyses. Outcomes (Digit Span, Digit
Symbol, Benton Visual Retention Test, Santa Ana Pegboard, Pursuit Aiming and
vibration sense threshold) where higher scores indicated better performance were
dichotomized at the 25th
percentile with those lower than this centile indicating poor
performance while those where higher scores indicated poorer performance (Brief
Symptom Inventory, Swedish Q16) outcomes were dichotomized at the 75th
percentiles with those higher than this centile indicating poor performance (Table
3.7).
For the cohort study, a ratio score was calculated for each of the difference outcome
variables using the method described in sub-section 3 of section 3.12.2. Summary
statistics produced quartiles for each outcome and the 25th
centile value was used for
outcomes where higher values indicate better performance to show poorer
performance. For those outcomes where higher values indicated poorer performance,
the 75th
centile value was used to indicate poorer performance.
The outcome of interest for the cohort study was whether OP pesticide exposed
participants’ neurobehavioral outcome scores fell into the lowest 25th
percentile
which would indicate worse performance over time when compared to those not
exposed to OP pesticides.
3.12.3 Cohort exposure variables
The cohort study investigated the effect of long-term occupational exposure to
organophosphate pesticides on neurobehavioural performance amongst emerging
farmers over a twelve month period. The exposure variables for long-term past
139
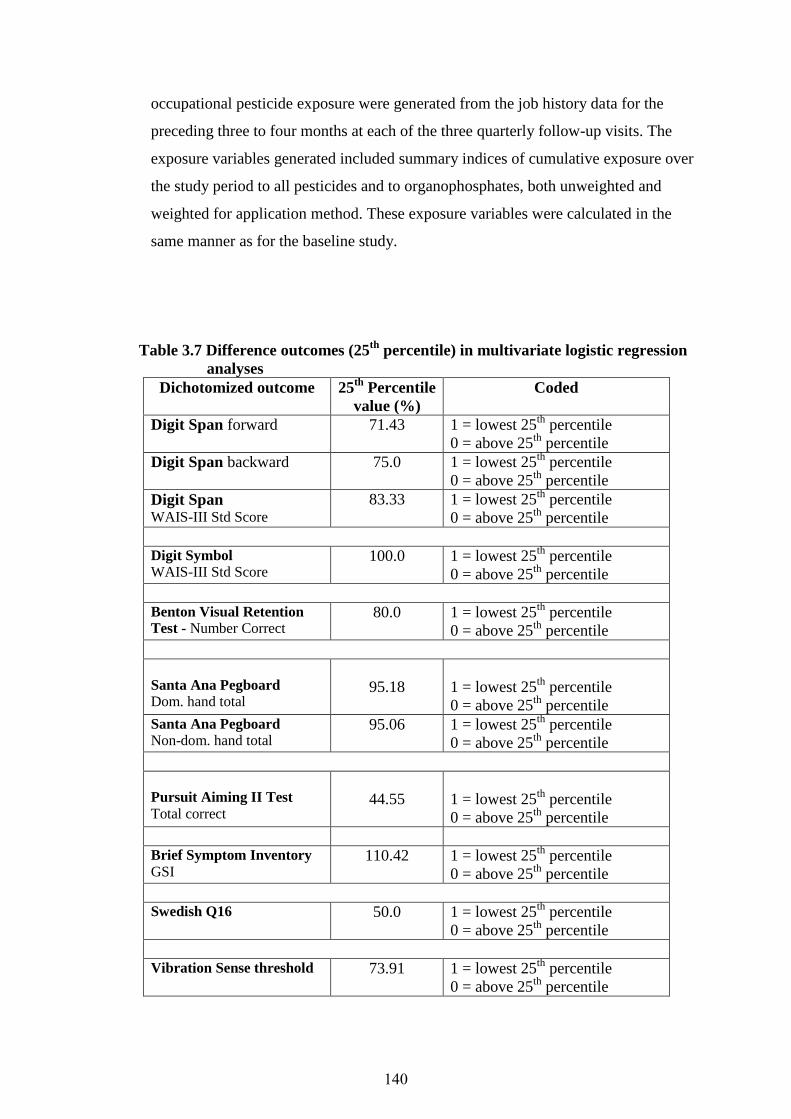
occupational pesticide exposure were generated from the job history data for the
preceding three to four months at each of the three quarterly follow-up visits. The
exposure variables generated included summary indices of cumulative exposure over
the study period to all pesticides and to organophosphates, both unweighted and
weighted for application method. These exposure variables were calculated in the
same manner as for the baseline study.
Table 3.7 Difference outcomes (25th
percentile) in multivariate logistic regression
analyses
Dichotomized outcome 25th
Percentile
value (%)
Coded
Digit Span forward 71.43 1 = lowest 25th
percentile
0 = above 25th
percentile
Digit Span backward 75.0 1 = lowest 25th
percentile
0 = above 25th
percentile
Digit Span
WAIS-III Std Score 83.33 1 = lowest 25
th percentile
0 = above 25th
percentile
Digit Symbol
WAIS-III Std Score 100.0 1 = lowest 25
th percentile
0 = above 25th
percentile
Benton Visual Retention
Test - Number Correct 80.0 1 = lowest 25
th percentile
0 = above 25th
percentile
Santa Ana Pegboard
Dom. hand total
95.18
1 = lowest 25th
percentile
0 = above 25th
percentile
Santa Ana Pegboard
Non-dom. hand total 95.06 1 = lowest 25
th percentile
0 = above 25th
percentile
Pursuit Aiming II Test
Total correct
44.55
1 = lowest 25th
percentile
0 = above 25th
percentile
Brief Symptom Inventory
GSI 110.42 1 = lowest 25
th percentile
0 = above 25th
percentile
Swedish Q16
50.0 1 = lowest 25
th percentile
0 = above 25th
percentile
Vibration Sense threshold
73.91 1 = lowest 25
th percentile
0 = above 25th
percentile
140

(a) Unweighted long-term exposure variables
The unweighted long-term exposure variables were derived in the same manner for
the cross-sectional and cohort studies and are repeated briefly for clarity. Each
participant was interviewed using a quarterly audit checklist about whether pesticides
had been applied for the past three to four months, including type, method, duration
and frequency of pesticide applications. The pesticides reported for each job during
the previous three to four months were classified into chemical groups (insecticides,
herbicides, fungicides, fertilizers, leaf wetters and other agrichemicals applied) and
chemical classes (organophosphates, carbamates, pyrethroids and ‘unclassified’ for
all instances where participants did not know and/or could not remember names of
pesticides. For each pesticide group and class, the total number of days applying
pesticides in the reported follow-up visits was then determined. The number of days
applying pesticides for each follow-up visit was the product of the number of 8 hour
days in that job for the three to four months each for mixing, hand or back-spraying,
tractor spraying with boom sprayer, tractor spraying with mistblower and quad bike
spraying.
Cumulative exposure to all pesticides (Allpestdys) was the sum of the number of
days applying all pesticide groups in all three follow-up visits (F1, F2, F3). Similarly
cumulative exposure to organophosphates (AllOPdys) was the sum of the number of
days applying organophosphate pesticides in all three follow-up visits but excluding
exposure information from the baseline visit and the past three jobs. From each of the
two cumulative exposure indices which are continuous variables, a dichotomous
variable (applicator/non-applicator) was also generated for applicators of all
pesticides (ALLpestappl) and applicators of OP pesticides (AllOPappl). For the
latter, unidentified pesticides which were classified as unclassified chemical group
and chemical class were not included as exposed days (pesticide days and
organophosphate days) but sensitivity analyses was conducted treating these days as
exposed and also excluding them from the analyses.
(b) Long-term exposure variables weighted for job activity
Cumulative long-term exposure indices weighted for job activity (Allpestjmdys,
AllOPjmdys) were determined in the same way as for the unweighted indices but the
141

number of days was weighted for pesticide application method using the weightings
in the job-exposure matrix (JEM) developed by London and Myers (1998) for the
Western Cape (see Table 3.2 for weightings used). Again, spraying with a quadbike,
which is not included in the JEM used by London and Myers (1998), was given a
weighting of 0.70 as it was considered similar to spraying with a tractor, a boom
sprayer or a tractor with mist blower.
Non-applicator duties were listed as general farm work which included harvesting of
fruit and vegetables, pruning, irrigation and other maintenance work in the orchards
and vineyards, gardening and dipping of cattle and sheep.
(c) Diagnosed recent poisoning
Participants who had experienced pesticide poisoning in their jobs during the study
period and had sought medical attention as a result were included in the cohort
analysis. The variable, ‘recent diagnosed poisoning’ was used in the cohort analysis
as an exposure variable to determine the association between diagnosed past
poisoning and change in neurobehavioural performance.
Table 3.8 shows a list of all the exposure variables generated from all the follow-up
visits (F1, F2 & F3) for the cohort analyses.
Table 3.8 Cohort weighted and unweighted exposure variables
OP exposure variables
AllOPappl
Categorical
OP Applicator and non-
applicator at F1, F2 & F3
Yes = 1 / No = 0
All unweighted OP
pesticide total exposure
days (AllOPdys)
Continuous Total number of all OP
pesticides exposure days
at F1, F2 & F3
All OP pesticides
jemdays weighted by
activity (AllOPjmdys)
Continuous Number of OP pesticide days
weighted by activity
at F1, F2 & F3
Recent diagnosed
poisoning
Categorical Yes = 1 / No = 0
142

In order to generate interpretable Odds Ratios (ORs) and to investigate a possible
dose-response relationship, a dose-response analysis was explored. An exposure
variable was created for each exposure level with dummy variables for the other
three levels using quartile values of the baseline study OP jemdays. Quartile values
were used by summing the continuous exposure variable for the baseline OPjemdays.
Each of the exposure levels was coded ‘1’, ‘2’, ‘3’ and ‘4’ respectively for the
multivariate logistic regression in the baseline study. The lowest quartile was coded
‘1’ and the highest quartile level was coded ‘4’ (Table 3.9).
Table 3.9 Baseline exposure variables used to calculate cumulative exposure
Exposure
variables
Quartile
values in 8
hour days
Variable name Coded
All non-
applicators with
no exposure
values (n=249)
0
-
-
OP jemdays
up to and
including the 25th
quartile (n=19)
2.6 - 31.5 B_OPjmdys_1 1= OP applicator in
1st quartile
OP jemdays
between the 25th
and 50th
quartile
(n=16)
38.5 - 211.9 B_OPjmdys_2 2= OP applicator in
2nd
quartile
OP jemdays
between the 50th
and 75th
quartile
(n=17)
215.6 - 667.4 B_OPjmdys_3 3= OP applicator in
3rd quartile
OP jemdays
equal to and
greater than the
75th
quartile
(n=18)
696.3 - 2058.7 B_OPjmdys_4 4= OP applicator in
4th quartile
However, this approach could not be used in the cohort study since there were only
33 OP applicators and four levels of exposure could not be supported in analysis.
This necessitated dichotomising exposure variables for OP jemdays. For the cohort
143

study a cut off value was used by summing the continuous exposure variable for
OPjemdays and using the median of the distribution to generate two exposure
variables: one variable for exposure values up to and including the median and one
variable for the values above the median. The exposure variable including values up
to the median was coded ‘1’ and the exposure variable above the median was coded
‘2’ (Table 3.10).
One exposure variable was included in the regression models which produced
estimates for all levels in the baseline (4) and cohort (2) studies.
Table 3.10 Cohort exposure variables used to calculate cumulative exposure
Exposure
variables
Median
values in 8
hour days
Variable name Coded
All non-
applicators with
no exposure
values (n=244)
0
-
-
AllOP jemdays
up to and
including the
median (n=17)
.0875 – 9.1 All_OPjmdum_1 1= Values up to
the median
AllOP jemdays
above the median
(n=16)
10.53 – 59.68 All_OPjmdum_2 2= Values above
the median
3.13 VARIABLES INCLUDED IN MULTIVARIATE MODELS
Bivariate and multivariate analyses were performed for all the relevant variables
selected for the data from the baseline visit and the final follow-up visit to determine
significant associations between outcomes, confounders and exposure variables. A
priori confounders were included in multivariate linear regression analyses and
statistically significant confounders (p<0.10) were included in the final multivariate
logistic regression analyses. The confounders that were selected for inclusion in the
multivariate logistic regression models included age, schooling (education), gender,
previous head injury, alcohol use, psychiatric illness (BSI, Swedish Q16) and low
144

socio-economic status. The covariate ‘language’ was included with the other
covariates in regression models for Digit Symbol, Benton Visual Retention, Santa
Ana non-dominant hand and the Q16.
3.14 STATISTICAL ANALYSIS
Statistical analyses were conducted using STATA 10 (Stata Corporation. 2007).
Univariate, bivariate and multivariate analyses were performed for all the relevant
variables selected for the data from the baseline visit and the final follow-up visit to
determine associations between outcomes, covariates and exposure variables.
Univariate and bivariate analyses were conducted for all follow-up visits to
determine relationships between exposure variables and covariates. The same
approach to model building as for the baseline study in section 3.11.3 above was
followed to identify significant associations between outcomes and covariates for the
cohort study.
A priori selected covariates (gender, age, education, language, current alcohol
consumption, psychiatric illness, head injury and low socio-economic status) and
other covariates selected in bivariate analyses between outcomes and confounders
were included in the multivariate analysis. Multiple linear regression analysis was
used to explore relationships between continuous outcomes, confounders and
exposure to (i) all pesticides and (ii) organophosphate pesticides. The difference
outcome variables were regressed with covariates and exposure variables. This was
done for (i) all pesticides and (ii) for organophosphates (OPs) only as listed below:
for all pesticides – all applicators versus non-applicator
for all pesticides – total exposure days
for all pesticides – jemdays (weighted by activity)
for only OP pesticides – all applicators versus non-applicator
for only OP pesticides – total exposure days
for only OP pesticides – jemdays (weighted by activity)
145

3.14.1 Statistical power
Sample size calculations based on means and variances sourced from studies (Table
3.11) where neurobehavioural tests had been conducted among potato, cotton and
fruit farmers who had been exposed to pesticides (Cole et al., 1997; Farahat et al.,
2003; London et al., 2005 (Heed Pilot study); Kamel et al., 2003; London et al.,
1997; Srivastava et al., 2000) suggested that for most neurobehavioural outcomes a
sample of between 160 and 350 is adequate to identify anticipated differences based
on an alpha of (α) p=0.05 and power of β = 0.8.
A sample size of 350 respondents was planned. Several farms and a few individual
respondents withdrew from the programme for various reasons resulting in a total
sample of 319 farmers.
Table 3.11 Sample size calculation
Reference
Study
Exposed
group mean
(SD)
Non-exposed
group mean
(SD)
Based on
comparing
cumulative
exposure: 50%
prevalence
(cumulative
exposure cut off
at median
(1:1)
Based on
comparing
acute episodic
exposures
over 12
months: 10%
incidence
(1:9)
Digit
Span
Cole et al.,
1997
6.8 (2.0) 7.5 (2.4) 314
(157 + 157)
Total N = 314
75 (n1)
675 (n2)
750
Kamel et al.,
2003
4.74 (0.99) 5.63 (1.02) 42
(21 + 21)
Total N = 42
11 (n1)
99 (n2)
110
London et al.,
1997
4.8 (1.0) 5.2 (1.0) 198
(99 + 99)
Total N = 198
55 (n1)
495 (n2)
550
London et al.,
2005 (Heed
pilot study)
8.7 (3.05) 7.00 (3.07) 244
(122 + 122)
Total N = 244
29 (n1)
261 (n2)
290
Digit
Symbol
Srivasta et al.,
2000
51.0 (10.9) 62.4 (13.7) 38
(19 + 19)
Total N = 38
9 (n1)
81(n2)
90
London et al.,
2005 (Heed
pilot study)
17.5 (9.1) 13.4 (9.1) 156
(78 + 78)
Total N = 156
43 (n1)
387 (n2)
430
London et al.,
1997
25.3 (10.4) 20.9 (9.5) 162
(81 +81)
Total N = 162
48 (n1)
432 (n2)
480
Cole et al.,
1997
25.0 (12.4) 22.3 (7.5) 454
(227 + 227)
Total N = 454
196 (n1)
392 (n2)
588
146

Santa
Ana
Kamel et al.,
2003
18 (3.49) 19.9 (3.04) 94
(47 + 47)
Total N = 94
37 (n1)
74 (n2)
111
London et al.,
1997
38.5 (6.9) 35.9 (7.7) 250
(125 + 125)
Total N = 250
90 (n1)
180 (n2)
270
London et al.,
2005 (Heed
pilot study)
36 (8.7)
31 (9.3)
102
(51 + 51)
Total N = 102
38 (n1)
76 (n2)
114
Benton
Visual
Cole et al.,
1997
8.7 (2.7) 9.8 (2.2) 158
(79 +79)
Total N = 158
63 (n1)
126 (n2)
189
Benton
Visual
London et al.,
1997
6.9 (2.0)
6.1 (2.1)
208
(104 +104)
Total N = 208
77 (n1)
154 (n2)
231
Benton
Visual
London et al.,
2005 (Heed
pilot study)
5.35 (2.58) 4.62 (1.70) 282
(141 +141)
Total N = 282
120 (n1)
240 (n2)
360
3.15 ETHICS
Ethical approval (REC REF 477/2007) for the study was obtained from the Research
Ethics Committee, Health Sciences Faculty of the University of Cape Town.
A thorough explanation about the purpose of the study and methods of the tests was
provided to all participants in Afrikaans which is the language predominantly spoken
in these districts and in Xhosa for the few Xhosa participants. In addition, each
participant was provided with a study information sheet that explained the purpose or
the study (Appendix A). Participants were recruited on the basis of individual
written informed consent, consistent with the requirements of the Helsinki
Declaration and the Medical Research Council of South Africa guidelines (World
Medical Association (WMA), 2000; South African Medical Research Council
(MRC), 1993). Signed consent was provided by farmers who were literate and who
agreed to participate in the study (Appendix B). For those farmers who were semi-
literate signed consent was provided by adult family members of their choice.
Participants were assured on every follow-up visit that the information they provided
would be anonymous and confidential.
The benefits of attending all testing sessions throughout the year were explained in
the consent form (Appendix B) and were also explained verbally to participants as a
147

group and individually before interviews and neurobehavioural testing. Two attempts
were made to contact participants who defaulted on follow-up sessions and those
who were absent on two consecutive times were excluded from the study.
Participating participants were provided with refreshments at the field interview and
assessment site. Training on safety with materials developed by the Occupational
and Environmental Health Research Unit were provided to groups of participants as
a form of collective compensation. Identified persons with untreated injury, affective
disorders or neuropsychological disorders such as depression were referred to local
health care providers. The intended year long exposure matrix based on repeated
cholinesterase (CHE) measurements for each participant was derailed as a result of
the laboratory delay in analysing the specimens.
148

3.16 REFERENCES
Anger, W. K. (2003). Neurobehavioral tests and systems to assess neurotoxic
exposures in the workplace and community. Occupational and Environmental
Medicine, 60, 531-538.
Anger, W. K., Sizemore, O. J., Grossmann, S., Glasser, J., Letz, R. & Bowler, R.
(1997). Human neurobehavioral research methods: impact of subject variables,
Environmental Research, 73, 18-41.
Axelson, O. & Hogstedt, C. (1988). On the health effects of solvents. In C. Zenz
(Ed.) Occupational medicine, pp. 775-84. Chicago: Year Book Medical
Publishing.
Benke, G., Sim, M., Fritschi, L., Aldred, G., Forbes, A. & Kauppinen, T. (2001).
Comparison of occupational exposure using three different methods: Hygiene
Panel, Job Exposure Matrix (JEM), and Self Reports. Applied Occupational and
Environmental Hygiene, 16(1), 84-91.
Bernhardt, M. W., Mumford, J., Taylor, C., Smith, B. (1982). Comparison of
questionnaire and laboratory tests in the detection of excessive drinking and
alcoholism. Lancet 1 (8267), 325 – 328.
Claassen, J. N. (1999). The benefits of the CAGE as a screening tool for alcoholism
in a closed rural South African community. South African Medical Journal,
89(9), 976-979.
Cole, D. C., Carpio, F., Julian, J., Leon, N., Carbotte, R. & De Almeida, H. (1997).
Neurobehavioral outcomes among farm and nonfarm rural Ecuadorians.
NeuroToxicology and Teratology, 19(4), 277 – 286.
Cole, D. C, Carpio, F., Julian, J. & Léon, N. (1998). Assessment of peripheral nerve
function in an Ecuadorian rural population exposed to pesticides. Journal of
Toxicology & Environmental Health A, 55(2), 77-91.
149

Colvin, M., Myers, J. E., Nell, V. N., Rees, D. & Cronje, R. (1993). A cross-sectional
survey of neurobehavioral effects of chronic solvent exposure on workers in a paint
manufacturing plant. Environmental Research, 63, 122-132.
Dalvie, M. A. (2002). The reproductive health effects of long term DDT exposure
on malaria vector control workers in Northern Province, South Africa.
Unpublished Doctoral Dissertation. South Africa, University of Cape Town.
Dalvie, M. A., Africa, A., Solomons, A., London, L., Brouwer, D. & Kromhout, H.
(2009). Pesticide exposure and blood endosulfan levels after first season spray
amongst farm workers in the Western Cape, South Africa. Journal of
Environmental Science & Health Part B: Pesticides, Food Contaminants, and
Agricultural Wastes, 44(3), 271-277.
Dalvie, M. A. & London, L. (2012, March). Neurotoxic effects of pesticide exposure
amongst women from the rural Western Cape of South Africa. Paper presented at
the 12th
International Symposium on neurobehavioral methods & effects in
occupational & environmental health, Cape Town, South Africa.
Dalvie, M. A., White, N, Raine, R., Myers, J. E., London, L., Thompson, M. &
Christiani, D. C. (1999). Long-term respiratory health effects of the herbicide,
paraquat, among workers in the Western Cape. Occupational and Environmental
Medicine, 56(6), 391-396.
Department of Agriculture, Forestry and Fisheries (DAFF), (2011). Annual report
2009/10. Retrieved from:
http://www.nda.agric.za/docs/AnnualReports/2009_10/AR2010.pdf
Derogatis, L. R. & Melisaratos, N. (1983). The Brief Symptom Inventory: An
introductory report, Psychological Medicine, 13, 595-605.
Derogatis, L.R. (1993). Brief Symptom Inventory (BSI). Administration, Scoring,
and Procedures Manual. United States of America: National Computer Systems,
Inc.
150

Farahat, T. M., Abdelrasoul, G. M. Amr, M. M., Shebl, M. M., Farahat, F. M. &
Anger, W. K. (2003). Neurobehavioral effects among workers occupationally
exposed to Organophosphate pesticides. Occupational Environmental Medicine,
60, 279-286.
Garcia, A. M., Gonzalez-Galarzo, M.C., Kauppinen, T., Delclos, G. L. & Benavides,
F. G. (2013). A Job-Exposure Matrix for research and surveillance of
occupational health and safety in Spanish workers: MatEmESp. American
Journal of Industrial Medicine. Retrieved July 3, 2013, from Web site:
http://www.ncbi.nlm.nih.gov/pmc/articles
Holtman, Z. & London, L. (2006). Neurobehavioural effects of pesticide exposure
amongst emergent farmers in Mpumalanga. Poster presentation to the 3rd
Public
Health Association of South Africa conference. Making the Health System
Work. 16 and 17 May 2006.
Human Sciences Research Council (HSRC). (2001). A standardisation of the WAIS-
III for English-speaking South Africans. Pretoria: Human Sciences Research
Council.
Ihrig, A., Triebig, G., & Dietz, M .C. (2001). Evaluation of a modified German
version of the Q16 questionnaire for neurotoxic symptoms in workers exposed to
solvents. Occupational Environmental Medicine, 58, 19-23.
Johnson, B. L., Baker, E. L. & Batawi, M. (Eds) (1987). Prevention of neurotoxic
illness in working populations. New York: John Wiley & Sons.
Johnson, B. L. (1997). The Triennial International Symposium on Neurobehavioral
Methods: The History and Hope. Environmental Research, 73, 2-8.
Jamal, G. A., 1997. Neurological syndromes of organophosphorus compounds.
Adverse Drug Reaction Toxicological Reviews, 16,133-170.
151

Kamel, F., Rowland, A.S., Park, L. P., Anger, W. K. Baird, D. D., Gladen, B. C.,
Moreno, T., Stallone, L. & Sandler, D. P. (2003). Neurobehavioral Performance
and work Experience in Florida Farmworkers. Environmental Medicine, 111(14),
1765-1772.
Kootbodien T. (2011). The association of depression, impulsivity and suicidal
ideation with organophosphate pesticide exposure amongst South African farm
workers. Unpublished MPH thesis. University of Cape Town, Cape Town, South
Africa.
London, L. (2011). Human rights and health: opportunities to advance rural
occupational health. International Journal of Occupational Environmental
Health, 17, 80-92.
London, L. & Myers, J. E. (1995). General patterns of agrichemical usage in the
Southern Region of South Africa. South African Journal of Science, 91, 509-514.
London, L. & Myers, J. E. (1998). Use of a crop and job specific exposure matrix for
retrospective assessment of long term exposure in studies of chronic neurotoxic
effects of agrichemicals. Occupational and Environmental Medicine, 55, 1-8.
London, L., Ngowi, A. V. N., Perry, M., Rother, H. A., Cairncross, E., Solomon, A.,
Du Toit, A,, Hall, R.& Ajayi, O. (2005). Health and Economic Consequences of
Pesticide Use: The experience of the Health, Environment and Economic
Development (HEED) programme on pesticides in Southern Africa.
Epidemiology 16: S29.
London, L., Thompson, M. L., Sacks, S., Fuller, B., Bachmann, O. M. & Myers, J. E.
(1995). Repeatability and validity of a field kit for estimation of cholinesterase in
whole blood. Occupational and Environmental Medicine, 52, 57-64.
152

London, L., Myers, J. E., Nell, V., Taylor, T. R., & Thompson, M. L. (1997). An
investigation into neurologic and neurobehavioural effects of long-term
agrochemical use among deciduous fruit farm workers in the Western Cape, South
Africa. Environmental Research, 73 (1-2), 132-145.
London, L., Nell, V., Thompson, M. L., Myers, J. E. (1998). Effects of long-term
organophosphate exposure on neurologic symptoms, vibration sense and tremor
among South African farm workers. Scandinavian Journal of Work And
Environmental Health, 24, 18-29.
London, L., Thompson, M. L., Capper, W. & Myers, J. E. (2000). Utility of
Vibration Sense Testing for use in Developing Countries: Comparison of
Extinction Time on the tuning fork to Vibration Thresholds on the Vibratron II.
NeuroToxicology, 21(5), 743-752.
Lundberg, I., Högberg, M., Michélsen, H., Nise, G. & Hogstedt, C. (1997).
Evaluation of the Q16 questionnaire on neurotoxic symptoms and a review of its
use. Occupational and Environmental Medicine, 54, 343-350.
Mackenzie Ross, S. J., Brewin, C. R., Curran, H. V., Furlong, C. E., Abraham-Smith,
K. M. & Harrison, V. (2010). Neuropsychological and psychiatric functioning in
sheep farmers exposed to low levels of organophosphate
pesticides. Neurotoxicology & Teratology, 32(4), 452-459.
Maizlish, N., Schenker, M., Weisskopf, C., Seiber, J. & Samuels, S. (1987). A
behavioral evaluation of pest control workers with short-term, low-level exposure
to the organophosphate diazinon. American Journal of Industrial Medicine, 12,
153-172.
Major, V. J. (2010). The role of organophosphate exposure in the aetiology of
depression and suicidality amongst farm workers on wine and table grape farms in
the Worcester area of the Western Cape Province, South Africa. Unpublished
Masters Dissertation. South Africa, University of Cape Town.
153

Mayfield, D. G., McCleod, G. & Hall. P. (1974). The CAGE questionnaire:
validation of a new alcoholism screening instrument. American Journal of
Psychology, 131, 1121-1123.
Misra, U., Nag, D., Bushan, V. & Ray, P. K. (1985). Clinical and biochemical
changes in chronically exposed organophosphate workers. Toxicology Letters 24,
187-193.
Monge, P., Wesseling, C., Engel, L., Keifer, M., Zuurbier, M., Rojas, M. & Partanen,
T. (2004). An icon-based interview for the assessment of occupational pesticide
exposure in a case-control study of childhood leukemia. International Journal of
Environmental Health, 10, 72-78.
Myers, J. E, Nell, V., Colvin, M., Rees, D. & Thompson, M. L. (1999).
Neuropsychological function in solvent-exposed South African paint makers.
Journal of Occupational & Environmental Medicine, 41(11), 1011-1018.
Nell, V. (2000). Cross-Cultural Neuropsychological Assessment. Theory and
Practice. London: Lawrence Erlbaum Associates, Publishers.
Nell, V., & Taylor, T. R. (1992). ‘‘Bypassing Culture.’’ Health Psychology Unit,
UNISA, Johannesburg, South Africa.
Pilkington, A., Buchanan, D., Jamal, G. A., Gillham, R., Hansen, S., Kidd, M.,
Hurley, J. F. & Soutar, C. A. (2001). An epidemiological study of the relations
between exposure to organophosphate pesticides and indices of chronic peripheral
neuropathy and neuropsychological abnormalities in sheep farmers and dippers.
Occupational and Environmental Medicine, 58, 702-710.
Powell, T. J. (2000). Chronic neurobehavioural effects of mercury poisoning on a
group of Zulu chemical workers. Brain Injury, 14(9), 797-814.
154

Rother, H. A., Hall, R. & London, L. (2008). Pesticide use among emerging
participants in South Africa: contributing factors and stakeholder perspectives.
Development Southern Africa, 25(4), 399-424.
Rohlman, D. S., Lasarev, M., Anger, W. K., Scherer, J., Stupfel, J. & McCauley, L.
(2007). Neurobehavioral performance of adult and adolescent agricultural
workers. Neurotoxicology, 28(2), 374-80.
Roldan-Tapia, L., Parron, T. & Sanchez-Santed, F. (2005). Neuropsychological
effects of long-term exposure to Organophosphate pesticides. Neurotoxicology and
Teratology, 27, 259-266.
Rosenstock, L. (1991). Chronic central nervous system effects of acute
organophosphate pesticide intoxication. Lancet, 338, 223-227.
Smit, L. A. M., van-Wendel-de-Joode, B. N., Heerderik, D., Peiris-John, R. & van
der Hoek, W. (2003). Neurological Symptoms among Sri Lankan Farmers
Occupationally Exposed to Acetylcholinesterase-inhibiting Insecticides. American
Journal of Industrial Medicine, 44, 254-264.
South African Medical Research Council (MRC). (1993). Guidelines on Ethics for
Medical Research. South African Medical Research Council, revised edition.
Retrieved September 10, 2008, from Web site:
http://www.mrc.ac.za/ethics/ethicsbook1.pdf
Srivastava, A. K., Gupta, B. N., Bihari, N., Muthur, L. P., Srivastava, B. S., Pangtey,
R. S., Bharti, R. S. & Kumar, P. (2000). Clinical, biochemical and
neurobehavioural studies of workers engaged in the manufacture of quinalphos.
Food and Chemical Toxicology, 38(1), 65-69.
Starks, S. A., Gerr, F., Kamel, F., Lynch, C. F., Jones, M. P., Alavanja, M. C.,
Sandler, D. P. & Hoppin, J. A. (2012). Neurobehavioral function and
organophosphate insecticide use among pesticide applicators in the Agricultural
Health Study. Neurotoxicology and Teratology, 34, 168-176.
155

Stata Corporation. (2007). Stata Statistical Software: Release 10. College Station,
TX: StataCorp LP.
Statistics South Africa. (2007). Census of Agriculture Provincial statistics: Financial
and production statistics: Western Cape, 2007. Pretoria.
Steenland, K., Jenkins, B., Ames, R. G. O’Malley, M., Chrislip, D. & Russo, J.
(1994). Chronic neurological sequelae to organophosphate pesticide poisoning.
American Journal of Public Health 84(5), 731-736.
Steenland, K., Dick, R. B., Howell, R. J., Chrislip, D. W., Hines, C., Reid, T. M. …
Knotff, C. (2000). Neurologic function among termiticide applicators exposed to
chlorpyrifos. Environmental Health Perspectives, 108(4), 293-300.
Steinweg, D. L. & Worth, H. (1993). ‘Alcoholism: The Keys to the CAGE’,
American Journal of Medicine, 94, 520-523.
Teschke, K., Olshan, A. F., Daniels, J. L., De Roos, A. J., Parks, C. G., Schulz, M. &
Vaughan, T. L. (2002). Occupational exposure assessment in case-control
studies: opportunities for improvement. Occupational & Environmental
Medicine, 59, 575 – 594. Retrieved September 10, 2012, from Web site:
http://www.ncbi.nlm.nih.gov/pmc/articles/PMC1757718/pdf/v056p00145.pdf
The Local Government Handbook. A complete guide to municipalities in South
Africa. (2012). Retrieved October 15, 2012, from Web site:
http://www.localgovernment.co.za/districts/view/43/Cape-Winelands-District-
Municipality
Wesseling, C., Keifer, M., Ahlbom, A., McConnell, R., Moon, J., Rosenstock, L. &
Hogstedt, C. (2002). Long-term neurobehavioural effects of mild poisonings with
organophosphate and n-methyl carbamate pesticides among banana workers.
International Journal of Occupational and Environmental Health, 8(1), 27-34.
156

Wesseling, C., van Wendel de Joode, B., Keifer, M., London, L., Mergler, D. &
Stallones, L. (2010). Symptoms of psychological distress and suicidal ideation
among banana workers with a history of poisoning by organophosphate or n-
methylcarbamate pesticides. Occupational & Environmental Medicine, 67, 778-
784.
World Health Organization (WHO) (1986). “Operational Guide for the WHO
Neurobehavioral Core Test Battery.” World Health Organization Office of
Occupational Health, Geneva, Switzerland.
World Medical Association (WMA): Helsinki Declaration. (2000). Retrieved August
7. 2013 from Web site: http://www.wma.net/en/30publications/10policies/b3
Young, H. A., Mills, P. K., Riordan, D. & Cress, R. (2004). Use of a crop and job
specific exposure matrix for estimating cumulative exposure to triazine herbicides
among females in a case-control study in the Central Valley of California.
Occupational & Environmental Medicine, 61, 945-951.
157

Chapter 4: BASELINE STUDY RESULTS
AND DISCUSSION
4.1 INTRODUCTION
This chapter presents the results and discussion relating to the baseline study. Figure
4.1 provides an overview of study participation and data collection for this phase of
the study. A discussion of these results concludes the chapter.
4.1.1 Study participation
Participation in the study and in individual tests is summarised in Figure 4.1. Of the
34 eligible projects, 21 projects (62%) participated. Of the 326 individuals eligible to
participate on the 21 farms, 319 (98%) participated in the study.
The projects that were ineligible included dairy farms with low pesticide use, farms
that were in the process of switching over to organic farming methods and have
stopped using pesticides and farms that were geographically remote. The number of
eligible farms in the Overberg was lower than in other districts because they were, on
average, larger projects and some Overberg projects were switching over to organic
methods of farming at the time of data collection and were thus rendered ineligible.
Only 70 farmers could be sampled in the Overberg. This resulted in oversampling in
the Cape Winelands district and the West Coast district. Table 4.1 shows the
distribution of farms and participants per district.
The methods are described in detail in Chapter 3. In brief, the participants completed
structured questionnaires detailing demographic, exposure and outcome information
(see Chapter 3, pages 8 to 20).
4.2 UNIVARIATE RESULTS
4.2.1 Demographic characteristics and injury history
Age and education
Table 4.2 shows the demographic characteristics of the study sample. The number of
farmers per farm who participated in the study varied from 3 (vegetable farmers) to
37 (grape, citrus and deciduous fruit farms). The majority of the farmers (66%,
n=211) who participated in the study were male. The sample had a wide age
158

Figure 4.1 Study participation summary
Note: * n= 303, **n= 317, *** n= 301
Total number of participants (n=319)
Total number of projects (n=21)
Missing
participants
(n=7)
Pilot studies
(n=2)
Neurobehavioural tests (N=319) N
Digit Span forward 319
Digit Span backward 319
Digit Span Total score 319
Digit Span WAIS-III 319
Digit Symbol* 303
Digit Symbol WAIS-III 303
Benton VRT 319
Santa Ana dominant hand 319
Santa Ana non-dominant hand** 317
Pursuit Aiming*** 301
Six agricultural districts
Emerging farmer population (n= 14 624)
Total number of projects (n=183)
Eligible farmer projects (n=34)
Population size (n=1391)
Switching to
organic
(n=2)
3 districts selected
(Cape Winelands, Overberg, West Coast)
Emerging farmer population (n= 5074)
Total number of projects (n=63)
Ineligible farmer
projects (n=26)
Farmer projects that declined
participation (n=13)
Defunct projects
(n= 1)
Brief Symptom
Inventory
(n=318)
Swedish
Q16
(n=318)
Vibration
Sense
Threshold
(n=315)
Farmer
Questionnaire
(N=319)
Participating Farmer projects (n=21)
Eligible number of participants in 3 districts (n=326)
159

Table 4.1 Summary of eligible farmers from participating farms per district
Number of farms and farmer participants (%)
Farms Farms Total on Total on Participated
District Eligible Participated (%) eligible farms participating farms (%)
Overberg 9 7 (78) 161 77 24
West Coast 12 5 (42) 790 84 26
Cape Winelands 13 9 (69) 433 158 50
34 21 (62) 1384 319 100
160

distribution with a median of 39 years and inter-quartile range (IQR) of 30 to 48
years. The median years of schooling was 9 (IQR: 7-11), equal to Grade 8 or
Standard 6 in South Africa. Of the 319, 8 % reported 1 year or less of formal
schooling. Twelve per cent (n=38) completed junior school (Grade 7) and 8% (n=27)
matriculated (completed Grade 12). There were no participants with tertiary
education. Those participants who self-reported that they had difficulty with reading
were coded as not being literate. Twenty six respondents (8.1%) in the present study
reported difficulty with reading.
Lifestyle factors: alcohol and smoking
More than half (61%, n= 195) of the participants in this study reported current
consumption of alcohol and, amongst others, 74% (n=144) reported a CAGE score of
2 or more (≥2). Sixty-nine percent (n=145) of males were current alcohol consumers,
while 46% (n=50) of females reported current alcohol consumption. About two
thirds reported being current smokers of cigarettes and/or tobacco products. Seventy-
four percent (n= 156) of males reported being current smokers and 48% (n=52) of
females were current smokers. Six percent of respondents (all males) reported
currently smoking Marijuana (Cannabis).
Socio-economic status
Thirteen percent (n=42) of farmers were categorized as low SES. A number of
participants (34%; n=108) reported receiving State Aid in the form of a Social
Development Grant personally and 15% (n=49) reported being occasionally hungry
which is an indirect measure of poverty.
Previous head injuries
Thirty six participants (11%) reported having sustained past head injuries. Six
injuries were work-related and involved four participants who, respectively, fell from
a chicken coop, a horse-drawn cart and a moving truck and two involved accidents
with tractors. Male participants reported the majority of head injuries (10.6%; n=34).
161

Table 4.2 Demographic, lifestyle and socio-economic status characteristics of the
study sample (N=319)
Mean (SD)
Gender
Male
Female
N (%) Median (IQR)
211 (66)
108 (34)
Age (years) 39 (11)
Median (IQR)
39 (30 – 48)
Schooling(years) 8 (3)
Median (IQR)
Height (m)
Mean (SD) 1.64 (0.08)
9 (7 – 11)
1.6 (1.6 – 1.7)
Home language
Afrikaans 274 (86)
Xhosa 36 (11)
Sotho 9 (3)
Lifestyle factors
Current alcohol consumption 195 (61)
CAGE Score ≥2* 144 (74 , n=195)
(45, n=319)
Current smokers 208 (65)
Current Marijuana (Cannabis)use 18 (6)
Socio-economic status
3 or fewer household items 42 (13)
Receipt of Social Development Grant 108 (34)
Hungry occasionally 49 (15)
Previous head injury
Self-reported previous head injuries 36 (11)
Psychiatric illness
Self-reported psychiatric illness 5(2)
Note: Median and inter-quartile range presented for continuous variables where
data are skewed. * The CAGE score was calculated by scoring 1 point for each ‘yes’ answer.
A score of ≥2 identified problem alcohol users.
that resulted from a range of incidents including having been assaulted or as a result
of playing rugby. Four participants reported loss of conscious as a result of their
injury for a duration that varied from a few minutes to one week. These included two
rugby injuries, a car accident and one participant who reported having been
assaulted. All four participants were male and two were pesticide applicators. Seven
participants reported head injuries as a result of having been assaulted.
162

Psychiatric illness
Five (2%) participants reported taking medication for psychiatric illness. Two were female
and 3 male. Four were pesticide applicators and three were OP pesticide applicators.
The psychiatric illnesses reported for which participants were receiving medication included
depression, panic attacks, insomnia and anxiety and ‘stress’.
4.2.2 Current occupational status
Of those farmers who reported being in current employment (n=311) 97% (n=301)
worked on farms while the remaining ten were involved in non-farm work. Three
hundred and fifteen participants provided details of their current and 3 previous jobs
(99%). More than half of those in current employment were pesticide applicators
with tasks including mixing pesticides, back pack pesticide application, quad bike
application, applying pesticides using a tractor with a mist blower and hand or
manual pesticide application. Two participants reported being unemployed at the
time of the data collection and 6 were retired pensioners (Table 4.3). Those farmers
not directly involved in pesticide application were involved in infield non-applicator
Table 4.3 Emerging farmers’ occupational status and gender (N=319)
Job description N (%) Pesticide applicator 169 (53.0)
Infield non-applicators 126 (39.5)
Non-farm worker – other 9 (2.8)
Farm worker - general worker 6 (1.9)
Non-farm worker – industry 1 (0.3)
Unemployed 2 (0.6)
Retired 6 (1.9)
Pesticide applicators (n=169) Male 137 (80)
Female 32 (20)
Non-applicators (n=150)
Male 74 (49)
Female 76 (51)
OP applicators (n=70) Male 60 (86)
Female 10 (14)
163

farming activities such as pruning, cleaning orchards, grading and harvesting crops
(39.5%; n=126). Six general workers operated temperature systems in cooling rooms,
assisted in the farm workshop conducting vehicle repairs and maintenance and one
member of the emerging farmer projects assisted with ABET (Adult Basic Schooling
and Training) facilitation.
Work history
The median number of current and past job years was 9 with an inter-quartile range of 5 to
16 years. The mean total number of years worked on farms for males was 13.0 years
(SD: 9.5 years) with an inter-quartile range of 5 to 18 years. The mean total number of
years worked on farms for female participants was 9.4 years (SD: 7.9 years) with an
inter-quartile range of 4 to 11 years.
Only 58 (18%) participants reported having had one previous job, 19 (6%) had two
previous jobs and less than one percent (n=2) had 3 previous jobs (Table 4.4).
Approximately 99% (n=317) only had three jobs or less in their lifetime, which
means that 99% of their occupational history was captured by the questionnaire.
Table 4.4 Emerging farmers’ work history by gender (N=312)
Gender Current jobs 1st Previous 2
nd Previous 3
rd Previous
Job Job Job
Males (n=207) 206 48 15 1
Females (n=105) 105 10 4 1
311 (97%) 58 (18.2%) 19 (6%) 2 (1%)
The mean age at which female farmers reported starting work in agriculture was 25
years (SD: 8.4 years) with one female farmer reporting age 11 years as a starting age
for work in an agricultural setting. Nine females (8%) reported starting work below
the age of sixteen. The mean age at which male farmers started working on farms
was 29 years (SD: 10.7 years) and 14 male farmers (7%) had started working on
farmers at an age younger than 16 years. The mean age for applicators involved with
any pesticide activity was 40.6 years (SD: 11.0 years) and 38.6 years (SD: 11.1
years) for non-applicators.
164

4.2.2.1 Current job description
Three hundred and eleven (n=311) participants reported details of their current jobs.
A mean of 10.14 years (SD: 8.32 years) with a median of 8 years and an inter-quartile
range from 4 to 13 years was reported for current jobs. Of these, 153 (48%)
participants reported having been applicators in their present jobs. Pesticide-related
tasks in current jobs included spray application using a tractor, a back pack, a quad
bike and mixing indoors and outdoors (Table 4.5). Of these, 106 (33%) participants
reported more than one risk task in the same job. While 26 applicators (8.15%)
reported that their only pesticide-related job tasks were mixing pesticides indoors,
most applicators (n=135; 80%) mixed pesticides along with pesticide application.
Exposure to tasks other than mixing was longer in duration. Use of personal
protective equipment (PPE) was infrequent among applicators for example of the 169
applicators 116 (69%) reported wearing boots, 96 (57%) reported using gloves and
112 (66%) reported wearing overalls while only 37 (22%) reported wearing eye
protection and 82 (49%) reported wearing a mask with a filter.
Table 4.5 Cumulative days in pesticide-related job tasks in current jobs (N=153)
Job tasks ( in days) Mean (SD)
Median IQR
Mixing indoors (n=26) 163.7
(±203.89)
96 7.5 – 210.0
Mixing outdoors (n=101) 110.1
(±235.9)
18 3.4 – 75.2
Back pack with spray gun (n=74) 236.5
(±474.7)
42.75 10.0 – 231.0
Tractor (n=20) 1050.3
(±1354.9)
466 180.0 – 1305.0
Tractor with boom sprayer (n=63) 1106.0
(±1121.6)
810 400.0 – 1575.0
Quad bike (n=3) 1048.3
(±842.5)
825 340.0 – 1980.0
All current job pesticide-related tasks (n=153) 828.2
(±1114.2)
360 40.5 – 1260.0
Work days were calculated as 8 hour work days and as day equivalents where work time
was reported in hours or minutes for a portion of the day worked.
165

4.2.2.2 Non-occupational exposure to pesticides
The median number of years lived on a farm was 14 years (range 1 to 71 years).
Thirty six percent (n=115) of the participants reported living within 50 meters or less
from vineyards and orchards. Most farmers (n= 85; 27%) lived on farms where
deciduous fruit was cultivated. However the crop sectors in which participants spent
more years working on were on citrus fruit farms and on vineyards. A small
proportion (n= 56; 18%) reported coming into contact with pesticides outside the
home while spraying was taking place. An item in the farmer questionnaire asked the
question ‘Does any member of your family go into the field/vineyards soon after
spraying, or come into contact with sprayed surfaces?’ and 16% (n=50) of the
participants selected the ‘YES’ option indication that they had come into contact
with pesticides soon after crops had been sprayed on re-entering vineyards and
orchards. Eighty six participants (27%) reported the smell of pesticides entering their
homes spraying occurred in the orchards and vineyards.
Table 4.6 Residential pesticide exposure and crop cultivation on farms (N=319)
Residential status (N=319) N (%)
Own their homes 76 (24)
Rented homes 16 (5)
Farm-owner homes 224 (70)
Other living arrangements 3 (1)
Residential pesticide exposure Pesticide spray entering home
86 (27)
Outside the home during spraying 56 (18)
Pesticide contact following re-entry 50 (16)
Household pesticide use
Crop cultivation (years)
Any crop combination farm (n=70)
Citrus fruit farms (n=68)
Deciduous fruit farms (n=85)
Vineyards (n=22)
Vegetable farms (n=52)
Other crops farms (n=13)
Retired members of project
Pensioners/retirees (n=5)
217(68)
Median(IQR)
7.0(4.0 - 13.0)
16.0 (9.5 - 22.0)
9.0 (5.0 - 13.0)
11.5 (5.0 - 17.0)
7.5 (4.0 - 13.0)
8.0 (3.0 - 14.0)
8.0 (4.0 - 9.0)
166

More than two thirds of the participants (68%) reported using pyrethroid-based
insecticides. The frequency of usage varied from 16% (n=50) who reported using
pesticides in their homes every day to 24% (n=77) who reported using pesticides
once a week to control pests such as flies and cockroaches. More than half of the
participants (n=169) did not know how empty pesticide containers were disposed of,
33% (n= 104) reported that empty pesticide containers were burnt, 44 (14%)
participants reported that empty containers were collected by a waste disposal
organisation and two reported bringing empty pesticide containers home. One
participant reported using the empty container as a plant holder outside her home and
one participant reported using an empty pesticide container as a waste bin.
4.2.2.3 Pesticide use on farms
Pesticide applicators reported using insecticides, herbicides, fungicides and other
chemicals (fertilizers, leaf wetters, adjuvants and growth regulators) in current and
previous jobs. Of the 169 applicators, 70 (41.4%) reported having applied
organophosphate pesticides in their current and previous jobs with a mean of 562.8
days (SD: 685.5 days). The highest number of cumulative days of use for any
agrichemical group reported was for fungicides and the lowest usage was for
herbicides. The lowest usage for type of chemical class was reported for pyrethroid
agrichemicals and the highest agrichemical class usage reported was for growth
regulators, adjuvants and fertilizers. Seventy participants reported having applied
organophosphate (OP) pesticides which included azenphos, chlorpyrifos, dursban,
malathion, parathion and tokuthion amongst others. An average of 562.8 days
(±685.5) was reported for OP pesticide use for current and previous jobs.
167

Table 4.7 Number of cumulative days over current and previous jobs for
different exposure activities (N=169)
4.2.2.4 Exposure measures
Log transformation did not normalize the distribution and medians, range, means and
standard deviations are reported in Table 4.8. Since only 70 (22%) participants
applied OP pesticides the inter-quartile range is from 0 to 0.
Agrichemical use by chemical group Mean (SD) Median Inter-quartile
range
Number of days reported using
insecticides (n=111)
754.5
(±933.1)
412.5 50.0 – 981.8
Number of days reported using
fungicides (n=43)
952.7
(±1262.1)
480.0 176.3 – 1099.7
Number of days reported using
herbicides (n=51)
564.6
(±704.7)
277.5 60.6 – 570.0
Number of days reported using
fertilizers, adjuvants and growth
regulators (n=131)
737.9
(±1029.1)
400.0 81.0 – 981.8
Unclassified pesticides (n=27) 618.7
(±899.8)
270.0 65.3 – 580.0
Agrichemical use by chemical class Number of days reported using
organophosphate pesticides (n=70)
562.8
(±685.5)
305.4 45.0 – 953.3
Number of days reported using
pyrethroid pesticides (n=33)
517.0
(±654.9)
334.1 112.5 – 663.5
Number of days reported using
carbamate pesticides (n=35)
581.6
(±679.5)
413.1 148.5 – 694.5
Number of days reported using
fertilizers, leaf wetters and growth
regulators (n=131)
737.9
(±1029.1)
400.0 81.0 – 981.8
Total number of days for all chemical
classes and groups (n=169)
1015.6
(±1310.6)
500.1 75.0 – 1440.0
Unclassified pesticides (n=27)
618.7
(±899.9)
270.0 65.3 – 580.0
168

Table 4.8 Number of cumulative exposure days for different exposure activities
for all jobs
Exposure variable N Mean SD Median IQR
Continuous exposure
variables All pesticide total exposure
days (Unweighted days)
319
539.6
1081.1
6.0
0 – 570.0
All pesticide jemdays
(Weighted by activity)
319
395.8
852.9
4.5
0 – 393.7
All pesticide jemcrop days
(Weighted for crop type)
319
5742.5
14903.3
1.9
0 – 4548.6
All pesticide
jemcrop days
(per annum)
319
433.1
816.1
0.2
0 – 487.8
Only OP pesticide days
(Unweighted days)
319
123.5
395.5
0.0
0 – 0
Only OP pesticide days
jemdays
(Weighted by activity)
319
86.5
276.8
0.0
0 – 0
Only OP pesticide days
Jem crop days
(Weighted for crop type)
319
1275.8
4695.6
0.0
0 – 0
Only OP pesticide days
Jem crop days (per annum)
319
85.4
276.9
0.0
0 – 0
4.2.2.5 Past pesticide poisoning
Information on past poisoning incidents was not collected in the farmer questionnaire
at the first baseline data collection visit but was included during the cohort at the
final follow-up. Only 201 (63%) of 319 participants reported on past poisoning at the
final visit. Of these, 102 (51%) of 201 participants reported having experienced
poisoning symptoms in the past, during or after having applied pesticides. Twenty
three (12%) of the 201 participants reported that they had been diagnosed in the past
with pesticide poisoning by a health professional.
169

4.2.2.6 Neurobehavioural outcomes
4.2.2.6.1 Scoring of neurobehavioural outcomes
The methods for each test used in the study are outlined in detail in Chapter 3
(section 3.4.2) and the score range is summarised again for convenience in Table 4.9.
Table 4.9 Neurobehavioural outcomes score range
Neurobehavioural tests Score range
Digit Span forward 0.0 – 14.0
Digit Span backward 0.0 – 14.0
Digit Span total possible score 0.0 – 28.0
Digit Span WAIS-III 1.0 – 19.0
Benton Visual Retention Test 0.0 – 10.0
Digit Symbol Substitution Test 0.0 – 67.0
Digit Symbol WAIS-III 1.0 – 19.0
Santa Ana Pegboard (dominant hand) 0.0 – 48.0
Santa Ana Pegboard (non-dominant hand) 0.0 – 48.0
Pursuit Aiming II 0 – 750.0
The Brief Symptom Inventory (BSI) 0.0 – 212.0
The BSI Global Severity Index (GSI) Tscore ≥ 63 = a positive
case
The BSI Symptom Dimension Tscore ≥ 63 on any 2
dimensions = a
positive case
The Swedish Neuropsychiatric Questionnaire (the
Q16).
0.00 – 16.0
A score of ≥7
requires referral
for further
investigation
Vibration Sense Threshold – 3 readings in
seconds
No fixed score
4.2.2.6.2 Descriptive findings: neurobehavioural outcomes
All eleven outcomes were collected as continuous data. Table 4.10 shows the
descriptive statistics for five subtests from the WHO Neurobehavioural Core Test
Battery, the Brief Symptom Inventory Global Severity Index (GSI), the vibration
170

sense threshold test and the Swedish Q16. The numbers of participants who
completed the neurobehavioural tests varied (see Table 4.10), with the fewest tests
completed for the Pursuit Aiming test (n= 301; 94%). Some participants had
difficulty completing the Pursuit Aiming and Digit Symbol tests for the following
reasons: some complained of bad eyesight and had no spectacles (n=8; 2.5%), some
could not write (n=10; 3%) and one participant had difficulty understanding the Digit
Symbol test and could not complete the test even after repeated explanations. One
questionnaire with completed forms was lost between the research study site and the
offices of the University of Cape Town. Missing data affected relatively few
participants for the BSI (0.3%; n=1), Vibration Sense threshold (1.3%; n=4) and the
Q16 (0.3%; n=1).
Table 4.10 Univariate results for neurobehavioral outcome measures
Digit Span N Mean SD Median Range
Digit Span Forward 319 6.1 2.2 6 5 – 7
Digit Span Backward 319 3.5 1.5 3 2 – 4
WAIS-III Std score 319 6.9 1.9 6 6 – 8
Log transformed score 319 0.8 0.1 0.8 0.8 – 0.9
Digit Symbol
WAIS-III Std score 303 5.8 1.5 5 5 – 7
Log transformed score 303 0.7 0.1 0.7 0.7 – 0.8
Benton VRT
Number correct 319 6.0 2.1 6 4 – 8
Santa Ana
Dom. hand total 319 36.6 8.3 37 31 – 42
Non-dom. hand total 317 35.1 8.4 36 30 – 41
Pursuit Aiming
Total correct 301 72.4 41.2 69 39 – 105
Brief Symptom Inventory
GSI 318 54.2 9.2 53 48 – 60
Log transformed score 318 1.7 0.1 1.7 1.7 – 1.8
Swedish Q16
Total score 318 4.2 3.4 3 1 – 6
Vibration Sense Threshold
Average threshold (s)# 315 13.5 5.4 13 9.5 – 16.5
Log transformed score 315 1.1 0.2 1.1 0.9 – 1.2
# Extinction time was measured in seconds and three readings were recorded. The average of
the last two readings was used as the final extinction time for each participant.
171

4.3 BIVARIATE RESULTS
4.3.1 Neurobehavioural outcomes by covariates, exposure variables and past
diagnosed poisoning
In this section results will be presented for bivariate analyses of:
(a) the associations between continuous outcomes and dichotomous covariates
(b) the association between continuous outcomes and continuous covariates
(c) the association between continuous outcomes and dichotomous exposure
variables
(d) the association between continuous outcomes and continuous exposure
variables
(e) the association between continuous outcomes and past diagnosed poisoning
used as an exposure variable
The number of participants who completed the different neurobehavioural tests
differed on different tests (Digit Symbol, Santa Ana Pegboard non-dominant hand,
Pursuit Aiming, BSI, Q16, vibration sense). Tables 4.11 to 4.24 include the sample
size for each bivariate comparison contained in the tables.
Performance on most of the neurobehavioural tests was consistently significantly
associated with age (negative) and schooling (positive) except on vibration sense
threshold, the Brief Symptom Inventory and the Swedish Q16. Younger participants
consistently performed better on most tests (p<0.05) where higher scores indicated
better performance.
172

Table 4.11 Neurobehavioural outcomes by age
Outcome Age ≤ 39 years Age > 39 years
P-value Mean
(SD)
Median
(IQR)
Mean
(SD)
Median
(IQR)
Digit Span
Forward#
(n=164)
6.4
(2.2)
(n=164)
6
(5-8)
(n=155)
5.8
(2.2)
(n=155)
6
(4-7)
0.02
Backward#
(n=164)
3.7
(1.5)
(n=164)
4
(3-5)
(n=155)
3.2
(1.6)
(n=155)
3
(2-4)
<0.01
WAIS-III
Std# Score
(n=164)
7.1
(2.0)
(n=164)
7
(6-8)
(n=155)
6.7
(1.8)
(n=155)
6
(6-8)
0.04
Log$
transformed
score
(n=164)
0.8
(0.1)
(n=164)
0.8
(0.8-0.9)
(n=155)
0.8
(0.1)
(n=155)
0.8
(0.8-0.9)
0.06
Digit Symbol Substitution
WAIS-III
Std# Score
(n=160)
6.1
(1.5)
(n=160)
6
(5-7)
(n=143)
5.4
(1.50)
(n=143)
5
(4-6)
<0.01
Log$
transformed
score
(n=160)
0.7
(0.1)
(n=160)
0.8
(0.7 -0.8)
(n=140)
0.7
(0.1)
(n=140)
0.7
(0.6-0.8)
<0.01
Benton Visual Retention Test
Number#
Correct
(n=164)
6.3
(2.0)
(n=164)
6
(5-8)
(n=155)
5.7
(2.1)
(n=155)
6
(4-7)
0.03
Santa Ana Pegboard
Dom. Hand*
total
(n=164)
38.6
(8.3)
(n=164)
39
(34-44)
(n=155)
34.5
(7.9)
(n=155)
35
(29-40)
<0.01
Non-dom.#
hand total
(n=163)
36.5
(8.4)
(n=163)
37
(31-43)
(n=154)
33.6
(8.17)
(n=154)
35
(29-39)
0.01
Pursuit Aiming II Test
Total correct# (n=163)
87.5
(39.9)
(n=163)
93
(54-118)
(n=138)
54.5
(35.0)
(n=138)
49
(28-79)
<0.01
Brief Symptom Inventory
GSI
Total
score#
(n=163)
54.8
(9.2)
(n=163)
54
(48 - 60)
(n=155)
53.5
(9.2)
(n=155)
53
(48 - 59)
0.32
Log$
transformed
score
(n=163)
1.7
(0.1)
(n=163)
1.7
(1.7 - 1.8)
(n=155)
1.7
(0.1)
(n=155)
1.7
(1.7 - 1.8)
0.21
Swedish Q16
Total
score#
(n=163)
3.9
(3.4)
(n=163)
3
(1 - 6)
(n=155)
4.4
(3.3)
(n=155)
4
(2 - 6)
0.16
173

* Based on Two-sample t-test; # Based on Two-sample Wilcoxon Ranksum (Mann-Whitney)
test; $ For 4 variables, the distributions were only normalized with log transformation: Digit
Span Standardised Score, Digit Symbol Substitution; GSI BSI and Vibration threshold. Log
transformation did not normalize the other neurobehavioural outcome variables.
Table 4.12 shows significant differences between participants with 9 years of
schooling or less (median number of schooling in years) and those 10 or more years
of schooling on most of the neurobehavioural outcomes (p<0.05). Participants with
more schooling performed significantly better on nine out of 11 outcomes (Digit
Span Forward, Digit Span Backward, Digit Span WAIS, Digit Symbol, Benton
Visual Retention, Santa Ana dominant hand, Santa Ana non-dominant hand, Pursuit
Aiming, Q16).
Table 4.12 Neurobehavioural outcomes by schooling
Vibration Sense threshold
Total
score#
(n=163)
13.8
(5.9)
(n=163)
13
(10 - 17)
(n=152)
13.1
(4.8)
(n=152)
12.5
(10 - 17)
0.66
Log$
transformed
score
(n=163)
1.1
(0.2)
(n=163)
1.1
(1.0 - 1.2)
(n=152)
1.1
(0.2)
(n=152)
1.1
(1.0 - 1.2)
0.55
Outcome Schooling ≤ 9 years Schooling > 9 years
P-value Mean
(SD)
Median
(IQR)
Mean
(SD)
Median
(IQR)
Digit Span
Forward#
(n=208)
5.8
(2.0)
(n=208)
6
(4-7)
(n=111)
6.7
(2.4)
(n=111)
6
(5-8)
0.03
Backward#
(n=208)
3.1
(1.4)
(n=208)
3
(2-4)
(n=111)
4.1
(1.6)
(n=111)
4
(3-5)
<0.01
WAIS-III Std
Score#
(n=208)
6.5
(1.6)
(n=208)
6
(5-8)
(n=111)
7.5
(2.2)
(n=111)
7
(5-9)
<0.01
Log
transformed
score$
(n=208)
0.8
(0.1)
(n=208)
0.8
(0.7-0.9)
(n=111)
0.9
(0.1)
(n=111)
0.8
(0.8 -0.9)
<0.01
Digit Symbol Substitution
WAIS-III Std
Score#
(n=192)
5.3
(1.3)
(n=192)
5
(4-6)
(n=111)
6.6
(1.5)
(n=111)
7
(5-8)
<0.01
Log
transformed
score$
(n=192)
0.7
(0.1)
(n=192)
0.7
(0.6-0.8)
(n=111)
0.8
(0.1)
(n=111)
0.8
(0.7-0.9)
<0.01
174

* Based on Two-sample t-test; # Based on Two-sample Wilcoxon Ranksum (Mann-Whitney)
test; $ For 4 variables, the distributions were only normalized with log transformation: Digit
Span Standardised Score, Digit Symbol Substitution; GSI BSI and Vibration threshold. Log
transformation did not normalize the other neurobehavioural outcome variables.
Gender (Table 4.13) was significantly associated with Digit Symbol WAIS-III,
Pursuit Aiming II and the Swedish Q16. Females performed better than males on the
Digit Symbol WAIS-III test (p=0.002) and Pursuit Aiming II (p=0.002) but worse
than males on the Q16 test (p=0.024).
Benton Visual Retention Test
Number
Correct#
(n=208)
5.6
(2.0)
(n=208)
6
(4-7)
(n=111)
6.7
(1.9)
(n=111)
7
(6-8)
<0.01
Santa Ana Pegboard
Dom. hand
total*
(n=208)
35.1
(8.3)
(n=208)
35
(30-40)
(n=111)
39.5
(7.6)
(n=111)
40
(35-44)
<0.01
Non-dom.
hand total#
(n=207)
33.6
(8.4)
(n=207)
34
(28-39)
(n=110)
37.9
(7.8)
(n=110)
39
(33-43)
<0.01
Pursuit Aiming II Test
Total correct# (n=190)
60.5
(36.9)
(n=190)
56
(33-89)
(n=111)
92.7
(40.3)
(n=111)
49
(67-125)
<0.01
Brief Symptom Inventory
GSI
Total
score#
(n=207)
54.6
(9.4)
(n=207)
53
(48 - 60)
(n=111)
53.4
(8.9)
(n=111)
53
(48 - 59)
0.39
Log
transformed
score$
(n=207)
1.7
(0.1)
(n=207)
1.7
(1.7 -1.8)
(n=111)
1.7
(0.1)
(n=111)
1.7
(1.7 -1.8)
0.31
Swedish Q16
Total
score#
(n=208)
4.7
(3.4)
(n=208)
4
(2-7)
(n=110)
3.2
(2.7)
(n=110)
3
(1-4)
<0.01
Vibration Sense threshold
Total
score#
(n=205)
13.3
(5.4)
(n=205)
13
(10-17)
(n=110)
13.7
(5.5)
(n=110)
13
(10-17)
0.61
Log
transformed
score$
(n=205)
1.1
(0.2)
(n=205)
1.1
(1.0 -1.1)
(n=110)
1.1
(0.2)
(n=110)
1.1
(1.0 -1.2)
0.59
175

Table 4.13 Neurobehavioural outcomes by gender
Outcome Males Females
P-value Mean
(SD)
Median
(IQR)
Mean
(SD)
Median
(IQR)
Digit Span
Forward#
(n=211)
6
(2.2)
(n=211)
6
(5-7)
(n=108)
6.3
(2.1)
(n=108)
6
(5-7)
0.17
Backward#
(n=211)
3.4
(1.6)
(n=211)
3
(2-4)
(n=108)
3.6
(1.5)
(n=108
4
(3-4)
0.15
WAIS-III Std
Score#
(n=211)
6.8
(1.9)
(n=211)
6
(3-14)
(n=108)
7
(1.8)
(n=108)
7
(4-13)
0.27
Log
transformed
score$
(n=211)
0.8
(0.1)
(n=211)
0.8
(0.8 -0.9)
(n=108)
0.8
(0.1)
(n=108)
0.8
(0.8 -0.9)
0.25
Digit Symbol Substitution
WAIS-III Std
Score#
(n=198)
5.6
(1.5)
(n=198)
5
(5-6)
(n=105)
6.1
(1.5)
(n=105)
6
(5-7)
0.01
Log
transformed
score$
(n=198)
0.7
(0.1)
(n=198)
0.7
(0.7-0.8)
(n=105)
0.8
(0.1)
(n=105)
0.8
(0.7-0.8)
0.01
Benton Visual Retention Test
Number
Correct#
(n=211)
5.9
(2.2)
(n=211)
6
(4-8)
(n=108)
6.3
(1.8)
(n=108)
6
(5-8)
0.14
Santa Ana Pegboard
Dom. hand
total*
(n=211)
37
(8.16)
(n=211)
37
(32-43)
(n=108)
35.8
(8.63)
(n=108)
37
(31-42)
0.24
Non-dom.
hand total#
(n=209)
35.3
(8.1)
(n=209)
36
(31-41)
(n=108)
34.8
(8.9)
(n=108)
36
(29-42)
0.77
Pursuit Aiming II Test
Total
correct#
(n=196)
68.2
(39.4)
(n=196)
63
(37-101)
(n=105)
80.1
(43.3)
(n=105)
85
(41-114)
0.02
Brief Symptom Inventory
GSI
Total
score#
(n=210)
53.9
(10.0)
(n=210)
53
(48-80)
(n=108)
54.7
(7.4)
(n=108)
55
(49-61)
0.17
Log
transformed
score$
(n=210)
1.7
(0.1)
(n=210)
1.7
(1.7 -1.8)
(n=108)
1.7
(0.1)
(n=108)
1.7
(1.7 -1.8)
0.28
Swedish Q16
Total
score#
(n=209)
3.90
(3.36)
(n=209)
3
(2-13)
(n=108)
4.7
(3.30)
(n=108)
4
(1-14)
0.02
176

Vibration Sense threshold
Total
score#
(n=207)
13.8
(5.6)
(n=207)
13
(10-17)
(n=108)
12.8
(5.1)
(n=108)
13
(10-16)
0.10
Log
transformed
score$
(n=207)
1.1
(0.2)
(n=207)
1
(1.0-1.2)
(n=108)
1.1
(0.2)
(n=108)
1
(1.0 -1.2)
0.17
* Based on Two-sample t-test; # Based on Two-sample Wilcoxon Ranksum (Mann-Whitney)
test; $ For 4 variables, the distributions were only normalized with log transformation: Digit
Span Standardised Score, Digit Symbol Substitution; GSI BSI and Vibration threshold. Log
transformation did not normalize the other neurobehavioural outcome variables.
Table 4.14 shows the results for the differences in neurobehavioural performance
between those Afrikaans speaking participants with and non-Afrikaans speaking
participants. Afrikaans speaking participants performed significantly better than non-
Afrikaans speaking participants on the Digit Symbol, Benton Visual Retention test
and the Santa Ana Pegboard (non-dominant hand) (p<0.05). Non-Afrikaans speaking
participants performed significantly better than Afrikaans speaking participants on
the Q16 test (where higher scores equal poorer performance). Non-Afrikaans
speaking participants also showed longer extinction times than Afrikaans speaking
participants on the Tuning Fork but this difference was only marginally significant
(p=0.06). There were no significant differences between the two groups on the Digit
Span, Pursuit Aiming and Brief Symptom Inventory tests.
Table 4.14 Neurobehavioural outcomes by language
Outcome Afrikaans speaking Non-Afrikaans
speaking
P-value
Mean
(SD)
Median
(IQR)
Mean
(SD)
Median
(IQR)
Digit Span
Forward#
(n=274)
6.1
(2.2)
(n=274)
6
(5-7)
(n=45)
6
(2.2)
(n=45)
6
(5-7)
0.71
Backward#
(n=274)
3.5
(1.5)
(n=274)
4
(2-4)
(n=45)
3.3
(1.7)
(n=45
3
(3-4)
0.44
WAIS-III Std
Score#
(n=274)
6.9
(1.9)
(n=274)
6
(6-8)
(n=45)
6.8
(1.9)
(n=45)
6
(5-8)
0.61
Log
transformed
score$
(n=274)
0.8
(0.1)
(n=274)
0.8
(0.8 -0.9)
(n=45)
0.8
(0.1)
(n=45)
0.8
(0.7-0.9)
0.67
177

Digit Symbol Substitution
WAIS-III Std
Score#
(n=259)
5.9
(1.5)
(n=259)
6
(5-7)
(n=44)
4.8
(1.1)
(n=44)
5
(4-5)
<0.01
Log
transformed
score$
(n=259)
0.8
(0.1)
(n=259)
0.8
(0.7-0.9)
(n=44)
0.7
(0.1)
(n=44)
0.7
(0.6-0.7)
<0.01
Benton Visual Retention Test
Number
Correct#
(n=274)
6.2
(1.9)
(n=274)
6
(5-8)
(n=45)
4.7
(2.3)
(n=45)
4
(3-7)
<0.01
Santa Ana Pegboard
Dom. hand
total*
(n=274)
36.7
(8.5)
(n=274)
37
(31-42)
(n=45)
36
(7.1)
(n=45)
36
(32-40)
0.62
Non-dom.
hand total#
(n=274)
35.6
(8.2)
(n=274)
36
(31-42)
(n=45)
32.4
(9.2)
(n=45)
32
(27-39)
0.02
Pursuit Aiming II Test
Total
correct#
(n=257)
73.3
(41.7)
(n=257)
70
(41-106)
(n=44)
66.9
(37.5)
(n=44)
56
(36-98)
0.37
Brief Symptom Inventory
GSI
Total
score#
(n=274)
53.9
(10)
(n=274)
53
(48 - 60)
(n=44)
54.7
(7.4)
(n=44)
55
(48-56)
0.29
Log
transformed
score$
(n=274)
1.7
(0.1)
(n=274)
1.7
(1.7 -1.8)
(n=44)
1.7
(0.1)
(n=44)
1.7
(1.7 -1.7)
0.65
Swedish Q16
Total
score#
(n=273)
4.3
(3.3)
(n=273)
4
(2-6)
(n=45)
3.1
(3.3)
(n=45)
2
(1-4)
<0.01
Vibration Sense threshold
Total
score#
(n=271)
13.3
(5.6)
(n=271)
13
(9-17)
(n=44)
14.2
(3.7)
(n=44)
15
(13-16)
0.06
Log
transformed
score$
(n=271)
1.1
(0.2)
(n=271)
1
(0.9-1.2)
(n=44)
1.1
(0.1)
(n=44)
1
(1.1-1.2)
0.09
* Based on Two-sample t-test; # Based on Two-sample Wilcoxon Ranksum (Mann-Whitney)
test; $ For 4 variables, the distributions were only normalized with log transformation: Digit
Span Standardised Score, Digit Symbol Substitution; GSI BSI and Vibration threshold. Log
transformation did not normalize the other neurobehavioural outcome variables.
Table 4.15 shows the results for the differences in neurobehavioural performance
between participants who reported current alcohol consumption and those who
reported no current alcohol consumption. Participants who reported current alcohol
consumption performed significantly worse than non-consumers of alcohol on the
178

Digit Symbol (p<0.05). However current alcohol consumption seemed protective for
performance on the Santa Ana Pegboard (dominant hand) test (p<0.05). There were
no significant differences between the two groups on the other tests.
Table 4.15 Neurobehavioural outcomes and current alcohol consumption Outcome Current Alcohol
consumption
No alcohol
consumption currently
P-value
Mean
(SD)
Median
(IQR)
Mean
(SD)
Median
(IQR)
Digit Span
Forward#
(n=195)
6.0
(2.2)
(n=195)
6
(5-7)
(n=124)
6.2
(2.2)
(n=124)
6
(5-8)
0.22
Backward#
(n=195)
3.4
(1.6)
(n=195)
3
(2-4)
(n=124)
3.5
(1.5)
(n=124
4
(2-4)
0.49
WAIS-III Std
Score#
(n=195)
6.8
(1.9)
(n=195)
6
(6-8)
(n=124)
7.0
(1.7)
(n=124)
7
(6-8)
0.24
Log
transformed
score$
(n=195)
0.8
(0.1)
(n=195)
0.8
(0.8 -0.9)
(n=124)
0.8
(0.1)
(n=124)
0.8
(0.8 -0.9)
0.41
Digit Symbol Substitution
WAIS-III Std
Score#
(n=190)
5.6
(1.6)
(n=190)
5
(5-7)
(n=113)
6.0
(1.4)
(n=113)
6
(5-7)
<0.01
Log
transformed
score$
(n=190)
0.7
(0.1)
(n=190)
0.7
(0.7-0.8)
(n=113)
0.8
(0.1)
(n=113)
0.8
(0.7-0.9)
<0.01
Benton Visual Retention Test
Number
Correct#
(n=195)
6.0
(2.2)
(n=195)
6
(4-8)
(n=124)
6.1
(1.9)
(n=124)
6
(5-8)
0.65
Santa Ana Pegboard
Dom. hand
total*
(n=195)
37.6
(8.5)
(n=195)
38
(31-43)
(n=124)
35.1
(7.9)
(n=124)
35
(31-40)
0.01
Non-dom.
hand total#
(n=195)
35.4
(8.4)
(n=195)
36
(31-42)
(n=122)
34.7
(8.4)
(n=122)
35
(30-40)
0.27
Pursuit Aiming II Test
Total
correct#
(n=186)
70.9
(40.2)
(n=186)
66
(39-104)
(n=115)
74.8
(42.7)
(n=115)
73
(37-108)
0.43
Brief Symptom Inventory
GSI
Total
score#
(n=195)
54.0
(9.4)
(n=195)
53
(48-59)
(n=123)
54.5
(8.9)
(n=123)
54
(48-61)
0.41
179

Log
transformed
score$
(n=195)
1.7
(0.1)
(n=195)
1.7
(1.7 -1.8)
(n=123)
1.7
(0.1)
(n=123)
1.7
(1.7 -1.8)
0.55
Swedish Q16
Total
score#
(n=194)
4.1
(3.4)
(n=194)
3
(1-6)
(n=124)
4.3
(3.2)
(n=124)
4
(1.5-7)
0.37
Vibration Sense threshold
Total
score#
(n=193)
13.3
(5.4)
(n=193)
12
(9.5-16.5)
(n=122)
13.7
(5.4)
(n=122)
13
(9.5-17)
0.48
Log
transformed
score$
(n=193)
1.1
(0.2)
(n=193)
1
(1 -1.2)
(n=122)
1.1
(0.2)
(n=122)
1
(1 -1.2)
0.57
* Based on Two-sample t-test; # Based on Two-sample Wilcoxon Ranksum (Mann-Whitney)
test; $ For 4 variables, the distributions were only normalized with log transformation: Digit
Span Standardised Score, Digit Symbol Substitution; GSI BSI and Vibration threshold. Log
transformation did not normalize the other neurobehavioural outcome variables.
Participants who scored ≥2 on the CAGE questionnaire (indicating problem alcohol
use) performed significantly poorer than those who scored <2 on the Digit Symbol
Substitution test and Santa Ana non-dominant hand (p=0.05) and the Q16 test
(p=0.010) (Table 4.16). There were no other significant associations between
neurobehavioural performance and problem alcohol use.
Table 4.16 Neurobehavioural outcomes and CAGE score
Outcome CAGE Score ≥2 CAGE Score <2
P-value Mean
(SD)
Median
(IQR)
Mean
(SD)
Median
(IQR)
Digit Span
Forward#
(n=144)
5.8
(2.1)
(n=144)
6
(5-7)
(n=175)
6.3
(2.2)
(n=175)
6
(5-8)
0.06
Backward# (n=144)
3.4
(1.6)
(n=144)
3
(2-4)
(n=175)
3.5
(1.5)
(n=175
4
(2-4)
0.475
WAIS-III Std
Score#
(n=144)
6.7
(1.9)
(n=144)
6
(6-8)
(n=175)
7.0
(1.9)
(n=175)
7
(6-8)
0.07
Log
transformed
score$
(n=144)
0.8
(0.1)
(n=144)
0.8
(0.7-0.9)
(n=175)
0.8
(0.1)
(n=175)
0.8
(0.8 -0.9)
0.11
Digit Symbol Substitution
WAIS-III Std
Score#
(n=140)
5.6
(1.5)
(n=140)
5
(5-7)
(n=163)
5.9
(1.5)
(n=163)
6
(5-7)
0.06
180

Log
transformed
score$
(n=140)
0.7
(0.1)
(n=140)
0.7
(0.7-0.8)
(n=163)
0.8
(0.1)
(n=163)
0.8
(0.7-0.9)
0.05
Benton Visual Retention Test
Number
Correct#
(n=144)
6.0
(2.1)
(n=144)
6
(5-8)
(n=175)
6.0
(2.1)
(n=175)
6
(4-8)
0.11
Santa Ana Pegboard
Dom. hand
total*
(n=144)
37.6
(8.5)
(n=144)
38
(31-4)
(n=175)
35.8
(8.1)
(n=175)
37
(31-41)
0.07
Non-dom.
hand total#
(n=144)
36.0
(8.4)
(n=144)
37
(32-42)
(n=173)
34.4
(8.4)
(n=173)
35
(28-40)
0.05
Pursuit Aiming II Test
Total
correct#
(n=136)
69.9
(38.5)
(n=136)
68
(40-98)
(n=165)
74.5
(43.2)
(n=165)
71
(37-108)
0.42
Brief Symptom Inventory
GSI
Total
score#
(n=144)
55.1
(9.5)
(n=144)
54
(48-60)
(n=174)
53.4
(8.9)
(n=174)
53
(48-60)
0.21
Log
transformed
score$
(n=144)
1.7
(0.07)
(n=144)
1.7
(1.68-1.78)
(n=174)
1.7
(0.07)
(n=174)
1.7
(1.68-1.78)
0.10
Swedish Q16
Total
score#
(n=143)
4.7
(3.5)
(n=143)
4
(2-7)
(n=175)
3.7
(3.2)
(n=175)
3
(1-5)
0.01
Vibration Sense threshold
Total
score#
(n=143)
13.4
(5.7)
(n=143)
12
(9-17)
(n=172)
13.5
(5.2)
(n=172)
13
(10-17)
0.56
Log
transformed
score$
(n=143)
1.1
(0.2)
(n=143)
1.1
(1 -1.2)
(n=172)
1.1
(0.2)
(n=172)
1.1
(1 -1.2)
0.63
* Based on Two-sample t-test; # Based on Two-sample Wilcoxon Ranksum (Mann-Whitney)
test; $ For 4 variables, the distributions were only normalized with log transformation: Digit
Span Standardised Score, Digit Symbol Substitution; GSI BSI and Vibration threshold. Log
transformation did not normalize the other neurobehavioural outcome variables.
Those who reported a previous head injury showed significantly longer extinction
time on the Tuning Fork (increased vibration sensitivity) (P=0.002) (Table 4.17).
Previous head injury was marginally associated with worse performance on Pursuit
Aiming (P=0.06). None of the other tests were associated with reported previous
head injury.
181

Table 4.17 Neurobehavioural outcomes and previous head injury
Outcome Previous head injury No previous head
injury
P-value
Mean
(SD)
Median
(IQR)
Mean
(SD)
Median
(IQR)
Digit Span
Forward#
(n=36)
6.4
(2)
(n=36)
7
(5-8)
(n=283)
6.1
(2.2)
(n=283)
6
(5-7)
0.35
Backward#
(n=36)
3.6
(1.5)
(n=36)
3
(3-4)
(n=283)
3.4
(1.6)
(n=283)
3
(2-4)
0.81
WAIS-III Std
Score#
(n=36)
7.1
(1.9)
(n=36)
7
(6-8)
(n=283)
6.9
(1.9)
(n=283)
6
(6-8)
0.52
Log
transformed
score$
(n=36)
0.8
(0.1)
(n=36)
0.8
(0.8-0.9)
(n=283)
0.8
(0.1)
(n=283)
0.8
(0.8 -0.9)
0.39
Digit Symbol Substitution
WAIS-III Std
Score#
(n=35)
5.6
(1.5)
(n=35)
5
(5-7)
(n=268)
5.8
(1.5)
(n=268)
5
(5-7)
0.42
Log
transformed
score$
(n=35)
0.7
(0.1)
(n=35)
0.7
(0.7-0.8)
(n=268)
0.8
(0.1)
(n=268)
0.7
(0.7-0.9)
0.49
Benton Visual Retention Test
Number
Correct#
(n=36)
6.0
(2.3)
(n=36)
7
(5-8)
(n=283)
6.0
(2)
(n=283)
6
(4-8)
0.85
Santa Ana Pegboard
Dom. hand
total*
(n=36)
36.0
(7.7)
(n=36)
37
(31-43)
(n=283)
37.0
(8.4)
(n=283)
37
(31-42)
0.51
Non-dom.
hand total#
(n=36)
36.0
(5.6)
(n=36)
37
(32-40)
(n=281)
35.0
(8.7)
(n=281)
36
(30-42)
0.60
Pursuit Aiming II Test
Total
correct#
(n=34)
60.0
(37.2)
(n=34)
54.0
(35-71)
(n=267)
74.0
(41.4)
(n=267)
74.0
(39-106)
0.06
Brief Symptom Inventory
GSI
Total
score#
(n=36)
56.0
(9)
(n=36)
54
(50-61)
(n=282)
54.0
(9.2)
(n=282)
53
(48-60)
0.35
Log
transformed
score$
(n=36)
1.7
(0.1)
(n=36)
1.7
(1.7-1.8)
(n=282)
1.7
(0.1)
(n=282)
1.7
(1.7-1.8)
0.20
Swedish Q16
Total
score#
(n=36)
4.0
(3.5)
(n=36)
3
(1-6)
(n=282)
4.0
(3.3)
(n=282)
3
(1-6)
0.55
182

Vibration Sense threshold
Total
score#
(n=34)
16.0
(4.9)
(n=34)
16
(12-20)
(n=281)
13.0
(5.4)
(n=281)
13
(10-17)
<0.01
Log
transformed
score$
(n=34)
1.2
(0.1)
(n=34)
1.2
(1.1 -1.3)
(n=281)
1.1
(0.2)
(n=281)
1.1
(1 -1.2)
<0.01
*Based on Two-sample t-test; #Based on Two-sample Wilcoxon Ranksum (Mann-Whitney)
test; $For 4 variables, the distributions were only normalized with log transformation: Digit
Span Standardised Score, Digit Symbol Substitution; GSI BSI and Vibration threshold. Log
transformation did not normalize the other neurobehavioural outcome variables.
Those participants who reported taking medication for psychiatric illness performed
significantly worse than those without psychiatric illness (Table 4.18) on the Global
Severity Index of the Brief Symptom Inventory (p=0.03) and on the Q16 (p=0.04). In
both these tests higher scores indicate poorer performance.
Table 4.18 Neurobehavioural outcomes and psychiatric illness
Outcome Psychiatric illness No psychiatric illness
P-value Mean
(SD)
Median
(IQR)
Mean
(SD)
Median
(IQR)
Digit Span
Forward#
(n=5)
4.8
(1.1)
(n=5)
5
(5-5)
(n=314)
6.1
(2.2)
(n=314)
6
(5-7)
0.14
Backward#
(n=5)
3
(1.7)
(n=5)
4
(3-4)
(n=314)
3.5
(1.6)
(n=314)
2
(2-4)
0.84
WAIS-III Std
Score#
(n=5)
5.8
(0.8)
(n=5)
6
(5-6)
(n=314)
6.9
(1.9)
(n=314)
6
(6-8)
0.15
Log
transformed
score$
(n=5)
0.8
(0.1)
(n=5)
0.8
(0.7-0.8)
(n=314)
0.8
(0.1)
(n=314)
0.8
(0.8 -0.9)
0.22
Digit Symbol Substitution
WAIS-III Std
Score#
(n=5)
5
(1.2)
(n=5)
5
(4-5)
(n=298)
5.8
(1.5)
(n=298)
5
(5-7)
0.19
Log
transformed
score$
(n=5)
0.7
(0.1)
(n=5)
0.7
(0.6-0.7)
(n=298)
0.8
(0.1)
(n=298)
0.7
(0.7-0.9)
0.25
Benton Visual Retention Test
Number
Correct#
(n=5)
5.8
(1.9)
(n=5)
6
(5-7)
(n=314)
6
(2.1)
(n=314)
6
(6-8)
0.77
183

Santa Ana Pegboard
Dom. hand
total*
(n=5)
33.4
(5.9)
(n=5)
33
(31-38)
(n=314)
36.7
(8.4)
(n=314)
37
(31-42)
0.39
Non-dom.
hand total#
(n=5)
29.8
(6.4)
(n=5)
28
(27-31)
(n=312)
35.21
(8.42)
(n=312)
36
(30-41)
0.10
Pursuit Aiming II Test
Total
correct#
(n=5)
60.8
(32)
(n=5)
77
(73-88)
(n=296)
72.4
(41.3)
(n=296)
68.5
(38-105.5)
0.97
Brief Symptom Inventory
GSI#
Total
score
(n=5)
63.4
(10.6)
(n=5)
64
(63-64)
(n=313)
54
(9.1)
(n=313)
53
(48-59)
0.03
Log
transformed
score$
(n=5)
1.8
(0.1)
(n=5)
1.8
(1.8-1.8)
(n=313)
1.7
(0.1)
(n=313)
1.7
(1.7 -1.8)
0.03
Swedish Q16
Total
score#
(n=5)
9.2
(5.9)
(n=5)
11
(3-14)
(n=313)
4.1
(3.3)
(n=282)
3
(1-6)
0.04
Vibration Sense threshold
Total
score#
(n=5)
16.4
(4.6)
(n=5)
17
(15 -20)
(n=310)
13.4
(5.4)
(n=310)
13
(9.5-16.5)
0.14
Log
transformed
score$
(n=5)
1.2
(0.1)
(n=5)
1. 2
(1.2 -1.3)
(n=310)
1.1
(0.2)
(n=310)
1.1
(1 -1.2)
0.18
* Based on Two-sample t-test; # Based on Two-sample Wilcoxon Ranksum (Mann-Whitney)
test; $ For 4 variables, the distributions were only normalized with log transformation: Digit
Span Standardised Score, Digit Symbol Substitution; GSI BSI and Vibration threshold. Log
transformation did not normalize the other neurobehavioural outcome variables.
Low socio-economic status (Table 4.19) was significantly associated with poorer
performance on the Digit Symbol WAIS-III (p<0.001), Benton Visual Retention Test
(p<0.001) and the Santa Ana Pegboard, non-dominant hand (p=0.001).
Table 4.19 Neurobehavioural outcomes and low socio-economic status
Outcome Low socio-economic
status
High socio-economic
status
P-value
Mean
(SD)
Median
(IQR)
Mean
(SD)
Median
(IQR)
Digit Span
Forward#
(n=42)
6.1
(2.1)
(n=42)
6
(5-7)
(n=277)
6.1
(2.2)
(n=277)
6
(5-7)
1.00
184

Backward#
(n=42)
3.3
(1.7)
(n=42)
4
(2-4)
(n=277)
3.5
(1.5)
(n=277)
3
(2-4)
0.82
WAIS-III Std
Score#
(n=42)
6.8
(1.9)
(n=42)
7
(6-8)
(n=277)
6.9
(1.9)
(n=277)
6
(6-8)
0.95
Log
transformed
score$
(n=42)
0.8
(0.1)
(n=42)
0.9
(0.8 -0.9)
(n=277)
0.8
(0.1)
(n=277)
0.8
(0.8 -0.9)
0.76
Digit Symbol Substitution
WAIS-III Std
Score#
(n=40)
4.7
(1.1)
(n=40)
5
(4-5)
(n=263)
5.9
(1.5)
(n=263)
6
(5-7)
<0.01
Log
transformed
score$
(n=40)
0.7
(0.1)
(n=40)
0.7
(0.6-0.7)
(n=263)
0.8
(0.1)
(n=263)
0.8
(0.7-0.9)
<0.01
Benton Visual Retention Test
Number
Correct#
(n=42)
5
(2.1)
(n=42)
5
(3-7)
(n=277)
6.2
(2)
(n=277)
6
(5-8)
<0.01
Santa Ana Pegboard
Dom. hand
total*
(n=42)
34.5
(7.6)
(n=42)
35
(29-38)
(n=277)
37
(8.4)
(n=277)
37
(32-43)
0.08
Non-dom.
hand total#
(n=42)
31.4
(8.6)
(n=42)
32
(25-37)
(n=275)
35.7
(8.3)
(n=275)
36
(31-42)
<0.01
Pursuit Aiming II Test
Total
correct#
(n=38)
64.21
(39.91)
(n=38)
59
(28-93)
(n=263)
73.57
(41.26)
(n=263)
70
(41-106)
0.21
Brief Symptom Inventory
GSI#
Total
score
(n=41)
54.8
(8.7)
(n=41)
53
(48-62)
(n=277)
54.1
(9.3)
(n=277)
53
(48-60)
0.71
Log
transformed
score$
(n=41)
1.7
(0.1)
(n=41)
1.7
(1.7 -1.8)
(n=313)
1.7
(0.1)
(n=313)
1.72
(1.7 -1.8)
0.60
Swedish Q16
Total
score#
(n=42)
4.3
(3.8)
(n=42)
3
(1-7)
(n=276)
4.1
(3.3)
(n=276)
3
(1-6)
0.93
Vibration Sense threshold
Total
score#
(n=41)
14.6
(5)
(n=41)
14
(11-17)
(n=274)
13.3
(5.5)
(n=274)
13
(9-16.5)
0.10
Log
transformed
score$
(n=41)
1.1
(0.2)
(n=41)
1.2
(1-1.2)
(n=274)
1.1
(0.2)
(n=274)
1.1
(1 -1.2)
0.08
* Based on Two-sample t-test; # Based on Two-sample Wilcoxon Ranksum (Mann-Whitney)
test; $ For 4 variables, the distributions were only normalized with log transformation: Digit
Span Standardised Score, Digit Symbol Substitution; GSI BSI and Vibration threshold. Log
transformation did not normalize the other neurobehavioural outcome variables.
185

4.3.2 Neurobehavioural outcomes by applicator status
Table 4.20 shows the results for all the neurobehavioural outcomes by applicator
status. Applicators included all farmers who either mixed or applied all classes of
pesticides (such as carbamates, organophosphates, pyrethroids and all other forms of
agrichemicals) by back pack, quad bike, tractor or manually. The results showed a
borderline difference between applicators and non-applicators on the Santa Ana
Pegboard dominant hand mean scores with lower mean scores for non-applicators
35.7 (±8) (p=0.06). There were no statistically significant differences between
applicators and non-applicators on most of the neurobehavioural outcome scores.
There were no significant differences between applicators and non-applicators of
pesticides on the Brief Symptom Inventory dimension scores and Global Severity
Index. Applicators reported lower mean scores than non-applicators on the Swedish
Q16 test but the difference was not statistically significant (p=0.09) (Two-sample
Wilcoxon rank-sum (Mann-Whitney) tests).
Table 4.20 Neurobehavioural outcomes by applicator status
Outcome Applicator Non-applicator
P-value Mean
(SD)
Median
(IQR)
Mean
(SD)
Median
(IQR)
Digit Span
Forward#
(n=169)
6
(2.2)
(n=169)
6
(5-7)
(n=150)
6.2
(2.1)
(n=150)
6
(5-8)
0.39
Backward#
(n=169)
3.5
(1.6)
(n=169)
3
(2-4)
(n=150)
3.4
(1.5)
(n=150)
3
(2-4)
0.64
WAIS-III Std
Score#
(n=169)
6.9
(2)
(n=169)
6
(6-8)
(n=150)
6.9
(1.8)
(n=150)
6.5
(6-8)
0.92
Log
transformed
score$
(n=169)
0.8
(0.1)
(n=169)
0.8
(0.8 -0.9)
(n=150)
0.8
(0.1)
(n=150)
0.8
(0.8 -0.9)
0.85
Digit Symbol Substitution
WAIS-III Std
Score#
(n=163)
5.8
(1.5)
(n=163)
5
(5-7)
(n=140)
5.8
(1.5)
(n=140)
5
(5-7)
0.95
Log
transformed
score$
(n=163)
0.8
(0.1)
(n=163)
0.7
(0.7 -0.9)
(n=140)
0.8
(0.1)
(n=140)
0.7
(0.7-0.9)
0.84
Benton Visual Retention Test
Number
Correct#
(n=169)
6
(2.1)
(n=169)
6
(4-8)
(n=150)
6
(2)
(n=150)
6
(5-7)
0.95
186

* Based on Two-sample t-test; # Based on Two-sample Wilcoxon Ranksum (Mann-Whitney)
test; $ For 4 variables, the distributions were only normalized with log transformation: Digit
Span Standardised Score, Digit Symbol Substitution; GSI BSI and Vibration threshold. Log
transformation did not normalize the other neurobehavioural outcome variables.
Pearson chi-square tests of independence were performed to examine the
relationship between BSI positive cases (‘caseness’) and covariates and results
revealed a significant relationship between participants with a T-score ≥63 and
psychiatric illness X2(1, N = 318) = 13.96, p<0.001). The relationship between BSI
caseness and all other covariates was not significant.
Santa Ana Pegboard
Dom. hand
total*
(n=169)
37.5
(8.6)
(n=169)
37
(32-44)
(n=150)
35.7
(8)
(n=150)
36
(31-41)
0.06
Non-dom.
hand total#
(n=168)
35.6
(8.6)
(n=168)
36
(31-42)
(n=149)
34.6
(8.2)
(n=149)
36
(29-41)
0.32
Pursuit Aiming II Test
Total correct# (n=163)
75.2
(41.1)
(n=163)
73
(44-105)
(n=138)
69.1
(41.2)
(n=138)
62.5
(35-105)
0.17
Brief Symptom Inventory
GSI#
Total score
(n=169)
54.1
(9.9)
(n=169)
53
(48-60)
(n=149)
54.3
(8.4)
(n=149)
54
(48-59)
0.66
Log
transformed
score$
(n=169)
1.7
(0.1)
(n=169)
1.7
(1.7 -1.8)
(n=149)
1.7
(0.1)
(n=149)
1.7
(1.7 -1.8)
0.65
Swedish Q16
Total score# (n=168)
3.9
(3.3)
(n=168)
3
(1-6)
(n=149)
4.5
(3.4)
(n=149)
4
(2-7)
0.09
Vibration Sense threshold
Total score# (n=167)
13.7
(5.2)
(n=167)
13.5
(10-17)
(n=148)
13.1
(5.7)
(n=148)
12.3
(9-16)
0.17
Log
transformed
score$
(n=167)
1.1
(0.2)
(n=167)
1.1
(1-1.2)
(n=148)
1.1
(0.2)
(n=148)
1.1
(1 -1.2)
0.22
187

Table 4.21 Global Severity Index Dimension results by applicator status
Dimensions Applicator
(n=169)
Non-applicator
(n=149)
P-value*
Dimensions with T-score
≥63**
115 (68%) 110 (74%) 0.26
With GSI T-score ≥63*** 32 (19%) 24 (16%) 0.51
* Chi2 test
** Any respondent who scores ≥63 on the GSI or on two dimensions is
considered a positive diagnosis or a case (Derogates, 1993).
*** While the GSI T score may be ≤63 the respondent may score ≥63 on two
or more dimensions.
4.3.3 Neurobehavioural outcomes by OP applicator status
Of the 169 applicators, 70 participants were applicators of OP pesticides. Table 4.22
shows the results for all the neurobehavioural outcomes by OP applicator status
(n=70). OP applicators are those applicators who reported having applied OP
pesticides and did not include applicators of carbamates, pyrethroids, or other forms
of agrichemicals, who did not apply OP pesticides. In general, OP applicators tended
to perform slightly better than applicators who applied other pesticides and non-
applicators on all of the neurobehavioural tests but none of the differences were
statistically significant at the p<0.05 level.
Table 4.22 Neurobehavioural outcomes by OP applicator status
Outcome OP applicators Non-applicators¥
P-value Mean
(SD)
Median
(IQR)
Mean
(SD)
Median
(IQR)
Digit Span
Forward#
(n=70)
6.2
(2.4)
(n=70)
6
(5-8)
(n=249)
6.1
(2.1)
(n=249)
6
(5-7)
0.70
Backward#
(n=70)
3.7
(1.9)
(n=70)
4
(2-4)
(n=249)
3.4
(1.4)
(n=249)
3
(2-4)
0.49
WAIS-III Std
Score#
(n=70)
7.2
(2.2)
(n=70)
6.5
(6-8)
(n=249)
6.8
(1.8)
(n=249)
6
(6-8)
0.30
Log
transformed
score$
(n=70)
0.8
(0.1)
(n=70)
0.8
(0.8 -0.9)
(n=249)
0.8
(0.1)
(n=249)
0.8
(0.8 -0.9)
0.29
Digit Symbol Substitution
WAIS-III Std
Score#
(n=68)
5.6
(n=68)
5
(n=235)
5.8
(n=235)
5
0.32
188

(1.4) (5-6) (1.5) (5-7)
Log
transformed
score$
(n=68)
0.7
(0.1)
(n=68)
0.7
(0.7-0.8)
(n=235)
0.8
(0.1)
(n=235)
0.7
(0.7-0.8)
0.22
Benton Visual Retention Test
Number
Correct#
(n=70)
6.1
(2.2)
(n=70)
6
(5-8)
(n=249)
6
(2)
(n=249)
6
(4-8)
0.48
Santa Ana Pegboard
Dom. hand
total*
(n=70)
37.1
(7.8)
(n=70)
37
(32-43)
(n=249)
36.5
(8.5)
(n=249)
37
(31-42)
0.60
Non-dom.
hand total#
(n=70)
35.0
(8.8)
(n=70)
35
(30-40)
(n=247)
35.2
(8.3)
(n=247)
36
(30-42)
0.73
Pursuit Aiming II Test
Total correct# (n=68)
73.6
(43.2)
(n=68)
77
(39-102.5)
(n=233)
72.1
(40.6)
(n=233)
68
(39-105)
0.77
Brief Symptom Inventory
GSI#
Total score
(n=70)
53.2
(9.8)
(n=70)
53
(45-59)
(n=248)
54.4
(9)
(n=248)
54
(48-60)
0.28
Log
transformed
score$
(n=70)
2.0
(0.1)
(n=70)
2
(1.7 -1.8)
(n=248)
2.0
(0.1)
(n=248)
2.0
(1.7 -1.8)
0.29
Swedish Q16
Total
score#
(n=69)
3.9
(3.3)
(n=69)
3
(1-6)
(n=248)
4.2
(3.4)
(n=248)
3
(2-6)
0.52
Vibration Sense Threshold
Total
score#
(n=69)
13.1
(5.4)
(n=69)
12
(9-16)
(n=246)
13.6
(5.4)
(n=246)
13
(9.5-16.5)
0.57
Log
transformed
score$
(n=69)
1.1
(0.2)
(n=69)
1.1
(1 -1.2)
(n=246)
1.1
(0.2)
(n=246)
1.1
(1 -1.2)
0.56
¥All participants who did not apply OP pesticides
* Based on Two-sample t-test; # Based on Two-sample Wilcoxon Ranksum (Mann-Whitney)
test; $ For 4 variables, the distributions were only normalized with log transformation: Digit
Span Standardised Score, Digit Symbol Substitution; GSI BSI and Vibration threshold. Log
transformation did not normalize the other neurobehavioural outcome variables.
Table 4.23 shows the results for the BSI Global Severity Index by OP applicator
status. The scores of OP applicators were virtually indistinguishable from other
workers.
189

Table 4.23 Global Severity Index Dimension results by OP applicator status
Dimensions OP applicator
(n=70)
Non-OPapplicator
(n=248)
P-value*
Dimensions with T-score
≥63**
47 (67%) 178 (72%) 0.45
With GSI T-score ≥63*** 11 (16%) 45 (18%) 0.64
* Chi2 test
** Any respondent who scores ≥63 on the GSI or on two dimensions is
considered a positive diagnosis or a case (Derogates, 1993).
*** While the GSI T score may be ≤63 the respondent may score ≥63 on two
or more dimensions.
4.3.4 Neurobehavioural outcomes by past pesticide poisoning status
Table 4.24 compares the prevalence of all outcomes between those diagnosed with
past pesticide poisoning (n=23) and those not. Non-poisoned participants performed
better than doctor-diagnosed poisoned participants on 7 of the 11 neurobehavioural
tests. Participants with past poisoning showed significantly decreased extinction time
on the Tuning Fork (vibration sense) (p=0.025). For all other tests differences were
not significant at the p<0.05 level (Wilcoxon rank-sum (Mann-Whitney) tests).
Table 4.24 Neurobehavioural outcomes by diagnosed past poisoning status Outcome Poisoned (n=23)
1 Non-poisoned (n=178)
P-value
Mean
(SD)
Median
(IQR)
Mean
(SD)
Median
(IQR)
Digit Span
Forward#
(n=23)
5.5
(2.1)
(n=23)
5
(4-7)
(n=178)
6.2
(2.1)
(n=178)
6
(5-8)
0.12
Backward#
(n=23)
3.4
(2.0)
(n=23)
3
(2-4)
(n=178)
3.5
(1.5)
(n=178)
4
(2-4)
0.42
WAIS-III Std
Score#
(n=23)
6.5
(2.1)
(n=23)
6
(5-8)
(n=178)
7
(1.9)
(n=178)
7
(6-8)
0.14
Log
transformed
score$
(n=23)
0.8
(0.1)
(n=23)
0.8
(0.7-0.9)
(n=178)
0.8
(0.1)
(n=178)
0.8
(0.8-0.9)
0.17
Digit Symbol Substitution
WAIS-III Std
Score#
(n=21)
5.6
(1.8)
(n=21)
5
(5-5)
(n=171)
5.8
(1.4)
(n=171)
5
(5-6)
0.15
1 Past poisoned participants as treated and diagnosed by a health professional
190

Log
transformed
score$
(n=21)
0.7
(0.1)
(n=21)
0.7
(0.7-0.7)
(n=171)
0.7
(0.1)
(n=171)
0.7
(0.7-0.8)
0.38
Benton Visual Retention Test
Number
Correct#
(n=23)
6.2
(2.4)
(n=23)
7
(3-8)
(n=178)
6.2
(2)
(n=178)
6
(5-8)
0.78
Santa Ana Pegboard
Dom. hand
total*
(n=23)
36
(9.7)
(n=23)
37
(28-45)
(n=178)
37.3
(8.6)
(n=178)
38
(32 - 43)
0.47
Non-dom.
hand total#
(n=23)
37.5
(7)
(n=23)
38
(33-42)
(n=177)
35.6
(8.6)
(n=177)
36
(31-42)
0.32
Pursuit Aiming II Test
Total
correct#
(n=22)
73
(39.9)
(n=22)
67
(55-103)
(n=172)
70.3
(40.2)
(n=172)
64
(37-104)
0.67
Brief Symptom Inventory
GSI
Total score#
(n=23)
52.3
(8.5)
(n=23)
54
(45-59)
(n=151)
54.1
(9.4)
(n=151)
53
(48-59)
0.53
Log
transformed
score$
(n=23)
1.7
(0.1)
(n=23)
1.7
(1.7-1.8)
(n=151)
1.7
(0.1)
(n=151)
1.7
(1.7-1.8)
0.42
Swedish Q16
Total score# (n=48)
3.8 (2.6)
(n=48) 3
(2-6)
(n=178) 4.1
(3.3)
(n=178) 3
(1-6)
0.91
Vibration Sense threshold Total score
# (n=22) 11
(5.6)
(n=22) 8.3
(8-17)
(n=177) 13.2 (5.2)
(n=177) 13
(9.5-16.5)
0.02
Log
transformed
score$
(n=22) 1
(0.2)
(n=22) 0.9
(0.9-1.1)
(n=177) 1.1
(0.2)
(n=177) 1.1
(1-1.2)
0.03
Note: Information on previous poisoning could not be collected from 118
participants. * Based on Two-sample t-test; # Based on Two-sample Wilcoxon Ranksum
(Mann-Whitney) test; $ For 4 variables, the distributions were only normalized with log
transformation: Digit Span Standardised Score, Digit Symbol Substitution; GSI BSI and
Vibration threshold. Log transformation did not normalize the other neurobehavioural
outcome variables.
4.4. MULTIVARIATE ASSOCIATIONS
Significant potential confounders were identified during bivariate analyses
(involving age, gender, schooling, language, height, smoking, current alcohol
consumption, previous head injury, psychiatric illness and socio-economic status)
these variables and were included in model building. A priori confounders identified
in the literature were similar to those selected during the model building exercise and
191

were forced into the regression models with each exposure variable (Table 4.25).
Other covariates investigated included height, language and current smoking and
were also included in the model building exercise. Height and current smoking were
not significantly associated with any of the outcomes and were excluded from the
regression models. Language was the only other confounder significantly associated
with Digit Symbol, Benton Visual Retention, Santa Ana non-dominant hand and Q16
and was only included in the regression models for these outcomes.
Table 4.25 Covariates included in multivariate logistic regression analyses
Covariate Type of variable Coded
Low age Categorical 1 = low age (below the median
0 = high age (above the median)
Low education Categorical 1 = low education (below the
median
0 = high education (above the
median)
Gender Categorical 1 = male
0 = female
Language Categorical 1 = speaks Afrikaans
0 = does not speak Afrikaans
Alcohol consumption
(Current use)
Categorical 1 = current alcohol consumption
0 = does not use alcohol
Previous head injury Categorical 1 = previous head injury
0 = no previous head injury
Psychiatric illness Categorical 1 = psychiatric illness
0 = no psychiatric illness
Socio-economic status
(SES)
Categorical 1 = low SES(<4 items)
0 = high SES(≥4 items)
Since outcomes were not normally distributed and most could not be normalized
through log transformation, linear regression analyses were not used. Associations
between neurobehavioural outcomes and exposure were therefore investigated
further by dichotomizing outcomes and using logistic regression analyses. Outcomes
(Digit Span, Digit Symbol, Benton Visual Retention Test, Santa Ana Pegboard,
Pursuit Aiming and vibration sense threshold) where higher scores indicated better
performance were dichotomized at the 25th
percentile with those lower than this
centile indicating poor performance. Those outcomes where higher scores indicated
192

poorer performance outcomes were dichotomized at the 75th
percentiles with those
higher than this centile indicating poor performance (Table 4.26).
Four different cumulative exposure metrics were used alternatively in modelling
exposure-outcome relationships. These were: (i) unweighted total OP exposure days
(total B_OPdys); (ii) total OP exposure days weighted for job activity
(B_OPjemdys); (iii) OP jem crop days weighted for type of crop (B_OPjemcrpdys)
Table 4.26 Outcomes (25th
percentile) included in multivariate logistic
regression analyses
Dichotomized outcome 25th
Percentile
value
Coded
Digit Span forward 5 ≤ 5 =low performance
> 5 = high performance
Digit Span backward 2 ≤ 2 = low performance
> 2 = high performance
Digit Span
WAIS-III Std Score 6 ≤6= low performance
> 6 = high performance
Digit Span
Log transformed score* 0.78 ≤0.78= low performance
>0.78= high performance
Digit Symbol
WAIS-III Std Score 5 ≤ 5 = low performance
> 5 = high performance
Digit Symbol
Log transformed score* 0.70 ≤ 0.70 = low performance
> 0.70 = high performance
Benton Visual Retention
Test - Number Correct 4 ≤4 = low performance
>4 = high performance
Santa Ana Pegboard
Dom. hand total 31 ≤31= low performance
>31= high performance
Santa Ana Pegboard
Non-dom. hand total 30 ≤30= low performance
>30= high performance
Pursuit Aiming II Test
Total correct
39
≤39 = low performance
>39 = high performance
Brief Symptom Inventory
GSI 60 ≥60 = low performance
<60 = high performance
Brief Symptom Inventory
Log transformed score* 1.78 ≥1.78 = low performance
<1.78 = high performance
193

Swedish Q16
6 ≥6 = low performance
<6 = high performance
Vibration Sense threshold
9.5 ≤9.5 = low performance
>9.5 = high performance
Vibration Sense threshold
Log transformed score* 0.98 ≤0.98 = low performance
>0.98 = high performance
and; (d) the intensity of OP days per annum where OP jemcrop days
(B_OPjemcrpdys_pa) were divided by the total number of years worked. Results for
exposure-outcome associations were similar for the models using different exposure
metrics. Only the results for B_OP jemdays are presented here but the results for all
the other models are included in Appendix I. Table 4.27 shows the outcomes and
covariates included in regression models with each of the exposure variables listed.
4.4.1. Multivariate associations between outcomes and OP applicator status
Tables 4.28, 4.30 to 4.32 present the multivariate logistic regression results for the
relationship between dichotomised outcomes and four metrics for OP exposure: (i)
OP applicator status (B_OPappl), (ii) cumulative OP exposure weighted for
task/activity (B_OPjemdays), (iii) diagnosed past poisoning and (iv) cumulative OP
exposure adjusted for diagnosed past poisoning. Table 4.28 shows a comparison of
crude and adjusted Odds Ratio for the dichotomised neurobehavioral outcomes for
OP applicator status as the exposure measure. Schooling remained a significant
covariate in the regression models on the performance of eight out of the eleven
outcomes (p<0.05), low socio-economic status was a significant covariate in
participants’ performance on Digit Symbol, Benton Visual Retention test and Santa
Ana Pegboard non-dominant hand (p<0.05) and psychiatric illness was a significant
covariate on the participants’ performance on the Global Severity Index of the BSI
(p<0.05).
The results showed that there were no significant associations between OP
applicator status as a measure of exposure and any of the neurobehavioural tests in
the crude associations as well as the adjusted associations. In the crude associations
194

OP applicators performed better on seven of the tests (Digit Span Forward, Digit
Span WAIS, Benton Visual Retention, Santa Ana dominant hand, Pursuit Aiming,
BSI, Q16), but performed worse on four of the tests (Digit Span backward, Digit
Symbol WAIS, Santa Ana non-dominant hand and vibration sense threshold test). In
the adjusted models OP applicators performed better on nine of the tests and worse
on Santa Ana non-dominant hand and vibration sense threshold test).
Age, schooling, current alcohol consumption and psychiatric illness significantly
predicted poorer performance on the neurobehavioural tests in the expected direction.
Younger participants performed better than older participants and those with lower
schooling performed worse than those with higher schooling levels on Digit Span,
Digit Symbol, Benton Visual Retention and Pursuit Aiming while older participants
performed worse than younger participants on the Digit Symbol, Santa Ana
dominant hand and Pursuit Aiming.
Sensitivity analyses in this present study, where those participants who could not
identify or remember pesticides were included in the analyses as (1) OP applicators
and then (2) as non-OP applicators and finally (3) as missing data, did not produce
different results.
195

Table 4.27 Outcomes, covariates and exposure variables included in regression models
Outcome Covariates Exposure variables (alternate models)
Digit Span Forward Age, gender, education, current alcohol OP applicator, OP jemdays, diagnosed
consumption, head injury, psychiatric illness, past poisoning
socio-economic status
Digit Span Backward Age, gender, education, current alcohol OP applicator, OP jemdays, diagnosed
consumption, head injury, psychiatric illness, past poisoning
socio-economic status
Digit Span WAIS Age, gender, education, current alcohol OP applicator, OP jemdays, diagnosed
consumption, head injury, psychiatric illness, past poisoning
socio-economic status
Digit Symbol Substitution Age, gender, education, language, current alcohol OP applicator, OP jemdays, diagnosed
consumption, head injury, psychiatric illness, past poisoning
socio-economic status
Benton Visual Retention Test Age, gender, education, language, current alcohol OP applicator, OP jemdays, diagnosed
consumption, head injury, psychiatric illness, past poisoning
socio-economic status
Santa Ana Pegboard dom. Hand Age, gender, education, current alcohol OP applicator, OP jemdays, diagnosed
consumption, head injury, psychiatric illness, past poisoning
socio-economic status
Santa Ana Pegboard non-dom. Hand Age, gender, education, language, current alcohol OP applicator, OP jemdays, diagnosed
consumption, head injury, psychiatric illness, past poisoning
socio-economic status
196

Pursuit Aiming II Test Age, gender, education, current alcohol OP applicator, OP jemdays, diagnosed
consumption, head injury, psychiatric illness, past poisoning
socio-economic status
Brief Symptom Inventory Age, gender, education, current alcohol OP applicator, OP jemdays, diagnosed
consumption, head injury, psychiatric illness, past poisoning
socio-economic status
Swedish Q16 Age, gender, education, language, current alcohol OP applicator, OP jemdays, diagnosed
consumption, head injury, psychiatric illness, past poisoning
socio-economic status
Vibration Sense threshold Age, gender, education, current alcohol OP applicator, OP jemdays, diagnosed
consumption, head injury, psychiatric illness, past poisoning
socio-economic
197

Table 4.28 Crude and adjusted logistic regression results for neurobehavioural outcome-exposure relationships: OP applicators (n=70)
versus non-OP applicators (n=249)
Exposure variable - B_OPappl
Crude associations
Adjusted associations
Significant covariates in the model*
Dichotomised outcomes N OR 95% CI p-value OR 95% CI p-
value Covariates OR (95% CI)
Digit Span Forward 319 0.92 0.54 – 1.58 0.77 0.72 0.40 – 1.27 0.25 None
Digit Span Backward 319 1.12 0.63 – 2.00 0.71 0.96 0.52 – 1.80 0.90 Low schooling
Prev. head injury 2.40; 1.27 - 4.51 0.30; 0.11 - 0.81
Digit Span WAIS 319 0.92 0.54 – 1.56 0.74 0.77 0.44 – 1.36 0.37 Low schooling 1.72; 1.02 - 2.89
Digit Symbol WAIS** 303 1.01 0.50 – 2.06 0.97 0.61 0.25 – 1.49 0.28 Low age
Low schooling Language
Curr. alcohol use SES
0.31; 0.13 - 0.72 7.16; 2.24 - 22.94 0.23; 0.09 - 0.55 4.57; 1.85 - 11.30 3.34; 1.36 - 8.21
Benton VRT** 319 0.86 0.46 – 1.60 0.63 0.74 0.37 – 1.48 0.39 Low schooling
Language
2.25; 1.12 - 4.52 0.19; 0.09 - 0.40
Santa Ana dom. hand 319 0.74 0.39 – 1.40 0.36 0.69 0.35 – 1.38 0.30 Low age 0.49; 0.27 - 0.90
Santa Ana non-dom.
hand** 317 1.09 0.60 – 1.98 0.78 1.02 0.53 – 1.99 0.95 Language
Prev. head injury
0.40; 0.19 - 0.84 0.32; 0.11 - 0.98
198

Notes:
*For low age and low schooling median cut off values were used where low age = 1 and high age = 0 and low schooling = 1 and high
schooling = 0. Language was categorised as 1 for Afrikaans speakers and 0 for non-Afrikaans speakers
** Language was selected in model building for this outcome and included in the model together with all the other a priori covariates
(age, gender, schooling, previous head injury, psychiatric illness and low socio-economic status)
Exposure variable - OP applicator/non-OP
applicator
Crude associations
Adjusted associations
Significant covariates in the model*
Dichotomous outcomes N OR 95% CI p-value OR 95% CI p-value Covariates OR
Pursuit Aiming 301 0.94 0.505 – 1.75 0.85 0.76 0.38 – 1.52 0.44 Low age Low schooling
0.28; 0.14 - 0.53 2.76; 1.35 - 5.65
BSI/GSI 318 0.90 0.488 – 1.67 0.75 0.86 0.44 – 1.68 0.66 Psychiatric illness 13.04; 1.38 -123.26
Swedish Q16** 319 0.83 0.46 – 1.50 0.54 0.88 0.46 – 1.67 0.69 Low schooling
Language 2.40; 1.30 - 4.42 2.41; 1.00 - 5.80
Vibration Sense Test 310 1.20 0.648 – 2.21 0.57 1.22 0.64 – 2.36 0.55 None
199

4.4.2. Multivariate associations between outcomes and OP jemdays (B_OPjemdays)
In order to generate interpretable Odds Ratios (ORs) and to explore a possible dose-response
relationship, four dichotomous exposure variables were generated based on the quartiles of
OP jemdays (Table 4.29). For all four exposure variables, non-applicators were coded ‘0’
and those falling within the quartiles were coded ‘1’. The four exposure variables were
included individually in the regression models.
Table 4.29 Exposure variables used to calculate cumulative exposure
Exposure variables
Quartile
values
Variable name
OP jemdays up to and including the
25th
quartile (n=19)
2.6 - 31.5
B_OPjmdys_1
OP jemdays between the 25th
and 50th
quartile (n=16)
38.5 - 211.9 B_OPjmdys_2
OP jemdays between the 50th
and 75th
quartile (n=17)
215.6 - 667.4 B_OPjmdys_3
OP jemdays equal to and greater than
the 75th
quartile (n=18)
696.3 - 2058.7 B_OPjmdys_4
A comparison of crude and adjusted Odds Ratios are presented in Table 4.30 for the
dichotomised neurobehavioral outcomes for total cumulative OP exposure days weighted for
job task and dichotomised at each quartile (B_OPjemdays).
Crude and adjusted results showed that participants with cumulative OP pesticide exposure
within the third quartile (OPjmdys50-75) were three times more likely to show shortened
extinction times on the Tuning Fork (poorer vibration sense) than those without OP exposure
(OR= 3.08; 95% CI 1.05 to 9.07, p<0.04). However, there was no dose-response
relationship evident across the quartiles.
200

Table 4.30 Adjusted logistic regression results for dichotomous neurobehavioural outcome-exposure relationships: Total OP exposure days
weighted by activity (B_OPjemdays)
Exposure variable -
B_OPJemdays Crude associations Adjusted associations
Significant covariates
in the model
Dichotomised outcomes N OR 95% CI p-value OR 95% CI p-value Covariate* OR (95% CI)
Digit Span Forward
Referent group§ 249 1.00 (ref. group) - 1.00 (ref. group) -
OPjmdys_1 19 1.18 0.46 – 2.99 0.74 1.00 0.36 – 2.72 0.99 None
OPjmdys_2 16 1.31 0.48 – 3.59 0.61 0.99 0.35 – 2.86 0.99
OPjmdys_3 17 0.40 0.13 – 1.27 0.12 0.27 0.08 – 0.93 0.04
OPjmdys_4 18 1.04 0.40 – 2.74 0.93 0.80 0.30 – 2.16 0.66
Digit Span Backward
Referent group§ 249 1.00 (ref. group) - 1.00 (ref. group) -
OPjmdys_1 19 0.70 0.22 – 2.17 0.53 0.58 0.17 – 1.93 0.37 Low schooling 2.39; 1.27 - 4.50
OPjmdys_2 16 1.19 0.40 – 3.54 0.76 1.06 0.33 – 3.41 0.92 Head injury 0.30; 0.11 - 0.83
OPjmdys_3 17 1.42 0.51 – 4.00 0.50 1.26 0.42 – 3.81 0.68
OPjmdys_4 18 1.30 0.47 – 3.61 0.61 1.12 0.39 – 3.28 0.83
Digit Span WAIS
Referent group§ 249 1.00 (ref. group) - 1.00 (ref. group) -
OPjmdys_1 19 0.82 0.32 – 2.10 0.68 0.72 0.26 – 1.94 0.51 Low schooling 1.70; 1.01 - 2.88
OPjmdys_2 16 0.92 0.33 – 2.52 0.86 0.79 0.27 – 2.27 0.65
OPjmdys_3 17 0.64 0.24 – 1.74 0.38 0.51 0.17 – 1.48 0.21
OPjmdys_4 18 1.44 0.54 – 3.83 0.47 1.18 0.43 – 3.26 0.75
Digit Symbol WAIS
Referent group§ 235 1.00 (ref. group) - 1.00 (ref. group) -
OPjmdys_1 18 0.95 0.26 – 3.42 0.93 0.16 0.02 – 1.05 0.06 Low age 0.26; 0.11 - 0.63
OPjmdys_2 16 1.09 0.30 – 4.01 0.89 0.63 0.12 – 3.38 0.59 Low schooling 7.87; 2.38 - 26.03
OPjmdys_3 17 1.01 0.28 – 3.69 0.98 1.67 0.29 – 9.83 0.49 Language** 0.19; 0.07 - 0.48
OPjmdys_4 17 1.01 0.28 – 3.69 0.98 0.24 0.05 – 1.33 0.66 Curr. Alcohol use 4.96; 1.96 - 12.59
SES 4.36; 1.68 - 11.32
201

Benton VRT
Referent group§ 249 1.00 (ref. group) - 1.00 (ref. group) -
OPjmdys_1 19 0.77 0.25 – 2.41 0.65 0.35 0.09 – 1.38 0.13 Low schooling 2.18; 1.07 - 4.43
OPjmdys_2 16 0.67 0.18 – 2.42 0.54 0.56 0.13 – 2.39 0.43 Language** 0.17; 0.08 - 0.36
OPjmdys_3 17 0.39 0.09 – 1.73 0.21 0.44 0.09 – 2.13 0.31
OPjmdys_4 18 1.84 0.68 – 4.95 0.23 2.05 0.72 – 5.84 0.18
Santa Ana dom. hand
Referent group§ 249 1.00 (ref. group) - 1.00 (ref. group) -
OPjmdys_1 19 1.25 0.46 – 3.43 0.66 0.93 0.31 – 2.77 0.90 Low age 0.49; 0.27 - 0.90
OPjmdys_2 16 0.39 0.09 – 1.75 0.22 0.41 0.09 – 1.95 0.27
OPjmdys_3 17 0.58 0.16 – 2.09 0.41 0.69 0.18 – 2.71 0.60
OPjmdys_4 18 0.78 0.25 – 2.44 0.67 0.69 0.21 – 2.27 0.54
Santa Ana non-d. hand
Referent group§ 247 1.00 (ref. group) - 1.00 (ref. group) -
OPjmdys_1 19 1.70 0.64 – 4.52 0.28 0.93 0.30 – 2.85 0.89 Low schooling 1.98; 1.03 - 3.80
OPjmdys_2 16 1.75 0.61 – 5.02 0.30 2.28 0.73 – 7.17 0.16 Language** 0.41; 0.20 - 0.87
OPjmdys_3 17 0.63 0.17 – 2.25 0.47 0.63 0.16 – 2.50 0.51 Prev. head injury 0.32; 0.11 - 0.99
OPjmdys_4 18 0.58 0.16 – 2.09 0.41 0.76 0.20 – 2.87 0.69
Pursuit Aiming
Referent group§ 233 1.00 (ref. group) - 1.00 (ref. group) -
OPjmdys_1 18 0.56 0.16 – 2.02 0.38 0.29 0.07 – 1.19 0.09 Low age 0.26; 0.14 - 0.51
OPjmdys_2 15 1.03 0.32 – 3.34 0.97 1.06 0.29 – 3.92 0.93 Low schooling 2.76; 1.34 - 5.68
OPjmdys_3 17 0.60 0.17 – 2.18 0.44 0.68 0.17 – 2.80 0.60
OPjmdys_4 18 1.79 0.67 – 4.84 0.25 1.41 0.47 – 4.20 0.54
BSI/GSI
Referent group§ 248 1.00 (ref. group) - 1.00 (ref. group) -
OPjmdys_1 19 0.75 0.24 – 2.34 0.62 0.48 0.13 – 1.86 0.29 Psychiatric illness 16.87;1.66 - 171.48
OPjmdys_2 16 1.280 0.43 – 3.82 0.66 1.62 0.52 – 5.05 0.41
OPjmdys_3 17 0.866 0.27 – 2.75 0.81 0.75 0.21 – 2.68 0.66
OPjmdys_4 18 0.804 0.26 – 2.53 0.71 0.93 0.29 – 3.01 0.90
202

Notes: *For low age and low schooling median cut off values were used where low age = 1 and high age = 0 and low schooling = 1 and high schooling = 0. Language
was categorised as 1 for Afrikaans speakers and 0 for non-Afrikaans speakers ** Language was selected in model building for this outcome and included in the model
together with all the other a priori covariates (age, gender, schooling, previous head injury, psychiatric illness and low socio-economic status) §The referent group for OPjemdays has zero number of exposure days
Swedish Q16
Referent group§ 248 1.00 (ref. group) - 1.00 (ref. group) -
OPjmdys_1 19 1.03 0.38 – 2.81 0.95 0.96 0.32 – 2.92 0.95 Low schooling 2.50; 1.35 - 4.63
OPjmdys_2 15 1.02 0.34 – 3.02 0.98 1.38 0.44 – 4.39 0.58 Language** 2.51; 1.03 - 6.10
OPjmdys_3 17 0.69 0.22 – 2.18 0.52 0.73 0.21 – 2.55 0.62
OPjmdys_4 18 0.64 0.20 – 2.00 0.44 0.62 0.19 – 2.02 0.43
Vibration Sense Test
Referent group§ 246 1.00 (ref. group) - 1.00 (ref. group) -
OPjmdys_1 19 0.19 0.03 – 1.44 0.11 0.23 0.03 – 1.78 0.16 None
OPjmdys_2 15 1.70 0.56 – 5.17 0.35 1.59 0.50 – 5.10 0.43
OPjmdys_3 17 3.02 1.11 – 8.18 0.03 3.08 1.05 – 9.07 0.04
OPjmdys_4 18 0.97 0.31 – 3.06 0.96 1.02 0.31 – 3.36 0.97
203

Participants with OP pesticide exposure in the second quartile showed a two-fold
likelihood of poorer performance on the Benton Visual Retention (OR= 2.05; 95%
CI 0.72 to 5.84, p<0.18) and Santa Ana non-dominant hand test compared to those
without OP pesticide exposure but the results were not significant (OR= 2.28;95% CI
0.73 to 7.17, p<0.16). The results for the Digit Span Forward test showed a
significant difference between participants with reported exposure to OP pesticides
in the third quartile and those with no reported exposure to OP pesticides but the
results were in the opposite direction in that applicators performed better than non-
applicators (OR= 0.27; 95% CI 0.08 to 0.93, p<0.04). The results do not show a
consistent positive and/or dose-response relationship between neurobehavioural
outcomes and cumulative exposure, here expressed as OP jemdays.
Covariates that were predictive of poor performance included age, education
previous head injury, language and psychiatric illness. Participants with low
education levels were significantly more likely to fall within the lowest quartile for
the Digit Span Backward, Digit Span WAIS, Benton Visual Retention, Santa Ana
non-dominant hand, Q16. Older participants performed significantly worse than
younger participants on Digit Symbol WAIS, Santa Ana dominant hand and Pursuit
Aiming.
The results obtained for logistic regression analysis between dichotomous outcomes
and the three other cumulative exposure variables (B_OPdys, B_OPjemcrpdys,
B_OPjemcrpdys_pa) were similar to that found with OP jemdays and are shown in
Appendix I.
4.4.3. Multivariate associations between outcomes and diagnosed past pesticide
poisoning
Table 4.31 shows a comparison of crude and adjusted Odds Ratio between past
pesticide poisoning and dichotomised neurobehavioural outcomes. Information on
past poisoning could only be collected from 201 (63%) participants.
204

Table 4.31 Adjusted logistic regression results for dichotomous neurobehavioural outcome-exposure relationships: Past poisoning diagnosed by a
health professional versus no past poisoning.
Notes:*For low age and low schooling median cut off values were used where low age = 1 and high age = 0 and low schooling = 1 and high schooling = 0. Language
was categorised as 1 for Afrikaans speakers and 0 for non-Afrikaans speakers ** Language was selected in model building for this outcome and included in the model
together with all the other a priori covariates (age, gender, schooling, previous head injury, psychiatric illness and low socio-economic status) #
Log transformed units
Exposure variable -
Past poisoning Crude associations Adjusted associations Significant covariates in the model
Dichotomous outcomes N OR 95% CI p-value N OR 95% CI p-value Covariates* OR (95% CI)
Digit Span Forward 201 2.24 0.92 – 5.44 0.08 201 2.24 0.90 - 5.53 0.08 None
Digit Span Backward# 201 1.79 0.73 – 4.41 0.21 201 1.82 0.70 - 4.73 0.22 Low Schooling 3.19; 1.37 - 7.44
Prev. Head injury 0.10; 0.01 - 0.76
Digit Span WAIS# 201 2.05 0.83 – 5.08 0.12 201 1.95 0.76 - 4.95 0.16 Low Schooling 2.69; 1.35 - 5.38
Digit Symbol WAIS 192 1.51 0.47 – 4.90 0.49 192 2.16 0.59 - 7.92 0.25 Language 0.13; 0.04 - 0.46
Low Schooling 4.24; 1.01 - 17.70
Benton VRT 201 1.30 0.48 – 3.53 0.61 201 1.41 0.49 - 4.04 0.52 Language 0.21; 0.07 - 0.66
Santa Ana dom. hand 201 2.15 0.87 – 5.32 0.10 201 1.87 0.72 - 4.86 0.20 Gender 0.37; 0.17 - 0.83
Santa Ana non-dom. hand 200 0.51 0.15 – 1.82 0.30 200 0.51 0.14 - 1.89 0.31 Curr. Alcohol Use 0.46; 0.22 - 0.96
Pursuit Aiming 194 0.59 0.19 – 1.84 0.36 194 0.44 0.13 - 1.43 0.17 Low age 0.33; 0.15 - 0.75
Low Schooling 2.51; 1.01 - 6.20
BSI/GSI 200 0.90 0.31 – 2.55 0.83 200 0.97 0.33 - 2.84 0.95 Low age 2.36; 1.07–5.18
Swedish Q16# 201 1.40 0.56 – 3.52 0.47 183 1.15 0.45 - 2.95 0.77 None
Vibration Sense Test# 199 4.25 1.71 – 10.56 <0.01 180 5.97 2.14 - 16.66 <0.01 None
205

There was a consistent positive association between participants with past diagnosed
poisoning experiences and poor performance on the neurobehavioural tests compared
to those without past diagnosed poisoning. The results showed a non-significant
increased likelihood of poorer performance among participants with diagnosed
pesticide poisoning for 8 out of 11 outcomes in the crude associations. In the
adjusted associations those with past pesticide poisoning showed significantly
decreased vibration sensitivity (OR 5.97; 95% CI 3.14 to 16.66) and performed
marginally poorer on the Digit Span Forward test (OR 2.24; 95% CI 0.90 to 5.53,
p=0.08) than those with no past pesticide poisoning.
4.4.4. Multivariate associations between outcomes and cumulative OP exposure
days weighted by activity (B_OPjemdays) adjusted for acute past poisoning
Table 4.32 shows a fourth analysis conducted to determine the effect of including
acute past poisoning with total weighted cumulative OP exposure days (B_OP
jemdays) on dichotomised outcomes in the same model. The results showed that 10
of the 11 outcomes had positive associations between outcomes and cumulative OP
exposure mainly in the 3rd
and 4th
quartiles when adjusting cumulative OP exposure
for acute past poisoning (Digit Span Backward, Digit Span WAIS, Digit Symbol
WAIS, Benton VRT, Santa Ana dominant and non-dominant hand, Pursuit Aiming
and vibration sense). Two of these outcomes showed a non-significant doubling of
risk in the 3rd
quartile (Digit Symbol) and 4th
quartile (Pursuit Aiming) when
adjusting for acute poisoning. Including past poisoning with cumulative OP exposure
reduced the effect on vibration sense (OR= 2.34; 95% CI 0.70 to 7.86). Including
past poisoning in the regression model with cumulative OP poisoning did not
significantly change the results of most of the outcomes except for changing the
direction of some of the outcomes such as the Digit Symbol WAIS and the Santa Ana
dominant hand from a negative to a positive but non-significant finding in some of
the quartiles.
206

Table 4.32 Baseline adjusted logistic regression results for dichotomous neurobehavioural outcome-exposure relationships: cumulative OP
exposure days weighted by activity (B_OPjemdays) adjusted for diagnosed past poisoning
Exposure variable -
B_OP Jemdays Crude associations Adjusted associations
Significant covariates
in the model
Dichotomous outcomes N OR 95% CI p-value OR 95% CI p-value Covariate OR (95% CI)
Digit Span Forward
Referent group§ 131 1.00 (ref. group) - 1.00 (ref. group) -
OPjmdys_1 19 0.60 0.14 – 2.50 0.48 0.61 0.14 – 2.62 0.14 None
OPjmdys_2 16 0.88 0.26 – 3.90 0.83 0.76 0.22 – 2.66 0.67
OPjmdys_3 17 0.36 0.10 – 1.33 0.13 0.32 0.08 – 1.24 0.10
OPjmdys_4 18 1.04 0.36 – 2.01 0.94 0.86 0.29 – 2.57 0.79
Referent group§§
178 1.00 (ref. group) - 1.00 (ref. group) -
Past Poisoning 23 2.07 0.84 – 5.13 0.12 2.11 0.84 – 5.33 0.11
Digit Span Backward
Referent group§ 131 1.00 (ref. group) - 1.00 (ref. group) -
OPjmdys_1 19 0.76 0.15 – 3.81 0.74 0.80 0.15 – 4.35 0.80 Low schooling 3.14; 1.34 – 7.35
OPjmdys_2 16 0.90 0.23 – 3.51 0.88 0.83 0.19 – 3.59 0.81 Head injury 0.10; 0.01 – 0.78
OPjmdys_3 17 1.59 0.50 – 5.05 0.43 1.49 0.42 – 5.28 0.53
OPjmdys_4 18 1.06 0.34 – 3.33 0.92 1.18 0.34 – 4.08 0.80
Referent group§§
178 1.00 (ref. group) - 1.00 (ref. group) -
Past Poisoning 23 1.85 0.73 – 4.65 0.19 1.83 0.69 – 4.83 0.23
Digit Span WAIS
Referent group§ 131 1.00 (ref. group) - 1.00 (ref. group) -
OPjmdys_1 19 0.47 0.32 – 2.10 0.30 0.46 0.11 – 2.02 0.31 Low schooling 2.54; 1.26 – 5.12
OPjmdys_2 16 0.48 0.33 – 2.52 0.25 0.40 0.11 – 1.49 0.17
OPjmdys_3 17 0.76 0.24 – 1.74 0.63 0.65 0.20 – 2.15 0.48
OPjmdys_4 18 1.40 0.54 – 3.83 0.54 1.21 0.38 – 3.83 0.75
Referent group§§
178 1.00 (ref. group) - 1.00 (ref. group) -
Past Poisoning 23 1.90 0.54 – 3.83 0.18 1.82 0.69 – 4.76 0.23
207

Exposure variable -
B_OP Jemdays
Crude associations
Adjusted associations
Significant covariates
in the model
Dichotomous outcomes N OR 95% CI p-value OR 95% CI p-value Covariate OR (95% CI)
Digit Symbol WAIS
Referent group§ 116 1.00 (ref. group) - 1.00 (ref. group) -
OPjmdys_1 18 - ≠ - - ≠ -
OPjmdys_2 16 0.53 0.06 – 4.33 0.55 0.36 0.03 – 4.40 0.42 Low schooling 4.49; 1.01 – 19.89
OPjmdys_3 17 1.01 0.21 – 4.86 0.99 2.36 0.38 – 14.53 0.36 Language 0.09; 0.02 – 0.37
OPjmdys_4 17 1.33 0.33 – 5.32 0.69 1.31 0.28 – 6.24 0.73 Curr. alcohol use 3.48; 1.04 – 11.65
Referent group§§
163 1.00 (ref. group) - 1.00 (ref. group) -
Past Poisoning 21 1.44 0.42 – 4.89 0.56 2.20 0.57 – 8.50 0.25
Benton VRT
Referent group§ 131 1.00 (ref. group) - 1.00 (ref. group) -
OPjmdys_1 19 0.44 0.05 – 3.67 0.45 0.26 0.03 – 2.53 0.24
OPjmdys_2 16 0.32 0.04 – 2.59 0.29 0.27 0.03 – 2.67 0.27 Language 0.17; 0.05 – 0.55
OPjmdys_3 17 0.59 0.13 – 2.79 0.51 0.90 0.17 – 4.70 0.90
OPjmdys_4 18 2.74 0.93 – 8.09 0.07 2.90 0.89 – 9.45 0.08
Referent group§§
178 1.00 (ref. group) - 1.00 (ref. group) -
Past Poisoning 23 1.03 0.36 – 2.94 0.96 1.16 0.39 – 3.48 0.79
Santa Ana dom. hand
Referent group§ 131 1.00 (ref. group) - 1.00 (ref. group) -
OPjmdys_1 19 1.43 0.34 – 6.04 0.63 1.22 0.26 – 5.71 0.80 Gender 0.37; 0.16 – 0.86
OPjmdys_2 16 0.26 0.03 – 2.10 0.21 0.40 0.05 – 3.40 0.40
OPjmdys_3 17 0.85 0.22 – 3.24 0.82 1.59 0.37 – 6.86 0.54
OPjmdys_4 18 0.79 0.23 – 2.70 0.71 0.80 0.21 – 3.03 0.74
Referent group§§
178 1.00 (ref. group) - 1.00 (ref. group) -
Past Poisoning 23 2.18 0.85 – 5.57 0.10 1.97 0.73 – 5.29 0.18
208

Santa Ana non-d. hand
Referent group§ 130 1.00 (ref. group) - 1.00 (ref. group) -
OPjmdys_1 19 0.97 0.19 – 4.91 0.97 0.97 0.17 – 5.47 0.97 Curr. alcohol use 0.42; 0.20 – 0.89
OPjmdys_2 16 1.11 0.28 – 4.35 0.88 1.94 0.44 – 8.52 0.38
OPjmdys_3 17 0.24 0.03 – 1.94 0.18 0.28 0.03 – 2.43 0.25
OPjmdys_4 18 0.89 0.23 – 3.37 0.86 1.47 0.35 – 6.16 0.60
Referent group§§
177 1.00 (ref. group) - 1.00 (ref. group) -
Past Poisoning 23 0.49 0.14 – 1.75 0.27 0.45 0.12 – 1.72 0.25
Pursuit Aiming
Referent group§ 118 1.00 (ref. group) - 1.00 (ref. group) -
OPjmdys_1 18 - ≠ - - ≠ -
OPjmdys_2 15 1.88 0.23 – 3.45 0.86 0.93 0.21 – 4.10 0.92 Low age 0.29; 0.12 – 0.68
OPjmdys_3 17 0.42 0.09 – 1.96 0.27 0.62 0.12 – 3.23 0.57
OPjmdys_4 18 2.47 0.82 – 7.40 0.11 2.21 0.64 – 7.70 0.21
Referent group§§
164 1.00 (ref. group) - 1.00 (ref. group) -
Past Poisoning 22 0.46 0.14 – 1.51 0.20 0.36 0.10 – 1.23 0.10
BSI/GSI
Referent group§ 130 1.00 (ref. group) - 1.00 (ref. group) -
OPjmdys_1 19 0.38 0.05 – 3.13 0.37 0.46 0.05 – 3.96 0.48 Low age 2.32; 1.04 – 5.17
OPjmdys_2 16 1.01 0.26 – 3.92 1.00 1.33 0.317- 5.54 0.70
OPjmdys_3 17 0.82 0.22 – 3.11 0.77 0.79 0.19 – 3.21 0.74
OPjmdys_4 18 0.71 0.19 – 2.67 0.62 0.82 0.20 – 3.32 0.78
Referent group§§
177 1.00 (ref. group) - 1.00 (ref. group) -
Past Poisoning 23 0.92 0.32 – 2.70 0.88 0.99 0.33 – 2.99 0.99
Swedish Q16
Referent group§ 131 1.00 (ref. group) - 1.00 (ref. group) -
209

≠ Inestimable since none of the participants for this corresponding outcome quartile had values within this exposure band §The referent group for
B_OPjemdays has zero number of exposure days §§
The referent group for participants without past poisoning
OPjmdys_1 19 1.20 0.29 – 5.04 0.80 1.74 0.36 – 8.43 0.49
OPjmdys_2 16 0.81 0.21 – 3.14 0.76 0.94 0.22 – 3.96 0.93
OPjmdys_3 17 0.68 0.18 – 2.58 0.58 0.68 0.17 – 2.78 0.59
OPjmdys_4 18 0.74 0.22 – 2.49 0.63 0.68 0.19 – 2.37 0.54
Referent group§§
178 1.00 (ref. group) - 1.00 (ref. group)
Past Poisoning 23 1.42 0.56 – 3.65 0.46 1.17 0.45 – 3.06 0.75
Vibration Sense Test
Referent group§ 121 1.00 (ref. group) - 1.00 (ref. group) -
OPjmdys_1 19 - ≠ - - ≠ -
OPjmdys_2 15 2.43 0.70 – 8.40 0.16 2.30 0.60 – 8.76 0.22 None
OPjmdys_3 17 2.92 0.94 – 9.10 0.07 2.34 0.70 – 7.86 0.17
OPjmdys_4 18 0.66 0.18 – 2.45 0.53 1.04 0.25 – 4.21 0.96
Referent group§§
168 1.00 (ref. group) - 1.00 (ref. group) -
Past Poisoning 22 5.54 2.06 – 14.90 <0.01 6.10 2.15 – 17.32 <0.01
210

4.5 DISCUSSION
The results from this cross-sectional study constitute the baseline findings for a
longitudinal cohort study conducted between 2009 and 2010 (see Chapter 5).
The results of the baseline cross-sectional study did not show positive associations
between most of the neurobehavioral outcomes (including the Digit Span Forward,
Digit Span WAIS, Benton Visual Retention test, Santa Ana Pegboard dominant
hand, Pursuit Aiming test, the Global Severity Index (BSI) and the Swedish Q16 test)
and occupational exposure to OP pesticides, estimated by means of 2 different
exposure metrics (OP Applicator, cumulative OP jemdays). There were no strong
positive associations for long-term exposure measures. The findings for analyses
involving three other cumulative exposure metrics (all pesticide applicators, OP
jemdays weighted for crop type (B_OPjmcrp) and the intensity exposure variable,
OP jemdays per annum (B_OPjmcrppa) were broadly similar to that for OP jemdays
and are listed in Appendix I. Vibration sense was significantly associated with the
third quartile of cumulative OP exposure in the crude as well as adjusted regression
models.
Overall, there was a lack of association between adverse neurobehavioural outcomes
and cumulative OP exposure. There was an increased Odds Ratio for vibration
sensitivity in the 3rd
quartile, indicating poorer vibration sensitivity in that quartile of
OP exposure. However, there was no obvious trend in risk with increasing exposure.
It is possible that applicators who have had the longest OP exposures (e.g. in the 4th
quartile) would have had safety training and would be expected to exhibit better
safety behaviours (e.g. wearing personal protective equipment when applying
pesticides) and therefore did not show decreased performance in many of the tests.
However, with retrospective ascertainment of cumulative exposure, it is not possible
to tease out whether such factors could explain an association in one quartile of the
exposure gradients assessed. It is also possible that those with the highest exposures
left the workforce because of ill-health, a variant of the Healthy Worker Effect,
discussed later in this chapter. The strongest adverse effect due to cumulative OP
pesticide exposure was for vibration sense associated with the 3rd
quartile of
cumulative OP exposure (OR= 3.08; 95% CI= 1.05 to 9.07). Impaired vibration
211

sense was also significantly and strongly associated with past poisoning (OR= 5.97;
95% CI= 2.14 to 16.66) in the adjusted regression model which indicates impaired
peripheral somatosensory function. However, this association was attenuated when
controlling for acute poisoning (OR= 2.34; 95% CI 0.70 to 7.86) which suggests that
some of the workers with past poisoning were more likely to be in the 3rd
exposure
quartile and provides evidence of an underlying association with past poisoning.
These results are consistent with findings from other studies that have reported
decreased vibration sensitivity among participants exposed to OP pesticides. In their
study among Ecuadorian potato farmers, Cole et al., (1998) collected information
regarding past pesticide use for the previous month from participants for various
pesticides including organophosphates and found that Ecuadorian applicators
spraying potato crops had a threefold likelihood of altered vibration sense following
regular OP use. Stokes et al., (1995) also found decreased vibration sensitivity in OP
applicators compared to population-based controls. While purely a motor function,
impaired grip and pinch strength was reported among 62 Nicaraguan agricultural
workers who had been hospitalized for acute OP poisoning by Miranda et al., (2002).
Of these 62 poisoned men, 48 were followed up two years later and found to have
persistent reduced hand strength (Miranda et al., 2004) indicating possible delayed
polyneuropathy.
Multivariate adjusted logistic regression analyses results also showed that OP
applicators were more likely to perform poorly compared to non-OP applicators on
psychomotor function tests requiring fine motor manual dexterity (Santa Ana
Pegboard non-dominant hand) although these results were not significant and
associations were not strong. Associations were also not significant and not
consistent for Santa Ana dominant hand. Impairment on tests of fine motor manual
dexterity has been reported in other studies investigating neurobehavioural effects
due to pesticide exposure (Kamel et al., 2003; London et al., 1997; Wesseling et al.,
2002).
212

Including past poisoning in the regression models led to a negligible change in the
patterns of associations. Past pesticide poisoning was positively associated with
poorer performance on 8 of the 11 neurobehavioural outcomes and significantly to
vibration sense. Consistent with findings reported in other studies, participants with
past poisoning (confirmed by a health professional) in this study were more likely to
perform poorly on most neurobehavioural tests particularly for vibration sense
compared to those with no past poisoning. Similar findings were reported in other
studies with Spanish greenhouse workers on attention (Digit Span WAIS Backward,
Digit Symbol WAIS), memory (Benton Visual Retention) and visuo-motor tests,
(Roldan-Tapia et al., 2006) and Savage et al., (1988) who reported decreased
performance for poisoned cases on one Grooved Pegboard test when compared with
non-poisoned controls. Steenland et al., (1994, 2000) reported significantly worse
vibrotactile sensitivity of toe and finger among poisoned individuals when compared
non-poisoned controls who comprised friends of the exposed. Wesseling et al.,
(2002, 2010) in their cross-sectional studies evaluated the neurobehavioral
performances of banana workers who had received medical attention not requiring
hospitalization for mild organophosphate or a carbamate pesticide poisoning two
years earlier. Poisoned subjects performed worse than controls on the Digit Symbol
and Brief Symptom Inventory tests. Rosenstock et al., (1991) also reported
significant differences between poisoned agricultural workers and a control group in
Nicaragua where the poisoned group did significantly worse than the control group
on the Digit Span Forward, Digit Symbol, Santa Ana Pegboard, Pursuit Aiming tests.
The sarin poisoned cases in Yokoyama et al’s study (1998) also performed
significantly worse than non-poisoned controls on a psychomotor test (Digit Symbol)
providing evidence that past OP poisoning results in decreased neurobehavioral
performance. In the present study, the association between past poisoning and poor
neurobehavioural performance could have been stronger since only 201 (63%) of the
319 participants responded to the question on past poisoning. In the present study
past poisoning was defined as self-reported by those participants who had been
diagnosed by a health professional.
213

The literature suggests that one might have anticipated finding more associations
amongst exposed workers. Cole et al., (1997) reported significant differences
between exposed farm workers on potato farms and non-farm rural groups in
Ecuador on a number of tests, including the Digit Span, Digit Symbol Substitution,
Benton Visual Retention tests, Santa Ana Pegboard and Pursuit Aiming tests.
Stephens et al., (1995) found significant differences between 146 sheep dippers and
143 quarry workers only on Simple Reaction time, Symbol-Digit Substitution and
Syntactic Reasoning test but not on the Digit Span test. Similarly, Kamel et al.,
(2003) compared the neurobehavioural performance of 288 farm workers in Florida
with 51 controls and found significant differences between the two groups on Digit
Span and Santa Ana Pegboard tests but not on Digit Symbol latency. Farahat et al.,
(2003) reported significantly lower performance for exposed pesticide applicators
when compared to 50 male administrators working in offices in Egypt on Digit Span,
Digit Symbol and Benton Visual Retention tests. Gomes et al., (1998) also reported
poorer performance among established farm workers (n=226) who had been exposed
to multiple pesticides when compared to unexposed referents (n=226) on aiming and
Digit Symbol tests. A recent study among South African rural women exposed to
pesticides on farms performed worse on the Q16 than women from neighbouring
towns (Dalvie et al., 2012, unpublished). The only other studies where the lower
exposed participants were also farm workers, were in previous studies by Major
(2010) and London et al., (1997) also conducted in the Western Cape in which no
association between neurotoxicity and long-term OP exposure was found. In these
studies (London et al., 1997; Major, 2010), the control groups were farm workers
who may have been indirectly exposed to pesticide residues on crops and leaves
which could be one of the explanations for the result found in our study. As indicated
above (London et al., 1997; Major, 2010), non-applicators may also be a highly
exposed group, for instance high pesticide residue levels were previously reported in
applicators as well as non-applicators in recent studies in the Western Cape (Dalvie
et al., 2003, 2004).
In summary, the study found few associations between OP pesticide exposure and
neurobehavioural performance. There were no significant associations between being
an OP applicator and poor neurobehavioural performance. OP applicator performed
better on 7 neurobehavioural outcomes but the relationships were not statistically
214

significant. The only significant association for cumulative exposure was with
vibration sense where participants with cumulative exposure in the third quartile
showed a three-fold risk of decreased vibration sense. However, including past
poisoning in the regression model resulted in a slight reduction of effect on vibration
sense (OR= 2.34; 95% CI 0.70 to 7.86). No significant associations were found when
adjusting unweighted cumulative OP exposure (B_OPdys) for acute poisoning on
any of the dichotomised outcomes (Appendix I).
The present study also found a significant and strong association between impaired
vibration sense and past diagnosed poisoning, and a consistent pattern suggesting
impaired performance on 7 of the other 10 outcomes, albeit non-significant
associations. This pattern is broadly similar to other studies, particularly those which
found altered vibration sense following an acute poisoning episode (McConnell et
al., 1994; Savage et al., 1988; Steenland et al., 1994).
Associations between outcomes and covariates
Seven out of eleven outcomes were significantly associated with age and schooling.
Younger participants performed better than older participants and those with more
schooling performed better than those with less schooling. This is consistent with
many other studies (Bazylewicz-Walczak, et al., 1999; Farahat et al., 2003; Fiedler et
al., 1997; London et al., 1997; Roldan-Tapia et al., 2005, 2006; Rohlman et al., 2007,
2011; Wesseling et al., 2002, 2010). Hispanic adolescents working in agriculture
performed better than adults on Finger Tapping, Selective Attention and Serial Digit
Learning tests and increased years of schooling were associated with better
performance on these tests (Rohlman et al., 2007). Outcomes that were not
associated with age and schooling were vibration sense, the Swedish Q16 and the
Global Severity Index of the Brief Symptom Inventory.
Formal schooling levels were higher in this study than reported in earlier studies
(Groenewald, 1986; London et al. 1997) where schooling levels varied between 4.3
years and 5.1 years. More recently the Western Cape Department of Agriculture
reported higher schooling levels of 9 to 12 years for 63% of emerging farmers
(N=97) in a study conducted in 2002 (Department of Agriculture: Western Cape,
215

2002). The neurobehavioural tests used in this study are standardized tests with
proven validity and reliability in other developing countries (Farahat et al., 2003;
London et al., 1997; Wesseling et al., 2002, 2010). Covariates such as age, schooling,
gender, language and alcohol consumption have consistently been associated with
neurobehavioural outcomes in a range of studies (Anger et al., 2000; Colvin et al.,
1993; Cole et al., 1997; Farahat et al., 2003; Nell et al., 1993). The associations
demonstrated in this study for these covariates are consistent with the literature,
which suggests the administration of the tests was done in a rigorous and appropriate
manner, which supports the validity of the neurobehavioural test outcomes in this
study.
The Western Cape farm worker community is well known for its high alcohol
consumption rates (Holtman et al., 2011; London et al., 1997; London et al., 1998;
Claassen, 1999; London, 2000; Major, 2010; Matthews, 2004; te Water Naude et al.,
1998). Even though the percentage of farmers consuming alcohol in this present
study was high, alcohol consumption could well be higher given the stigma attached
to alcohol consumption amongst farm workers (London, 2000). Not surprisingly,
alcohol consumption significantly influenced performance on tests of higher
cognitive function. Participants who reported current alcohol consumption performed
significantly worse than those not currently consuming alcohol on the Digit Symbol
test. There were also positive non-significant associations between current alcohol
consumption and tests of attention (Digit Span) as demonstrated in the findings of
Cole et al., (1997); psychomotor function (Pursuit Aiming); mood (BSI) and
vibration sensitivity. There was also a significant association between current alcohol
use and the Santa Ana Pegboard test (dominant and non-dominant hand) in the
opposite direction to what was expected, indicating that those currently using alcohol
was associated with better performance on this test.
The results were also stratified by running regression models for current alcohol
consumption and excluding those participants not currently consuming alcohol.
While there were changes in direction from negative to positive Odds Ratios on the
Digit Span Forward and the Digit Span WAIS tests, the differences were not
significant between those with and without current alcohol consumption and
216

cumulative OP exposure. Current alcohol consumption seemed protective for
performance on the Global Severity Index of the BSI, the Santa Ana non-dominant
hand and the Q16 (Appendix I). Current alcohol consumption also appeared to be
protective for performance on the Global Severity Index of the BSI, Q16 and the
Santa Ana non-dominant hand (Appendix I).
The percentage of current smokers in this present study is considerably lower than
reported by Major (2010) in her study (74%) and London (2000) in his study (87%)
among the South African deciduous fruit farm worker population. While the results
of the present study might indicate under-reporting, the South African Demographic
and Health Survey (SADHS) reported a general decline in smoking rates in South
Africa since 1998 (SADHS, 2003). Recent tobacco legislation (Act 23, Section 2 (1)
(a), 2007) have imposed tighter restrictions on the advertising of the sale of tobacco
products to youth and have banned smoking in the work place and in enclosed
spaces.
Gender was significantly associated with fine motor control tests, hand steadiness
tests, hand tremor and impaired subjective mood function (Digit Symbol, Pursuit
Aiming and the Swedish Q16). Females performed better than males on tests of
immediate memory, visuo-motor, speed, attention span and hand tremor while males
performed better on the manual dexterity and subjective mood symptom tests.
Associations between outcomes and previous head injury
Previous head injury was significantly associated with Digit Span Backward and
Santa Ana Pegboard, non-dominant hand. It is not surprising that the majority of
participants who reported previous head injuries were male (94%) given the nature of
the cause of the head injuries (contact sport and physical assault). The four
participants who reported having been unconscious following head injury were also
male and cited contact sport, physical assault and a car accident as causes of the head
injuries. Studies have reported associations between physical violence and high
alcohol consumption on farms in the region (Bek et al., 2007; Holtman et al., 2011;
National Trauma Research Programme, 1994).
217

Strengths and Limitations of the study
A strength of the study lies in the fact that more than 94% of the participants (n=301)
completed all the tests which took almost an hour to administer and complete. In
addition, 99% of the participants had reported only up to three jobs in their lifetime
which provides a near-complete agricultural work history.
Information bias which influences associations between exposure and outcomes
could have occurred during the Brief Symptom Inventory and Q16 questionnaire
assessment. Some of the farmers may have over-reported symptoms in the hope of
possible financial compensation for symptoms reported while other farmers may
have left the emerging farmer projects because of ill-health thus resulting in possible
under-reporting of symptoms. A Healthy Worker Effect may have operated as a
selection bias and partly explain the failure to detect significant associations between
exposure to OP pesticides and neurobehavioural performance in this study where
farmers with poor health may have left work and healthier emerging farmers may
have been selected for pesticide application tasks because of factors associated with
neurobehavioural competence. For example, the results showed that the trend
between cumulative exposure and decreased extinction time on the Tuning Fork
stops in the third quartile. Secondly, OP applicators performed better than non-
applicators on the Digit Span Forward and Backward, Benton Visual Retention,
Santa Ana dominant hand and Pursuit Aiming tests, though not significantly. This
may indicate that applicators were more competent neurobehavioural performers and
remained in the farmer projects while those adversely affected dropped out of the
farmer projects, providing some evidence for a healthy worker effect. The cross-
sectional design of the present study lends itself to an investigation of study
participants’ neurobehavioural performance at one point in time which is a poor
reflection of participants’ continuing exposure and neurobehavioural function over
time (Cole et al., 1997).
Covariates that are known to influence neurobehavioural test performance such as
age, education (schooling), gender, language, alcohol consumption, head injury, low
socio-economic status and psychiatric illness were controlled for in this study
through the use of statistical adjustment procedures. Confounding with these
variables should therefore not have affected the results of this study. However, it
218

cannot be ruled out that some error may have occurred during the measurement of
the confounders which could have resulted in some bias for example, residual
confounding which cannot be controlled for in the analysis.
Exposure misclassification may explain the absence of significant associations
between exposure and neurobehavioural performance. Attempting to characterise
exposure as accurately as possible is a challenge in developing countries. Despite
substantial training in the administration of the farmer questionnaire, interviewers
may have differed in their ability to record occupational exposure as accurately as
possible. Ability to recall exposure history accurately is problematic among farmers
especially given the reluctance among spray managers to provide spray schedules or
divulge information about spray activities. It is also in the nature of emerging small-
holder farmers to rotate spraying tasks with farmers who are usually tasked with
general farm duties such as pruning, irrigation and cleaning of orchards and
vineyards when pesticide applicators are absent. In these instances, farmers may not
be able to accurately recall spray activities.
While biomarkers (urine, venous blood, plasma cholinesterase) were collected for
each participant on the same day as the farmer questionnaire and neurobehavioural
tests were administered, the laboratory approached delayed and ultimately was
unable to do the analysis of the biomarker specimens. Thus, the lack of biomarker
based exposure assessment presents a weakness in the study since exposure
characterisation is based on self-report.
In many of the studies mentioned above, the control groups were not farm workers
but unexposed friends of the exposed, town residents and office workers (Ames et
al., 1995; Cole et al., 1997; Fiedler et al., 1997; Pilkington et al., 2001; Steenland et
al., 2000). Non-applicators who are farm workers are also often highly exposed
either because they do not have access to personal protective equipment (Major et al.,
2010; London et al., 1998; van Wendel de Joode et al., 2004; Blanco-Muñoz, J. &
Lacasaña, M., 2011). In the current study 70% (n=223) reported not wearing gloves
because they do not consider themselves to be exposed if they do not apply
pesticides and/or because of residential proximity to orchards and vineyards
219

(Coronado et al., 2006). Reasons for the lack of consistent study findings can be
varied: often studies do not specify actual OPs; types of OPs may differ between
studies; every exposed population studied is different with different duration and
patterns of exposure which are always unknown. More recently, it has also been
postulated that because individuals differ from each other in their ability to
metabolize and detoxify agrochemicals and therefore respond differently to exposure
this may explain the differences in neurobehavioural test performance between
exposed individuals (Cherry et al., 2002; Mackenzie Ross et al., 2012).
On reflection on the objectives of the study, long-term organophosphate exposure
was inconsistently associated with poorer neurobehavioural performance. Besides the
finding related to Vibration Sense discussed above, only on the Digit Span
Backward, Digit Symbol WAIS and the Santa Ana non-dominant hand was poorer
neurobehavioural performance associated with long-term exposure and these
associations were of borderline statistical significance. There were also positive
associations between cumulative OP exposure and impaired neurobehavioural
performance. All of these results were not statistically significant. Therefore, overall,
the hypothesis that exposure to OP pesticides results in impaired neurobehavioural
performance is not convincingly supported by the findings from the analysis of the
cross-sectional baseline data in the present study.
In contrast, the hypothesis that past poisoning is associated with a decrease in
vibration sensitivity, as evidenced in other studies (Cole et al., 1998; Delgado et al.,
2004; London et al., 1997, 2000; McConnell et al., 1994; Miranda et al., 2004;
Stokes et al., 1995), was confirmed in this study. Past pesticide poisoning was also
positively associated with deficits in most of the neurobehavioural outcomes where
the associations were present but not statistically significant. In all likelihood, had
the response rate on this question been higher, the analyses may have had sufficient
power to achieve associations with statistical significance. The presence of an
association between past pesticide poisoning and impaired neurobehavioural
outcomes in these data is thus more convincing.
220

The role of age and schooling as powerful covariates in neurobehavioural
performance was also confirmed in this study, consistent with other research. The
problems of exposure misclassification that may underlie the equivocal findings,
particularly for cumulative exposure, could be better addressed by prospective study
designs with accurate recording of on-going exposure. The next chapter presents the
findings of a cohort follow up of this group of farmers to explore whether on-going
exposure to OP pesticides over a period of a year results in changes in
neurobehavioural performance, using prospective data collection for exposure to OP
pesticides.
221

4.6 REFERENCES
Ames, R. G., Steenland, K., Jenkins, B., Chrislip, D. & Russo, J. (1995). Chronic
neurologic sequelae to cholinesterase inhibition among agricultural pesticide
applicators. Archives of Environmental Health, 50(6), 440-444.
Anger, W. K., Liang, Y. X., Nell, V., Kang, S. K., Cole, D., Bazylewicz-Walczak,
B. (2000). Lessons learned – 15 years of the WHO-NCTB: a review.
Neurotoxicology, 21, 837-846.
Bazylewicz-Walczak, B., Majczakowa, W. & Szymczak, M. (1999). Behavioral
effects of occupational exposure to organophosphorous pesticides in female
greenhouse planting workers. Neurotoxicology, 20, 819-826.
Bek, D., McEwan, C. & Bek, K. (2007). Ethical trading and socioeconomic
transformation: critical reflections on the South African wine industry.
Environment and planning A, 39(2), 301-319.
Blanco-Muñoz, J. & Lacasaña, M. (2011). Practices in pesticide handling and the use
of personal protective equipment in Mexican agricultural workers. Journal of
Agromedicine, 16(2), 117-126.
Cherry, N., Mackness, M., Durrington, P., Povey, A., Dippnall, M., Smith, T. &
Mackness, B. (2002). Paraoxonase (PON1) polymorphisms in farmers
attributing ill health to sheep dip. Lancet, 359, 763-764.
Claassen, J. N. (1999). The benefits of the CAGE as a screening tool for alcoholism
in a closed rural South African community. South African Medical Journal,
89(9), 976-979.
Cole, D. C., Carpio, F., Julian, J., Leon, N., Carbotte, R. & De Almeida, H. (1997).
Neurobehavioral outcomes among farm and nonfarm rural Ecuadorians.
Neurotoxicology and Teratology, 19(4), 277-286.
222

Cole, D. C., Carpio, F., Julian, J. & Leon, N. (1998). Assessment of peripheral nerve
function in an Ecuadorian rural population exposed to pesticides. Journal of
Toxicology and Environmental Health Part A, 55(2), 77-91.
Colvin, M., Myers, J. E., Nell, V. N., Rees, D. & Cronje, R. (1993). A cross-sectional
survey of neurobehavioral effects of chronic solvent exposure on workers in a
paint manufacturing plant. Environmental Research, 63,122-132.
Coronado, G. D., Vigoren, E. M., Thompson, B., Griffith, W. C. & Faustman, E. M.
(2006). Organophosphate pesticide exposure and work in pome fruit: evidence for
the take-home pesticide pathway. Environmental Health Perspectives, 114(7),
999-1006.
Dalvie, M. A., Cairncross, E., Solomon, A. & London, L. (2003). Contamination of
rural surface and ground water by endosulfan in farming areas of the Western
Cape, South Africa. Environmental Health, 2(1) Retrieved June15, 2013, from
Web site: http://www.ehjournal.net/content/2/1/1
Dalvie, M. A., London, L., Mbuli, S. & Cairncross, E. (2004). Knowledge and
attitudes in the rural Western Cape towards pesticides in water sources. Water SA,
30 (1), 43-50.
Dalvie, M. A. & London, L. (2012, March). Neurotoxic effects of pesticide exposure
amongst women from the rural Western Cape of South Africa. Paper presented at
the 12th
International Symposium on neurobehavioral methods & effects in
occupational & environmental health, Cape Town, South Africa.
Delgado, E., McConnell, R., Miranda, J., Keifer, M., Lundberg, I., Partanen, T. &
Wesseling, C. (2004). A two-year follow-up of central nervous system effects of
acute organophosphate poisoning. Scandinavian Journal of Work, Environment &
Health, 30, 362-370.
223

Department of Health, Medical Research Council, OrcMacro. (2007). South Africa
demographic and health survey 2003 (SADHS). Demographic and Health Surveys.
Pretoria: Department of Health.
Department of Agriculture: Western Cape. (2002). Provincial report on schooling
and training for agriculture and rural development: Western Cape. Retrieved from
www.nda.agric.za/doaDev
Farahat, T. M., Abdelrasoul, G. M. & Amr, M. M., Shebl, M. M., Farahat, F. M. &
Anger, W. K. (2003). Neurobehavioral effects among workers occupationally
exposed to Organophosphate pesticides. Occupational Environmental Medicine,
60, 279-286.
Fiedler, N., Kiepen, H., Kelly-McNeil, K. & Fenske, R. (1997). Long-term use of
organophosphates and neuropsychological performance. American Journal of
Industrial Medicine, 32, 487- 496.
Gomes, J., Lloyd, O., Revitt, M. D. & Basha, M. (1998). Morbidity among farm
workers in a desert country in relation to long-term exposure to pesticides.
Scandinavian Journal of Work, Environment and Health, 24(3), 213-219.
Groenewald, C. J. (1986). Afrikaans: Gemeenskapsontwikkeling op plase in die
Weskaap (Community development on farms in the Western Cape).
Geleentheidspublikasie 9, Department Sociology, University of Stellenbosch,
Stellenbosch.
Holtman, Z., Shelmerdine, S., London, L. & Flisher, A. J. (2011). Suicide in a poor
rural community in the Western Cape, South Africa: experiences of five suicide
attempters and their families. South African Journal of Psychology, 41(3), 300-
309.
Kamel, F., Rowland, A. S., Park, L. P., Anger, W. K., Baird, D, D,, Gladen, B. C. …
Sandler, D. P. (2003). Neurobehavioral performance and work experience in
Florida farmworkers. Environmental Health Perspectives, 111, 1765-1772.
224

London, L., Myers, J. E., Nell, V., Taylor, T. Thompson, M. L. (1997). An
investigation into neurologic and neurobehavioural effects of long-term
agrochemical use among deciduous fruit farm workers in the Western Cape,
South Africa. Environmental Research, 73(1-2), 132-145.
London, L., Nell, V., Thompson, M. L., Myers, J. E. (1998). Effects of long-term
organophosphate exposure on neurologic symptoms, vibration sense and tremor
among South African farm workers. Scandinavian Journal of Work And
Environmental Health, 24, 18-29.
London, L. (2000). Alcohol consumption amongst South African farm workers: a
challenge for post-apartheid health sector transformation. Drug and Alcohol
Dependence, 59, 199-206.
London, L., Thompson, M. L., Capper, W. & Myers, J. E. (2000). Utility of
Vibration Sense Testing for use in Developing Countries: Comparison of
extinction time on the tuning fork to vibration thresholds on the Vibratron
II. Neurotoxicology, 21(5), 743-752.
Mackenzie Ross, S., McManus, I. C., Harrison, V. & Mason, O. (2012).
Neurobehavioral problems following low-level exposure to organophosphate
pesticides: a systematic and meta-analytic review. Critical Reviews in
Toxicology, 43(1), 21-44.
Major, V. J. (2010). The role of organophosphate exposure in the aetiology of
depression and suicidality amongst farm workers on wine and table grape farms in
the Worcester area of the Western Cape Province, South Africa. Unpublished
Masters Dissertation. South Africa, University of Cape Town.
Matthews, B. M. F. (2004). An exploratory study of aspects on environmental
conditions associated with alcohol and drug abuse and criminal behaviour, M.A.
(Child and Family Studies) Mini-thesis, University of Western Cape.
225

McConnell, R., Keifer, M. & Rosenstock, L. (1994). Elevated quantitative
vibrotactile threshold among workers previously poisoned with methamidophos
and other organophosphate pesticides. American Journal of Industrial Medicine,
25, 325-334.
Miranda, J., Lundberg, I., McConnell, R., Delgado, E., Cuadra, R., Torress, E. …
Keifer, M. (2002). Onset of grip-and pinch-strength impairment after acute
poisonings with organophosphate insecticides. International Journal of
Occupational and Environmental Health, 8(1), 19-26.
Miranda, J., McConnell, R., Wesseling, C., Cuadra, R., Delgado, E., Torress, E., &
Lundberg, I. (2004). Muscular strength and vibration thresholds during two years
after acute poisoning with organophosphate insecticides. Occupational and
Environmental Medicine, 61 (4) 1 – 6. Retrieved April 20, 2013, from Web site:
http://www.occenvmed.com/cgi/content/full/61/1/e4
National Trauma Research Programme. (1994). A guide to rural injury data capture.
Cape Town: Medical Research Council.
Nell, V., Myers, J. E., Colvin, M. & Rees, D. (1993). Neuropsychological assessment
of organic solvent effects in South Africa: Test selection, adaptation, scoring and
validation issues. Environmental Research, 63, 301-318.
Pilkington, A., Buchanan, D., Jamal, G. A., Gillham, R., Hansen, S., Kidd, M. …
Soutar, C. A. (2001). An epidemiological study of the relations between exposure
to organophosphate pesticides and indices of chronic peripheral neuropathy and
neuropsychological abnormalities in sheep farmers and dippers. Occupational
and Environmental Medicine, 58, 702-710.
Rohlman, D. S., Anger, K.W. & Lein, P. J. (2011). Correlating neurobehavioral
performance with biomarkers of organophosphorus pesticide exposure.
Neurotoxicology, 32, 268-276.
226

Rohlman, D. S., Lasarev, M., Anger, W. K., Scherer, J., Stupfel, J. & McCauley, L.
(2007). Neurobehavioral performance of adult and adolescent agricultural
workers. Neurotoxicology, 28(2), 374-380.
Roldan-Tapia, L., Parron, T. & Sanchez-Santed, F. (2005). Neuropsychological
effects of long-term exposure to organophosphate pesticides. Neurotoxicology
and Teratology, 27, 259-266.
Roldan-Tapia, L., Nieto-Escamez, F. A., del Aguila, E. M., Laynez, F. & Parron, T.
& Sanchez-Santed, F. (2006). Neuropsychological sequelae from acute poisoning
and long-term exposure to carbamate and organophosphate pesticides.
Neurotoxicology and Teratology, 28, 694-703.
Rosenstock, L. (1991). Chronic central nervous system effects of acute
organophosphate pesticide intoxication. Lancet, 338, 223-227.
Savage, E. P., Keefe, T. J. & Mounce, L. M., Heaton, R. K., Lewis, J. A. & Burcar,
P.J. (1988). Chronic neurological sequelae of acute pesticide poisoning. Archives
of Environmental Health, 43, 38-45.
Steenland, K., Jenkins, B., Ames, R. G., O’Malley, M., Chrislip, D. & Russo, J.
(1994). Chronic neurological sequelae to organophosphate pesticide poisoning.
American Journal of Public Health, 84(5), 731-736.
Steenland, K., Dick, R. B., Howell, R. J., Chrislip, D.W., Hines, C. K., Reid, T.
M.(2000). Neurological function among termiticide applicators exposed to
chlorpyrifos. Environmental Health Perspectives, 108(4), 293-300.
Stephens, R., Spurgeon, A., Calvert, A., Beach, J., Levy, L. S., Berry, H. &
Harrington, J. M. (1995). Neuropsychological effects of long-term exposure to
organophosphates in sheep dip. Lancet, 6, 1135-1139.
227

Stokes, L., Stark, A., Marshall, E. & Narang, A. (1995). Neurotoxicity among
pesticide applicators exposed to organophosphates. Retreieved September 7,
2012, from Web site: http://oem.bmj.com/content/52/10/648.full.pdf+html.
te Water Naude, J., London, L., Pitt, B., & Mahomed, C. (1998). The ‘dop’ system
around Stellenbosch - results of a farm survey. South African Medical Journal,
88, 1102-1104.
van Wendel de Joode, B. (2004). An Occupational DREAM: Development,
evaluation and application of a Dermal Exposure Assessment Method. Doctoral
Dissertation. Utrecht: Utrecht University.
Wesseling, C., Keifer, M., Ahlbom, A., McConnell, R., Moon, J., Rosenstock, L. &
Hogstedt, C. (2002). Long-term neurobehavioural effects of mild poisonings with
organophosphate and n-methyl carbamate pesticides among banana workers.
International Journal of Occupational and Environmental Health, 8(1), 27-34.
Wesseling, C., van Wendel de Joode, B., Keifer, M., London, L., Mergler, D. &
Stallones, L. (2010). Symptoms of psychological distress and suicidal ideation
among banana workers with a history of poisoning by organophosphate or n-
methylcarbamate pesticides. Occupational & Environmental Medicine, 67, 778-
784.
228

CHAPTER 5: COHORT STUDY RESULTS AND DISCUSSION
5.1 INTRODUCTION
This chapter presents the results and discussion relating to the cohort study. Figure 5.1
repeats, for convenience of understanding, the timeline for the different elements to the
cohort data collection. Results are presented from the three follow-up visits where
exposure data were collected; followed by results from the final visit where all outcome
instruments were administered. The main analysis in this chapter is of differences in
outcomes between the baseline study and the final visit to assess change in performance
over time in relation to exposure. A discussion of these results concludes the chapter.
5.2 STUDY PARTICIPATION
The methods of the follow-up visits are described in detail in Chapter 3. Briefly, at
baseline, data were collected on demographics, work history, exposure history, a set of
neurobehavioural outcomes and on a limited list of confounders. At each follow up visit,
data were collected on exposures and injuries or poisonings sustained in the intervening
period. At final visit, the farmer questionnaires and neurobehaviorual tests were repeated
using the same instruments as in the baseline. The baseline visits took place between
December 2008 and May 2009, the follow up visits at approximately 3 to 4 monthly
intervals over the next year, and the final visits took place between December 2009 and
May 2010 (Figure 5.1).
Neurobehavioural tests were administered to 319 farmers at the start of the study and to
277 participants at the final visit. Four participants did not complete some of the tests
and complete data for neurobehavioural testing was available for 273 participants at the
final visit.
Three follow-up visits were conducted at intervals of about three to four months
following the first visit as quarterly audits using a check list. During the quarterly audits
(see Appendix D) pesticide exposure, poisoning and injury information was collected
retrospectively for the previous 3 to 4 months. The number of participants varied at each
follow-up visit (see Figure 3.2). The percentage of baseline respondents participating at
229

each follow up was 86%, 89% and 87% for follow-up visits 1, 2 and 3, respectively. For
the neurobehavioural assessments, 86% of those farmers tested at baseline completed
neurobehavioural testing at the final visit. Retention in the cohort at final visit varied
from 73% in the Overberg district to 88% in the Cape Winelands district (Table 5.1).
The percentage of baseline participants for whom data were available for all subsequent
data collection points – 3 follow-ups and the final visit – was 76% (Table 5.1).
Due to seasonal floods, forest fires and farmers’ unavailability at appointment dates,
intervals between quarterly visits were longer than three months. The mean number of
days falling outside of each 90 day period was calculated for each participant for each
follow-up visit. For the first follow-up visit, the mean follow-up time from baseline to F1
outside the 90 day period was 10.1days (SD 8.7; IQR 5 – 19).
Figure 5.1 shows the attendance at each visit, beginning with baseline attendance,
attendance at the follow-up quarterly audits where only exposure and injury data was
collected and culminating in the final visit where all study instruments were repeated.
The exposure information collected in the quarterly audits was used to estimate
cumulative exposure for each participant in any one of the three follow-up intervals. Data
from each visit was summed over the three visits to derive an estimate for the full cohort
follow-up period. Exposure variables were generated in 8 hour day-equivalents for all
participants for (i) all pesticide applications and for (ii) all OP pesticide applications,
using data from all the follow up visits. Information was collected on the type of
pesticide applied, method of application, duration of application in minutes, hours and
days (8 hours). Information on recent diagnosed poisoning during the study period was
also collected at this time and whether or not medical treatment was sought for the
poisoning. Information was also collected with regard to physical injuries sustained
during the study period.
230

Figure 5.1: Cohort study participation summary
Time 0 Time 1 Time 2 Time 3 Time 4
Dec 2008 March 2009 July 2009 Dec 2009 Dec 2009
to to to to to
May 2009 Aug 2009 Dec 2009 May 2010 May 2010
Note: * n= 265, ** n= 272, *** n= 263
1st Follow-up
(n=274)
(Exposure
data)
2nd
Follow-up
(n=285)
(Exposure
data)
collectedin
QA )
Baseline
(n=319)
(All tests
administered)
Final Quarterly
Audit Follow-
up (n=277)
(Exposure
data)
Cohort study
(N=319)
Neurobehavioural tests (N=273)
Digit Span Forward
Digit Span Backward
Digit Span Total score
Digit Span WAIS-III
Digit Symbol*
Digit Symbol WAIS-III
Benton VRT
Santa Ana dominant hand**
Santa Ana non-dominant hand **
Pursuit Aiming***
Brief
Symptom
Inventory
(n=273)
Farmer
Questionnaire
(n=273)
Vibration
Sense
Threshold
(n=273)
Swedish
Q16
(n=271)
Final visit
(n=273)
(All tests
administered)
231

Table 5.1 Study participation by district at final visit
District Number of farms (projects)
at final data collection visit
Number of participants
Participated
(%)
Baseline
participation
Final
participation
(%)
Overberg 4/7 (57) 77 56 (73)
West Coast 5/5 (100) 84 78 (93)
Cape
Winelands
8/9 (89) 158 139 (88)
Total 17/21(81) 319 277 (87)
Number of participants who attended all follow-up visits –
baseline, three follow-ups and final visit.
244 (76)
In brief, for the cohort study, analysis was conducted to estimate the effect of the
cumulative exposure, measured over the cohort study period on change in
neurobehavioural performance over time. The ratio of final to baseline scores was used
to calculate change in neurobehavioural performance (difference outcome variables) over
time. Refer to section 3.12.1 of Chapter 3, page 34 (Methods used in the study) for
details of the difference outcome variables.
5.3 UNIVARIATE RESULTS
5.3.1 Demographic characteristics and injury history
Age and education
Two hundred-and-seventy four (n=274) (86%) participants attended the first follow-up
visit (F1) after the baseline data collection visit. There were 181 (66%) males and 93
(34%) females.
At the 2nd
follow-up visit (F2) four months later, 285 (89%) participants were present of
which 188 (66%) were male, 97 (34%) were female. It took more than one month to
administer the final quarterly audit (F3) to 277 (87%) participants. Of these who attended
F3 visit (n=277), 186 (67%) were male, 91 (33%) were female and 154 were applicators
(56%) who provided details of pesticide applications. Of the 39 participants who were
not interviewed using the quarterly audit at the same time as their final neurobehavioural
232

assessments, the median gap between the final quarterly audit (F3) and assessment was
19 days. For other participants, the audit and neurobehavioural assessments took place on
the same date. The median age of the participants at the final follow-up was 41 years and
IQR ranged from 31 years to 49 years.
Pearson chi2 tests of independence were used to compare the same demographic
characteristics at baseline (taken from Table 4.2) and final visit (Table 5.2) and results
showed that participants for whom neurobehavioural testing data were available at the
final visit were not statistically different from non-participants in terms of gender, age,
schooling, current smokers, Marijuana (Cannabis) use, socio-economic status, previous
head injuries and psychiatric illness. However differences were noted for language
(p<0.01), current alcohol use (p=0.01) and the CAGE questionnaire (p<0.01). More non-
Afrikaans speaking participants at baseline were lost to follow-up (31%) than Afrikaans-
speaking participants (12%). Fewer alcohol consumers were lost to follow-up. In total 20
(10%) of current alcohol users and 11 (8%) of participants who scored ≥2 on the CAGE
questionnaire were lost to follow-up.
Most participants spoke Afrikaans (89%) with 11% speaking either Xhosa (9%) or
SeSotho (2%). Pearson chi2 tests for independence showed that the differences in
proportions between Afrikaans and non-Afrikaans speaking participants were statistically
significant X2(1, N=273) = 11.83, p<0.01) As with the baseline data collection visit, a
mother tongue IsiXhosa interviewer conducted interviews with all the Xhosa participants
in all the follow-up visits. The alternative language competence was Sesotho with Xhosa
and Afrikaans.
233

Table 5.2 Demographic, lifestyle and socio-economic status characteristics of the study sample at the final visit (n=273)
Baseline Cohort N (%) Median (IQR) N (%) Median (IQR) P-value*
Gender Male 211 (66) 183 (67) 0.41
Female 108 (34) 90 (33)
Age (years)
Median (IQR) 39 (30 – 48) 41 (31-49) 0.32#
Schooling (years)
Median (IQR) 7 (7 – 11) 8 (7 – 11) 0.60#
Home language
Afrikaans speaking 274 (86) 242 (89)
Non-Afrikaans speaking 45 (14) 31 (11) <0.01
Lifestyle factors
Current alcohol consumption 195 (61) 175 (63) <0.01
CAGE score ≥2** <0.01
-as a percentage of alc. consumers (n=195/175) 144 (74) 133 (76)
-as a percentage of respondents (n=319/273) 144 (45) 133 (49)
Current smokers 208 (65) 138 (66) 0.74
Current Marijuana (Cannabis) use 18 (6) 15 (5) 0.78
Socio economic status
3 or fewer household items 42 (13) 34 (12) 0.17
Receipt of Social Development Grant*** 108 (34) 90 (32) 0.07
Previous head injury
Self-reported previous head injuries 36 (11) 31 (11) 0.68
Psychiatric illness
Self-reported psychiatric illness §
5 (2) 4 (1) 0.72
Note: Median and inter-quartile range presented for continuous variables where data is skewed. # Two-sample Wilcoxon rank-sum (Mann Whitney)
tests to compare medians were undertaken for skewed distributions and Pearson Chi2tests of independence for other listed covariates *P-value for
comparison between those who dropped out of the cohort study and those who remained using baseline results. **The CAGE score was calculated
using ≥2 ‘Yes’ answers to identify problem alcohol users. ***Self-reported answers to questions about receipt of State Aid in farmer questionnaire §Self-reported answers to questions about illness for which medication is prescribed in farmer questionnaire
234

Lifestyle Factors: Alcohol and Smoking
More than two-thirds (63%) of the participants in this final data collection visit
reported current consumption of alcohol and of these, 76% (n= 133) could be
described as possible problem drinkers based on a CAGE total score of 2 or more
(≥2). This equates to 42% of the total sample (N=319). A chi-square test of
independence between CAGE score and gender showed that males were significantly
more likely to score highly than females, X2(1, N=133) = 5.19, p =0.02). Of those
who reported using alcohol, 74% were male and 26% were female. About two thirds
reported being current smokers of cigarettes and/or tobacco products at the final
follow-up which represents 43% of the total sample (N=319). More males reported
being current smokers (75%) and 5% of respondents (all males) reported currently
smoking Marijuana (Cannabis). These findings were similar to baseline results with
no statistically differences in proportions of smokers and Marijuana users between
baseline and final visit.
Socio-economic status
Low socio-economic status (SES) was determined by ownership of 3 or fewer
household items from a list including a radio, a refrigerator, a television set and a cell
phone or landline telephone (see Chapter 3, section 3.5.1). Twelve percent (n=34) of
farmers could be categorized as falling within a low SES. A number of participants
(32%) reported receiving State Aid in the form of a Social Development Grant and
there were no statistical differences in SES between those who remained in the
cohort at the final visit and those who were lost to follow up.
Previous injuries
There were no new head injuries reported during the cohort period and of the 36
participants who reported having sustained head injuries in the past at baseline, 6
were lost to follow-up. Male participants reported the majority of head injuries
(n=29; 97%) that resulted from a range of incidents including having been assaulted
or as a result of playing rugby. Four participants reported loss of conscious as a result
of their injury for a duration that varied from a few minutes to one week. These
included two rugby injuries, a car accident and one participant who reported having
235

been assaulted. Seven participants reported head injuries as a result of having been
assaulted (Pearson chi2tests X
2(1, N=36)= 0.17, p =0.68) showed no significant
differences in head injury experience between those who remained in the cohort at
the final visit and those who were lost to follow-up (p=0.68). Twenty-nine
participants reported injuries other than head injuries during the study period.
Injuries ranged from finger and hand injuries (38%; n=11) to back injuries (21%;
n=6), to injuries to feet (21%; n=6), eyes (n=4), injury to one nostril and a spider
bite.
Psychiatric illness
Four (1.4%) participants reported taking medication for psychiatric illness. Of these,
one was female and 3 were male. Two were pesticide applicators. The psychiatric
illnesses reported for which participants were receiving medication included
epilepsy, panic attacks, insomnia and anxiety and ‘stress’. There were no statistical
differences in history of psychiatric illness between those who remained in the cohort
at the final visit and those who were lost to follow-up.
5.3.2 Pesticide exposure information
5.3.2.1 Occupational and residential exposure status at final visit
Thirty eight percent (n=105) of the cohort reported currently living within 50 meters
or less from vineyards and orchards. The most common crop currently cultivated on
respondents’ farms was deciduous fruit (26%; n=72) followed by citrus fruit (23%;
n=63) and combinations of crops (21%; n=58); for example, some smaller farms
cultivated fruit and vegetables. Cumulatively, the two crop sectors in which
participants spent more years ever working were citrus fruit farms and on vineyards.
A small proportion (17%; n= 51) of participants reported coming into contact with
pesticides outside the home while spraying was taking place during the study period
and 16% (n= 43) reported having come into contact with pesticides soon after crops
had been sprayed on re-entering vineyards and orchards. Eighty one participants
(30%) reported pesticide spraying entering their homes by smelling the pesticides
while spraying occurred in the orchards and vineyards.
236

More than 70% of the participants (n=194) reported using pyrethroid-based
insecticides from weekly to once a year in their homes to control pests such as flies
and cockroaches
Table 5.3 Residential pesticide and crop cultivation status of participants
(N=273)
Residential status N (%)
Own their homes 49 (18)
Rented homes 13 (5)
Farm-owner homes 208 (76)
Other living arrangements 3 (1)
Residential pesticide exposure Pesticide spray entering home 81 (30)
Outside the home during spraying 51 (17)
Pesticide contact following re-entry 43 (16)
Household pesticide use 194 (71)
Crop cultivation (years) Median (IQR)
Any crop combination farm (n=58) 7.5 (4.0 – 13.0)
Citrus fruit farms (n=63) 6.0 (9.0 – 22.0)
Deciduous fruit farms (n=72) 9.5 (5.0 – 13.5)
Vineyards (n=21) 12.0 (7.0 – 17.0)
Vegetable farms (n=42) 8.0 (5.0 – 14.0)
Other crops farms (n=11) 6.0 (3.0 – 14.0)
Pensioners/retirees (n=3) 9.0 (2.0 – 0.0)
Work status at final visit
Of the 169 pesticide applicators at baseline, 78% (n=132) were still present as
applicators in the cohort at final visit and of these 25% (n=33) had applied OP
pesticides during the study period. The mean age for all applicators in the cohort
(n=132) involved in pesticide application at any follow-up visits (F1, F2 and F3) was
41years (SD: 11) with a median of 42 years (IQR: 33 to 49) and 41 years (SD: 11.4)
for non-applicators with a median of 39 years (IQR: 31 to 49). The results of a t-test
revealed that there were no statistically significant differences (p=0.23) in age
between applicators of all pesticides (those who sprayed any type of pesticides
during the cohort follow-up period) and those sprayers at baseline who did not spray
in the course of the cohort follow-up. The mean age for all cohort OP applicators was
237

40,8 years (±10.1), with a median of 42 years (IQR: 34 to 47). Of the 70 OP pesticide
applicators at baseline, the 33 who sprayed OP pesticides in the cohort were
significantly older (p=0.03) than those sprayers at baseline who remained in the
cohort but did not spray OP pesticides.
Table 5.4 A comparison of emerging farmers’ baseline and cohort occupational
status and gender
Baseline (n=319) Cohort (N=277)
Job description N (%) N (%)
Pesticide applicator 169 (53) 154 (56.0)
Infield non-applicators 126 (40) 101 (36.0)
Non-farm worker – other 9 (3) 9 (3.3)
Farm worker - general worker 6 (1.5) 6 (2.2)
Non-farm worker – industry 1 (0.4) 1 (0.4)
Unemployed 2 (0.6) 2 (0.7)
Retired 6 (1.5) 4 (1.4)
Pesticide applicators (n=169/132)
Male 137 (80) 111 (84.0)
Female 32 (20) 21 (16.0)
Non-applicators (n=150/145)
Male 74 (49) 72 (50.0)
Female 76 (51) 73 (50.0)
OP applicators (n=33)
Male 60 (86) 27 (82.0)
Female 10 (14) 6 (18.0)
Of these 169 pesticides applicators at baseline, 132 (78%) applied pesticides during
the cohort period, 15 (9%) did not do any application in the cohort period and 22
(13%) dropped out of the study by the final visit. Of the 70 OP applicators at
baseline, 33 (47%) applied OP pesticides during the cohort period, 33 (47%) did not
do any OP pesticide application in the cohort period and 4 (6%) dropped out of the
study by the final visit. Among applicators who sprayed all pesticides a greater
proportion of males remained (92% vs 75%; p<0.01), similarly for OP applicators
(92% vs 70%; p<0.05). Of the 70 OP applicators at baseline, 10 (14%) were female
and 4 (6%) were lost to follow up.
238

Cumulative pesticide application in days over the cohort follow-up period
Table 5.5 shows the method of pesticide application during the follow-up period. The
majority of pesticide applications were conducted using a tractor with a mist blower
(n=34) and with participants walking behind the tractor guiding spray nozzles (n=8).
Seventy-nine participants (28.5%) reported using a tractor but did not specify
whether a mist blower or boom sprayer was used to apply pesticides.
Table 5.5 Cumulative days in pesticide-related job tasks over a one year period
for F1a, F2
b and F3
c visits (N=277)
Job tasks ( in days) Mean
(SD)
Median Inter-quartile
range
Mixing indoors (n=23) 4.70
(±12.9)
0.6 0.8-3.0
Mixing outdoors (n=3) 40.6
(±35.2)
60.0 0.01 - 61.9
Back pack with spray gun (n=39) 8.9
(±14.9)
3.7 2.0-10.5
Manual applications (by hand) (n=20) 6.91
(±7.3)
3.9 1.3-13.0
Tractor (n=79) 36.8
(±32.1)
28.7 11.3-55.0
Tractor with mistblower (n=34) 28.5
(±27.5)
19.6 3.7-56.3
Tractor with hand-directed nozzles
behind(n=8)
17.0
(±13.1)
13.75 6.38-30.0
Quad bike (n=2) 49.7
(±64.9)
49.7 3.75-95.6
All current job pesticide-related tasks (n=132) 36.7
(±39.0)
20.0 4.0 - 61.5
Note: Work days were calculated as 8 hour work day equivalents where
work time was reported in hours or minutes for a portion of the day worked.
aMean follow-up time for baseline to F1 = 10.1days (SD 8.7); IQR 5 - 19
bMean follow-up time for F1 to F2 = 35.8 days (SD 42.5); IQR 6 - 58
cMean follow-up time for F2 to F3= 88.6days (SD 68.9); IQR 55- 95
A backpack with a spraygun was used by 39 participants and 20 participants reported
hanging insect bait by hand.
Twenty-six participants reported mixing pesticides indoors and outdoors. The
pesticide use by chemical group and class is shown in Table 5.6.The most common
group of agents applied was insecticides, followed by fungicides, fertilizers, leaf
239

wetters, growth regulators and herbicides. Eleven participants (n=11) did not know
the names of pesticides they applied and could not remember pesticide names.
Thirty-three applicators reported applying OP pesticides over the follow-up period
with a mean of 20 days (SD: 21.5) and an inter-quartile range (IQR) of 3.7 to 48.6 8-
hour days. Carbamates were applied with a mean of 33.4 days (SD: 27.6) by twenty-
five (19%) (n=25) applicators.
Table 5.6 Number of days using pesticides in the cohort follow-up period
(N=277)
5.3.2.2 Exposure measures
The Shapiro-Wilks test (p < 0.05) showed that the continuous exposure variables for
all pesticides (total exposure days) and OP pesticides were not normally distributed.
Agrichemical use by chemical group Mean (SD) Median Inter-quartile
range
Number of days reported using
insecticides (n=95)
30.1
(±33.2)
20.0 3.7 - 48.6
Number of days reported using
fungicides (n=41)
28.4
(±28.7)
20.0 7.5-40.0
Number of days reported using
herbicides (n=54)
18.8
(±20.3)
11.7 2.5-30.6
Number of days reported using
fertilizers, adjuvants and growth
regulators (n=27)
27.2
(±20.7)
20.0 9.5-42.5
Unclassified pesticides (n=11) 7.05
(±8.6)
3.0 2.0-11.3
Agrichemical use by chemical class
Number of days reported using
organophosphate pesticides (n=33)
20.5
(±21.5)
13.0 6.4-21.5
Number of days reported using
pyrethroid pesticides (n=33)
23.4
(±24.2)
12.6 3.0 - 43.1
Number of days reported using
carbamate pesticides (n=25)
33.4
(±27.6)
20.3
13.1- 60.0
Number of days reported using
fertilizers, leaf wetters and growth
regulators (n=105)
25.5
(±26.1)
20.0
5.5 - 40.0
Total number of days for all chemical
classes and groups (n=132)
36.7
(±39.0)
20.0 4.0 - 61.5
Unclassified pesticides (n=11) 7.1
(±8.6)
3.0 2.0–11.3
240

Log transformation did not normalize the distribution and medians, range, means and
standard deviations are reported in Table 5.7.
Table 5.7 Cumulative exposure days for all pesticides and OP pesticides (N=277)
5.3.2.3 Pesticide poisoning
Twenty-six participants (4%) reported having been diagnosed with pesticide
poisoning by a health professional during the cohort follow up period. Of these 7
were female and 19 were male. Information on recent poisoning incidents during the
cohort study was also collected in the final visit and past poisoning before the start of
the study was reported in the baseline results chapter (Section 4.2.2.5, page 13).
Briefly, 201 (63%) of 319 participants who started in the cohort reported at the final
data collection phase on pesticide poisoning prior to the baseline visit and recent
poisoning during the cohort study period. Of these, 102 (51%) of 201 participants
reported having experienced past and recent poisoning symptoms. Twenty-three
(11%) of the 201 participants reported that they had been diagnosed in the past with
pesticide poisoning by a health professional and 26 (13%) participants reported
recent diagnosed poisoning during the cohort study.
Exposure variable N Mean SD Median Inter-quartile
range
Continuous exposure variables
All pesticide total exposure
days (Unweighted days)
132
36.7
38.4
20.5
4 - 61.6
All pesticide jemdays
(Weighted by activity)
132
25.7
26.9
14.4
2.8 - 42.9
Only OP pesticide days
(Unweighted days)
33
20.5
21.5
13.0
6.4- 21.5
Only OP pesticide days
jemdays
(Weighted by activity)
33
14.4
4.47
9.1
4.5 - 15.1
241

5.3.3 Neurobehavioural outcomes
5.3.3.1 Scoring of neurobehavioural outcomes
The methods for each test used in the study are outlined in detail in Chapter 3
(section 3.5.2) and the score range briefly summarised in Table 4.9 in the previous
baseline results and discussion chapter (Chapter 4).
Table 5.8 maps the baseline performance scores of those participants who were lost
to follow-up and those who remained in the cohort. There was a significant
difference in the mean scores of those who left and those who remained in the cohort
in performance on the Global Severity Index of the BSI (p=0,02). The baseline mean
score of 57.0 (SD 9.4) of those who were lost to follow-up (n=46) was significantly
higher on the Global Severity Index of the BSI than the mean score of those who
remained in the cohort (mean 53.7; SD: 9.1). There were no other significant
differences on the other neurobehavioural outcomes between those who left and
those who remained in the cohort.
In order to determine the change in neurobehavioural performance over a 12 month
period between baseline and final neurobehavioural performance, ratio scores
expressed as a percentage were calculated and multiplied by 100. This was chosen in
preference to estimating difference in scores, so as to avoid negative values. The
following formula was thus used:
final/baseline*100
The change in outcomes (neurobehavioural performance) over a 12 month period
between baseline and final data collection visit is reported as a ratio with no negative
values. In this manner any value <100 indicates a negative value or a decrease in
performance over time. Similarly, any value equal to 100 indicates no change
between baseline and final neurobehavioural performance and values >100 indicate a
positive value or an increase in neurobehavioural performance. The difference
between the obtained ratio and 100 can be understood as the percentage of baseline
performance lost or gained at the end of the follow-up period.
242

Table 5.8 Neurobehavioural outcome scores for the cohort at baseline and final visit
Outcome N Baseline
Final
Follow-up
P-value*
Outcome N Mean SD Median N Mean SD Median
Digit Span
Digit Span Forward 46 6.0 2.0 6.0 273 6.1 2.2 6.0 0.76
Digit Span Backward 46 3.4 1.6 3.5 273 3.5 1.6 3.0 0.97 WAIS-III Std score 46 6.8 1.8 6.0 273 6.9 1.9 6.0 0.92 Digit Symbol
WAIS-III Std score 40 6.1 1.5 6.0 263 5.7 1.5 5.0 0.08
Benton VRT
Number correct 46 5.8 2.0 6.0 273 6.1 2.1 6.0 0.38
Santa Ana
Dom. hand total* 46 36.8 7.7 36.5 273 36.6 8.4 37.0 0.87 Non-dom. hand total 45 34.7 7.3 36.0 272 35.2 8.6 36.0 0.50 Pursuit Aiming
Total correct 40 81.4 47.3 82.5 261 71.0 42.0 68.0 0.16
Brief Symptom
Inventory
GSI 46 57.0 9.4 57.0 272 53.7 9.1 53.0 0.02
Swedish Q16
Total score 46 4.9 3.8 4.0 272 4.0 3.3 3.0 0.17
Vibration Sense
Threshold
Average score 45 12.8 5.6 12.5 270 13.6 5.4 13.0 0.25
*P-value for comparison between those who dropped out of the cohort study and those who remained in the cohort
using baseline results
243

5.3.3.1.1 Descriptive results for the difference between baseline and
final follow-up scores on neurobehavioural tests
The ratio of scores for neurobehavioural performance from baseline to final assessment
for all eleven outcomes (Digit Span Forward, Digit Span Backward, Digit Span WAIS,
Digit Symbol, Benton Visual Retention, Santa Ana dominant hand, Santa Ana non-
dominant hand, Pursuit Aiming, Brief Symptom Inventory, vibration sense threshold,
Q16) was calculated and recorded as continuous data. Table 5.9 presents descriptive
statistics for five subtests from the WHO Neurobehavioural Core Test Battery (WHO,
1986), the Brief Symptom Inventory Global Severity Index (GSI), the vibration sense
threshold test and the Q16. The number of respondents who completed the
neurobehavioural tests ranged from 252 (Pursuit Aiming) to 265 (Digit Symbol), 272
(Santa Ana Pegboard) and 273 for all other tests. The first column re-presents the
baselines results for those participants present at the final visit, the second column
presents the results for the final visit and the third column presents the ratios of final to
baseline for each test.
The Shapiro-Wilks test (p < 0.05) showed that the ratio scores for all of the outcomes
were not normally distributed. Log transformation normalized the distributions for Digit
Span Backward, Digit Span WAIS, vibration sense threshold and the Swedish Q16. The
distribution for all the other outcomes scores remained skewed after log transformation.
Medians, inter-quartile range, means and standard deviations are reported in Table 5.8
for the baseline, final visit and ratio of final to baseline, with IQR also reported for the
latter.
Performance on Digit Span Forward and Digit Span WAIS decreased over time while
on the Global Severity Index of the BSI performance improved over time (lower scores
indicate better performance on the BSI). Performance on eight of the neurobehavioural
outcomes improved over time (Table 5.9). Depending on the outcome measure, between
14% and 22% of participants were lost to follow-up.
244

Table 5.9 Neurobehavioural outcome scores for the Baseline, follow up and ratio outcome scores Outcome N Baseline Final Follow-up Ratio follow-up score to baseline
Outcome N Mean SD Median Mean SD Median Mean
ratio
SD Median Inter-quartile
range
Digit Span
Digit Span Forward 273 6.1 2.2 6.0 5.2 1.7 5.0 91.1 31.7 84.6 71.4 - 100.0
Digit Span Backward 264 3.5 1.6 3.0 3.4 1.5 3.0 101.3 38.6 100.0 75.0 - 120.0
WAIS-III Std score 273 6.9 1.9 6.0 6.4 1.5 0.8 95.2 20.0 100.0 83.3 - 100.0
Digit Symbol
WAIS-III Std score 257 5.8 1.5 5.0 5.9 1.6 5.0 104.5 15.3 100.0 100.0 - 116.67
Benton VRT
Number correct 273 6.0 2.1 6.0 6.2 2.0 6.0 111.1 51.1 100.0 80.0 - 125.0
Santa Ana
Dom. hand total* 272 36.6 8.3 37.0 36.6 8.4 37.0 109.8 23.8 106.7 95.2 - 120.6
Non-dom. hand total 272 35.1 8.4 36.0 35.2 8.6 36.0 110.1 29.5 104.1 95.1 - 116.2
Pursuit Aiming
Total correct 252 72.4 41.2 69.0 60.1 42.2 51.0 102.5 89.6 80.9 44.6 - 128.1
Brief Symptom Inventory
GSI 272 54.2 9.4 53.0 52.2 7.7 53.0 99.4 18.4 96.6 87.4 - 110.4
Swedish Q16
Total score 214 4.2 3.7 3.0 3.8 3.3 3.0 123.1 105.0 100.0 50.0 - 166.7
Vibration Sense Threshold
Average score 270 13.5 5.4 13.0 13.2 5.2 12.5 108.2 53.7 95.1 73.9 - 130.0
*Normally distributed data (Shapiro-Wilk W test)
245

5.4 BIVARIATE RESULTS
A borderline non-significant decline in performance between the Santa Ana
Pegboard non-dominant hand and participants older than 40 years of age (p<0.07)
was noted (Table 5.10).
Table 5.10 Change in neurobehavioural outcomes# by age
Outcome Age ≤ 40* Age >40
P-value§ Mean
(SD)
Median
(IQR)
Mean
(SD)
Median
(IQR)
Digit Span
Forward
(n=143)
91.5
(28.7)
(n=143)
86
(75.0-100.0)
(n=130)
90.7
(34.5)
(n=130)
83
(66.7-83.3)
0.21
Backward
(n=141)
105.1
(35.9)
(n=141)
100
(80.0-120.0)
(n=123)
97.5
(41.0)
(n=123)
100
(75.0-125.0)
0.31
Log
transformed
score
(n=141)
2.0
(0.1)
(n=141)
2
(1.9-2.0)
(n=117)
2.0
(0.2)
(n=117)
2
(1.9-2.1)
0.63
WAIS-III
Std Score
(n=143)
95.4
(20.9)
(n=143)
100
(83.3-100.0)
(n=130)
95.1
(19.0)
(n=130)
100.0
(83.3-100.0)
0.86
Log
transformed
score
(n=143)
1.97
(0.1)
(n=143)
2
(1.9 - 2.0)
(n=130)
1.97
(0.1)
(n=130)
2
(1.9-2.0)
1.00
Digit Symbol Substitution
WAIS-III Std
Score
(n=140)
105.8
(14.2)
(n=140)
100
(100.0-116. 7)
(n=117)
102.9
(16.6)
(n=117)
100
(100.0-116. 7)
0.24
Benton Visual Retention Test
Number
Correct
(n=143)
111.4
(46.1)
(n=143)
100
(83.3-133.3)
(n=130)
110.7
(56.3)
(n=130)
100
(80.0-120.0)
0.39
Santa Ana Pegboard
Dom. hand
total
(n=142)
111.2
(23.3)
(n=142)
108
(97.6-122.2)
(n=130)
108.2
(24.5)
(n=130)
106
(91.9-120.0)
0.16
Non-dom.
hand total
(n=142)
112.8
(32.2)
(n=142)
106
(95.7-120.0)
(n=130)
107.2
(26.2)
(n=130)
101
(93.3-114.3)
0.07
Pursuit Aiming II
Total correct
(n=141)
99.5
(78.8)
(n=141)
81
(51.7-125.0)
(n=111)
106.3
(101.9)
(n=111)
79
(34.2-135.6)
0.58
Brief Symptom Inventory
GSI
(n=142)
98.1
(16.9)
(n=142)
95
(86.9-110.3)
(n=130)
100.7
(19.9)
(n=130)
100.0
(88.3-111.1)
0.32
246

#Expressed as ratio of scores at final visit to scores at baseline, multiplied by 100;
*Age cut off at median = 40
§Comparisons were made using a t-test for Digit Span
Backward, Digit Span WAIS, vibration sense and Q16 and Wilcoxon ranksum comparison
of medians was undertaken for Digit Span forward, Benton Visual Retention, Digit Symbol,
Santa Ana dominant and non-dominant hand, Pursuit Aiming and Brief Symptom Inventory
because of non-normality of the distributions.
Although none of the changes were statistically significant, participants with ≤9
years of schooling (cut off at median) performed worse than those with more than 9
years of schooling on 5 out of 11 neurobehavioural tests (Digit Span Forward, Digit
Span Backward, Digit Symbol, Benton Visual Rentention, Santa Ana dominant).
Table 5.11 Change in neurobehavioural outcomes# by schooling
Swedish Q16
Total score (n=108)
126.3
(101.5)
(n=108)
100
(55.8-190.0)
(n=106)
119.9
(108.9)
(n=106)
100
(40.0- 150.0)
0.38
Log
transformed
score
(n=103)
2.0
(0.3)
(n=103)
2
(1.8-2.3)
(n=102)
2.0
(0.4)
(n=102)
2
(1.6-2.2)
0.18
Vibration Sense threshold
(n=143)
111.0
(55.1)
(n=143)
96
(75.0-133.3)
(n=127)
105.0
(52.2)
(n=127)
92
(70.8-125.0)
0.32
Log
transformed
score
(n=143)
2.0
(0.2)
(n=143)
2
(1.9-2.1)
(n=127)
2.0
(0.2)
(n=127)
2
(1.9-2.1)
0.29
Outcome Schooling ≤9 years* Schooling > 9 years*
P-value Mean
(SD)
Median
(IQR)
Mean
(SD)
Median
(IQR)
Digit Span
Forward
(n=176)
90.8
(32.7)
(n=176)
83
(71.4-100.0)
(n=97)
91.5
(29.9)
(n=97)
88
(71.4-112.5)
0.60
Backward
(n=168)
100.5
(41.4)
(n=168)
100
(75.0-125.0)
(n=96)
102.8
(33.3)
(n=96)
100
(80.0-100.0)
0.78
Log
transformed
score
(n=162)
2.0
(0.2)
(n=162)
2
(1.9-2.1)
(n=96)
2.0
(0.1)
(n=96)
2
(1.9-2.0)
0.99
WAIS-III Std
Score
(n=176)
95.3
(18.3)
(n=176)
100
(83.3-100.0)
(n=97)
95.1
(22.9)
(n=97)
89
(81.8-112.5)
0.56
Log
transformed
score
(n=176)
2.0
(0.1)
(n=176)
2
(1.9-2.0)
(n=97)
2.0
(0.1)
(n=97)
2
(1.9-2.1)
0.68
247

#Expressed as a ratio of scores at final visit to scores at baseline, multiplied by 100;
*Education cut off at median = 9 years of schooling
§Comparisons were made using a t-test
for Digit Span Backward, Digit Span WAIS, vibration sense and Q16 and Wilcoxon
comparison of medians was undertaken for Digit Span forward, Benton Visual Retention,
Digit Symbol, Santa Ana dominant and non-dominant hand, Pursuit Aiming and Brief
Symptom Inventory because of non-normality of the distributions.
Change in performance was compared by a range of other covariates, the tables of
results for which are contained in Appendix H but not presented in detail here.
Changes in male participants’ performance over time was better than females on 5
out of 11 outcomes; however there were no significant associations between gender
Digit Symbol Substitution
WAIS-III Std
Score
(n=160)
104.0
(15.9)
(n=160)
100
(100.0-116.7)
(n=97)
105.3(1
4.5)
(n=97)
100
(100.0-116.7)
0.62
Benton Visual Retention Test
Number
Correct
(n=176)
110.0
(53.5)
(n=176)
100
(80.0-125.0)
(n=97)
113.0
(46.7)
(n=97)
100
(83.3-133.3)
0.59
Santa Ana Pegboard
Dom. hand
total
(n=176)
109.0
(26.1)
(n=176)
106
(92.0-120.0)
(n=96)
111.3(1
9.0)
(n=96)
109
(97.62-121.3)
0.14
Non-dom.
hand total
(n=176)
110.5
(33.2)
(n=176)
102.9
(94.3-114.7)
(n=96)
109.4
(21.5)
(n=96)
106.7
(95.3-119.7)
0.32
Pursuit Aiming II Test
Total correct
(n=156)
104.0
(90.6)
(n=156)
79
(46.7-131.9)
(n=96)
100.1
(88.4)
(n=96)
81
(43.4-125.5)
0.85
Brief Symptom Inventory
GSI
(n=175)
98.8
(19.8)
(n=175)
96
(85.7-110.4)
(n=97)
100.4
(15.8)
(n=97)
100
(91.2-110.4)
0.22
Swedish Q16
Total score
(n=146)
121.0
(103.7)
(n=146)
100
(45.5-150.0)
(n=65)
130.6
(110.2)
(n=65)
100
(50.0-200.0)
0.71
Log
transformed
score
(n=142)
2.0
(0.4)
(n=142)
2
(1.7-2.2)
(n=60)
2.0
(0.4)
(n=60)
2
(1.8-2.3)
0.34
Vibration Sense threshold
Total score (n=174)
108.2
(55.0)
(n=174)
94
(70.8-133.3)
(n=96)
108.2
(51.7)
(n=96)
96
(75.0-124.0)
0.76
Log
transformed
score
(n=174)
2.0
(0.2)
(n=174)
2
(1.9-2.1)
(n=96)
2.0
(0.2)
(n=96)
2
(1.9-2.1)
0.60
248

and the change in neurobehavioural performance over time at the p≤0.05 significance
level.
Afrikaans-speaking participants’ performance on the Santa Ana Pegboard non-
dominant hand was significantly worse over time than non-Afrikaans speaking
participants (p=0.01). Non-Afrikaans speaking participants performed significantly
worse on the Q16 than Afrikaans speaking participants over time (p<0.01).
Performance on the Santa Ana non-dominant hand improved for both Afrikaans and
non-Afrikaans-speaking participants; however, non-Afrikaans-speaking participants
improved significantly more than Afrikaans-speaking participants over time.
Vibration sensitivity improved significantly among current alcohol consumers
(p=0.01). The performance on all other outcomes was unaffected over time and not
significant. There was also a marginal improvement over time for problem alcohol
drinkers on vibration sensitivity showing a borderline significance (p=0.07).
Participants in the low socio-economic status category showed a significant
improvement in performance on the Santa Ana non-dominant hand compared to
those in the high socio-economic status category(p=0.02). For the rest of the
outcomes the change in performance by problem drinking was non-significant.
Tables H1 to H5 reflecting results for these associations are contained in Appendix
H.
5.4.1 Neurobehavioural outcomes by applicator status
Table 5.12 shows the results for all the neurobehavioural outcomes, expressed as
change from baseline to final visit, by applicator status. These are applicators of all
pesticides who had either mixed or applied all classes of pesticides (such as
carbamates, organophosphates, pyrethroids and all other forms of agrichemicals) by
any mode of application (Back pack, Quad bike, tractor with mist blower or
manually (by hand) at any point during the follow up period. There were no
significant associations between applicators and change in neurobehavioural
performance over time.
249

Table 5.12 Change in neurobehavioural outcomes#
by applicator status
(n=273)
Outcome Applicator Non-applicator
P-value Mean
(SD)
Median
(IQR)
Mean
(SD)
Median
(IQR)
Digit Span
Forward
(n=121)
91.8
(32.2)
(n=121)
86
(71.4-100.0)
(n=152)
90.5
(31.4)
(n=152)
83
(71.4-100.0)
0.50
Backward
(n=118)
104.9
(35.1)
(n=118)
100
(83.3-120.0)
(n=146)
98.4
(41.1)
(n=146)
100
(75.0-120.0)
0.06
Log
transformed
score
(n=116)
2.0
(0.1)
(n=116)
2
(1.9-2.1)
(n=142)
2.0
(0.2)
(n=142)
2
(1.9-2.1)
0.08
WAIS-III Std
Score
(n=121)
97.0
(20.5)
(n=121)
100
(83.3-100.0)
(n=152)
93.8
(19.5)
(n=152)
100
(80.0-100.0)
0.14
Log
transformed
score
(n=121)
2.0
(0.1)
(n=121)
2
(1.9-2.0)
(n=152)
1.9
(0.1)
(n=152)
2
(1.9-2.0)
0.19
Digit Symbol Substitution
WAIS-III Std
Score
(n=116)
102.6
(14.9)
(n=116)
100
(100.0-114.3)
(n=141)
106.0
(15.6)
(n=141)
100
(100.0-116.7)
0.19
Benton Visual Retention Test
Number
Correct
(n=121)
119.7
(60.4)
(n=121)
100
(83.3-142.9)
(n=152)
104.2
(41.1)
(n=152)
100
(78.9-120.0)
0.12
Santa Ana Pegboard
Dom. hand
total
(n=120)
109.3
(23.7)
(n=120)
106
(94.5-120.8)
(n=152)
110.2(2
4.0)
(n=152)
108
(95.6-120.0)
0.80
Non-dom.
hand total
(n=121)
110.1(28.3)
(n=121)
104
(94.6-119.4)
(n=151)
110.2
(30.6)
(n=151)
104
(95.1-114.3)
0.94
Pursuit Aiming II Test
Total correct
(n=112)
95.5
(80.1)
(n=112)
77
(42.8-125.6)
(n=140)
108.1
(96.5)
(n=140)
85
(47.5-139.0)
0.51
Brief Symptom Inventory
GSI
(n=121)
100.8
(20.4)
(n=121)
100
(88.9-111.1)
(n=151)
98.2
(16.7)
(n=151)
96
(86.9-108.3)
0.66
Swedish Q16
Total score (n=89)
113.6
(89.6)
(n=89)
100
(50.0-162.5)
(n=125)
129.9
(114.6)
(n=125)
100
(50.0-180.0)
0.69
Log
transformed
score
(n=82)
2.0
(0.3)
(n=82)
2
(1.7-2.2)
(n=123)
2.0
(0.4)
(n=123)
2
(1.7-2.3)
0.84
250

#Expressed as a ratio of scores at final visit to scores at baseline, multiplied by 100;
§Comparisons were made using a t-test for Digit Span Backward, Digit Span WAIS,
vibration sense and Q16 and Wilcoxon comparison of medians was undertaken for Digit
Span forward, Benton Visual Retention, Digit Symbol, Santa Ana dominant and non-
dominant hand, Pursuit Aiming and Brief Symptom Inventory because of non-normality of
the distributions.
There was no significant difference for change in neurobehaviorual performance,
comparing OP pesticide applicators to farmers who did not apply OP’s (Table 5.13).
The change in vibration sensitivity among OP applicators compared to those who did
not apply OP pesticides approached statistical significance (p=0.08) and the direction
was to suggest that performance for OP applicators improved more than for OP non-
applicators.
Table 5.13 Change in neurobehavioral Outcomes# by OP applicator status
(n=273)
Vibration Sense threshold
Total score (n=119)
108.0
(55.1)
(n=119)
94
(70.6-131.6)
(n=151)
108.4
(52.9)
(n=151)
96
(77.3-125.0)
0.66
Log
transformed
score
(n=119)
2.0
(0.2)
(n=119)
2
(1.9-2.1)
(n=151)
2.0
(0.2)
(n=151)
2
(1.9-2.1)
0.81
Outcome OP applicator Non-OP applicator
P-value Mean
(SD)
Median
(IQR)
Mean
(SD)
Median
(IQR)
Digit Span
Forward
(n=30)
100.0
(35.3)
(n=30)
100
(75.0-125.0)
(n=243)
90.0
(31.1)
(n=243)
83
(71.4-100.0)
0.10
Backward
(n=29)
100.3
(27.3)
(n=29)
100
(80.0-100.0)
(n=235)
101.4
(39.8)
(n=235)
100
(75.0-125.0)
0.93
Log
transformed
score
(n=29)
2.0
(0.1)
(n=29)
2
(1.9-2.0)
(n=229)
2.0
(0.1)
(n=229)
2
(1.9-2.1)
0.84
WAIS-III Std
Score
(n=30)
97.4
(20.7)
(n=30)
100.0
(81.8-114.3)
(n=243)
95.0
(19.9)
(n=243)
100
(83.3-100.0)
0.34
Log
transformed
score
(n=30)
2.0
(0.1)
(n=30)
2
(1.9-2.1)
(n=243)
2.0
(0.1)
(n=243)
2
(1.9-2.1)
0.57
251

# Expressed as a ratio of scores at final visit to scores at baseline, multiplied by 100;
§Comparisons were made using a t-test for Digit Span Backward, Digit Span WAIS,
vibration sense and Q16 and Wilcoxon comparison of medians was undertaken for Digit
Span forward, Benton Visual Retention, Digit Symbol, Santa Ana dominant and non-
dominant hand, Pursuit Aiming and Brief Symptom Inventory because of non-normality of
the distributions.
Table 5.14 shows that participants with recent poisoning experiences performed
significantly worse over time on the Digit Span Forward (p=0.04), Digit Span WAIS
(p=0.03) and Pursuit Aiming tests (p=0.01) than those without recent poisoning.
Recent poisoned participants also performed worse on most of the tests except the
Digit Symbol Substitution
WAIS-III Std
Score
(n=28)
106.3
(14.1)
(n=28)
100
(100-116.7)
(n=229)
104.3(1
5.5)
(n=229)
100
(100.0-116.7)
0.46
Benton Visual Retention Test
Number
Correct
(n=30)
119.2
(63.7)
(n=30)
100
(87.5-150.0)
(n=243)
110.1(4
9.4)
(n=243)
100
(80.0-125.0)
0.48
Santa Ana Pegboard
Dom. hand
total
(n=29)
114.3(21.3)
(n=29)
117
(100.0-120.9)
(n=243)
109.3(2
4.1)
(n=243)
106
(94.1-120.0)
0.11
Non-dom.
hand total
(n=30)
109.7(28.2)
(n=30)
103
(92.5-113.2)
(n=242)
110.2
(29.7)
(n=242)
104
(95.2-116.2)
0.72
Pursuit Aiming II Test
Total
correct
(n=27)
81.4
(42.8)
(n=27)
74
(51.2-119.4)
(n=225)
105.0
(93.4)
(n=225)
81
(44.0-133.3)
0.59
Brief Symptom Inventory
GSI
(n=30)
96.1
(15.7)
(n=30)
94
(86.7-108.9)
(n=242)
99.8
(18.7)
(n=242)
98
(87.5-111.1)
0.32
Swedish Q16
Total
score
(n=20)
133.0
(99.4)
(n=20)
110
(55.8-200.0)
(n=194)
122.1
(105.8)
(n=194)
100
(45.5-162.5)
0.39
Log
transformed
score
(n=18)
2.1
(0.3)
(n=18)
2
(1.9-2.3)
(n=187)
2.0
(0.4)
(n=187)
2
(1.7-2.2)
0.15
Vibration Sense threshold
Total
score
(n=29)
117.5
(45.5)
(n=29)
114
(78.6-136.0)
(n=241)
107.1
(54.6)
(n=241)
93
(72.7-125.0)
0.08
Log
transformed
score
(n=29)
2.0
(0.2)
(n=29)
2
(1.9-2.1)
(n=241)
2.0
(0.2)
(n=241)
2
(1.9-2.1)
0.13
252

Digit Span Backward and the Swedish Q16 tests over time but the differences were
not statistically significant between the two groups.
Table 5.14 Change in neurobehavioral outcomes by recent diagnosed poisoning
status (n=201)
Outcome Poisoned (n=26) Non-poisoned (n=175)
P-value Mean
(SD)
Median
(IQR)
Mean
(SD)
Median
(IQR)
Digit Span
Forward
(n=23)
78.8
(31.1)
(n=23)
75
(62.5-100.0)
(n=170)
94.6
(33.3)
(n=170)
88
(72.0-112.5)
0.04
Backward (n=22)
91.7
(31.4)
(n=22)
100
(75.0-100.0)
(n=167)
104.2
(40.5)
(n=167)
100
(80.0-125.0)
0.23
Backward
Log
transformed
score
(n=21)
1.9
(0.1)
(n=21)
2
(1.8-2.0)
(n=164)
2.0
(0.1)
(n=164)
2
(1.9-2.1)
0.36
WAIS-III Std
Score
(n=23)
87.1
(16.5)
(n=23)
86
(75.0-100.0)
(n=170)
97.2
(21.2)
(n=170)
100
(83.3-100.0)
0.05
Log
transformed
score
(n=23)
2.0
(0.1)
(n=23)
2
(1.9-2.0)
(n=170)
2.0
(0.1)
(n=170)
2
(1.9-2.1)
0.03
Digit Symbol Substitution
WAIS-III Std
Score
(n=21)
100.5
(13.6)
(n=21)
100
(100-111.1)
(n=160)
104.5
(14.9)
(n=160)
100
(100.0-116.7)
0.25
Benton Visual Retention Test
Number
Correct
(n=23)
110.4
(23.1)
(n=23)
114
(100.0-125.0)
(n=170)
110.8
(55.9)
(n=170)
100
(80.0-125.0)
0.20
Santa Ana Pegboard
Dom. hand
total
(n=23)
107.7
(21.0)
(n=23)
106
(94.4-125.0)
(n=169)
112.5
(25.5)
(n=169)
109
(97.4-125.0)
0.56
Non-dom.
hand total
(n=23)
100.8
(13.5)
(n=23)
100
(93.0-108.8)
(n=169)
110.0
(31.4)
(n=169)
104
(95.1-115.4)
0.28
Pursuit Aiming II Test
Total correct
(n=23)
65.5
(63.0)
(n=23)
56
(17.1-81.3)
(n=157)
106.5
(94.9)
(n=157)
86
(48.6-126.4)
0.01
Brief Symptom Inventory
GSI
(n=23)
98.6
(12.8)
(n=23)
100
(88.3-107.3)
(n=169)
99.7
(19.6)
(n=169)
96
(87.3-110.9)
0.92
253

5.5 MULTIVARIATE ASSOCIATIONS
The covariates age, schooling, gender, current alcohol consumption, previous head
injury, psychiatric illness and socio-economic status were all selected a priori during
model building and thus included in all the models with outcomes and exposure
variables (Table 5.15). Because current alcohol use and CAGE scores were highly
correlated (p<0.01) only current alcohol use was included in the logistic regression
analysis. Language was the only covariate that was not one of the a priori selected
covariates but was significantly associated with Digit Symbol, Benton Visual
Retention test, Santa Ana non-dominant hand and the Q16 and therefore included in
regression models for these outcomes. Other covariates investigated included height
and current smoking but these were not significantly associated with the outcomes
and were not included in the analyses.
Swedish Q16
Total score (n=19)
90.8
(76.8)
(n=19)
63
(33.3-128.6)
(n=136)
126.4
(108.1)
(n=136)
100
(47.2-173.0)
0.20
Log
transformed
score
(n=17)
1.9
(0.3)
(n=17)
2
(1.7-2.1)
(n=130)
2.0
(0.4)
(n=130)
2
(1.7-2.3)
0.40
Vibration Sense threshold
Total
score
(n=23)
100.8
(54.8)
(n=23)
85
(65.5-112.5)
(n=168)
109.9
(55.5)
(n=168)
96
(74.6-130.0)
0.24
Log
transformed
score
(n=23)
2.0
(0.2)
(n=23)
2
(1.8-2.1)
(n=168)
2.0
(0.2)
(n=168)
2
(1.9-2.1)
0.14
254

Table 5.15 Outcomes, covariates and exposure variables included in regression models
Outcome Covariates Exposure variables (alternate models)
Digit Span Forward Age, gender, education, current alcohol OP applicator, OP jemdays,
consumption, head injury, psychiatric illness, recent diagnosed poisoning
socio-economic status
Digit Span Backward Age, gender, education, current alcohol OP applicator, OP jemdays,
consumption, head injury, psychiatric illness, recent diagnosed poisoning
socio-economic status
Digit Span WAIS Age, gender, education, current alcohol OP applicator, OP jemdays,
consumption, head injury, psychiatric illness, recent diagnosed poisoning
socio-economic status
Digit Symbol Substitution Age, gender, education, language, current alcohol OP applicator, OP jemdays,
consumption, head injury, psychiatric illness, recent diagnosed poisoning
socio-economic status
Benton Visual Retention Test Age, gender, education, language, current alcohol OP applicator, OP jemdays,
consumption, head injury, psychiatric illness, recent diagnosed poisoning
socio-economic status
Santa Ana Pegboard dom. Hand Age, gender, education, current alcohol OP applicator, OP jemdays,
consumption, head injury, psychiatric illness, recent diagnosed poisoning
socio-economic status
Santa Ana Pegboard non-dom. Hand Age, gender, education, language, current alcohol OP applicator, OP jemdays,
consumption, head injury, psychiatric illness, recent diagnosed poisoning
socio-economic status
255

Pursuit Aiming II Test Age, gender, education, current alcohol OP applicator, OP jemdays,
consumption, head injury, psychiatric illness, recent diagnosed poisoning
socio-economic status
Brief Symptom Inventory Age, gender, education, current alcohol OP applicator, OP jemdays,
consumption, head injury, psychiatric illness, recent diagnosed poisoning
socio-economic status
Swedish Q16 Age, gender, education, language, current alcohol OP applicator, OP jemdays,
consumption, head injury, psychiatric illness, recent diagnosed poisoning
socio-economic status
Vibration Sense threshold Age, gender, education, current alcohol OP applicator, OP jemdays,
consumption, head injury, psychiatric illness, recent diagnosed poisoning
socio-economic
256

Table 5.16 Odds Ratio interpretation for multivariate logistic regression results
Outcomes Score direction Interpretation
Digit Span High scores = better performance 100 = no change in performance
>100 = improved performance
<100 = decreased performance
Digit Symbol High scores = better performance 100 = no change in performance
>100 = improved performance
<100 = decreased performance
Benton VRT High scores = better performance 100 = no change in performance
>100 = improved performance
<100 = decreased performance
Santa Ana
Pegboard
High scores = better performance 100 = no change in performance
>100 = improved performance
<100 = decreased performance
Pursuit Aiming High scores = better performance 100 = no change in performance
>100 = improved performance
<100 = decreased performance
Brief Symptom
Inventory
Low scores = better performance 100 = no change in performance
<100 = improved performance
>100 = decreased performance
Swedish Q16 Low scores = better performance 100 = no change in performance
<100 = improved performance
>100 = decreased performance
Vibration sense
threshold
High scores = better performance 100 = no change in performance
<100 = improved performance
>100 = decreased performance
Since outcomes were not normally distributed, results from linear regression analyses
was not be used. As with the Baseline analyses, associations between neurobehavioural
outcomes and exposure were investigated further by dichotomizing outcomes and using
logistic regression analyses. Outcomes where higher scores indicated better performance
(in this case, improvement from baseline to final visit) were dichotomized at the 25th
percentile to identify change in performance in a negative direction relative to the
comparison group. Similarly, where higher scores indicated poorer performance (in this
case, decrease from baseline to final visit) outcomes were dichotomized at the 75th
percentiles to identify change in performance in a negative direction relative to the
comparison group (Table 4.26 in previous chapter, Baseline Study Results and
257

Discussion, pages 37 - 38). A positive direction in any Odds Ratios therefore reflects an
adverse effect of exposure on change in neurobehavioural performance.
5.5.1 The relationship between dichotomised outcomes and OP applicator status
Tables 5.17 to 5.26 present the multivariate logistic regression results for the change in
neurobehavioural performance during the cohort period in the relationship between
dichotomised outcomes and four metrics for OP exposure: (i) OP applicator status, (ii)
cumulative OP exposure measured as AllOPjemdays during the cohort follow up period,
(iii) recent diagnosed poisoning and (iv) cumulative OP exposure adjusted for recent
poisoning.
Analyses were also conducted for other variables measuring cumulative exposure during
the cohort follow up period, including unweighted total OP exposure days (total
AllOPdys) and total OP exposure days weighted for job activity (AllOPjemdys). The
multivariate analysis results were broadly similar as found for cumulative OP exposure
measured as AllOPjemdays and only these latter results are presented here. Associations
between all outcome scores and the exposure variables AllOPdys are listed in Appendix
J.
Over the one year period, crude and adjusted logistic regression results showed that OP
applicators were more likely to decline in their performance than non-OP applicators on
the Digit Span WAIS, Santa Ana Pegboard non-dominant hand and the Q16 tests (Table
5.17). However, these differences were not statistically significant. The associations
between being an OP applicator and other outcomes were negative in that the
performance of applicators improved relative to non-applicators – but none were
statistically significant changes. Covariates that remained significant at the p<0.05 level
were previous head injuries (in the model for Digit Span Forward), age (in the model for
Pursuit Aiming) and schooling (in the model for the Q16).
258

Table 5.17 Crude and adjusted logistic regression results for neurobehavioural outcome-exposure relationships: (33 OP applicators and
249 non-applicators) (N=273)
Exposure variable -
OP applicator/non-OP
applicator (AllOPappl)
Crude associations
Adjusted associations
Significant covariates in the model
Dichotomous outcomes N OR 95% CI p-value OR 95% CI p-value Covariates OR (95% CI)
Digit Span Forward 273 0.62 0.24 – 1.58 0.32 0.58 0.22 – 1.53 0.27 Prev. head injury 2.31; 1.00 – 5.32
Digit Span Backward 258 0.63 0.23 – 1.72 0.37 0.69 0.24 – 1.96 0.48 None
Digit Span WAIS 273 1.16 0.49 – 2.74 0.74 1.17 0.48–2.86 0.73 None
Digit Symbol WAIS 257 0.77 0.34 – 1.72 0.52 0.83 0.33 – 1.96 0.67 None
Benton VRT 273 0.67 0.26 – 1.71 0.40 0.72 0.27 – 1.91 0.51 None
Santa Ana dom. hand 272 0.32 0.09 – 1.08 0.07 0.30 0.09 – 1.07 0.06 None
Santa Ana non-dom. hand 272 1.33 0.58 – 3.06 0.50 1.31 0.54 – 3.16 0.55 None
Pursuit Aiming 252 0.84 0.32 – 2.19 0.73 0.64 0.24 – 1.76 0.39 Low age 0.35; 0.17 – 0.72
BSI/GSI 272 0.71 0.28– 1.82 0.48 0.63 0.24 – 1.66 0.35 None
Swedish Q16 214 1.64 0.62 – 4.34 0.32 1.51 0.50 – 4.60 0.47 Low schooling 0.43; 0.20 – 0.92
Vibration Sense Test 270 0.43 0.15 – 1.29 0.13 0.44 0.14 – 1.34 0.15 None
259

5.5.2 The relationship between dichotomised outcomes and AllOPjemdays:
crude and adjusted associations
To detect a dose-response, cumulative AllOPjemdays were categorised across the median
(OPjmdys_1, OPjmdys_2), and the two dose groups compared to farmers who did not
apply OP’s in multivariate modeling. Crude associations between dichotomised
outcomes and cumulative AllOPjemdays showed that there were three positive
associations between decline in neurobehavioural performance and cumulative OP
exposure for AllOPjemdays below and up to the median (OPjmdys_1) (for the Santa Ana
non-dominant hand, Pursuit Aiming and the Q16) and two positive associations between
decline in neurobehavioural performance and cumulative OP exposure for AllOPjemdays
above the median (OPjmdys_2) (Digit Span Standardised Score and the Q16). However,
none of these associations were significant at the p<0.05 level.
While the associations were not significant, in the crude associations high exposure
participants had an almost two-fold risk of showing a decline in the Q16 (OR= 1.80; 95%
CI 0.41 to 7.83) and were also almost twice as likely to show a decline on Pursuit
Aiming (OR=1.96; 95% CI 0.67 to 5.76) compared to those with less OP exposure.There
was no evidence of dose response relationship between the levels of exposure (Table
5.18).
The majority of performance changes, however, were in the negative direction, with test
score declines being inversely associated with cumulative exposure, whether categories
below the median or categorised above the median. None of these inverse relationships
were statistically significant.
Sensitivity analysis was conducted for the number of participants who did not remember
or did not know the names of pesticides they had applied. Including and excluding the
number of participants (n=6) from the regression models did not make a meaningful
difference to the findings.
Adjusted logistic regression models in multivariate analysis showed similar results
between cumulative OP exposure and neurobehavioural performance to the crude
analyses, with no significant associations at the p<0.05 level. The covariates age,
schooling and previous head injury were significant predictors of Digit Span Forward
260

Table 5.18 Adjusted logistic regression results for dichotomous neurobehavioural outcome-exposure relationships: Total OP exposure
days weighted by activity (AllOPjemdays) (N=273)
Exposure variable -
AllOPJemdays Crude associations Adjusted associations
Significant covariates
in the model
Dichotomous outcomes N OR 95% CI p-
value
N OR 95% CI p-value Covariate OR (95% CI)
Digit Span Forward
Referent group§ 239 1.00 (ref. group) - 239 1.00 (ref. group) -
OPjmdys_1 16 0.81 0.25 – 2.58 0.72 16 0.69 0.21 – 2.28 0.54 Low age 0.50; 0.26– 0.96
OPjmdys_2 14 0.40 0.09 – 1.85 0.24 14 0.42 0.09 – 1.96 0.27 Prev. head injury 2.38; 1.02– 5.57
Digit Span Backward
Referent group 225 1.00 (ref. group) - 225 1.00 (ref. group) - OPjmdys_1 15 0.45 0.10 – 2.07 0.31 15 0.47 0.10 – 2.24 0.34 None
OPjmdys_2 14 0.80 0.22 – 2.98 0.74 14 0.92 0.24 – 3.57 0.90
Digit Span WAIS
Referent group 239 1.00 (ref. group) - 239 1.00 (ref. group) -
OPjmdys_1 16 0.72 0.20 – 2.62 0.62 16 0.70 0.19 – 2.59 0.59 None
OPjmdys_2 14 1.73 0.56 – 5.40 0.34 14 1.88 0.58 – 6.07 0.29
Digit Symbol WAIS
Referent group 225 1.00 (ref. group) - 225 1.00 (ref. group) -
OPjmdys_1 15 0.72 0.25 – 2.10 0.55 15 0.77 0.25 – 2.36 0.65 None
OPjmdys_2 13 0.77 0.24 – 2.43 0.65 13 0.82 0.25 – 2.77 0.76
Benton VRT
Referent group 239 1.00 (ref. group) - 239 1.00 (ref. group) -
OPjmdys_1 16 0.87 0.27 – 2.81 0.82 16 0.91 0.28 – 3.04 0.88 None
OPjmdys_2 14 0.44 0.10 – 2.01 0.29 14 0.49 0.10 – 2.31 0.36
261

§The referent group has zero number of exposure days
‡Indeterminate since none of the participants for this corresponding outcome quartile had values within this exposure band
Exposure variable -
AllOPJemdays
Crude associations Adjusted associations Significant covariates
in the model
Dichotomous outcomes N OR 95% CI p-value N OR 95% CI p-value Covariate OR (95% CI)
Santa Ana dom. hand
Referent group§ 239 1.00 (ref. group) - 239 1.00 (ref. group) -
OPjmdys_1 16 0.18 0.02 – 1.38 0.10 16 0.18 0.02 – 1.39 0.10 None
OPjmdys_2 13 0.49 0.11 – 2.26 0.36 13 0.45 0.09 – 2.16 0.32
Santa Ana non-d. hand
Referent group§ 238 1.00 (ref. group) 238 1.00 (ref. group)
OPjmdys_1 16 1.82 0.63 – 5.22 0.27 16 1.72 0.58 – 5.15 0.33 None
OPjmdys_2 14 0.83 0.22 – 3.07 0.78 14 0.85 0.22 – 3.31 0.82
Pursuit Aiming
Referent group§ 221 1.00 (ref. group) - 221 1.00 (ref. group)
OPjmdys_1 15 1.96 0.67 – 5.76 0.22 15 1.63 0.53 – 4.98 0.39 Low age 0.36; 0.17 – 0.76
OPjmdys_2 0 ‡ ‡ ‡ 0 ‡ ‡ ‡
BSI/GSI
Referent group§ 238 1.00 (ref. group) - 238 1.00 (ref. group) -
OPjmdys_1 16 0.64 0.18 – 2.32 0.50 16 0.59 0.16 – 2.19 0.43 None
OPjmdys_2 14 0.76 0.21 – 2.80 0.68 14 0.64 0.17 – 2.45 0.51
Swedish Q16
Referent group§ 184 1.00 (ref. group) - 184 1.00 (ref. group) -
OPjmdys_1 8 1.80 0.41 – 7.83 0.43 8 1.53 0.33 – 7.20 0.59 Low schooling 0.43; 0.20 – 0.93
OPjmdys_2 10 1.29 0.32 – 5.18 0.72 10 1.48 0.34 – 6.51 0.60
Vibration Sense Test
Referent group§ 237 1.00 (ref. group) - 237 1.00 (ref. group) -
OPjmdys_1 15 0.66 0.18 – 2.42 0.53 15 0.64 0.17 – 2.44 0.52 None
OPjmdys_2 14 0.20 0.03 – 1.59 0.13 14 0.22 0.03 – 1.75 0.15
262

(age, previous head injury), Pursuit Aiming (age) and the Q16 (schooling). The
performance of older participants was significantly more likely to show a decline over
time on Digit Span Forward and Pursuit Aiming. Those with previous head injuries were
also significantly more likely to evidence a decline in performance over time on the Digit
Span Forward. Level of schooling also significantly predicted performance on the Q16
with lower education associated with less decline in Q16 scores.
5.5.3 The relationship between dichotomised outcomes and recent poisoning: crude
and adjusted associations
The relationship between dichotomous neurobehavioural outcomes and diagnosed recent
(reported during the cohort study period) poisoning is shown in Table 5.19. Of the eleven
outcomes, seven showed a positive association with diagnosed recent poisoning. Crude
associations showed a significant decline in the performance of participants with
diagnosed recent poisoning on Digit Span Forward over time (OR= 2.75; 95% CI 1.12 to
6.76). In the adjusted logistic regression models, the association of diagnosed recent
poisoning with Digit Span Forward remained significant (OR = 2.67; 95% CI 1.05 to
6.80). Covariates that significantly predicted performance on neurobehavioural outcomes
when modelling recent poisoning included age (Pursuit Aiming) and schooling (Q16).
Older participants showed a significant decline on Pursuit Aiming compared to younger
participants while those with higher schooling reported fewer symptoms on the Q16 than
those with low schooling levels.
Recent poisoning is included into the regression model with cumulative OP exposure
above and below the median in Table 5.20. The results show a positive significant
association between cumulative OP exposure and change in performance on the Digit
Span WAIS (OR= 3.95; 95%CI 1.03 to 15.08) indicating that those with the most
cumulative OP exposure were almost 4 times more likely to show a decline in the Digit
Span WAIS score. There was also a significant decline in the Digit Span Forward over
time (OR=2.64; 95% CI 1.04 to 6.74). Results also showed positive but non-significant
Odds Ratios for Digit Span Backward (OR= 1.45; 95% CI 0.33 to 6.33); Santa Ana non-
dominant hand (OR= 0.85; 95% CI 0.22 to 3.31), Pursuit Aiming (OR= 2.99; 95% CI
0.84 to 10.63) and the Q16 (OR=2.89; 95% CI 0.54 to 15.45). Age and gender were
263

significant predictors for performance on the Digit Symbol, Pursuit Aiming and Digit
Span WAIS.
5.6 DISCUSSION
Results from the baseline study showed modest to weak evidence of an effect of long-
term cumulative exposure on neurobehavioural performance of emerging farmers
(Chapter 4).Vibration sense was the only outcome in the baseline study that was
significantly associated with cumulative OP exposure in the crude as well as adjusted
regression models. Participants with cumulative OP exposure in the third quartile in the
baseline study had a three-fold risk (OR=3.08; 95% CI 1.05 to 9.07) of evidencing
decreased vibration sense.
In the cohort study, however, which reflects the change in neurobehavioural performance
between the baseline and final follow-up study conducted over 12 months between 2009
and 2010, there was no evidence of performance decline in those with higher levels of
cumulative OP exposure during the 12 month follow-up. Including recent poisoning into
the regression model with cumulative OP exposure above the median (Table 5. 20)
resulted in a striking change from non-significant Odds Ratio for a few outcomes to a
positive (and in some instances, a significant) Odds Ratio between change in
performance over time and cumulative OP exposure. For example, the association
between cumulative OP exposure and change in performance on the Digit Span WAIS
changed from a non-significant association (OR= 1.88; 95% CI 0.58 to 6.07) (Table
5.24) to a significant Odds Ratio (OR= 3.95; 95% CI 1.03 to 15.08) indicating that those
with the most cumulative OP exposure were almost 4 times more likely to show a decline
in the Digit Span WAIS score. Farmers who sustained a poisoning in the course of the
year were more than twice as likely to evidence a decline in Digit Span Forward
(OR=2.64; 95% CI 1.04 to 6.74) by the end of the year and a trend toward a dose-
response was evident in the results for Digit Span, Digit Symbol and Santa Ana dominant
hand.
264

Table 5.19 Adjusted logistic regression results for dichotomous neurobehavioural outcome-exposure relationships using recent diagnosed
poisoning as an exposure variable (N=201)
*Units are log transformed
Exposure variable -
Recent poisoning Crude associations Adjusted associations
Significant covariates in the
model
Dichotomous
outcomes
N OR 95% CI p-value N OR 95% CI p-value Covariates OR (95% CI)
Digit Span Forward 171 2.75 1.12 – 6.76 0.03 171 2.67 1.05 – 6.80 0.04 None
Digit Span Backward* 165 1.40 0.50 – 3.90 0.52 165 1.47 0.50 – 4.34 0.49 None
Digit Span WAIS* 171 1.859 0.73 – 4.76 0.20 171 1.77 0.67 – 4.67 0.25 None
Digit Symbol WAIS 162 1.33 0.49– 3.65 0.58 162 1.47 0.49 – 4.38 0.49 None
Benton VRT 171 0.41 0.11 – 1.44 0.16 171 0.42 0.12 – 1.52 0.19 None
Santa Ana d. hand 170 1.22 0.45 – 3.34 0.70 170 1.31 0.46 –3.76 0.61 None
Santa Ana non-d. hand 170 1.17 0.43 – 3.21 0.76 170 0.97 0.33–2.82 0.95 None
Pursuit Aiming 160 2.29 0.91 – 5.81 0.08 160 2.19 0.82 –5.88 0.12 Low Age 0.39; 0.16–0.98
BSI/GSI 170 0.74 0.26 – 2.16 0.58 170 0.73 0.25 –2.16 0.58 None
Swedish Q16* 128 0.74 0.20 – 2.77 0.65 128 0.64 0.15–2.70 0.55 Low
Schooling
0.36;0.13–0.96
Vibration Sense Test* 170 1.91 0.26 – 2.14 0.58 170 1.83 0.71 – 4.73 0.22 None
265

Table 5.20 Adjusted logistic regression results for dichotomous neurobehavioural outcome-exposure relationships: chronic cumulative
OP exposure days weighted by activity (AllOPjemdays) adjusted for acute recent poisoning
Exposure variable -
AllOPJemdays* Crude associations Adjusted associations
Significant covariates
in the model
Dichotomous outcomes N OR 95% CI p-value OR 95% CI p-value Covariate OR (95% CI)
Digit Span Forward
Referent group§ 117 1.00 (ref. group) - 1.00 (ref. group) -
OPjmdys_1 16 0.99 0.28 – 3.49 0.98 0.85 0.23-3.21 0.81 None
OPjmdys_2 14 0.57 0.12 – 2.78 0.49 0.52 0.10-2.75 0.44
Referent group§§
148 1.00 (ref. group) - 1.00 (ref. group) -
Recent Poisoning** 23 2.70 1.09 – 6.67 0.03 2.64 1.04-6.74 0.04
Digit Span Backward
Referent group§ 114 1.00 (ref. group) - 1.00 (ref. group) -
OPjmdys_1 15 0.25 0.03 – 1.98 0.19 0.30 0.04 – 2.55 0.27 None
OPjmdys_2 14 1.19 0.30 – 4.74 0.81 1.45 0.33 – 6.33 0.62
Referent group§§
144 1.00 (ref. group) - 1.00 (ref. group) -
Recent Poisoning 21 1.51 0.53 – 4.28 0.44 1.49 0.50 – 4.47 0.48
Digit Span WAIS
Referent group§ 117 1.00 (ref. group) - 1.00 (ref. group) -
OPjmdys_1 16 0.96 0.24 – 3.73 0.68 1.15 0.28 – 4.73 0.85 Gender 0.417; 0.176-0.988
OPjmdys_2 14 2.97 0.84 – 10.42 0.09 3.95 1.03 – 15.08 0.05
Referent group§§
148 1.00 (ref. group) - 1.00 (ref. group) -
Recent Poisoning 23 1.93 0.74 – 5.00 0.22 1.83 0.68 – 4.92 0.23
Digit Symbol WAIS
Referent group§ 112 1.00 (ref. group) - 1.00 (ref. group) -
OPjmdys_1 15 0.75 0.23 – 2.44 0.63 0.75 0.20 – 2.76 0.66 Low Age 0.427; 0.184-0.990
OPjmdys_2 13 0.73 0.20 – 2.72 0.64 0.77 0.18 – 3.30 0.73
Referent group§§
141 1.00 (ref. group) - 1.00 (ref. group) -
Recent Poisoning 21 1.33 0.48 – 3.659 0.59 1.47 0.49 – 4.41 0.50
266

Benton VRT
Referent group§ 117 1.00 (ref. group) - 1.00 (ref. group) -
OPjmdys_1 16 0.53 0.11 – 2.54 0.65 0.53 0.11 – 2.62 0.44 None
OPjmdys_2 14 0.59 0.12 – 2.87 0.54 0.56 0.11 – 2.87 0.48
Referent group§§
148 1.00 (ref. group) - 1.00 (ref. group) -
Recent Poisoning 23 0.41 0.12 – 1.46 0.22 0.43 0.12 – 1.53 0.19
Santa Ana dom. Hand
Referent group§ 117 1.00 (ref. group) - 1.00 (ref. group) -
OPjmdys_1 16 0.24 0.030 – 1.91 0.18 0.22 0.03 – 1.83 0.16 None
OPjmdys_2 13 0.33 0.040 – 2.69 0.30 0.24 0.03 – 2.10 0.20
Referent group§§
147 1.00 (ref. group) - 1.00 (ref. group) -
Recent Poisoning 23 1.28 0.458 – 3.55 0.64 1.35 0.46 – 3.96 0.58
Santa Ana non-d. Hand
Referent group§ 116 1.00 (ref. group) - 1.00 (ref. group) -
OPjmdys_1 16 1.49 0.43 – 5.17 0.53 1.50 0.39 – 5.87 0.56 None
OPjmdys_2 14 1.28 0.32 – 5.10 0.73 1.84 0.41 – 8.21 0.43
Referent group§§
147 1.00 (ref. group) - 1.00 (ref. group) -
Recent Poisoning 23 1.14 0.41 – 3.14 0.80 0.97 0.33 – 2.83 0.95
Pursuit Aiming
Referent group§ 99 1.00 (ref. group) - 1.00 (ref. group) -
OPjmdys_1 15 2.54 0.78 – 8.21 0.12 2.99 0.84 – 10.63 0.10 Low Age 0.350; 0.130 - 0.941
OPjmdys_2 12 - ≠ - ≠ -
Referent group§§
137 1.00 (ref. group) - 1.00 (ref. group) -
Recent Poisoning 23 2.15 0.83 – 5.58 0.12 2.05 0.74 – 5.66 0.17
BSI/GSI
Referent group§ 116 1.00 (ref. group) - 1.00 (ref. group) -
OPjmdys_1 16 0.49 0.10 – 2.31 0.37 0.41 0.08 – 2.01 0.27 None
OPjmdys_2 14 0.97 0.25 – 3.86 0.66 0.78 0.18 – 3.32 0.73
Referent group§§
147 1.00 (ref. group) - 1.00 (ref. group) -
267
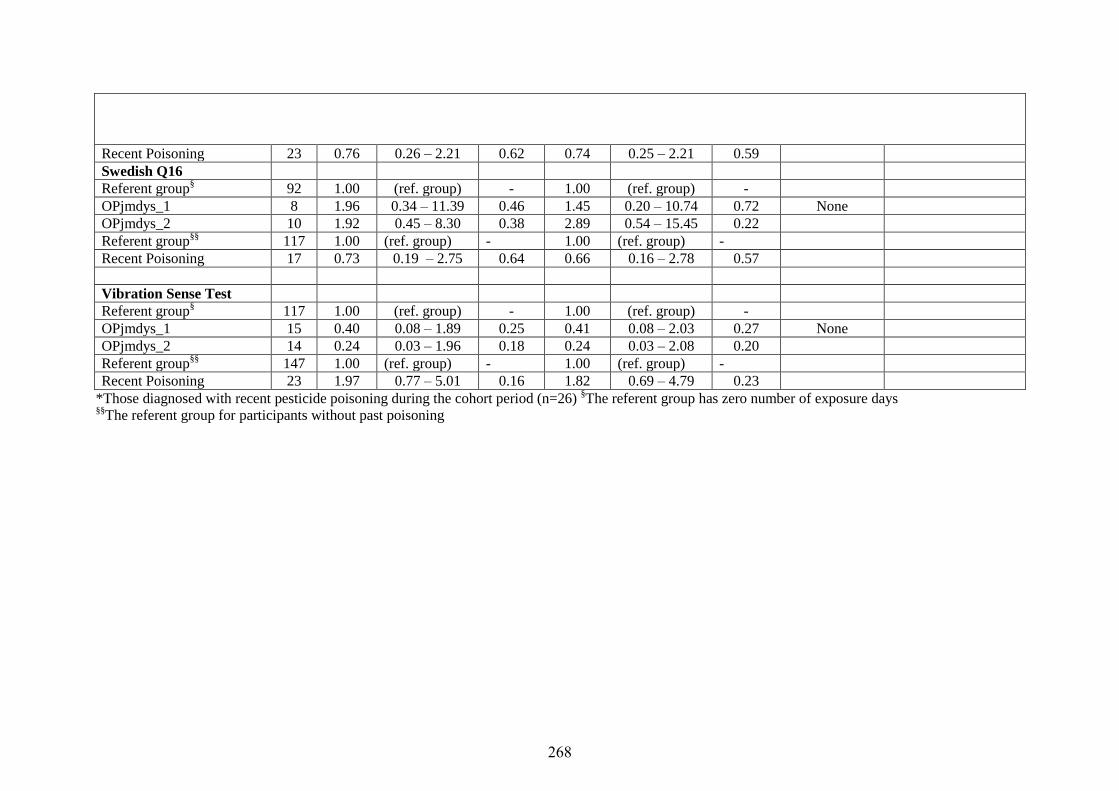
*Those diagnosed with recent pesticide poisoning during the cohort period (n=26) §The referent group has zero number of exposure days
§§The referent group for participants without past poisoning
Recent Poisoning 23 0.76 0.26 – 2.21 0.62 0.74 0.25 – 2.21 0.59
Swedish Q16
Referent group§ 92 1.00 (ref. group) - 1.00 (ref. group) -
OPjmdys_1 8 1.96 0.34 – 11.39 0.46 1.45 0.20 – 10.74 0.72 None
OPjmdys_2 10 1.92 0.45 – 8.30 0.38 2.89 0.54 – 15.45 0.22
Referent group§§
117 1.00 (ref. group) - 1.00 (ref. group) -
Recent Poisoning 17 0.73 0.19 – 2.75 0.64 0.66 0.16 – 2.78 0.57
Vibration Sense Test
Referent group§ 117 1.00 (ref. group) - 1.00 (ref. group) -
OPjmdys_1 15 0.40 0.08 – 1.89 0.25 0.41 0.08 – 2.03 0.27 None
OPjmdys_2 14 0.24 0.03 – 1.96 0.18 0.24 0.03 – 2.08 0.20
Referent group§§
147 1.00 (ref. group) - 1.00 (ref. group) -
Recent Poisoning 23 1.97 0.77 – 5.01 0.16 1.82 0.69 – 4.79 0.23
268

The effects of cumulative OP exposure on neurobehavioural outcomes taking
pesticide poisoning into account showed changes from negative Odds Ratios for
Digit Span Backward, Santa Ana non-dominant hand and the Q16. While it is
possible that that the few positive findings in this study could be chance results due
to multiple testing, there is a discernible difference in the evidence once acute
poisoning is accounted for in the multivariate analysis.
Bivariate analysis showed that acute poisoning was associated with global decline in
neurobehavioural performance except for performance on the Q16 and the BSI
(Table 5.14). Furthermore, the adjusted logistic regression analysis the results
showed that participants with diagnosed recent poisoning were more than twice as
likely (OR=2.67; 95% CI 1.05 to 6.80) to show a borderline decline over time in
performance on a test of attention (Digit Span Forward). This could result in negative
consequences for the health and safety practices of such poisoned participants.
Indeed, pesticide poisoning has been linked to a reduction in safety behaviours
through depressive symptoms reported to have been induced by pesticide exposure
(Beseler & Stallones, 2013). Digit Span Forward and Backward tests of attention and
working memory have been included in most of the studies investigating the
neurobehavioural effects of long-term OP pesticide exposure because it is regarded
as sensitive to neurotoxic effects of chemicals (see Table 2.3, page 41, Chapter 2).
Previous studies that reported significant findings for deficits in Digit Span following
OP poisoning included studies among 36 farm workers in a cross-sectional study
(Rosenstock et al., 1991) and 100 US pesticide poisoned cases in a cohort study
(Savage et al., 1988).The farm workers in Rosenstock et al., (1991) were tested 2
years after poisoning and showed significant deficits in the Digit Span. Savage et al.,
(1988) tested their participants 10 years after poisoning and also reported significant
differences between poisoned and control groups supporting current evidence for the
long-term chronic effects of acute OP pesticide poisoning.
Besides a significant difference between recently poisoned and non-poisoned
participants on the Digit Span test, there were non-significant effects evident,
suggesting decline in performance in poisoned farmers for 6 of the battery outcomes
when using recent poisoning as an exposure variable. These associations ranged from
269

a marginal risk (OR= 1.31; 95% CI 0.46to 3.76) for Santa Ana dominant hand, to
being twice as likely (OR= 2.19; 95% CI 0.82 to 5.88) to show a decline in
performance on Pursuit Aiming. (Participants with recent poisoning also performed
worse than non-poisoned participants on the neuropsychiatric subjective mood
symptom test (Q16). It is likely that a lack of study power because of missing data
(37% of respondents did not answer questions on past poisoning) played a role in the
finding of increased Odds Ratios that were non-significant. Had full data been
available, it is possible more of these associations would have been statistically
significant.
The study by Baldi et al., (2011) is the only other prospective cohort that reported a
significant decline in cognitive function for directly exposed French farm workers
(OR= 5.84) followed up four years later, specifically on the Benton Visual Retention
test. However, there are no other cohort studies that have reported a positive
association between long-term OP pesticide exposure and change in performance on
Digit Span. However, the results from this study are compatible with results from
other cross-sectional studies that show a positive association between an acute past
poisoning episode and chronic decrements in neurobehavioural performance
including Digit Span (Rosenstock et al., 1991; Savage et al., 1988).
Cohort studies may generally require a longer period of study to detect significant
associations between pesticide exposure and neurobehavioural impairment. The
present study followed participants over 12 months which may have proved too short
a follow-up period for detecting the effects of long-term low-level OP exposure on
these emerging farmers. There are many OP pesticides and the mechanism that
produces effects for chronic exposure is as yet unknown and may not be related to
cholinesterase inhibition or the mechanisms for high concentration acute exposure
effects. A follow-up period of between 2 to 4 years could yield different results. The
duration of follow-up in published cohort studies varies widely. There are cohort
studies conducted over relatively short periods such as between 3 to 9 months (Salvie
et al., 2003; Stokes et al., 1995; Bazylewicz-Walckzak et al., 1999; Daniell et al.,
1992), others over a period of 12 months (Albers et al., 2004) and in some studies
270

participants were followed up between 2 and 7 years (Baldi et al., 2011; Blanc-
Lapierre et al., 2013; Beseler & Stallones, 2008; Cherry et al., 2012; Delgado et al.,
2004; Horowitz et al., 1999; Kamel et al., 2005; Proctor et al., 2006). There appears
to be no relationship in the published literature between duration of follow-up and
the identification or strength of associations between long-term OP exposure and
neurobehavioural deficits.
Another factor explaining the mainly null results may relate to the fact that there
were only 33 OP applicators who reported OP applications during the cohort period
which may have limited the power of the study and made it difficult to detect
significant results. The mean number of days for OP application across the cohort
period was 20.5 days ranging from a portion of an 8 hour day (0.1) to a maximum of
85 days over 12 months. Sample size calculations using means and variances from
studies with similar agricultural populations (see Chapter 3, page 43-44) suggested a
sample of between 160 and 350 would have been adequate to identify differences in
neurobehavioural performance between applicators and non-applicators. In addition,
it was assumed that the initial number of OP applicators at baseline (n=70 would
continue to apply OP pesticides during the course of the cohort and higher exposure
was anticipated in the course of the follow-up. The far smaller number of applicators
who applied OP’s in practice is another factor in reducing study power, and may
account for the absence of any associations other than with the Digit Span test.
It is possible that selection bias could have influenced the outcome of this study
since, for example; farmers may have become aware of the health effects of pesticide
exposure over the last decade with the introduction of GlobalGAP policies
monitoring good agricultural practices including the socio-political conditions of
farm workers (Schreinemachers et al., 2012). For this reason, farmers using
pesticides more intensively and who are more highly exposed may have been
reluctant to participate in this study. Selection bias could have arisen given the
response rate of farmer projects where only 21 (61%) out of a possible 34 projects
agreed to participate in the research. It is also possible that since many of the
participants were emerging farmers, they may have had limited exposure to OP’s
because of the prohibitive costs of these agents to small farmers. This may have
271

compounded the problem of a lack of statistical power in that the degree of exposure
was too low to make it possible to detect clear exposure-outcome associations.
Some studies have used biomarkers such as urinary OP metabolites and blood
cholinesterase activity (or ChE level) to measure internal dose and to assess the
correlation between OP exposure and neurobehavioural performance. While many
studies have reported lower cholinesterase levels in exposed compared to unexposed
control groups (Cole et al., 1997, Gomes et al.,1998; Farahat et al., 2003; Kamel et
al., 2003; London et al., 1997; Rohlman et al., 2007; Rothlein et al., 2006) not many
have drawn positive correlations between cholinesterase depression and
neurobehavioural deficits. Farahat et al., (2010) was an exception who found that
pesticide applicators had significantly higher OP exposure than engineers and
technicians. The study also drew correlations between high OP exposure evidenced
in pesticide applicators and the significant neurobehavioural deficits reported in their
previous study (Farahat et al., 2003). The present study could also have been
strengthened with the results of urinary biomarkers. Biological markers (urine,
venous blood, plasma cholinesterase) of recent occupational OP exposure were
collected on the same day as the farmer questionnaire and neurobehavioural tests
were administered and at the subsequent quarterly follow-up visits (F1, F2 & F3).
The study had planned to estimate exposure using a composite of urinary metabolite
data collected at every visit as well as exposure data from the quarterly audits which
would have provided a strong estimation of on-going exposure. However, the
laboratory engaged to analyse the specimens failed to provide results after three
years hence this study does not have data to provide biomarker based exposure
assessment.
Farmers and farm workers are exposed to many different OP pesticides and it is
possible that combinations and mixtures of different pesticides may obscure the
synergistic effects of certain OP pesticides (Blanc-Lapierre et al., 2013) and dose-
response relationships may not be difficult to determine (Mackenzie Ross et al.,
2012). While it may be a challenge for future studies to disentangle the effects of
specific pesticides, recent studies have begun to investigate the effects of certain
types of OP pesticides. For example, Blanc-Lapierre et al., (2013) specifically
272

investigated the effects of 11 OP pesticides on cognitive performance and found a
significant association between the OP insecticide Mevinphos and significantly
poorer performance on the Benton Visual Retention test (a visual memory test) (OR=
3.26;95% CI: 1.54 to 6.88). Furthermore, individuals vary genetically and may
detoxify and metabolize chemicals differently resulting in some individuals being
more susceptible to OP pesticides than others (Mackenzie Ross et al., 2012). While it
is also possible that applicators could have handled pesticide combinations or
mixtures of non-OP pesticides, the present study collected detailed data on individual
pesticides used in the course of the year and analysed the relationship between all
pesticides and neurobehavioural performance which therefore minimises the
possibility of misclassification.
Current alcohol use was non-significantly protective of change in performance on the
BSI and the Q16 when using OP applicator status (AllOPappl) and unweighted OP
exposure (AllOPdys) in alternate regression models with outcomes. Participants with
current alcohol had an almost twelve-fold risk of evidencing a decline in change in
performance on Pursuit Aiming over time in the regression model with unweighted
total OP pesticide exposure (AllOPdys) (OR=11.81; 95% CI 1.23 to 113.30)
(Appendix I). With unweighted all pesticides (Allpestdys) in the regression model,
current alcohol use significantly predicted an almost four-fold decline in change in
performance on Santa Ana dominant hand (OR=3.94; 95% CI 1.41 to 11.03)
(Appendix I). There were non-significant positive associations between those
participants with current alcohol consumption and a decline in neurobehavioural
performance over time on Digit Span Forward, Benton Visual Retention, Santa Ana
dominant hand, vibration sense and the GSI in the logistic regression model with
exposure to all pesticides (Allpestdys).
It is also possible that applicators were more likely to wear suitable personal
protective clothing (PPE) and so have lower risk. Information was collected from
participants on the use of personal protective equipment (PPE). However, the quality
and completeness of the information on PPE use was poor and could not be used in
the analysis. Nonetheless, PPE data that was collected showed that not all applicators
used gloves, overalls and boots; and use of respirators was infrequent for example,
273

only 84 (64%) participants reported using gloves, 104 (78%) reported wearing boots,
101 (76%) wore overalls and 76 (56%) used a mask with a filter when applying
pesticides. Notably, Farahat et al. (2010), in a study of applicators, technicians and
engineers working in Egyptian cotton production found that more highly exposed
farmers who made use of PPE had lower risk of dermal OP exposure through contact
with treated foliage than low exposed controls.
High current alcohol consumption in the study (63%) could also mask exposure-
effect relationships especially if these effects are modest. This was a possible
explanation for the small associations between long-term OP exposure and
neurobehavioural performance reported in London et al., (1997) who reported very
high alcohol consumption levels. This study stratified for current alcohol use by
running the regression models alternately with only those participants who reported
being current alcohol users and those who reported no current alcohol use in logistic
regression models with outcomes and each of the exposure variables. While there
were positive results between OP applicator status and current alcohol use for Digit
Span Backward, Digit Span WAIS and the Q16, the associations were not
significant. For example the negative Odds Ratio for Digit Span Backwards
(OR=0.28; 95% CI 0.03 to 2.50) without current alcohol use changed to a marginally
positive Odds Ratio (OR=1.07; 95% CI 0.03 to 3.79) for participants who reported
current alcohol use. What is interesting is the possibly protective effect of current
alcohol use on change in performance on the BSI, Q16 and the Benton Visual
Retention test. For the Global Severity Index of the BSI, the negative Odds Ratio for
those participants not currently consuming alcohol (OR=0.39; 95% CI 0.10 to 1.46)
became positive but non-significantly so (OR=1.35; 95% CI 0.28 to 6,44), this
pattern was similar for the Q16 where a negative Odds Ratio for participants not
currently consuming alcohol (OR=0.50; 95% CI 0.09 to 2.89) became positive but
not significant (OR=5.25; 95% CI 0.73 to 37.85). This study also found that current
alcohol use was protective of change in performance over time on Benton Visual
Retention (OR=6.10; 95% CI 1.22 to 30.55) which is similar to the findings of Baldi
et al., (2001) who reported a protective effect for moderate alcohol consumption on
the Benton Visual Retention test, (Appendix I).
274

Strengths and limitations of the study
A strength of the study lies in the fact that this is a longitudinal cohort study where
more than 85% of the participants (n=277) remained in the cohort over 12 months.
The high retention rate at every follow-up visit established good internal validity for
study comparisons between those who remained in the cohort and those who were
lost to follow-up.
The profile of those who remained in the cohort was not very different from those
who left the cohort for example, Table 5.2 on page 6 shows that the only significant
differences were between Afrikaans-speaking and non-Afrikaans speaking
participants and between current alcohol consumers. Firstly, the farmers in the
Western Cape are predominantly Afrikaans-speaking and high alcohol consumption
has been reported for farm workers (who may now comprise emerging farmers) in
this province (London et al., 1997; Major, 2010). There were also no significant
differences in neurobehavioural performance at baseline between those who
remained in the cohort and those who were lost to follow-up (Table 5.8, page 14). In
total, the study maintained participation by 85% of those who started at baseline.
Broadly speaking, loss to follow-up was quite low in this study and unlikely to
impact in a major way on the findings.
Another strength of the study was the prospective design which allowed for an
investigation of study participants’ change in neurobehavioural function at two
different points and documenting on-going OP pesticide exposure with improved
accuracy over an extended time frame of a year and thus has enabled determination
of temporality of exposure-effect relationships. Acute and long-term exposure
metrics included in the study enabled an assessment of the impact of acute poisoning
effects as well as long-term exposure which has been a significant omission in
previous studies. Also, the exposure-effect analyses for cumulative exposure
controlled for acute poisoning by including acute poisoning as a variable in the
model which is a strength of the study. This is the first prospective cohort study
conducted among emerging farmers exposed to OP pesticides that investigated the
effects of cumulative OP pesticide exposure and diagnosed past poisoning on
neurobehavioural function in sub-Saharan Africa.
275

Many of the emerging farmers in this study had worked as farm workers on existing
farms before and recall bias is a possibility since literacy levels are generally low
among farm worker populations in this and other developing countries and thus may
have forgotten the names of the pesticides applied. However, we used sensitivity
analyses to assess recall bias by including and excluding cases in the regression
models where farmers did not remember names of pesticides applied. This was done
for all classes of pesticides including OP pesticides. In addition, exposure data was
carefully collected in all the follow-up visits using a checklist every 3 to 4 months
over a total of 12 months. This study design with prospective exposure
characterization utilizes more accurate metrics that is less vulnerable to recall bias.
During these follow-up visits researchers took care to ensure that pesticides names
provided by farmers were recorded accurately. Few spray managers were willing to
provide copies of spray schedules (logs), while the majority of spray managers were
reluctant to provide such copies. However they were willing to verify pesticide
names where farmers were unable to recall names of pesticides.
Covariates that are known to influence neurobehavioural test performance such as
age, education (schooling), gender, language, alcohol consumption, head injury, low
socio-economic status and psychiatric illness were controlled for in this study
through the use of statistical adjustment procedures. Furthermore, the consistently
positive associations between the covariates age, schooling, current alcohol use, head
injury and neurobehavioural performance in the expected direction is a strength of
the study. For example, age and schooling were significant predictors of the change
in performance on the Digit Span Forward, Pursuit Aiming and Q16 tests. Previous
South African studies with paint factory workers (Colvin, Myers, Nell, Rees, &
Cronje, 1993; Myers et al., 1999) and deciduous fruit farm workers (London et al.,
1997) also reported significant associations between Pursuit Aiming and age and
schooling.
There were a number of limitations in the study. One potential limitation includes
the Healthy Worker Effect (HWE) in that farmers with poor health may have left
work during the cohort study resulting in healthier emerging farmers remaining in
the cohort. There was some evidence for this in the study – those who were lost to
276

follow-up (n=46) had significantly higher scores on the Global Severity Index of the
BSI than the mean score of those who remained in the cohort, suggesting that those
with higher levels of ill-health leave the workplace. Further a total of 6 participants
died in the three agricultural districts over the course of the study period; however, it
could not be determined whether the deaths were related to OP pesticide exposure or
neurobehavioural impairment as a result of OP pesticide exposure. If workers are
leaving the workforce because of ill-health it may also signal that the HWE applies
to the entry of workers into work. Thus, the workforce we sampled may have been
pre-selected as a healthier and less vulnerable population than other adults of the
same age.
Information bias which influences associations between exposure and outcomes
could have affected the responses of participants on the Brief Symptom Inventory
and Q16 questionnaire at the baseline and cohort data collection visits. Some of the
farmers may have over-reported symptoms in the hope of possible financial
compensation for symptoms reported while farmers who left the emerging farmer
projects may have done so because of ill-health thus resulting in possible under-
reporting of symptoms. However, age, education and a past head injury were
associated with outcomes in expected directions suggesting that such a bias could not
have been very strong. Moreover, for this to confound our findings, the bias in
reporting would have had to be differentially distributed by exposure status for which
there was no strong evidence in this study.
As indicated in Chapter 4, a major limitation of the study is the fact that we were
unable to collect information on diagnosed past poisoning from 37% of the study
participants. The numbers who reported they had been diagnosed by a health
professional with past pesticide poisoning (n=23) and during the course of the cohort
period (n=26) were therefore rather high. This suggests that poisoning at baseline
was probably under-reported at baseline while participants may have over-reported
poisoning incidents during the cohort. This may have limited the study power for the
exposure-effect analysis for both the baseline and the cohort study.
277

In the absence of spray schedules with more accurate exposure information, it is
possible that the number, frequency and duration of pesticide application job
activities could have been under-reported at an individual level (Blanc-Lapierre et
al., 2013). Few farmers with low education levels may also not have been able to
read pesticide names and instructions on the labels. Spray managers were reluctant to
provide spray schedules despite repeated attempts to persuade them to do so but they
were willing to verify names of unknown pesticides reported by farmers, which was
done in order to reduce error and misclassification. Participants becoming weary of
interviews and their busy farm schedules could have introduced exposure
misclassification in the follow-up exposure data where farmers may have been too
tired to remember details such as dates and frequency of pesticide applications. They
may have provided quick answers (shortcuts) that may have compromised the
accuracy of their responses. In this respect, the audits may be viewed as strength as
well as a weakness and future studies should attempt to schedule interviews during
farmers’ lunch hour when they are more relaxed. In such instances, spray managers
were consulted to verify exposure history.
Large prospective studies such as the US Agricultural Health study (AHS) have
detailed relatively precise exposure estimates of pesticide applicators, their spouses
as well as commercial applicators from Iowa and North Carolina. The study includes
data from different crop and farming practices and various aspects of
neurobehavioural and psychiatric function have been analysed (Beseler et al., 2006;
Kamel et al., 2005; Starks et al., 2012). Given the inconsistent findings of studies
investigating the different health outcomes of agricultural exposure, an international
consortium of agricultural cohort studies (AGRICOH) has been established to
support and maintain collaboration and share data from various studies. The benefits
that accrue from such data pooling include increased statistical power and will
obviate the need for individual studies to deal with the difficulties discussed above.
In conclusion, this present study showed limited evidence for an association between
OP exposure and neurobehavioural decrements. The final chapter synthesises the
outcomes from the baseline cross-sectional analysis and the cohort study in reflecting
278

on the problem of long-term neurobehavioural effects of low-level cumulative
exposure.
279

5.7 REFERENCES
Albers, J. W., Garabrant, D. H., Schweitzer, S. J., Garrison, R. P., Richardson, R. J. &
Berent, S. (2004). The effects of occupational exposure to chlorpyrifos on the
peripheral nervous system: a prospective cohort study. Occupational and
Environmental Medicine, 61, 201-211.
Baldi, I., Filleul, L., Mohammed-Brahim, B., Fabrigoule, C., Dartiques, J. F., Schwall,
… Brochard, P. (2001). Neuropsychologic effects of long-term exposure to
pesticides: results from the French Phytoner study. Environmental Health
Perspectives, 109(8), 839-844.
Baldi, I., Gruber, A., Rondeau, V., Lebailly, P., Brochard, P. & Fabrigoule, C. (2011).
Neurobehavioral effects of long-term exposure to pesticides: results from the 4-year
follow-up of the PHYTONER Study. Occupational & Environmental Medicine, 68,
108-115.
Bazylewicz-Walczak, B., Majczakowa, W., Szymczak, M. (1999). Behavioral effects
of occupational exposure to organophosphorous pesticides in female greenhouse
planting workers. Neurotoxicology, 20, 819-826.
Beseler, C., Stallones, L., Hoppin, J. A., Alavanja, M. C. R., Blair, A., Keefe, T., &
Kamel, F. (2006). Depressions and pesticide exposures in female spouses of licensed
pesticides applicators in the Agricultural Health Study Cohort, Journal of
Occupational and Environmental Medicine. 48(10), 1005-1013.
Beseler, C. & Stallones, L. (2008). A cohort study of pesticide poisoning and
depression in Colorado farm residents. Annals of epidemiology, 18(10), 768-774.
Beseler, C. & Stallones, L. (2013). Structural equation modelling of pesticide
poisoning, depression, safety, and injury. Journal of Agromedicine, 18(4), 340-349.
Retrieved October 22, from Web site: www.tandfonline.com
280

Blanc-Lapierre, A., Bouvier, G., Gruber, A., Leffondré, K., Lebailly, P.,
Fabrigoule, C. & Baldi, I. (2013). Cognitive Disorders and Occupational Exposure to
Organophosphates: Results From the PHYTONER Study. American Journal of
Epidemiology, Retrieved April 5, 2013, from Web site: http://aje.oxfordjournals.org.
Cherry, N., Burstyn, J., Beach, J. & Senthilselvan, A. (2012). Mental health in Alberta
grain farmers using pesticides over many years. Occupational Medicine, 62, 400-
406.
Cole, D. C., Carpio, F., Julian, J., Leon, N., Carbotte, R. & De Almeida, H. (1997).
Neurobehavioral Outcomes Among Farm and Nonfarm Rural Ecuadorians.
NeuroToxicology and Teratology, 19(4), 277- 286.
Colvin, M., Myers, J. E., Nell, V. N., Rees, D. & Cronje, R. (1993). A cross-sectional
survey of neurobehavioral effects of chronic solvent exposure on workers in a paint
manufacturing plant. Environmental Research, 63, 122-132.
Daniell, W., Barnhart, S., Demers, P., Costa, L. G., Eaton, D. L., Miller, M. &
Rosenstock, L. (1992). Environmental Research, 59(1), 217-228.
Delgado, E., McConnell, R., Miranda, J., Keifer, M., Lundberg, I., Partanen, T. &
Wesseling, C. (2004). A two-year follow-up of central nervous system effects of
acute organophosphate poisoning. Scandinavian Journal of Work, Environment &
Health, 30, 362-370.
Farahat, T. M., Abdelrasoul, G. M. & Amr, M. M., Shebl, M. M., Farahat, F. M. &
Anger, W. K. (2003). Neurobehavioral effects among workers occupationally
exposed to Organophosphate pesticides. Occupational Environmental Medicine, 60,
279-286.
Farahat, F. M., Fenske, R. A., Olsen, J. R., Galvin, K., Bonner, M. R., Rohlman, D. S.
…Anger, W. K. (2010). Chlorpyrifos exposures in Egyptian cotton field workers.
Neurotoxicology, 31, 297-304.
281

Gomes, J., Lloyd, O., Revitt, M. D. & Basha, M. (1998). Morbidity among farm
workers in a desert country in relation to long-term exposure to pesticides.
Scandinavian Journal of Work, Environment and Health, 24(3), 213-219.
Horowitz, S. H., Stark, A., Marshall, E. & Mauer, M. P. (1999). A Multi-Modality
Assessment of peripheral nerve function in organophosphate-pesticide applicators.
Journal of Occupational & Environmental Medicine, 41(5), 405-408.
Kamel, F., Engel L. S. Gladen, B. C., Hoppin, J. A., Alavanja, M. C. R. & Sandler, D.
P. (2005). Neurologic symptoms in licensed pesticide applicators in the Agricultural
Health Study. Environmental Health Perspectives, 113(7), 877-882.
Kamel, F., Rowland, A. S., Park, L. P., Anger, W. K. Baird, D. D., Gladen, B. C. …
Sandler, D. P. (2003). Neurobehavioral performance and work experience in Florida
farmworkers. Environmental Medicine, 111(14), 1765-1772.
London, L., Myers, J. E., Nell, V., Taylor, T. Thompson, M. L. (1997). An
investigation into neurologic and neurobehavioural effects of long-term
agrochemical use among deciduous fruit farm workers in the Western Cape, South
Africa. Environmental Research, 73 (1-2), 132-145.
Mackenzie Ross, S., McManus, I. C., Harrison, V. & Mason, O. (2012).
Neurobehavioral problems following low-level exposure to organophosphate
pesticides: a systematic and meta-analytic review. Critical Reviews in Toxicology,
43(1), 21-44.
Major, V. J. (2010). The role of organophosphate exposure in the aetiology of
depression and suicidality amongst farm workers on wine and table grape farms in
the Worcester area of the Western Cape Province, South Africa. Unpublished
Masters Dissertation. South Africa, University of Cape Town.
Myers, J. E, Nell, V., Colvin, M., Rees, D. & Thompson, M. L. (1999).
Neuropsychological function in solvent-exposed South African paint makers.
Journal of Occupational & Environmental Medicine, 41(11), 1011-1018.
282

Proctor, S. P., Kristin J. Heaton, K. J., Tim Heeren, T. & White, R. F. (2006). Effects
of sarin and cyclosarin exposure during the 1991 Gulf War on neurobehavioral
functioning in US army veterans. Neurotoxicology, 27, 931-939.
Rohlman, D. S., Lasarev, M., Anger, W. K., Scherer, J., Stupfel, J. & McCauley, L.
(2007). Neurobehavioral performance of adult and adolescent agricultural workers.
Neurotoxicology, 28(2), 374-380.
Rosenstock, L. (1991). Chronic central nervous system effects of acute
organophosphate pesticide intoxication. Lancet, 338, 223-227.
Rothlein, J., Rohlman, D., Lasarev, M., Phillips, J., Muniz, J. & McCauley, L. (2006).
Organophosphate pesticide exposure and neurobehavioral performance in
agricultural and non-agricultural Hispanic workers. Environmental Health
Perspectives, 114(5), 691-696.
Salvi, R. M., Lara, D. R., Ghisolfi, E. S., Portela, L. V., Dias, R. D. & Souza, D. O.
(2003). Neuropsychiatric evaluation in subjects chronically exposed to
organophosphate pesticides. Toxicological Sciences, 72, 267-271.
Savage, E. P., Keefe, T. J., Mounce, L. M., Heaton, R. K., Lewis, J. A. & Burcar, P. J.
(1988). Chronic neurological sequelae of acute pesticide poisoning. Archives of
Environmental Health, 43, 38-45.
Schreinemachers, P., Schad, I., Tipraqsa, P., Williams, P. M., Neef, A., Riwthong, S.
…Grovermann, C. (2012). Can public GAP standards reduce agricultural pesticide
use? The case of fruit and vegetable farming in northern Thailand. Journal of
Agriculture and Human Values, 29, 519-529.
Starks, S. A., Gerr, F., Kamel, F., Lynch, C. F., Jones, M. P., Alavanja, M. C.,
Sandler, D. P. & Hoppin, J. A. (2012). Neurobehavioral function and
organophosphate insecticide use among pesticide applicators in the Agricultural
Health Study. Neurotoxicology and Teratology 34, 168-176.
283

Stokes, L., Stark, A., Marshall, E. & Narang, A. (1995). Neurotoxicity among pesticide
applicators exposed to organophosphates. Retrieved September 7, 2012, from Web
site: http://oem.bmj.com/content/52/10/648.full.pdf+html.
World Health Organization (WHO) (1986). “Operational Guide for the WHO
Neurobehavioral Core Test Battery.” World Health Organization Office of
Occupational Health, Geneva, Switzerland.
284

CHAPTER 6: OVERVIEW, CONCLUSIONS AND
RECOMMENDATIONS
6.1 OVERVIEW
This longitudinal cohort study investigated the association between exposure to
organophosphate (OP) pesticides and neurobehavioural performance among emerging
farmers in the Western Cape.
In both the baseline cross-sectional and follow-up cohort studies, the evidence was
weak for an association between adverse neurobehavioural outcomes and cumulative
exposure. Results from the baseline study showed a significant association between
decreased vibration sense and the 3rd
quartile of cumulative OP exposure (OR= 3.08;
95% CI 1.05 to 9.07) which provides some evidence for the argument that long-term
chronic effects may be associated with cumulative exposure to OP pesticides.
However, in the cohort follow-up, there was no evidence that cumulative exposure
during the cohort period resulted in a decline in vibration sense. There appears to be
no relationship in the published literature between duration of follow-up and the
identification or strength of associations between long-term OP exposure and
neurobehavioural deficits. However it is possible that a longer follow-up period of
between 2 to 4 years might have resulted in higher OP exposure and different results.
While some studies have found a positive association between OP exposure and
decreased vibration sense, (Cole et al., 1998; McConnell, Keifer & Rosenstock, 1994;
Stokes, Stark, Marshall & Narang, 1995) other studies did not (Ames et al., 1995;
Kamel et al., 2003; London et al., 1997; Pilkington et al., 2001; Steenland et al.,
2000). The nature of the exposure in these positive studies also differed – exposure in
the study by Cole et al., (1998) was for regular pesticide use, in the study by
McConnell and colleagues (1994) was after acute OP poisoning, and for Stokes and
colleagues (1995) it was both short and long-term OP exposure. The positive
association reported in the baseline study of vibration sense with cumulative OP
exposure in the 3rd
quartile and past poisoning suggests a link between increasing OP
exposure and impaired somatosensory function, and some evidence that vibration
sense is affected by both cumulative OP exposure and past poisoning. It is likely that
285

those participants with past poisoning in the baseline study had higher levels of OP
exposure. However, controlling for past poisoning attenuated the association by
reducing the Odds Ratio (OR=2.34; 95% CI 0.70 to 7.86). It is likely that the loss of
study power due to a small sample size as well as the few applicators who reported
spraying OP pesticides during the cohort follow-up (n=33) could potentially explain
the loss of significance in the association between cumulative OP exposure and
reduced vibration sensitivity.
The fact that decreased vibration sense was significantly associated with past pesticide
poisoning (OR= 5.96; 95% CI 2.14 to 16.66) suggests that residual damage may
persist in individuals years after OP poisoning. Including both past poisoning and
cumulative exposure in the logistic regression model strengthened the effect (OR=
6.10; 95% CI 2.15 to 17.32) and showed that participants with past poisoning had a
six-fold risk of decreased vibration sense.
It has been argued that the use of vibratory machinery such as tractors or repetitive
stress injury caused by the use of tools specific to certain agricultural occupations such
as in fern workers using a small clipper to harvest ferns may confound effects between
exposure and somatosensory function (Kamel et al., 2003). However, operating
vehicles such as tractors and/or vibrating tools mainly affect upper body extremities
(Stokes et al., 1995) and therefore cannot explain the significant association found
between decreased vibration sense and cumulative OP exposure in this study where
vibration was measured in the medial malleolus of the non-dominant lower limb of the
body. Height, a covariate regarded as predictive of vibration threshold in the literature
(Gerr et al., 1990; London et al., 1997), was included in the logistic regression
analyses models as a covariate but did not predict vibration sensitivity.
Although not significant, adjusted multivariate results for the baseline study showed
that OP applicators were more likely to perform poorly on psychomotor function tests
such as the Santa Ana Pegboard tests that require fine motor manual dexterity. This is
consistent with findings of other studies that reported neurobehavioural deficits in tests
of fine motor dexterity as a result of pesticide exposure (Kamel et al., 2003; London et
286

al., 1997; Wesseling et al., 2002). While the baseline study found no significant
associations between cumulative OP exposure and most of the other neurobehavioral
outcomes including tests of attention and memory, except for Digit Span Forward
which was significantly associated to cumulative OP exposure (OR= 0.27; 95% CI
0.08 to 0.93), the result was in the opposite direction to what was expected (see
chapter 4, Table 4.31, page 45-47). Furthermore, there were other rather weakly
positive but non-significant associations between cumulative OP exposure and 7 of 11
outcomes (Digit Span Backward, Digit Span WAIS, Digit Symbol, Benton VRT,
Santa Ana non-dominant hand, Pursuit Aiming, GSI, Q16). While there was no
evidence of performance decline in those with higher levels of cumulative OP
exposure there were only 4 weakly positive but non-significant associations with
cumulative OP exposure (Digit Span WAIS, Santa Ana non-dominant hand, Pursuit
Aiming, Q16) (see chapter 5, Table 5.18). While the associations were not significant
and there was no evidence of a dose-response relationship, participants with high
exposure were almost twice as likely to show increased symptoms in the Q16 and a
decline in performance in Pursuit Aiming compared to those with less OP exposure.
There was also little evidence of a decline in neurobehavioural performance in those
with higher levels of cumulative OP exposure during the 12 month follow-up in the
other neurobehavioural outcomes. While there were no significant associations
between neurobehavioural performance and cumulative OP exposure, when recent
poisoning was included in the regression model with cumulative OP exposure, the
previously non-significant association changed to a significant association showing a
decline in performance on the Digit Span WAIS (OR=3.95; 95% CI 1.03 to 15.08)
over time. This result suggests that those with higher levels of cumulative OP
exposure during the study follow up period were almost four times more likely to
show a decline in Digit Span WAIS score over time.
For Digit Span Forward, the crude associations showed a significant decline in the
performance of participants with diagnosed recent poisoning over time (OR= 2.75;
95% CI 1.12 to 6.76). This association remained significant in the adjusted logistic
regression models (OR = 2.67; 95% CI 1.05 to 6.80). While poisoning experiences
could only be collected from 63% of the participants, the results showed significant
287

differences between poisoned and non-poisoned participants notwithstanding this
limitation. The results on most of the other outcomes also showed an increased risk
among poisoned participants ranging from a marginal risk for Santa Ana dominant
hand (OR=1.31; 95% CI 0.46 to 3.76), to past poisoned participants being more than
two and-a-half times as likely to fall into the lowest quartile for neurobehavioural
performance for Digit Span Forward. Past poisoned participants also performed worse
(non-significantly) than non-poisoned participants on the Q16. Although none of these
other findings were statistically significant, the pattern of associations, and the single
significant finding for Digit Span, are consistent with results from other studies
reporting positive associations between acute poisoning and chronic neurobehavioural
impairment. The consistency of this finding is confirmed in this study and indicates
that the Digit Span may be a key test to use in future studies of OP exposures.
Validity of the outcome measures can be inferred from the pattern of associations for
covariates in both the baseline and the cohort studies. The team of interviewers
received training for two weeks in the administration of questionnaires and
neurobehavioural tests. All the neurobehavioural tests were conducted in a valid and
reliable manner following a strict protocol provided in a fieldwork user guide that
provided instructions for the administration of each test. Significant associations
between age, schooling, previous head injury, language and psychiatric illness and
neurobehavioural performance were evident in the baseline study and these remained
as significant predictors for the change in neurobehavioural performance over time in
the cohort study. These associations were also consistently in the right direction, for
example, younger participants consistently outperformed older participants and those
with higher schooling levels performed better than those with lower schooling levels
were significantly more likely to fall in the lowest quartile indicating poor
performance on tests of memory (Digit Span Backward), visuo-spatial ability (Benton)
and fine motor control (Santa Ana non-dominant hand). Those with low-schooling
were also more likely to report increased symptoms (Q16) than those with higher
schooling. In line with results from other studies (Anger et al., 1997; Baldi et al.,
2011; Rohlman et al., 2007) older participants performed significantly worse than
younger participants on psychomotor speed tests (Digit Symbol) and on fine motor
control and manual dexterity tests (Santa Ana, Pursuit Aiming).
288

Tables 4.28, 4.30 to 4.32 in chapter 4, which present results from the baseline study,
and Tables 5.17 to 5.20 in chapter 5 (cohort study) show that the covariates that
remained significant in the adjusted multivariate logistic regression models for the
association between the dichotomised neurobehavioural outcomes and the three
exposure variables were variables known to be predictive of neurobehavioural
function (schooling, age and gender), and their associations were all in the direction,
and of a strength that would be expected in the literature. While the education levels
among the farmers in the present study were higher than in previous studies (Nell et
al., 1993; London et al., 1997; Myers et al., 1999) the median nine years of education
equates to the first year of senior or high school indicating that they were largely non-
test wise at the baseline visit but were more familiar with the tests at the final follow-
up visit 12 months later indicating the possible benefits from practice effects. In
addition, time was taken at both the baseline and final follow-up visits to ensure that
participants were comfortable with the test setting. Participants were also given
enough time during the practice session of the tests to learn how to perform the
relevant tests at baseline and final follow-up visits and therefore should have been at
the peak of their learning curve reflecting their true ability rather than just being test-
wise (Nell, 2000).
Thus, given the strong consistency with patterns involving co-factors in the literature,
one can be confident that the tests were delivered consistent with the standards
required for valid administration, and that they measured the constructs intended.
6.2 STRENGTHS AND LIMITATIONS
Despite flash floods in the Overberg region in January 2009 and runaway fires on the
West Coast district in December 2009, which caused minor damage to some of the
research community’s crops, data collection was not jeopardised. The study retained
more than 75% of the cohort over a period of 12 months and more than 80% of
participants who remained in the cohort completed all the tests.
289

Covariates such as age, schooling, psychiatric illness and previous head injury were
strong significant predictors of neurobehavioural performance in expected directions
confirming findings of other similar studies in the literature.
Failure to detect significant associations between OP exposure and neurobehavioural
deficits could be due to the fact that participants with poor health may have left work
leaving behind the healthy workers who were selected for pesticide application. There
is some evidence for this Healthy Worker Effect. In the follow-up period, workers
who remained in the study has better scores at baseline than those who dropped out
(for example, median test scores for the Digit Symbol (6.0 vs 5.0) and Pursuit Aiming
(82.5 vs 68.0) - see chapter 5, Table 5.8, page 14). This may explain why applicators
with high exposure tasks performed better than non-applicators on tests of attention
and working memory (Digit Span Forward and Backward, Benton Visual Retention)
and on manual dexterity and fine motor speed (Santa Ana, Pursuit Aiming) in that they
had survived with relatively good neurobehavioural function from past exposures,
whereas those most affected by OP exposures had left the cohort before follow-up.
Recall bias is a possible reason for the lack of a positive significant association
between OP exposure and neurobehavioural outcomes in the baseline study.
Participants’ inability to recall the duration, frequency and type of OP exposure may
have resulted in under-reporting of exposure. Moreover, re-entry into previously
sprayed sections of an orchard or vineyard present opportunities for exposure from
residues on crops and was not measured as an exposure variable in this study. Baldi et
al., (2011) note for example that indirect exposure occurring as a result of re-entry
tasks could account for the lack of difference found in cognitive studies between
directly and indirectly exposed groups in their study. They argue that more time is
spent during the year on maintenance or re-entry tasks than on actual application
treatment which they argued, could explain the absence of effect in their study. High
pesticide residue levels were previously reported in farm as well as non-farm workers
in recent studies in the Western Cape (Dalvie, Cairncross, Solomon & London,
2003, Dalvie et al., 2004, 2009; English et al., 2012). This suggests that supposedly
non-exposed subject may actually have considerable exposure as a result of
290

undocumented pathways. Failure to measure exposure from re-entry among non-
applicators in the present study was a big oversight and is recommended for better
exposure assessment in future studies.
Tests of attention were significantly associated with recent poisoning in the cohort
study and confirms the findings of the literature that report that tests of attention,
working and visual memory (Digit Span, Benton) appear to be consistently positive no
matter what the exposure and sub-groups (Mackenzie Ross et al., 2012). These tests
are most often included in studies assessing neurobehavioural effects of OP pesticide
exposure. Similarly, tests of affect and mood were positively, though non-significantly
associated with OP exposure in the present study confirming findings in the literature
that these tests consistently show exposure effects across studies notwithstanding
study design, exposure duration and sample size. Tests of fine motor control (Santa
Ana Pegboard, Pursuit Aiming) appear not to be reproducible across studies which
could possibly be the reason that these tests are less often included in test batteries to
assess exposure effects. It is possible that these tests (Santa Ana Pegboard and Pursuit
Aiming) are also not well suited to assess neurobehavioural performance following
long-term OP exposure with emerging farmers in this present study, and may be the
reason the study did not find significant associations between cumulative OP exposure
and Santa Ana Pegboard and Pursuit Aiming. Multiple comparisons may also be
another reason for the few significant associations as was reported in London et al.,
(1997) who found small associations between cumulative OP exposure and Santa Ana
dominant hand and Pursuit Aiming with a similar occupational group (deciduous fruit
farm workers) which they explained could be the result of multiple comparisons.
The more objective exposure monitoring in the form of a biomarker of OP such as
blood cholinesterase activity (ChE) useful in cross-sectional studies (Abdel Rasoul et
al., 2008; Rothlein et al., 2006) is not very useful for long-term low level exposure
assessment since toxins are eliminated from the human body within three to four
months (Rohlman, Anger & Lein, 2011). However, it is possible to provide
information on on-going exposure using urinary OP metabolites and the present study
had collected urine specimens every quarter with the intention to monitor such on-
291

going OP exposure; however, this was not possible due to the delay in results from the
laboratory as stated in the previous chapter.
Another possible reason for the limited positive associations between long-term OP
pesticide exposure and neurobehavioural deficits in the present baseline study could be
that non-applicators were also highly exposed. No significant associations between
being an OP applicator and impaired neurobehavioural function were found providing
a strong argument against using job titles as a proxy for exposure. However, the
present study used a job exposure matrix which is a more accurate measure of
exposure than a job title. It could also be argued that emerging farm workers are
generally less exposed than farm workers in other settings given the current leanings
toward more organic farming methods that employ alternative more integrated
pesticide management (IPM) practices.
Lastly, the cohort study suffered from a problem of lowered study power. Higher
levels of OP exposure were anticipated; however the small sample size as well as the
few applicators who reported spraying OP pesticides during the follow-up could
explain the significant associations between a few outcomes and cumulative OP
exposure.
6.3 NEUROBEHAVIOURAL PERFORMANCE IN AFRICA
Emerging farmers in the present study performed better on the higher more complex
cognitive function tests of attention, memory and psychomotor speed (Digit Span,
Digit Symbol) than in previous studies involving deciduous fruit farm workers
(London et al., 1997), paint factory workers (Myers et al., 1999; Nell et al., 1993) and
Egyptian cotton farm workers (Farahat et al., 2003) which could almost certainly be as
a result of the higher level of education in the present study. However, performance on
the manual dexterity test (Santa Ana Pegboard) and on immediate visual memory
(Benton Visual Retention test) in the present study were also slightly worse than farm
workers in a study by London et al., (1997). This notwithstanding, the findings are
fairly similar across the four studies on the cognitive function tests (Digit Span, Digit
Symbol) (London et al., 1997; Nell et al., 1993; Myers et al., 1999).
292

South African emerging farmers showed higher mean scores on cognitive function
tests requiring working memory and attention (Digit Span) than previous South
African studies (London et al., 1997, Nell et al., 1993; Myers et al., 1999) and
participants in Egypt (Farahat et al., 2003). This is likely due to increasing education
levels among South African farmers. South African participants also performed better
than Venezuelan factory workers (Maizlish et al., 1995) and Costa Rica (Wesseling et
al., 2002) but worse than rural Ecuadorian potato farmers (Cole et al., 1997) on
cognitive function tests.
6.4 PESTICIDE EXPOSURE AND SOUTH AFRICAN EMERGING
FARMERS
The findings in this study indicate that emerging farmers continue to be vulnerable to
the health effects of cumulative pesticide exposure. The results showed for example
that emerging farmers suffered a significant decrease in vibration sense over a 12
month interval suggesting peripheral nervous system damage resulting from
cumulative OP exposure and as a result of diagnosed past poisoning, and farmers who
reported pesticide poisoning treated by a medical professional, both retrospectively,
and during the cohort follow-up, showed associations with a broad range of adverse
neurobehavioural outcomes.
Farmers who experienced pesticide poisoning may have been reluctant to seek medical
attention which could have resulted in under-reporting. The geographical distance
between health care facilities and farms serve as obstacles for emerging farmers with
limited funds to access needed health care. Similar to Hispanic and Mexican farm
workers in North America (Poss, Pierce & Prieto, 2005), emerging farmers in this
study reported resorting to the use of home remedies such as drinking herbal infusions,
taking headache tablets and nausea mediation or ‘lying down’ in the orchard or
vineyard to rest when feeling sick or dizzy.
293

Assistance provided by government extension services has also tended to be limited
and infrequent and has not included health and safety training in terms of pesticide use
and information about the use of personal protective equipment. This is not unique to
South Africa; Ohayo-Mitoko (1997) found that about a third of the Kenyan extension
workers in her study did not know that poisoning resulted from pesticide operations.
They also thought that pesticide poisoning was a minor problem and only 80% of the
extension workers advised farmers on the safe use of pesticides. Naidoo et al., (2010)
reported that almost 29% of women farmers in a farming district in northern Kwazulu-
Natal had not received any pesticide information at all.
Paradoxically, farmers might consider themselves to be more protected from the
effects of pesticides when using safety measures. For example, Nicaraguan crop duster
pilots using closed-circuit loading systems for aerial crop dusters were reported to
have greater exposure and lower cholinesterase levels than those who had not used the
closed-circuit systems presumably because there were less careful about basic safety
precautions as a result of a false sense of safety (Hruska et al., 2002; McConnell,
Pacheco & Murray, 1992). Workers using respirators for which filters had not been
replaced (and which therefore become ineffective) and leaking gloves are also sources
of unwitting exposure. A further concern lies with the pesticide vendors and
manufacturers for whom the primary objective is the marketing of pesticides.
Emerging farmers with low education levels are influenced by pesticide vendors in
terms of the use of pesticides (Ngowi, Mbise, Ijani, London & Ajayi, 2007). Weather
conditions influence the safety attitudes and practices of emerging and small-scale
farmers who often choose not to wear personal protective equipment because of
discomfort while wearing it. In tropical countries where temperature exceeds 30
degrees Celsius during the summer months, this is often the case and farmers consider
the symptoms pesticide poisoning as normal resulting in failure to seek medical
attention or report poisoning instances (Kishi et al., 1995).
Though the knowledge and attitudes of the farmers on the use of pesticides were not
measured in this present study, they were aware of the harmful effects of pesticide
exposure and readily admitted to not wearing all the personal protective equipment
they knew they should such as gloves, boots, overalls, eye protection and respirators
294

but wearing only one or two types of personal protection at a time. In fact, the smaller
less educated, resource-poor farmers wore only boots or overalls. In the present study,
many of the poorer farmers did not wear boots but rather wore sneakers and trainers
and leather shoes which may be porous (in the case of sneakers and trainers). In one
instance where appropriate rubber boots were worn it rather served as a reservoir for
pesticides that spilled on two female farmers’ legs during an accident. The two female
farmers continued working in the orchards until their shift ended. They only sought
medical attention the following day when their legs were visibly swollen.
Emerging farmer groups often include whole families in their agricultural activities
providing an opportunity to investigate the neurobehavioural effects of OP exposure in
children. Studies that have found evidence of pesticides on workers’ bodies, in their
clothing and on their shoes have shown that the home of farmers can be a source of
domestic contamination and possible route of exposure (Coronado et al., 2004; Curl et
al., 2002; McCauley et al., 2001). Children are more susceptible to neurotoxicity
because of their developing brain and this provides an opportunity for the use of a
paediatric neurobehavioural test battery to test the effects of OP exposure on the
children of farmers. A recent study by Dalvie et al., (2013) confirmed the presence of
OP pesticides on a farm school using dust samples and a drift catcher positioned near a
farm school providing evidence for occupational pesticide drift from neighbouring
farms.
6.5 PESTICIDE REGULATION
Globally, there is growing concern about the increase in the production, trade and use
of pesticides in agriculture in the last thirty years especially in developing countries
where there are concerns about the health and safety of resource-poor farmers and
farm workers with low education levels and infrequent and/or lack of access to
personal protective equipment. In addition, highly toxic pesticides such as methyl
parathion and paraquat have been banned for use in developed countries but are still in
use in South Africa (London, 2003). While there is a substantial body of legislation,
policies and regulations that exists for the protection of human health and the
environment, it is fragmented and located across several government departments
295

such as Agriculture, Forestry and Fisheries, Water Affairs, Environmental Affairs,
Trade and Industry, Labour and Transport (Naidoo, London, Burdorf, Naidoo &
Kromhout, 2011; Rother, 2005; Rother & London, 1998). Inadequate surveillance
strategies in health facilities combined with inadequately trained health professionals
result in missed opportunities to accurately identify poisoning symptoms resulting in
inaccurate pesticide poisoning estimates (London & Bailie, 1999; Ngowi et al., 2007;
Ngowi & Partanen, 2002; Ohaya-Mitoko, 1997; Rother, 2000; Wesseling et al., 2002).
To assist health care professionals in more accurately identifying pesticide poisoning
symptoms especially in the event of poisoning through unlabelled pesticides, Rother
(2012) recently reported on an algorithm to improve the notification of pesticide
poisoning at a local children’s hospital. This pesticide poisoning notification system
could be extended to health care facilities in closer proximity to farmers in rural and
peri-urban areas.
6.6 CONCLUSION
This is the first prospective cohort study conducted among emerging farmers in this
country and in a developing country. The results from this cohort study have
contributed important findings to the existing body of literature that investigates the
neurobehavioural effects of cumulative as well as acute OP pesticide exposure among
farmers and farm workers.
The study has shown limited evidence for neurobehavioural deficits following long-
term OP pesticide exposure in emerging farmers. It has also confirmed the positive
association between OP pesticide poisoning and lower neurobehavioural performance
both in the cross-sectional study as well as a decline in the follow-up over 12 months.
The results of the baseline study showed some evidence of decreased vibration
sensitivity following cumulative OP exposure especially in the higher level 2nd
and 3rd
but not in the 4th quartiles. For the cohort study, some evidence was provided for the
decline in attention through the Digit Span test following cumulative OP exposure.
Recent poisoning during the cohort study period significantly affected the change in
neurobehavioural performance over time on the Digit Span WAIS. The non-significant
association between cumulative OP exposure and performance on the Digit Span
WAIS over time (OR= 1.88; 95% CI 0.58 to 6.07) became significant when
296

cumulative OP exposure was adjusted for recent poisoning and showed an almost
four-fold risk (OR= 3.95; 95% CI 1.03 to 15.08) of decline over time. The consistently
significant associations between age, schooling and head injury confirmed these
covariates as strong predictors of neurobehavioural performance, and provide
evidence that the test administration was performed to high standard. The overall
findings re-confirm the vulnerability of emergent farmers to hazards from
organophosphate and other pesticides.
The high rate of alcohol consumption combined with low schooling levels among
resource-poor farmers reported in this study is an on-going cause for concern in this
population. The neurobehavioural performance of participants in the study was
significantly affected by current alcohol use, psychiatric illness and previous head
injury, for example, current alcohol use was a significant predictor of performance on
the Digit Symbol and the Santa Ana dominant hand in the baseline study and was
significant predictor of decreased vibration sensitivity over time in the cohort study
(p=0.01). The baseline bivariate results showed a significant association between
increased symptoms on the BSI and the Q16 for participants with psychiatric illness
(p=0.03) compared to those without psychiatric illness. This is also a population that
experiences high rates of trauma as a result of physical injury (London, 2011) as
evidenced in this present study where head injury was a significant predictor of
vibration sensitivity (p=0.002) in the baseline study and a significant predictor of a
decline in Pursuit Aiming in the cohort study (p=0.04).
6.7 RECOMMENDATIONS
The present study showed a need to improve the health and safety conditions of South
African emerging farmers. They require the assistance of a well-functioning
government extension service that is well acquainted with pesticide information and
health and safety training. Extension Officers should be trained about neurotoxicity
and health and safety practices with regard to handling harmful pesticides. In turn,
these trained extension officers could educate farmers on issues of occupational health
and safety such as using personal protective equipment; how to read and understand
labels on pesticide containers; the safe storage of pesticides; how to dispose of empty
pesticide containers; observing re-entry periods; how to identify symptoms of
297

pesticide poisoning; what action to take following accidental pesticide poisoning and
accidental pesticide spills. Farmers should also be educated about the health risks of
pesticide exposure such as symptoms of neurotoxicity and the use of safer alternative
less toxic pesticides.
The health of farmers is an enduring concern especially where literacy levels are low,
alcohol use is high and farmers are resource-poor and are not knowledgeable about the
health effects of pesticide exposure. For the foreseeable future, pesticides are currently
needed to maintain a high crop yield and public health vector control. However, a
range of measures are required to address this problem. These measures require, in the
main, collaboration between emerging farmers and unions that represent farmers, and
various government sectors including the departments of Agriculture, Forestry &
Fisheries, Labour, Health, Water Affairs, Environmental Affairs, Trade and Industry
and Transport.
6.7.1 Interventions to improve farmer occupational health and safety
It is imperative that highly toxic pesticides be banned and farmers educated and
trained about the benefits of using safer less toxic alternatives that are not hazardous to
human health and the environment. Eliminating or restricting the few highly toxic
pesticides would have a huge effect on the health and safety of emerging farmers. A
study from Sri Lanka showed that deaths from suicide were reduced by restricting the
most toxic pesticides (Manuweera, Eddleston, Egodage & Buckley, 2008). This
should also results in a reduction in the number of pesticide poisoning incidents. The
restricting of these highly toxic pesticides did not reduce production neither did it
result in increased costs to the Sri Lankan farmers providing evidence that the use of
less toxic safer alternatives can be cost effective. The department of Agriculture,
Forestry & Fisheries should start by assessing the needs of farmers for specific pest
control and encourage the use of safer less toxic alternatives. The state could also
subsidise the purchase of safer pesticides to encourage resource-poor emerging
farmers to use less toxic pesticides.
It is well known that highly toxic pesticides are sold informally on the streets in South
Africa (Rother, 2012) and restrictions on the use of toxic pesticides are not enforced in
298

most developing countries elevating the health risks of poorer farmers with low levels
of education (Hruska et al., 2002). In addition, emerging farmers are targets for the
sale of pesticides (Rother et al., 2008) and training about IPM methods and the
neurotoxicity of pesticides would place farmers in a more informed position in terms
of using safer alternative. This would slowly obviate the need for farmers to buy more
toxic pesticides from the private sector. The state should also protect the farmers in
this regard by regulating the marketing of pesticides in the private sector.
The state should develop policies to encourage the use of IPM methods and farmers
should be educated about more sustainable and innovative pest management strategies.
The state should also assist financially with the implementation of IPM strategies by
providing technical support so that farmers do not use more pesticides. The training of
extension officers and farmer non-governmental organisations (NGOs) should be
standardised and evaluated by an independent authority to ensure that emerging
farmers receive unbiased training and information that benefit certain sectors. They
should also be well acquainted with IPM strategies so as to advise on different farming
methods such as crop rotation which is a measure that can be used to reduce hazardous
exposure (Rother et al., 2008). Farmers could also be trained to interpret risks
associated with pesticide exposure such as identifying poisoning symptoms and other
health risks.
The South African state should protect the health and safety of farmers by developing
policies that will monitor the sale of pesticides to farmers and restrict access to
hazardous pesticides. Industrialized developed countries such as Europe and North
America employ an Industrial Hygiene Matrix, whereby interventions are focused on
the highest level of impact first, such as removing the few highly hazardous pesticides
labelled as Category 1 chemicals by the WHO, and substituting these with safer
alternatives (Hruska et al., 2002; Murray & Taylor, 2000). The state should also
develop policies that monitor working conditions of emerging farmers and farm
workers by conducting frequent audits of farms, pesticide stores and conditions of
work such as availability, condition and use of PPE.
299

Spray drift in the present study from orchards and vineyards as well as neighbouring
farms presents a health hazard to farmers and their families. Trees should be planted
between orchards, vineyards and farmer homes to act as barriers to spray drift.
6.7.2 Strategies to address high alcohol use and mental illness
High alcohol consumption, low schooling levels, head injury and psychiatric illness
among these resource-poor emerging farmers in this study were significantly
associated with poorer neurobehavioural performance. A comprehensive multi-
pronged strategy is needed to address these conditions in this sector of the agricultural
community. Education is an important aspect that needs addressing in this population.
Farmers with low education levels are not in a good position to read and understand
important information regarding the use of pesticides on labels. The departments of
Agriculture, Forestry & Fisheries, Health and Labour should provide funding for civil
society and Non-Governmental Organisations (NGOs) to develop programs to
promote general literacy for adults and children on farms. This should be combined
with feeding schemes occupational health services through mobile clinic visits to
farms and farm schools.
High alcohol use is also associated with physical injury and poor health which may be
exacerbated by pesticide exposure and psychological illness (London, 2011). The state
should providing funding for NGOs such as Dopstop, Women on Farms Project
(WFP) and faith-based organisations or religious organisations to conduct workshops
to educate and empower farmers to identify risks associated with alcohol use and
physical violence. Workshops should be conducted to train farmers about problem-
solving, conflict resolution and active participation in decision-making about their
health and safety (Holtman et al., 2011). The state should provide improved access to
emergency health care such as ambulance services dedicated to farms. The Health
department should develop mental health policies that provide for mental health
professionals such as social workers and psychiatric nurses to visit farms along with
regular monthly mobile mental health clinic visits. NGOs should run workshops on
life skills with participants suffering psychiatric illness.
300

6.7.3 Strategies to improve the social determinants of health
Underlying determinants of health and healthy working conditions include access to
safe and potable water, adequate sanitation, safe housing, health-related information
and education are necessary physical conditions required to improve the social
determinants of health for farmers and farm workers. Interventions are needed that
will address exposure include providing decontamination facilities such as showers,
hand washing facilities and toilets close to orchards and vineyards for farmers and
farm workers. A multi-level collaboration between government, civil society and
religious organisations is needed to develop policies that will facilitate interventions
that include adult literacy programs, appropriate mental health care and state funding
to conduct on-going research
6.7.4 Pesticide knowledge and safety practices
Targeting the lack of pesticide knowledge among developing farmers, though
important, features low on the rungs of important interventions for safer agricultural
practices (Murray & Taylor, 2000). Incorporating health and safety training that is
specifically focused on avoiding risk behaviour and identifying health symptoms of
pesticide exposure, into the skills base of government extension service officers would
assist in building more informed emerging farmers who are better able to avoid risk
behaviour and identify poisoning symptoms.
Emerging farmers should be included in health and safety training teams that develop
training programs to ensure that the training is culturally, linguistically and
educationally appropriate (Arcury, Estrada & Quandt, 2010; Rother, 2008). Pesticide
education should also be made available to entire emerging farmer families since
pesticide health risks often spread beyond adult members of the family to their
children who are often included in agricultural activities such as weeding and
harvesting (Ngowi et al., 2007). The information on pesticide labels and pesticide
safety posters should be in an appropriate easy-to-understand language and pictograms
(Rother, 2008) especially where education levels may be low.
301

A common misconception is that farmers and farmworkers who prune fruit trees and
vines, harvest, pack and load crops and do not apply pesticides do not need personal
protective equipment (PPE). However, these farmers may in fact be directly exposed
to pesticide residues on plants, fruit, branches and leaves and therefore could benefit
from all the safety measures describes above, e.g. information about neurotoxicity, the
use of suitable personal protective equipment (PPE) and Integrated Pesticide
Management (London & Rother, 2000; London, 2003), hats or scarfs given the risk of
sunstroke in hot South African summer conditions and long-sleeved shirts and long
pants (Naidoo et al., 2011; Vela-Acosta et al., 2002). Government could also assist
with developing PPE that is more suited to the South African climate and/or provide
research funding to adequately address this great need among emerging farmers and
farm workers. More portable drinking water sources within close proximity to the
orchards and vineyards should be made available for farmers to wash their hands
before they eat during their lunch break and reduce further areas of exposure.
It has also been suggested that farmers be consulted about having pesticide applicators
trained and paid directly by government who can provide them with pesticides and
thus have government be in a better position to regulate the way pesticides are used
and the quality of the professional competence in those who handle such applications
(Naidoo et al., 2011).
6.7.5 Legislation and policies
A single pesticide monitoring authority located within the Department of Health is
needed to coordinate the many pieces of the legislation that governs the use, sale and
distribution of pesticide use (Naidoo et al., 2011). Registration of pesticides should
involve consultation with farmers, farm workers and farm workers unions to ensure
that the language appearing on labels is understood clearly by those involved in
application and storage of pesticides (Rother, 2008). Such an overseeing body should
also provide surveillance service for pesticide poisoning by gathering monthly reports
on poisoning instances from all hospitals and clinics in the country (London, 2011). A
national database should be developed that captures all pesticide poisoning instances
on farms and in urban areas.
302

Government should incorporate policies that encourage the use of Integrated Pest
Management methods in agriculture. Environmental Health Officers in turn, should be
trained to provide information and training to emerging farmers about the use of
Integrated Pest Management (IPM) methods. In this manner farmers can be
encouraged to use fewer pesticide applications, use alternative pesticides with low
acute toxicity and low chronic toxicity and have safe packaging and an easy method of
application (Damalas & Eleftherohorinos, 2011; Konradsen et al., 2003; Murray &
Taylor, 2000). Decreased applications of harmful pesticides could then be carefully
monitored and alternative physical and biological control methods used to reduce
health and environmental risks to farmers.
The number of Labour Inspectors should be increased in order to reach all emerging
farmer groups and government resources should be made available to ensure regular
visits to such farmers and report all pesticide poisoning to the pesticide monitoring
authority maintaining the pesticide poisoning database. Government should also set
relevant guidelines to regulate the pesticide manufacturing and trade industry to ensure
that certain sectoral interests are not promoted to the detriment of emerging farmers.
Government should train Environmental Health Officers to provide health and safety
training for emerging farmers. Government should also support safety practices on
farms by providing resources for the training of more safety inspectors to advise
farmers on chemical and physical safety in terms of pesticide storage and accidents.
There should also be inter-sectoral collaboration between the departments of Labour
and Health to refer poisoned farmers for medical attention as well as to record and
update a national database for poisoning instances. Government should also mandate
pesticide safety training for all owners of farms who cultivate crops and practice
animal husbandry.
Resources should be made available by the Department of Health in collaboration with
the Department of Labour to establish decontamination sites, manned by an official
with adequate training in pesticide knowledge and supplied with decontamination
supplies for emerging farmer groups and farm workers. The decontamination sites
should be within close proximity to orchards and vineyards and the official assuming
303

responsibility for the site should also be trained in emergency medical assistance to
treat poisoned and injured farmers and farm workers. Such decontamination sites exist
in North America to reduce and minimise exposure to farm workers (Vela-Acosta et
al., 2002).
6.8 FUTURE RESEARCH
This present study provided limited evidence of an association between impaired
neurobehavioural performance and long-term low-level OP exposure in the absence
of poisoning instances. The findings of this longitudinal cohort study indicate that on-
going research is required with this cohort of emerging farmers over a longer period of
time to track the neurobehavioural effects of long-term low-level exposure to OP
pesticides in the absence of acute poisoning. Further studies should be conducted to
investigate the effects of single chemicals, such as with factory workers since the
synergistic effects of pesticide combinations and mixtures are difficult to disentangle.
6.8.1 Neurobehavioural testing and emerging farmers
More and more farms have access to electricity making the introduction of
computerized testing of emerging farmers a real possibility. They are also simple to
use, can include up to 11 tests and can successfully be used with agricultural workers
(Anger, 2003). In the absence of computerised tests that are expensive, the
neurobehavioural core test battery requiring paper and pencil continues to provide
reliable and valid testing measures for this population since it performed as expected
for age, education, alcohol consumption and head injury. Furthermore, the tuning fork
has proved to be a reliable and valid instrument to assess the effects of OP pesticides
in farmer populations in rural settings and is recommended for use in agricultural
settings in developing countries where electricity may not be consistent or in countries
where electricity is not available. The Brief Symptom Inventory (BSI) and Q16 have
also been used with success among farmer and farm worker populations in a previous
local study (Kootbodien, 2011) confirming the validity of the use of these instruments
in this population. It is recommended that future studies with this cohort and other
similar populations investigate the learning effect that was evident in the results of the
304

participants in the present study and waned at 12 months when the battery of tests was
repeated.
6.8.2 Exposure characterisation
It is also recommended that future studies refine the use of a Job Exposure Matrix
(JEM) to collect more detailed information about the different mixtures of pesticides
that were used including the method, duration, frequency and intensity of application
of such pesticide mixtures. For example, a list with names of pesticides normally used
in an area could serve to jog participants memory about the various types of pesticides
used. Such a list could be used in conjunction with quarterly audit checklists and self-
report exposure questionnaires in follow-up visits. Information about re-entry into
sections of an orchard or vineyard where pesticides have been applied should also be
collected from all emerging farmers (Coronado et al., 2004). In this manner exposure
may be characterised more accurately. The use of PPE could also be incorporated into
the job exposure matrix and information carefully collected for applicators as well as
non-applicators in agricultural settings. This would provide would assist with more
exposure characterisation since it would include both direct and indirect exposure
routes.
6.8.2.1 Preventive biomonitoring
Biological monitoring should be used on an on-going basis to provide more accurate
dose-response exposure estimates (Colosio et al., 2009). Since urinary and blood
specimens provide information about short-term exposure, serial regular
biomonitoring on a larger scale which includes applicators as well as non-applicators
is required to strengthen exposure assessment and provide estimates of on-going
exposure over a longer period of time. In a study by Dalvie et al., (2009) the JEM was
validated against increases in post-spraying blood endosulfan levels in 8 agricultural
applicators compared to non-applicators. The authors reported a positive but weak
association between the JEM score and the increase in post-spraying endosulfan levels
for each participant and noted that this result was due to their small sample size.
Future studies using the JEM and biomonitoring with a larger sample size are needed
to validate the use of regular periodic biomonitoring to assess on-going long-term
exposure. Other markers such as glycophorin A (GPA) assay are able to detect
305

cumulative effects of long-term or repeated OP exposure to bone marrow mutagens
and may demonstrate dose-related increases in the mutations of GPA (Takaro et al.,
2004). GPA would be particularly useful in studies of pesticide mixtures and
combinations in agriculture since it is able to detect cumulative effects of non-specific
exposure.
The state should provide biomonitoring services free of charge for farmer populations
at local hospitals and as part of the mobile clinic services that visit farms and provide
pesticide information sessions. In this way red blood cell cholinesterase testing could
be conducted on a regular and on-going basis (London & Bailie, 1999). This would
assist with early identification of poisoned farmers and farm workers who could be
referred for further treatment to local hospitals. In addition, the state could make
resources available for the training of one member from each emerging farmer group
in basic first aid and ensure that each project is equipped with adequate first aid
facilities (a first aid kit) to provide emergency treatment to injured farmers and farm
workers (Vela-Acosta, Bigelow & Buchan, 2002). Biomonitoring of this sort may
serve to reduce the incidence of acute poisoning, but also heighten farmer awareness
and so indirectly reduce cumulative exposure.
Implementing a biomonitoring service also presents possibilities for better
surveillance. For example, mobile clinics could also channel pesticide poisoning
information collected on farm visits through to the central authority tasked with
monitoring and surveillance located within the Department of Health.
6.8.2.2 Environmental exposure monitoring
Regular monitoring of water sources such as rivers, lakes and dams should be
conducted by the Department of Water Affairs to determine environmental
contamination through ground water from adjoining farms applying pesticides and
posing potential health risks for both humans and animal life (English et al., 2012;
London et al., 2000). Future studies are needed to provide on-going monitoring of air,
dust, spray drift and water sources near farms where pesticides are sprayed (Dalvie et
al., (2013). Water sources used in orchards and vineyards by farmers and farm
306

workers for hand washing before having meals, should also be protected from possible
pesticide contamination. Field Sanitation and Temporary Labor Camps Standards
which are part of federal regulation of North America’s Occupational Health and
Safety Administration (OSHA) specify a distance of approximately 400 meters (a
quarter of a mile) between a potable water source and orchards and vineyards (Vela-
Acosta et al., 2002).
6.8.3 Ensuring future participation in the cohort
Problems with cohort studies often include loss to follow-up of study participants. Our
study retained more than 75% of the cohort by providing participants with minor
financial compensation. Most of the participants who remained in the cohort were of
mixed race origins from the Western Cape while many of the participants who were
lost to follow-up were Black Africans who were migratory farmers from the Eastern
Cape and who had returned there. In order to maintain a good retention rate, it is
recommended that focus groups be held with current project members to determine
reasons that will ensure their continued participation and vested interest in the cohort.
Prospective cohort studies have the potential to assist with more accurate exposure
characterisation and may reduce exposure misclassification. Cohort study designs
have the potential to detect cumulative neurotoxicity manifestations early and thus
play an important role in the design of preventive strategies (Rohlman et al., 2008).
However, cohort studies are expensive, labour intensive, are subject to the vagaries of
agricultural production and extreme weather conditions but provide better assessments
of neurobehavioural effects resulting from on-going pesticide exposure. The existing
cohort may have been too short to determine effects of OP exposure and a longer
follow-up period with this cohort is thus necessary to monitor the effects of long-term
OP exposure. The mechanisms of all OPs are not known and the exposure history of
the participants in this study differs between participants. A recommendation of this
study is that this cohort of emerging farmers be followed up for at least 2 to 4 years to
track on-going OP pesticide exposure and conduct regular biomonitoring (e.g. every
3rd
month) using urinary OP metabolites and blood cholinesterase activity (or ChE
307

level) to measure internal dose. In this way it might be possible to get closer to
establishing the circumstances needed to assess any dose-response relationship.
This study has demonstrated the challenges facing emergent farmers in South Africa
and highlighted the difficulties in studies of neurobehavioural toxicants in developing
countries. It has identified a number of strategies and focus areas for future research,
which will hopefully contribute to improving health and safety conditions for rural
emerging farmers, a particularly vulnerable group in South Africa at the moment.
308

6.9 REFERENCES
Abdel Rasoul, G. M., Abou Salem, M. E., Mechael, A. A., Hendy, O. M., Rohlman, D.
S.& Ismail, A. A. (2008). Effects of occupational pesticide exposure on children
applying pesticides. Neurotoxicology, 29, 833–838.
Ames, R. G., Steenland, K., Jenkins, B., Chrislip, D. & Russo, J. (1995). Chronic
neurologic sequelae to cholinesterase inhibition among agricultural pesticide
applicators. Archives of Environmental Health, 50(6), 440-444.
Anger, W. K. (2003). Neurobehavioral tests and systems to assess neurotoxic exposures in
the workplace and community. Occupational and Environmental Medicine, 60, 531-
538.
Anger, W. K., Sizemore, O. J., Grossmann, S., Glasser, J., Letz, R. & Bowler, R. (1997).
Human neurobehavioral research methods: impact of subject variables. Environmental
Research, 73, 18-41.
Arcury, T. A., Estrada, J. A. & Quandt, S. A. (2010). Overcoming language and literacy
barriers in safety and health training of agricultural workers. Journal of Agromedicine,
15:236-248,
Baldi, I., Gruber, A., Rondeau, V., Lebailly, P., Brochard, P. & Fabrigoule, C. (2011).
Neurobehavioral effects of long-term exposure to pesticides: results from the 4-year
follow-up of the PHYTONER Study. Occupational & Environmental Medicine, 68,
108-115.
Cole, D. C., Carpio, F., Julian, J., Leon, N., Carbotte, R. & De Almeida, H. (1997).
Neurobehavioral outcomes among farm and nonfarm rural Ecuadorians.
Neurotoxicology and Teratology, 19(4), 277-286.
Cole, D. C., Carpio, F., Julian, J. & Leon, N. (1998). Assessment of peripheral nerve
function in an Ecuadorian rural population exposed to pesticides. Journal of
Toxicology and Environmental Health Part A, 55(2), 77-91.
309

Colosio, C., Tiramani, M., Brambilla, G., Colombi, A. & Moretto, A. (2009).
Neurobehavioural effects of pesticides with special focus on organophosphorus
compounds: Which is the real size of the problem? Neurotoxicology, 30, 1155-1161.
Coronado, G. D., Thompson, B., Strong, L., Griffith, W. C. & Islas, I. (2004). Agricultural
task and exposure to organophosphate pesticides among farmworkers. Environmental
Health Perspectives, 112 (2), 142-147.
Curl, C. L., Fenske, R. A., Kissel, J. C., Shirai, J. H., Moate, T. F., Griffith, W. ...
Thompson, B. (2002). Evaluation of take-home organophosphorus pesticide exposure
among agricultural workers and their children. Environmental Health Perspectives,
110, A787-A792.
Dalvie, M. A., Cairncross, E., Solomon, A. & London, L. (2003). Contamination of rural
surface and ground water by endosulfan in farming areas of the Western Cape, South
Africa. Environmental Health, 2(1), 1.
Dalvie, M. A., Myers, J. E., Thompson, M. L., Dyer, S., Robins, T. G., Omar, S. ... Millar,
R., (2004). The hormonal effects of long-term DDT exposure on malaria vector-
control workers in Limpopo Province, South Africa. Environmental Research, 96 (1),
9-19.
Dalvie, M. A., Africa, A., Solomons, A., London, L., Brouwer, D. & Kromhout, H. (2009).
Pesticide exposure and blood endosulfan levels after first season spray amongst farm
workers in the Western Cape, South Africa. Journal of Environmental Science &
Health Part B: Pesticides, Food Contaminants, and Agricultural Wastes, 44(3), 271-
277.
Dalvie, M. A., Sosan, M. B., Africa, A., Cairncross, E. & London, L. (2013).
Environmental monitoring of pesticide residues from farms at a neighbouring primary
and pre-school in the Western Cape in South Africa. Science of the Total Environment,
466-467, 1078-1084.
310

Damalas, C. A. & Eleftherohorinos, I. G. (2011). Pesticide exposure, safety issues, and risk
assessment indicators. International Journal of Environmental Research and Public
Health, 8, 1402-1419.
English, R. G., Perry, M., Lee, M. M., Hoffman, E., Delport, S. & Dalvie, M. A. (2012).
Farm residence and reproductive health among boys in rural South Africa.
Environment International, 15(47), 73-79.
Farahat, T. M., Abdelrasoul, G. M. & Amr, M. M., Shebl, M. M., Farahat, F. M. & Anger,
W. K. (2003). Neurobehavioral effects among workers occupationally exposed to
Organophosphate pesticides. Occupational Environmental Medicine, 60, 279-286.
Gerr, F. E., Hershman, D. & Letz, R. (1990). Vibrotactile threshold measurement
for detecting neurotoxicity: reliability and determination of age and height
standardized normative values. Archives of Environmental Health, 45, 148-154.
Holtman, Z., Shelmerdine, S., London, L. & Flisher, A. J. (2011). Suicide in a poor
rural community in the Western Cape, South Africa: experiences of five suicide
attempters and their families. South African Journal of Psychology, 41(3), 300-309.
Hruska, A. J. & Corriols, M. (2002). The impact of training in Integrated
Pest Management among Nicaraguan maize farmers: Increased net returns and
reduced health risk. International Journal of Occupational and Environmental Health,
8, 191-200.
Kamel, F., Rowland, A. S., Park, L. P., Anger, W. K. Baird, D. D., Gladen, B. C. …
Sandler, D. P. (2003). Neurobehavioral performance and work experience in Florida
farmworkers. Environmental Medicine, 111(14), 1765-1772.
Kishi, M., Hirschon, N., Djajadisastra, M., Satterlee, L. N., Strowman, S. & Dilts, R.
(1995). Relationship of pesticide spraying to signs and symptoms in Indonesian
Farmers. Scandinavian Journal of Work and Environmental Health, 21,124-
133.
311

Konradsen, F., van der Hoek, W., Cole, D. C., Hutchinson, G., Daisley, H., Singh, S. &
Eddleston, M. (2003). Reducing acute poisoning in developing countries – options for
restricting the availability of pesticides. Toxicology, 192, 249-261.
Kootbodien T. (2011). The association of depression, impulsivity and suicidal ideation
with organophosphate pesticide exposure amongst South African farm workers.
Unpublished MPH thesis. University of Cape Town, Cape Town, South Africa.
London, L. (2003). Human rights, environmental justice, and the health of farm workers in
South Africa. International Journal of Occupational and Environmental Health, 9,
59-68.
London, L. (2011). Human rights and health: opportunities to advance rural occupational
health. International Journal of Occupational and Environmental Health, 17, 80-92.
London, L. & Bailie, R. (1999). Notification of pesticide poisoning: Knowledge, attitudes
and practices of doctors in the rural Western Cape. South African Family Practice,
20,(1) 117-120.
London, L. & Rother, H. A. (2000). People, pesticides and the environment:
who bears the brunt of backward policy in South Africa? New Solutions, 10, 339-350.
London, L., Myers, J. E., Nell, V., Taylor, T. Thompson, M. L. (1997). An investigation
into neurologic and neurobehavioural effects of long-term agrochemical use among
deciduous fruit farm workers in the Western Cape, South Africa. Environmental
Research, 73 (1-2), 132-145.
London, L., Thompson, M. L., Capper, W. & Myers, J. E. (2000). Utility of vibration
sense testing for use in developing countries: Comparison of extinction time on the
tuning fork to vibration thresholds on the Vibratron II. NeuroToxicology, 21(5), 743-
752.
312

Mackenzie Ross, S., McManus, I. C., Harrison, V. & Mason, O. (2012). Neurobehavioral
problems following low-level exposure to organophosphate pesticides: a systematic
and meta-analytic review. Critical Reviews in Toxicology, 43(1), 21-44.
Manuweera, G., Eddleston, M., Egodage, S. & Buckley, N. A. (2008). Do targeted bans of
insecticides to prevent deaths from self-poisoning result in reduced agricultural
output? Environmental Health Perspectives, 116, 492-495.
Maizlish, N. A, Parra, G. & Feo, O. (1995). Neurobehavioural evaluation of Venezuelan
workers exposed to inorganic lead. Occupational & Environmental Medicine, 52(6),
408-414.
McCauley, L. A., Lasarev, M. R., Higgins, G., Rothlein, J., Muniz, J., Ebbert, C. &
Phillips, J. (2001). Work characteristics and pesticide exposures among migrant
agricultural families: a community-based research approach. Environmental Health
Perspectives, 109, 533–538.
McConnell, R., Pacheco, F. & Murray, D. (1992). Hazards of closed pesticide
mixing and loading systems: the paradox of protective technology in the third world.
British Journal of Industrial Medicine, 49, 615-620.
McConnell, R., Keifer, M. & Rosenstock, L. (1994). Elevated quantitative vibrotactile
threshold among workers previously poisoned with methamidophos and other
organophosphate pesticides. American Journal of Industrial Medicine, 25, 325-334.
Murray, D. L. & Taylor, P. L. (2000). Claim No Easy Victories: Evaluating the pesticide
industry’s Global Safe Use Campaign. World Development, 28(10), 1735-1749.
Myers, J. E, Nell, V., Colvin, M., Rees, D. & Thompson, M.L. (1999). Neuropsychological
function in solvent-exposed South African paint makers. Journal of Occupational &
Environmental Medicine, 41(11), 1011-1018.
313

Naidoo, S., London, L., Rother, H. A., Burdorf, A., Naidoo, R. N. & Kromhout, H. (2010).
Pesticide safety training and practices in women working in small-scale agriculture in
South Africa. Occupational and Environmental Medicine, 67, 223-229.
Naidoo, S., London, L., Burdorf, A., Naidoo, R. N. & Kromhout, H. (2011). Occupational
Activities associated with a reported history of malaria among women working in
small-scale agriculture in South Africa. The American Society of Tropical Medicine
and Hygiene, 85(5), 805-810.
Nell, V. (2000). Cross-Cultural Neuropsychological Assessment. Theory and Practice.
London: Lawrence Erlbaum Associates, Publishers.
Nell, V., Myers, M. Colvin, M. & Rees, D. (1993). Neuropsychological assessment of
organic solvent effects in South Africa: Test Selection, Adaptation, Scoring, and
Validation Issues. Environmental Research, 63(2), 301-318.
Ngowi, A.V. F., Mbise, T. J., Ijani, A. S. M., London, L. & Ajayi, O. C. (2007). Pesticides
use by smallholder farmers in vegetable production in Northern Tanzania. Crop
Protection, 26(11), 1617-1624.
Ngowi, A.V. F., Partanen, T., (2002). Treatment of pesticide poisoning: a problem for
health care workers in Tanzania. African Newsletter on Occupational Health and
Safety, 12, 71-74.
Ohayo-Mitoko, G. J. A. (1997). Occupational Pesticide Exposure among Kenyan
Agricultural Workers an epidemiological and public health perspective. (Unpublished
doctoral dissertation), Wageningen University, Wageningen, The Netherlands.
Pilkington, A., Buchanan, D., Jamal, G. A., Gillham, R., Hansen, S., Kidd, M. … Soutar,
C. A. (2001). An epidemiological study of the relations between exposure to
organophosphate pesticides and indices of chronic peripheral neuropathy and
neuropsychological abnormalities in sheep farmers and dippers. Occupational and
Environmental Medicine, 58, 702-710.
314

Poss, J., Pierce, R. & Prieto, V. (2005). Herbal remedies used by selected migrant
farmworkers in El Paso, Texas. Journal of Rural Health, 21, 187-191.
Rohlman, D. S., Lasarev, M., Anger, W. K., Scherer, J., Stupfel, J. & McCauley, L.
(2007). Neurobehavioral performance of adult and adolescent agricultural workers.
Neurotoxicology, 28(2), 374-380.
Rohlman, D. S., Luccini, R., Anger, W. K., Bellinger, D. C. & van Thriel, C. (2008).
Neurobehavioral testing in human risk assessment. Neurotoxicology, 29, 556-567.
Rohlman, D. S., Anger, K.W. & Lein, P. J. (2011). Correlating neurobehavioral
performance with biomarkers of organophosphorus pesticide exposure.
Neurotoxicology, 32, 268-276.
Rother, H. A. (2000). Influences of pesticide risk perception on the health of rural South
African women and children. African Newsletter on Occupational Health and Safety,
10, 42-46.
Rother, H. A. (2005). Risk perception, risk communication, and the effectiveness of
pesticide labels in communicating hazards to South African farm workers.
(Unpublished doctoral dissertation), Michigan State University, Michigan.
Rother, H. A. (2008). South African farm workers’ interpretation of risk assessment data
expressed as pictograms on pesticide labels. Environmental Research, 108, 419-427.
Rother, H.A. (2012). Improving poisoning diagnosis and surveillance of street pesticides.
South African Medical Journal, 102(6), 485-488.
Rother, H. A. & London, L. (1998). Pesticide health and safety policy mechanisms in
South Africa: the state of the debate. Occupational and Environmental Health
Research Unit Working Paper No. 1, Department of Community Health. Cape Town:
University of Cape Town.
315

Rother, H. A., Hall, R. & London, L. (2008). Pesticide use among emerging participants
in South Africa: contributing factors and stakeholder perspectives. Development
Southern Africa, 25(4), 399-424.
Rothlein, J., Rohlman, D., Lasarev, M., Phillips, J., Muniz, J. & McCauley, L. (2006).
Organophosphate pesticide exposure and neurobehavioral performance in agricultural
and non-agricultural Hispanic workers. Environmental Health Perspectives, 114,
691-696.
Steenland, K., Dick, R. B., Howell, R. J., Chrislip, D. W., Hines, C., Reid, T. M. …
Knotff, C. (2000). Neurologic function among termiticide applicators exposed to
chlorpyrifos. Environmental Health Perspectives, 108(4), 293-300.
Stokes, L., Stark, A., Marshall, E. & Narang, A. (1995). Neurotoxicity among pesticide
applicators exposed to organophosphates. Retrieved September 7, 2012, from Web
site: http://oem.bmj.com/content/52/10/648.full.pdf+html.
Takaro, T. K., Engel, L. S., Keifer, M., Bigbee, W. L., Kavanagh, T. J & Checkoway, H.
(2004). Glycophorin A is a potential biomarker for the mutagenic effects of pesticides.
International Journal of Occupational And Environmental Health, 10, 256-261.
Wesseling, C., Keifer, M., Ahlbom, A., McConnell, R., Moon, J., Rosenstock, L. &
Hogstedt, C. (2002). Long-term neurobehavioural effects of mild poisonings with
organophosphate and n-methyl carbamate pesticides among banana workers.
International Journal of Occupational and Environmental Health, 8(1), 27-34.
Vela-Acosta, M. S., Bigelow, P. & Buchan, R. (2002). Assessment of occupational health
and safety risks of farmworkers in Colorado. American Journal of Industrial Medical
Supplement, 2, 19-27.
316

APPENDIX A
STUDY INFORMATION SHEETS
(ENGLISH AND AFRIKAANS
TRANSLATIONS)
(A1 TO A2)
317

STUDY INFORMATION SHEET
Adult Family member
1. Title of research project
The title of the study is “neurobehavioural effects of organophosphate pesticides among
emergent farmers and adult members of their families in the Western Cape.”
2. Purpose of research
The purpose of this research is to find out whether you and adult members of your family
have been affected negatively because of coming into close contact with, and/or using
pesticides. In particular the study will look at the effects of pesticides that we call
organophosphates on your health as well as the health of adult members of your family.
3. Why the research is important?
South African farmers, farm workers and their families may be affected by pesticides.
Emerging farmers or small-scale farmers may be encouraged to use more pesticides in order
to become commercial farmers. Without the necessary information and training about the
effects and use of pesticides the health of farmers and members of their family may be at risk.
Because the effects of using low doses of pesticides over a long period of time are not always
visible and noticeable farmers and their families may not be aware of the dangers that these
pesticides may cause to their health.
4. Description of the research project
The study will take place over twelve months starting approximately December 2008 in the
following manner:
At the start of the study, we will do the following: a) ask you to answer question from a
questionnaire; b) perform some tests of your memory, your thinking and your mood, and your
movements and administer questionnaires. These visits will take place approximately in
March, June, September with the last testing taking place in December 2009.
If you agree to participate, and if you give permission for adult members of your family to take
part in the study, I and four research assistants will administer the following tests to each adult:
A questionnaire that will take between 30 and 45 minutes each to complete. The
questionnaire that will ask questions about your age, gender, education, health,
drinking, smoking practices and work activities, your psychological well-being and
your general health.
Tests of your memory, your thinking your mood, and your movements. These are
like IQ tests and will not cause any harm to you or your family. These are tests that
will involve you telling me things, pointing out things and moving your hands.
An examiner will test how well you can feel vibration in your ankle using a tuning
fork
Whenever possible, you will be interviewed in privacy in order to complete the questionnaire
and to conduct the tests. Any personal information will be kept confidential.
318

5. Risks and discomforts of the research
There are no risks when completing the questionnaires. However testing will be stopped if
you as the participant request it and can be continued at a later time or not at all. If you are
uncomfortable about any aspect of the testing, intervention or treatment will be made
available from a trained clinical staff member.
6. Expected benefits to you and others
This study will try to find out whether you have been affected negatively because of using
and/or coming into close contact with pesticides in your farming activities and if you have
been affected, you will be provided with information about pesticides and referred to your
nearest hospital or clinic if necessary. It is important that you and adult members of your
family attend all of these testing sessions to determine the effects of pesticide exposure on
your health.
7. Costs to you resulting from participation in the study
You will not be paid or have to pay for taking part in the study. You will be provided with
lunch or tea if you have to spend a long time with us in the study.
8. Confidentiality of information collected
You will not be personally identified in any reports on this study. The records will be kept
confidential to the extent provided by law.
9. Documentation of the consent
A copy of this document will be kept together with my research records on this study.
10. Contact person
You may contact the following persons for answers to further questions about the research,
your rights, or any injury you may feel relates to the study.
Professor Marc Blochman (Chairperson of the Research Ethics Committee)
Telephone: 021 406 6492
Name of researcher: Ms. Zelda Holtman (Student and researcher)
Telephone: 021 406 6842
Fax: 021 406 6163
Email: [email protected]
Name of Principal Co-investigator: Dr Aqiel Dalvie
Telephone: 021 406 6610
Fax: 021 406 6163
Email: [email protected]
11. Voluntary nature of participation Your participation in this project is entirely voluntary. You must decide whether you want to
participate or not, without feeling obligated to anyone. You will not suffer any discrimination
from the extension officers or the health services if you decide you do not want to participate.
Even if you start participating in the study, you can always change your mind later and
withdraw from the study.
319

STUDIE INLIGTING
Hoof van Huishouding
1. Titel van die navorsings projek
Die titel van die studie is ‘Die neurogedrags gevolge van Organofosfaat gifstowwe in
opkomende klein-skaalse boere en volwasse lede van hulle families in die Wes Kaap.
2. Doel van die navorsing
Die doel van die navorsing is om uit te vind of u en die volwassenes in u familie enige
nadelige gevolge ervaar het as gevolg van blootstelling aan en die gebruik van gifstowwe.
Die studie sal spesifiek kyk na die gevolge op u gesondheid as gevolg van blootstelling aan
organofosfaat gifstowwe. Ons wil dan ook kyk na die tipe en aantal beserings opgedoen met
betrekking tot plaas aktiwiteite oor ‘n periode van 12 maande.
3. Waarom is die navorsing belangrik? Die gesondheid van Suid Afrikaanse boere en plaas werkers en hulle families mag deur
gifstowwe beinvloed word. Opkomende klein-skaalse boere mag ook aangemoedig word om
meer gifstowwe te gebruik om uiteindelik kommersieel te boer. Sonder die nodige inligting
en opleiding omtrent die gevolge en gebruik van gifstowwe mag die boere en hul families ‘n
risiko loop in hierdie opsig. Omdat die gevolge van lae dosis gifstowwe oor ‘n lang tydperk
nie altyd sigbaar en opmerkbaar is nie mag boere en hulle families nie bewus wees van die
gevare op hul gesondheid nie. Dit is ook moontlik dat kontak met gifstowwe oor ‘n lang
tydperk kan lei tot vergeetagtigheid met betrekking tot veiligheids prosedures. Dit mag lei tot
beserings. Daar is nie baie studies wat die verband tussen beserings op plase en noue kontak
met gifstowwe ondersoek het nie. Hierdie studie wil dus kyk na die verband tussen noue
kontak met gifstowwe en die tipe en aantal beserings wat die boer oor ‘n tydperk van 12
maande opdoen.
4. Beskrywing van die navorsings projek Die studie vind plaas oor ‘n tydperk van 12 maande en begin om en by Desember 2008 in die
volgende manier:
Aan die begin van die studie wil ons graag die volgende doen:
(a) u vra om vrae in die vraelys te beantwoord
(b) ‘n paar toetse te doen omtrent u geheue, u denkwyse, stemming (mood) en u
bewegings
(c) Neem ‘n paar bloed en urine monsters
Na hierdie aanvanklike ondersoek, sal ons u en die volwasse lede van u familie wat hul
toestemming gegee het om deel te neem, elke 3rde maand besoek om bloed en urine monsters
te neem en vraelyste aan u te stel. Hierdie besoeke sal plaasvind om en by in Maart, Junie,
September en dan laastens in Desember 2009.
Indien u instem om deel te neem en u u toestemming gee sodat volwasse lede van u familie
kan deel neem aan die studie, sal ek en 8 ander navorsings assistente die volgende toetse met
elke volwassene toedien:
320

‘n vraelys wat tussen 30 en 45 minute sal neem om toe te dien. Die vraelys bestaan
uit vrae oor u ouderdom, u geslag, opvoeding, gesondheid, drink en rook gewoontes,
werks aktiwiteite, u geestes toestand. Hierdie vrae is soos IK toetse en hou geen
gevaar in vir u of u familie nie. Gedurende hierdie toetse sal ons u vra om sekere
vorms te identifiseer, u hande te beweeg en syfers te onthou
‘n professionele verpleegster sal ‘n klein bloed en urine monster neem om te kyk of u
aan gifstowwe blootgestel was
‘n navorser sal ook met ‘n Toonvurk toets om te sien hoe lank u vibrasie in u enkel
kan voel
Elke 3rde
maand sal ons u ook vrae vra oor die inligting in die dagboek om enige
onduidelikheid op te klaar.
Ons sal sover moontlik probeer om u privaatheid te respekteer deur alle bloed en urine
monsters, onderhoude en toetse in ‘n private kamer of kantoor te neem. Alle inligting wat u
aan ons verskaf is streng vertroulik.
5. Risiko en ongemak met betrekking tot die navorsing
Daar is geen risiko verbonde aan die vraelyste nie. Indien u ongemaklik voel oor enige aspek
van die toetsing, sal dit onmiddelik stop gesit word en of later hervat word of glad nie.
Bloed monster: bloed sal geneem word deur ‘n prikkie in u vinger te maak en dit mag
dalk ‘n bietjie ongemaklik voel, daar mag ‘n klein bietjie bloed wees of daar mag ‘n klein
kneusing (bruising) wees by die plek waar die spuit naald bloed trek
Urine monster: hier word daar geen ongemak verwag nie. Boere sal in privaat ‘n kans gegee
word om ‘n urine monster te verskaf, of in hulle eie huise of in ‘n saal met fasiliteite soos
toilette ens.
6. Voorgeneme voordele aan u en andere
Hierdie studies al probeer om uit te vind of u enige nadelige gesondheids gevolge opgedoen
het as gevolg van blootstelling aan gifstowwe gedurende u plaas aktiwiteite. Indien u wel
geaffekteer is sal ons aan u die nodige inligting oor gifstowwe verskaf en indien nodig, sal
ons u verwys na die naaste hospital of kliniek. Dit is baie belangrik dat u en u familie al die
toets sessies bywoon om die gevolge van blootstelling van gifstowwe op u gesondheid vas te
stel.
7. Koste verbonde aan u as gevolg van u deelname aan die studie
U sal nie betaal word nie en u hoef nie te betaal om deel te neem aan die studie nie. Etes of
tee/koffie en toebroodjies sal wel bedien word indien u vir ‘n lang tyd per dag met ons sal
wees gedurende die studie.
8. Vertroulikheid van inligting ingesamel
U sal nie persoonlik geidentifiseer word in enige van die verslae van die studie nie. Die
verslae sal vertroulik gehou word volgens die regskode.
9. Dokumentasie van die toestemming
‘n Afdruk van hierdie dokument sal gehou word met die navorsing verslae van hierdie studie.
321

10. Kontak persoon
U mag die volgende persone kontak indien u enige verdere vrae het in verband met hierdie
navorsing , u regte of enige beserings met betrekking tot hierdie studie:
Professor Marc Blockman (Voorsitter van die Navorsings Etiese Komitee)
Telefoon: 021 406 6492
Naam van navorser: Ms Zelda Holtman (Student en navorser)
Telefoon: 021 406 6842
Faks: 021 406 6163
Epos: [email protected]
Naam van mede-hoof navorser: Dr Aqiel Dalvie
Telefoon: 021 406 6610
Faks: 021 406 6163
Epos: [email protected]
11. Vrywillige wyse van deelname
U deelname in hierdie projek is heeltemal vrywillig. U mag besluit of u wil deelneem of nie
sonder om enigsins aanspreeklik aan enig iemand te voel. Geen Voorligter (Extension
Officer) of gesondheidsdienste sal teen u diskrimineer indien u nie wil deelneem nie. Indien
u aan die begin deelneem en later van plan verander en wil onttrek van die studie kan u so
maak.
322

APPENDIX B
CONSENT FORMS
(ENGLISH AND AFRIKAANS
TRANSLATIONS)
323

Consent Form
Head of Household
Consent to participate in study on the neurobehavioural effects of Organophosphate
pesticides among emergent farmers and adult members of their families.
I am a PhD student at the University of Cape Town. I would like to ask you to participate in a
research study.
1. Title of research project
The title of the study is “The neurobehavioural effects of organophosphate pesticides among
emergent farmers and adult members of their families in the Western Cape.”
2. Purpose of research
The purpose of this research is to find out whether you and adult members of your family
have been affected negatively because of coming into close contact with, and/or using
pesticides. In particular the study will look at the effects of pesticides that we call
organophosphates on your health as well as the health of adult members of your family.
3. Why the research is important?
South African farmers, farm workers and their families may be affected by pesticides.
Emerging farmers or small-scale farmers may be encouraged to use more pesticides in order
to become commercial farmers. Without the necessary information and training about the
effects and use of pesticides the health of farmers and members of their family may be at risk.
Because the effects of using low doses of pesticides over a long period of time are not always
visible and noticeable farmers and their families may not be aware of the dangers that these
pesticides may cause to their health.
4. Description of the research project
The study will take place over twelve months starting approximately December 2008 in the
following manner:
At the start of the study, we will do the following: a) ask you to answer question from a
questionnaire; b) perform some tests of your memory, your thinking and your mood. After
this initial examination, we will visit you and the adult members of your family who have
consented to participate every third to fourth month to administer questionnaires. These visits
will take place approximately in March, June, September with the last testing taking place in
December 2009
If you agree to participate, and if you give permission for adult members of your family to take
part in the study, I and four research assistants will administer the following tests to each adult:
A questionnaire that will take between 30 and 45 minutes each to complete. The
questionnaire that will ask questions about your age, gender, education, health,
drinking, smoking practices and work activities, your psychological well-being and
your general health.
324

Tests of your memory, your thinking your mood, and your movements. These are
like IQ tests and will not cause any harm to you or your family. These are tests that
will involve you telling me things, pointing out things and moving your hands.
An examiner will test how well you can feel vibration in your ankle using a Tuning
Fork
A checklist that will record the number, type and severity of all injuries
Whenever possible, you will be interviewed in privacy in order to complete the questionnaire
and to conduct the tests. Any personal information will be kept confidential.
5. Risks and discomforts of the research
There are no risks when completing the questionnaires. However testing will be stopped if
you as the participant request it and can be continued at a later time or not at all. If you are
uncomfortable about any aspect of the testing, intervention or treatment will be made
available from a trained clinical staff member.
6. Expected benefits to you and others
This study will try to find out whether you have been affected negatively because of using
and/or coming into close contact with pesticides in your farming activities and if you have
been affected, you will be provided with information about pesticides and referred to your
nearest hospital or clinic if necessary. It is important that you and adult members of your
family attend all of these testing sessions to determine the effects of pesticide exposure on
your health.
7. Costs to you resulting from participation in the study
You will not be paid or have to pay for taking part in the study. You will be provided with
lunch or tea if you have to spend a long time with us in the study.
8. Confidentiality of information collected
You will not be personally identified in any reports on this study. The records will be kept
confidential to the extent provided by law.
9. Documentation of the consent
A copy of this document will be kept together with my research records on this study.
10. Contact person
You may contact the following persons for answers to further questions about the research,
your rights, or any injury you may feel relates to the study.
Professor Marc Blochman (Chairperson of the Research Ethics Committee)
Telephone: 021 406 6492
Name of researcher: Ms. Zelda Holtman (Student and researcher)
Telephone: 021 406 6842
Fax: 021 406 6163
Email: [email protected]
Name of Principal Investigator: Professor Leslie London
Telephone: 021 406 6524
325

Fax: 021 406 6163
Email: [email protected]
Name of Principal Co-investigator: Dr Aqiel Dalvie
Telephone: 021 406 6610
Fax: 021 406 6163
Email: [email protected]
11. Voluntary nature of participation Your participation in this project is entirely voluntary. You must decide whether you want to
participate or not, without feeling obligated to anyone. You will not suffer any discrimination
from the extension officers or the health services if you decide you do not want to participate.
Even if you start participating in the study, you can always change your mind later and
withdraw from the study.
Consent of the participant
Head of household
I have read the information given above. I understand the meaning of this information. I,
Mr./Ms/Mrs ________________________have offered to answer any questions concerning
the study. I hereby consent to participate in the study.
I understand that an adult member of my family will also be asked to participate in the study
and I Mr./Ms/Mrs ________________________ as head of my household hereby give my
consent for my wife/partner/adult daughter/adult son to be approached to participate in the
study.
____________________________ _______________________
Printed name of participant signature Date
(Head of household)
____________________________ _______________________
Interviewer (print) signature Date
____________________________ _______________________
Printed name of witness signature Date
(if participant is unable to read
and write)
326

Toestemming
Hoof van Huishouding
Inligting met betrekking tot die studie oor die neurogedrags gevolge van Organofosfaat
gifstowwe in opkomende klein-skaalse boere en volwasse lede van hulle families.
Ek is ‘n Doktorale student verbonde aan die Universiteit Kaapstad en wil graag u
toestemming vra om deel te neem aan ‘n navorsing studie.
1. Titel van die navorsings projek
Die titel van die studie is ‘Die neurogedrags gevolge van Organofosfaat gifstowwe in
opkomende klein-skaalse boere en volwasse lede van hulle families in die Wes Kaap.
2. Doel van die navorsing
Die doel van die navorsing is om uit te vind of u en die volwassenes in u familie enige
nadelige gevolge ervaar het as gevolg van blootstelling aan en die gebruik van gifstowwe.
Die studie sal spesifiek kyk na die gevolge op u gesondheid as gevolg van blootstelling aan
organofosfaat gifstowwe.
3. Waarom is die navorsing belangrik? Die gesondheid van Suid Afrikaanse boere en plaas werkers en hulle families mag deur
gifstowwe beinvloed word. Opkomende klein-skaalse boere mag ook aangemoedig word om
meer gifstowwe te gebruik om uiteindelik kommersieel te boer. Sonder die nodige inligting
en opleiding omtrent die gevolge en gebruik van gifstowwe mag die boere en hul families ‘n
risiko loop in hierdie opsig. Omdat die gevolge van lae dosis gifstowwe oor ‘n lang tydperk
nie altyd sigbaar en opmerkbaar is nie mag boere en hulle families nie bewus wees van die
gevare op hul gesondheid nie.
4. Beskrywing van die navorsings projek Die studie vind plaas oor ‘n tydperk van 12 maande en begin om en by Desember 2008 in die
volgende manier:
Aan die begin van die studie wil ons graag die volgende doen:
(d) u vra om vrae in die vraelys te beantwoord
(e) ‘n paar toetse te doen omtrent u geheue, u denkwyse, stemming (mood) en u
bewegings
Na hierdie aanvanklike ondersoek, sal ons u en die volwasse lede van u familie wat hul
toestemming gegee het om deel te neem, elke 3rde tot 4rde maand besoek om vraelyste aan u
te stel. Hierdie besoeke sal plaasvind om en by Maart, Junie, September en dan laastens in
Desember 2009.
Indien u instem om deel te neem en u u toestemming gee sodat volwasse lede van u familie
kan deel neem aan die studie, sal ek en 8 ander navorsings assistente die volgende toetse met
elke volwassene toedien:
327

‘n vraelys wat tussen 30 en 45 minute sal neem om toe te dien. Die vraelys bestaan
uit vrae oor u ouderdom, u geslag, opvoeding, gesondheid, drink en rook gewoontes,
werks aktiwiteite, u geestes toestand. Hierdie vrae is soos IK toetse en hou geen
gevaar in vir u of u familie nie. Gedurende hierdie toetse sal ons u vra om sekere
vorms te identifiseer, u hande te beweeg en syfers te onthou
‘n navorser sal ook met ‘n Toonvurk toets om te sien hoe lank u vibrasie in u enkel
kan voel
Ons sal sover moontlik probeer om u privaatheid te respekteer deur alle toetse in ‘n private
kamer of kantoor te neem. Alle inligting wat u aan ons verskaf is streng vertroulik.
5. Risiko en ongemak met betrekking tot die navorsing
Daar is geen risiko verbonde aan die vraelyste nie. Indien u ongemaklik voel oor enige aspek
van die toetsing, sal dit onmiddelik stop gesit word en of later hervat word of glad nie.
6. Voorgeneme voordele aan u en andere
Hierdie studies al probeer om uit te vind of u enige nadelige gesondheids gevolge opgedoen
het as gevolg van blootstelling aan gifstowwe gedurende u plaas aktiwiteite. Indien u wel
geaffekteer is sal ons aan u die nodige inligting oor gifstowwe verskaf en indien nodig, sal
ons u verwys na die naaste hospital of kliniek. Dit is baie belangrik dat u en u familie al die
toets sessies by woon om die gevolge van blootstelling van gifstowwe op u gesondheid vas te
stel.
7. Koste verbonde aan u as gevolg van u deelname aan die studie
U sal nie betaal word nie en u hoef nie te betaal om deel te neem aan die studie nie. Etes of
tee/koffie en toebroodjies sal wel bedien word indien u vir ‘n lang tyd per dag met ons sal
wees gedurende die studie.
8. Vertroulikheid van inligting ingesamel
U sal nie persoonlik geidentifiseer word in enige van die verslae van die studie nie. Die
verslae sal vertroulik gehou word volgens die regskode.
9. Dokumentasie van die toestemming
‘n Afdruk van hierdie dokument sal gehou word met die navorsing verslae van hierdie studie.
10. Kontak persoon
U mag die volgende persone kontak indien u enige verdere vrae het in verband met hierdie
navorsing , u regte of enige beserings met betrekking tot hierdie studie:
Professor Marc Blockman (Voorsitter van die Navorsings Etiese Komitee)
Telefoon: 021 406 6492
Naam van navorser: Ms Zelda Holtman (Student en navorser)
Telefoon: 021 406 6842
Faks: 021 406 6163
Epos: [email protected]
Naam van mede-hoof navorser: Dr Aqiel Dalvie
Telefoon: 021 406 6610
Faks: 021 406 6163
328

Epos: [email protected]
11. Vrywillige wyse van deelname
U deelname in hierdie projek is heeltemal vrywillig. U mag besluit of u wil deelneem of nie
sonder om enigsins aanspreeklik aan enig iemand te voel. Geen Voorligter (Extension
Officer) of gesondheidsdienste sal teen u diskrimineer indien u nie wil deelneem nie. Indien
u aan die begin deelneem en later van plan verander en wil onttrek van die studie kan u so
maak.
Toestemming van die deelnemer
Hoof van huishouding
Ek het die bogenoemde inligting gelees en verstaan dit. Ek Mnr, Mevrou, Mej
_______________________ as hoof van die huishouding neem aan dat volwasse lede van my
familie ook gevra sal word om deel te neem aan die studie en dus gee ek my toestemming vir
my vrou/maat/volwasse dogter/volwasse seun om deel te neem aan die studie en enige vrae te
beantwoord.
_____________________________ ____________________ ___________
Naam van deelnemer in drukskrif Handtekening Datum
(Hoof van huishouding)
_____________________________ ____________________ ___________
Naam van Onderhoud voerder Handtekening Datum
____________________________ ____________________ ___________
Naam van Getuie in drukskrif Handtekening Datum
(indien deelnemer nie kan lees of
skryf)
329

APPENDIX C
EXPOSURE AND OUTCOME
QUESTIONNAIRES
(ENGLISH AND AFRIKAANS
TRANSLATIONS)
330

Neurobehavioural effects of pesticide exposure among emergent
farmers in the Western Cape
Farmer Questionnaire
UNIVERSITY OF CAPE TOWN
Questionnaire Number
District
Date
Farm (Trust/project)
name
Name of Farmer
Cell phone number
Telephone number
(landline)
Name of Interviewer
331

GENERAL INSTRUCTIONS
Thank you for agreeing to take part in this study.
We will work through the questionnaire as follows: I will ask the questions and give you the
answer choices and tick or circle the answers you give me in the questionnaire. Choose the
answer that is the closest to how you feel. The interview will take between forty five minutes
and one hour to complete.
Please note that there are no right or wrong answers to the questions asked. Please feel free to
answer just what you think. You may stop at any time if you do not want to carry on with
these questions. Your answers are confidential and will not be shared with anyone. Only the
research staff will have access to the questionnaire once it has been completed.
332

Section 1: DEMOGRAPHIC CHARACTERISTICS
We would like to ask you a few questions about yourself.
Please circle the correct response.
1.1 Gender Male / Female
1.2 How old are you? _________years
Date of birth ____/_____/_____
1.3 What is the highest level of education you have passed?
Less than one year completed 1
Sub A/Class 1/Grade 1 2
Sub B/Class 2/Grade 2 3
Standard 1/Grade 3 4
Standard 2/Grade 4 5
Standard 3/Grade 5 6
Standard 4/Grade 6 7
Standard 5/Grade 7 8
Standard 6/Grade 8 9
Standard 7/Grade 9 10
Standard 8/Grade 10 11
Standard 9/Grade 11 12
Standard 10/Grade 12 13
Further studies – incomplete 14
Diploma/other post school – complete 15
Degree 16
1.4 Which of the following is the main language spoken at home? (Please circle
only one)
English 1
Afrikaans 2
IsiXhosa 3
IsiZulu 4
SeSotho 5
SeTswana 6
SePedi 7
SiSwati 8
TshiVenda 9
Zitsonga 10
IsiNdebele 11
333

Other (Please specify) 12
Section 2: HOUSEHOLD FACTORS
2.1 Is the house you live in:
Owned by your family
1
Rented
2
Owned by the owner of the farm 3
Other (please specify) 4
2.2 How many rooms are there in this house?
Rooms
2.3 How many bedrooms are there in this house?
Bedrooms
2.4 How many bathrooms are there in this house?
Bathrooms
2.5 Does your house have:
Yes No
A Electricity
B A radio
C A television
D A landline telephone
E A fridge
F A computer
G A washing machine
H A cell phone (anybody)
2.6 Which of the following live in the same household with you?
Yes No
A Live alone
B Partner
C Child or Children under 13 yrs
D Child or Children over 13 yrs
E Brother(s) and/or sister(s)
334

F Mother/Female guardian
G Father/Male guardian
H Grandparent(s)
I Other (please specify)
2.7 How many people usually live and sleep in your household?
Number of people
Section 3: ECONOMIC FACTORS
Now we would like to ask a few questions about you and the work that you do.
3.1 What kind of work do you do? (If working, please tell me your occupation. For
example, Farmer, Street Trader, Primary School Teacher, Domestic Worker)
Not working 0
Working (Please specify) 1
3.2 Have you done any paid work in the last 12 months?
No 0
Yes 1
3.3 What kind of paid work did you?
1.
2.
3.
3.4 Please indicate which of the following are your sources of income. Please
answer this question whether or not you are working.
Yes No
A Work
B Spouse/partner
C Parents
D Brothers and/or sisters
E Children
F Child Support Grant
G State Old Age Pensions
335

H Disability Grant
I Care Dependency Grant
J Foster Care Grant
K Grants-in-Aid
L Workman’s Compensation Fund
M Other (Please specify)
3.5 How often do the people here go hungry or have no food to eat?
Never 0
Seldom 1
Sometimes 2
Often 3
3.6 How often does your family have enough money for:
Never Some-
times Always
Not
Applica
ble
A Buying food 0 1 2 3
B Paying for transport (bus, taxi,
train fare, petrol bills) 0 1 2 3
C Paying bills (rent, light, water,
telephone, etc.) 0 1 2 3
D Paying doctors and for medicine 0 1 2 3
E Buying school supplies, uniforms,
books, shoes 0 1 2 3
F Buying clothes 0 1 2 3
G Buying firewood, coal, paraffin 0 1 2 3
Section 4. LIFE HISTORY
Now I’d like to ask you a few questions about the places where you have lived in your
lifetime:
4.1 Where do you live now ? _______________________________________
4.2 How long have you lived here? ____________________ _(Years/Months)
4.3 What kind of farm is this (what is grown here) ? ______________________
336

4.4 How far from your house is the vineyard/field ? ______________________
4.5 Are pesticides sprayed on the vineyard/field during the year? (YES, NO)
IF YES, complete the following:
4.5.1 How many times a year are pesticides applied by means of
a tractor with a boom sprayer ______ (number of times a year)
4.5.2 A tractor with persons using hand or backpacks? _____ (number of
times a year)
4.5.3 Aerial spraying (with an aeroplane) _____ (number of times a year)
4.5.4 Quadbike spraying __________________(number of times a year)
4.6 Does the pesticide spraying come into the house? (YES, NO)
4.7 Does any member of your family come into contact with pesticides
outside the house while spraying occurs (eg. children playing near
spraying area) ? (YES, NO)
4.8 Does any member of your family go into in the field/vineyards
soon after spraying or come into contact with sprayed surfaces? (YES, NO)
4.9 What are the sources of drinking water at your house? ____________________
(municipal water, storage dam on mountain, borehole/spring, river water, farm
dam, rain water tank, etc)
4.10 What are the sources of water for recreational use (bathing, washing of clothes)
at your house? ____________________ (municipal water, storage dam on
mountain, borehole/spring, river water, farm dam, rain water tank, etc)
4.11 Does any other member of your family perform work on the farm? (YES, NO)
If Yes – list the members who are involved in spraying and/or mixing
pesticides? (for example – partner/wife – mixes pesticides or adult member of
the family sprays pesticides)
Member of family e.g. adult son Activity e.g. sprays pesticides
4.12 Do you work in the pesticide store? (YES, NO)
337

4.13 Does any member of your family come into contact
with empty pesticide containers? (YES, NO)
If YES, how _________________________ (for example
drinking water, burn empty containers)
4.14 Does any member of your family eat from the crops in the
vineyard/field soon after spraying? (YES, NO)
4.15 Do you wash your hands before you eat? (YES, NO)
Section 5. ALCOHOL USE
5. Do you drink alcohol ? (YES, NO)
5.1 Have you ever felt that you should drink less alcohol? (YES, NO)
5.2 Have people ever angered you by criticising your drinking habits? (YES, NO)
5.3 Have you ever felt guilty or bad because you drink alcohol? (YES, NO)
5.4 Have you ever had a drink early in the morning to make you
feel better or to get over a ‘babalaas’? (YES, NO)
Section 6. SMOKING AND OTHER DRUG USE
6.1 Do you smoke ? (YES, NO)
6.1.1 If YES please state what you smoke:
YES NO
Cigarettes
Pipe Tobacco
Dagga
Other, please describe
6.1.2 If NO did you ever smoke and if so what did you smoke? (YES, NO)
(IF you did smoke before please state what you smoked)
YES NO
Cigarettes
338

Pipe Tobacco
Dagga
Other, please describe
6.2 During the past 30 days, on how many days did you use each of the following
substances if at all?
Section 7. SUICIDALITY
7.1 During the past 12 months have you ever seriously thought
about hurting yourself in a manner that may cause you to die? (YES, NO)
7.2 During the past 12 months, have you ever told someone that
you plan to commit suicide? (YES, NO)
7.3 During the past 12 months, have you ever tried to commit suicide? (YES, NO)
7.4 Have any of your attempts to injure yourself caused you to be (YES, NO)
treated by a doctor or nurse?
Section 8. WORK HISTORY
Current job
8.1 Are you currently working on this farm (YES/NO)
8.1.1 If YES - how long have you been working on this farm (or since when)
0 days 1 or 2
days
3 to 5
days
6 to 9
days
10 to 19
days
20 to 29
days
All 30
days
A Dagga 0 1 2 3 4 5 6
B Mandrax 0 1 2 3 4 5 6
C Heroin 0 1 2 3 4 5 6
D Crack/cocaine 0 1 2 3 4 5 6
E Ecstasy 0 1 2 3 4 5 6
F Methamphetamin
e (tik) 0 1 2 3 4 5 6
I Other 0 1 2 3 4 5 6
339

(If NO – Go to question 8.2)
_________________________________________________________
8.1.2 Which crops do you work with _______________________________
8.1.3 Do you apply pesticides (YES/NO)
8.1.3.1 If YES which pesticides do you use ____________________
_________________________________________________
Please provide the details about your CURRENT work with pesticides in the following table
Current job – Date: ____________________________
Activity
Yes/No
Hours per day
And
Days per week
Weeks per
month
And
Months per
year
Number of
years
PPE Use:
Indicate which:
A = Apron
B = Boots
G = Gloves
M = Mask
O = Overalls
Gls = Goggles
Mix pesticides
inside
Mix pesticides
outside
Tractor driver with
boom sprayer
Tractor driver
without boom
sprayer
Quadbike spraying
Back pack or hand
spraying
8.2 If NO – please answer the following questions:
8.2.1 Are you currently also doing a non-farming job (YES/NO)
8.2.2 If yes, where are you working ________________________________
8.2.3 What is your job title ______________________________________
340

8.3 Please list your PREVIOUS jobs for the last 3 years (excluding your current job)
where you handled, mixed or in any way came into contact with pesticides. Start
with the job before your current job.
JOB 1 - Date:___________________
Activity
Yes/No
Hours per day
And
Days per week
Weeks per
month
And
Months per year
Number of
years
PPE Use:
Indicate which:
A = Apron
B = Boots
G = Gloves
M = Mask
O = Overalls
Gls = Goggles
Mix pesticides
inside room
Mix pesticides
outside room
Tractor driver with
boom sprayer
Tractor driver
without boom
sprayer
Quadbike spraying
Back pack or hand
spraying
JOB 2 - Date:___________________
Activity
Yes/No
Number of
months per year
Number of
days per week
Number of
years
PPE Use:
Indicate which:
A = Apron
B = Boots
G = Gloves
M = Mask
O = Overalls
Gls = Goggles
Mix pesticides
inside room
Mix pesticides
outside room
Tractor driver with
boom sprayer
341

Tractor driver
without boom
sprayer
Quadbike spraying
Back pack or hand
spraying
JOB 3 - Date:___________________
Activity
Yes/No
Hours per day
And
Days per week
Weeks per
month
And
Months per year
Number of
years
PPE Use:
Indicate which:
A = Apron
B = Boots
G = Gloves
M = Mask
O = Overalls
Gls = Goggles
Mix pesticides
inside room
Mix pesticides
outside room
Tractor driver with
boom sprayer
Tractor driver
without boom
sprayer
Quadbike spraying
Back pack or hand
spraying
Section 9. ENVIRONMENTAL EXPOSURE
9.1 Do you use any pesticides in your garden or in your home? (YES / NO)
eg. Target or Doom __________________________
9.2 For how long have you been using pesticides at home __________ (number of
years)
9.3 How frequently do you use pesticides at home __________ (every day, 3 times a
week, once a week, once a month, less than once a month)
9.4 Have you taken any empty containers home? (YES / NO)
9.5 If yes, what was it used for ________________________________________
9.6 Does any other person in the house work with pesticides? (YES / NO)
342

9.7 If yes, how many? ________________________________________________
9.8 For how long has this person in your home worked with pesticides? _________
__________________(Year(s))
9.9 Do pesticide contaminated clothes get washed at home (YES / NO)
9.10 If yes, does it get washed with the rest of the washing? (YES / NO)
9.11 Do you eat fruit or vegetables from your garden (YES / NO)
9.12 Do you use empty pesticide containers at home for domestic
purposes (YES / NO)
9.13 If yes, what do you use them for? _____________________________________
________________________________________________________________
9.14 For how long have you been using empty containers at home _______ (Year(s))
9.15 What do you do with the pesticide containers you don’t use anymore
_________________________________________________________
343

Brief Symptom Inventory (BSI)
(Interviewer write the answer of the worker, according to the given ratings, in the
appropriate block)
NOT AT ALL
A LITTLE BIT
MODERATELY
QUITE A BIT
EXTREMELY
0
1
2
3
4
This is a list of problem that people sometimes experience. Please listen to each one
Carefully and choose the one which best describes THE EXTENT TO WHICH THIS
PROBLEM HAS UPSET/DISTURBED YOU DURING THE PAST 7 DAYS,
INCLUDING TODAY.
1. Nervousness or shakiness inside
2. Faintness or dizziness
3. The idea that someone else can control your thoughts
4. Feeling others are to blame for most of your troubles
5. Trouble remembering things
6. Feeling easily annoyed or irritated
7. Pains in heart or chest
8. Feeling afraid in open spaces or on street
9. Thoughts of ending your life
10. Feeling that most people cannot be trusted
11. Poor appetite
12. Suddenly scared for no reason
13. Temper outbursts that you could not control
14. Feeling lonely even when you are with people
15. Feeling blocked in getting things done
16. Feeling lonely
17. Feeling blue
18. Feeling no interest in anything
19. Feeling fearful
20. Your feelings being easily hurt
21. Feeling that people are unfriendly or dislike you
22. Feeling inferior to others
23. Nausea or upset stomach
24. Feeling that you are watched or talked about by others
25. Trouble falling asleep
26. Having to check and double-check what you do
27. Difficulty making decisions
28. Feeling afraid to travel on buses, subways or trains
29. Trouble getting your breath
30. Hot or cold spells
344

31. Having to avoid certain things, places or activities because they
frighten you
32. Your mind going blank
33. Numbness or tingling in parts of your body
34. The idea that you should be punished for your sins
35. Feeling hopeless about the future
36 Trouble concentrating
37. Feeling weak in parts of your body
38. Feeling tense or keyed up
39. Thoughts of death or dying
40. Having urges to beat, injure or harm someone
41. Having urges to break or smash things
42. Feeling very self-conscious with others
43. Feeling uneasy in crowds such as shopping or at a movie
44. Never feeling close to another person
45. Spells of terror or panic
46. Getting into frequent arguments
47. Feeling nervous when you are left alone
48. Others not giving you proper credit for your achievements
49. Feeling so restless you couldn’t sit still
50. Feelings of worthlessness
51. Feeling that people will take advantage of you if you let them
52. Feelings of guilt
53. The idea that something is wrong with your mind
345

Q16 SYMPTOMS
Please circle the correct answer
1. Are you abnormally tired ? 1. YES 2. NO
2. Do you have palpitations of the heart when you do not exert yourself ? 1. YES 2. NO
3. Do you often have painful tingling in some part of your body ? 1. YES 2. NO
4. Do you often feel irritated without any particular reason ? 1. YES 2. NO
5. Do you often feel depressed without any particular reason ? 1. YES 2. NO
6. Do you often have problems concentrating ? 1. YES 2. NO
7. Do you have a short memory ? 1. YES 2. NO
8. Do you often perspire without any particular reason ? 1. YES 2. NO
9. Do you have any problems with buttoning and unbuttoning ? 1. YES 2. NO
10.Do you generally find it hard to get the meaning from reading
newspapers and books ? 0. standard 4 or less = CANNOT READ 1. YES 2. NO
11.Have your relatives told you that you have a short memory ? 1. YES 2. NO
12. Do you sometimes feel a heavy feeling on your chest ? 1. YES 2. NO
13. Do you often have to make notes about what you must remember ?
0. standard 4 or less = CANNOT READ 1. YES 2. NO
14. Do you often have to go back and check things you have done such as
locking the door ? 1. YES 2. NO
15. Do you have a headache at least once a week ? 1. YES 2. NO
16. How many times do you have sex per week?_________________
16a. Do you think that this is less than most persons of your age? 1. YES 2. NO
Thank you for taking part in this study
346

Neurogedrags gevolge weens blootstelling aan gifstowwe op
opkomende boere in die Wes-Kaap
Vraelys aan boere
UNIVERSITY OF CAPE TOWN
Vraelysnommer
Distrik
Datum
Plaasnaam (Trust/projek)
Naam van boer
Selfoon nommer
Telefoonnommer (landlyn)
Naam van
onderhoudvoerder
347

ALGEMENE INSTRUKSIES
Dankie dat jy ingestem het om aan hierdie studie deel te neem.
Ons gaan soos volg deur die vraelys werk: Ek sal die vrae vra en aan jou die moontlike
antwoordkeuses gee en ek sal jou antwoorde merk en omsirkel in die vraelys. Kies die
antwoord wat die naaste is aan hoe jy voel. Die onderhoud sal tussen vyf-en-veertig minute
en een uur neem om te voltooi.
Let asseblief op dat daar geen regte of verkeerde antwoorde op die vrae is nie. Antwoord
asseblief soos jy voel. Jy kan enige tyd ophou as jy nie wil voortgaan met die vrae nie. Jou
antwoorde is vertroulik en sal aan niemand anders bekend gemaak word nie. Slegs die
navorsingspersoneel sal toegang tot die vraelys hê nadat dit voltooi is.
348

Afdeling 1: DEMOGRAFIESE BESONDERHEDE
Ons wil jou graag ’n paar vrae oor jouself vra.
Omkring die regte antwoord.
1.1 Geslag Manlik / Vroulik
1.2 Hoe oud is u? _________jaar
Geboortedatum ____/_____/_____
1.3 Wat is die hoogste vlak van onderrig wat jy geslaag het?
Minder as een jaar voltooi 1
Sub A/Klas 1/Graad 1 2
Sub B/Klas 2/Graad 2 3
Standerd 1/Graad 3 4
Standerd 2/Graad 4 5
Standerd 3/Graad 5 6
Standerd 4/Graad 6 7
Standerd 5/Graad 7 8
Standerd 6/Graad 8 9
Standerd 7/Graad 9 10
Standerd 8/Graad 10 11
Standerd 9/Graad 11 12
Standerd 10/Graad 12 13
Verdere onderrig – onvoltooid 14
Diploma/ander naskools – voltooid 15
Graad 16
1.4 Watter een van die volgende is die taal wat die meeste tuis gepraat word? (Omkring
asseblief net een)
Engels 1
Afrikaans 2
IsiXhosa 3
IsiZulu 4
SeSotho 5
SeTswana 6
SePedi 7
SiSwati 8
TshiVenda 9
Zitsonga 10
IsiNdebele 11
349

Ander (Spesifiseer asb.) 12
Afdeling 2: INLIGTING OOR HUISHOUDING
2.3 Is die huis waarin jy woon:
Die eiendom van jou gesin
1
Gehuur
2
Die eiendom van die plaaseienaar 3
Ander (spesifiseer asb.) 4
2.4 Hoeveel vertrekke is daar in hierdie huis?
Vertrekke
2.3 Hoeveel slaapkamers is daar in hierdie huis?
Slaapkamers
2.4 Hoeveel badkamers is daar in hierdie huis?
Badkamers
2.5 Is die volgende in jou huis:
Ja Nee
A Elektrisiteit
B ’n Radio
C ’n Televisie
D ’n Landlyntelefoon
E ’n Yskas
F ’n Rekenaar
G ’n Wasmasjien
H ’n Selfoon (enige iemand)
2.6 Wie van die volgende persone bly saam met jou in die huis?
Ja Nee
A Bly alleen
B Lewensmaat
C Kind of kinders onder 13 jaar
D Kind of kinders bo 13 jaar
E Broer(s) en/of suster(s)
F Moeder/Vroulike voog
G Vader/Manlike voog
H Grootouer(s)
I Ander (Spesifiseer asb.)
350

2.7 Hoeveel mense woon en slaap gewoonlik in jou huishouding?
Aantal mense
Afdeling 3: EKONOMIESE FAKTORE
Nou wil ons graag ’n paar vrae oor jou en die werk wat jy doen, vra.
3.2 Watter soort werk doen jy? (Indien jy werk, wat is jou beroep? Byvoorbeeld boer,
straathandelaar, laerskoolonderwyser, huishulp)
Werk nie 0
Werk (Spesifiseer asb.) 1
3.2 Het jy die afgelope 12 maande enige werk gedoen waarvoor jy betaal is?
Nee 0
Ja 1
3.3 Watter soort betaalde werk het jy gedoen?
3.4 Dui asseblief aan watter van die volgende is jou bronne van inkomste. Antwoord
asseblief hierdie vraag – of jy werk of nie.
Ja Nee
A Werk
B Eggenoot/lewensmaat
C Ouers
D Broers en/of susters
E Kinders
F Kinderonderhoudstoelae
G Staatsouderdomspensioen
H Ongeskiktheidstoelae
I Sorgafhanklikheidstoelae
J Pleegsorgtoelae
K Hulptoelae
L Vergoeding vir beroepsbeserings
M Ander (Spesifiseer asb.)
351

3.5 Hoe gereeld ly die mense hier honger of het nie kos om te eet nie?
Nooit 0
Selde 1
Soms 2
Dikwels 3
3.6 Hoe gereeld het jou gesin geld om:
Nooit Soms Altyd
Nie van
toepas-
sing
A Kos te koop 0 1 2 3
B Te betaal vir vervoer (bus, taxi,
treingeld, petrolgeld) 0 1 2 3
C Rekeninge te betaal (huur, ligte,
water, telefoon, ens.) 0 1 2 3
D Dokters en vir medisyne te betaal 0 1 2 3
E Skoolbenodigdhede, skoolklere,
boeke, skoene te koop 0 1 2 3
F Klere te koop 0 1 2 3
G Hout, steenkool of paraffien te
koop 0 1 2 3
Afdeling 4. LEWENSGESKIEDENIS
Nou wil ek jou graag ’n paar vrae vra oor die plekke waar jy al in jou lewe gebly het:
4.1 Waar woon jy nou? _______________________________________
4.2 Hoe lank woon jy al hier? _____________________(Jare/Maande)
4.3 Watter soort plaas is hierdie (waarmee word hier geboer)?
______________________
4.4 Hoe ver is jou huis van die wingerd/lande? ______________________
4.5 Word gifstowwe gedurende die jaar op die wingerd/lande gespuit?
(JA, NEE)
352

INDIEN JA, voltooi die volgende:
4.5.1 Hoeveel keer per jaar word gifstowwe met ’n trekker en’n
balkspuit toegedien ______ (aantal keer per jaar)
4.5.3 ’n Trekker en persone met hand- of knapsakspuite? _____ (aantal keer per
jaar
4.5.3 Lugbespuiting (met ’n vliegtuig) _____ (aantal keer per jaar)
4.5.4 Spuit met vierwielmotorfietse (Quadbike)__________________(aantal
keer per jaar)
4.6 Kom die gifstowwe in die huis in? (JA, NEE)
4.7 Kom ander lede van jou gesin in kontak met gifstowwe buite die huis terwyl daar gespuit
word? (bv. kinders wat speel naby waar gespuit word)? (JA, NEE)
4.9 Gaan enige lede van jou gesin in die land/wingerd net nadat dit gespuit is of kom hulle
in aanraking met oppervlaktes wat gespuit is? (JA, NEE)
4.9 Waar kom die drinkwater in jou huis vandaan? ____________________
(Munisipale water, opgaardam op berg, boorgat/fontein, rivierwater, plaasdam,
reënwatertenk, ens.)
4.10 Waar kom die water vir gebruiksdoeleindes in jou huis vandaan (bad, was of
klere)? (munisipale water, opgaardam op berg, boorgat/fontein, rivierwater, plaasdam,
reënwatertenk, ens.)
4.11 Doen enige ander lid van jou gesin werk op die plaas? (JA, NEE)
Indien JA – maak ’n lys van die lede wat betrokke is by die spuit of meng van
gifstowwe (byvoorbeeld, lewensmaat/vrou meng gifstowwe of volwasse lid van die
gesin spuit gifstowwe).
Lid van die gesin, bv. volwasse
seun
Aktiwiteit, bv. spuit gifstowwe
4.12 Werk jy in die gifstoor? (JA, NEE)
4.13 Kom enige lid van jou gesin in aanraking met leë gifhouers? (JA/NEE)
Indien JA, hoe? _________________________ (bv. drinkwater, verbrand leë houers)
353

4.14 Eet enige lede van jou gesin van die gewasse in die wingerd/lande kort nadat dit gespuit
is? (JA, NEE)
4.15 Was jy jou hande voor jy eet? (JA, NEE)
Afdeling 5. ALKOHOLGEBRUIK
5. Drink jy alkohol? (JA, NEE)
5.1 Het jy al gevoel dat jy minder alkohol moet gebruik? (JA, NEE)
5.2 Het jy al kwaad geword as mense jou drinkgewoontes kritiseer? (JA, NEE)
5.3 Het jy al ooit sleg of skuldig gevoel oor jy alkohol gebruik? (JA, NEE)
5.4 Het jy al ooit vroeg in die oggend gedrink om beter te voel of om jou babelas beter te
maak? (JA/NEE)
Afdeling 6. ROOK EN ANDER DWELM MIDDEL GEBRUIK
6.1 Rook jy ? (JA/NEE)
6.1.1 Indien JA, vertel my asseblief wat jy rook:
JA NEE
Sigarette
Pyp tabak
Dagga
Ander, beskryf asseblief
6.1.2 Indien NEE het jy ooit gerook en indien wel wat het jy gerook? (JA/NEE)
(Indien jy voorheen gerook het dui asseblief aan wat jy gerook het)
JA NEE
Sigarette
Pyp tabak
Dagga
Ander, beskryf asseblief
354

6.2 Oor die afgelope 30 dae, op hoeveel dae het jy enige van die volgende gebruik, indien
wel?
Afdeling 7. SELFMOORDNEIGINGS
7.1 Gedurende die afgelope 12 maande, het jy dit ooit ernstig oorweeg om jouself so seer te
maak dat jy daarvan kan doodgaan? (JA/NEE)
7.2 Gedurende die afgelope 12 maande, het jy ooit aan iemand gesê dat jy beplan om
selfmoord te pleeg? (JA/NEE)
7.3 Gedurende die afgelope 12 maande, het jy ooit probeer selfmoord pleeg?
(JA/NEE)
7.4 Moes jy deur ’n dokter of verpleegster behandel word na enige van jou pogings om
jouself seer te maak? (JA/NEE)
Afdeling 8. WERKSGESKIEDENIS
Huidige werk
8.1 Werk jy tans op hierdie plaas? (JA/NEE)
8.1.1 Indien JA – hoe lank werk jy al op hierdie plaas (of van wanneer af)?
(Indien NEE – Gaan na vraag 8.2)
_________________________________________________________
8.1.2 Met watter gewasse werk jy? _______________________________
0 dae 1 or 2
dae
3 to 5
dae
6 to 9
dae
10 to 19
dae
20 to 29
dae
Al 30
dae
A Dagga 0 1 2 3 4 5 6
B Mandrax 0 1 2 3 4 5 6
C Heroine 0 1 2 3 4 5 6
D Crack/cocaine 0 1 2 3 4 5 6
E Ecstasy 0 1 2 3 4 5 6
F Methamphetamine
(Tik) 0 1 2 3 4 5 6
I Ander 0 1 2 3 4 5 6
355

8.1.3 Gebruik jy gifstowwe? (JA/NEE)
8.1.3.1 Indien JA – watter gifstowwe gebruik jy? ________________
________________________________________________________
Gee asseblief die besonderhede oor jou HUIDIGE werk met gifstowwe in die volgende tabel
Huidige werk – Datum: ____________________________
Aktiwiteit
Ja/Nee
Ure per dag
en
Dae per week
Weke per
maand
En
Maande per
jaar
Aantal jare
PBT gebruik:
Dui aan watter:
V = Voorskoot
S = Stewels
H =
Handskoene
M = Masker
O = Oorpak
SB = Skermbril
Meng gifstowwe in
vertrek
Meng gifstowwe
buite vertrek
Trekkerdrywer met
balkspuit
Trekkerdrywer
sonder balkspuit
Spuit met
vierwielmotorfiets
Gebruik knapsak- of
handspuite
8.2 Indien NEE – beantwoord asseblief die volgende vrae:
8.2.1 Doen jy tans ook ’n werk wat nie in die boerdery is nie? (JA/NEE)
8.2.2 Indien ja, waar werk jy? ________________________________
8.2.3 Wat is jou posbeskrywing?____________________________________
8.3 Noem asseblief jou VORIGE werke van die afgelope 3 jaar (uitsluitend jou huidige
werk) waar jy gifstowwe hanteer, gemeng of enigsins daarmee in aanraking gekom het.
Begin met die werk net voor jou huidige werk.
WERK 1 - Datum:___________________
356

Aktiwiteit
Ja/Nee
Ure per dag
en
Dae per week
Weke per
maand
En
Maande per jaar
Aantal jare
PBT gebruik:
Dui aan watter:
V = Voorskoot
S = Stewels
H = Handskoen
M = Masker
O = Oorpak
SB = Skermbril
Meng gifstowwe in
vertrek
Meng gifstowwe
buite vertrek
Trekkerdrywer met
balkspuit
Trekkerdrywer
sonder balkspuit
Spuit met
vierwielmotorfiets
Gebruik knapsak- of
handspuite
WERK 2 - Datum:___________________
Aktiwiteit
Ja/Nee
Ure per dag
en
Dae per week
Weke per
maand
En
Maande per jaar
Aantal jare
PBT gebruik:
Dui aan watter:
V = Voorskoot
S = Stewels
H = Handskoen
M = Masker
O = Oorpak
SB = Skermbril
Meng gifstowwe in
vertrek
Meng gifstowwe
buite vertrek
Trekkerdrywer met
balkspuit
Trekkerdrywer
sonder balkspuit
Spuit met
vierwielmotorfiets
Gebruik knapsak- of
handspuit
357

WERK 3 - Datum:___________________
Aktiwiteit
Ja/Nee
Ure per dag
en
Dae per week
Weke per
maand
En
Maande per jaar
Aantal jare
PBT gebruik:
Dui aan watter:
V = Voorskoot
S = Stewels
H = Handskoen
M = Masker
O = Oorpak
SB = Skermbril
Meng gifstowwe
binne vertrek
Meng gifstowwe
buite vertrek
Trekkerdrywer met
balkspuit (Mist
blower)
Trekkerdrywer
sonder balkspuit
(Mist blower)
Spuit met
vierwielmotorfiets
(Quadbike)
Gebruik knapsak- of
handspuite
Afdeling 9. OMGEWINGSBLOOTSTELLING
9.1 Gebruik jy enige gifstowwe in jou tuin of in jou huis? (JA / NEE)
bv. Target of Doom _________________________________________
9.2 Hoe lank gebruik jy al gifstowwe by jou huis? __________ (aantal jare)
9.3 Hoe gereeld gebruik jy gifstowwe by jou huis? __________ (elke dag, 3 keer per week,
een keer per week, een keer per maand, minder as een keer per maand)
9.4 Het jy enige leë gifhouers huis toe gevat? (JA / NEE)
9.5 Indien JA, waarvoor is dit gebruik? ________________________________________
9.6 Werk enige ander persoon in die huis met gifstowwe? (JA / NEE)
9.7 Indien JA, hoeveel? ________________________________________________
9.8 Hoe lank werk hierdie persoon in jou huis al met gifstowwe? _________
358

__________________(Jaar/Jare)
9.9 Word klere wat met gifstowwe besmet is, by die huis gewas? (JA / NEE)
9.10 Indien JA, word dit saam met ander wasgoed gewas? (JA / NEE)
9.11 Eet jy vrugte of groente uit jou tuin? (JA / NEE)
9.12 Gebruik jy leë plaagdoderhouers tuis vir huishoudelike doeleindes? (JA /NEE)
9.13 Indien JA, waarvoor gebruik jy dit? ___________________________________
________________________________________________________________
9.14 Hoe lank reeds gebruik jy leë houers by die huis? _______ (Jaar/Jare)
9.15 Wat doen julle met die lee gifstof houers wat julle nie meer gebruik nie?
________________________________________________________________
359

Brief Symptom Inventory (BSI)
(Onderhoud voerder skryf die antwoord van die plaasboer wat ooreenstem met die gegewe
skaal in die gepaste blok)
Glad nie
‘n Klein bietjie
Taamlik
Heelwat
Verskriklik
0
1
2
3
4
Die volgende is ‘n lys van probleme wat mense soms ervaar. Luister asseblief na elkeen en
kies versigtig die een wat u gevoel die beste beskryf. DIE MATE WAARTOE HIERDIE
PROBLEEM U ONTSTEL HET OOR DIE LAASTE 7 DAE INSLUITEND VANDAG.
1. Senuweeagtigheid of bewerig
2. Lighoofdig of duiselig
3. Die idée dat iemand anders u gedagtes kan beheer
4. Die gevoel dat ander mense te blameer is vir die meeste van u
probleme
5. Sukkel om dinge te onthou
6. Maklik geirriteerd of vies word
7. Pyn in die hart of bors
8. Bang om in die openbaar of op straat te wees
9. Dink daaraan om u lewe te be-eindig
10. Die gevoel dat die meeste mense nie vertrou kan word nie
11. Swak aptyt
12. Skielik bang vir geen rede nie
13. Humeur uitbarstings wat u nie kan beheer nie
14. Alleen voel al is u tussen mense
15. Die gevoel dat u gekeer word om dinge gedaan te kry
16. Voel eensaam
17. Voel teneergedruk of af
18. Geen belangstelling in enigiets
19. Voel bang of vreesbevange
20. Jou gevoelens word maklik seer gemaak
21. Die gevoel dat mense onvriendelik is of nie van jou hou nie
22. Voel minderwaardig tot anders
23. Naar of u maag voel ontsteld
24. Voel dat u dop gehou word of dat andere van u praat
25. Moeilikheid om aan die slaap te word
26. Die gevoel dat u moet seker maak en weer dubbel seker te maak wat
u doen
27. Moeilikheid om besluite te neem
28. Bang om op busse, stasies en treine te ry
29. Sukkel om asem te skep
360

30. Warm en koue gevoelens
31. Die gevoel dat u sekere dinge, plekke of aktiwiteite moet vermy
omdat dit u bang maak
32. U verstand word ‘blank’
33. Die gevoel dat sekere gedeeltes van u liggaam lam is of prikkel
34. Die gevoel dat u gestraf moet word vir u sonde
35. U voel hopeloos oor die toekoms
36 Sukkel om te konsentreer
37. Voel swak in sekere gedeeltes van u liggaam
38. U voel gespanne
39. U het gedagtes oor die dood of doodgaan
40. Die gevoel om iemand te slaan of seer te maak
41. Die gevoel of iets te breek of te verbrysel
42. Baie selfbewus voel met anders
43. Voel ongemaklik in groot skare soos by ‘n winkel sentrum of by die
fliek
44. Voel nooit na aan iemand anders nie
45. Voel soms paniekbevange of angstig
46. Is aanhoudend by argumente of onderonsies betrokke
47. Voel senuweeagtig wanneer u alleen gelaat word
48. Andere gee u nie genoeg krediet vir u prestasies nie
49. Voel so rusteloos dat u nie stil kan sit nie
50. Gevoelens van onwaardigheid
51. Die gevoel dat mense u sal misbruik indien u hulle toelaat
52. Skuld gevoelens
53. Die idée dat iets verkeerd is met u verstand
361

Q16
Simptome
Omsirkel asseblief die gepaste antwoord
1. Voel u buitengewoon moeg ? 1. JA 2. NEE
2. Het u hartkloppens al het u nie geoefen nie ? 1. JA 2. NEE
3. Het u dikwels pynvolle prikkel sensasies in ‘n
gedeelte van jou liggaam ? 1. JA 2. NEE
4. Voel u dikwels geirriteerd sonder enige rede ? 1. JA 2. NEE
5.Voel u dikwels teneergedruk sonder enige rede ? 1. JA 2. NEE
6.Het u dikwels probleme met konsentrasie ? 1. JA 2. NEE
7. Is u kort van gedagte ? 1. JA 2. NEE
8. Sweet u dikwels sonder enige rede ? 1. JA 2. NEE
9. Het u enige probleme om u knope vas en los te maak ? 1. JA 2. NEE
10.Vind u dit oor die algemeen moeilik om koerante
en boeke te verstaan ?
0. standerd 4 of minder = KAN NIE LEES NIE 1. JA 2. NEE
11. Het u familie al vir u gese dat u kort van gedagte is ? 1. JA 2. NEE
12. Voel u soms ‘n swaar drukking op u bors ? 1. JA 2. NEE
13. Moet u dikwels notas maak oor dinge wat u moet onthou ? 0. standerd 4 of minder = KAN NIE LEES NIE 1. JA 2. NEE
14. Moet u dikwels teruggaan om seker te maak dat u
sekere dinge gedoen het bv. Of die deur gesluit is ? 1. JA 2. NEE
15. Het u ‘n hoofpyn ten minste een keer per week ? 1. JA 2. NEE
16. Hoeveel keer per week het u seks ? _____________________
16a. Dink u dat dit minder is as ander persone van u
ouderdom ? 1. JA 2. NEE
DANKIE DAT U AAN HIERDIE STUDIE DEELGENEEM HET
362

APPENDIX D
QUARTERLY AUDIT
(ENGLISH AND AFRIKAANS
TRANSLATIONS)
363

Daily Iconic Audit Checklist
Pesticide application and injuries during working hours
Study Number: ________ Day/month/year: ___/___/__ District: ____________________ Farm (Project) name: _______________________
Pesticide application in the last three months: Farmer name: _______________________
1. Did you apply any pesticides in the past three months? Yes/No
2. Were you poisoned by pesticides in the past three months? Yes/No Interviewer: _________________________
If so, did you go to a clinic or hospital for treatment? Yes/No
Please give me details about all the pesticide applications over the last three months:
1.
Pesticide name
2.
How did
you apply it
?
E.g.
Tractor,
Handgun or
Backpack
3.
How many hours per
day/wks per
mnth/mnths did it
take to apply?
4.
Did you
mix it
yourself ?
= YES
X = NO
5. What Personal Protective Equipment did you use ?
M = while you mixed / A = while you applied
= YES / X = NO
March 2009
Hrs per day –
Days per week –
Wks per mnths –
June 2009
Hrs per day –
Days per week –
Wks per mnths –
September 2009
Hrs per day –
Days per week –
Wks per mnths –
December 2009
Hrs per day –
Days per week –
Wks per mnths –
364

Daaglikse ikoniese Oudit Kontrolelys Gifstof aanwending en beserings gedurende werksure
Studie Nommer: ________ Dag/maand/jaar: ___/___/__ Distrik: ____________________ Plaas (Projek) naam: _______________________
Gifstof aanwending in die laaste 3 maande: Boer naam _______________________
1. In die laaste 3 maande wat verby is het u enige gifstowwe aangewend? Ja/Nee
2. Was u in die laaste 3 maande wat verby is vergiftig deur gifstowwe? Ja/Nee Onderhoudvoerder _________________________
Indien wel, het u na ‘n kliniek of hospital gegaan vir behandeling? Ja/Nee
Verskaf asseblief besonderhede oor alle gifstof aanwendings oor die laaste drie maande:
1.
Gifstof naam
2.
Hoe het
u dit aan
gewend ?
Bv
Trekker,
Handspuit
of Rugsak
3.
Hoeveel ure per dag /
dae per week het dit
geneem om dit aan te
wend ?
4.
Het u die
gifstof self
gemeng ?
= JA
X = NEE
5. Watter beskermings toerusting het u gebruik ?
M = terwyl u gemeng het / A = terwyl u aangewend het
= JA / X = NEE
Maart 2009
Ure per dag –
Dae per week –
Weke per mnd –
Junie 2009
Ure per dag –
Dae per week –
Weke per mnd –
September 2009
Ure per dag –
Dae per week –
Weke per mnd –
Desember 2009
Ure per dag –
Dae per week –
Weke per mnd –
365

APPENDIX E
FIELDWORK USER GUIDE
(ENGLISH TRANSLATION)
366

Fieldwork User Guide
for
conducting neurobehavioural testing
and data collection for the study entitled:
Neurobehavioural effects of
pesticide exposure among emerging farmers
in the Western Cape
2008/2009
Zelda Holtman, Aqiel Dalvie & Leslie London
Occupational & Environmental Health Research Unit (OEHRU)
School of Public Health & Family Medicine
University of Cape Town
367

Contents
Page
1. Introduction 3
2. Considerations when conducting research among farming 3
communities
3. The WHO Neurobehavioural Core Test Battery sub-tests 4
(a) Digit Span (Forward and Backward ) 4
(b) Santa Ana Manual Dexterity Test 7
(c) Digit Symbol 10
(d) Benton Visual Retention Test 13
(e) Pursuit Aiming Test II 15
368

1. Introduction
This fieldwork user guide is an adaptation of the Operational Guide ‘Bypassing Culture.
Performance Process Probes for Neuropsychological Assessment’ developed by Nell & Taylor,
(1992).
The aim of this guide is to assist fieldworkers with administering neurobehavioural tests in a study
investigating the effects of pesticide exposure on emergent farmers. The study aims to describe and
characterize the relationship between organophosphate pesticide (OP) exposure and
neurobehavioural performance among 350 emergent farmers and members of their families from 3
agricultural districts in the Western Cape province: the Boland-Overberg District, the Cape
Winelands District and the West Coast District.
Testing will include sub-tests from the WHO Neurobehavioural Core Test Battery and will be used
in conjunction with neurotoxicity questionnaires, the Brief Symptom Questionnaire, a checklist
collecting information on injury occurrence and farmers will be required to enter information on
daily activities related to pesticide use on the farms. Blood and urine samples will also be collected
from a subsample of 40 participants by a registered nurse to determine cholinesterase levels.
2. Considerations when conducting research in farming communities
There are many facets to conducting research in farming communities. Be aware of the power
differentials that exist between the researcher and farmers and farm workers and while
researchers are expected to behave in a professional manner do not be aloof and distant as this may
intimidate the participant and affect his or her responses and performance.
2.1 Facilitating a relaxed atmosphere
In order to facilitate a relaxed start to the testing session, introduce yourself in a courteous and
friendly manner. Address the participant as ‘Mr…’ ‘Mnr’, ‘Mrs …’ ‘Mev’ Or ‘Miss …’ ‘Mej’ and
make sure that he/she is comfortable. Without having long conversations, try to set the research
participant at ease by using an ice-breaker such as commenting on the weather or the environment
e.g. ‘it is really hot today’ ‘Dit is nogal warm vandag’ or ‘this is such a beautiful part of our
country’ ‘Dit is so mooi hier’.
2.2 Inform participants about testing and ensure confidentiality
Start the interview/testing by telling the participant about your role as interviewer/test administrator
e.g. ‘ I am a psychology student not a doctor or a psychologist’ and the research we are doing is to
help make farm work safer and healthier for you and others who work on farms and use pesticides.’
‘Ek is ‘n Sielkunde student, nie ‘n dokter nie en die navorsing/werk wat ons doen, help om plaas
werk veiliger en meer gesond te maak vir jou en andere wat op plase werk en gifstowwe gebruik’.
Tell the participant that the test results and information gathered is confidential and will only be seen
by other researchers who are part of the research study. Explain how the testing will happen e.g.
‘I will start by asking questions about your health, the work you do on the farm, injuries you have
had and the pesticides you use on your crops. After this I will ask you to do some tests that are like
games and some are quite enjoyable. Some will be easy and others not so easy but do not let this
worry you. Everybody finds some parts of the tests easy and some not so easy.
369

As soon as you have finished we will take a break and have some tea. After that we will carry on
with some more tests. Please feel free to ask questions if there are some things you don’t understand
or that might worry you. Do you have any questions you would like to ask now?
I am going to start with …then I will ask you to go to table number …to be interviewed by
……………’
‘Ek sal begin met vrae oor u gesondheid, die werk wat u op die plaas doen. Beserings wast u gehad
het en die gifstowwe wat u gebruik op u groente en vrugte wat u groei. Daarna sal ek u vra om
toetse te doen wat soos lekker speletjies is. Sommige van die toetse sal maklik wees en andere sal nie
so maklik wees nie maar moenie bekommerd wees nie.Almal vind sommige van die toetse maklik en
sommige nie so maklik nie.
Sodra ons klaar het met die toetse sal ons ‘n blaas kansie neem en tee drink. Daarna gaan ons weer
voort met meer toetse. Voel vry om vrae te vra indien daar enigiets is wat u nie verstaan nie of
waaroor u miskien bekommerd is. Het u nou enige vrae?
Ek sal nou begin met …dan gaan ek u vra om na tafel nommer … te gaan om ‘n paar vra te
beantwoord by …
3. WHO Neurobehavioural Core Test Battery sub-tests:
(a) Digit Span (Forward and Backward)
Materials
The Digit Span test consists of a form with both parts (Digit Span Forward and
Backward) on the same form (see blank form below). The blank test forms will be
provided to the researcher.
The Digit Span Test is a test of immediate (short) auditory memory and requires
focused attention has two parts: Digit Span Forward and Digit Span Backwards. Each
part has 7 pairs of random numbers that become longer in sequence.
HOW TO ADMINISTER THE TEST
Digit Span Forward
The task of the participant
The researcher will read aloud the digit sequence in the same order as it stands on the Digit Span
Forward test and the participant repeats the digit sequence in exactly the same order.
The researcher will be supplied with many blank test forms - one for each participant.
The researcher says to the participant:
‘I am going to say some numbers. Listen carefully and then repeat them in exactly the same order’
‘Ek gaan ‘n paar syfers sê. Luister versigtig en herhaal wat ek sê in diesefde volgorde’
Discontinue after failure on BOTH trials of any item
370

Administer BOTH trials of each item, even if subject passes first trial
IMPORTANT: Administer Digits Backward even if subject scores 0 on Digits Forward
Digit Span Test Blank
Discontinue after failure on BOTH TRIALS
DIGIT SPAN Administer BOTH TRIALS of each item, even if subject passes first trial
DIGITS FORWARD
Pass
-
Fail
Score
2, 1,
or 0
DIGITS BACKWARD
Pass
-
Fail
Score
2, 1,
or 0
.
5 - 8 - 2
2 - 4
6 - 9 - 4 5 - 8
6 - 4 - 3 - 9
6 - 2 - 9
7 - 2 - 8 - 6 4 - 1 - 5
4 - 2 - 7 - 3 - 1
3 - 2 - 7 - 9
7 - 5 - 8 - 3 - 6 4 - 9 - 6 - 8
6 - 1 - 9 - 4 - 7 - 3
1 - 5 - 2 - 8 - 6
3 - 9 - 2 - 4 - 8 - 7 6 - 1 - 8 - 4 - 3
5 - 9 - 1 - 7 - 4 - 2 - 8
5 - 3 - 9 - 4 - 1 - 8
4 - 1 - 7 - 9 - 3 - 8 - 6 7 - 2 - 4 - 8 - 8 - 5 - 6
5 - 8 - 1 - 9 - 2 - 6 - 4 - 7
8 - 1 - 2 - 9 - 3 - 6 - 5
3 - 8 - 2 - 9 - 5 - 1 - 7 - 4 4 - 7 - 3 - 9 - 1 - 2 - 8
2 - 7 - 5 - 8 - 6 - 2 - 5 - 8 - 4
9 - 4 - 3 - 7 - 6 - 2 - 5 - 8
7 - 1 - 3 - 9 - 4 - 2 - 5 - 6 - 8 7 - 2 - 8 - 1 - 9 - 6 - 5 - 3
Max =
14
Total Backward Max =
14
+ +
Forward Backward Total
371

Digit Span Backward
Materials
The Digit Span Backward test is part of the same form as the Digit Span Forward.
The task of the participant
In the Digit Span Backward test the researcher (examiner) will read aloud the digit sequence in the
reverse order and the participant repeats the digit sequence in exactly the same order.
The researcher says to the participant:
‘I am going to say some more numbers, but this time I want you to repeat them backwards, that is,
the last number comes first and the first one comes last. If I say 1-2-3, what will you say …’
Ek gaan ‘n paar syfers sê, maar hierdie keer wil ek he dat jy dit van agter af moet herhaal, met
ander woorde, jy moet die laaste syfer eerste sê en die eerste syfer laaste. Wanneer ek
1-2-3 sê, wat sal jy dan sê …?’
Coach the participant to correct answer Help die persoon om die regte
antwoord te gee
SCORING
Participant’s performance Score (in points)
Both sequences repeated correctly 2
Only one sequence correct 1
Neither sequence correct 0
Maximum score possible on Digit Forward test 14
SCORE The overall score for a participant’s performance on the Digit Span Test is the sum of Digits
Forward and Digits Backwards.
Scoring is the same for the Digits Forward and Digits Backwards
___________________________________________________________________________
(b) Santa Ana Manual Dexterity Test
Materials
The Santa Ana pegboard test consists of a board with 48 square depressions and an equal number of
fitted pegs having a cylindrical upper part and square base. A stopwatch is also needed.
Function tested
This is a test of manual dexterity which requires rapid eye-hand coordinated movements.
372

Task of the participant
The participant has to turn each peg 180 degrees as fast as possible. Separate measurements are
taken for the preferred hand (dominant hand) and the non-preferred hand (non-dominant hand).
Before the test
Place the board with all the pegs inserted into the base plate in front of the participant. Make sure
that all the pegs are in the same position. The participant has to perform the test while standing and
the researcher has to stand next to the participant.
Now the researcher lifts one of the pegs from its depression and demonstrates while saying to the
participant:
‘Now please look at the board with the pegs. The pegs have a round upper part,
but the base is square so that the pegs fit into the holes in the board. You must
take each peg, turn it around and put it back in this way, one after the other’.
‘Nou kyk asseblief na die bord met die pennetjies. Die pennetjies het ‘n ronde boonste
gedeelte maar die onderste gedeelte is vierkantig sodat die pennetjies in die gaatjies
van die bord pas. Jy moet elke pennetjie uit haal, omdraai en dit weer terug sit op
hierdie manier, een op ‘n tyd’.
The researcher demonstrates this task by turning four pegs, beginning from the left upper line. Then
put each of the four pegs back to their original place slowly and deliberately so as not to create a
competitive attitude on the part of the participant.
The researcher then says to the participant:
‘Now you try. Lift and turn these pegs with your right hand like I did. Make sure
that you are standing in a comfortable position to do it easily.’
‘Probeer jy nou so bietjie. Haal die pennetjies uit met jou regter hand soos wat ek dit
gedoen het. Maak seker jy staan in ‘n gemaklike posisie om dit maklik te doen.’
NOTE: Right-handed participants begin with the right-hand in the upper left-hand
corner and left-handed participants begin with the left hand in the upper
right-hand corner.
Trial 1
Now say to the participant while showing the participant the upper left-hand corner and
demonstrating by moving the finger in a reversed S-shape over the pegs on the board the direction
the participant should follow after the first line:
‘Now try to turn the pegs as fast as possible, with your right hand
beginning from here and when you have finished the upper line, carry
on with the next line in the opposite direction, and so on until I ask you
373

to stop’
‘Probeer nou om die pennetjies so vinnig as moontlik met jou regter hand
te draai en begin hier en wanneer jy klaar het met die boonste lyn, gaan
verder met die volgende lyn in die teenoorgestelde rigting, en so voorts
totdat ek jou vra om op te hou.’
Now say to the participant: ‘Please begin’ ‘Begin asseblief’
Begin hier
---begin here--- > ---------- >
0 0 0 0 0 0 0 0 0 0 0 0 0 0 0 0 0 0 0 0 0 0 0 0 0 0 0 0 0 0 0 0 0 0 0 0 0 0 0
< -------- < ---------
0 0 0 0 0 0 0 0 0 0 0 0 0 0 0 0 0 0 0 0 0 0 0 0 0 0 0 0 0 0 0 0 0 0 0 0 0 0 0
---------- > ---------- >
0 0 0 0 0 0 0 0 0 0 0 0 0 0 0 0 0 0 0 0 0 0 0 0 0 0 0 0 0 0 0 0 0 0 0 0 0 0 0
After 30 seconds say: ‘Stop now please.’ ‘Stop asseblief nou’
Trial 2
Say: ‘Next you should do it with your left hand, beginning from here (Upper right-hand
corner) and continue from right to left.’
‘Nou moet jy dit met jou linker hand doen, begin hier (Boonste regter hoek)
En hou aan van reg tot links.’
Show the correct course as illustrated below:
begin hier
< -------- < ------ begin here---
0 0 0 0 0 0 0 0 0 0 0 0 0 0 0 0 0 0 0 0 0 0 0 0 0 0 0 0 0 0 0 0 0 0 0 0 0 0 0
---------- > ---------- >
0 0 0 0 0 0 0 0 0 0 0 0 0 0 0 0 0 0 0 0 0 0 0 0 0 0 0 0 0 0 0 0 0 0 0 0 0 0 0
< -------- < ---------
0 0 0 0 0 0 0 0 0 0 0 0 0 0 0 0 0 0 0 0 0 0 0 0 0 0 0 0 0 0 0 0 0 0 0 0 0 0 0
‘Maar jy kan eerste ‘n bietjie vinniger oefen’
Say: ‘But you can practice it a little first.’
374

(The researcher demonstrates this by turning around four pegs with the left hand and lets the
participant turn the pegs around with his/her left hand.)
Say: ‘OK, now you can begin’ ‘OK, nou kan jy begin’
Now reset the pegs, moving slowly and deliberately.
Trial 3
Say: ‘Now once again with the right hand. You can begin’
‘Nou weer met die regterhand. Jy kan begin’
Reset the pegs.
Trial 4
Say: ‘And once again with the left hand. You can begin’
‘En nou weer met die linkerhand. Jy kan begin’
Scoring
The time limit for each trial is 30 seconds. After each trial, write down the number of correctly
turned pegs in the Record Form. (Do not include pegs that are not placed back in the hole or that are
just turned part way.)
SCORE
SA Preferred hand (Dominant) Sum of pegs turned in 2 trials with preferred hand
SA Non-Preferred hand (Non-Dominant) Sum of pegs turned in 2 trials with non-preferred
Hand
Additional advice to researcher
Problem: At the beginning of the trial the participant turns 2 successive pegs to the wrong
position
Action: Interrupt the trial, turn the pegs back to their original position, repeat the
instruction.
Problem: The participant tries to correct any errors
375

Action: Ask the participant to leave it and to continue
Problem: The participant drops a peg
Action: Ask the participant to leave it and to continue
Note to the researcher: if you are uncertain about anything please ask the Research
Coordinator
______________________________________________________________________
(c) Digit Symbol Test
Introduction
The Digit Symbol test is a test of perceptual motor speed which also requires learning of
association.
Materials
The Digit Symbol worksheet will be supplied to the researcher (one for each participant) and
contains a list of numbers that are associated with certain simple symbols and a list of random digits
from one through nine with blank squares below each digit.
The participant needs a pencil and the researcher needs a stopwatch.
Task of the participant
The researcher puts the blank worksheet in front of the participant who is seated.
The participant’s task is to fill the blank squares with the symbols paired to their corresponding
digits as quickly as possible for 90 seconds.
Administering the test
Hand the subject a pencil
Point at the key above the rows of digits and say:
‘Look at these boxes. Each has a number in the upper part and a symbol
in the lower part. There are nine numbers, from one through nine, and each
has its own symbol.’
‘Kyk na hierdie bladsy. Elkeen het ‘n syfer in die boonste gedeelte en ‘n
simbool in die onderste gedeelte. Daar is nege syfers, vanaf een tot nege,
en elkeen het sy eie simbool.’
Show the participant the association between a digit and its symbol.
Then, pointing at the first row, say:
‘Here you see only the numbers are printed. Your task is to fill each empty
square with the symbol corresponding to that number.’
376

‘Hier sien jy is net die syfers getik. Jou taak is om in elke lee blok die syfer
in te vul wat ooreen stem met die simbool.’
The practice exercise
Show the participant the first box of the practice series and say:
‘Now here is a 2, find its symbol and fill in the blank square below it.
Try the next number. And here is another one; now please put the symbol
you think should go with that number.’
‘Nou hier is ‘n 2, kry sy simbool en vul dit in die lee blok onder aan.
Probeer die volgende syfer. En hier is nog een; vul nou die simbool
in wat jy dink moet daarmee gaan.’
If the participant has completed the first three squares correctly, say:
‘Good, now carry on filling in the empty squares up to this heavy line,’
‘Goed, gaan nou aan om die lee blokkies in te vul tot by hierdie dik lyn,’
After 30 seconds, if the participant has not yet filled in all the squares, say:
‘Try to work a little faster’
‘Probeer ‘n bietjie vinniger werk’
Check that the participant fills the squares with the correct symbols. If he/she makes a mistake, stop
him/her, go back to the key and have the participant indicate the correct
answer.
Trial
When the practice squares are completed, say:
‘Starting from here you will continue this task until I tell you
to stop. Do not skip any squares. Work quickly. Do not
worry about how well you draw the symbols.’
‘Begin hier en hou aan met hierdie taak totdat ek jou sê om op te hou.
Moenie blokkies oorslaan nie. Werk vinnig. Moenie bekommerd wees
oor hoe goed jy die simbole teken nie.’
Say: ‘Start now !’ ‘Begin nou’
The researcher must now start the stopwatch and at the end of 90 seconds, say:
‘Stop’ ‘Stop’
377

Scoring
Use the Digit Symbol Scoring Stencil to count the number of items filled in correctly. If a symbol is
a little different in form or orientation from the correct symbol, count it as correct as long as it does
not look at all like any other symbol. If you have a doubt, make a note of this on the record form but
score the test using your best judgement.
SCORE
The number of symbols correctly filled in.
Additional advice to researcher
Problem: Participant leaves an item out (skips an item)
Action: Without interrupting the trial say:
‘Do not skip any’ ‘Moenie enige item oorslaan nie’
Problem: Participant systematically fills in only the spaces corresponding
to a given number.
Action: Stop the trial, give the participant a new worksheet and repeat the instructions.
Problem: The rhythm of performance seems too slow. The subject appears to have
under-estimated the request to work quickly.
Action: Without interrupting the trial, say:
‘Work quickly’ ‘Werk vinnig’
Note to the researcher: if you are uncertain about anything please ask the Research
Coordinator
_______________________________________________________________________
(d) Benton Visual Retention Test (Recognition Form)
Introduction
The Benton Visual Retention Test is a test of short term visual memory. It measures the ability to
organise geometrical patterns in space and memorise them.
Materials
The test consists of 20 cards presented in 10 pairs of 2. The first of each pair contains the pattern to
be memorised and the second contains four patterns, one of which is identical to the pattern
378

presented previously. A stopwatch is needed and a record form to record the wrong answer and
how many the participant identified correctly – this will be provided to the researcher.
Task of the participant
The participant is given 10 seconds to look at the shape on the card and memorise it. The researcher
then presents the next card with the correct shape as well as confounders. The participant has to
identify the correct shape from among the confounders.
Administering the test
Pre-test arrangements
Sit face-to-face with the subject who is also seated.
Place the closed book containing the 20 cards in front of the participant.
Keeping the book closed, say:
‘I’ll show you some cards, one at a time. Each card illustrates one
or more geometric patterns. You have to look at it carefully for 10 seconds.
After that time I will show you another card reproducing the pattern(s)
you have already seen and 3 others differing in some small details.
Your task is to recognise the right one(s). Remember to look at the cards all
the time I give you, even when you feel that the patterns are easy to remember.’
‘Ek gaan jou ‘n paar kaarte wys, een op ‘n tyd. Elke kaart wys een of meer
geometriese patrone. Jy moet versigtig daarna kyk vir 10 sekondes.
Daarna sal ek jou nog ‘n kaart wys met dieselfde patrone wat jy nou net gesien het
maar met nog 3 ander wat op ‘n klein mate verskil van mekaar. Jou taak is om die
regte een te identifiseer. Onthou asseblief om na die kaarte te kyk vir so lank
as wat jy tyd het, al voel jy dat die patrone maklik is om te onthou.’
Trial Open the book to the first card and start the stopwatch.
After 10 seconds, turn the page to the next card – the card with the confounders.
The participant has to identify the correct shape.
If the participant does not respond within about 10 seconds, say this:
‘Please make a choice even if you are not sure’ ‘Maak asseblief ‘n keuse
al is jy nie seker nie.’
If they still do not respond or if they state that they do not remember, make a note on the record form
marking it wrong and say:
‘We will go onto the next card’ ‘Ons sal aangaan met die volgende kaart’
Immediately record the participant’s answer (A, B, C or D) on the record form.
Show the second card to the participant and proceed in the same way.
379

Before proceeding to the third card say:
‘Remember to look at the patterns for the whole time I give you’
‘Onthou om na die patrone te kyk die heel tyd wat ek jou gee’
Scoring
The score is the number of patterns correctly identified.
The correct answers are:
1. D 6. D
2. A 7. B
3. C 8. A
4. C 9. A
5. B 10. C
Additional advice to researcher
Problem: The participant glances at the card, says ‘Okay,’ and looks around.
Action: Repeat the instructions:
‘Look at the patterns all the time I give you. These may be simple patterns,
but others may be more complex.’
‘Kyk na al die patrone al die tyd wat ek jou gee. Hierdie mag eenvoudige patrone
wees, maar ander mag meer moeilik wees.’
___________________________________________________________________________
(e) Pursuit Aiming Test II
Introduction
The Pursuit Aiming Test originates from Fleischman’s (1954) psychomotor battery of tests and
measures the ability to make quick and accurate movements with the hand.
Materials
A printed Pursuit Aiming Test sheet, a sharp HB pencil and a stopwatch are required for this test and
will be supplied by the Research Coordinator. A pencil sharpener is required to sharpen the pencil
periodically.
380

Task of the participant
The participant’s task is to make a dot inside every 2mm diameter circle without touching the
outside line of the circle. The participant must follow the pattern on the test sheet. This task must be
done as quickly as possible.
Administering the test
Pre-test arrangements
The participant must be seated.
Hand the participant the test sheet and a pencil.
Say:
‘Look at this sheet with the small circles. Your task is to put a dot
inside each circle while trying not to touch the outside line. You must follow
the pattern shown by the arrows’ (Researcher shows the participant the direction).
‘Kyk na hierdie bladsy met die klein sirkels. Jou taak is om ‘n merkie binne elke
sirkel te maak sonder om die buitenste lyn te raak. Jy moet die rigting volg soos
die pyltjies aandui.’
Begin ↓
---------- > O O O O O O O O O O O O O O O O O O O O O O O O
O
O O O O O O O O O O O O O O O O O O O O O O O O←
O
→ O O O O O O O O O O O O O O O O O O O O O O O O
Say: ‘Work as rapidly as you can, but do not let your pencil touch the line
of the circles; your dots need not be heavy but make sure they can be
easily seen. Practice for a while placing dots here.’
‘Werk so gou as wat jy kan, maar moenie dat die potlood die buitenste
lyn van die sirkels raak nie; die merkies hoef nie dik te wees nie maar
maak seker dat hulle maklik gesien kan word. Oefen so ‘n rukkie en maak
merkies hier.’
Let the participant perform the practice trial indicated on the practice sheet.
The Researcher should watch the participant to see that he/she performs the task according the
instructions. If the participant works too slowly, without interrupting the practice trial tell him/her
to:
‘Work quickly’ ‘Werk vinnig’
Trial 1
381

Say:
‘Now you are ready to start the task: begin here, and continue until
I ask you to stop. Please begin now.’
‘Nou is jy gereed om met die taak te begin: begin hier, en hou aan totdat
ek jou vra om op te hou. Begin asseblief nou.’
Stop after 60 seconds. Say:
‘Stop now; thank you. You have to do it once again, but first try to
relax your hand.’ (Make a mark where the first trial ended)
‘Hou nou op asseblief; dankie. Jy moet dit weer doen, maar probeer eers
om jou hand te laat ontspan.’
Trial 2
After 30 seconds of rest, say:
‘Are you ready to start again? Please take your pencil and begin
with trial 2 here’
‘Is jy gereed om weer te begin? Neem asseblief jou potlood en begin
met die tweede oefen sessie hier’
Researcher points to that part of the test form to be used by the participant and says:
‘Begin now’ ‘Begin nou’
Stop after 60 seconds.
Say:
‘Stop now; thank you.’ ‘Stop nou; dankie’
Scoring
Count the sum of correct dots from both trials.
Count the sum of incorrect dots from both trials (those touching the line of the circle or outside the
circle).
Total the number of dots attempted from the two trials.
382

Additional advice to researcher
Problem: Some unexpected disturbance occurs during the test
Action: Interrupt the trial and start over again
Thank the participant and mark the Tick Sheet on the brown envelope to
indicate which tests have been completed
383

APPENDIX F
GLOSSARY AND ABBREVIATIONS
384

GLOSSARY AND LIST OF ABBREVIATIONS
AChE Acetylcholinesterase
AENTB Adult Environmental Neurobehavioural Test Battery
AGRICOH International Consortium of Agricultural Studies
AHS Agricultural Health Study
APA American Psychological Association
BSI Brief Symptom Inventory
CI Confidence Interval
CNS Central nervous system
DBSA Development Bank of South Africa
DOH Department of Health
EurepGAP Euro-Retailer Produce Partnership of Agricultural Producers and retail
customers
established to develop accepted standards and procedures for the global
certification of Good Agricultural Practices (up to 2007)
F1 First quarterly audit follow-up
F2 Second quarterly audit follow-up
FQA Final quarterly audit
GDP Gross Domestic Product
GlobalGap EurepGAP changed its name to GLOBALG.A.P. in 2007
GSI Global Severity Index (part of the global indices of the Brief Symptom
Inventory)
IQR Inter-quartile range
ILO International Labour Organisation
IMS Intermediate Syndrome
IPM Integrated Pest Management
385

JEM Job exposure matrix
MRI Magnetic Resonance Imaging
NDA National Department of Agriculture
NES Neurobehavioural Evaluation System
NIOSH United States National Institute for Occupational Safety and Health
OP Organophosphate pesticide
OPICN Organophoshorous ester-induced chronic neurotoxicity
OR Odds ratio
PET Positron Emission Tomography
PSDI Positive Symptom Distress Index (part of the global indices of the Brief
Symptom Inventory)
PST Positive Symptom Total (part of the global indices of the Brief Symptom
Inventory)
PPE Personal Protective Equipment
SADHS South African Demographic and Health Survey
SES Socio-economic status
UCT University of Cape Town
WHO World Health Organisation
WHO NCTB World Health Organisation Neurobehavioral Core Test Battery
386

APPENDIX G
NEUROBEHAVIOURAL TEST
BATTERY SCORE SHEET
387

Neurobehavioural Test Battery
a) Any evidence leg deformity interfering with sensation? Yes No
1. Vibration Sense Testing
Extinction Time 1 (sec)
Extinction Time 2 (sec)
Extinction Time 3 (sec)
2. WHO Neurobehavioural Core Test Battery sub-tests
Digit Span Span Forward
Span Backward
Total Raw Score
Age
WAIS-R Standardised score
Benton Visual R Total Score
x Dropped Total
Santa Ana Trials 1 (dominant hand)
Trials 2 (non-dominant hand)
Trials 3 (dominant hand)
Trials 4 (non-dominant hand)
Digit Symbol Total correct
Age
WAIS-R Standardised score
x Total Attempted
Pursuit Aiming Trial 1
Trial 2
Total trials 1 and 2
= Correct X = Wrong
388

APPENDIX H
ADDITIONAL BIVARIATE
RESULTS
(Tables H1 to H5)
389

Table H1 Change in neurobehavioural outcomes by gender
Outcome Males Females
P-value Mean
(SD)
Median
(IQR)
Mean
(SD)
Median
(IQR)
Digit Span
Forward
(n=183)
91.1
(32.7)
(n=183)
83
(71.4-100.0)
(n=90)
91.1
(29.7)
(n=90)
86
(71.4-100.0)
0.72
Backward
(n=175)
100.8
(37.0)
(n=175)
100
(80.0-120.0)
(n=89)
102.2
(41.7)
(n=89)
100
(75.0-120.0)
0.75
Backward
Log
transformed
score
(n=170)
2.0
(0.1)
(n=170)
2
(1.9-2.1)
(n=88)
2.0
(0.2)
(n=88)
2
(1.9-2.1)
0.67
Wais-III Std
Score
(n=183)
96.0
(20.3)
(n=183)
100
(83.3-100.0)
(n=90)
93.7
(19.4)
(n=90)
94
(80.0-100.0)
0.37
Log
transformed
score
(n=183)
2.0
(0.1)
(n=183)
2
(1.9-2.0)
(n=90)
2.0
(0.1)
(n=90)
2
(1.9-2.0)
0.38
Digit Symbol Substitution
Wais-III Std
Score
(n=170)
104.6
(16.5)
(n=170)
100
(100.0-116.7)
(n=87)
104.3
(12.9)
(n=97)
100
(100.0-114.3)
0.84
Benton Visual Retention Test
Number
Correct
(n=183)
114.2
(55.7)
(n=183)
100
(83.3-133.3)
(n=90)
104.7
(39.5)
(n=90)
100
(77.8-116.7)
0.24
Santa Ana Pegboard
Dom. hand
total
(n=182)
109.1
(23.4)
(n=182)
107
(94.64-119.5)
(n=90)
111.3
(24.7)
(n=90)
108
(96.8-124.3)
0.54
Non-dom.
hand total
(n=182)
110.8
(31.5)
(n=182)
105
(95.8-116.1)
(n=90)
108.9
(25.1)
(n=90)
103
(93.8-116.2)
0.68
Pursuit Aiming II Test
Total correct
(n=165)
101.6
(92.0)
(n=165)
80
(48.4-126.4)
(n=87)
104.21
(82.2)
(n=87)
82
(43.5-135.6)
0.76
Brief Symptom Inventory
GSI
(n=182)
100.3
(19.4)
(n=182)
100
(87.5-111.1)
(n=90)
97.7
(16.2)
(n=90)
95
(87.0-106.8)
0.22
Swedish Q16
Total score
(n=133)
125.0
(114.6)
(n=133)
100
(42.9-166.7)
(n=78)
122.1
(88.6)
(n=78)
100
(57.1-166.7)
0.46
Log
transformed
score
(n=125)
2.0
(0.4)
(n=125)
2
(1.7-2.3)
(n=77)
2.0
(0.3)
(n=77)
2
(1.8-2.2)
0.84
390

Table H2 Change in neurobehavioural outcomes by language
Vibration Sense threshold
Total score (n=180)
107.7
(53.5)
(n=180)
94
(75.0-129.0)
(n=90)
109.2
(54.48)
(n=90)
95.8
(70.8-135.7)
0.88
Log
transformed
score
(n=180)
2.0
(0.2)
(n=180)
2
(1.9-2.1)
(n=90)
2.0
(0.21)
(n=90)
2
(1.9-2.1)
0.94
Outcome Afrikaans-speaking Non-Afrikaans-speaking
P-value Mean
(SD)
Median
(IQR)
Mean
(SD)
Median
(IQR)
Digit Span
Forward
(n=242)
91.1
(32.3)
(n=242)
85
(71.4-100.0)
(n=31)
90.7
(27.1)
(n=31)
83
(66.7-100.0)
0.94
Backward
(n=235)
102.5
(38.7)
(n=235)
100.0
(75.0-125.0)
(n=29)
91
(36.5)
(n=29)
100
(80.0-100.0)
0.38
Backward
Log
transformed
score
(n=226)
2.0
(0.1)
(n=226)
2
(1.9-2.1)
(n=27)
2.0
(0.1)
(n=27)
2
(1.9-2.0)
0.46
Wais-III Std
Score
(n=242)
95.5
(20.5)
(n=242)
100
(83.3-100.0)
(n=31)
93.6
(15.8)
(n=31)
100
(83.3-100.0)
0.91
Log
transformed
score
(n=242)
2.0
(0.1)
(n=242)
2
(1.9-2.0)
(n=31)
2.0
(0.1)
(n=31)
2
(1.9-2.0)
0.73
Digit Symbol Substitution
Wais-III Std
Score
(n=228)
104.8
(15.4)
(n=228)
100.0
(100.0-116.7)
(n=29)
102
(15.2)
(n=29)
100.0
(100.0-100.0)
0.32
Benton Visual Retention Test
Number
Correct
(n=242)
112.4
(51.6)
(n=242)
100
(83.3-125.0)
(n=31)
100.7
(46.7)
(n=31)
100.0
(75.0-133.3)
0.18
Santa Ana Pegboard
Dom. hand
total
(n=241)
110.0
(23.9)
(n=241)
107
(96.0-120.6)
(n=31)
108.1
(23.82)
(n=31)
106
(89.0-122.5)
0.66
Non-dom.
hand total
(n=241)
109.4
(30.0)
(n=241)
103
(94.3-114.3)
(n=31)
116.0
(24.8)
(n=31)
113
(102.8-127.3)
0.01
Pursuit Aiming II Test
Total correct
(n=222)
104.3
(92.0)
(n=222)
81
(44.0-130.4)
(n=30)
88.9
(68.9)
(n=30)
82
(45.1-112.1)
0.29
391

Table H3 Change in neurobehavioural outcomes by current alcohol consumption
Brief Symptom Inventory
GSI
(n=242)
99.1
(18.7)
(n=242)
96
(87.3-110.4)
(n=30)
101.3
(15.8)
(n=30)
104
(89.1-110.4)
0.27
Swedish Q16
Total score
(n=197)
128.7
(106.6)
(n=197)
100
(50.0-180.0)
(n=14)
56.8
(58.4)
(n=14)
33
(25.0-50.0)
0.00
Log
transformed
score
(n=189)
2.0
(0.4)
(n=189)
2.0
(1.7-2.3)
(n=13)
1.7
(0.3)
(n=13)
1.5
(1.5-1.7)
0.00
Vibration Sense threshold
Total score (n=234)
109.8
(54.6)
(n=234)
97
(74.2-133.3)
(n=31)
93.4
(32.4)
(n=31)
84
(71.0-107.4)
0.13
Log
transformed
score
(n=239)
2.0
(0.2)
(n=239)
2
(1.9-2.1)
(n=31)
2.0
(0.1)
(n=31)
2
(1.9-2.0)
0.24
Outcome Current alcohol
consumption
No alcohol consumption
P-value
Mean
(SD)
Median
(IQR)
Mean
(SD)
Median
(IQR)
Digit Span
Forward
(n=175)
89.9
(30.6)
(n=175)
83.3
(71.4-100.0)
(n=98)
93.1
(33.6)
(n=98)
86
(71.43-110.0)
0.45
Backward
(n=167)
102.2
(35.7)
(n=167)
100
(80.0-100.0)
(n=97)
99.8
(43.2)
(n=97)
100
(75.0-125.0)
0.491
Backward
Log
transformed
score
(n=163)
2.0
(0.1)
(n=163)
2
(1.9-2.1)
(n=27)
2.0
(0.2)
(n=27)
2
(1.9-2.1)
0.46
Wais-III Std
Score
(n=175)
95.5
(19.9)
(n=175)
100
(83.3-100.0)
(n=98)
94.8
(20.2)
(n=98)
100
(80.0-100.0)
0.75
Log
transformed
score
(n=175)
2.0
(0.1)
(n=175)
2
(1.9-2.0)
(n=98)
2.0
(0.1)
(n=98)
2
(1.9-2.0)
0.72
Digit Symbol Substitution
Wais-III Std
Score
(n=167)
105.1
(14.4)
(n=167)
100
(100.0-116.7)
(n=90)
103.3
(16.9)
(n=90)
100
(100.0-116.7)
0.26
Benton Visual Retention Test
Number
Correct
(n=175)
111.2
(51.6)
(n=175)
100
(80.0-125.0)
(n=98)
110.9
(50.4)
(n=98)
100
(83.3-125.0)
0.55
392

Table H4 Change in neurobehavioural outcomes by problem alcohol use (CAGE
score)
Santa Ana Pegboard
Dom. hand
total
(n=174)
108.2
(22.8)
(n=174)
106
(94.6-117.5)
(n=98)
112.7
(25.4)
(n=98)
108
(97.5-125.6)
0.14
Non-dom.
hand total
(n=175)
111.7
(31.5)
(n=175)
106
(95.6-117.8)
(n=97)
107.4
(25.6)
(n=97)
102
(92.7-113.3)
0.21
Pursuit Aiming II Test
Total correct
(n=162)
109.0
(98.4)
(n=162)
81
(50.0-133.3)
(n=90)
90.8
(70.2)
(n=90)
78
(37.2-125.0)
0.22
Brief Symptom Inventory
GSI
(n=175)
100.3
(18.1)
(n=175)
100
(88.75-112.5)
(n=97)
97.7
(19.0)
(n=97)
95
(86.7-107.3)
0.13
Swedish Q16
Total score
(n=134)
123.3
(103.2)
(n=134)
100
(50.0-166.7)
(n=77)
125.1
(110.2)
(n=77)
100
(42.9-180.0)
0.92
Log
transformed
score
(n=130)
2.0
(0.4)
(n=130)
2
(1.7-2.2)
(n=72)
2.0
(0.4)
(n=72)
2
(1.7-2.3)
0.74
Vibration Sense threshold
Total score (n=173)
113.0
(52.7)
(n=173)
105
(75.7-134.6)
(n=92)
98.2
(51.5)
(n=92)
87
(67.5-111.6)
0.01
Log
transformed
score
(n=174)
2.0
(0.2)
(n=174)
2
(1.9-2.1)
(n=96)
2.0
(0.2)
(n=96)
2
(1.8-2.1)
0.01
Outcome Cage score ≥ 2 Cage score <2
P-value Mean
(SD)
Median
(IQR)
Mean
(SD)
Median
(IQR)
Digit Span
Forward
(n=133)
91.2
(30.4)
(n=133)
86
(71.4-100.0)
(n=140)
91.0
(33.0)
(n=140)
83.33
(71.4-110.0)
0.77
Backward
(n=128)
102.1
(36.0)
(n=128)
100.0
(80.0-125.0)
(n=136)
100.5
(41.0)
(n=136)
100.0
(75.0-110.0)
0.48
Backward
Log
transformed
score
(n=132)
2.0
(0.1)
(n=132)
2
(1.9-2.0)
(n=136)
2.0
(0.1)
(n=136)
2
(1.9-2.0)
0.43
Wais-III Std
Score
(n=133)
96.4
(20.4)
(n=133)
100.0
(83.33-100.0)
(n=140)
94.16
(19.59)
(n=140)
100.0
(80.90-100.0)
0.29
393

Log
transformed
score
(n=133)
2.0
(0.1)
(n=133)
2
(1.9-2.0)
(n=140)
2.0
(0.1)
(n=140)
2
(1.9-2.0)
0.36
Digit Symbol Substitution
Wais-III Std
Score
(n=127)
104.3
(14.0)
(n=127)
100.0
(100.0-116.7)
(n=130)
104.62
(16.6)
(n=130)
100.0
(100.0-116.7)
0.93
Benton Visual Retention Test
Number
Correct
(n=133)
109.5
(42.8)
(n=133)
100
(83.3-125.0)
(n=140)
112.6
(58.0)
(n=140)
100
(78.9-133.3)
0.95
Santa Ana Pegboard
Dom. hand
total
(n=133)
108.8
(23.76)
(n=133)
107
(95.2-119.2)
(n=139)
111.0
(24.0)
(n=139)
107
(95.1-122.2)
0.53
Non-dom.
hand total
(n=133)
111.0
(33.4)
(n=133)
104
(95.4-115.2)
(n=139)
109.3
(25.4)
(n=139)
104
(93.9-116.7)
0.90
Pursuit Aiming II Test
Total correct
(n=121)
117.0
(108.3)
(n=121)
89
(50.9-130.4)
(n=131)
89.1
(65.6)
(n=131)
78
(42.4-125.4)
0.12
Brief Symptom Inventory
GSI
(n=133)
98.74
(18.1)
(n=133)
96.0
(87.5-111.1)
(n=139)
99.96
(18.8)
(n=139)
98
(87.3-110.3)
0.72
Swedish Q16
Total score
(n=113)
124.63
(103.7)
(n=113)
100
(50.0-150.0)
(n=98)
123.1
(108.1)
(n=98)
100
(42.9-180.0)
0.62
Log
transformed
score
(n=110)
1.97
(0.4)
(n=110)
2
(1.7-2.2)
(n=92)
2.0
(0.4)
(n=92)
2
(1.70-2.3)
0.96
Vibration Sense threshold
Total score (n=131)
112.2
(49.3)
(n=131)
106
(75.0-136.0)
(n=134)
103.63
(55.7)
(n=134)
92
(71.0-117.4)
0.05
Log
transformed
score
(n=132)
2.0
(0.2)
(n=132)
2
(1.9-2.1)
(n=138)
2.0
(0.2)
(n=138)
2
(1.9-2.1)
0.07
394

Table H5 Change in neurobehavioural outcomes by head injury
Outcome Head injury No head injury
P-value Mean
(SD)
Median
(IQR)
Mean
(SD)
Median
(IQR)
Digit Span
Forward
(n=30)
80.1
(27.9)
(n=30)
75
(60.0-100.0)
(n=243)
92.4
(31.9)
(n=243)
86
(71.4-100.0)
0.04
Backward
(n=29)
100.5
(39.5)
(n=29)
100
(75.0-125.0)
(n=235)
101.3
(38.8)
(n=235)
100
(75.0-120.0)
0.94
Backward
Log
transformed
score
(n=28)
2.0
(0.1)
(n=28)
2
(1.9-2.10)
(n=230)
2.0
(0.14)
(n=230)
2
(1.90-2.08)
0.86
Wais-III Std
Score
(n=30)
93.0
(18.1)
(n=30)
88
(83.3-100.0)
(n=243)
95.5
(20.2)
(n=243)
100
(83.3-100.0)
0.56
Log
transformed
score
(n=30)
2.0
(0.1)
(n=30)
2
(1.9-2.0)
(n=243)
2.0
(0.09)
(n=243)
2
(1.9-2.0)
0.55
Digit Symbol Substitution
Wais-III Std
Score
(n=29)
104.2
(15.28)
(n=29)
100
(100.0-120.0)
(n=228)
104.5
(15.37)
(n=228)
100
(100.0-116.67)
0.92
Benton Visual Retention Test
Number
Correct
(n=30)
126.7
(73.8)
(n=30)
112
(87.5-133.3)
(n=243)
109.2
(47.4)
(n=243)
100
(80.0-125.0)
0.16
Santa Ana Pegboard
Dom. hand
total
(n=30)
114.79
(27.9)
(n=30)
108
(95.4-125.0)
(n=242)
109.2
(23.3)
(n=242)
106
(95.12-120.6)
0.49
Non-dom.
hand total
(n=30)
104.5
(16.8)
(n=30)
102
(96.9-113.5)
(n=242)
110.8
(30.7)
(n=242)
104.26
(95.0-117.8)
0.64
Pursuit Aiming II Test
Total correct
(n=28)
133.7
(96.2)
(n=28)
106
(75.0-203.1)
(n=224)
98.6
(88.2)
(n=224)
77
(43.4-126.1)
0.04
Brief Symptom Inventory
GSI
(n=30)
96.1
(16.9)
(n=30)
96
(81.8-111.1)
(n=242)
99.8
(18.6)
(n=242)
97
(88.1-110.4)
0.40
Swedish Q16
Total score
(n=23)
142.0
(100.4)
(n=23)
125
(50.0-200.0)
(n=191)
120.85
(105.6)
(n=191)
100
(50.0-150.0)
0.19
Log
transformed
score
(n=22)
2.0
(0.4)
(n=22)
2
(1.8-2.3)
(n=183)
1.96
(0.4)
(n=183)
2
(1.7-2.2)
0.37
Vibration Sense threshold
Total score (n=29) (n=29) (n=241) (n=241)
395

98.6
(32.5)
89
(78.6-112.9)
109.35
(55.7)
95.45
(72.7-131.6)
0.67
Log
transformed
score
(n=29)
2.0
(0.1)
(n=29)
2
(1.9-2.1)
(n=241)
2.0
(0.2)
(n=241)
2
(1.9-2.1)
0.66
396

APPENDIX I
ADDITIONAL ADJUSTED
MULTIVARIATE LOGISTIC
REGRESSION RESULTS
(Baseline study)
(Tables I(a) to I(h)
397

Table I(a). Adjusted regression results for neurobehavioural outcomes with Baseline - B_Opdys excluding and including past poisoning
Ignoring Past Poisoning Including Past Poisoning
Outcome N OR P-value* CI N OR P-value* CI
Digit Span
Forward
70
1.50
0.55
0.41 – 5.53
51
0.72
0.71
0.13 – 3.98
PPoisnd_pre - - - - - 1.53 0.66 0.23 – 10.21
Backward 70 0.39 0.27 0.07 – 2.08 48 0.40 0.40 0.05 – 3.39
PPoisnd_pre - - - - - 0.19 0.27 0.01 – 3.58
Low Schooling - - - - - 7.42 0.05 1.02 – 53.95
Wais-R Std score 70 0.74 0.67 0.19 – 2.90 51 0.57 0.53 0.10 – 3.29
PPoisnd_pre - - - - - 1.25 0.82 0.19 – 8.47
Digit Symbol
Wais-R Std score 68 0.04 0.07 1.19x10⁻³
– 1.37 40 - - -
PPoisnd_pre - - - - - 1.49 0.77 0.11 – 20.36
Low SES - 25.50 0.02 1.54 – 423.06
- - - -
Benton
Total no. correct 70 0.08 0.10 3.83x10⁻³
– 1.63 46 0.08 0.13 2.67x10⁻³
– 2.14
PPoisnd_pre - - - - - 1.43 0.78 0.12 – 17.56
Gender - 199.14 0.04 1.42 – 27996.03 - - - -
Low SES - 203.11 0.01 5.02 – 8210.37 - 49.15 0.04 1.31 – 1843.65
Santa Ana
Dom. hand tot corr 70 0.85 0.86 0.13 – 5.37 51 1.03 0.98 0.12 – 8.58
PPoisnd_pre - - - - - 0.30 0.46 0.01 – 7.38
Non-dom. hand corr 61 0.25 0.22 0.03 – 2.33 41 0.39 0.48 0.03 – 5.30
PPoisnd_pre - - - - - - - -
Low SES - 21.99 0.01 1.98 – 244.20 - - - -
398

Pursuit Aiming
Total no. corr Inestimable 40 - - -
PPoisnd_pre - - - - - 0.10 0.19 3.25x10⁻³
– 3.09
BSI / GSI 64 0.33 0.27 0.05 – 2.34 39 0.33 0.40 0.03 – 4.19
PPoisnd_pre - - - - - - - -
Q16 70 1.39 0.68 0.29 – 6.70 45 3.99 0.20 0.48 – 33.32
PPoisnd_pre - - - - - 2.24 0.57 0.14 – 36.03
Low Schooling - - - - - 10.03 0.03 1.29 – 78.04
Vibration sense 60 0.08 0.08 4.73x10
-3 – 1.31 34 - - -
PPoisnd_pre - - - - - 4.85 0.24 0.34 – 68.34
*Adjusted for confounders age, gender, education, language, current alcohol consumption, head injury, psychiatric illness, low SES
399

Table (I(b). Adjusted regression results for neurobehavioural outcomes with Baseline - B_Opdys excluding and including alcohol use
Excluding Alcohol Use Including Alcohol Use
Outcome N OR P-value* CI N OR P-value* CI
Digit Span
Forward
20
Inestimable
45
2.69
0.25
0.50 – 14.47
Backward 13 0.13 0.23 4.92x10⁻³
– 3.61 43 0.54 0.57 0.06 – 4.62
Low Schooling - - - - - 9.67 0.03 1.24 – 75.22
Wais-R Std score 22 0.14 0.22 6.48x10⁻³
– 3.19 47 1.54 0.62 0.29 – 8.27
Low Schooling - - - - - 6.85 0.04 1.14 – 41.32
Digit Symbol
Wais-R Std score 7 Inestimable 44 0.07 0.16 1.93x10⁻³
– 2.86
Low SES - - - - - 36.75 0.01 2.37 – 569.89
Benton
Total no. correct 7 Inestimable 43 0.25 0.43 0.01 – 7.79
Low SES - - - - - 65.49 0.02 2.21 – 1941.32
Santa Ana
Dom. hand tot corr 13 Inestimable 27 0.80 0.87 0.05 – 12.07
Non-dom. hand corr 11 0.75 0.86 0.03 – 17.51 41 0.18 0.35 4.68x10⁻³
– 6.64
Language - - - - - 0.04 0.04 1.56x10⁻³
– 0.83
Low SES - - - - - 97.36 0.02 2.24 – 4227.39
Pursuit Aiming
Total no. corr 13 - - - 46 Inestimable
BSI / GSI 11 2.50 0.58 0.10 – 62.60 41 0.20 0.24 0.01 – 2.91
Q16 15 12 0.15 0.39 – 366.19 41 0.16 0.25 6.49x10⁻³
– 3.79
Vibration sense 20 Inestimable 28 - - -
*Adjusted for confounders age, gender, education, language, current alcohol consumption, head injury, psychiatric illness, low SES
400

Table I(c) Baseline adjusted logistic regression results for neurobehavioural outcome-exposure relationships:
OP jemdays weighted for crop type (B_OPjmcrp25)
Exposure variable - B_OPjmcrp25
Adjusted associations
Significant covariates in the model*
Dichotomised outcomes N OR 95% CI p-value Covariates OR (95% CI)
Digit Span Forward 319 1.17 0.43 – 3.21 0.76 None
Digit Span Backward 319 0.67 0.20 – 2.24 0.52 Low schooling
Prev. head injury 2.24; 1.19 - 4.23 0.29; 0.11 - 0.79
Digit Span Wais 319 1.11 0.40 – 3.03 0.20 Low schooling 1.73; 1.03 - 2.92
Digit Symbol Wais** 303 0.23 0.04 – 1.46 0.12 Low age
Low schooling Language
Curr. alcohol use SES
0.25; 0.11 - 0.59 7.19; 2.20 - 23.53 0.18; 0.07 - 0.48 4.80; 1.92 - 12.01 3.74; 1.49 - 9.42
Benton VRT** 319 0.46 0.12 – 1.77 0.26 Low schooling Language
2.29; 1.14 - 4.60 0.18; 0.09 - 0.38
Santa Ana dom. hand 319 0.62 0.18 – 2.16 0.46 Low age 0.45; 0.24 - 0.82
Santa Ana non-dom.
hand** 317 1.14 0.37 – 3.57 0.82 Language
Prev. head injury 0.40; 0.19 - 0.83 0.31; 0.10 - 0.95
401

Notes: *For low age and low schooling median cut off values were used where low age = 1 and high age = 0 and low schooling = 1 and high
schooling = 0. Language was categorised as 1 for Afrikaans speakers and 0 for non-Afrikaans speakers
** Language was selected in model building for this outcome and included in the model together with all the other a priori covariates
(age, gender, schooling, previous head injury, psychiatric illness and low socio-economic status)
Exposure variable -
B_OPjmcrp25
Adjusted associations
Significant covariates in the model* Dichotomous outcomes N OR 95% CI p-value Covariates OR
Pursuit Aiming 301 0.39 0.09 – 1.63 0.20 Low age Low schooling
0.24; 0.12 - 0.46 2.60; 1.26 - 5.33
BSI/GSI 318 0.55 0.15 – 2.10 0.38 Psychiatric illness 15.16; 1.52 -150.91
Swedish Q16** 319 0.63 0.18 – 2.27 0.49 Low schooling
2.31; 1.25 - 4.25
Vibration Sense Test 294 1.20 0.65 – 2.21 0.57 None
402

Table I(d). Baseline adjusted logistic regression results for neurobehavioural outcome-exposure relationships:
OP jemdays weighted for crop type divided by number of job years (Intensity variable) (B_OPjmcrppa25)
Exposure variable - B_OPjmcrppa25
Adjusted associations
Significant covariates in the model*
Dichotomised outcomes N OR 95% CI p-value Covariates OR (95% CI)
Digit Span Forward 319 1.09 0.40 – 2.96 0.86 None
Digit Span Backward 319 0.54 0.16 – 1.76 0.31 Low schooling
Prev. head injury 2.25; 1.20 - 4.25 0.28; 0.10 - 0.78
Digit Span Wais 319 0.60 0.22 – 1.63 0.31 Low schooling 1.71; 1.01 - 2.88
Digit Symbol Wais** 303 0.31 0.06 – 1.58 0.16 Low age
Low schooling Language
Curr. alcohol use SES
0.25; 0.10 - 0.58 7.06; 2.17 - 22.92 0.20; 0.08 - 0.50 5.12; 2.02 - 12.98 3.55; 1.43 - 8.85
Benton VRT** 319 0.44 0.12 – 1.65 0.22 Low schooling Language
2.30; 1.14 - 4.62 0.18; 0.09 - 0.39
Santa Ana dom. hand 319 1.11 0.38 – 3.26 0.85 Low age 0.46; 0.25 - 0.86
Santa Ana non-dom.
hand** 317 0.66 0.20 – 2.16 0.50 Language
Prev. head injury 0.38; 0.18 - 0.80 0.30; 0.10 - 0.93
403

*For low age and low schooling median cut off values were used where low age = 1 and high age = 0 and low schooling = 1 and high
schooling = 0. Language was categorised as 1 for Afrikaans speakers and 0 for non-Afrikaans speakers
** Language was selected in model building for this outcome and included in the model together with all the other a priori covariates
(age, gender, schooling, previous head injury, psychiatric illness and low socio-economic status)
Exposure variable -
B_OPjmcrppa25
Adjusted associations
Significant covariates in the model* Dichotomous outcomes N OR 95% CI p-value Covariates OR
Pursuit Aiming 301 0.39 0.11 – 1.37 0.14 Low age Low schooling
0.23; 0.12 - 0.44 2.63; 1.28 - 5.41
BSI/GSI 318 0.50 0.13 – 1.96 0.32 Psychiatric illness 14.11; 1.45 -137.60
Swedish Q16** 319 0.63 0.19 – 2.11 0.45 Low schooling
2.32; 1.26 - 4.28
Vibration Sense Test 310 0.43 0.09 – 1.98 0.28 None
404

Table I(e) Baseline adjusted logistic regression results for dichotomous neurobehavioural outcome-exposure relationships: stratifying for current
alcohol use with B_OP applicators
Exposure variable -
B_OPappl Without current alcohol use With current alcohol use
Significant covariates
in the model
Dichotomous outcomes N OR 95% CI p-value N OR 95% CI p-value Covariate OR (95% CI)
Digit Span Forward 124 0.67 0.24 – 1.85 0.44 192 0.72 0.36 – 1.44 0.35 None
Digit Span Backward 122 0.76 0.25 – 2.37 0.64 195 1.12 0.52 – 2.43 0.78 None
Gender 4.50 1.62 – 12.52
Low Schooling 3.77 1.16 – 12.19
Digit Span Wais 122 1.17 0.43 – 3.14 0.76 195 0.64 0.32 – 1.29 0.21 None
Digit Symbol Wais 71 1.29 0.21 – 7.75 0.78 190 0.49 0.17 – 1.40 0.18 Low Age 0.30; 0.12 – 0.76
Low Schooling 6.28; 1.81 – 21.79
Language 0.20; 0.07 – 0.56
Low SES 4.82; 1.67 – 13.91
Benton VRT 122 0.91 0.28 – 2.93 0.87 195 0.64 0.26 – 1.59 0.34 Language 0.16; 0.06 – 0.41
Santa Ana dom. hand 124 0.90 0.30 – 2.72 0.85 195 0.58 0.24 – 1.40 0.23 Low Age 0.33; 0.15 – 0.72
Santa Ana non-d. hand 122 1.26 0.45 – 3.50 0.66 195 0.99 0.39 – 2.51 0.99 Low Schooling 2.80; 1.10 – 7.12
Language 0.22; 0.09 – 0.56
Prev. Head injury 0.11; 0.01 – 0.88
Pursuit Aiming 113 0.80 0.23 – 2.78 0.72 186 0.72 0.30 – 1.73 0.46 Low Age 0.31; 0.14 – 0.71
Gender 0.24 0.07 – 0.76 Low Schooling 4.03; 1.51 – 10.73
Low Age 0.18 0.05 – 0.59 Low SES 2.78; 1.02 – 7.57
BSI/GSI 123 0.48 0.14 – 1.61 0.23 192 1.25 0.55 – 2.86 0.59 None
Swedish Q16 122 1.30 0.41 – 4.18 0.66 192 0.69 0.30 – 1.59 0.39 Low Schooling 3.56; 1.54 – 8.25
Gender 0.18 0.07 – 0.47 Language 3.54; 1.11 – 11.27
Vibration Sense Test 109 2.56 0.85 – 7.77 0.10 190 0.82 0.35 – 1.88 0.63 None
405

Table I(f). Adjusted regression results for neurobehavioural outcomes with Baseline - B_Allpestdys excluding and including past poisoning
Ignoring Past Poisoning Including Past Poisoning
Outcome N OR P-value* CI N OR P-value* CI
Digit Span
Forward
169 1.29 0.53 0.59 – 2.84 113 1.37 0.55 0.48 – 3.88
PPoisnd_pre - - - - - 3.47 0.03 1.10 – 10.96
Backward 169 0.46 0.13 0.17 – 1.24 113 0.60 0.40 0.18 – 1.99
PPoisnd_pre - - - - - 0.87 0.83 0.25 – 3.06
Wais-R Std score 169 0.94 0.88 0.43 – 2.04 113 1.02 0.96 0.36 – 2.90
PPoisnd_pre - - - - - 2.55 0.11 0.81 – 8.05
Digit Symbol
Wais-R Std score 163 0.02 0.01 1.28x10⁻³
– 0.38 86 2.38 0.32 0.44 – 12.86
PPoisnd_pre - - - - - 0.56 0.66 0.05 – 7.01
Low Schooling - 6.07 0.04 1.12 – 32.99 - - - -
Curr. Alc. Use - 5.78 0.01 1.42 – 23.53 - - - -
Low SES - 6.20 0.01 1.50 – 25.61
- - - -
Benton
Total no. correct 169 0.52 0.24 0.18 – 1.54 98 0.45 0.30 0.10 – 2.07
PPoisnd_pre - - - - - 1.59 0.50 0.42 – 6.05
Low Schooling - 2.93 0.03 1.09 – 7.82 - 4.27 0.04 1.08 – 16.97
Language - 0.25 0.01 0.08 – 0.75 - 0.15 0.04 0.03 – 0.93
Low SES - 2.99 0.04 1.06 – 8.46 - - - -
Santa Ana
Dom. hand tot corr 169 1.06 0.91 0.40 – 2.83 113 3.99 0.06 0.96 – 16.62
PPoisnd_pre
- - - - - 1.07 0.93 0.23 – 4.95
Low Age - 0.34 0.03 0.13 – 0.89 - 0.18 0.02 0.04 – 0.79
Prev. Head injury - - - - - 4.60 0.04 1.07 – 19.82
406

Non-dom. hand corr 168 1.06 0.90 0.40 – 2.80 112 1.61 0.47 0.45 – 5.81
PPoisnd_pre - - - - - 0.54 0.47 0.10 – 2.83
Language - 0.32 0.04 0.11 – 0.93 - - - -
Pursuit Aiming
Total no. corr 163 0.51 0.27 0.15 – 1.69 110 0.69 0.61 0.16 – 2.90
PPoisnd_pre - - - - - 0.13 0.07 0.01 – 1.17
Low Age - 0.22 <0.01 0.08 – 0.61 - - - -
Low Schooling - 3.33 0.05 1.02 – 10.86 - - - -
BSI / GSI 169 0.85 0.72 0.35 – 2.09 113 1.41 0.57 0.43 – 4.60
PPoisnd_pre - - - - - 0.72 0.64 0.18 – 2.84
Q16 70 1.39 0.68 0.29 – 6.70 104 2.35 0.18 0.68 – 8.08
PPoisnd_pre - - - - - 1.83 0.34 0.53 – 6.32
Curr. Alc. Use - - - - - 4.09 0.01 1.33 – 12.58
Vibration sense 145 0.53 0.26 0.17 – 1.59 88 0.91 0.90 0.21 – 3.93
PPoisnd_pre - - - - - 12.43 0.01 2.18 – 70.95
Gender - - - - - 8.80 0.05 1.03 – 75.34
Low SES - 0.13 0.05 0.02 – 1.00 - - - -
*Adjusted for confounders age, gender, education, language, current alcohol consumption, head injury, psychiatric illness, low SES
407

Table I(g). Adjusted regression results for neurobehavioural outcomes with Baseline- past poisoning B_Allpestdys excluding and including
alcohol use
Excluding Alcohol Use Including Alcohol Use
Outcome N OR P-value* CI N OR P-value* CI
Digit Span
Forward
62 0.59 0.45 0.15 – 2.29 105 2.15 0.15 0.76 – 6.14
Backward 60 0.61 0.54 0.13 – 2.90 107 0.36 0.13 0.09 – 1.36
Low Schooling - - - - - 3.18 0.04 1.04 – 9.78
Wais-R Std score 60 0.46 0.24 0.13 – 1.67 107 1.38 0.53 0.50 – 3.82
Digit Symbol
Wais-R Std score 24 - - - 103 0.02 0.03 7.62x10⁻⁴
– 0.65
Gender - - - - - 0.12 0.05 0.01 – 1.00
Low SES - - - - - 9.81 0.01 1.67 – 57.70
Benton
Total no. correct 52 0.31 0.25 0.04 – 2.33 107 0.77 0.71 0.19 – 3.08
Language - - - - - 0.22 0.04 0.05 – 0.94
Santa Ana
Dom. hand tot corr 62 0.99 0.99 0.24 – 4.03 107 1.34 0.71 0.29 – 6.16
Low Age - - - - - 0.11 <0.01 0.02 – 0.48
Non-dom. hand corr 61 1.17 0.82 0.30 – 4.54 95 0.86 0.84 0.20 – 3.64
Language - - - - - 0.23 0.05 0.05 – 0.97
Pursuit Aiming
Total no. corr 42 - - - 104 1.33 0.69 0.33 – 5.33
Low Age - - - - - 0.24 0.02 0.08 – 0.77
Low Schooling - - - - - 6.32 0.02 1.30 – 30.67
BSI / GSI 62 1.86 0.42 0.42 – 8.30 105 0.52 0.30 0.15 – 1.79
408

Q16 60 3.05 0.20 0.56 – 16.51 105 0.93 0.90 0.29 – 2.91
Low Schooling - - - - - 3.64 0.02 1.28 – 10.33
Vibration sense 51 0.21 0.19 0.02 – 2.09 82 0.75 0.67 0.20 – 2.81
*Adjusted for confounders age, gender, education, language, current alcohol consumption, head injury, psychiatric illness, low SES
409

Table I(h) Baseline adjusted logistic regression results for dichotomous neurobehavioural outcome-exposure
relationships: stratifying for past poisoning with B_OPjemdum (past poisoning excluded)
Exposure variable -
B_OPJemdum Without past poisoning
Significant covariates
in the model
Dichotomous outcomes N OR 95% CI p-value Covariate OR (95% CI)
Digit Span Forward
Referent group 249
OPjmdys_1 19 1.17 0.41 – 3.29 0.77 None
OPjmdys_2 16 1.25 0.42 – 3.69 0.69
OPjmdys_3 17 0.29 0.08 – 1.03 0.06
OPjmdys_4 18 0.65 0.20 – 2.11 0.47
Digit Span Backward
Referent group 249
OPjmdys_1 19 0.42 0.11 – 1.63 0.21 Low schooling 2.03; 1.05 – 3.92
OPjmdys_2 16 1.20 0.37 – 3.90 0.77 Prev. head injury 0.26; 0.08 – 0.79
OPjmdys_3 17 1.25 0.41 – 3.77 0.70
OPjmdys_4 18 2.00 0.61 – 6.63 0.25
Digit Span Wais
Referent group 249
OPjmdys_1 19 0.63 0.22 – 1.78 0.38 None
OPjmdys_2 16 0.93 0.31 – 2.78 0.90
OPjmdys_3 17 0.52 0.18 – 1.53 0.24
OPjmdys_4 17 1.22 0.37 – 3.99 0.75
Digit Symbol Wais
Referent group 235
OPjmdys_1 18 0.14 0.02 – 1.00 0.05 Low age 0.20; 0.08 – 0.51
OPjmdys_2 16 0.65 0.12 – 3.62 0.63 Low schooling 6.96; 2.06 – 23.49
410

OPjmdys_3 17 1.85 0.37 – 9.23 0.45 Language 0.17; 0.06 – 0.44
OPjmdys_4 17 0.56 0.10 – 3.06 0.50 Curr. alcohol use 4.51; 1.74 – 11.71
Low SES 4.41; 1.62 – 11.99
Benton VRT
Referent group 249
OPjmdys_1 19 0.35 0.09 – 1.44 0.15 Language 0.16; 0.07 – 0.35
OPjmdys_2 16 0.61 0.14 – 2.64 0.51
OPjmdys_3 17 0.47 0.10 – 2.26 0.34
OPjmdys_4 18 2.12 0.62 – 7.25 0.23
Santa Ana dom. hand
Referent group 249
OPjmdys_1 19 0.82 0.26 – 2.64 0.74 None
OPjmdys_2 16 0.45 0.09 - 2.14 0.32
OPjmdys_3 17 0.69 0.18 -2.69 0.59
OPjmdys_4 18 0.77 0.20 – 3.02 0.71
Santa Ana non-d. hand
Referent group 247
OPjmdys_1 19 0.93 0.29 -2.92 0.90 Low schooling 2.13; 1.09 – 4.17
OPjmdys_2 16 2.46 0.76 – 7.93 0.13 Language 0.44; 0.21 – 0.93
OPjmdys_3 17 0.63 0.16 – 2.51 0.51
OPjmdys_4 18 1.10 0.28 – 4.39 0.89
Pursuit Aiming
Referent group 233
OPjmdys_1 18 0.29 0.07 – 1.23 0.09 Low age 0.28; 0.14 – 0.55
OPjmdys_2 15 1.09 0.29 – 4.10 0.90 Low schooling 2.71; 1.30 – 5.65
OPjmdys_3 17 0.61 0.15 – 2.51 0.50
OPjmdys_4 18 1.85 0.52 – 6.58 0.34
411

BSI/GSI
Referent group 248
OPjmdys_1 19 0.52 0.13 – 2.05 0.35 Curr. alcohol Use 0.54; 0.31 – 0.96
OPjmdys_2 16 1.75 0.55 – 5.57 0.34 Curr. psych. illness 16.84; 1.66 – 170.66
OPjmdys_3 17 0.71 0.20- 2.55 0.60
OPjmdys_4 18 1.55 0.44 – 5.41 0.49
Swedish Q16
Referent group 248
OPjmdys_1 19 0.73 0.22 – 2.42 0.60 Low schooling 2.46; 1.30 – 4.67
OPjmdys_2 15 1.50 0.46 – 4.84 0.50 Language 2.56; 1.04 – 6.28
OPjmdys_3 17 0.71 0.20 – 2.49 0.59
OPjmdys_4 18 0.64 0.16 – 2.49 0.52
Vibration Sense Test
Referent group 246
OPjmdys_1 19 0.27 0.03 – 2.14 0.22 None
OPjmdys_2 15 1.48 0.42 – 5.16 0.54
OPjmdys_3 17 3.68 1.23 – 11.00 0.02
OPjmdys_4 18 0.69 0.14 – 3.33 0.65
412

Table I(i) Baseline adjusted logistic regression results for dichotomous neurobehavioural outcome-exposure relationships: stratifying for current
alcohol use - with B_OPjemdys
Exposure variable -
B_OP Jemdum With current alcohol use Without current alcohol use
Significant covariates
in the model
Dichotomous outcomes N OR 95% CI p-value N OR 95% CI p-value Covariate OR (95% CI)
Digit Span Forward 192 124
Referent group 127
OPjmdys_1 19 1.35 0.34 – 5.47 0.67 0.73 0.15 – 3.47 0.70 None
OPjmdys_2 16 1.14 0.35 – 3.70 0.83 0.66 0.05 – 8.65 0.76
OPjmdys_3 17 0.28 0.05 – 1.45 0.13 0.17 0.02 – 1.61 0.12
OPjmdys_4 18 0.52 0.16 – 1.67 0.27 3.40 0.32 – 36.50 0.31
Digit Span Backward 195 122
Referent group 124
OPjmdys_1 19 0.91 0.20 – 4.15 0.91 0.32 0.03 – 3.09 0.33 Gender 4.42; 1.51 – 12.96
OPjmdys_2 16 0.76 0.19 – 3.05 0.70 10.13 0.48 – 216.07 0.14 Low Schooling 5.17; 1.44 – 18.52
OPjmdys_3 17 1.31 0.29 – 5.85 0.73 0.92 0.16 – 5.24 0.92
OPjmdys_4 18 1.59 0.47 – 5.38 0.46 0.37 0.03 – 4.21 0.42
Digit Span Wais 195 122
Referent group 124
OPjmdys_1 19 0.79 0.20 – 3.08 0.74 0.68 0.15 – 3.16 0.62 None
OPjmdys_2 16 0.62 0.19 – 2.03 0.43 2.38 0.18 – 31.71 0.51
OPjmdys_3 17 0.27 0.06 – 1.21 0.09 1.15 0.22 – 6.02 0.87
OPjmdys_4 18 0.95 0.30 – 3.02 0.93 2.68 0.25 – 28.65 0.41
Digit Symbol Wais 190 61
Referent group 129
OPjmdys_1 18 0.16 0.02 – 1.41 0.10 - ≠ - None
OPjmdys_2 16 0.62 0.11 – 3.46 0.58 - ≠ -
OPjmdys_3 17 0.30 0.02 – 5.46 0.41 12.04 0.86 – 168.76 0.07
OPjmdys_4 17 0.83 0.19 – 3.68 0.81 - ≠ -
Low Age 0.27 0.10 – 0.73
413

Low Schooling 6.47 1.81 – 23.21
Language 0.18 0.06 – 0.51
Low SES 5.52 1.82 – 16.78
Benton VRT 185 119
Referent group 134
OPjmdys_1 19 0.35 0.05 – 2.36 0.28 _1 0.26 0.03 – 2.66 0.26 Language 0.23; 0.06-0.93
OPjmdys_2 16 0.60 0.12 – 2.94 0.53 _3 1.68 0.26 – 10.79 0.58
OPjmdys_3 17 - ≠ - - ≠ -
OPjmdys_4 18 1.60 0.46 – 5.52 0.46 _4 4.25 0.50 – 36.31 0.19
Language 0.14 0.05 – 0.36
Santa Ana dom. hand 195 120
Referent group 124
OPjmdys_1 19 0.82 0.17 – 3.95 0.81 0.89 0.18 – 4.38 0.89 Low Schooling 3.08; 1.03-9.19
OPjmdys_2 16 0.21 0.03 – 1.75 0.15 2.32 0.17 – 31.96 0.53
OPjmdys_3 17 0.40 0.04 – 3.85 0.43 1.26 0.20 – 7.91 0.81
OPjmdys_4 18 0.89 0.25 – 3.22 0.86 - ≠ -
Low Age 0.33 0.15 – 0.73
Santa Ana non-d. hand 195 122
Referent group 123
OPjmdys_1 19 1.05 0.19 – 5.99 0.95 0.95 0.19 – 4.70 0.95 None
OPjmdys_2 16 1.66 0.41 – 6.76 0.48 7.55 0.55 – 102.75 0.13
OPjmdys_3 17 0.34 0.03 – 4.12 0.40 1.02 0.17 – 6.22 0.98
OPjmdys_4 18 0.89 0.17 – 4.56 0.89 0.82 0.07 – 8.89 0.87
Low Schooling 2.82 1.10 – 7.26
Language 0.22 0.09 – 0.58
Prev. Head Injury 0.11 0.01 – 0.91
Pursuit Aiming 176 102
Referent group 143
OPjmdys_1 18 0.43 0.07 – 2.61 0.36 - ≠ - Gender 0.13; 0.03-0.52
OPjmdys_2 15 0.42 0.08 – 2.33 0.32 8.79 0.59 – 130.49 0.11 Low Age 0.17; 0.05-0.61
414

≠ Indeterminate since none of the participants for this corresponding outcome quartile had values within this exposure band
OPjmdys_3 17 - ≠ - 4.01 0.59 – 27.44 0.16
OPjmdys_4 18 2.14 0.62 – 7.40 0.23 - ≠ -
Low Age 0.31 0.13 – 0.74
Low Schooling 3.74 1.37 – 10.18
BSI/GSI 192 119
Referent group 126
OPjmdys_1 19 0.95 0.18 – 5.12 0.96 0.24 0.02 – 2.47 0.23 None
OPjmdys_2 16 1.18 0.29 – 4.74 0.82 4.95 0.38 – 64.25 0.22
OPjmdys_3 17 1.10 0.20 – 5.93 0.91 0.42 0.04 – 4.02 0.45
OPjmdys_4 18 1.69 0.47 – 6.01 0.42
Swedish Q16 192 115
Referent group 126
OPjmdys_1 19 0.38 0.04 – 3.38 0.38 1.83 0.38 – 8.83 0.46 None
OPjmdys_2 16 1.05 0.28 – 3.95 0.94 2.40 0.18 – 32.52 0.51
OPjmdys_3 17 1.13 0.23 – 5.50 0.88 - ≠ -
OPjmdys_4 18 0.45 0.11 – 1.80 0.26 1.85 0.16 – 20.92 0.62
Low Schooling 3.61 1.55 – 8.43
Language 3.56 1.11 – 11.44
Vibration Sense Test 181 109
Referent group 134
OPjmdys_1 19 - ≠ - 0.55 0.06 – 5.15 0.60
OPjmdys_2 15 1.24 0.34 – 4.53 0.75 6.44 0.32 – 129.87 0.22 None
OPjmdys_3 17 1.99 0.47 – 8.31 0.35 7.04 1.18 – 42.05 0.03
OPjmdys_4 18 0.52 0.11 – 2.52 0.42 4.87 0.54 – 43.52 0.16
415

APPENDIX J
ADDITIONAL ADJUSTED
MULTIVARIATE LOGISTIC
REGRESSION RESULTS
(Cohort study)
(Tables J(a) to J(f)
416

Table J(a). Adjusted regression results for neurobehavioural outcomes with Cohort - AllOpdys excluding and including past poisoning
Ignoring Past Poisoning Including Past Poisoning
Outcome N OR P-value* CI N OR P-value* CI
Digit Span
Forward
266 1.77 0.42 0.44 – 7.12 170 2.31 0.30 0.48 – 11.10
PPoisnd_pre - - - - - 2.51 0.06 0.97 – 6.46
Low Age - - - - - 0.41 0.04 0.17 – 0.96
Prev. Head injury - 2.58 0.03 1.11 – 6.01 - - - -
Backward 252 0.39 0.39 0.05 – 3.34 156 1.47 0.50 0.49 – 4.43
PPoisnd_pre - - - - - 0.19 0.27 0.01 – 3.58
Wais-R Std score 266 1.47 0.60 0.35 – 6.22 170 1.86 0.44 0.39 – 8.81
PPoisnd_pre - - - - - 1.69 0.29 0.64 – 4.49
Digit Symbol
Wais-R Std score 253 0.64 0.54 0.16 – 2.64 161 0.77 0.75 0.15 – 3.94
PPoisnd_pre - - - - - 1.49 0.77 0.11 – 20.36
Low Age - - - - - 0.40 0.04 0.17 – 0.94
Benton
Total no. correct 266 0.75 0.74 0.15 – 3.91 170 1.24 0.81 0.22 – 6.93
PPoisnd_pre - - - - - 0.42 0.19 0.12 – 1.53
Santa Ana
Dom. hand tot corr 259 1.07 0.84 0.55 – 2.09 161 - - -
PPoisnd_pre - - - - - 1.37 0.57 0.47 – 3.98
Non-dom. hand corr 268 0.73 0.71 0.14 – 3.81 169 0.34 0.35 0.04 – 3.26
PPoisnd_pre - - - - - 0.97 0.96 0.33 – 2.84
Pursuit Aiming
Total no. corr 245 6.28 0.02 1.40 – 28.17 159 17.34 <0.01 2.59 – 116.26
PPoisnd_pre - - - - - 2.06 0.18 0.72 – 5.87
417

Gender - - - - - 0.40 0.05 0.16 – 0.99
Low Age - 0.43 0.02 0.21 – 0.88 - - - -
BSI / GSI 268 0.32 0.29 0.04 – 2.64 169 0.29 0.27 0.03 – 2.56
PPoisnd_pre - - - - - 0.73 0.57 0.24 – 2.17
Q16 200 1.93 0.54 0.24 – 15.50 127 4.39 0.29 0.29 – 66.34
PPoisnd_pre - - - - - 0.59 0.48 0.13 – 2.59
Low Schooling - 0.44 0.04 0.20 – 0.95 - - - -
Vibration sense 266 1.36 0.68 0.31 – 5.94 169 0.83 0.83 0.15 – 4.60
PPoisnd_pre - - - - - 1.76 0.25 0.67 – 4.58
*Adjusted for confounders age, gender, education, language, current alcohol consumption, head injury, psychiatric illness, low SES
418

Table J(b). Adjusted regression results for neuro-behavioural outcomes with Cohort- AllOpdys excluding and including alcohol use
Excluding Alcohol Use Including Alcohol Use
Outcome N OR P-value* CI N OR P-value* CI
Digit Span
Forward
97 0.33 0.39 0.03 – 4.05 169 3.75 0.17 0.58 – 24.48
Low SES - 5.07 0.03 1.15 – 22.39 - - - -
Backward 93 1.07 0.96 0.08 – 14.38 154 - - -
Wais-R Std score 97 0.62 0.70 0.05 – 7.08 169 1.98 0.47 0.31 – 12.74
Digit Symbol
Wais-R Std score 89 0.35 0.36 0.04 – 3.36 163 0.62 0.63 0.09 – 4.41
Benton
Total no. correct 93 0.92 0.87 0.32 – 2.60 169 1.55 0.65 0.23 – 10.45
Santa Ana
Dom. hand tot corr 93 1.05 0.93 0.36 – 3.12 165 - - -
Non-dom. hand corr 96 1.14 0.92 0.08 – 15.77 169 0.71 0.78 0.07 – 7.39
Pursuit Aiming
Total no. corr 89 1.78 0.61 0.19 – 16.68 156 11.81 0.03 1.23 – 113.30
Low Age - 0.15 0.01 0.04 – 0.57 - - - -
BSI / GSI 96 0.69 0.79 0.04 – 10.96 166 1.22 0.64 0.53 – 2.83
Q16 72 1.30 0.90 0.02 – 78.59 126 1.40 0.83 0.07 – 28.64
Low Schooling - - - - - 0.29 0.02 0.10 – 0.84
Prev. Head injury - - - - - 3.72 0.04 1.03 – 13.37
Vibration sense 95 0.87 0.91 0.07 – 10.24 170 3.03 0.25 0.46 – 20.15
Low SES - - - - - 2.90 0.03 1.09 - 7.74
*Adjusted for confounders age, gender, education, language, current alcohol consumption, head injury, psychiatric illness, low SES
419

Table J(c). Adjusted regression results for neurobehavioural outcomes with Cohort - Allpestdys excluding and including past poisoning
Excluding Past Poisoning Including Past Poisoning
Outcome N OR P-value* CI N OR P-value* CI
Digit Span
Forward
263 0.81 0.67 0.31 – 2.11 167 1.82 0.34 0.53 – 6.26
PPoisnd_pre - - - - - 2.16 0.13 0.81 – 5.76
Low Age - 0.49 0.04 0.25 – 0.95 - 0.35 0.02 0.15 – 0.84
Prev. Head injury - 2.67 0.02 1.14 – 6.22 - - - -
Backward 252 0.54 0.30 0.17 – 1.71 161 0.61 0.55 0.12 – 3.09
PPoisnd_pre - - - - - 1.24 0.72 0.39 – 3.97
Wais-R Std score 263 0.53 0.27 0.17 – 1.63 167 0.81 0.77 0.20 – 3.32
PPoisnd_pre - - - - - 1.50 0.44 0.53 – 4.19
Digit Symbol
Wais-R Std score 251 1.10 0.84 0.43 – 2.79 158 1.08 0.92 0.24 – 4.79
PPoisnd_pre - - - - - 1.81 0.32 0.56 – 5.81
Benton
Total no. correct 263 1.04 0.93 0.41 – 2.61 167 1.33 0.67 0.36 – 4.99
PPoisnd_pre - - - - - 0.43 0.20 0.12 – 1.57
Santa Ana
Dom. hand tot corr 266 2.45 0.04 1.05 – 5.68 166 2.05 0.26 0.59 – 7.16
PPoisnd_pre
- - - - - 1.35 0.59 0.45 – 4.06
Non-dom. hand corr 266 1.35 0.53 0.53 – 3.43 166 2.38 0.19 0.65 – 8.67
PPoisnd_pre - - - - - 0.92 0.88 0.30 – 2.77
Pursuit Aiming
Total no. corr 242 1.00 1.00 0.38 – 2.62 156 0.99 0.99 0.26 – 3.79
420

PPoisnd_pre - - - - - 2.28 0.11 0.83 – 6.31
Low Age - 0.38 0.01 0.18 – 0.76 - 0.38 0.04 0.15 – 0.97
BSI / GSI 266 0.71 0.50 0.27 – 1.89 166 1.63 0.43 0.48 – 5.48
PPoisnd_pre - - - - - 0.71 0.54 0.24 – 2.13
Q16 197 0.44 0.30 0.09 – 2.09 125 2.09 0.46 0.30 – 14.75
PPoisnd_pre - - - - - 0.66 0.57 0.15 – 2.81
Low Schooling - 0.42 0.03 0.20 – 0.91 - - - -
Vibration sense 264 1.24 0.65 0.50 – 3.05 166 1.52 0.50 0.45 – 5.12
PPoisnd_pre - - - - - 1.48 0.44 0.54 – 4.01
*Adjusted for confounders age, gender, education, language, current alcohol consumption, head injury, psychiatric illness, low SES
421

Table J(d). Adjusted regression results for neurobehavioural outcomes with Cohort - Allpestdys excluding and including alcohol use
Excluding Alcohol Use Including Alcohol Use
Outcome N OR P-value* CI N OR P-value* CI
Digit Span
Forward
95 2.17 0.35 0.43 – 10.99 168 0.56 0.36 0.17 – 1.91
Low Age - - - - - 0.44 0.05 0.19 – 0.99
Low SES - 4.78 0.03 1.15 – 19.90 - - - -
Backward 91 0.33 0.32 0.03 – 3.03 160 0.63 0.52 0.15 – 2.56
Wais-R Std score 95 1.19 0.85 0.21 – 6.80 168 0.37 0.20 0.08 – 1.69
Digit Symbol
Wais-R Std score 87 0.92 0.91 0.18 – 4.59 163 1.16 0.81 0.36 – 3.72
Benton
Total no. correct 95 6.10 0.03 1.22 – 30.55 168 0.35 0.14 0.09 – 1.39
Santa Ana
Dom. hand tot corr 95 0.43 0.45 0.05 – 3.88 170 3.94 0.01 1.41 – 11.03
Non-dom. hand corr 94 1.48 0.64 0.29 – 7.57 168 1.24 0.74 0.36 – 4.30
Pursuit Aiming
Total no. corr 87 0.69 0.70 0.10 – 4.56 155 1.27 0.69 0.40 – 3.99
Low Age - 0.13 <0.01 0.03 – 0.51 - - - -
BSI / GSI 94 0.54 0.59 0.06 – 5.05 171 0.81 0.70 0.27 – 2.43
Q16 70 0.56 0.64 0.05 – 6.37 125 0.26 0.25 0.03 – 2.52
Low Schooling - - - - - 0.28 0.02 0.09 – 0.81
Vibration sense 93 0.60 0.56 0.11 – 3.31 170 1.63 0.38 0.55 – 4.81
Low SES - - - - - 2.81 0.04 1.06 – 7.45
Prev. Head injury - - - - - 3.77 0.05 1.03 – 13.77
*Adjusted for confounders age, gender, education, language, current alcohol consumption, head injury, psychiatric illness, low SES
422

Table J(e) Cohort adjusted logistic regression results for dichotomous neurobehavioural outcome-exposure relationships: stratifying for current
alcohol use - With AllOP applicators
Exposure variable -
AllOPappl With current alcohol use Without current alcohol use
Significant covariates
in the model
Dichotomous outcomes N OR 95% CI p-value N OR 95% CI p-value Covariate OR (95% CI)
Digit Span Forward 171 97 None
AllOPappl 0.91 0.29 – 2.81 0.87 0.14 0.01 – 1.28 0.08
Digit Span Backward 163 93 None
AllOPappl 1.07 0.30 – 3.79 0.92 0.28 0.03 – 2.50 0.26
Digit Span Wais 171 97 None
AllOPappl 1.60 0.54 – 4.77 0.40 0.55 0.10 – 2.95 0.49
Digit Symbol Wais 166 89 None
AllOPappl 0.65 0.22 – 1.89 0.42 0.99 0.20 – 4.84 0.99
Benton VRT 171 97
AllOPappl 0.68 0.20 – 2.29 0.54 0.75 0.14 – 4.05 0.74 None
Santa Ana dom. hand 173 97 None
AllOPappl 0.27 0.06 – 1.28 0.10 0.26 0.03 – 2.29 0.22
423

≠ Indeterminate since none of the participants for this corresponding outcome quartile had values within this exposure band
Santa Ana non-d. hand 171 96 None
AllOPappl 0.72 0.21 – 2.49 0.61 3.30 0.76 – 14.33 0.11
Pursuit Aiming 158 89 Low Age 0.10; 0.02-0.42
AllOPappl 0.73 0.21 – 2.54 0.62 0.32 0.05 – 1.96 0.22
BSI/GSI 174 96 None
AllOPappl 0.39 0.10 – 1.46 0.16 1.35 0.28 – 6.44 0.71
Swedish Q16 127 72 None
AllOPappl 0.50 0.09 – 2.89 0.44 5.25 0.73 – 37.85 0.10
Low Schooling 0.26 0.09 – 0.77 0.02
Vibration Sense Test 173 95 None
AllOPappl 0.44 0.09 – 2.10 0.31 0.48 0.09 – 2.57 0.39
Low SES 2.75 1.04 – 7.29 0.42
424

Table J(f) Cohort adjusted logistic regression results for dichotomous neurobehavioural outcome-exposure relationships: stratifying for current
alcohol use with All_OPjemdum
Exposure variable -
All_OP Jemdum With current alcohol use Without current alcohol use
Significant covariates
in the model
Dichotomous outcomes N OR 95% CI p-value N OR 95% CI p-value Covariate OR (95% CI)
Digit Span Forward 169 93
OPjmdys_1 16 1.23 0.28 – 5.39 0.78 0.17 0.02 – 1.74 0.14 Low SES 4.92; 1.11 – 21.71
OPjmdys_2 14 0.61 0.12 – 3.16 0.558 - ≠ -
Digit Span Backward 159 89
OPjmdys_1 15 0.53 0.06 – 4.72 0.57 0.59 0.06 – 6.30 0.66 None
OPjmdys_2 14 1.44 0.32 – 6.54 0.64 - ≠ -
Digit Span Wais 169 97
OPjmdys_1 16 0.92 0.17 – 4.81 0.92 0.35 0.04 – 3.42 0.37 None
OPjmdys_2 14 2.38 0.60 – 9.45 0.22 1.08 0.10 – 12.02 0.95
Digit Symbol Wais 163 253
OPjmdys_1 15 0.95 0.21 – 4.41 0.95 0.77 0.25 – 2.36 0.65 None
OPjmdys_2 13 0.38 0.09 – 1.56 0.43 0.76 0.22 – 2.59 0.66
Benton VRT 169 97
OPjmdys_1 16 1.22 0.27 – 5.40 0.80 0.52 0.05 – 5.10 0.58 None
OPjmdys_2 14 0.28 0.03 – 2.37 0.24 1.25 0.11 – 13.82 0.86
Santa Ana dom. hand 161 93
OPjmdys_1 16 - ≠ - 0.39 0.04 – 3.82 0.42 None
OPjmdys_2 13 0.51 0.09 – 2.71 0.43 - ≠ -
425

≠ Indeterminate since none of the participants for this corresponding outcome quartile had values within this exposure band
Santa Ana non-d. hand 169 96
OPjmdys_1 16 0.79 0.15 – 4.30 0.79 5.24 0.78 – 35.25 0.09 None
OPjmdys_2 14 0.61 0.11 – 3.26 0.56 1.59 0.14 – 18.26 0.71
Pursuit Aiming 148 85
OPjmdys_1 15 2.03 0.49 – 8.42 0.33 0.83 0.12 – 5.81 0.85 Low Age 0.08; 0.02 – 0.38
OPjmdys_2 12 - - Low Schooling 0.21; 0.05 – 0.91
BSI/GSI 162 92
OPjmdys_1 16 0.84 0.20 – 3.54 0.81 3.31 0.52 – 21.16 0.21 None
OPjmdys_2 14 - -
Swedish Q16 126 70
OPjmdys_1 8 0.60 0.05 – 7.19 0.69 2.43 0.22 – 26.32 0.47 None
OPjmdys_2 10 0.42 0.04 – 4.33 0.47 -
Low Schooling 0.26 0.09 – 0.78 0.02
Vibration Sense Test 160 95
OPjmdys_1 15 1.17 0.22 – 6.23 0.85 0.39 0.04 – 3.90 0.43 None
OPjmdys_2 14 - ≠ - 0.61 0.06 – 6.58 0.69
426