
Impact of Television programs on the attitude of women: An analytical study of Aligarh Region
442
Chapter 1 Introduction 1
-
Upload
mangalayatanuniversity -
Category
Documents
-
view
0 -
download
0
Transcript of Impact of Television programs on the attitude of women: An analytical study of Aligarh Region

Chapter 1
Introduction
1
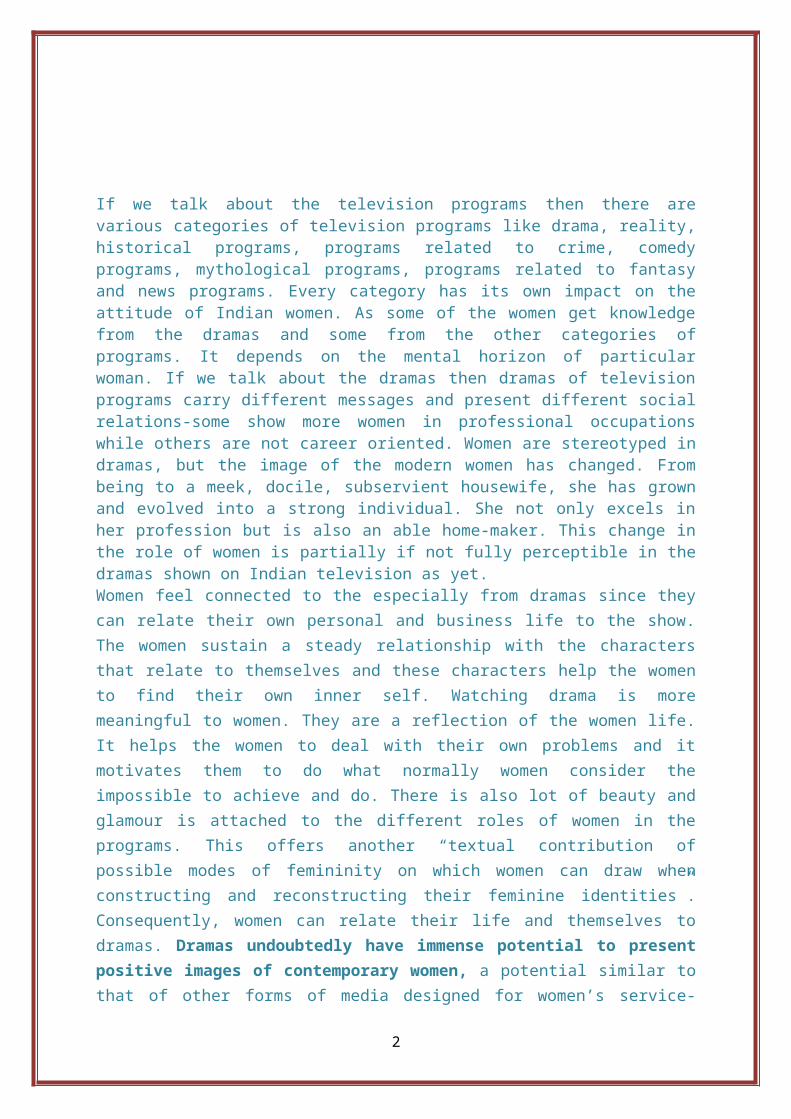
If we talk about the television programs then there arevarious categories of television programs like drama, reality,historical programs, programs related to crime, comedyprograms, mythological programs, programs related to fantasyand news programs. Every category has its own impact on theattitude of Indian women. As some of the women get knowledgefrom the dramas and some from the other categories ofprograms. It depends on the mental horizon of particularwoman. If we talk about the dramas then dramas of televisionprograms carry different messages and present different socialrelations-some show more women in professional occupationswhile others are not career oriented. Women are stereotyped indramas, but the image of the modern women has changed. Frombeing to a meek, docile, subservient housewife, she has grownand evolved into a strong individual. She not only excels inher profession but is also an able home-maker. This change inthe role of women is partially if not fully perceptible in thedramas shown on Indian television as yet.Women feel connected to the especially from dramas since theycan relate their own personal and business life to the show.The women sustain a steady relationship with the charactersthat relate to themselves and these characters help the womento find their own inner self. Watching drama is moremeaningful to women. They are a reflection of the women life.It helps the women to deal with their own problems and itmotivates them to do what normally women consider theimpossible to achieve and do. There is also lot of beauty andglamour is attached to the different roles of women in theprograms. This offers another “textual contribution ofpossible modes of femininity on which women can draw whenconstructing and reconstructing their feminine identities”.Consequently, women can relate their life and themselves todramas. Dramas undoubtedly have immense potential to presentpositive images of contemporary women, a potential similar tothat of other forms of media designed for women’s service-
2

newspapers, magazines, radio forums focusing on relationshipsand family life could easily present more story lines andcharacters, discussing social issues and problems central totheir changing roles. Dramas writers have contended that partof their mission is to teach the “lesson of life” to thewomen. Dramas are an example of women’s literature thatsupports the status quo regarding women’s place in the socialorder. Women’s concern in dramas are changing somewhat. Manywomen leave a family – centered world to become an integralpart of the work world. All these things in dramas affect theattitude of women who watch these dramas. By challenging the stereotyped roles of women in the Indianprograms, with male dominated formulas and inventing strong,active female characters, dramas have created orthodoxnarrative of femininity and women’s desires. In comparison tothe neat wrap up in movies which often ends up by showingwomen in a traditional role in society, soaps have had toinvent new places continuously for women. Dramas presentstrong women who resist their roles in male hierarchies andportray a female power.Dramas contain many characters and many sub plots are inter -woven around these characters. Dramas like “Bade Ache LagteHain”, and others are portraying women with independent mindsand a decision making individual. There are a variety of womencharacters such as “grandmother types, married women,marriageable women, spinster types and young women and thesevarious representations of women in the drama makes it moreinteresting for women to watch especially, if they can relateto certain characters in the show. In the contemporary dramas,the women character is considered to be a “strong women”.Dramas include women who are not only capable in the personalsphere but are also capable in the business world. These“strong women” are admired by the viewers. In a survey done by Star TV, it was found that women who wereeconomically self-sufficient, had a stronger decision makingpower in the business and family, were very popular. The womenalso meant to achieve the same things in their personal lives
3

as the characters do. Most women are shown to be on the top inthe business world and women character in dramas may inspiresome of the women audience.And if we talk about the reality programs then realitytelevision programs is a genre of televisionprogramming that presents purportedly unscripted dramatic orhumorous situations, documents actual events, and usuallyfeatures ordinary people instead of professional actors,sometimes in a contester other situation where a prize isawarded. Reality shows have been order of the day attractingand wooing the women of all ages. With the advent of showslike India Got Talent, Dance India Dance ,Nach Baliye and BogBoss attract most of the women of any field either lecturer,teacher, doctor, working women as well as housewives. All likethese programs because it shows the talent of participants ofall ages which creates a feeling of awakening among women ofIndia and they want to do some real thinks in their life sothat they can make a different image of themselves in theminds of viewers from all around the world If we talk about the programs related to crime then most ofthe women want to aware them from problems which are createdby the people of the society and they also want to know aboutthe solutions of these types of problems by knowing the lawregarding the punishment of person who has done wrong thingswith them. And if we talk about the historical programs then women wantto upgrade their knowledge of ancient Indian history as wellas can feel the royal living of King and Queen at that timeand their culture as well as traditions and if we talk aboutthe mythological programs then women want to know about thehistory behind the myth and some of them feel devotional aswell as spirituals from these programs which creates a feelingof respect towards the Gods of every religion. On the other side we know that an Indian woman is also knownas the well of emotions so Indian programs are mostly based onthis ideology but now a day’s condition has changed because
4

every woman cannot walk on traditional rules and regulationsbut in some cases it has been seen that sometimes they followthe wrong path to achieve their goals. It can be her image inthe family or in outside world.So by knowing above things can we say that these changes inthe attitude of women are the reason of the programs only? So to keep away this confusion various researches have done bythe scholars and in these research it is concluded thatprograms creates both positive as well as negative impact onthe mindset of women and most of them want to bring thatparticular character in their own life but it is not true inevery woman because some women watch programs only to knowabout the real face of the society as well as the people whomake this society and want to know about their thinking aswell as behaviors which keep them safe from any unwantedproblems in their life and there are women who remains eagerto know about the political as well as social position of thewomen in the country by the help of news programs which arebased on women problems .There are some of the women who watchinternational channels and want to upgrade their knowledgeabout the external World like Discovery, National Geographic,History and so on. So, here it is concluded that it depends on the mental horizonof particular woman that what she thinks after watching theprograms? In India there are mainly six channels which telecast programson different categories like drama, comedy, reality, horror, historical, mythological andfantasy on Indian television.These channels are:1. Zee TV2. Sony3. Colors4. Life OK5. Star Plus
6. SAB TV
5

There are also news channels whose programs are also liked bythe women which telecast various programs on new issues in thecountry like Aaj Tak, India News, ABP News and so on.
Now let us take a quick look on some of the programs channelswhich are watched by Indian women:
1. Zee T.V
Zee TV
Launched 2 October 1992
6

Owned by Zee Entertainment EnterprisesParent: (Essel Group)
Picture format 576i (16:9/4:3) (SDTV)1080i (HDTV)
Slogan ददद दद दद ददद
Country IndiaHeadquarters New Delhi, Delhi, IndiaWebsite www.zeetv.comCATEGORIES OF PROGRAMS TELECASTED ON ZEE TV:
1. Drama
2. Historical
3. Horror
4. Mythology
5. Reality
2. Sony
Sony Entertainment Television (India)
Sony Entertainment Television (India)Launched October 1995Owned by Multi Screen Media Pvt. Ltd. (a subsidiary of Sony
Pictures Entertainment)
7

Picture format
1080i (HDTV)
Country IndiaHeadquarters Mumbai, MaharashtraSister channel(s)
SAB TVSET MaxSony AathSET PIXSony MIXSony SIXAXNAnimax India
Website Sony Entertainment Television India Website
CATEGORIES OF PROGRAMS TELECASTED ON SONY:
1. Drama
2. Historical
3. Horror
4. Reality
5. Crime/Thriller
3. Colors
Colors
Launched July 21, 2008
8

Owned by Viacom 18Picture format
4:3 (576i, SDTV) and 1080i, HDTV
Country IndiaHeadquarters
Mumbai
Sister channel(s)
MTV India, Rishtey, Nick India, VH1 India, Viacom 18 Motion Pictures,Comedy Central (India), Sonic Nickelodeon India (launched on Dec. 20, 2011)
Website colors.in.com/in/colors.in.com/uk/aapkacolors.com
CATEGORIES OF PROGRAMS TELECASTED ON COLORS:
1. Drama
2. Reality
3. Comedy
4. Life OK
Life OK
9

Launched 18 December 2011Network STAR India
IBC
Owned by 21st Century FoxThe Show Maker Company
Picture format 576i (SDTV),720p (HDTV)
Country IndiaBroadcast area India
Singapore
Headquarters Mumbai, Maharashtra, India
CATEGORIES OF PROGRAMS TELECASTED ON LIFE OK:
1. Drama
2. Mythological
3. Fantasy
4. Crime
5. Star Plus
10

Star Plus
Launched 21 February 1992 (as Star TV)17 April 1996 (as Star Plus)
Network STAR IndiaOwned by 21st Century FoxPicture format
576i (SDTV),1080i (HDTV)
Slogan Rishta Wahi, Soch Nayi(Same Relationship, New Way Of Thinking)
Country IndiaBroadcast area
India
Headquarters New Delhi, IndiaCATEGORIES OF PROGRAMS TELECASTED ON STAR PLUS:
1. Drama
2. Mythology
3. Crime
4. Comedy
5. Talk show
11

6. SAB TV
SAB TV
Launched April 23, 2000Owned by Multi Screen Media Private LimitedPicture format 4:3 (576i, SDTV), 16:9(1080i, HDTV)
Country IndiaHeadquarters Mumbai, MaharashtraSister channel(s) Sony TV
SET MaxSony AathSET PIXSony MixSony SIXAXNAnimax
Website www.sabtv.com
CATEGORIES OF PROGRAMS TELECASTED ON SAB TV:
1.Drama
2.Comedy
12

Some of the news channel liked by the Indian women:
Aaj Tak
Logo of Aaj Tak
Launched December 31, 1998Network Broadcast television and onlineOwned by Living MediaPicture format 4:3 (576i, SDTV)Slogan "Sabse Tez" (English: 'The Fastest')
Country IndiaLanguage HindiBroadcast area India & WorldwideHeadquarters New Delhi, IndiaSister channel(s) Headlines Today
Website www.aajtak.inCATEGORIES OF PROGRAMS TELECASTED ON AAJ TAK:
1. Entertainment 2. Sports 3.Movies 4. Music
5.Reality Shows 6. News 7. Serials8.Kids
9. Finance 10.Others
13

Chapter-2
Objective of the Study
14
TO STUDY THE IMPACT OF TELEVISION PROGRAMS ON THE ATTITUDE OF WOMEN: AN ANALYTICAL STUDY OF ALIGARH REGION.
15

Chapter 3
16

Significance of the Study
There are some important factors which will clarify the significance of study on women:
1. Their routine to watch the programs on television.
2. Their most favorite channel.
3. Their favorite programs on particular channel.
4. Their feeling after watching the programs.
17

5. Their most liked character in the programs like realistic, emotional, negative, and positive and so on.
6. Application of these characters in their own as well as others life and their feeling after applying the marked characters.
7. Their opinion regarding social change through television programs.
8. Their thinking on some innovative factors which will absolutely increase the quality of programs in their thinking as a result more and more women will know about the current problems of women in this society with their solutions.
So, after finding the answers of above factors we will understand the significance of study and we will reach at right conclusions.
18

Chapter 4
Review of Literature
19

There are various researches which has been done by manyresearchers in past and many authors have written on the impact of television programs onthe Indian women.
They are as follow:
According to author Varsha A. Sherring, violence against womenin India has been on a
rise. With the advent of television in India, programming forwomen in India has been in
great demand. While the current television programs focus onsocial issues faced by Indian
women, little scholarly research has focused on the effectsand outcomes that such
programming has on the Indian populace as a whole, especiallythe women when it comes to
policy and decision making which may perpetuate continuingviolence against their kind.
This study deals with finding the links, if any, betweensocial and personal identity of Indian
women, and the effects of Indian prosocial television programsin forming mindsets affecting
attitudes and actions relating to the two major social evilsstill existing in modem Indian
20

society, and highlighted herein: female feticide and childmarriage.
According to a latest book by Shoma Munshi, a writer, divisionhead of social sciences
and professor of anthropology seeks to analyse the impact ofprime time serials on the
women of India. According to her some of the programs havebrought the entire country to a
standstill. Here I am talking about the ubiquitous TV serialson the numerous channels,
spanning genre, theme and class representation. This issomething that I have always taken
issue with. Why must women be considered regressive if theyare homemakers? Soap stories,
being women-centric by definition, locate the woman in thefamily home. In soaps,
competence in the personal sphere is valued and women are ableto handle difficult situations
well because of it, and this is crucial and all these storieseffect the attitude of women of
every class.
According to By Cheryl Ni, TV dramas are always thought to bea female-viewer-attracted industry, especially for soap operas. However, the same asother types of television programs, TV dramas represent and reinforce the majority’s ideology ofmodern western culture
21

1. Female characters are fewer in number and less central tothe plot.2. Marriage and parenthood are considered more important to awoman’s than to a man’s life.3. Television portrays the traditional division of labor inmarriage.
4. Employed women are shown in traditionally femaleoccupations, as subordinates to men and with little status orpower.
5. TV-women are more personally-and less professionally-oriented than TV-men.
6. Female characters are more passive than male characters.
7. Television dramatic programming ignores the existence ofthe women’s movement.
According to the study done by co-authors, RobertJensen and Emily Oster, conclude that
television programs features lifestyles of both urban areasand of other countries. It is an
effective form of persuasion because women follow what theyperceive to be desirable
behaviors and attitudes, without the need for an explicitappeal to do so.
According to Neeru Ghale and Rosy Karna research “Hindi daily
soap rocks the fashion world”. They have concluded that daily
television programs are the genre of programs based on
fiction. These daily soaps depict stories to which people can
relate their lives with. Most of the soaps share common themes
22

like family relationships, romance, humor, and conflicts.
However, to make each serial exclusive the director chooses
unique clothing and accessories. Daily soap operas are made to
deliver messages regarding culture, family relations,
struggles of life and mythology through stories, but instead
of the story, the audience is fascinated by the dresses,
actors and the jewelries. Through research we found that the
channels like Star Plus, Zee TV, Sony, Colors and Others (Star
One, MAX and NDTV) have secured the highest position in the
box office. On watching the soaps obtained from the survey, we
surmised that love, family relationship, social problems and
Hindu mythology are some of the common themes presented in the
story. Depending upon these themes, designers design the
costume and accessories of the actors and all these things
have impact on the women of India. Our finding shows that Star
Plus is the mostly watched channel. This is because Star Plus
is one of the oldest channels and people are acquainted with
it for a long time. From the research we found that women are
mostly focused in the serial which binds the women to watch
programs. Moreover, people are losing traditional values and
beliefs by imitating Hindi daily soaps. In most of the serials
23

we watched, the married women wore Sindoor, (red color tika
put in the forehead to symbolize marriage) in a stylish way.
According to the Hindu culture the women should wear Sindoor
in the forehead as it is considered sacred, but the women in
daily soaps do not put it in the forehead. The directors
should not introduce new trends for a holy thing like Sindoor.
Apart from directors, the viewers should also realize the
importance of traditions that gives us identity. India is one
of the biggest countries in South Asia and has influence in
its neighboring countries. Daily soaps/programs produced in
India are not only watched by the Indian viewers, but is also
viewed in UK, USA, Australia, Asian countries like Nepal,
Bangladesh and Bhutan.1 Television industries produce daily
soaps/programs in such a way that audience gets anchored to
their television sets. The stories of daily soaps/programs
vary; some are based on reality, some are based on fiction and
some are based on fantasy. Whatever story the television
company advertises, fashion and style is the pivot of the
show.
Most of the Hindi daily soaps are thirty minutes long. In
that short duration the women can taste every facet of1
24

entertainment- comedy, romance, and action. Along with
entertainment they also get to see a range of styles. The
styles used by the actors come to the market within a week or
less. This quick accessibility motivates the women to purchase
the outfits and accessories used by their favorite celebrity.
When the new fashion enters the market the price is high, but
with time the price reduces gradually. According to the
shopkeepers of San mar, the customers do not buy the outfits
instantly, but purchase it later when the price reduces.
In a way television daily soap/programs binds people as
most of the people who watch them crave for the same style and
fashion. This desire has boosted the fashion world. For the
sake of fashion, designers sacrifice Indian traditional
culture and take up western culture. As a result people are
losing their traditional values, watching daily soap operas
are one of the ways of catharsis, but too much of watching is
unhealthy. It might reduce the capacity to think.
According to Dr. Aaliya Ahmed, Senior Assistant Professor,Media Education Research
Centre University of Kashmir, and Ms. Malik Zahra KhalidSenior Assistant Professor,
Media Education Research Centre University of Kashmir, foundin their research
25

“CONSTRUCTION OF CONTEMPORARY WOMEN IN SOAP OPERAS” that a
popular entertainment genre like soap opera can contributesto the process of changes at two
levels. The first level is that of generating a thinking roleof women. The meanings derived
from the knowledge of soaps challenge the dominant discoursesabout the role of women in
the family, on the silencing of women‟s voice, on the socialexpectations of women‟s
behavior and about the power of women‟s relationship withother members of society.
Aspects like the pleasure of close-knit family, clothingstyles, elaborate wedding spectacles,
continue to have a meaning in the life of women. Theseresistive readings are enveloped in
subtle contradictions and are not obvious to a casualobserver. The second level is that
despite its public negative evaluation, women find time andspace for these soaps in their
lives. It provides for experiences, learning and pleasure forwomen in which feminine
discourse can be spoken of and appreciated. Soaps alsoconstitute “affective alliances” ( Grossberg, 1992) based onshared emotional responses.
Television programs has emerged as a sharp, double-edgedsword which can serve
important and significant functional purposes if usedcarefully and judiciously. The efficacy
26

of television as a means of communication is very high vis-à-vis women. Television has an
important role in shaping and influencing their views,opinions and attitude. Television
programs has become the most persuasive and pervasive means ofinformation diffusion in
society. The medium of television plays a very significantrole in bringing about change
among people. Television has the potential and strength toact as a „modern information
multiplier‟ which can help people in smoothening the processof national development,
economic growth and social development.
The part played by television as a galvanizer in the spectrumof change cannot be overlooked
or ignored. The need of the hour is to harness its potentialin the right direction or rather than
let it be a trite reflection of society‟s lowest commondenominator.
There are some of the experiences on television programs on
Gupshup by some of the viewers. They are as follow:
According to Amrita a member on Gupshup. She heard quite
a few people telling females in their house not to watch Star
Plus dramas or Colors TV/Zee TV/Star One etc .Many men
complain that they affect their wives behavior and influence
27

them. We all agree that what is shown on some of the shows is
beyond the decency limits some times, the story lines get
dirty, the saas-bahu melo dramas influence thinking, the
romance shown lifts expectations and other such daily life
happenings. I have noticed behavior changes in some of the
women around me who followed these serials religiously.
Slowly, their natures became more complaining, critical and
impatient. I am not sure if the effect is of what they see and
get influenced by. E.g. I once one of my colleagues laugh
about what his son said. They were passing by a restaurant in
Lahore and sajji was getting made. For those of you haven’t
seen how sajji is made, seekhs of chicken are put over coals.
Seeing this, his son said abu yahan koi mar gya hai kia?
Following what he had seen on Indian TV, he believed that some
one's burial was going on because of the ashes there.
According to Krati it would depend on the individual, how
impressionable they are. Yes age also matters like when you
are in your earlier teens most people get in peer pressure or
totally influenced by what they see on TV. However at the end
of the day no matter what you see on TV or of people around
you, if you are self assured nothing can hamper you. I have
28

personally been exposed to all kinds of things but I never
felt like I was losing a grip on myself and I would give the
credit for it to a good upbringing and of course a good self
sensor and moral detector.
According to INTERNATIONAL JOURNAL OF ADVERTISING, VOL. 26, PGS.
9-36, a research done by Russell, C. A.; Stern, B. B.; and
Russell, D. W. named as HIDDEN PERSUASIONS IN SOAP OPERAS:
DAMAGED HEROINES AND NEGATIVE CONSUMER EFFECTS. It is
concluded that textual images of damaged women characters in
soap operas on the female consumers who constitute the
majority of viewers. We begin with an analysis of the
television soap genre in terms of print and radio antecedents
to examine the specific attributes that make it a marketable
item designed to appeal to women audiences. In a cross-
sectional study of long-time viewers of four soap operas, we
investigate negative consumer influences identified in prior
research indicating that long exposure to negative role models
is detrimental to personal life satisfaction, realistic
assessment of what the world is like and achievement of
reasonable goals. These influences are considered negative in
that viewers who seek emotional satisfaction in parasocial
29

attachments to characters accept images of passively
subordinate women characters in attractive settings as 'real'.
Additional research directions on soaps as a source of hidden
persuasion are suggested on the part of advertising academics,
practitioners and public policy makers.
Chapter 5
30

Hypotheses
Hypotheses: A statement of potential relation between two ormore variables. It is based on the imagination.
‘Survey’ has been widely used as the central research tool toexamine the impact of television programs on the attitude ofwomen. So, I have used this tool for my research.
1. Objectivity of television programs:
If TV programs are telecasted on awareness issues then it willbe credible to the women.
H1: There is high percentage of women who perceives thetelevision programs as objective when programs are basedon awareness issues.
2. Objectivity of programs channels:
31

If programs channels bring programs based on reality as wellas on social issues then it will more credible to the women.
H2: There is high percentage of women who like thetelevision programs channels when these channels telecastprograms on real issues of society as well as the socialposition of women in the society which leave a positiveimpact on the thinking of women.
3. Objectivity of programs:
If Zee TV brings programs related to history of India then itwill be more credible to the women.
H3: There is more percentage of women who watch theprograms of Zee TV because historical programs of Zee TVhave more impact as it upgrades their knowledge ofhistory of ancient India.
4. Objectivity of programs:
If Sony brings programs related to crime/thriller then it willbe more credible to the women.
H4: There is more percentage of women who watch theprograms of Sony because programs related tocrime/thriller of Sony have more impact as these programsaware them from various crucial thinking of people who docrimes as well the various right steps to keep them alertfrom these people.
5. Objectivity of programs:
If Colors brings programs related to social drama as well asreality programs then it will be more credible to the women.
H5: There is more percentage of women who watch drama aswell as reality programs of Colors because drama givesthem a feeling of social change in the society and inreality programs they can feel the inner enthusiasm of
32

human nature which shows the positive impact of programson the attitude of women as a result they can thinkbetter and positive.
6. Objectivity of programs:
If Life OK brings programs related to crime then it will bemore credible to the women.
H6: There is more percentage of women who prefer to watchprograms related to crime on Life OK which make themaware from the criminal minds of people so that theyremain alert from these types of persons to avoid anytype of misbehavior which shows the positive impact ofprograms of Life OK.
7. Objectivity of Discovery programs:
If Discovery brings programs related to adventure then it willbe more credible to the women.
H7: Most of the women prefer to watch programs related toadventures because they want to express their innertalent as well as feeling by doing adventures which isthe positive impact of these programs on the attitude ofwomen as a result they feel something different andstrange to make their extra ordinary image in the eyes ofthe society.
8. Social role of TV programs:
If women feel that programs bring social change in the societythen it will be positive impact of programs on the attitude ofwomen that they can feel that something is changing in theirnearby society as well as women of their locality.
H8: There is more percentage of women who feel thatprograms brings social changes because in their opinionchannels telecast all type of programs and every womanhas her own choice and thinking as a result she wants to
33

change her attitude according to the characters whenpercentage of these types of woman increases then therecomes a social change which is a positive impact ofprograms on the attitude of women.
9. Innovative role of Television programs:
If women feel that they want innovation in the programs toimprove the quality of programs then it is an innovative roleof programs on the attitude of women.
H9: There is more percentage of women who feel thatinnovation should be done to improve the quality ofprograms because they feel that programs are centered tothe role of mother-in-law which is to be changed some ofthem feel that more programs should be on hidden socialproblems which are very far away from them which showsthe innovative impact of programs on the women.
Chapter 6
34

Research Methodology
Research Type : Descriptive Research Data Type : Primary and Secondary Data Sources : 1. Questionnaire
2. Websites
Sampling Type : Convenience Sampling Sampling Area : Aligarh Sampling Unit : 1.Female Lecturers
35

2. Female Teachers
3. Female Doctors
4. Working Women
5. Housewives
Sample Size : 100
36

Chapter 7
Data Analysis and
37

Interpretation
DATA ANALYSIS
38

OF LECTURERS
Q.1. Do you watch programs on TV?
1. Yes 2. No
If yes, than
(a) Daily (b) Alternate day (c) Sometimes(d) Most of the day Ans: The aim of this question is to know how many lecturerswatch the television programs and if they watch then what is
39

the routine of television program watching which will clarifythe impact of programs on the attitude of female lecturers.
Yes 20No NoneTotal Number of Lectures 20
Explanation: The data shows that 100% lectures watchtelevision programs on various channels.
Result: Whole lecturers watch television programs. There areno lecturers who do not watch television programs.
Their routine to watch television programs:
Daily 12Alternate Day 2Sometimes 4Most of the day 2Total number of Lectures 20
Explanation: The data shows that 60% of the lecturers watchtelevision programs daily, 10% of the lecturers watchtelevision programs on alternate days, 20% lecturers watchtelevision programs when they have time and 10% lecturerswatch television programs most of the day by using internetservices.
Result: More percentage of lecturers watch television programson daily basis.
Interpretation: From above study we conclude that mostlylecturers keen to watch television programs in which morepercentage of lecturers watch television program on dailybasis. So, we can conclude that the attitude of most of thelecturers is on television programs because they are eager towatch new episodes of programs and there are very less number
40

of lecturers who watch the television programs on alternateday and most of the day which shows the impact of programs onthe attitude of lecturers and from this we reach a conclusionthat something is there in the programs which attract thefemale lecturers. The most interesting thing is thatpercentage of lecturers who watch television programs onalternate day and most of the day is same. The reason behindthis is that they use internet services to watch theirimportant programs when they are free from lecturers. So, thisexplains that those lecturers who come under the category ofmost of the day are habitual to watch television programs whenthey get some free time. So, it explains the attitude of thelecturers towards the television program that at any cost theyhave to complete their episodes so we can conclude somenegative impact of programs.
Q.2. Which type of programs do you watch mostly?
1. Social 2.Entertainment 3.Educational 4.Awareness 5.Devotional
Ans : The aim of this question is to find out the types ofprograms which the female lecturers watch so that we canconclude that what is the impact of programs on the attitudeof lecturers behind watching these programs. It may be ofone category or more than one category for the lecturer.
One Type:
Number of lectures who watch one category of programme : Ifwe divide the lecturers on one type means lecturers who watchonly one type of programme then following results areobtained.
Social 1/20Entertainment 7/20
41

Educational 1/20Awareness 0/20Devotional 0/20
Explanation: If we talk about the percentage of lecturers whowatch one type of programs then only 5% lecturers watchprograms related to social activities, 35% watch entertainmentprograms, 5% watch educational programs and there are nolecturers who watch awareness and devotional programs
Result: 45% lecturers watch one type of programs.
Two type:
Number of lecturers who watch two categories of programs : Ifwe divide the lecturers on two types means the lecturers whowatch only two types of programs only.
Social + Awareness 1/20Entertainment + Educational 2/20Social+ Educational 1/20Entertainment+ Awareness 2/20Social + Entertainment 1/20
Explanation: If we talk about the percentage of lecturers whowatch two categories of programs then only 5% lecturers watchsocial as well as awareness related programs , 10% watchentertainment as well as educational programs, 5% watch socialas well as educational programs, 10% watch entertainment aswell as awareness programs and 5% watch social as well asentertainment programs.
Result: Only 35% lecturers watch two categories of programs.
Three Type :
Number of lecturers who watch three categories of programs :42

Social+ Entertainment+Educational
1/20
Social+ Entertainment +Awareness
1/20
Explanation: If we talk about the percentage of lecturers whowatch three categories of programs then only 5% lecturerswatch social, entertainment and educational programs and 5%lecturers watch social, entertainment and awareness programs.
Result: Only 10% lecturers watch three types of programs.
Four Type :
Number of lecturers who watch four categories of programs:
Ent.+ Edu.+ Awareness +Devotional
1/20
Explanation: If we talk about the lecturers who watch fourcategories of programs then only 5% lecturers watchentertainment, educational, awareness and devotional programs.
Result: Only 5% lecturers watch four categories of programs.
Five Type :
There is no lecturer who watches five types of programs ontelevision.
Interpretation: The study shows that there is more percentageof the female lecturers who watch one category of programsbut most of them watch programs only for entertainment itshows the attitude of female lecturers that they watch theprograms only for entertainment . They do not watch any type
43

of devotional programs which can give them spiritual thinking.If we particularly talk about the devotional programs thenthey are watched by the lecturers who watch four categories ofprograms so we cannot say that no lecturer watch devotionalprograms so it shows the positive effect of programs on theattitude of women but they come under other category. As weknow that for a lecturer it is must that they will know aboutthe new educational techniques by the help of which they cantreat the students in any type of problem related to educationbut the percentage of these lecturers is to less as comparedto entertainment but more as compared to awareness which tellsthe attitude of lecturers that they are updated with newtechniques of imparting education. We can conclude thatprograms have positive impact in the mindset of lecturers.
Q.3. Which channel programs do you like most?
1. Zee TV 2. Sony 3. Colors 4. Life Ok5.Discovery 6.Others
Ans. The aim of this question is to find out that whichchannel programs are liked by the lecturers which clarify theimportant channel programs impact on the attitude oflecturers. Number of Lecturers who like one channel programs:
Colors 6/20Discovery 4/20Others 1/20 Explanation: If we talk about one channel programs then fromabove data we conclude that 30% lecturers like colors, 20%like discovery and 5% lecturers like other channel programs.
Result: 55% lecturers like one channel programs in which morepercentage of lecturers like Colors.
44

Number of lecturers who like two channels programs :
Sony + Colors 2/20Zee TV + Others 1/20Zee TV + Discovery 2/20Zee TV + Colors 1/20
Explanation: If we talk about the percentage of lecturers fortwo channels then the above data shows that 10% lecturerslike Sony as well as Colors, 5% like Zee TV as well asothers, 10% like Zee TV as well as Discovery.
Result: 35% lecturers like two types of channels programs.
Number of lecturers who like three channels programs : Zee TV + Sony + Discovery 1/20Zee TV + Colors + others 1/20
Explanation : There are 5% lecturers who like three channelsprograms of Zee TV, Sony as well as Discovery and 5%lecturers like Zee TV, Sony and others like others.
Result: There are 10% lecturers who like three channelsprograms.
Number of lecturers who like four types of channelsprograms :
There is no lecturer who likes four types of channelsprograms.
Number of lecturers who like five types of channels programs :
Zee TV + Sony + Colors + 1
45

Discovery + others Explanation: 5% lecturer like five types of channels programs.
Result: There is so less percentage of lecturers who like fivechannels programs
Interpretation :- There is more percentage of lecturers wholike colors channel. So, we conclude that the interest oflecturers are on that type of channel who make programs on allcategories specially on social behaviors which shows thepositive impact of programs on the attitude of femalelecturers. It also clarify the attitude of the lecturers thatthey are keen the like those channels who brings the socialchange in the society.
Note : I have divided the data on the basis of choices oflecturers marked by the lecturers from Q.4 to Q.6 For example:
46

1.First Choice
2.Second Choice
3.Third Choice
and for Q.7 to Q.9 I shall take only the first choice oflecturers.For example:1.First Choice Only
So, I shall do my study on choice basis from Q.4 to Q.9.
Q.4. Which category of programme/programs of Zee TV do youwatch mostly and what do you feel?
Ans:- ………………………………………………………………………………………………………
47

1. Drama 2.Historical 3.Horror 4. Mythology 5.Reality
1. It keeps meaware.2. It entertainsme.3. I know abouthistory.4. It makes mephobic.5.I feel thereality.6. Createscriminalbehavior7.I feel Happy.8. I feelromantic.9.Any otherfeeling
Ans. The aim of this question is to find out that whichcategory of programs on Zee TV liked by the lecturers and whatthey feel after watching these programs which will clarify theimpact of programs of Zee TV on the attitude of lecturers.
1. Lecturers who prefer to watch programs as first choice fora particular category on Zee TV:
Drama 1/20Historical 9/20Horror 0/20Mythology 0/20Reality 1/20Not interested in Zee TVprograms
8/20
48
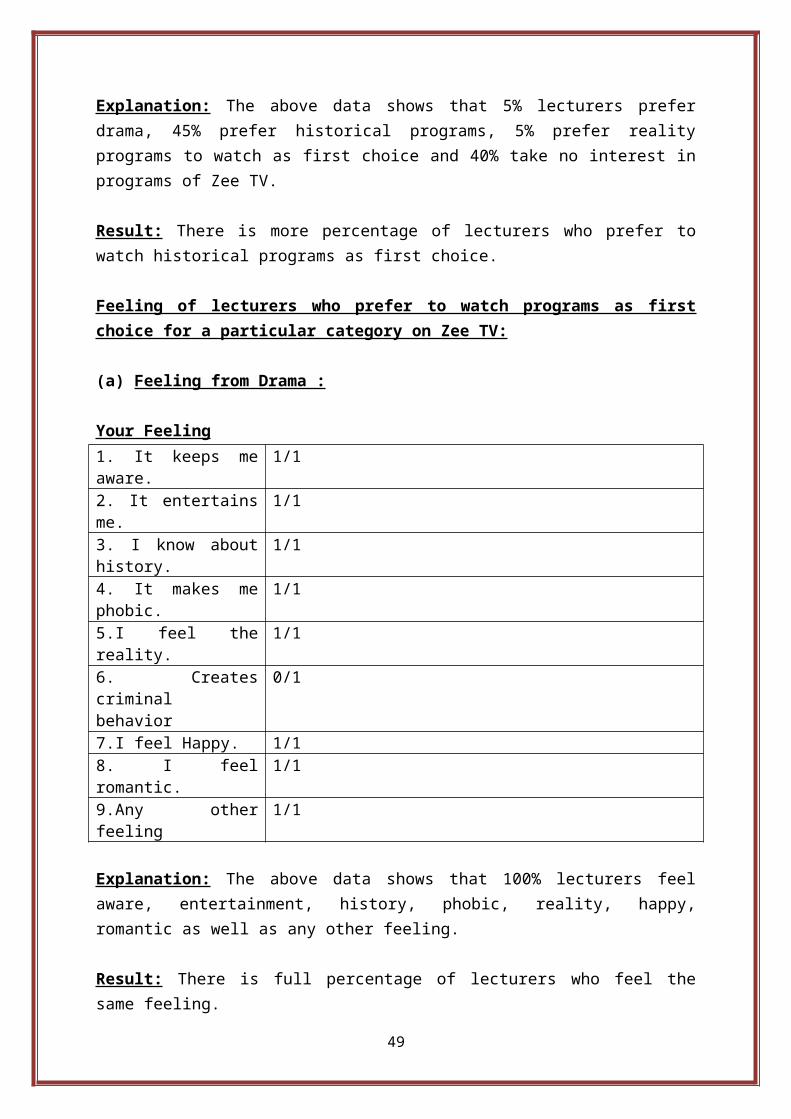
Explanation: The above data shows that 5% lecturers preferdrama, 45% prefer historical programs, 5% prefer realityprograms to watch as first choice and 40% take no interest inprograms of Zee TV.
Result: There is more percentage of lecturers who prefer towatch historical programs as first choice.
Feeling of lecturers who prefer to watch programs as firstchoice for a particular category on Zee TV:
(a) Feeling from Drama :
Your Feeling1. It keeps meaware.
1/1
2. It entertainsme.
1/1
3. I know abouthistory.
1/1
4. It makes mephobic.
1/1
5.I feel thereality.
1/1
6. Createscriminalbehavior
0/1
7.I feel Happy. 1/18. I feelromantic.
1/1
9.Any otherfeeling
1/1
Explanation: The above data shows that 100% lecturers feelaware, entertainment, history, phobic, reality, happy,romantic as well as any other feeling.
Result: There is full percentage of lecturers who feel thesame feeling.
49

(b) Feeling from Historical category programs :
Your Feeling1. It keeps meaware.
0/9
2. It entertainsme.
8/9
3. I know abouthistory.
6/9
4. It makes mephobic.
0/9
5.I feel thereality.
0/9
6. Createscriminalbehavior7.I feel Happy. 2/98. I feelromantic.
3/9
9.Any otherfeeling
0/9
Explanation: The above data shows that 88.88% lecturers feelentertainment, 66.66% feel that they know about the history,22.22% feel happy and 33.33% feel romance.
Result: There is more percentage of lecturers who feel theentertainment.
(c) Feeling from Horror category programs:
There is no lecturer under this category of first choice onZee TV.
(d)Feeling from Mythology category programs:
There are no lecturers under this category of first choice onZee TV.
50

(e) Feeling from Reality category programs:
Your Feeling1. It keeps meaware.
0/1
2. It entertainsme.
1/1
3. I know abouthistory.
0/1
4. It makes mephobic.
0/1
5.I feel thereality.
0/1
6. Createscriminalbehavior
0/1
7.I feel Happy. 1/18. I feelromantic.
0/1
9.Any otherfeeling
0/1
Explanation: The above data shows that 100% lecturers feelentertainment as well as happy.
Result: There is full percentage of lecturers who feel samefeeling of entertainment as well as happy.
2. Lecturers who prefer to watch programs as second choice fora particular category on Zee TV:
Drama 0/20Historical 0/20Horror 0/20Mythology 0/20Reality 2/20Not interested in Zee TVprograms
8/20
51

Explanation: The above data shows that 10% lecturers preferreality programs and 40% take no interest in programs of ZeeTV.
Result: There is more percentage of lecturers who do notprefer to watch programs which come under the category ofsecond choice.
Feeling of lecturers who prefer to watch programs as secondchoice for a particular category on Zee TV:
(a) Feeling from Drama category:There is no lecturer who come under the category of secondchoice and prefers to watch drama on Zee TV. (b) Feeling from Historical category programs :There is no lecturer who come under the category of secondchoice and prefers to watch drama on Zee TV.
(c) Feeling from Horror category programs:There is no lecturer who come under the category of secondchoice and prefers to watch drama on Zee TV.
(d)Feeling from Mythology category programs:There is no lecturer who come under the category of secondchoice and prefers to watch drama on Zee TV.
(e) Feeling from Reality category programs:
Your Feeling1. It keeps meaware.
0/2
2. It entertainsme.
2/2
52
3. I know abouthistory.
0/2
4. It makes mephobic.
0/2
5.I feel thereality.
0/2
6. Createscriminalbehavior
0/2
7.I feel Happy. 0/28. I feelromantic.
0/2
9.Any otherfeeling
Energetic, 1/2
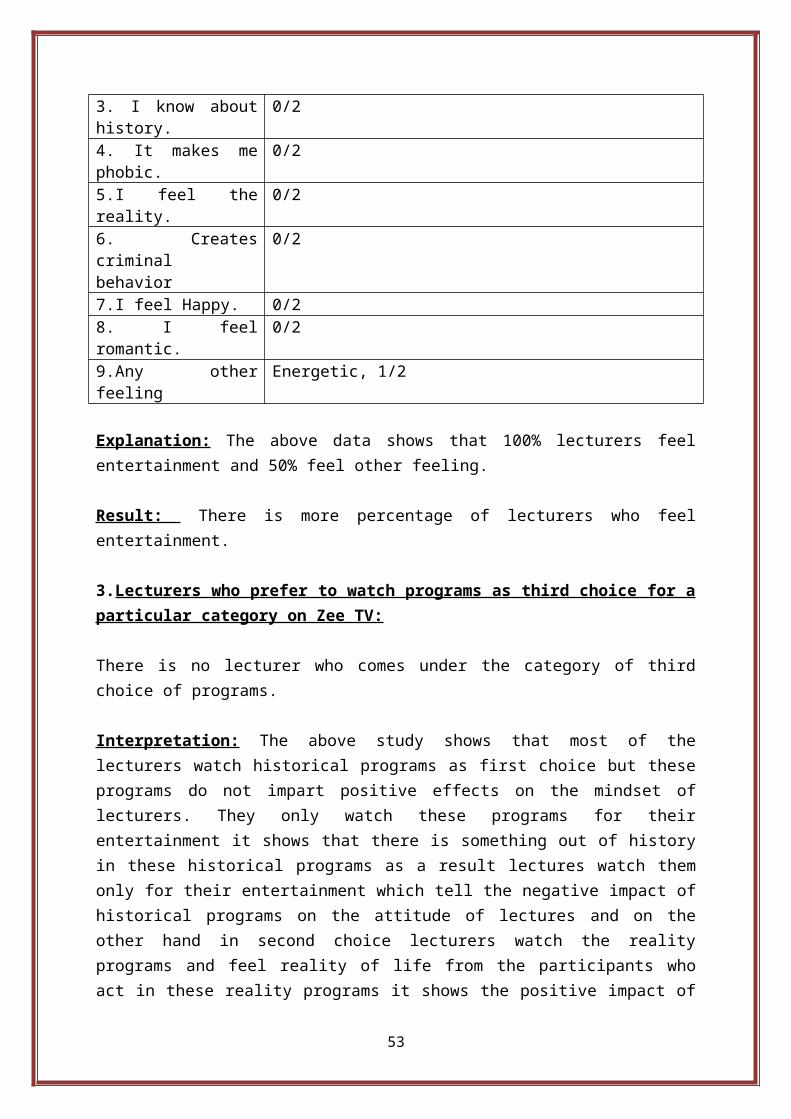
Explanation: The above data shows that 100% lecturers feelentertainment and 50% feel other feeling.
Result: There is more percentage of lecturers who feelentertainment.
3.Lecturers who prefer to watch programs as third choice for aparticular category on Zee TV:
There is no lecturer who comes under the category of thirdchoice of programs.
Interpretation: The above study shows that most of thelecturers watch historical programs as first choice but theseprograms do not impart positive effects on the mindset oflecturers. They only watch these programs for theirentertainment it shows that there is something out of historyin these historical programs as a result lectures watch themonly for their entertainment which tell the negative impact ofhistorical programs on the attitude of lectures and on theother hand in second choice lecturers watch the realityprograms and feel reality of life from the participants whoact in these reality programs it shows the positive impact of
53

reality programs on the attitude of lecturers that they cometo know about the struggle of others.
Q. 5.Which category of programme/programs of Sony do youwatch mostly?
Ans:- ………………………………………………………………………………………………………
1. Drama 2.Historical 3.Horror 4.Reality5.Crime/Thriller
Your Feeling:
1. It keeps meaware.2. It entertainsme.3. I know abouthistory.4. It makes mephobic.5.I feel thereality.6. Createscriminal behavior7.I feel Happy.8. I feelromantic.9.Any otherfeeling
Ans. The aim of this question is to find out that whichcategory of programs liked by the lecturers on Sony and whatthey feel after watching these programs which will clarify theimpact of programs of Sony on the attitude of lecturers.
54

1.Lecturers who prefer to watch programs as first choice for aparticular category on Sony:
Drama 1/20Historical 2/20Horror 0/20Reality 1/20Crime/Thriller 3/20Not interested in Sonyprograms
13/20
Explanation: The above data shows that 5% lecturers preferdrama, 10% prefer historical programs, 5% reality programs ,5% prefer reality ,15% prefer crime/thriller and 65% take nointerest in the programs of Sony.
Result: There is more percentage of lecturers who prefer towatch crime/thriller as first choice.
Feeling of lecturers who prefer to watch programs as firstchoice for a particular category on Sony:
(a) Feeling from Drama :
Your Feeling1. It keeps meaware.
0/1
2. It entertainsme.
1/1
3. I know abouthistory.
0/1
4. It makes mephobic.
0/1
5.I feel thereality.
0/1
6. Createscriminalbehavior
0/1
7.I feel Happy. 0/1
55

8. I feelromantic.
0/1
9.Any otherfeeling
0/1
Explanation: The above data shows that 100% lecturers feelentertainment in the drama of Sony.
Result: There is full percentage of lecturers who feelentertainment in watching drama on Sony.
(b)Feeling from Historical category programs :
Your Feeling1. It keeps meaware.
0/2
2. It entertainsme.
0/2
3. I know abouthistory.
2/2
4. It makes mephobic.
0/2
5.I feel thereality.
0/2
6. Createscriminalbehavior
0/2
7.I feel Happy. 0/28. I feelromantic.
0/2
9.Any otherfeeling
Art of living, give brave thinking toyoungsters, 2/2
Explanation: The above data shows that 100% lecturers feelthat they want to know about the history, 100% feel otherfeelings in which 50% feel art of living of Kings family atthat time and 50% feel that brave thinking creates in theminds of younger’s.
56

Result: There is equal percentage of lectures who feel thatthey want to know about history as well as other feelingscreates in them by the historical programs of Sony.
(c) Feeling from Horror category programs:
There is no lecturer under this category of first choice ofprograms on Sony who prefer horror category.
(d) Feeling from Reality category programs:
1. It keeps meaware.
0/1
2. It entertainsme.
1/1
3. I know abouthistory.
0/1
4. It makes mephobic.
0/1
5.I feel thereality.
0/1
6. Createscriminalbehavior
0/1
7.I feel Happy. 0/18. I feelromantic.
0/1
9.Any otherfeeling
0/1
Explanation: The above data shows that 100% lecturers feelreality from these programs.
Result: There is full percentage of lecturers who feel realityin the programs related to reality.
(e) Feeling from crime/thriller category programs:
1. It keeps me 2/3
57

aware.2. It entertainsme.
1/3
3. I know abouthistory.
0/3
4. It makes mephobic.
0/3
5.I feel thereality.
1/3
6. Createscriminalbehavior
0/3
7.I feel Happy. 0/38. I feelromantic.
0/3
9.Any otherfeeling
0/3
Explanation: The above data shows that 66.66% lecturers feelaware, 33.33% feel entertainment and 33.33% feel reality. Result: There is more percentage of lecturers who feel awarefrom the programs related to crime/thriller.
2. Lecturers who prefer to watch programs as second choice fora particular category on Sony:
Drama 2/20Historical 1/20Horror 0/20Reality 0/20Crime/Thriller 1/20Not interested in Sonyprograms
13/20
Explanation: The above data shows that 10% lecturers preferdrama, 5% prefer historical programs, 5% prefer crime/thrillerprograms to watch as second choice and 65% take no interestin programs of Sony.
58

Result: There is more percentage of lecturers who do not takeinterest in the programs of Sony which come under secondchoice.
Feeling of lecturers who prefer to watch programs as secondchoice for a particular category on Sony:
(a) Feeling from Drama :
1. It keeps meaware.
1/2
2. It entertainsme.
0/2
3. I know abouthistory.
0/2
4. It makes mephobic.
0/2
5.I feel thereality.
1/2
6. Createscriminalbehavior
0/2
7.I feel Happy. 0/28. I feelromantic.
1/2
9.Any otherfeeling
Know about human relation, 1/2
Explanation: The above data shows that 50% lecturers feel
aware, reality , romantic as well as other feeling of human
relation.
Result: There is equal percentage of lecturers who feel thesame feeling.
(b)Feeling from Historical category programs :
59

Your Feeling1. It keeps meaware.
0/1
2. It entertainsme.
0/1
3. I know abouthistory.
1/1
4. It makes mephobic.
0/1
5.I feel thereality.
0/1
6. Createscriminalbehavior
0/1
7.I feel Happy. 0/18. I feelromantic.
0/1
9.Any otherfeeling
0/1
Explanation: The above data shows that 100% lecturers feelthat they want to know about the history.
Result: There is full percentage of lecturers who feel thatthey want to know about history of India after watchingprograms related to history on Sony.
(c) Feeling from Horror category programs:
There is no lecturer under this category of second choice onSony.
(d) Feeling from Reality category programs:
There is no lecturer who come under the category of secondchoice and prefers to watch reality programs on Sony.
(e) Feeling from crime/thriller category programs:
60

1. It keeps meaware.
0/1
2. It entertainsme.
0/1
3. I know abouthistory.
0/1
4. It makes mephobic.
0/1
5.I feel thereality.
1/1
6. Createscriminalbehavior
1/1
7.I feel Happy. 0/18. I feelromantic.
0/1
9.Any otherfeeling
0/1
Explanation: The above data shows that 100% lecturers feelreality that come under the second choice of programs.
Result: There is full percentage of lecturers who feel awarefrom the programs related to crime/thriller on Sony.
(3) Lecturers who prefer to watch programs as third choice fora particular category on Sony:
Drama 1/20Historical 0/20Horror 0/20Reality 0/20Crime/Thriller 0/20Not interested in Sonyprograms
13/20
Explanation: The above data shows that 5% lecturers watchdrama as a third choice of particular category.
61

Result: There is very less percentage of lecturers who watchdrama as third choice.
Feeling of lecturers who prefer to watch programs as thirdchoice for a particular category on Sony:
Feeling from Drama:
Your feeling1. It keeps meaware.
0/1
2. It entertainsme.
1/1
3. I know abouthistory.
0/1
4. It makes mephobic.
0/1
5.I feel thereality.
0/1
6. Createscriminalbehavior
0/1
7.I feel Happy. 1/18. I feelromantic.
0/1
9.Any otherfeeling
0/1
Explanation: The above data shows that 100% lecturers feelentertainment as well as happy.
Result: There is full percentage of lecturers who feel thesame feeling by watching drama on Sony.
Interpretation: The above study shows that most of thelecturers do not take interest in the programs of Sony butthose lecturers who take interest in the programs of Sonyprefer to watch historical and reality programs as a firstchoice of programs on Sony and feel that there is something
62

historical in the program that attract them to watch regularepisode. The reason behind this is that they feel that theycome to know about the Indian historical stories and imaginethe prosperous life of King and Queen at that time. Thisparticular thinking creates a feeling of doing something newin their life which is different from others and with thisthey also feel that positive and brave heart thinking iscreated in the mindset of younger girls from these programs.There is some percentage of female lecturers who watchprograms related to crime/thriller which keep them aware fromthe incidents which sometimes happen in work places so it isthe positive effect of programs on the attitude of lecturersthat they are watching these programs and gaining somethingnew and interesting and if we talk about the second choice oflecturers then most of them watch drama and feel aware whichis also a positive impact of programs of Sony on the mindsetof lecturers.
Q.6.Which category of programme/programs of Colors do youwatch mostly and what do you feel?
Ans:- …………………………………………………………………………………………………….
1. Drama 2. Comedy 3. Reality
Your Feeling1. It keeps meaware.2. It entertainsme.3. I know abouthistory.4. It makes mephobic.5.I feel thereality.6. Createscriminal behavior7.I feel Happy.
63
8. I feelromantic.9.Any otherfeeling
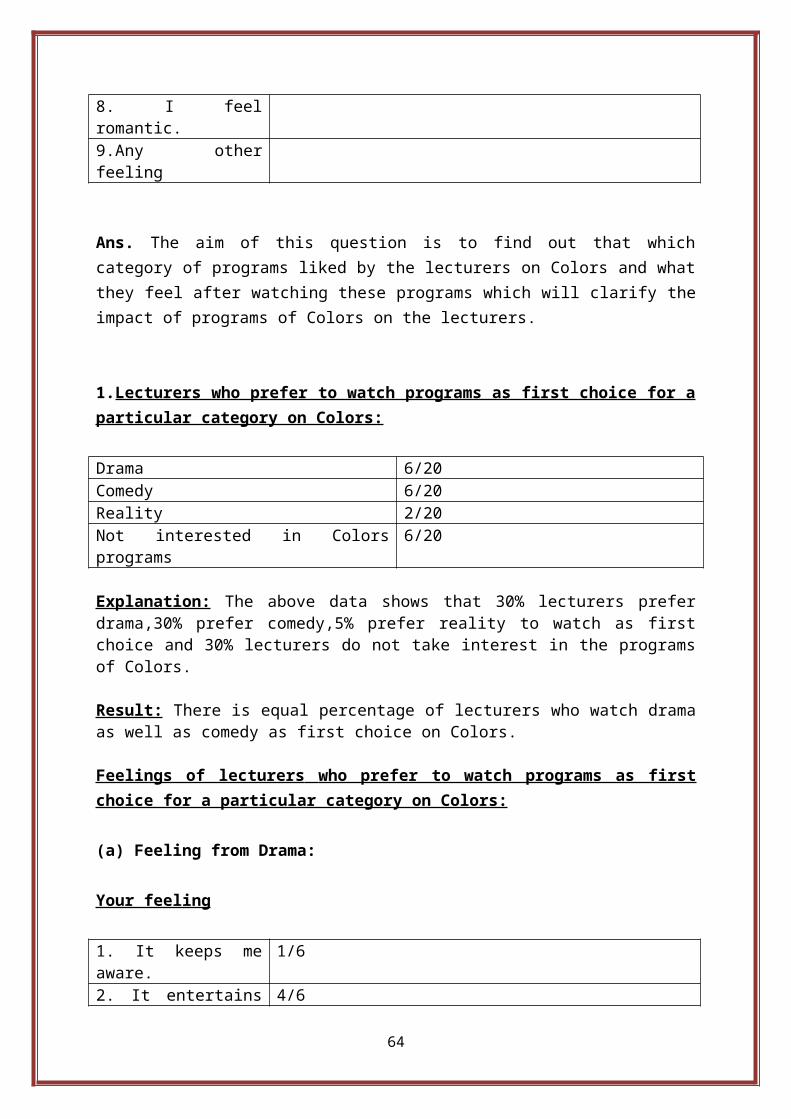
Ans. The aim of this question is to find out that whichcategory of programs liked by the lecturers on Colors and whatthey feel after watching these programs which will clarify theimpact of programs of Colors on the lecturers.
1.Lecturers who prefer to watch programs as first choice for aparticular category on Colors:
Drama 6/20Comedy 6/20Reality 2/20Not interested in Colorsprograms
6/20
Explanation: The above data shows that 30% lecturers preferdrama,30% prefer comedy,5% prefer reality to watch as firstchoice and 30% lecturers do not take interest in the programsof Colors.
Result: There is equal percentage of lecturers who watch dramaas well as comedy as first choice on Colors.
Feelings of lecturers who prefer to watch programs as first choice for a particular category on Colors:
(a) Feeling from Drama:
Your feeling
1. It keeps meaware.
1/6
2. It entertains 4/6
64

me.3. I know abouthistory.
0/6
4. It makes mephobic.
0/6
5.I feel thereality.
1/6
6. Createscriminal behavior
0/6
7.I feel Happy. 3/68. I feelromantic.
2/6
9.Any otherfeeling
0/6
Explanation: The above data shows that 16.66% lecturers feelaware, 66.66% feel entertainment , 16.66% feel reality, 50%feel happy and 33.33% feel romantic.
Result: There is equal percentage of lecturers who feel awareas well as reality in watching drama of Colors.
(b) Feeling from Comedy:
Your feeling
1. It keeps meaware.
0/6
2. It entertainsme.
6/6
3. I know abouthistory.
0/6
4. It makes mephobic.
0/6
5.I feel thereality.
0/6
6. Createscriminal behavior
0/6
7.I feel Happy. 6/68. I feelromantic.
0/6
9.Any other 0/665

feeling
Explanation: The above data shows that 100% lecturers feelentertainment as well as happy.
Result: There is full percentage of lecturers who feel thesame feeling of entertainment as well as happy in watchingComedy on Colors.
(c) Feeling from Reality:
Your feeling
1. It keeps meaware.
0/2
2. It entertainsme.
2/2
3. I know abouthistory.
0/2
4. It makes mephobic.
0/2
5.I feel thereality.
1/2
6. Createscriminal behavior
0/2
7.I feel Happy. 1/28. I feelromantic.
0/2
9.Any otherfeeling
0/2
Explanation: The above data shows that 100 % lecturers feelentertainment, 50% feel reality as well as feel happy inwatching reality programs on Colors.
Result: There is equal percentage of lecturers who feelreality as well as happy in watching programs related toreality.
2. Lecturers who prefer to watch programs as second choice fora particular category on Colors:
66

Drama 0/20Comedy 1/20Reality 1/20Not interested in Colorsprograms
6/20
Explanation: The above data shows that 5% lecturers watchcomedy and 5% lecturers watch reality.
Result: There is equal percentage of lecturers who watchcomedy as well as reality on Colors.
Feeling of lecturers who prefer to watch programs as secondchoice for a particular category on Colors:
(a)Feeling from Drama
There is no lecturer who watches drama under the category ofsecond choice.
(b)Feeling from Comedy
Your Feeling:
1. It keeps meaware.
0/1
2. It entertainsme.
0/1
3. I know abouthistory.
0/1
4. It makes mephobic.
0/1
5.I feel thereality.
0/1
6. Createscriminal behavior
0/1
7.I feel Happy. 1/18. I feelromantic.
0/1
9.Any other 0/1
67

feeling
Explanation: The above data shows that 100% lecturers feelhappy in watching programs related to Comedy
Result: There is full percentage of lecturers who feel happyin watching Comedy programs on Colors.
(c)Feeling from Reality
Your Feeling
1. It keeps meaware.
0/1
2. It entertainsme.
1/1
3. I know abouthistory.
0/1
4. It makes mephobic.
0/1
5.I feel thereality.
0/1
6. Createscriminal behavior
0/1
7.I feel Happy. 1/18. I feelromantic.
0/1
9.Any otherfeeling
0/1
Explanation: The above data shows that 100% lecturers feelentertainment.
Result: There is full percentage of lectures who feel realityin the programs of reality on Colors.
Lecturers who prefer to watch programs as third choice for aparticular category on Colors:
There is no lecturer who watches programs as third choice fora particular category on Colors
68

Interpretation: The above study shows that there are equalpercentage of lecturers who watch drama as well as comedy andfeel only entertainment which shows that they only watchprograms only for entertainment which shows the negativeeffect of programs on the attitude of lecturers because theseprograms not aware them and if we talk about second choice ofprograms then there are lecturers who watch programs only forentertainment which shows the negative effects of programs asthey are not awaking the lecturers on other issues. So it canbe concluded that programs of Colors are not effecting thethinking of the lecturers and do not encourages any newthinking.
Q.7. Which category of programme/programs of Life Ok do youwatch mostly and what do you feel?
Ans:- ………………………………………………………………………………………………………
1. Drama 2.Mythogical 3.Fantasy 4.Crime
Your Feeling
1. It keeps meaware.2. It entertainsme.3. I know abouthistory.4. It makes mephobic.5.I feel thereality.6. Createscriminal behavior7.I feel Happy.8. I feelromantic.9.Any otherfeeling
69

Ans. The aim of this question is to find out that whichcategory of programs liked by the lecturers on Life OK andwhat they feel after watching these programs which willclarify the impact of programs on the attitude of lecturers.
1.Lecturers who prefer to watch programs as first choice fora particular category on Life OK:
Drama 1/20Mythological 4/20Fantasy 0/20Crime 1/20Not interested in Life OK 14/20
Explanation: The above data shows that 5% lecturers watchdrama, 20% watch mythology, 5% watch Crime and 70% are notinterested in Life OK.
Result: There is equal percentage of lecturers who watch dramaas well as Crime.
Feelings of lecturers who prefer to watch programs as firstchoice for a particular category on Life OK:
From drama category:
Your feeling
1. It keeps meaware.
0/1
2. It entertainsme.
1/1
3. I know abouthistory.
0/1
4. It makes mephobic.
0/1
5.I feel thereality.
0/1
6. Createscriminal behavior
0/1
7.I feel Happy. 0/1
70
8. I feelromantic.
0/1
9.Any otherfeeling
0/1
Explanation: The above data shows that 100% lecturers feelentertainment.
Result: There is full percentage of lecturers who feelentertainment.
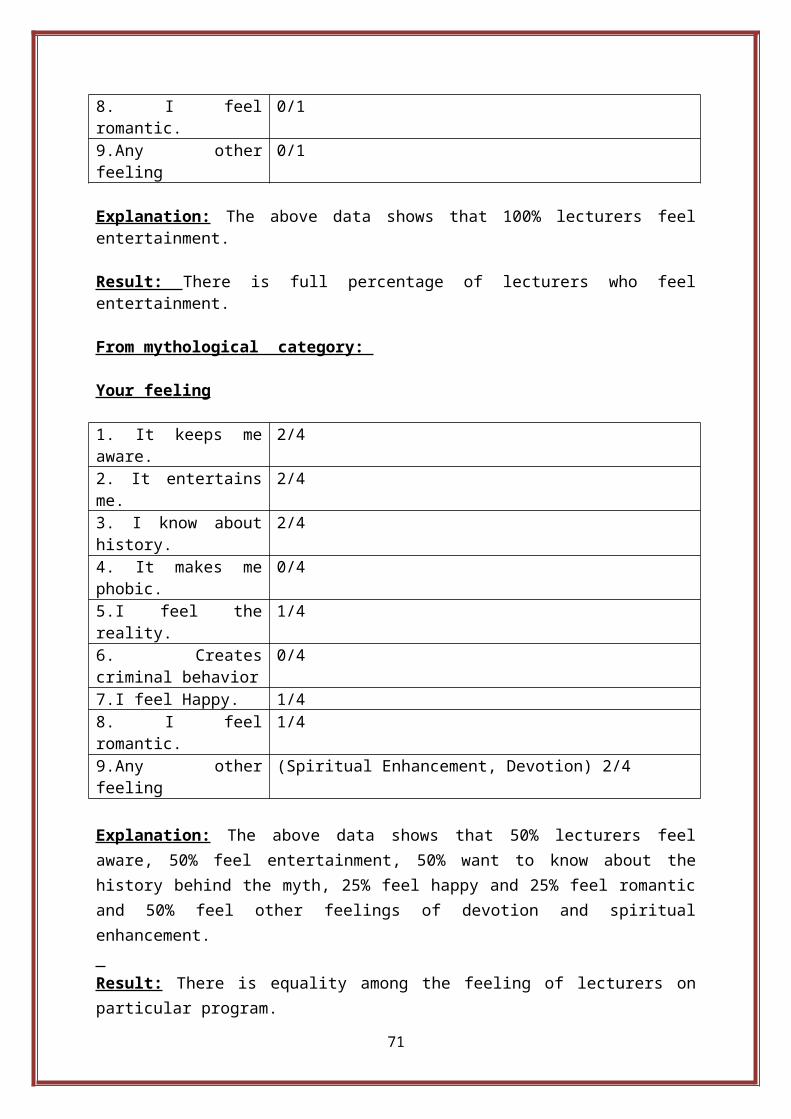
From mythological category:
Your feeling
1. It keeps meaware.
2/4
2. It entertainsme.
2/4
3. I know abouthistory.
2/4
4. It makes mephobic.
0/4
5.I feel thereality.
1/4
6. Createscriminal behavior
0/4
7.I feel Happy. 1/48. I feelromantic.
1/4
9.Any otherfeeling
(Spiritual Enhancement, Devotion) 2/4
Explanation: The above data shows that 50% lecturers feelaware, 50% feel entertainment, 50% want to know about thehistory behind the myth, 25% feel happy and 25% feel romanticand 50% feel other feelings of devotion and spiritualenhancement. Result: There is equality among the feeling of lecturers onparticular program.
71
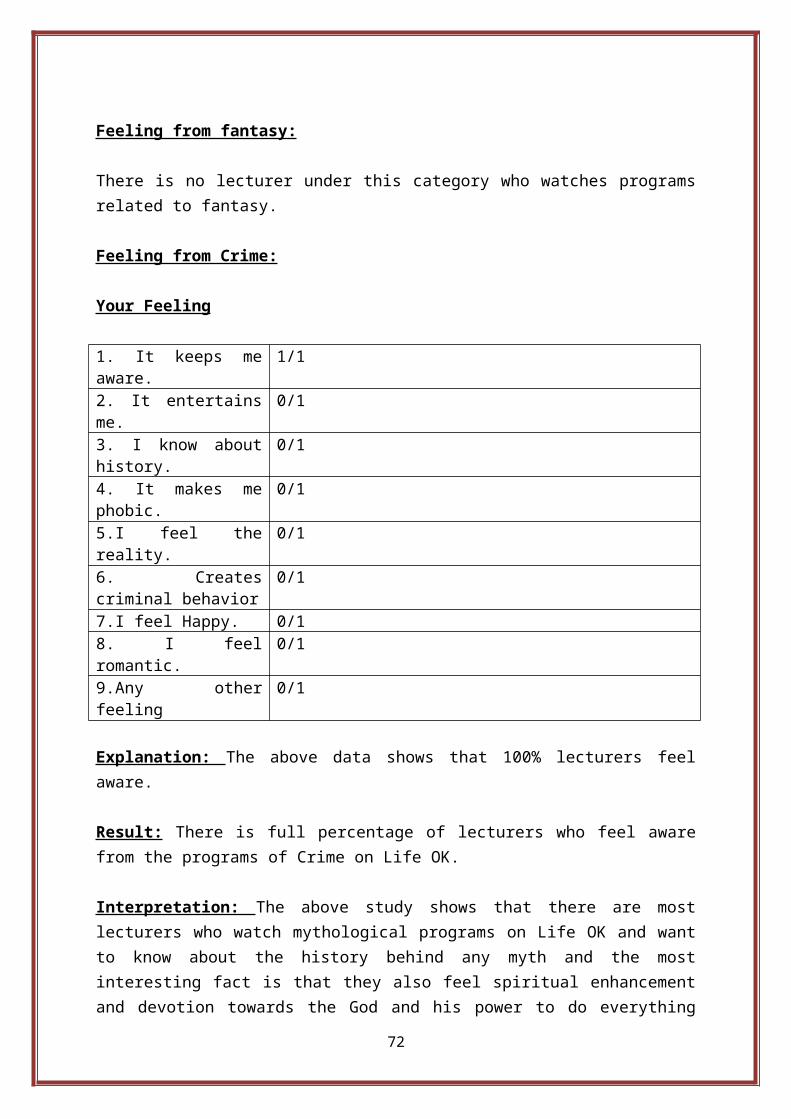
Feeling from fantasy:
There is no lecturer under this category who watches programsrelated to fantasy.
Feeling from Crime:
Your Feeling
1. It keeps meaware.
1/1
2. It entertainsme.
0/1
3. I know abouthistory.
0/1
4. It makes mephobic.
0/1
5.I feel thereality.
0/1
6. Createscriminal behavior
0/1
7.I feel Happy. 0/18. I feelromantic.
0/1
9.Any otherfeeling
0/1
Explanation: The above data shows that 100% lecturers feelaware.
Result: There is full percentage of lecturers who feel awarefrom the programs of Crime on Life OK.
Interpretation: The above study shows that there are mostlecturers who watch mythological programs on Life OK and wantto know about the history behind any myth and the mostinteresting fact is that they also feel spiritual enhancementand devotion towards the God and his power to do everything
72

and some of the lecturers watch programs related to crime andlearn the techniques to save themselves from the incidentswhich are occurring in the society and specially on theworking place where they are posted to teach the studentswhich shows the positive effects of programs on the thinkingstate of lecturers as well as on their attitude. As a resultthey feel confidence on their work place because they come toknow about every law regarding women exploitation in workplace. All this is the positive impact of programs of Life OKon the mind of female lecturers.
Q.8. Which category of programme/programs do you watch onDiscovery and what do you feel?
1. Medical Science 2.New technologies 3.Environment4.Culture 5.Health 6.Foods 7.Historical 8.Adventurous
Your Feeling
1.It aware me.2.It entertain me.3I know about externalWorld.4.I feel phobic.5.Innovative ideascome in my mind6.I know about healthproblems.7.Want to doadventure.8. Other feeling.. Ans. The aim of this question is to find out that whichcategory of programs liked by the lecturers on Discovery andwhat they feel after watching these programs which willclarify the impact of programs of Discovery on the attitude oflecturers.
73

1.Lecturers who prefer to watch programs as first choice for aparticular category on Discovery:
Medical Science 2/20New Technologies 6/20Environment 4/20Culture 1/20Health 0/20Food 0/20Historical 0/20Adventurous 0/20Not interested in Discovery 7/20
Explanation: The above data shows that 10% lecturers watchprograms related to medical science, 30% watch programs of newtechnologies, 20% watch programs related to environment ,5%related to culture and 35% do not take any interest in theprograms of Discovery.
Result: There is more percentage of lecturers who do not takeinterest in the programs of Discovery.
Feeling of lecturers who prefer to watch programs as firstchoice for a particular category on Discovery:
1.Feeling from Medical Science category programs:
Your feeling
1. It keeps meaware.
2/2
2. It entertainsme.
0/2
3. I know abouthistory.
0/2
4. It makes mephobic.
0/2
5.I feel thereality.
0/2
6. Createscriminalbehavior
0/2
74

7.I feel Happy. 0/28. I feelromantic.
0/2
9.Any otherfeeling
0/2
Explanation: The above data shows that 100% lecturers feelaware from the programs related to medical science.
Result: There is full percentage of lecturers who feel samefeelings.
2.Feeling from New Technologies category programs: Your feeling1.It aware me. 6/62.It entertain me. 2/63.I know aboutexternal World.
4/6
4.I feel phobic. 0/65.Innovative ideascome in my mind
3/6
6.I know about healthproblems.
0/6
7.Want to doadventure.
2/6
8. Other feeling.. 0/6
Explanation: The above data shows that 100% lecturers feelaware, 33.33% feel entertain, 66.66% know about the externalworld, 50% feel that innovative ideas come in their mind and33.33% feel that they want to do adventure.
Result: There is full percentage of lecturers who feel awarefrom the programs related to new technologies.
3.Feeling from Environment category programs:
Your feeling:
75

1.It aware me. 3/42.It entertain me. 2/43.I know aboutexternal World.
2/4
4.I feel phobic. 1/45.Innovative ideascome in my mind
1/4
6.I know about healthproblems.
2/4
7.Want to doadventure.
1/4
8. Other feeling.. Excitement , 1/4
Explanation: The above data shows that 75 % feel aware, 50%feel entertainment , 50% feel that they about the externalworld, 25% feel phobic, 25% feel that innovative ideas relatedto environment come in their mind , 50% feel that they aboutthe health problems which is caused by polluted environment ,25% feel that they want to do adventure and 25% feelexcitement.
Result: There is more percentage of lectures who feel awareafter watching programs related to environment.
4.Feeling from Cultural category programs:
Your feeling
1.It aware me. 1/12.It entertain me. 0/13.I know aboutexternal World.
1/1
4.I feel phobic. 0/15.Innovative ideascome in my mind
0/1
6.I know about healthproblems.
0/1
7.Want to doadventure.
0/1
76

8. Other feeling.. 0/1
Explanation: The above data shows that 100% lecturers feelaware as well as know about the culture of other countries.
Result: There is full percentage of lecturers who feel thesame feeling of awareness from the programs related tocultural category.
5.Feeling from Health category programs:
There are no lecturers who watch programs related to Health.
6. Feeling from food category programs :
There is no lecturer who watches programs related to food.
7. Feeling from Historical Category programs:
There is no lecturer who watches programs related to history.
8.Feeling from Adventurous category programs:
There is no lecturer who watches programs related toadventures.
Interpretation: The above study shows that most of thelecturers watch programs related to new technologies and feelthat they want to know about the external world withinnovative ideas and want to do adventures with the help ofnew technologies which shows the positive effect of programson the attitude of lecturers and some of the lectures watchprograms related to culture from which they acquire thefeeling of awareness which is something different feeling oflecturers. There are some of the lecturers who watch medicalrelated programs and feel awareness regarding health problems
77

which shows the positive impact of programs on the thinkingand attitude of female lecturers.
Q.9. Which category of programme/programs do you watch onother channels and what do you feel?Ans: ………………………………………………………………………………………………………
1.Drama 2.Historical 3.Horror 4.Mythology 5.Reality6.Crime 7.Comedy 8.Fantasy 9.Fashion
Your Feeling1. It keeps meaware.2. It entertainsme.3. I know abouthistory.4. It makes mephobic.5. I feel thereality.6. Createscriminal behavior7. I feel Happy.8. I feelromantic.9. Any otherfeeling.
Ans. The aim of this question is to find out that whichcategories of programs lecturers watch on other channels andwhat they feel which will clarify the impact of programs ofother channels on the attitude of female lecturers.
1.Lecturers who prefer to watch programs as first choice for aparticular category on other channels:
Drama 3/20Historical 0/20
78

Horror 0/20Mythology 1/20Reality 4/20Crime 0/20Comedy 3/20Fantasy 0/20Fashion 0/20News programs 0/20Music programs 2/20Devotional 3/20Not interested in otherchannels
4/20
Explanation: The above data shows that 15% lecturers watchdrama, 5% watch mythological programs,20% watch reality, 15%watch comedy, 10% watch music programs, 15% watch devotionalprograms and 20% are not interested in other channels.
Result: There is equal percentage of lecturers who watchdrama, mythological, comedy as well as devotional programs.
Feeling of lecturers who prefer to watch programs as firstchoice for a particular category on other channels:
Feeling from Drama:Your Feeling1. It keeps meaware.
1/3
2. It entertainsme.
2/3
3. I know abouthistory.
0/3
4. It makes mephobic.
0/3
5.I feel thereality.
0/3
6. Createscriminal behavior
0/3
7.I feel Happy. 3/38. I feelromantic.
2/3
9.Any other 0/379

feeling
Explanation: The above data shows that 33.33% lecturers feelaware, 66.66% feel entertainment , 100 feel happy and 66.66%feel romantic.
Result: There is equal percentage of lecturers who feelentertainment as well as romance in watching drama.
Feeling from Mythology:
Your feeling
1. It keeps meaware.
0/1
2. It entertainsme.
1/1
3. I know abouthistory.
1/1
4. It makes mephobic.
0/1
5.I feel thereality.
0/1
6. Createscriminal behavior
0/1
7.I feel Happy. 0/18. I feelromantic.
0/1
9.Any otherfeeling
0/1
Explanation: The above data shows that 100% lecturers feelentertainment as well as want to know about the history behindany myth.
Result: There is full percentage of lecturers who feelentertainment as well as want to know about history behind anymyth.
80

Feeling from reality
Your feeling
1. It keeps meaware.
0/4
2. It entertainsme.
2/4
3. I know abouthistory.
0/4
4. It makes mephobic.
0/4
5.I feel thereality.
1/4
6. Createscriminal behavior
0/4
7.I feel Happy. 2/48. I feelromantic.
1/4
9.Any otherfeeling
Feel action, 1/4
Explanation: The above data shows that 50% lecturers feelentertainment , 25% feel reality, 50% feel happy, 25% feelromance and 25% feel action.
Result: There is equal percentage of lecturers who feelentertainment as well as happy.
Feeling from Comedy:
Your feeling
1. It keeps meaware.
0/3
2. It entertainsme.
3/3
3. I know abouthistory.
0/3
81

4. It makes mephobic.
0/3
5.I feel thereality.
0/3
6. Createscriminal behavior
0/3
7.I feel Happy. 1/38. I feelromantic.
0/3
9.Any otherfeeling
0/3
Explanation: The above data shows that 100% lecturers feelentertainment and 33.33% feel happy who watch comedy programs.
Result: There is full percentage of lecturers who feelentertainment by watching comedy programs.
Feeling from News Programs:
There is no lecturer who watches programs related to newsprograms.
Feeling from Music
Your feeling1. It keeps meaware.
0/2
2. It entertainsme.
1/2
3. I know abouthistory.
0/2
4. It makes mephobic.
0/2
5.I feel thereality.
0/2
6. Createscriminal behavior
0/2
7.I feel Happy. 0/2
82
8. I feelromantic.
1/2
9.Any otherfeeling
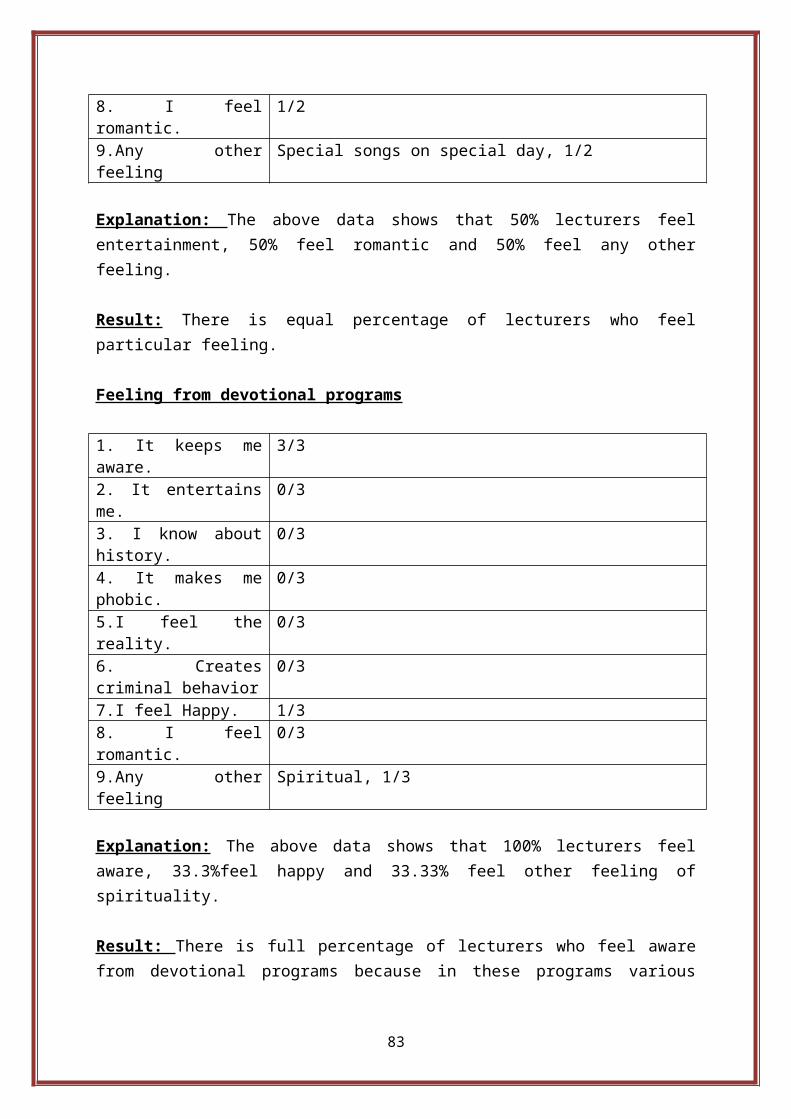
Special songs on special day, 1/2
Explanation: The above data shows that 50% lecturers feelentertainment, 50% feel romantic and 50% feel any otherfeeling.
Result: There is equal percentage of lecturers who feelparticular feeling.
Feeling from devotional programs
1. It keeps meaware.
3/3
2. It entertainsme.
0/3
3. I know abouthistory.
0/3
4. It makes mephobic.
0/3
5.I feel thereality.
0/3
6. Createscriminal behavior
0/3
7.I feel Happy. 1/38. I feelromantic.
0/3
9.Any otherfeeling
Spiritual, 1/3
Explanation: The above data shows that 100% lecturers feelaware, 33.3%feel happy and 33.33% feel other feeling ofspirituality.
Result: There is full percentage of lecturers who feel awarefrom devotional programs because in these programs various
83

speeches are delivered to the society on the nature of humanbeing in today’s World.
Interpretation: The above study shows that there are morelecturers who watch drama on other channels and some of themfeel aware but most of the lecturers watch these only forentertainment which shows the negative attitude of lecturersthat they do not acquire any positive thing from the drama.There are some other lecturers who watch mythologicalprograms on other channel and want to know history behind anymyth it shows the positive attitude of lecturers and mostinteresting thing is that some watch news programs and feelthat they are aware of any incident which can be occur infuture. So it shows the positive side of the programs whichare telecasted on other channels.
Q.10. Which type of programs do you like most?
1. Related to women 2. Related to children 3. Related tofashion 4. Related to food Habits
Ans. The aim of this question is to find out the impact ofprograms on the attitude of lecturers by dividing the type ofprograms as written above.
Lecturers who like one type of programs:
Related to Women 10/20Related to Children 0/20Related to Fashion 4/20Related to food Habits 5/20
Explanation: The above data shows that 50% lecturers likeprograms related to women, 20% lecturers like programs onfashion and 25% lecturers like programs related to foodhabits.
84

Result: There is more percentage of lecturers who likeprograms related to women.
Lecturers who like two type of programs:
Related to fashion + Relatedto food habits
1/20
Explanation: Lecturers who watch two types of programs, inwhich 5% lecturers watch two types of programs
Result: Very less percentage of lecturers watch two types ofprograms.
Lecturers who like three types of programs:
None
Lecturers who like four types of programs:
None
Interpretation: Study of data shows that most of the lecturerslike programs related to women as compared to food andfashion. It tells the attitude of female lecturers that theylike program related to women issues which aware them withproblems of women which can be an important cause of creatinga program on such basis that it will also attract the femalelecturers.
Q.11. Which type of characters do you like most?
1. Investigative 2.Realistic 3. Devotional 4.Emotional5.Negative 6.Positive
85

Ans. The aim of this question is to find out the effect ofprograms on the attitude of lecturers on particularcharacter.
Investigative 1/20Realistic 10/20Devotional 1/20Emotional 4/20Negative 0/20 Positive 4/20
Explanation: The above data shows that 5% like investigativecharacters, 50% lecturers like realistic characters, 5% likedevotional character, 20% like emotional character, 20% likepositive characters.
Result: There is more percentage of lecturers who feel thatthey like positive characters.
Lecturers who like two characters:
Realistic +Emotional
2/20
Realistic +Devotional
1/20
Emotional + Positive 1/20
Explanation: We can say that 10% like two types of charactersthat is realistic and emotional, 5% like other two types ofcharacters which include realistic and devotional, 5% likeother type of characters which include emotional and positivecharacters.
Result: There is more percentage of lecturers who like twocharacters that is realistic as well as emotional.
Lecturers who like three characters:
86

None
Lecturers who like four characters:
None
Lecturers who like five characters:
None
Lecturers who like five characters:
None Interpretation : The above study shows that most of thelecturers like realistic characters in the programs whichshows positive impact of programs on the attitude oflecturers towards the reality of life. The most interestingthing is that there are equal numbers of lecturers that likeinvestigative and emotional characters and there are number oflectures that life positive characters which shows that thefemale lecturers like positive characters. So we can concludethat these differentiation in the mind of lecturers caused bythe different characters which play different roles inparticular programs.
Q.12. Do you apply above marked character in your own lifeand what do you experience ?
1. Yes 2. No 3. To some extentIf your option is 1 or 3 than your experience: .……………………………………........................................……………………………………………………………………………………………………………….Ans. The aim of this question is to find out that how manylecturers apply the characters in their own life and what theyexperience. It will explain the impact of programs on the
87

attitude of lecturers towards the character and itsapplication in owns life.
Yes 8/20No 7/20To some extent 5/20
Explanation: The above data shows that 50% lecturers applytheir marked characters in there own life, 30% lecturers saythat they do not apply the marked characters and 20% lecturerssay that they apply the marked characters to some extent.
Result: There is more percentage of lecturers who feel thatthey apply the marked characters in their own life accordingto their wish.
Experience of particular lecturer:
Lecturers who say yes:
1.
Feel good.
2.
I behave like that person.
3.
Enhance my confidence.
4.
Vigilant about my surroundings.
5.
Feel positive
6.
Realization of truth by experiencing the knowledge.
7.
Sometimes create problems in life.
8.
Realization of truth.
88

Lecturers who say to some extent:
1.
Nice.
2.
Feel really good.
3.
To know about the balance between professional life andpersonal relations.
4.
Make me feel confident and get aware of the outside World.
5.
I feel good.
Explanation:If we talk about the experience then thoselecturers who apply marked characters in their life or thoselectures who apply the marked characters to some extent hasdifferent experiences. So, it is very difficult to evaluatetheir experiences but we can say that they feel good byapplying the marked characters.
Interpretation: The study of data shows that most of thelecturers apply the marked characters in their own life andexperience a good feeling or we can say that they feel achange in them. So, it shows the positive effect of programson the attitude of lecturers that they want to change theirlife patterns. If we talk about the lecturers those apply themarked characters to some extent feel good and somethingspecial in their life. So it also shows the positive impact ofprograms on the attitude of the lecturers.
Q.13. Do you apply above marked characters in others life andwhat you experience?1.Yes 2. No 3. To some extentIf your option is 1 or 3 than your experience:……........................................................................................……………………………………………………………………………………………………………….
89

Ans. The aim of this question is to find out that how manylecturers apply the characters on others life and what is therole of programs on the attitude of lecturers after applyingthe marked character.
Yes 3/20No 15/20To some extent 2/20
Explanation: The above data shows that 15% lecturers apply themarked characters in others life, 75% do not apply the markedcharacters in others life and 10% lecturers apply the markedcharacters to some extent.
Result: There are more percentage of lecturers who do notapply the marked character in others life but there are somepercentage of lecturers who apply the marked characters inothers life but in positive manner.
Experience of particular Lecturer with Yes option:
1.
Feel good
2.
Feel good
3.
Feel good
Explanation: Lecturers who apply marked characters on otherslife , in which 15% lecturers apply the marked characters onothers life and experience a good feeling.
Result: Lecturers feel good after applying the markedcharacters.
Experience of particular Lecturer with to some extent option:
90

1.
Character shows my near and dear ones
2.
Feel good
Explanation: Lecturers who apply the marked characters tosome extent and experience different feeling in which 5%lecturer experience her near and dear ones in others afterapplying the marked character on their life.
Result: Lecturers watch the image of their dear ones so thatthey can feel their dear ones to their nearby.
Interpretation : The study shows that most of the lecturersdo not apply the marked characters in others life and thoselecturers who apply the marked characters in others life areless in percentage but they apply it in a positive manner.So, we can say that programs do not create any wrong behaviorin the mind of female lecturers.
Q.14. How much time do you spend on watching Televisionprogramme?1. Half an Hour 2. One Hour 3. Two Hour
4. More than that Ans. The aim of this question is to find out the time oflecturers they spend in watching television programs. So, itwill clarify the attitude towards the time management in theirbusy schedule regarding watching programs which clarify theimpact of programs.
Half an Hour 3/20One Hour 11/20Two Hour 7/20More than that 0/20
91

Explanation: The above data shows that 15% lecturers watchprograms for half an hour, 55% lecturers watch programs forone hour, 35% lecturers watch the programs for two hour.
Result: There are more percentage of lecturers who watch thetelevision programs to one hour.Interpretation: The study shows that most of the lecturerswatch programs for one hour. It shows the effect of programsthat something is there in the programs that lecturers watchthem which we can say that it is a neutral effect of programson the lecturers.
Q.15. At what time do you prefer to watch Televisionprogramme?
1. Morning 2. After Noon 3. Evening 4.Late Night
Ans. The aim of this question is to find out the time which ispreferred by the lecturers to watch television programs whichclarify the eagerness of the lecturers to watch programs.
1. Morning 0/202. After Noon 1/203. Evening 16/204. Late Night 3/20
Explanation: The above data shows that 5% lecturers watchprograms at after noon, 80% says that they watch programs inevening, 15% lecturers watch the programs in late night.
Result : There are more percentage of lecturers who watchprograms at evening.
Interpretation: The study shows that most of the lecturerswatch the programs in evening. So, it tells the effect ofcharacters of the programs on the mind set of lecturers that
92

they watch that character in evening episodes which shows thatsomething is there which attract the lecturers as a resultthey watch the programs in evening because they are free inevening time.
Q.16. Do you leave all other important work while watchingTelevision Programme?
1. Yes 2.No 3.To some extent.
Ans. The aim of this question is to find out that how manylecturers leave their important work and how many lecturersleave no work and how many lecturers leave their work to someextent. So that we conclude the effect of program on theattitude of lecturers that how important a program for them.
Yes 3/20No 17/20To some extent 0/20
Explanation: The above data shows that only 15% lecturersleave their important work while watching programs ,85%lecturers do not leave their important work while watchingprogram.Result: There are less percentage of lecturers who leave theirimportant work while watching programs.
Interpretation: The study shows that most of the lecturers donot leave their important work while watching programs. So, ittells the attitude of female lecturers that they watchprograms but they do not leave their important work but theinteresting thing is that some of the lectures leave theirimportant work. So, those lecturers who come in this categoryhave more attraction towards television programs which meanssome percentage of lecturers are addict of programs as aresult they leave their important work which we can say that
93

the programs have negative impact on some percentage of femalelecturers.
Q.17. Do you feel that Television programs are responsible forsocial change?
1.If yes,why? ..............................................................................................................................................……………………………………………………………………………………………………………….
2.If no,why?.................................................................................................................................................……………………………………………………………………………………………………………….Ans. The aim of this question is to find out that how manylecturers feel that programs bring social changes which willclarify the importance of programs to bring social change inthe eyes of lecturers.
Yes 17/20No 3/20
Explanation: The data shows that 85% of the lecturers feelthat programs bring social change, 10% of the lecturers do notfeel that programs bring social change.
Result: There is more percentage of lecturers who feel thatprograms bring social change.
Opinion of the lecturers who say yes:
1 Change the society.2. Change the society.
94

3. People create the situations just like the programs.4 Women are becoming more powerful.5. Influence the people in that direction.6. People apply the things without knowing the result.7. Brings social change.8. Change the mindset of society.9. Teenagers and kids are influenced by the programs.10.
Women adopt fashion .
11.
Effects the thinking of the viewers.
12.
Both positive and negative effects.
13.
Lifestyle of the people changes.
14.
People influenced by negativities and positivities.
15.
Women know about the current scenario of the World andthey create power to face them.
16.
We behave as the television program characters.
17.
Give lesson to people
Opinion of the lecturers who say no:
1.
Wastage of time
2.
Nothing to say
3.
Nothing to say
Interpretation: The study shows that most of the lecturersfeel that programs brings social change which means somethingimportant is created in the programs so that it effects thesociety which shows the positive side of programs on thesociety and from here we can conclude that programs arechanging the thinking of lecturers so that they experience asocial change in the society by the medium of programs.
95

Q.18. Do you feel that something innovative should be done toimprove the quality of programs?Ans:-……………………………………………………………………………………………………………………………………………………………………………………………………………………………… Ans. The aim of this question is to find out that how manylecturers want something innovative in the quality of programsand how many do not agree with it which will clarify the needof innovation in the programs in the eyes of lecturers.
Yes 15/20No 5/20
Explanation:The data shows that 75% feel that somethinginnovative is done to improve the quality of the programs and25% feel that nothing should be done to improve the quality ofprograms.
Result: There are more percentage of lecturers who say thatinnovation should be done to improve the quality of programs.
Opinion of the lecturers who say yes:
1. Brings family problems2. Guidelines should be there in serials3. More social issues should be taken4. Highlight the social change5. Story should be not stretched.6. More educational programs7. Different programs should be there8. Social programs9. Positive programs should be there10.
Programs of public interest
11.
Concept of drama should be changed
96

12.
Reality programs should be more.
13.
Innovative programs
14.
Nothing to say
15.
Inspirational programs should be there
If No, than,
Nothing to say.
Interpretation: The study shows that most of the lecturerswant that something innovative should be done to improve thequality of programs which shows that they keep an eye on everycategory of programs as a result they feel that somethinginnovative is done to improve the quality of programs so ittells the innovative effects of programs on the mindset offemale lecturers as a result they feel that some new thingsshould be created in programs which can aware the women ofevery category.
97

DATA ANALYSIS OF TEACHERS
98

Q.1. Do you watch programs on TV?
1. Yes 2. No
If yes, than
(a) Daily (b) Alternate day (c) Sometimes(d) Most of the day Ans: The aim of this question is to know how many teacherswatch the television programs and if they watch then what isthe routine of television program watching which will clarifythe impact of programs on the attitude of teachers.
Yes 20/20No 0/20
Explanation: The data shows that all 100% teachers watchtelevision programs on various channels.
99

Result: There is full percentage of teachers who watchprograms.
Their routine to watch television programs
Daily 9/20Alternate Day 0/20Sometimes 7/20Most of the day 4/20
Explanation: The data shows that 45% watch programs daily, 35%watch programs something and 20% watch most of the day.
Result: There is more percentage of teachers watch programsdaily.
Interpretation: The above study shows that most of theteachers watch programs and in which most of the teacherswatch programs daily and those teachers who watch programsmost of the day prefer to watch whole episodes on Sunday whichshows the impact of programs on the teachers that somethinginteresting present in the programs that mostly teachers watchthem daily.
Q.2. Which type of programs do you watch mostly?1. Social 2.Entertainment 3.Educational 4.Awareness
5.Devotional
Ans : The aim of this question is to find out the types ofprograms which the teachers watch so that we can conclude thatwhat is the impact of programs on the attitude of teachers
100

behind watching these programs. It may be of one category ormore than one category for the teachers.
One Type :
Number of teachers who watch one type of programme :
Social 2/20Entertainment 11/20Educational 1/20Awareness 5/20Devotional 0/20
Explanation: The above data shows that 10% teachers watchsocial programs, 55% watch entertainment, 5% watch educationalprograms and 20% watch awareness related programs.
Result: There is more percentage of teachers who watchprograms of entertainment.
Two type :
Number of teachers who watch two type of programs :
Social +Educational 1/20Entertainment + Awareness 1/20
Explanation: The above data shows that 5% teachers watchprograms related to social as well as educational and 5% watchprograms related to entertainment as well as awareness.
Result: There are 10% teachers watch two types of programs.
Three Type :
Number of teachers who watch three types of programs :
101

There are no teachers who watch three types of programs.
Four Type :
Number of teachers who watch four type of program:There are no teachers who watch four types of programs.
Five Type :
There are no teachers who watch five types of programs.
Interpretation: The above study shows that most of theteachers watch programs related to entertainment or we can saythat they watch programs only for entertainment but there aresome percentage of teachers who watch programs related tosocial issues as well as awareness which shows the bothnegative as well as positive impact of programs on theattitude of teachers.
Q.3. Which channel programs do you like most?
1. Zee TV 2. Sony 3. Colors 4. Life Ok5.Discovery 6.Others
Ans. The aim of this question is to find out that whichchannel programs are liked by the teachers which clarify theimportant channel programs impact on the attitude of teachers. Number of teachers who like one type of channel programs:
Zee TV 2/20Sony 2/20Colors 8/20Others 3/20
102

Explanation: The above data shows that 10% teachers like ZeeTV, 10% like Sony, 40% like Colors and 15% watch otherchannels. Result: There is more percentage of teachers who like Colors.
Number of teachers who like two type of channels programs :
Colors + Others 1/20Zee TV + Colors 2/20
Explanation: The above data shows that 5% teachers like Colorsas well as other channels and 10% like Zee TV as well asColors.
Result: There are 15% teachers who like two types of channelsprograms.
Number of teachers who like three types channels programs :
Sony + Life OK + Others 1/20
Explanation: The above data shows that 5% teachers like Sony,Life OK as well as others channels programs.
Result: There are only 5% teachers who like three types ofprograms.
Number of teachers who like four types of channels programs :
Zee TV + Colors + Life OK +Discovery
1/20
Explanation: The above data shows that 5% teachers like ZeeTV, Colors, Life OK as well as Discovery.
103

Result: There are only 5% teachers who like four types ofprograms.
Number of teachers who like five types of channels programs :
Zee TV + Sony + Colors +Discovery+ Others
1/20
Explanation: The above data shows that 5% teachers like ZeeTV, Sony, Colors, Discovery as well as others.
Result: There are only 5% teachers who like five typeschannels programs.
Number of teachers who like six types of channels programs :
There is no teacher who likes six types of channel programs.
Interpretation: The study shows that there are teachers wholike five types of channels programs but most of the teacherslike programs on Colors because Colors telecast programs onsocial issues as well as family issues with their solutionwhich shows the positive effect of programs of Colors on themindset of teachers and most interesting fact is that Colorsis common in two types, four types as well as five typeschannels programs which absolutely clarify the reason behindthe programs of Colors that more percentage of teachers areeager to like programs on Colors as compared to Sony , Zee TVas well as others but from this we cannot say that all theteachers like programs on Colors because there are somepercentage of teachers who like Zee TV as well as Sony.
104

Note : I have divided the data on the basis of choices ofteachers marked by the teachers from Q.4 to Q.6 For example:
1.First Choice
2.Second Choice
3.Third Choice
and for Q.7 to Q.9 I shall take only the first choice ofteachers.For example:1.First Choice Only
So, I shall do my study on choice basis from Q.4 to Q.9.
105

Q.4. Which category of programme/programs of Zee TV do youwatch mostly and what do you feel?Ans:- ………………………………………………………………………………………………………
1. Drama 2.Historical 3.Horror 4. Mythology 5.Reality
1. It keeps meaware.2. It entertainsme.3. I know abouthistory.4. It makes mephobic.5.I feel thereality.6. Createscriminalbehavior7.I feel Happy.8. I feelromantic.9.Any otherfeeling
Ans. The aim of this question is to find out that whichcategory of programs on Zee TV liked by the teachers and whatthey feel after watching these programs which will clarify theimpact of programs of Zee TV on the attitude of teachers.
106

1. Teachers who prefer to watch programs as first choice for aparticular category on Zee TV:
Drama 7/20Historical 2/20Horror 0/20Mythology 0/20Reality 0/20Not interested in Zee TVprograms
12/20
Explanation: The above data shows that 30% teachers preferdrama, 10% prefer historical programs and 60% take no interestin programs of Zee TV.
Result: There is more percentage of teachers who do not takeinterest in the programs of Zee TV.
Feeling of teachers who prefer to watch programs as firstchoice for a particular category on Zee TV:
(a) Feeling from Drama :
Your Feeling1. It keeps meaware.
3/7
2. It entertainsme.
6/7
3. I know abouthistory.
1/7
4. It makes mephobic.
0/7
5.I feel thereality.
2/7
6. Createscriminalbehavior
0/7
7.I feel Happy. 0/78. I feel 0/7
107

romantic.9.Any otherfeeling
0/7
Explanation: The above data shows that 42.85% teachers feelaware, 85.71% feel entertainment, 14.28% feel about historyand 28.57% feel reality
Result: There is more percentage of teachers who feelentertainment from the drama of Zee TV.
(b)Feeling from Historical category programs :
Your Feeling1. It keeps meaware.
1/2
2. It entertainsme.
0/2
3. I know abouthistory.
2/2
4. It makes mephobic.
0/2
5.I feel thereality.
1/2
6. Createscriminalbehavior
0/2
7.I feel Happy. 0/28. I feelromantic.
0/2
9.Any otherfeeling
0/2
Explanation: The above data shows that 50% teachers feelaware, 100% feel that they know about the history and 5% feelthe reality.
108

Result: There is full percentage of teachers who want toknow about history.
(c) Feeling from Horror category programs:
There is no teacher under this category of first choice on ZeeTV.
(d)Feeling from Mythology category programs:
There is no teacher under this category of first choice on ZeeTV.
(e) Feeling from Reality category programs:
There is no teacher under this category of first choice on ZeeTV who watch reality programs.
2. Teachers who prefer to watch programs as second choice fora particular category on Zee TV:
Drama 0/20Historical 1/20Horror 0/20Mythology 0/20Reality 0/20Not interested in Zee TVprograms
12/20
Explanation: The above data shows that 5% teachers preferhistorical programs of Zee TV.
Result: There is very less percentage of teachers who preferto watch programs as a second choice of programs.
Feeling of teachers who prefer to watch programs as secondchoice for a particular category on Zee TV:
109

(a) Feeling from Drama category:
There is no teacher who come under the category of secondchoice and prefer to watch drama on Zee TV. (b) Feeling from Historical category programs :
1. It keeps meaware.
0/1
2. It entertainsme.
1/1
3. I know abouthistory.
1/1
4. It makes mephobic.
0/1
5.I feel thereality.
0/1
6. Createscriminalbehavior
0/1
7.I feel Happy. 0/18. I feelromantic.
0/1
9.Any otherfeeling
0/1
Explanation: The above data shows that 100% teachers feelentertainment as well as want to know about history.
Result: There is full percentage of teachers who feel thesame feeling for the programs realated to history.
(c) Feeling from Horror category programs:
There is no teacher who come under the category of secondchoice and prefer to watch drama on Zee TV.
(d)Feeling from Mythology category programs:
110

There is no teacher who come under the category of secondchoice and prefer to watch drama on Zee TV.
(e) Feeling from Reality category programs:
There is no teacher who come under the category of secondchoice and prefers to watch reality on Zee TV
3.Teachers who prefer to watch programs as third choice for aparticular category on Zee TV:
There is no teacher who comes under the category of thirdchoice of programs.
Interpretation: The above study shows that most of theteachers watch drama on Zee TV and feel the entertainment andthere are some teachers who feel awareness as well as realityin watching drama on Zee TV which shows that programs of ZeeTV has more negative effect as compare to positive effectbecause programs of Zee TV give them only entertainment but onthe other hand some of the teachers feel aware as wellexperience the reality of life which shows that there are somepast memories of teachers is shown in Drama of Zee TV whichmake them feel their past as well as they feel the reality ofpresent time which shows that the programs have some positiveeffect on the mind of teachers and if we talk about the secondchoice then most of the teachers watch programs relate tohistory and want to know about the history which is a positiveside of programs related to history of India.
Q. 5.Which category of programme/programs of Sony do youwatch mostly?
Ans:- ………………………………………………………………………………………………………
111

1. Drama 2.Historical 3.Horror 4.Reality5.Crime/Thriller
Your Feeling:
1. It keeps meaware.2. It entertainsme.3. I know abouthistory.4. It makes mephobic.5.I feel thereality.6. Createscriminal behavior7.I feel Happy.8. I feelromantic.9.Any otherfeeling
Ans. The aim of this question is to find out that whichcategory of programs liked by the teachers on Sony and whatthey feel after watching these programs which will clarify theimpact of programs of Sony on the attitude of teachers.
1.Teachers who prefer to watch programs as first choice for aparticular category on Sony:
Drama 1/20Historical 0/20Horror 0/20Reality 0/20Crime/Thriller 8/20Not interested in Sonyprograms
11/20
112

Explanation: The above data shows that 5% teachers preferdrama,40% prefer crime/thriller and 55% take no interest inthe programs of Sony.
Result: There is more percentage of teachers who do not preferto watch programs on Sony.
Feeling of teachers who prefer to watch programs as firstchoice for a particular category on Sony:
(a) Feeling from Drama :
Your Feeling1. It keeps meaware.
0/1
2. It entertainsme.
0/1
3. I know abouthistory.
0/1
4. It makes mephobic.
0/1
5.I feel thereality.
1/1
6. Createscriminalbehavior
0/1
7.I feel Happy. 0/18. I feelromantic.
0/1
9.Any otherfeeling
0/1
Explanation: The above data shows that 100% teachers feelreality in the drama of Sony.
Result: There is full percentage of lecturers who feel realityin watching drama on Sony.
113

(b)Feeling from Historical category programs :
There is no teacher who comes under category of first choicewho watch historical programs.
(c) Feeling from Horror category programs:
There is no teacher who comes under category of first choicewho watch historical programs.
(d) Feeling from Reality category programs:
There is no teacher who comes under category of first choicewho watch historical programs.
(e) Feeling from crime/thriller category programs:
1. It keeps meaware.
8/8
2. It entertainsme.
2/8
3. I know abouthistory.
0/8
4. It makes mephobic.
0/8
5.I feel thereality.
2/8
6. Createscriminalbehavior
0/8
7.I feel Happy. 0/88. I feelromantic.
0/8
9.Any otherfeeling
0/8
Explanation: The above data shows that 100% teachers feelaware,25% feel entertainment and 25% feel reality.
114

Result: There is full percentage of teachers who feel awareand equal percentage who feel entertainment as well as realityin watching programs related to crime/thriller.
2. Teachers who prefer to watch programs as second choice fora particular category on Sony:
Drama 0/20Historical 1/20Horror 0/20Reality 0/20Crime/Thriller 0/20Not interested in Sonyprograms
11/20
Explanation: The above data shows that 100% teachers preferhistorical programs.
Result: There is very less percentage of teachers who takeinterest in the historical programs of Sony which come undersecond choice.
Feeling of teachers who prefer to watch programs as secondchoice for a particular category on Sony:
(a) Feeling from Drama :There is no teacher who comes under category of second choicewho watch drama on Sony.
(b)Feeling from Historical category programs :
Your Feeling1. It keeps meaware.
0/1
2. It entertainsme.
0/1
3. I know abouthistory.
1/1
115

4. It makes mephobic.
0/1
5.I feel thereality.
0/1
6. Createscriminalbehavior
0/1
7.I feel Happy. 0/18. I feelromantic.
0/1
9.Any otherfeeling
0/1
Explanation: The above data shows that 100% teachers feel thatthey want to know about the history.
Result: There is full percentage of teachers who feel thatthey want to know about history of India after watchingprograms related to history on Sony.
(c) Feeling from Horror category programs:
There is no teacher who comes under category of second choicewho watch horror programs.
(d) Feeling from Reality category programs:
There is no teacher who comes under the category of secondchoice and prefer to watch reality on Sony.
(e) Feeling from crime/thriller category programs:
There is no teacher who comes under category of second choicewho watch crime/thriller programs.
(3) Teachers who prefer to watch programs as third choice fora particular category on Sony:
116

Drama 0/1Historical 0/1Horror 0/1Reality 1/20Crime/Thriller 0/1Not interested in Sonyprograms
0/1
Explanation: The above data shows that 5% teachers watchreality as a third choice of particular category.
Result: There is very less percentage of teachers who watchreality as third choice.
Feeling of teachers who prefer to watch programs as thirdchoice for a particular category on Sony:
Feeling from Reality:1. It keeps meaware.
0/1
2. It entertainsme.
0/1
3. I know abouthistory.
0/1
4. It makes mephobic.
0/1
5.I feel thereality.
1/1
6. Createscriminal behavior
0/1
7.I feel Happy. 1/18. I feelromantic.
0/1
9.Any otherfeeling
0/1
Explanation: The above data shows that 100% teachers feel thereality as well as happy.
117

Result: There is full percentage of teachers who feel thesame feeling for a particular programme.
Interpretation: The above study shows that most of theteachers who come in the category of first choice of programsprefer to watch crime/thriller which aware them and make themalert from the dangerous incidents in the present scenario oflife which shows the positive impact of the programs in themind of teachers and some of them watch historical programs onthe Sony which also make them aware of real facts of historyof India which is also a positive impact of programs on themindset of teachers.
Q.6.Which category of programme/programs of Colors do youwatch mostly and what do you feel?
Ans:- …………………………………………………………………………………………………….
1. Drama 2. Comedy 3. Reality
Your Feeling1. It keeps meaware.2. It entertainsme.3. I know abouthistory.4. It makes mephobic.5.I feel thereality.6. Createscriminal behavior7.I feel Happy.8. I feelromantic.9.Any otherfeeling
118
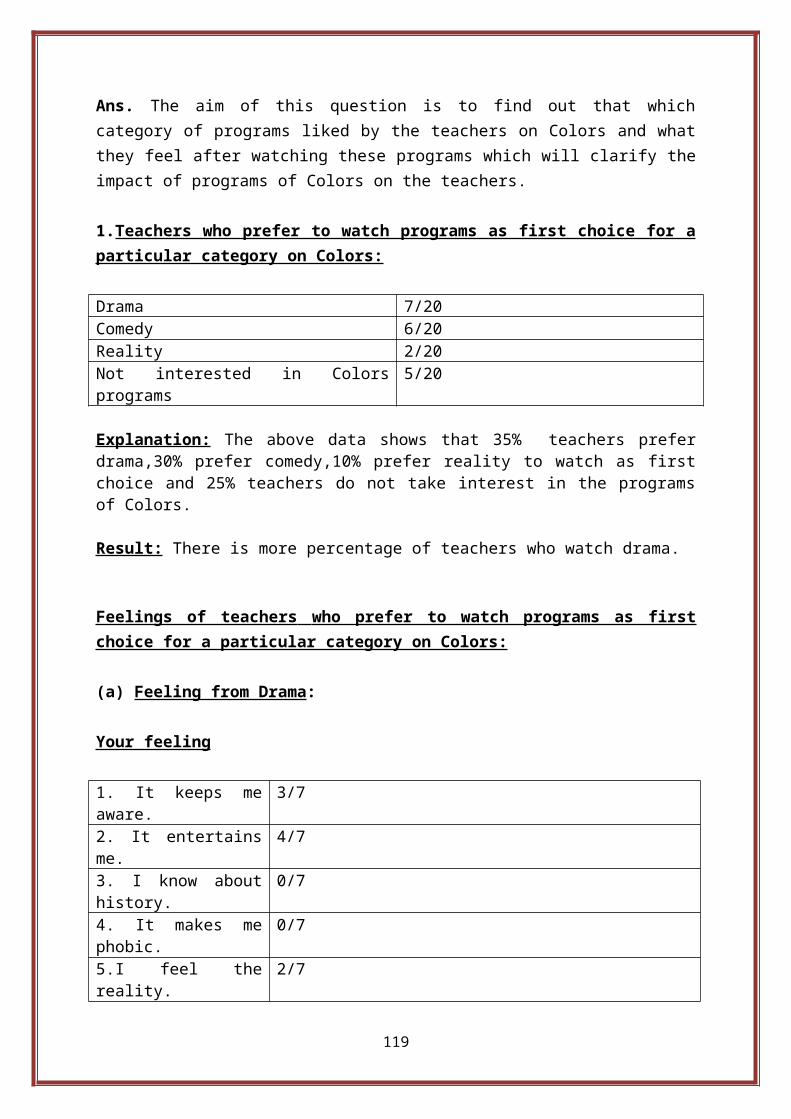
Ans. The aim of this question is to find out that whichcategory of programs liked by the teachers on Colors and whatthey feel after watching these programs which will clarify theimpact of programs of Colors on the teachers.
1.Teachers who prefer to watch programs as first choice for aparticular category on Colors:
Drama 7/20Comedy 6/20Reality 2/20Not interested in Colorsprograms
5/20
Explanation: The above data shows that 35% teachers preferdrama,30% prefer comedy,10% prefer reality to watch as firstchoice and 25% teachers do not take interest in the programsof Colors.
Result: There is more percentage of teachers who watch drama.
Feelings of teachers who prefer to watch programs as first choice for a particular category on Colors:
(a) Feeling from Drama:
Your feeling
1. It keeps meaware.
3/7
2. It entertainsme.
4/7
3. I know abouthistory.
0/7
4. It makes mephobic.
0/7
5.I feel thereality.
2/7
119

6. Createscriminal behavior
0/7
7.I feel Happy. 3/78. I feelromantic.
0/7
9.Any otherfeeling
Social change, 1/7
Explanation: The above data shows that 42.85% teachers feelaware, 57.14% feel entertainment, 28.57% feel reality, 42.85%feel happy and 14.28% feel the feeling of social change.
Result: There is more percentage of teachers who feelentertainment in watching drama of Colors.
(b) Feeling from Comedy:
Your feeling
1. It keeps meaware.
0/6
2. It entertainsme.
1/6
3. I know abouthistory.
0/6
4. It makes mephobic.
0/6
5.I feel thereality.
0/6
6. Createscriminal behavior
0/6
7.I feel Happy. 6/68. I feelromantic.
0/6
9.Any otherfeeling
0/6
Explanation: The above data shows that 16.66% teachers feelentertainment and 100% feel happy.
Result: There is full percentage of teachers who feel happy inwatching Comedy on Colors.
120

(c) Feeling from Reality:
Your feeling
1. It keeps meaware.
0/2
2. It entertainsme.
1/2
3. I know abouthistory.
0/2
4. It makes mephobic.
0/2
5.I feel thereality.
2/2
6. Createscriminal behavior
0/2
7.I feel Happy. 0/28. I feelromantic.
0/2
9.Any otherfeeling
0/2
Explanation: The above data shows that 50 % teachers feelentertainment and 100% feel reality in watching realityprograms on Colors.
Result: There is full percentage of teachers who feel realityin watching programs related to reality.
2. Teachers who prefer to watch programs as second choice fora particular category on Colors:
Drama 0/20Comedy 2/20Reality 0/20Not interested in Colorsprograms
10/20
121

Explanation: The above data shows that10% teachers watchreality.
Result: There is very less percentage of teachers who watchcomedy.
Feeling of teachers who prefer to watch programs as secondchoice for a particular category on Colors:
(a)Feeling from Drama
There is no teacher under the category of second choice whowatch drama on Colors.
(b)Feeling from Comedy
Your Feeling:
1. It keeps meaware.
0/2
2. It entertainsme.
1/2
3. I know abouthistory.
0/2
4. It makes mephobic.
0/2
5.I feel thereality.
0/2
6. Createscriminal behavior
0/2
7.I feel Happy. 1/28. I feelromantic.
0/2
9.Any otherfeeling
0/2
Explanation: The above data shows that 50% teachers feelentertainment as well as happyin watching programs related to Comedy.
122

Result: There is equal percentage of teachers who feelentertainment as well as happy in watching Comedy programs onColors.
(c)Feeling from Reality
There is no teacher under the category of second choice whowatch reality on Colors.
Teachers who prefer to watch programs as third choice for aparticular category on Colors:
There is no teacher under the category of third choice.
Interpretation: The above study shows most of the teacherswatch drama as well as comedy. From drama they feel realitywhich is the positive impact of programs of the programs onthe attitude of teachers and for refreshment they prefercomedy programs which keep them away from tiredness as well astensions which is also the great effect of programs on theteachers and in second category they also watch comedyprograms which make them happy and keep their worries far awaywhich is the most important factor of positivity of programsin the busy life which make them healthy. So we can concludethat programs of Colors have positive impact on the teachers.
Q.7. Which category of programme/programs of Life Ok do youwatch mostly and what do you feel?
Ans:- ………………………………………………………………………………………………………
1. Drama 2.Mythogical 3.Fantasy 4.Crime
Your Feeling
1. It keeps meaware.2. It entertainsme.3. I know about
123

history.4. It makes mephobic.5.I feel thereality.6. Createscriminal behavior7.I feel Happy.8. I feelromantic.9.Any otherfeeling
Ans. The aim of this question is to find out that whichcategory of programs liked by the teachers on Life OK andwhat they feel after watching these programs which willclarify the impact of programs on the attitude of teachers.
1. Teachers who prefer to watch programs as first choice fora particular category on Life OK:
Drama 0/20Mythological 0/20Fantasy 0/20Crime 10/20Not interested in Life OK 10/20
Explanation: The above data shows that 55% teachers watchcrime and 50% are not interested in Life OK.
Result: There is equal percentage of teachers who watchprograms related to crime on Life OK as well as not interestedin the programs of Life OK.
Feelings of teachers who prefer to watch programs as firstchoice for a particular category on Life OK:
From drama category:
There is no teacher under this category of first choice whowatch drama on Life OK.
124
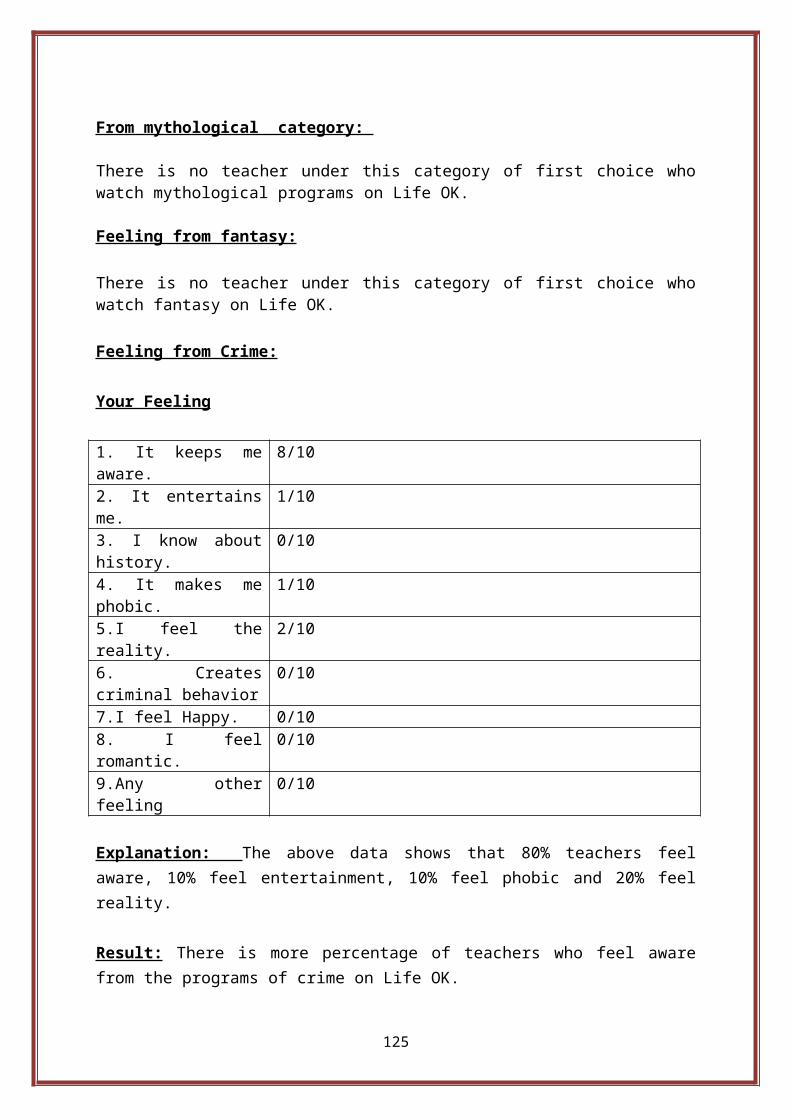
From mythological category:
There is no teacher under this category of first choice whowatch mythological programs on Life OK.
Feeling from fantasy:
There is no teacher under this category of first choice whowatch fantasy on Life OK.
Feeling from Crime:
Your Feeling
1. It keeps meaware.
8/10
2. It entertainsme.
1/10
3. I know abouthistory.
0/10
4. It makes mephobic.
1/10
5.I feel thereality.
2/10
6. Createscriminal behavior
0/10
7.I feel Happy. 0/108. I feelromantic.
0/10
9.Any otherfeeling
0/10
Explanation: The above data shows that 80% teachers feelaware, 10% feel entertainment, 10% feel phobic and 20% feelreality.
Result: There is more percentage of teachers who feel awarefrom the programs of crime on Life OK.
125

Interpretation: The above study shows that most of theteachers watch programs related to crime which make them awarefrom the upcoming incidents on work places as well as insociety which is the positive impact of programs of Life OK inthe attitude of teachers because more and more percentage ofteachers want to know about the laws and their implementationtowards the person who has done wrong with them.
Q.8. Which category of programme/programs do you watch onDiscovery and what do you feel?
1. Medical Science 2.New technologies 3.Environment4.Culture 5.Health 6.Foods 7.Historical 8.Adventurous
Your Feeling
1.It aware me.2.It entertain me.3I know about externalWorld.4.I feel phobic.5.Innovative ideascome in my mind6.I know about healthproblems.7.Want to doadventure.8. Other feeling.. Ans. The aim of this question is to find out that whichcategory of programs liked by the teachers on Discovery andwhat they feel after watching these programs which willclarify the impact of programs of Discovery on the attitude ofteachers.
1.Teachers who prefer to watch programs as first choice for aparticular category on Discovery:
Medical Science 0/20New Technologies 1/20
126

Environment 0/20Culture 1/20Health 1/20Food 0/20Historical 1/20Adventurous 2/20Not interested in Discovery 14/20
Explanation: The above data shows that 5% teachers watchprograms of new technologies, t ,5% related to culture and 5%watch historical programs, 10% watch programs related toadventure and 70% do not take any interest in the programs ofDiscovery.
Result: There is more percentage of teachers who do not takeinterest in the programs of Discovery.
Feeling of teachers who prefer to watch programs as firstchoice for a particular category on Discovery:
1.Feeling from Medical Science category programs:
There is no teacher who watches programs related to medicalsciences.
2.Feeling from New Technologies category programs:
Your feeling1.It aware me. 0/12.It entertain me. 0/13.I know aboutexternal World.
0/1
4.I feel phobic. 0/15.Innovative ideascome in my mind
1/1
6.I know about healthproblems.
0/1
7.Want to doadventure.
0/1
8. Other feeling.. 0/1
127

Explanation: The above data shows that 100% teachers feel thatinnovative ideas come in their mind.
Result: There is full percentage of teachers feel thatinnovative ideas come in their mind.
3.Feeling from Environment category programs:
There is no teacher who watch programs related to environment.
4.Feeling from Cultural category programs:
Your feeling
1.It aware me. 0/12.It entertain me. 1/13.I know aboutexternal World.
1/1
4.I feel phobic. 0/15.Innovative ideascome in my mind
0/1
6.I know about healthproblems.
0/1
7.Want to doadventure.
0/1
8. Other feeling.. 0/1
Explanation: The above data shows that 100% teachers feelentertainment as well as know about the external world.
Result: There is full percentage of teachers who feel the samefeeling of entertainment as well as innovation.
5.Feeling from Health category programs:
1.It aware me. 1/12.It entertain me. 0/13.I know about 0/1
128

external World.4.I feel phobic. 0/15.Innovative ideascome in my mind
0/1
6.I know about healthproblems.
1/1
7.Want to doadventure.
0/1
8. Other feeling.. 0/1
Explanation: The above data shows that 100% teachers feelaware as well as know about the health problems.
Result: There is full percentage of teachers who feel the samefeeling of awareness as well as know about the healthproblems.
6. Feeling from food category programs :
There is no teacher who watches programs related to food.
7. Feeling from Historical Category programs:
1.It aware me. 0/12.It entertain me. 0/13.I know aboutexternal World.
1/1
4.I feel phobic. 0/15.Innovative ideascome in my mind
0/1
6.I know about healthproblems.
0/1
7.Want to doadventure.
0/1
8. Other feeling.. 0/1
Explanation: The above data shows that 100% teachers want toknow about the external world.
129

Result: There is full percentage of teachers who feel the samefeeling to know about the external world.
8.Feeling from Adventurous category programs:
1.It aware me. 0/22.It entertain me. 0/23.I know aboutexternal World.
1/2
4.I feel phobic. 0/25.Innovative ideascome in my mind
0/2
6.I know about healthproblems.
0/2
7.Want to doadventure.
2/2
8. Other feeling.. 0/2
Explanation: The above data shows that 50% teachers want toknow about the external world and 100% want to do theadventure.
Result: There is full percentage of teachers who want to doadventure.
Interpretation: The above study shows that most of theteachers do not take interest in the programs of Discoveryand those take interest prefer to watch programs related toadventures which make them to do adventure in their life andsome of the teachers watch programs related to health whichmake them aware from health problems and those watch thoseteachers watch historical programs want to know about thehistory of other countries which is the positive impact ofprograms on the thinking and attitude of teachers by the helpof which they want to do something new and want to earnknowledge on all the fields of new technologies and health.
130

Q.9. Which category of programme/programs do you watch onother channels and what do you feel?Ans: ………………………………………………………………………………………………………
1.Drama 2.Historical 3.Horror 4.Mythology 5.Reality6.Crime 7.Comedy 8.Fantasy 9.Fashion
Your Feeling1. It keeps meaware.2. It entertainsme.3. I know abouthistory.4. It makes mephobic.5. I feel thereality.6. Createscriminal behavior7. I feel Happy.8. I feelromantic.9. Any otherfeeling.
Ans. The aim of this question is to find out that whichcategories of programs teachers watch on other channels andwhat they feel which will clarify the impact of programs ofother channels on the attitude of teachers.
1.Teachers who prefer to watch programs as first choice for aparticular category on other channels:
Drama 4/20Historical 0/20Horror 0/20Mythology 1/20Reality 0/20
131
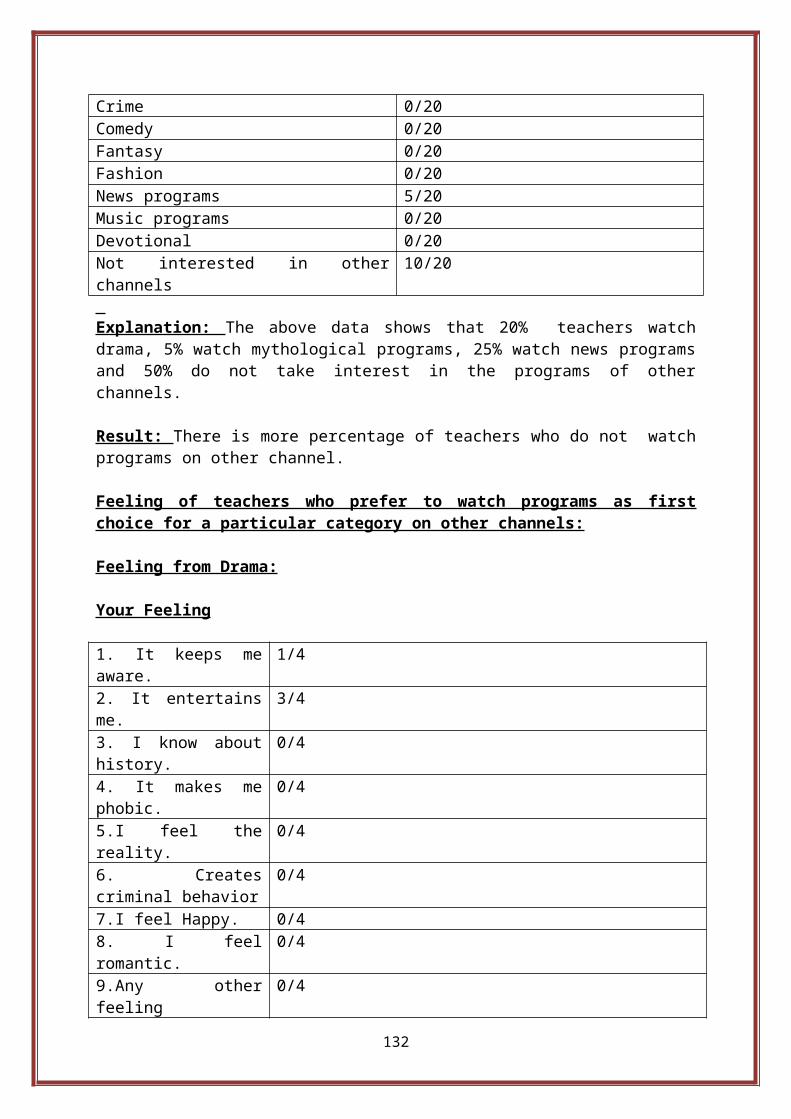
Crime 0/20Comedy 0/20Fantasy 0/20Fashion 0/20News programs 5/20Music programs 0/20Devotional 0/20Not interested in otherchannels
10/20
Explanation: The above data shows that 20% teachers watchdrama, 5% watch mythological programs, 25% watch news programsand 50% do not take interest in the programs of otherchannels.
Result: There is more percentage of teachers who do not watchprograms on other channel.
Feeling of teachers who prefer to watch programs as firstchoice for a particular category on other channels:
Feeling from Drama:
Your Feeling
1. It keeps meaware.
1/4
2. It entertainsme.
3/4
3. I know abouthistory.
0/4
4. It makes mephobic.
0/4
5.I feel thereality.
0/4
6. Createscriminal behavior
0/4
7.I feel Happy. 0/48. I feelromantic.
0/4
9.Any otherfeeling
0/4
132

Explanation: The above data shows that 25% teachers feel awareand 75% feel entertainment.
Result: There is more percentage of teachers who feelentertainment.
Feeling from Mythology:
Your feeling
1. It keeps meaware.
0/1
2. It entertainsme.
1/1
3. I know abouthistory.
1/1
4. It makes mephobic.
0/1
5.I feel thereality.
0/1
6. Createscriminal behavior
0/1
7.I feel Happy. 0/18. I feelromantic.
0/1
9.Any otherfeeling
0/1
Explanation: The above data shows that 100% teachers feelentertainment as well as want to know about the history behindany myth.
Result: There is full percentage of teachers who feelentertainment as well as want to know about history behind anymyth.
Feeling from reality
133

There is no teacher who watches reality programs on otherchannels.
Feeling from Comedy:
There is no teacher who watches comedy programs on otherchannels.
Feeling from News Programs:
1. It keeps meaware.
4/4
2. It entertainsme.
0/4
3. I know abouthistory.
0/4
4. It makes mephobic.
0/4
5.I feel thereality.
0/4
6. Createscriminal behavior
0/4
7.I feel Happy. 0/48. I feelromantic.
0/4
9.Any otherfeeling
0/4
Explanation: The above data shows that 100% teachers feelaware by watching programs of news programs.
Result: There is full percentage of teachers who feel awarefrom the programs of news channels.
Feeling from Music
There is no teacher who watches music programs on otherchannels.
134

Feeling from devotional programs
There is no teacher who watches devotional programs on otherchannels.
Interpretation: The above study shows that there are most ofthe teachers who prefer to watch news programs on otherchannels and feel aware which clarify the positive impact ofprograms on the attitude of teachers. So, we can show thatthere is positive effect of other channels programs on theteachers.
Q.10. Which type of programs do you like most?
1. Related to women 2. Related to children 3. Related tofashion 4. Related to food Habits
Ans. The aim of this question is to find out the impact ofprograms on the attitude of teachers by dividing the type ofprograms as written above.
Teachers who like one type of program:
Related to Women 11/20Related to Children 4/20Related to Fashion 1/20Related to food Habits 2/20
Explanation: The above data shows that 55% teachers likeprograms related to women, 20% like related to children, 5%like related to fashion and 10% like programs related to foodhabits.
Result: There is more percentage of teachers who like programsrelated to women.
135

Teachers who like two type of programs:
Related to children + Relatedto women
1/20
Explanation: The above data shows that 5% teachers likeprograms related to women as well as children.
Result: There is very less percentage of teachers who like twotypes of programs.
Teachers who like three types of programs:
There is no teacher who likes three types of programs.
Teachers who like four types of programs:
There are no teachers who like four types of programs.
Interpretation: The above study of data shows that most of theteachers like programs related to women as compared to foodand fashion. It tells the attitude of teachers that they likeprogram related to women issues which aware them with problemsof women which can be a important cause of creating a programon such basis that it also attract the teachers which tell thepositive impact of programs on the attitude of teachers. So itcan be concluded that more and more teachers are updating themon the current issues of women in the society which clarifythe positive impact of programs on the attitude of teachers.
Q.11. Which type of characters do you like most?
1. Investigative 2.Realistic 3. Devotional 4.Emotional5.Negative 6.Positive
136

Ans.. The aim of this question is to find out the effect ofprograms on the attitude of teachers on particular characterin the programs.
Teachers who like one type of character:
Investigative 2/20Realistic 7/20Devotional 0/20Emotional 1/20Negative 0/20Positive 4/20Teachers who do not like anycharacter
1/20
Explanation: The above data shows that 10% teachers likeinvestigative character, 35% like realistic character, 5% likeemotional characters and 20% like positive characters and 5%do not like any character.
Result: There is more percentage of teachers who likerealistic characters.
Teachers who like two characters:
Realistic + Emotional 1/20Realistic + Positive 2/20
Explanation: The above data shows that 5% like realistic aswell as emotional character and 10% like realistic as well aspositive characters.
Result: There are 15% teachers who like two characters.
Teachers who like three characters:
Realistic + Devotional +Emotional
1/20
137

Investigative + Realistic +Positive
1/20
Explanation: The above data shows that 5% like realistic,devotional as well as emotional characters and 5% likeinvestigative, realistic as well as positive characters.
Result: There is 10% teachers who like three types ofcharacters.
Teachers who like four characters:
There are no teachers who like four characters.
Teachers who like five characters:
There are no teachers who like four characters.
Teachers who like six characters:
There are no teachers who like six characters.
Interpretation: The above study shows that there is morepercentage of teachers who like investigative characters aswell as positive characters. The feeling to like any characteris caused by the programs characters which clarify that we canreach to the final conclusion of teachers that what characterthey want to play in their own life as well as in other lifewhich we can say that programs helps us to find the rightthinking of teachers which shows their attitude towards anycharacter.
Q.12. Do you apply above marked character in your own lifeand what do you experience ?
138

1. Yes 2. No 3. To some extent
If your option is 1 or 3 than your experience: .……………………………………........................................……………………………………………………………………………………………………………….
Ans. The aim of this question is to find out that how manyteachers apply the characters in their own life and what theyexperience. It will explain the impact of programs on theattitude of teachers towards the character and its applicationin owns life.
Yes 2/20No 12/20To some extent 5/20Nothing to mark 1/20
Explanation: The above data shows that 10% teachers apply theprograms characters,60% teachers do not apply the markedcharacters and 25% apply the marked characters to some extentin their own life and 5% have nothing to say in this respect.
Result: There is more percentage of teachers who do not applythe marked characters in their own life.
Experience of teachers who say yes:
Nothing to share
Experience of teachers who say to some extent:
1.Experience fantastic.2. Experience a happy feeling.3. It gives me confidence and encourage me to take the morepowerful decision in life.4.Feel good.
139

Interpretation: The above study shows that some of theteachers apply the marked character in their own life whichclarifies the effect of programs on the attitude of teachersthat they want to become like a real character which is actedin the programs by the cast.
Q.13. Do you apply above marked characters in others life andwhat you experience?
1.Yes 2. No 3. To some extent
If your option is 1 or 3 than your experience:……........................................................................................……………………………………………………………………………………………………………….
Ans. The aim of this question is to find out that how manyteachers apply the characters on others life and what is theimpact of programs on the attitude of teachers after applyingthe marked character.
Yes 3/20No 11/20To some extent 3/20Nothing to mark 1/20
Explanation: The above data shows that 15% teachers apply themarked character in others life and 15% do not apply themarked character in other life.
Result: There is very less percentage of teachers who applythe marked characters on other life but there is some teacherswho apply the marked characters on others life.
Experience of teachers who say Yes :
140

Nothing to share
Experience of teachers who say, to some extent :
1.Get positive response to some extent 2.Nothing to say3. Nothing to say Interpretation: The above study we conclude that there aresome teachers who apply the marked characters in others lifeand feel positive and gain positive experience from otherswhich shows the positive impact of programs on the attitude ofteachers that they watch particular particular programme andapply the positive things in others life as a result they finda positive image of themselves in the eyes of others.
Q.14. How much time do you spend on watching Televisionprogramme?
1. Half an Hour 2. One Hour 3. Two Hour4. More than that
Ans. The aim of this question is to find out the time ofteachers they spend in watching television programs. So, itwill clarify the attitude towards the time management in theirbusy schedule regarding watching programs which clarify theimpact of programs.
Half an Hour 4/20One Hour 6/20Two Hour 7/20More than that 1/20Nothing to mark 2/20
Explanation: The above data shows that 20% teachers watchprograms half an hour, 30% give one hour,35% give two hour, 5%give more than that and 20% have nothing to mark.
141

Result: The above data shows that more percentage of teacherswatch the programs for one hour.
Interpretation: The above study shows that there are moreteachers who watch programs for one hour which shows that intheir busy time teachers give one hour on television programsfor a particular programme which indicate that somethinginnovative is there in these programs which attract theteachers. It may be dressing sense, any character and so on.So it clarifies that programs bound the teachers in particularfix time.
Q.15. At what time do you prefer to watch Televisionprogramme?
1. Morning 2. After Noon 3. Evening 4.Late Night
Ans. The aim of this question is to find out the time which ispreferred by the teachers to watch television programs whichclarify the eagerness of the teachers to watch programs.
1. Morning 0/202. After Noon 0/203. Evening 12/204. Late Night 4/205. Nothing to mark 4/20
Explanation: The above data shows that 60% watch the programsin evening, 20% watch programs at late night and 20% havenothing to say.
Result: There is more percentage of teachers who watchprograms at evening.
142

Interpretation: The above study clarifies the negative impactof programs on the attitude of teachers because there are someteachers who watch programs till late night as a result becomereason for absent in the school and it also affects theirhealth.
Q.16. Do you leave all other important work while watchingTelevision Programme?
1. Yes 2.No 3.To some extent
Ans. The aim of this question is to find out that how manyteachers leave their important work and how many teachersleave no work and how many teachers leave their work to someextent. So that we conclude the effect of program on theattitude of teachers that how important a program for them.
Yes 2/20No 14/20To some extent 1/20Nothing to say 3/20 Explanation: The above data shows that 10% teachers leavetheir important work,70% do not leave their work , 5% leavetheir work to some extent and 15% have nothing to say.
Result: There is more percentage of teachers who do not leavetheir important work while watching programs.
Interpretation: The above study clarifies that there are somepercentage of teachers who leave their important work whilewatching their important programs so it shows the negativeimpact of programs on the attitude of teachers that they leavetheir important work.
143
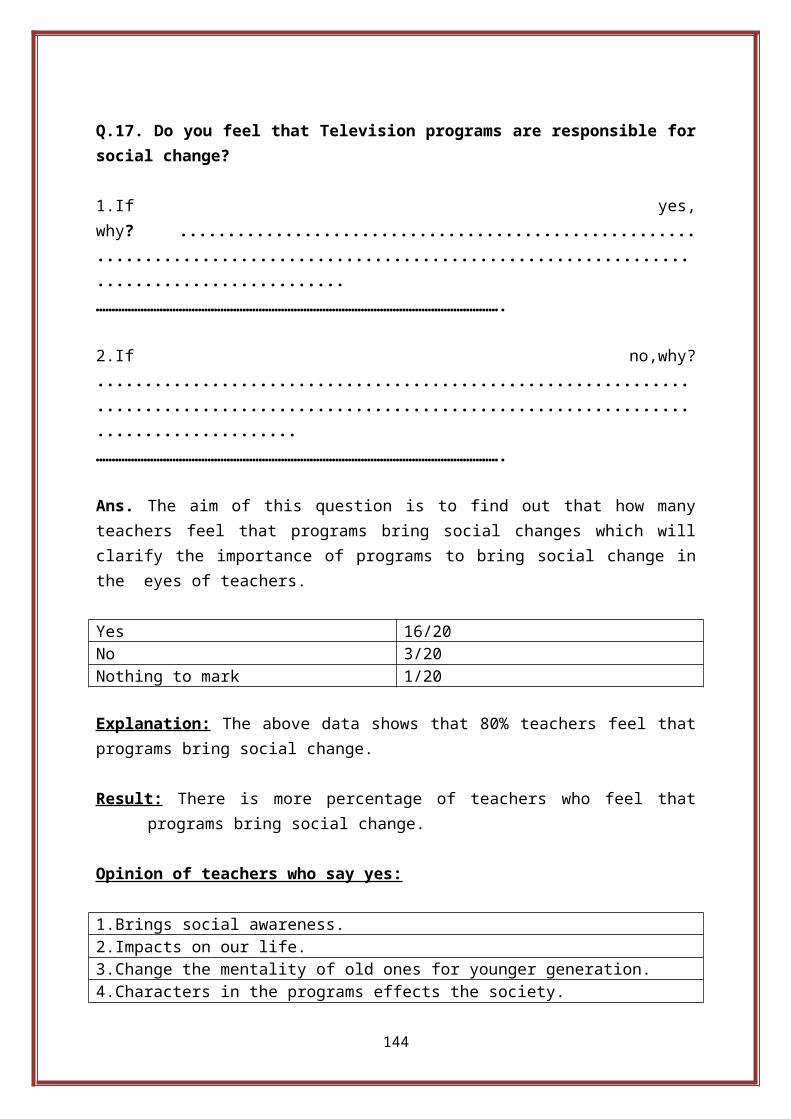
Q.17. Do you feel that Television programs are responsible forsocial change?
1.If yes,why? ..............................................................................................................................................……………………………………………………………………………………………………………….
2.If no,why?.................................................................................................................................................……………………………………………………………………………………………………………….
Ans. The aim of this question is to find out that how manyteachers feel that programs bring social changes which willclarify the importance of programs to bring social change inthe eyes of teachers.
Yes 16/20No 3/20Nothing to mark 1/20
Explanation: The above data shows that 80% teachers feel thatprograms bring social change.
Result: There is more percentage of teachers who feel thatprograms bring social change.
Opinion of teachers who say yes:
1.Brings social awareness.2.Impacts on our life.3.Change the mentality of old ones for younger generation.4.Characters in the programs effects the society.
144

5.Programs leave there influence on so many people.6.Many characters creates awareness in society.7.Make aware of nearby society.8.Changes the thinking of the people.9.Impact the society.10.Aware the people for their rights and give them knowledge.11.Both positive and negative effect.12.Nothing to share.13. Nothing to share.14. Nothing to share.15. Nothing to share.16. Nothing to share.
For No
1. Busy in own work2. Nothing to share
Interpretation: The above study shows that those teachers whofeel that programs brings social change have differentthinking which is very difficult to conclude the main thinkingbecause every teacher watches different programs and feeldifferent feelings for a particular programs as a result theyhave different horizon of thinking so it shows the positiveeffect of programs on the attitude of teachers that by thehelp of which they can think for the betterment of thesociety.
Q.18. Do you feel that something innovative should be done toimprove the quality of programs?Ans:-………………………………………………………………………………………………………………………………………………………………………………………………………………………………
Ans. The aim of this question is to find out that how manyteachers want something innovative in the quality of programs
145

and how many do not agree with it which will clarify theinnovation in the programs in the eyes of teachers.
Yes 13/20No 7/20
Explanation: The above data shows that 65% feel thatinnovation should be done and 35% say no innovation should bethere.
Result: There is more percentage of teachers who feel thatinnovation should be done.
Opinion of the teachers who say yes:
1.
Bulgur dialogue should be banned.
2.
Some of the viewers take these characters as role models.
3.
Programs should be based on moral values.
4.
Programs should be made to improve the society.
5.
Programs should be made on moral values of children.
6.
There is no need to show too much negative roles.
Interpretation: There is more percentage of teachers who feelthat innovation should be there in the quality of programs butthey have different opinions but it is true that most of theteachers want innovations in programs in respect to moralvalues, negative roles and so on. It shows the impact ofprograms that after watching programs of their choice theyponder over all the themes as well as characters of programsand by the help of which reach at a conclusion that innovationis required in the programs to show the real face of societyas well as human nature.
146

DATA ANALYSIS OF DOCTORS
147

Q.1. Do you watch programs on TV?
1. Yes 2. No
If yes, than
(a) Daily (b) Alternate day (c) Sometimes(d) Most of the day Ans: The aim of this question is to know how many doctorswatch the television programs and if they watch then what isthe routine of television program watching which will clarifythe impact of programs on the attitude of doctors.
Yes 20/20No 0/20
Explanation: The data shows that all 100% doctors watchtelevision programs on various channels.
Result: There is full percentage of doctors who watchprograms.
Their routine to watch television programs
Daily 10/20Alternate Day 2/20Sometimes 8/20Most of the day 0/20
148

Explanation: The data shows that 50% watch programs daily,10%watch programs on alternate day and 40% watch sometimes.
Result: There is more percentage of doctors watch programsdaily.
Interpretation:The above study shows that most of the doctorswatch programs and in which most of the doctors watch programsdaily which shows the impact of programs on the doctors thatsomething interesting present in the programs that mostlydoctors watch them daily.
Q.2. Which type of programs do you watch mostly?
1. Social 2.Entertainment 3.Educational 4.Awareness 5.Devotional
Ans : The aim of this question is to find out the types ofprograms which the doctors watch so that we can conclude thatwhat is the effect of programs on the attitude of doctorsbehind watching these programs. It may be of one category ormore than one category for the doctors.
One Type :
Number of doctors who watch one type of programme :
Social 1/20Entertainment 9/20Educational 0/20Awareness 1/20Devotional 1/20Nothing to say 1/20
Explanation: The above data shows that 5% doctors watch socialprograms, 45% watch entertainment, 5% watch awareness, 5%watch devotional related programs and 5% have nothing to say.
149

Result: There is more percentage of doctors who watch programsof entertainment.
Two type :
Number of doctors who watch two type of programs :
Social +Entertainment 3/20Entertainment + Awareness 2/20Entertainment + Educational 1/20
Explanation: The above data shows that 15% doctors watchprograms related to social as well as entertainment, 10% watchentertainment as well as awareness related program and 5%watch programs related to entertainment as well as education.
Result: There are 30% doctors who watch two types of programs.
Three Type :
Number of doctors who watch three types of programs :
There are no doctors who watch three types of programs.
Four Type :
Number of doctors who watch four type of program:
There are no doctors who watch four type of programs.
Five Type :
There are 5% doctors who watch five type of programs.
Interpretation: The above study shows that most of the doctorswatch programs related to entertainment or we can say that
150

they watch programs only for entertainment but there are somepercentage of doctors who watch two types of programs in whichentertainment programs are common which shows that theybelieve in entertainment which we can say something is therein these programs which entertain them which clarify thepositive impact of programs on the doctors.
Q.3. Which channel programs do you like most?
1. Zee TV 2. Sony 3. Colors 4. Life Ok5.Discovery 6.Others
Ans. The aim of this question is to find out that whichchannel programs are liked by the doctors which clarify theimportant channel programs impact on the attitude of doctors. Number of doctors who like one type of channel programs:
Zee TV 0/20Sony 1/20Colors 4/20Life OK 1/20Others 5/20
Explanation: The above data shows that 5% doctors like Sony,20% watch Colors, 5% like Life OK and 25% like other channels. Result: There is more percentage of doctors who like otherchannels.
Number of doctors who like two type of channels programs :
Colors + Discovery 1/20Sony + Discovery 2/20Colors + Life OK 1/20
151

Colors + others 1/20Discovery + others 1/20
Explanation: The above data shows that 5% doctor like Colorsas well as Discovery, 10% like Sony as well as Discovery, 5%like colors as well as Life OK, 5% like Colors as well asothers channels, 5% like discovery as well as others channels.
Result: There are 30% doctors who like two types of channelsprograms.
Number of doctors who like three types channels programs :
Zee TV+ Sony + Colors 1/20
Explanation: The above data shows that 5% doctors who like ZeeTV, Sony as well as Colors.
Result: There are only 5% doctors who like three types ofprograms.
Number of doctors who like four types of channels programs :
There is no doctor who likes four types of channels programs.
Number of doctors who like five types of channels programs :
There is no doctor who likes five types of channels programs.
Number of doctors who like six types of channels programs :
There are 10% doctors who like six types of channel programs.
Interpretation: The study shows that there are percentage ofdoctors who like Colors as one type category of channelprograms which shows that programs of Colors have more effecton the mind of doctors and if we talk about two category then
152

most of the doctors like Sony and discovery which shows theeffect of programs of both channels on the doctors and some ofthe doctors like all channels which shows that something isthere in the programs that attract the doctors.
Note : I have divided the data on the basis of choices ofdoctors marked by the doctors from Q.4 to Q.6 For example:
1.First Choice
2.Second Choice
3.Third Choice
and for Q.7 to Q.9 I shall take only the first choice ofdoctors.For example:1.First Choice Only
So, I shall do my study on choice basis from Q.4 to Q.9.
153

Q.4. Which category of programme/programs of Zee TV do youwatch mostly and what do you feel?Ans:- ………………………………………………………………………………………………………
1. Drama 2.Historical 3.Horror 4. Mythology 5.Reality
1. It keeps meaware.2. It entertainsme.3. I know abouthistory.4. It makes mephobic.5.I feel thereality.6. Createscriminalbehavior
154

7.I feel Happy.8. I feelromantic.9.Any otherfeeling
Ans. The aim of this question is to find out that whichcategory of programs on Zee TV liked by the doctors and whatthey feel after watching these programs which will clarify theimpact of programs of Zee TV on the attitude of doctors.
1. Doctors who prefer to watch programs as first choice for aparticular category on Zee TV:
Drama 1/20Historical 2/20Horror 1/20Mythology 0/20Reality 1/20Not interested in Zee TVprograms
15/20
Explanation: The above data shows that 5% doctors preferdrama, 10% prefer historical programs, 5% watch horror, 5%watch reality and 75% take no interest in programs of Zee TV.
Result: There is full percentage of doctors who do not takeinterest in the programs of Zee TV.
Feeling of doctors who prefer to watch programs as firstchoice for a particular category on Zee TV:
(a) Feeling from Drama :
Your Feeling
155

1. It keeps meaware.
1/20
2. It entertainsme.
0/20
3. I know abouthistory.
0/20
4. It makes mephobic.
0/20
5.I feel thereality.
0/20
6. Createscriminalbehavior
0/20
7.I feel Happy. 0/208. I feelromantic.
0/20
9.Any otherfeeling
0/20
Explanation: The above data shows that 5% doctors feel aware.
Result: There is very less percentage of doctors who feelaware from the drama of Zee TV.
(b)Feeling from Historical category programs :
Your Feeling1. It keeps meaware.
0/2
2. It entertainsme.
2/2
3. I know abouthistory.
1/2
4. It makes mephobic.
0/2
5.I feel thereality.
0/2
6. Createscriminalbehavior
0/2
156

7.I feel Happy. 0/28. I feelromantic.
0/2
9.Any otherfeeling
0/2
Explanation: The above data shows that 100% doctors feelentertainment and 5% want to know about history.
Result: There is more percentage of doctors who feelentertainment from the programs of historical categories.
(c) Feeling from Horror category programs:
1. It keeps meaware.
0/1
2. It entertainsme.
0/1
3. I know abouthistory.
0/1
4. It makes mephobic.
0/1
5.I feel thereality.
0/1
6. Createscriminalbehavior
0/1
7.I feel Happy. 0/18. I feelromantic.
0/1
9.Any otherfeeling
Feel exited.
(d)Feeling from Mythology category programs:
There is no doctor under this category of first choice on ZeeTV.
157

(e) Feeling from Reality category programs:
1. It keeps meaware.
1/1
2. It entertainsme.
1/1
3. I know abouthistory.
0/1
4. It makes mephobic.
0/1
5.I feel thereality.
0/1
6. Createscriminalbehavior
0/1
7.I feel Happy. 1/18. I feelromantic.
0/1
9.Any otherfeeling
0/1
Explanation: The above data shows that 5% doctors feel happyin watching reality on Zee TV.
Result: There is very less percentage of doctors who feelhappy by watching reality programs on Zee TV.
2. Doctors who prefer to watch programs as second choice for aparticular category on Zee TV:
Drama 0/20Historical 1/20Horror 0/20Mythology 0/20Reality 0/20Not interested in Zee TVprograms
15/20
Explanation: The above data shows that 5% doctors preferhistorical programs of Zee TV.
158

Result: There is very less percentage of doctors who prefer towatch programs as a second choice of programs.
Feeling of doctors who prefer to watch programs as secondchoice for a particular category on Zee TV:
(a) Feeling from Drama category:
There is no doctor who come under the category of secondchoice and prefer to watch drama on Zee TV. (b) Feeling from Historical category programs :
1. It keeps meaware.
0/1
2. It entertainsme.
0/1
3. I know abouthistory.
1/1
4. It makes mephobic.
0/1
5.I feel thereality.
0/1
6. Createscriminalbehavior
0/1
7.I feel Happy. 0/18. I feelromantic.
0/1
9.Any otherfeeling
0/1
Explanation: The above data shows that 100% doctors want toknow about history.
Result: There is full percentage of doctors who feel the samefeeling for the programs related to history.
159

(c) Feeling from Horror category programs:
There is no doctor who come under the category of secondchoice and prefer to watch drama on Zee TV.
(d)Feeling from Mythology category programs:
There is no doctor who come under the category of secondchoice and prefer to watch drama on Zee TV.
(e) Feeling from Reality category programs:
There is no doctor who come under the category of secondchoice and prefer to watch reality on Zee TV
3.Doctors who prefer to watch programs as third choice for aparticular category on Zee TV:
There is no doctor who come under the category of third choiceof programs.
Interpretation: The above study shows that most of the doctorswatch historical programs as a first choice of programs andmost of them feel entertainment by watching these programswhich shows the less positive impact on the attitude ofdoctors because they watch these programs only forentertainment so it can be concluded that programs of Zee TVhave little effect on the attitude and understanding ofDoctors because they do not feel that something is real inthese programs.
Q. 5.Which category of programme/programs of Sony do youwatch mostly?
Ans:- ………………………………………………………………………………………………………
160

1. Drama 2.Historical 3.Horror 4.Reality5.Crime/Thriller
Your Feeling:
1. It keeps meaware.2. It entertainsme.3. I know abouthistory.4. It makes mephobic.5.I feel thereality.6. Createscriminal behavior7.I feel Happy.8. I feelromantic.9.Any otherfeeling
Ans. The aim of this question is to find out that whichcategory of programs liked by the doctors on Sony and whatthey feel after watching these programs which will clarify theimpact of programs of Sony on the attitude of doctors.
1. Doctors who prefer to watch programs as first choice for aparticular category on Sony:
Drama 1/20Historical 2/20Horror 0/20Reality 1/20Crime/Thriller 5/20Not interested in Sonyprograms
11/20
161

Explanation: The above data shows that 5% doctors preferdrama, 10% prefer historical, 5% prefer reality, 25% prefercrime/thriller and 55% take no interest in the programs ofSony.
Result: There is more percentage of doctors who do not preferto watch programs on Sony.
Feeling of doctors who prefer to watch programs as firstchoice for a particular category on Sony:
(a) Feeling from Drama :
Your Feeling1. It keeps meaware.
1/1
2. It entertainsme.
0/1
3. I know abouthistory.
0/1
4. It makes mephobic.
0/1
5.I feel thereality.
0/1
6. Createscriminalbehavior
0/1
7.I feel Happy. 0/18. I feelromantic.
0/1
9.Any otherfeeling
0/1
Explanation: The above data shows that 100% doctors feelaware in the drama of Sony.
Result: There is full percentage of doctors who feel aware inwatching drama on Sony.
162

(b)Feeling from Historical category programs :
1. It keeps meaware.
0/2
2. It entertainsme.
2/2
3. I know abouthistory.
2/2
4. It makes mephobic.
0/2
5.I feel thereality.
0/2
6. Createscriminalbehavior
0/2
7.I feel Happy. 0/28. I feelromantic.
0/2
9.Any otherfeeling
0/2
Explanation: The above data shows that 100% doctors feelentertainment as well as want to know about the history.
Result: There is full percentage of doctors who feelentertainment as well as want to know about the history.
(c) Feeling from Horror category programs:
There is no doctor who comes under category of first choicewho watch historical programs.
(d) Feeling from Reality category programs:1. It keeps meaware.
0/1
2. It entertainsme.
1/1
3. I know abouthistory.
0/1
4. It makes mephobic.
0/1
163

5.I feel thereality.
0/1
6. Createscriminalbehavior
0/1
7.I feel Happy. 1/18. I feelromantic.
0/1
9.Any otherfeeling
0/1
Explanation: The above data shows that 100% doctors feelentertainment as well as happy.
Result: There is full percentage of doctors who feel the samefeelings. (e) Feeling from crime/thriller category programs:
1. It keeps meaware.
2/2
2. It entertainsme.
2/2
3. I know abouthistory.
0/2
4. It makes mephobic.
0/2
5.I feel thereality.
1/2
6. Createscriminalbehavior
0/2
7.I feel Happy. 0/28. I feelromantic.
0/2
9.Any otherfeeling
0/2
Explanation: The above data shows that 100% doctors feelaware,100 % feel entertainment and 5% feel reality.
164
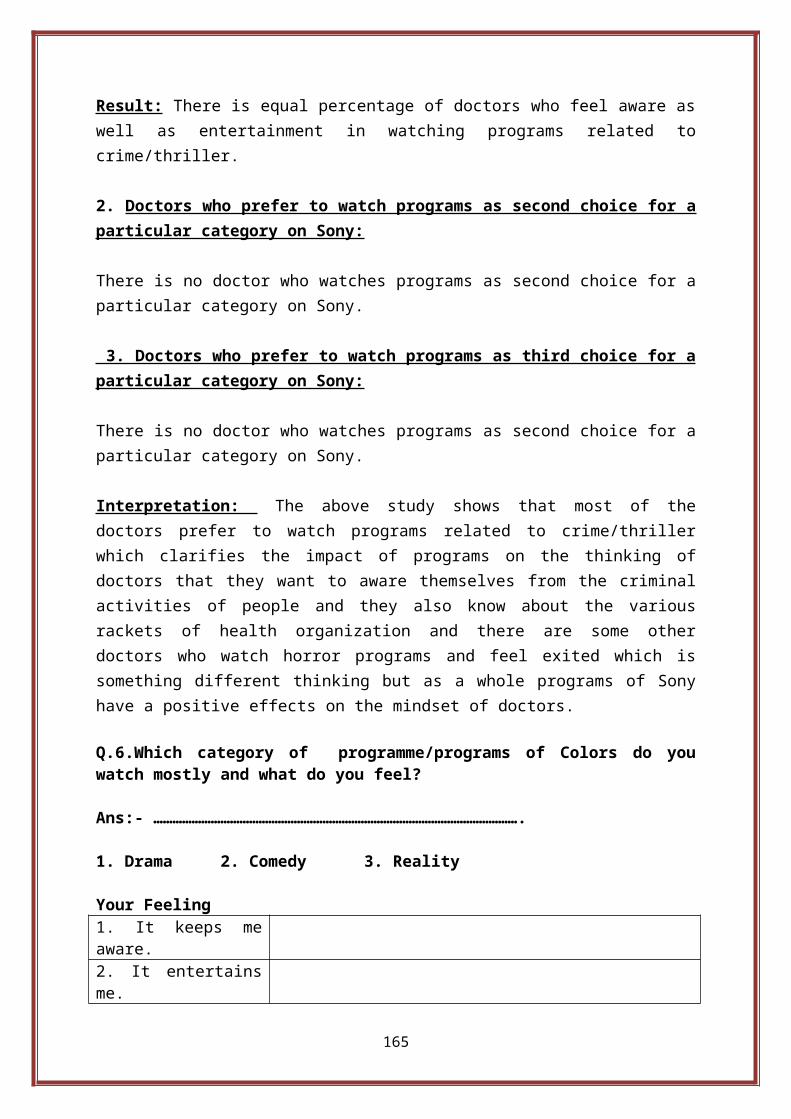
Result: There is equal percentage of doctors who feel aware aswell as entertainment in watching programs related tocrime/thriller.
2. Doctors who prefer to watch programs as second choice for aparticular category on Sony:
There is no doctor who watches programs as second choice for aparticular category on Sony.
3. Doctors who prefer to watch programs as third choice for aparticular category on Sony:
There is no doctor who watches programs as second choice for aparticular category on Sony.
Interpretation: The above study shows that most of thedoctors prefer to watch programs related to crime/thrillerwhich clarifies the impact of programs on the thinking ofdoctors that they want to aware themselves from the criminalactivities of people and they also know about the variousrackets of health organization and there are some otherdoctors who watch horror programs and feel exited which issomething different thinking but as a whole programs of Sonyhave a positive effects on the mindset of doctors.
Q.6.Which category of programme/programs of Colors do youwatch mostly and what do you feel?
Ans:- …………………………………………………………………………………………………….
1. Drama 2. Comedy 3. Reality
Your Feeling1. It keeps meaware.2. It entertainsme.
165

3. I know abouthistory.4. It makes mephobic.5.I feel thereality.6. Createscriminal behavior7.I feel Happy.8. I feelromantic.9.Any otherfeeling
Ans. The aim of this question is to find out that whichcategory of programs liked by the doctors on Colors and whatthey feel after watching these programs which will clarify theimpact of programs of Colors on the doctors.
1.Doctors who prefer to watch programs as first choice for aparticular category on Colors:
Drama 7/20Comedy 3/20Reality 1/20Not interested in Colorsprograms
9/20
Explanation: The above data shows that 35% doctors preferdrama, 15% prefer comedy,5% prefer reality to watch as firstchoice and 45% doctors do not take interest in the programsof Colors.
Result: There is more percentage of doctors who do not takeinterest in the programs of Colors watch drama.
Feelings of doctors who prefer to watch programs as firstchoice for a particular category on Colors:
166
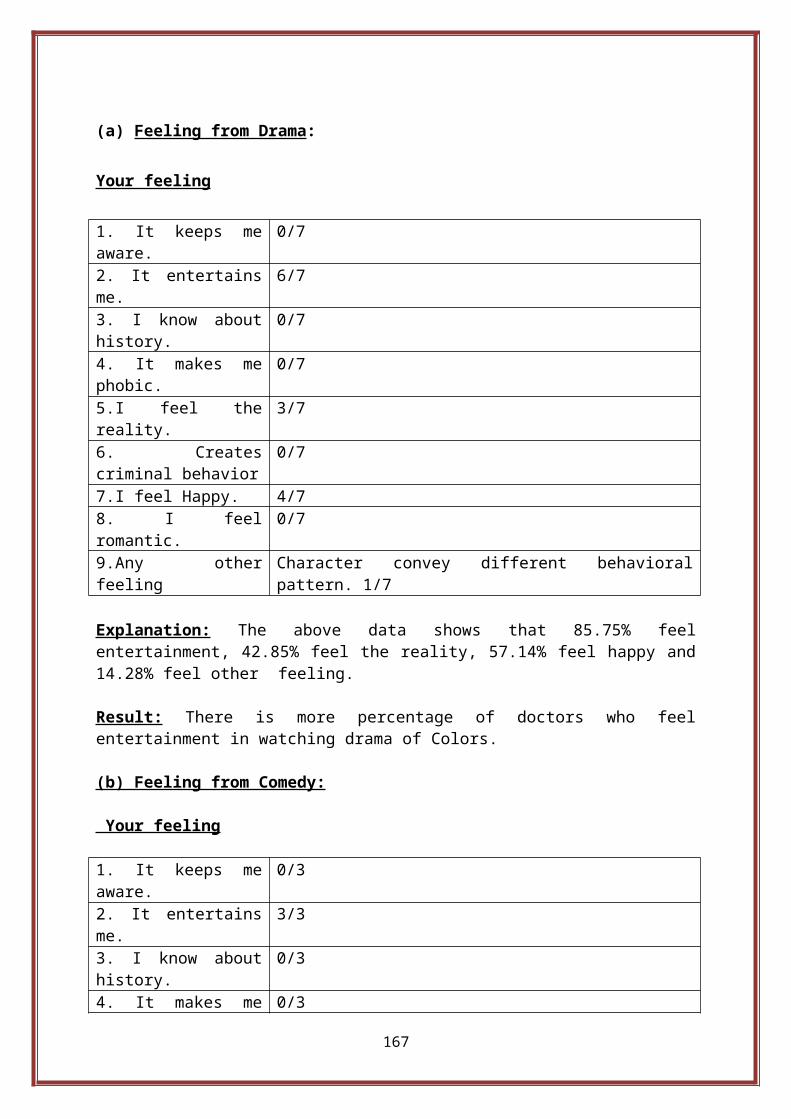
(a) Feeling from Drama:
Your feeling
1. It keeps meaware.
0/7
2. It entertainsme.
6/7
3. I know abouthistory.
0/7
4. It makes mephobic.
0/7
5.I feel thereality.
3/7
6. Createscriminal behavior
0/7
7.I feel Happy. 4/78. I feelromantic.
0/7
9.Any otherfeeling
Character convey different behavioralpattern. 1/7
Explanation: The above data shows that 85.75% feelentertainment, 42.85% feel the reality, 57.14% feel happy and14.28% feel other feeling.
Result: There is more percentage of doctors who feelentertainment in watching drama of Colors.
(b) Feeling from Comedy:
Your feeling
1. It keeps meaware.
0/3
2. It entertainsme.
3/3
3. I know abouthistory.
0/3
4. It makes me 0/3
167

phobic.5.I feel thereality.
0/3
6. Createscriminal behavior
0/3
7.I feel Happy. 2/38. I feelromantic.
0/3
9.Any otherfeeling
0/3
Explanation: The above data shows that 100% doctors feelentertainment and 66.66% feel happy.
Result: There is full percentage of doctors who feelentertainment in watching Comedy on Colors.
(c) Feeling from Reality:
Your feeling
1. It keeps meaware.
0/1
2. It entertainsme.
1/1
3. I know abouthistory.
0/1
4. It makes mephobic.
0/1
5.I feel thereality.
0/1
6. Createscriminal behavior
0/1
7.I feel Happy. 0/18. I feelromantic.
0/1
9.Any otherfeeling
0/1
Explanation: The above data shows that 100 % doctors feelentertainment.
168

Result: There is full percentage of doctors who feelentertainment in watching programs related to reality.
2. Doctors who prefer to watch programs as second choice for aparticular category on Colors:
Drama 0/20Comedy 0/20Reality 2/20Not interested in Colorsprograms
9/20
Explanation: The above data shows that 10% doctors watchcomedy.
Result: There is very less percentage of doctors who watchcomedy.
Feeling of doctors who prefer to watch programs as secondchoice for a particular category on Colors:
(a)Feeling from Drama
There is no doctor under the category of second choice whowatch drama on Colors.
(b)Feeling from Comedy
There is no doctor under the category of second choice whowatch drama on Colors.
(c)Feeling from Reality1. It keeps meaware.
0/2
2. It entertainsme.
1/2
3. I know abouthistory.
0/2
4. It makes mephobic.
0/2
5.I feel thereality.
1/2
169

6. Createscriminal behavior
0/2
7.I feel Happy. 1/28. I feelromantic.
0/2
9.Any otherfeeling
0/2
Explanation: The above data shows that 50% doctors feelentertainment, reality as well as happy.
Result: There is equal percentage of doctors who feelentertainment, reality as well as happy.
Doctors who prefer to watch programs as third choice for aparticular category on Colors:
Drama 0/20Comedy 1/20Reality 0/20Not interested in Colorsprograms
0/20
Explanation: The above data shows that 5% doctors watchcomedy.
Result: There is very less percentage of doctors who watchprograms under third choice.
Feeling of Doctors who prefer to watch programs as thirdchoice for a particular category on Colors:
Feelings from Comedy
1. It keeps meaware.
0/1
2. It entertainsme.
0/1
3. I know abouthistory.
0/1
4. It makes mephobic.
0/1
170

5.I feel thereality.
0/1
6. Createscriminal behavior
0/1
7.I feel Happy. 1/18. I feelromantic.
0/1
9.Any otherfeeling
0/1
Explanation: The above data shows that 100% doctors feel happyin watching programs related to comedy.
Result: There is full percentage of doctors come under thethird choice for a particular category on colors which feelhappy after watching comedy programs on Colors.
Interpretation: The above study shows that most of thedoctors watch drama on Colors and feel entertainment andreality which shows that something is there in the programs ofColors that some of the doctors feel the reality of their lifeand the reality of new generations and know about the thinkingof the society so it shows the positive effect of the programson the attitude of doctors and if we talk about the secondchoice than most of the doctors watch comedy and feel happywhich means they want to refresh themselves from the tirednessof whole day which is the positive effect of programs ofColors that some of the programs of Colors make them happywhich also shows the positive impact of programs of Colors onthe attitude of the doctors.
Q.7. Which category of programme/programs of Life Ok do youwatch mostly and what do you feel?
Ans:- ………………………………………………………………………………………………………
1. Drama 2.Mythogical 3.Fantasy 4.Crime
Your Feeling
1. It keeps me
171

aware.2. It entertainsme.3. I know abouthistory.4. It makes mephobic.5.I feel thereality.6. Createscriminal behavior7.I feel Happy.8. I feelromantic.9.Any otherfeeling
Ans. The aim of this question is to find out that whichcategory of programs liked by the doctors on Life OK andwhat they feel after watching these programs which willclarify the impact of programs on the attitude of doctors.
1.Doctors who prefer to watch programs as first choice for aparticular category on Life OK:
Drama 0/20Mythological 3/20Fantasy 0/20Crime 0/20Not interested in Life OK 17/20
Explanation: The above data shows that 15% doctors watchmythological programs and 85% are not interested in Life OK.
Result: There is very less percentage of doctors who watchprograms related to crime on Life OK as well as not interestedin the programs of Life OK.
Feelings of doctors who prefer to watch programs as firstchoice for a particular category on Life OK:
172

From drama category:
There is no doctor under this category of first choice whowatch drama on Life OK.
From mythological category:
1. It keeps meaware.
0/3
2. It entertainsme.
1/3
3. I know abouthistory.
2/3
4. It makes mephobic.
0/3
5.I feel thereality.
0/3
6. Createscriminal behavior
0/3
7.I feel Happy. 0/38. I feelromantic.
0/3
9.Any otherfeeling
0/3
Explanation: The above data shows that 33.33% doctors feelentertainment and 66.66% doctors want to know about thehistory behind the myth.
Result: There is more percentage of doctors who want to knowabout the history behind the myth.
Feeling from fantasy:
There is no doctor under this category of first choice whowatches fantasy on Life OK.
Feeling from Crime:
There is no doctor under this category of first choice whowatches crime on Life OK.
173

Interpretation: The above study shows that most of the doctorswatch programs related to mythology and want to know about thehistory behind the myth which is a positive impact ofprograms of Life OK on the attitude of the doctors that theywant to upgrade their knowledge.
Q.8. Which category of programme/programs do you watch onDiscovery and what do you feel?
1. Medical Science 2.New technologies 3.Environment4.Culture 5.Health 6.Foods 7.Historical 8.AdventurousYour Feeling
1.It aware me.2.It entertain me.3I know about externalWorld.4.I feel phobic.5.Innovative ideascome in my mind6.I know about healthproblems.7.Want to doadventure.8. Other feeling.. Ans. The aim of this question is to find out that whichcategory of programs liked by the doctors on Discovery andwhat they feel after watching these programs which willclarify the impact of programs of Discovery on the attitude ofdoctors.
1.Doctors who prefer to watch programs as first choice for aparticular category on Discovery:
Medical Science 6/20New Technologies 0/20Environment 0/20
174

Culture 0/20Health 0/20Food 0/20Historical 0/20Adventurous 5/20Not interested in Discovery 9/20
Explanation: The above data shows that 30% doctors watchprograms of medical sciences,25% watch programs related toadventures and 45% take no interest in the programs ofDiscovery.
Result: There is more percentage of doctors who do not takeinterest in the programs of Discovery.
Feeling of doctors who prefer to watch programs as firstchoice for a particular category on Discovery:
1.Feeling from Medical Science category programs:
1.It aware me. 4//62.It entertain me. 0/63I know about externalWorld.
2/6
4.I feel phobic. 0/65.Innovative ideascome in my mind
1/6
6.I know about healthproblems.
0/6
7.Want to doadventure.
0/6
8. Other feeling.. 0/6
Explanation: The above data shows that 66.66% doctors feelaware, 33.33% feel that they about the external world medicalsciences and 16.66% feel that innovative ideas regardingmedical discoveries come in their mind.Result: There are more percentage of doctors who feel aware ofdifferent typical conditionsof medical sciences.
2.Feeling from New Technologies category programs:175

There is no doctor under this category of first choice whowatches new technological programs.
4.Feeling from Cultural category programs:
There is no doctor under this category of first choice whowatches programs related to culture.
5.Feeling from Health category programs:
There is no doctor under this category of first choice whowatches health programs.
6. Feeling from food category programs :
There is no doctor under this category of first choice whowatches programs related to food.
7.Feeling from Historical Category programs:
There is no doctor under this category of first choice whowatches historical programs.
8.Feeling from Adventurous category programs:
1.It aware me. 1/52.It entertain me. 2/53.I know aboutexternal World.
2/5
4.I feel phobic. 0/55.Innovative ideascome in my mind
0/5
6.I know about healthproblems.
0/5
7.Want to doadventure.
0/5
8. Other feeling.. 0/5
176

Explanation: The above data show that 20% doctors feel aware,40% feel entertainment and 40% feel that they want to knowabout the external WorldWorld.
Interpretation: The above study shows that there are most ofthe doctors watch programs related to medical sciences andmost of them feel aware from the problems come in the path ofmedical sciences discoveries and some of them know about theexternal World of medical sciences in which they learn aboutthe latest discoveries of operation methods as well asmedicines for a particular disease which shows the positiveeffect of the programs on the attitude of female doctorsbecause after watching these programs they can differentiatebetween the prescribed treatment to the patient given by themon the particular problem of body. So, we conclude that thereis a positive impact of programs of Discovery on the doctorsof every field.
Q.9. Which category of programme/programs do you watch onother channels and what do you feel?Ans: ………………………………………………………………………………………………………
1.Drama 2.Historical 3.Horror 4.Mythology 5.Reality6.Crime 7.Comedy 8.Fantasy 9.Fashion
Your Feeling1. It keeps meaware.2. It entertainsme.3. I know abouthistory.4. It makes mephobic.5. I feel thereality.6. Creates
177

criminal behavior7. I feel Happy.8. I feelromantic.9. Any otherfeeling.
Ans. The aim of this question is to find out that whichcategories of programs doctors watch on other channels andwhat they feel which will clarify the impact of programs ofother channels on the attitude of doctors.
1.Doctors who prefer to watch programs as first choice for aparticular category on other channels:
Drama 5/20Historical 0/20Horror 0/20Mythology 0/20Reality 0/20Crime 0/20Comedy 0/20Fantasy 0/20Fashion 0/20News programs 10/20Music programs 1/20Devotional 0/20Not interested in otherchannels
4/20
Explanation: The above data shows that 25% doctors watchdrama, 50% watch news programs, 5% watch music programs and20% do not take interest in the programs of other channels.
Result: There is more percentage of doctors who watch newsprograms on others channels.
Feeling of doctors who prefer to watch programs as firstchoice for a particular category on other channels:
178

Feeling from Drama:
Your Feeling
1. It keeps meaware.
2/5
2. It entertainsme.
3/5
3. I know abouthistory.
0/5
4. It makes mephobic.
0/5
5.I feel thereality.
0/5
6. Createscriminal behavior
0/5
7.I feel Happy. 2/58. I feelromantic.
0/5
9.Any otherfeeling
0/5
Explanation: The above data shows that 40% doctors feel awarefrom the drama of the other channels, 60% feel entertainmentand 40% feel happy in watching drama on other channels.
Result: There is more percentage of doctors who feelentertainment after watching drama on other channels.
Feeling from Mythology:
There is no doctor under this category of first choice whowatches programs related to mythology.
Feeling from reality
There is no doctor under this category of first choice whowatches programs related to reality.
179

Feeling from Comedy:
There is no doctor under this category of first choice whowatches programs related to comedy.
Feeling from News Programs:
1. It keeps meaware.
10/10
2. It entertainsme.
1/10
3. I know abouthistory.
0/10
4. It makes mephobic.
0/10
5.I feel thereality.
0/10
6. Createscriminal behavior
0/10
7.I feel Happy. 0/108. I feelromantic.
0/10
9.Any otherfeeling
0/10
Explanation: The above data shows that 100% doctors feel awareand 10% feel entertainment from the news programs.
Result: There is more percentage of doctors who feel awarefrom the news programs.
Feeling from Music
1. It keeps meaware.
0/1
2. It entertainsme.
1/1
3. I know abouthistory.
0/1
180

4. It makes mephobic.
0/1
5. I feel thereality.
0/1
6. Createscriminal behavior
0/1
7. I feel Happy. 0/18. I feelromantic.
0/1
9. Any otherfeeling.
0/1
Explanation: The above data shows that 100% doctors feelentertainment from the music programs.
Result: There is more percentage of doctors who feelentertainment in watching music programs.
Feeling from devotional programsThere is no doctor under this category of first choice whowatch programs related to devotion.
Interpretation: The above study shows that there most of thedoctors watch news programs on the other channels because itmake them aware from the incidents which occur on workingplaces of doctors which shows the positive impact of programson the attitude of the doctors because after watching thesenews programs they can handle any misbehavior of anybody ontheir work places.
Q.10. Which type of programs do you like most?
1. Related to women 2. Related to children 3. Related tofashion 4. Related to food Habits
Ans. The aim of this question is to find out the impact ofprograms on the attitude of doctors by dividing the type ofprograms as written above.
181

Doctors who like one type of program:
Related to Women 3/20Related to Children 0/20Related to Fashion 1/20Related to food Habits 0/20Nothing to choose 10/20
Explanation: The above data shows that 15% doctors likeprograms related to women, 5% watch related to fashion and 50%have nothing to choose.
Result: There is more percentage of doctors who have nothingto choose.
Teachers who like two type of programs:
Related to children + Relatedto women
4/20
Explanation: The above data shows that 20% doctors likeprograms related to women as well as children.
Result: There is very less percentage of doctors who like twotypes of programs.
Teachers who like three types of programs:
There is no doctor who like three types of programs.
Teachers who like four types of programs:
There are 5% doctors who like four type of programs.
Interpretation: The above study shows that most of the doctorshave no particular choice of programs but some of them watch
182

programs related to women issues in the society which create adecision making thinking in them that what is good for themand for their dear ones.
Q.11. Which type of characters do you like most?
1. Investigative 2.Realistic 3. Devotional 4.Emotional5.Negative 6.Positive
Ans.. The aim of this question is to find out the effect ofprograms on the attitude of doctors on particular characterin the programs.
Doctors who like one type of character:
Investigative 2/20Realistic 5/20Devotional 1/20Emotional 3/20Negative 0/20Positive 4/20Doctors who do not like anycharacter
3/20
Explanation: The above data shows that 10% doctors likeinvestigative character, 25% like realistic character,5% likedevotional,15% like emotional characters and 20% like positivecharacters and 15% do not like any character.
Result: There is more percentage of doctors who like realisticcharacters.
Doctors who like two characters:
Devotional + Emotional 1/20
Explanation: The above data shows that 5% like devotional aswell as emotional character.
183
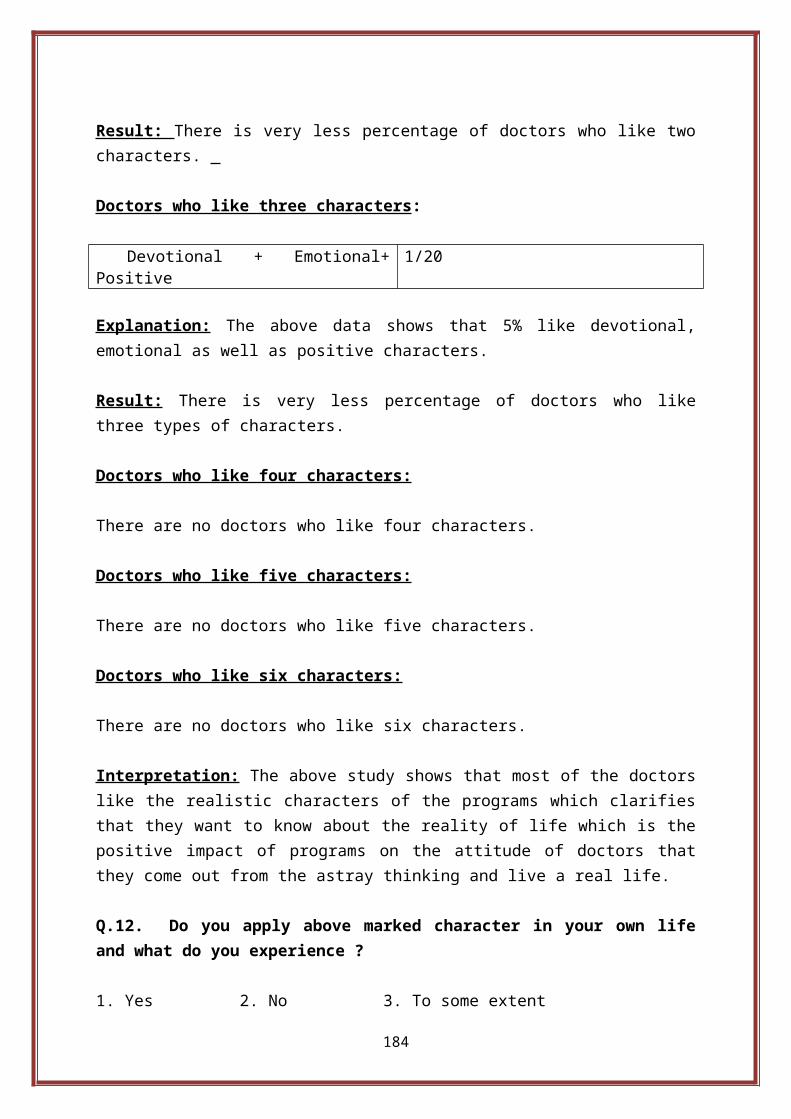
Result: There is very less percentage of doctors who like twocharacters.
Doctors who like three characters:
Devotional + Emotional+Positive
1/20
Explanation: The above data shows that 5% like devotional,emotional as well as positive characters.
Result: There is very less percentage of doctors who likethree types of characters.
Doctors who like four characters:
There are no doctors who like four characters.
Doctors who like five characters:
There are no doctors who like five characters.
Doctors who like six characters:
There are no doctors who like six characters.
Interpretation: The above study shows that most of the doctorslike the realistic characters of the programs which clarifiesthat they want to know about the reality of life which is thepositive impact of programs on the attitude of doctors thatthey come out from the astray thinking and live a real life.
Q.12. Do you apply above marked character in your own lifeand what do you experience ?
1. Yes 2. No 3. To some extent
184

If your option is 1 or 3 than your experience: .……………………………………........................................……………………………………………………………………………………………………………….
Ans. The aim of this question is to find out that how manydoctors apply the characters in their own life and what theyexperience. It will explain the effect of programs on theattitude of doctors towards the character and its applicationin owns life.
Yes 3/20No 14/20To some extent 3/20Nothing to mark 0/20
Explanation: The above data shows that 15% doctors apply theprograms characters,70% doctors do not apply the markedcharacters and 15% apply the marked characters to some extentin their own life.
Result: There is equal percentage of doctors who apply as wellas do not apply the marked characters in their own life.
Experience of doctors who say yes:
1. Good2. Good3. Nothing to say
Experience of doctors who say to some extent:1. Feel something new2. Feel something different3. Feel good
185

Interpretation: The above study shows that most of the doctorsdo not apply the programs characters in their own life butsome of them apply the characters in their own life and feelgood and some of them apply to some extent and feel somethingnew as well as different which clarifies the effects ofprograms on the attitude of doctors but to very less extent .
Q.13. Do you apply above marked characters in others life andwhat you experience?
1.Yes 2. No 3. To some extent
If your option is 1 or 3 than your experience:……........................................................................................……………………………………………………………………………………………………………….
Ans. The aim of this question is to find out that how manydoctors apply the characters on others life and what is theimpact of programs on the attitude of doctors after applyingthe marked character.
Yes 3/20No 16/20To some extent 1/20Nothing to mark 0/20
Explanation: The above data shows that 15% doctors apply themarked character in others life , 80% do not apply the markedcharacter in other life and 5% apply the marked character tosome extent.
Result: There is more doctors who do not apply the markedcharacters on other life.
Experience of doctors who say Yes :
186

1.
Good
2.
Nothing to say
3.
Nothing to say
Experience of doctors who say, to some extent : 1.
Nothing to say
Interpretation: From above study we conclude that there aremost of the doctors which do not apply the characters onothers life which shows that programs have very less effectson the attitude of doctors which feel them that they have toapply the character in others life.
Q.14. How much time do you spend on watching Televisionprogramme?
1. Half an Hour 2. One Hour 3. Two Hour4. More than that
Ans. The aim of this question is to find out the time ofdoctors they spend in watching television programs. So, itwill clarify the attitude towards the time management in theirbusy schedule regarding watching programs which clarify theimpact of programs.
Half an Hour 3/20One Hour 11/20Two Hour 4/20More than that 1/20Nothing to mark 0/20
187

Explanation: The above data shows that 15% doctors watchprograms half an hour, 55% give one hour, 20% give two hour,5% give more than that.
Result: The above data shows that more percentage of doctorswho watch the programs for one hour.
Interpretation: The above study shows that there are most ofthe doctors who watch the programs for one hour which showsthat they are not so much eager to watch the programs whichshows that programs do not affect the eagerness of doctorsthat they absolutely watch the particular programme.
Q.15. At what time do you prefer to watch Televisionprogramme?
1. Morning 2. After Noon 3. Evening 4.Late Night
Ans. The aim of this question is to find out the time which ispreferred by the doctors to watch television programs whichclarify the eagerness of the doctors to watch programs.
1. Morning 0/202. After Noon 0/203. Evening 9/204. Late Night 11/205. Nothing to mark 0/20
Explanation: The above data shows that 45% doctors watch theprograms in evening and 55% watch programs at late night.
Result: There is more percentage of doctors who watch programsat late night.
188

Interpretation: The above study clarifies that most of thedoctors watch programs at late night which the negative effectof programs on the attitude of doctors that they are ready towatch programs at night.
Q.16. Do you leave all other important work while watchingTelevision Programme?
1. Yes 2.No 3.To some extent
Ans. The aim of this question is to find out that how manydoctors leave their important work and how many doctors leaveno work and how many teachers leave their work to some extent.So that we conclude the effect of program on the attitude ofdoctors that how important a program for them.
Yes 0/20No 19/20To some extent 1/20Nothing to say 0/20 Explanation: The above data shows that 95% doctors do notleave their important work and 5% to some extent.
Result: There is more percentage of doctors who do not leavetheir important work while watching programs.
Interpretation: The above study clarifies that most of thedoctors do not leave there important work while doing theirimportant work which shows that they are not bounded to theprograms which is a positive attitude of doctors towards theirwork because they are not anchored in the programs by theircharacters.
Q.17. Do you feel that Television programs are responsible forsocial change?
189

1.If yes,why? ..............................................................................................................................................……………………………………………………………………………………………………………….
2.If no,why?.................................................................................................................................................……………………………………………………………………………………………………………….
Ans. The aim of this question is to find out that how manydoctors feel that programs bring social changes which willclarify the importance of programs to bring social change inthe eyes of doctors.
Yes 16/20No 3/20Nothing to mark 1/20
Explanation: The above data shows that 80% doctors feel thatprograms bring social change, 15% say no and 5% have nothingto say.
Result: There is more percentage of doctors who feel thatprograms bring social change.
Opinion of doctors who say yes:
1. Make us aware about the latest happenings.2. People try so many things.3. Both positive and negative changes come up to an extent. 4. Programs directly or indirectly effect the people. 5. Positive effect.6. Both positive and negative effect.7. Nothing to say.8. Programs have more impact on the mindset of children.
190
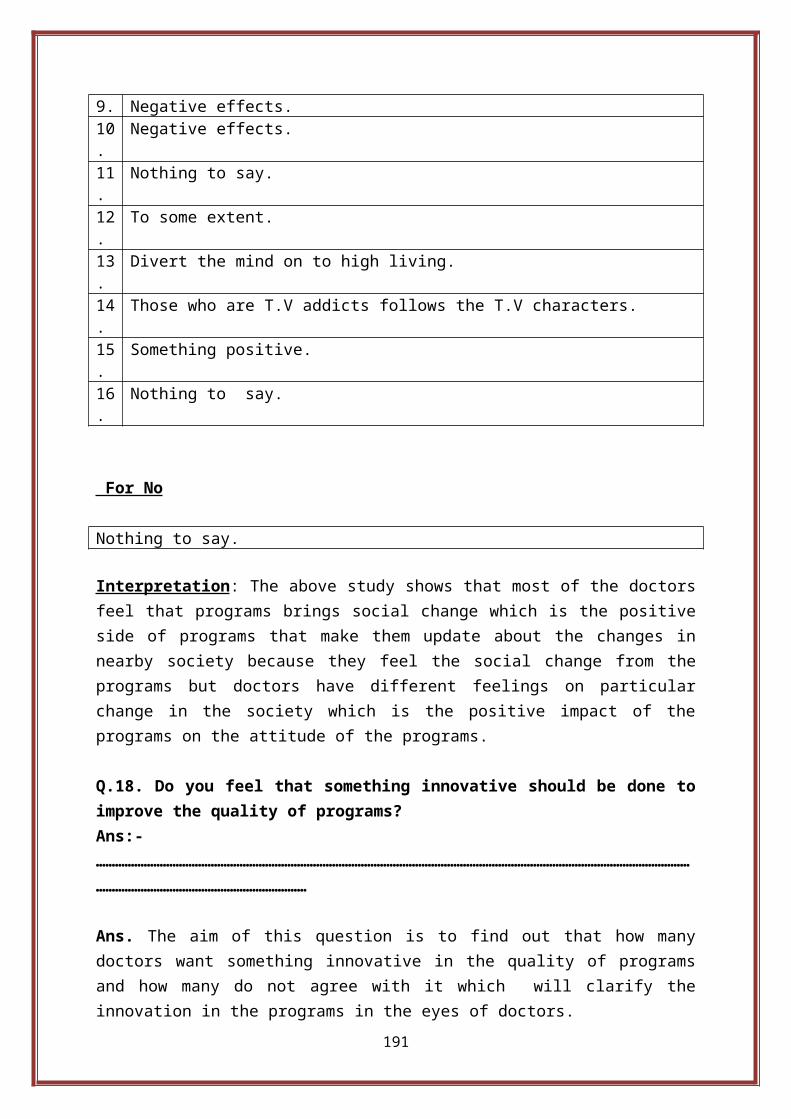
9. Negative effects.10.
Negative effects.
11.
Nothing to say.
12.
To some extent.
13.
Divert the mind on to high living.
14.
Those who are T.V addicts follows the T.V characters.
15.
Something positive.
16.
Nothing to say.
For No
Nothing to say.
Interpretation: The above study shows that most of the doctorsfeel that programs brings social change which is the positiveside of programs that make them update about the changes innearby society because they feel the social change from theprograms but doctors have different feelings on particularchange in the society which is the positive impact of theprograms on the attitude of the programs.
Q.18. Do you feel that something innovative should be done toimprove the quality of programs?Ans:-………………………………………………………………………………………………………………………………………………………………………………………………………………………………
Ans. The aim of this question is to find out that how manydoctors want something innovative in the quality of programsand how many do not agree with it which will clarify theinnovation in the programs in the eyes of doctors.
191

Yes 8/20No 12/20
Explanation: The above data shows that 40% doctors feel thatinnovation should be done and 60% say no innovation should bethere.
Result: There is more percentage of doctors who feel thatinnovation should not be done.
Opinion of the doctors who say yes:
1. Programs should have a creative stories, no lengthen ofprograms if story of programs is not good.
2. Emotional drama should be little.3. Women based programs should be encouraged more.4. Programs should be on old stories like post independence
where moral values and principle matters more than selfpromotion and greed.
5. Programs based on moral values should be promoted.Negative, violent and vulgar programs should not be aired.
6. Programs should be on positive values.7. Programs should be historic and realistic.8. Educational programs should be aired.
Interpretation: The above data shows that there is very lesspercentage of doctors who feel that some innovations should bedone to improve the quality of programs which shows thatprograms effects the thinking of doctors as a result they feelthat innovation should be done to improve the quality ofprograms and have different thinking of innovation.
192

DATA ANALYSIS OF WORKINGWOMEN
193

Q.1. Do you watch programs on TV?
1. Yes 2. No
If yes, than
(a) Daily (b) Alternate day (c) Sometimes(d) Most of the day Ans: The aim of this question is to know how many workingwomen watch the Television programs and if they watch thenwhat is the routine of Television program watching which willclarify the impact of programs on the attitude of workingwomen.
Yes 20/20No 0/20
Explanation: The above data shows that 100% working womenwatch television programs.
Result: There is full percentage of working women who watchprograms daily.
Their routine to watch television programs:
Daily 8/20Alternate Day 0/20Sometimes 7/20Most of the day 5/20
Explanation: The above data shows that 40% working women watchprograms daily, 35% watch sometimes and 25% watch most of theday.
Result: There is more percentage of working women who watchprograms daily.
194

Interpretation: The study shows that all the working womenwatch programs on television and there are most of the workingwomen who watch programs daily and sometimes which shows thatprograms are made with such planning so that more and moreworking women get attract towards the programs or anycharacter or any dresses and so on which tells the positive aswell as negative effect on the attitude of the working womenthat they are much eager to watch programs daily. Thoseworking women who have less time are also watch programs whichshows that they are also eager to watch programs when they getfree time. So, we can say that programs are changing theattitude of working women or vice versa.
Q.2. Which type of programs do you watch mostly?
1. Social 2.Entertainment 3.Educational 4.Awareness 5.Devotional
Ans : The aim of this question is to find out the types ofprograms which the working women like so that we can concludethat what is the effect of programs on the attitude ofworking women behind watching these programs. It may be ofone category or more than one category for the working women.
One Type :
Number of working women who like one type of programme :
Social 1/20Entertainment 2/20Educational 1/20Awareness 1/20Devotional 1/20
195

Explanation: The above data shows that there are 5% of workingwomen who like programs related to social changes, 10% likeprograms related to entertainment, 5% like educationalprograms,5% like programs related to awareness and 5% likedevotional programs.
Result: There is more percentage of working women who likeprograms related to entertainment.
Two type :
Number of working women who like two type of programs :
Entertainment+ Awareness 4/20
Explanation: The above data shows that 20% working women watchtwo types of program related to entertainment as well asawareness.
Result: There are some working women who watch two types ofprograms.
Three Type :
Number of working women who like three types of programs :
Social+ Entertainment +Awareness
1/20
Explanation: The above data shows that 5% working women likethree types of programs related to entertainment, society aswell as awareness.
Result: There are some working women who like three types ofprograms.
196

Four Type :
Number of working women who like four type of program:
There is no working woman who like four type of programs.
Five Type :
There is no working woman who like four type of programs.
Interpretation: The above study shows that most of the workingwomen like programs related to entertainment or in other wordswe can say that they like programs only for entertainment butthere are some working women who like programs related toawareness which shows that this is not true that every workingwomen watch entertainment programs so it shows the attitude ofworking women that they want to aware themselves from thecurrent issues of women and in other words we can say thatprograms are telecasted to aware the working women so it apositive side of television programs.
Q.3. Which channel programs do you like most?
1. Zee TV 2. Sony 3. Colors 4. Life Ok5.Discovery 6.Others
Ans. The aim of this question is to find out that whichchannel programs are liked by the working women which clarifythe important channel programs impact on the attitude ofworking women. Number of working women who like one type of channel programs:
Zee TV 5/20Sony 2/20Colors 3/20
197
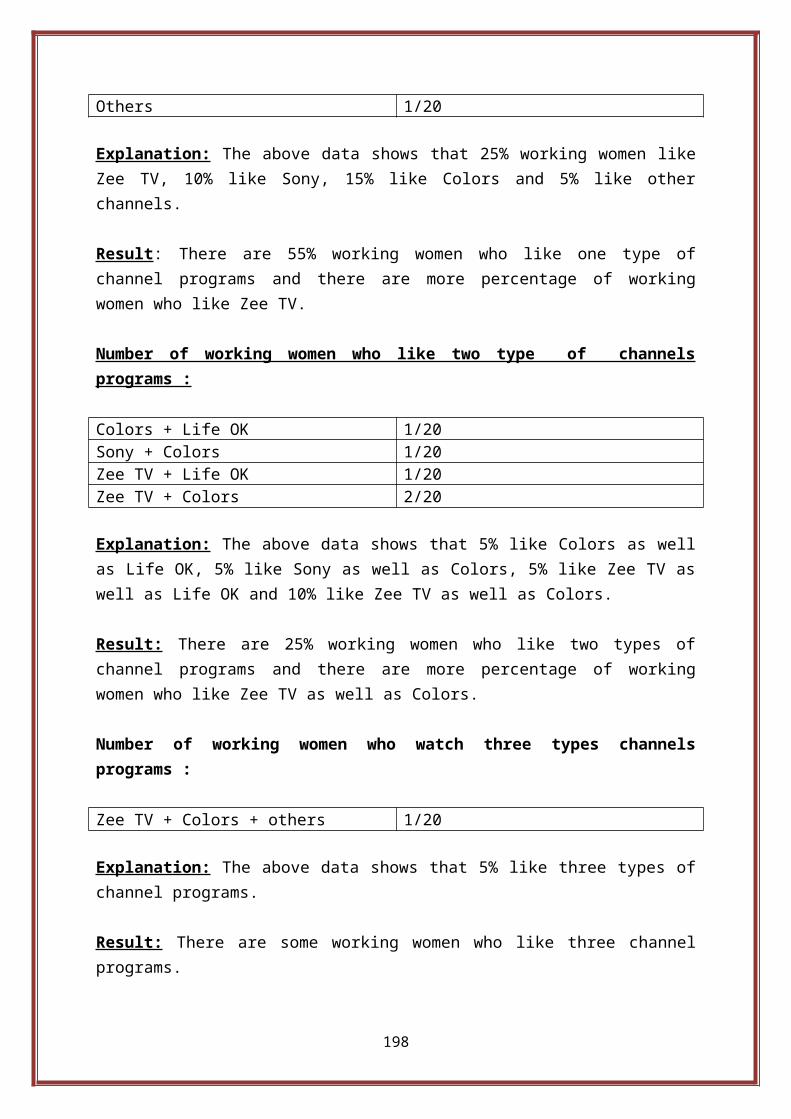
Others 1/20
Explanation: The above data shows that 25% working women likeZee TV, 10% like Sony, 15% like Colors and 5% like otherchannels.
Result: There are 55% working women who like one type ofchannel programs and there are more percentage of workingwomen who like Zee TV.
Number of working women who like two type of channelsprograms :
Colors + Life OK 1/20Sony + Colors 1/20Zee TV + Life OK 1/20Zee TV + Colors 2/20
Explanation: The above data shows that 5% like Colors as wellas Life OK, 5% like Sony as well as Colors, 5% like Zee TV aswell as Life OK and 10% like Zee TV as well as Colors.
Result: There are 25% working women who like two types ofchannel programs and there are more percentage of workingwomen who like Zee TV as well as Colors.
Number of working women who watch three types channelsprograms :
Zee TV + Colors + others 1/20
Explanation: The above data shows that 5% like three types ofchannel programs.
Result: There are some working women who like three channelprograms.
198

Number of working women who watch four types of channelsprograms :
There is no working woman who watches four types of channelsprograms.
Number of working women who watch five types of channelsprograms :
Sony+Colors+LifeOK+Discovery+Others
1
Explanation: The above data shows that 5% working women likefive channel programs.
Result: There are some working women who like five channelprograms.
Interpretation: From the above study we conclude that thereare more percentage of working women who watch programs ofColors which shows that programs of Colors have more impact onthe Working Women so it shows the positive side of Colors thatmost of the working woman watch programs of Colors becauseColors is known for the programs related to social changes andfamily changes so it shows the positive attitude of workingwoman that they are more prone to the programs related tosocial changes.
199

Note : I have divided the data on the basis of choices ofworking women marked by the working women from Q.4 to Q.6 For example:
1.First Choice
2.Second Choice
3.Third Choice
and for Q.7 to Q.9 I shall take only the first choice ofworking women.For example:1.First Choice Only
So, I shall do my study on choice basis from Q.4 to Q.9.
200

Q.4. Which category of programme/programs of Zee TV do youwatch mostly and what do you feel?
Ans:- ………………………………………………………………………………………………………
1. Drama 2.Historical 3.Horror 4. Mythology 5.Reality
1. It keeps meaware.2. It entertainsme.3. I know abouthistory.4. It makes mephobic.5.I feel thereality.6. Createscriminalbehavior7.I feel Happy.8. I feelromantic.9.Any otherfeeling
Ans. The aim of this question is to find out that whichcategory of programs on Zee TV liked by the working women andwhat they feel after watching these programs which willclarify the impact of programs of Zee TV on the attitude ofworking women.
1. Working women who prefer to watch programs as first choicefor a particular category on Zee TV:
201

Drama 6/20Historical 5/20Horror 2/20Mythology 0/20Reality 2/20Not interested in Zee TVprograms
4/20
Explanation: The above data shows that 30% working womenprefer drama, 25% prefer historical programs, 10% preferhorror, 10% prefer reality programs to watch as first choiceand 25% take no interest in programs of Zee TV.
Result: There is more percentage of working women who preferto watch drama as first choice.
Feeling of working women who prefer to watch programs as firstchoice for a particular category on Zee TV:
(a) Feeling from Drama :
Your Feeling
1. It keeps meaware.
2/6
2. It entertainsme.
3/6
3. I know abouthistory.
0/6
4. It makes mephobic.
0/6
5.I feel thereality.
2/6
6. Createscriminalbehavior
1/6
7.I feel Happy. 0/68. I feel 1/6
202

romantic.9.Any otherfeeling
0/6
Explanation: The above data shows that 33.33% working womenfeel aware, 50% feel entertainment, 33.33% feel reality,16.66% feel criminal behavior and 16.66% feel romantic.
Result: There is more percentage of working women who feelentertainment after watching drama on Zee TV.
(b)Feeling from Historical category programs :
Your Feeling
1. It keeps meaware.
1/5
2. It entertainsme.
2/5
3. I know abouthistory.
2/5
4. It makes mephobic.
0/5
5.I feel thereality.
0/5
6. Createscriminalbehavior
0/5
7.I feel Happy. 2/58. I feelromantic.
0/5
9.Any otherfeeling
0/5
Explanation: The above data shows that 20% feel aware, 40%feel entertain,40 %feel that they want to know about thehistory, 40% feel happy.
203

Result: There is equal percentage of working women who feelentertainment, happy as well as want to know about thehistory.
(c) Feeling from Horror category programs:
Your feeling:
1. It keeps meaware.
1/2
2. It entertainsme.
1/2
3. I know abouthistory.
0/1
4. It makes mephobic.
1/2
5.I feel thereality.
1/2
6. Createscriminalbehavior
0/2
7.I feel Happy. 0/28. I feelromantic.
0/2
9.Any otherfeeling
0/2
Explanation: The above data shows that 50% feel aware, 50%feel entertainment, 50% feel phobic, 50% feel reality.
Result: There is equal percentage of working women who feelaware, entertainment, phobic as well as reality.
(d)Feeling from Mythology category programs:
There is no working woman under this category of first choiceon Zee TV.
(e) Feeling from Reality category programs:
204

Your Feeling
1. It keeps meaware.
0/2
2. It entertainsme.
0/2
3. I know abouthistory.
0/2
4. It makes mephobic.
0/2
5.I feel thereality.
0/2
6. Createscriminalbehavior
0/2
7.I feel Happy. 2/28. I feelromantic.
0/2
9.Any otherfeeling
0/2
Explanation: The above data shows that 100% working women whowatch reality feel happy in watching reality programs. Result: There is full percentage of working women who feelthat programs related to reality make them happy.
2. Woking women who prefer to watch programs as second choicefor a particular category on Zee TV:
Drama 2/20Historical 0/20Horror 2/20Mythology 0/20Reality 2/20Not interested in Zee TVprograms
4/20
205
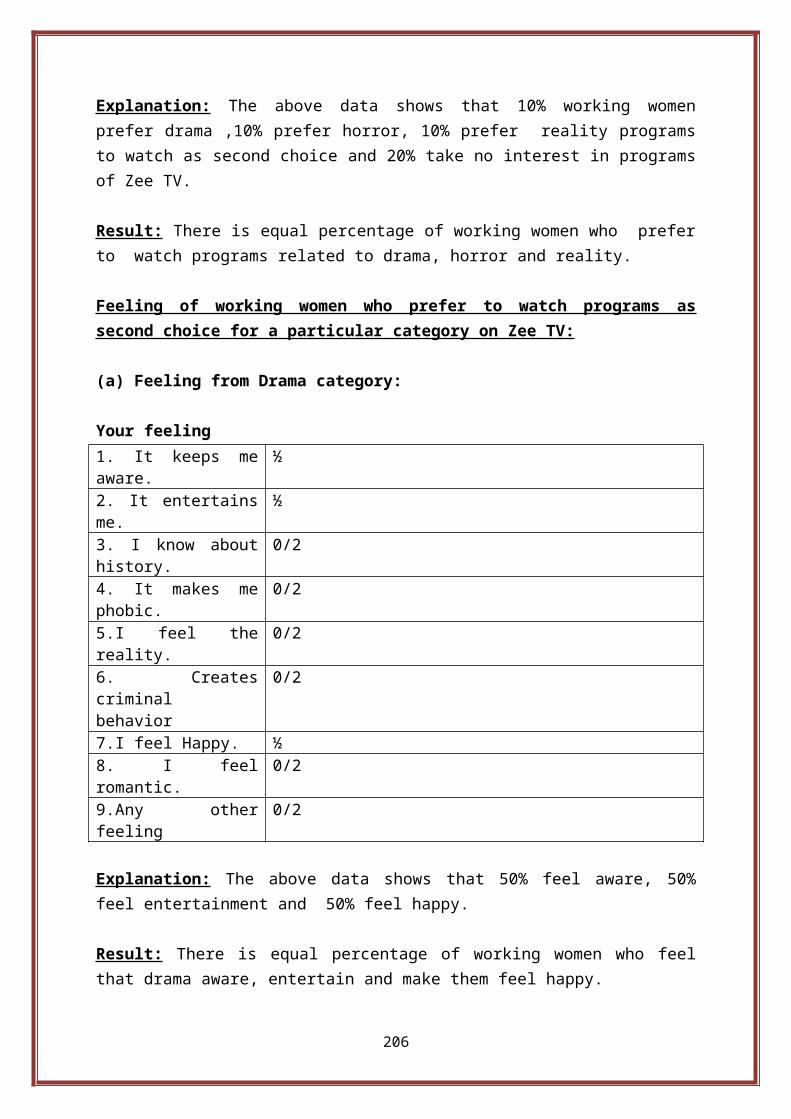
Explanation: The above data shows that 10% working womenprefer drama ,10% prefer horror, 10% prefer reality programsto watch as second choice and 20% take no interest in programsof Zee TV.
Result: There is equal percentage of working women who preferto watch programs related to drama, horror and reality.
Feeling of working women who prefer to watch programs assecond choice for a particular category on Zee TV:
(a) Feeling from Drama category:
Your feeling 1. It keeps meaware.
½
2. It entertainsme.
½
3. I know abouthistory.
0/2
4. It makes mephobic.
0/2
5.I feel thereality.
0/2
6. Createscriminalbehavior
0/2
7.I feel Happy. ½8. I feelromantic.
0/2
9.Any otherfeeling
0/2
Explanation: The above data shows that 50% feel aware, 50%feel entertainment and 50% feel happy.
Result: There is equal percentage of working women who feelthat drama aware, entertain and make them feel happy.
206

(b) Feeling from Historical category programs :
There is no working woman which comes under the category ofsecond choice.
(c) Feeling from Horror category programs:
Your feeling:
1. It keeps meaware.
½
2. It entertainsme.
0/2
3. I know abouthistory.
0/2
4. It makes mephobic.
0/2
5.I feel thereality.
½
6. Createscriminalbehavior
½
7.I feel Happy. 0/28. I feelromantic.
0/2
9.Any otherfeeling
0/2
Explanation: The above data shows that 50% feel aware, 50%feel reality and 50% feel criminal behavior in them.
Result: There is equal percentage of working women who feelaware, reality and criminal behavior in them.
(d)Feeling from Mythology category programs:
There is no working woman under this category of second choiceon Zee TV.
207

(e) Feeling from Reality category programs:
Your Feeling1. It keeps meaware.
0/1
2. It entertainsme.
2/2
3. I know abouthistory.
0/1
4. It makes mephobic.
0/1
5.I feel thereality.
½
6. Createscriminalbehavior
0/1
7.I feel Happy. 0/18. I feelromantic.
0/1
9.Any otherfeeling
0/1
Explanation: The above data shows that 100% feel entertainmentand 50% feel reality in programs related to reality.
Result: There is full percentage of working women who feelentertainment in the programs related to reality.
3.Working Women who prefer to watch programs as third choicefor a particular category on Zee TV:
Drama 0/20Historical 1/20Horror 0/20Mythology 0/20
208

Reality 0/20Not interested in Zee TVprograms
4/20
Explanation: The above data shows that 5% working women preferhistorical programs to watch as third choice and 20% take nointerest in programs of Zee TV.
Result: There is less percentage of working women who preferto watch historical programs as third choice.
Feeling of working women who prefer to watch programs asthird choice for a particular category on Zee TV
(a)Feeling from Drama category:
There is no working woman under this category of third choice.
(b) Feeling from Historical category:
Your feeling
1. It keeps meaware.
0/1
2. It entertainsme.
0/1
3. I know abouthistory.
1/1
4. It makes mephobic.
0/1
5.I feel thereality.
0/1
6. Createscriminalbehavior
0/1
7.I feel Happy. 0/18. I feel 0/1
209

romantic.9.Any otherfeeling
0/1
Explanation: The above data shows that 100% working women whocome in the category of third choice feel that they want toknow about the history.
Result: There is full percentage of working women who come inthe category of third choice feel that they want to know aboutthe history.
(c) Feeling from Horror category:
There is no working woman who comes under this category ofthird choice on Zee TV.
(d) Feeling from Mythology category:
There is no working woman who comes under this category ofthird choice on Zee TV.
(e)Feeling from Reality category programs:
There is no working woman who comes under this category ofthird choice on Zee TV.
Interpretation: The above study shows that now a day’sprograms are telecasted to think every aspect of woman sothere are working women who watch drama as well as Historicalprograms and most of the working women want to know about thehistory of India which tell their attitude to know more abouthistory and on the other hand some of the working women watchprograms related to horror category and feel reality in thoseprograms which tells the attitude of working women that theybelieve in Spirits and Souls and most interesting thing isthat there are some working woman who feel that horror
210

programs aware them which shows that some of them haveexperienced the spirit so it is a positive impact of programson the mind of working women and on the other hand somenegative impact is also there because they are becomingphobic.
Q. 5.Which category of programme/programs of Sony do youwatch mostly?Ans:- ………………………………………………………………………………………………………
1. Drama 2.Historical 3.Horror 4.Reality5.Crime/Thriller
Your Feeling:
1. It keeps meaware.2. It entertainsme.3. I know abouthistory.4. It makes mephobic.5.I feel thereality.6. Createscriminal behavior7.I feel Happy.8. I feelromantic.9.Any otherfeeling
Ans. The aim of this question is to find out that whichcategory of programs liked by the working women on Sony andwhat they feel after watching these programs which willclarify the impact of programs of Sony on the attitude ofworking women.
211

1. Working women who prefer to watch programs as first choicefor a particular category on Sony:
Drama 0/20Historical 2/20Horror 1/20Reality 0/20Crime/Thriller 8/20Not interested in Sonyprograms
8/20
Explanation: The above data shows that 10% prefer historicalprograms, 5% prefer Horror,40% prefer crime/thrillerprograms to watch as first choice and 40% take no interestin programs of Sony.
Result: There is more percentage of working women who preferto watch programs related to crime/thriller as first choice.
Feeling of Working Women who prefer to watch programs as firstchoice for a particular category on Sony:
(a) Feeling from Drama :
There is no working woman who watch drama under the categoryof first choice on Sony
(b)Feeling from Historical category programs :
Your Feeling1. It keeps meaware.
1/2
2. It entertainsme.
0/2
3. I know abouthistory.
2/2
4. It makes mephobic.
0/2
212

5.I feel thereality.
0/2
6. Createscriminalbehavior
0/2
7.I feel Happy. ½8. I feelromantic.
0/2
9.Any otherfeeling
0/2
Explanation: The above data shows that 50% feel that they wantto know about the history, 100% feel reality and 50% feelhappy. Result: There is more percentage of working women who feelthat they feel reality and equal percentage of working womenwho want to know about history and feel happy.
(c) Feeling from Horror category programs:
1. It keeps meaware.
0/1
2. It entertainsme.
0/1
3. I know abouthistory.
0/1
4. It makes mephobic.
0/1
5.I feel thereality.
1/1
6. Createscriminalbehavior
0/1
7.I feel Happy. 0/18. I feelromantic.
0/1
9.Any otherfeeling
0/1
213

Explanation: The above data shows that 100% working womenfeel reality who watches horror.
Result: There is full percentage of working women who feelreality in programs related to horror which come under thecategory of first choice.
(d) Feeling from Reality category programs:
Your feeling:
1. It keeps meaware.
0/1
2. It entertainsme.
1/1
3. I know abouthistory.
0/1
4. It makes mephobic.
0/1
5.I feel thereality.
0/1
6. Createscriminalbehavior
0/1
7.I feel Happy. 0/18. I feelromantic.
0/1`
9.Any otherfeeling
0/1
Explanation: The above data shows that 100% working womenfeel that reality programs entertain them.
Result: There is full percentage of working women who feelentertainment after watching reality programs and which comein the category of first choice.
(e) Feeling from crime/thriller category programs:
214

1. It keeps meaware.
7/8
2. It entertainsme.
1/8
3. I know abouthistory.
1/8
4. It makes mephobic.
0/8
5.I feel thereality.
3/8
6. Createscriminalbehavior
1/8
7.I feel Happy. 0/88. I feelromantic.
0/8
9.Any otherfeeling
0/8
Explanation: The above data shows that 87.5% feel aware, 12.5% feel entertainment and 12.5% feel that criminal behaviorstrikes in their mind. Result: There is more percentage of working women who feelaware after watching crime /thriller programs and some feelthat criminal behavior strikes them.
2. Working women who prefer to watch programs as secondchoice for a particular category on Sony:
Drama 1/20Historical 1/20Horror 0/20Reality 0/20Crime/Thriller 0/20Not interested in Sonyprograms
0/20
Explanation: The above data shows that 5% working women preferdrama and 5% prefer historical programs.
215

Result: There is equal percentage of working women who preferto watch drama and historical programs.
Feeling of working women who prefer to watch programs assecond choice for a particular category on Sony:
(a) Feeling from Drama :
Your feeling1. It keeps meaware.
0/1
2. It entertainsme.
1/1
3. I know abouthistory.
0/1
4. It makes mephobic.
0/1
5.I feel thereality.
0/1
6. Createscriminalbehavior
0/1
7.I feel Happy. 0/18. I feelromantic.
0/1
9.Any otherfeeling
0/1
Explanation: The above data shows that 100% working women feelentertainment in watching drama.
Result: There is full percentage of working women who feelentertainment from the drama.
(b)Feeling from Historical category programs :
1. It keeps me 0/1
216

aware.2. It entertainsme.
0/1
3. I know abouthistory.
1/1
4. It makes mephobic.
0/1
5.I feel thereality.
0/1
6. Createscriminalbehavior
0/1
7.I feel Happy. 0/18. I feelromantic.
0/1
9.Any otherfeeling
0/1
Explanation: The above data shows that 100% working women wantto know about the history.
Result: There is full percentage of working women who want toknow about the history of India.
(c) Feeling from Horror category programs:
There is no working woman under this category of second choiceon Sony.
(d) Feeling from Reality category programs:
There is no working woman under this category of second choiceon Sony.
(e) Feeling from crime/thriller category programs:
There is no working woman under this category of second choiceon Sony.
217

(3) Working women who prefer to watch programs as thirdchoice for a particular category on Sony:
There are no working women who watch programs as third choicefor a particular category on Sony.
Interpretation: The above study shows that most of theworking woman who come under the first choice watch programsrelated to crime/thriller and feel that they are becomingaware from the incidents which occur in the working placewhich shows the positive attitude of the programs of thesetypes on the mind set of working women that they are becomingaware and on the other hand if we talk about the second choicethen working women prefer historical as well as drama to watchand feel entertainment and know about history so it also showsthat positive side of programs that in second choice alsoworking women prefer to watch historical programs of Sony.
Q.6.Which category of programme/programs of Colors do youwatch mostly and what do you feel?
Ans:- …………………………………………………………………………………………………….
1. Drama 2. Comedy 3. Reality
Your Feeling
1. It keeps meaware.2. It entertainsme.3. I know abouthistory.4. It makes mephobic.5.I feel thereality.6. Createscriminal behavior
218

7.I feel Happy.8. I feelromantic.9.Any otherfeeling
Ans The aim of this question is to find out that whichcategory of programs liked by the working women on Colors andwhat they feel after watching these programs which willclarify the impact of programs of Colors on the working women.
1. Working women who prefer to watch programs as firstchoice for a particular category on Colors:
Drama 7/20Comedy 3/20Reality 7/20Not interested in Colorsprograms
3/20
Explanation: The above data shows that 35% working womenprefer drama, 15% prefer comedy, 35% prefer reality to watchas first choice and 15% housewives do not take interest in theprograms of Sony.
Result: There is equal percentage of working women who watchdrama as well as reality programs as first choice on Colors.
Feelings of working woman who prefer to watch programs as first choice for a particular category on Colors:
(a) Feeling from Drama:
Your feeling1. It keeps meaware.
1/7
2. It entertainsme.
1/7
3. I know abouthistory.
0/7
219

4. It makes mephobic.
0/7
5.I feel thereality.
4/7
6. Createscriminal behavior7.I feel Happy. 1/78. I feelromantic.
2/7
9.Any otherfeeling
0/7
Explanation: The above data shows that 14.28% working womenfeel aware, 14.28% feel entertainment and 57.14 % feelreality, 4.28% feel happy and 28.57% feel romantic.
Result: There is more percentage of working woman who feelreality in watching drama of Colors.
(b) Feeling from Comedy:
Your feeling1. It keeps meaware.
0/3
2. It entertainsme.
1/3
3. I know abouthistory.
0/3
4. It makes mephobic.
0/3
5.I feel thereality.
0/3
6. Createscriminal behavior
0/3
7.I feel Happy. 3/38. I feelromantic.
0/3
9.Any otherfeeling
0/3
220

Explanation: The above data shows that 33.33% working womenfeel entertainment and 100% feel happy. Result: There is full percentage of working women who feelhappy in watching Comedy on Colors.
(c) Feeling from Reality:
Your feeling
1. It keeps meaware.
0/7
2. It entertainsme.
6/7
3. I know abouthistory.
0/7
4. It makes mephobic.
0/7
5.I feel thereality.
4/7
6. Createscriminal behavior
0/7
7.I feel Happy. 3/78. I feelromantic.
0/7
9.Any otherfeeling
0/7
Explanation: The above data shows that 85.71% working womenfeel entertainment and 57.14% feel reality and 42.85 % feelhappy in watching reality programs on Colors.
Result: There is more percentage of working women who feelentertainment in watching programs related to reality. 2. Working women who prefer to watch programs as secondchoice for a particular category on Colors:
Drama 1/20Comedy 2/20Reality 0/20Not interested in Colors 3/20
221

programs
Explanation: The above data shows that 5% working women watchcomedy and 10% watch reality as second choice on Colors and15% do not take interest in the program of Colors.
Result: There is more percentage of working women who watchreality on Colors.
Feeling of working women who prefer to watch programs assecond choice for a particular category on Colors:
(a)Feeling from Drama
Your feeling
1. It keeps meaware.
0/1
2. It entertainsme.
1/1
3. I know abouthistory.
0/1
4. It makes mephobic.
0/1
5.I feel thereality.
1/1
6. Createscriminal behavior
0/1
7.I feel Happy. 0/18. I feelromantic.
0/1
9.Any otherfeeling
0/1
Explanation: The above data shows that 100% working women feelentertainment and 100% feel reality.
Result: There is full percentage of working women who comeunder the second choice programs category feel the samefeeling of entertainment as well as reality in watching thedrama of Colors.
222

(b)Feeling from Comedy
Your Feeling:
1. It keeps meaware.
0/2
2. It entertainsme.
0/2
3. I know abouthistory.
0/2
4. It makes mephobic.
0/2
5.I feel thereality.
0/2
6. Createscriminal behavior
0/2
7.I feel Happy. 2/28. I feelromantic.
0/2
9.Any otherfeeling
0/2
Explanation: The above data shows that 100% working women feelhappy in watching programs related to Comedy.
Result: There is full percentage of working women who feelhappy in watching Comedy programs on Colors.
(c)Feeling from Reality
There is no working women who come under second choiceprograms category who watch reality.
Interpretation: The above study shows that the most of theworking women under the category of first choice of programswatch drama as well as reality programs on Colors and inwatching drama feel the reality of their life in these dramawhich remember their past and present so it shows thatprograms attach their heart to particular situation in thatparticular episode so it creates feeling of a affection ofworking women to others so it shows the positive impact of thetelevision programs on the thinking of working women and on
223

the other hand these programs create the feeling of romance insome of the working women which creates a unusual thinking orwe can say that the day dreaming which we can say thatsomething out of way because in real life it has differentmeaning. Q.7. Which category of programme/programs of Life Ok do youwatch mostly and what do you feel?
Ans:- ………………………………………………………………………………………………………
1. Drama 2.Mythogical 3.Fantasy 4.Crime
Your Feeling1. It keeps meaware.2. It entertainsme.3. I know abouthistory.4. It makes mephobic.5.I feel thereality.6. Createscriminal behavior7.I feel Happy.8. I feelromantic.9.Any otherfeeling
Ans. The aim of this question is to find out that whichcategory of programs liked by the working women on Life OKand what they feel after watching these programs which willclarify the effect of programs on the attitude of workingwomen.
1.Working women who prefer to watch programs as first choicefor a particular category on Life OK:
224

Drama 4/20Mythological 1/20Fantasy 0/20Crime 1/20Not interested in Life OK 14/20
Explanation: The above data shows that 20% working women watchdrama, 5% watch mythology, 5% watch Crime and 70% are notinterested in Life OK.
Result: There are some working women who watch mythology onLife OK. It is something different.
Feelings of working women who prefer to watch programs asfirst choice for a particular category on Life OK:
From drama category:
Your feeling
1. It keeps meaware.
0/4
2. It entertainsme.
1/4
3. I know abouthistory.
0/4
4. It makes mephobic.
0/4
5.I feel thereality.
0/4
6. Createscriminal behavior
2/4
7.I feel Happy. 2/48. I feelromantic.
2/4
9.Any otherfeeling
0/4
Explanation: The above data shows that 25% working womenfeel entertainment, 50% feel the criminal behavior in them ,50% feel happy and 50% feel romantic.
225

Result: There are some working women who feel that it createsthe criminal behavior in them.
From mythological category:
Your feeling
1. It keeps meaware.
0/1
2. It entertainsme.
1/1
3. I know abouthistory.
1/1
4. It makes mephobic.
1/1
5.I feel thereality.
0/1
6. Createscriminal behavior
0/1
7.I feel Happy. 1/18. I feelromantic.
0/1
9.Any otherfeeling
0/1
Explanation: The above data shows that 100%working women feelentertainment, want to know about history behind the myth,phobic as well as happy.
Result: There is percentage of working women who feel phobicfrom the programs related to mythology.
Feeling from fantasy:
There is no working woman who watches fantasy on Life OK.
Feeling from Crime:
Your Feeling
226

1. It keeps meaware.
1/1
2. It entertainsme.
0/1
3. I know abouthistory.
0/1
4. It makes mephobic.
0/1
5.I feel thereality.
0/1
6. Createscriminal behavior
0/1
7.I feel Happy. 0/18. I feelromantic.
0/1
9.Any otherfeeling
0/1
Explanation: The above data shows that 100% working women feelaware..
Result: There is full percentage of working women who feel thesame feeling of awareness.
Interpretation: The above study shows that programs of Life OKcreates the feeling of criminal mentality in the mind ofworking women it shows the negative effect of programs on theattitude of working women so it shows the negative effect ofprograms on the mindset of working women. So from here weconclude that there is something negative in the programs ofLife OK which creates such type of feeling. Q.8. Which category of programme/programs do you watch onDiscovery and what do you feel?
1. Medical Science 2.New technologies 3.Environment4.Culture 5.Health 6.Foods 7.Historical 8.AdventurousYour Feeling
227

1.It aware me.2.It entertain me.3I know about externalWorld.4.I feel phobic.5.Innovative ideascome in my mind6.I know about healthproblems.7.Want to doadventure.8. Other feeling.. Ans. The aim of this question is to find out that whichcategory of programs liked by the working women on Discoveryand what they feel after watching these programs which willclarify the impact of programs of Discovery on the attitude ofworking women
1.Working women who prefer to watch programs as first choicefor a particular category on Discovery:
Medical Science 0/20New Technologies 2/20Environment 1/20Culture 0/20Health 0/20Food 0/20Historical 0/20Adventurous 9/20Not interested in Discovery 8/20
Explanation: The above data shows that 10% working womenwatch programs on new technologies, 5% watch programs onenvironment, 45% watch programs on adventure and 40% do nottake interest in the programs of Discovery.
Result: There is more percentage of working women who watchprograms related to adventure on Dicovery.
228

Feeling of working women who prefer to watch programs as firstchoice for a particular category on Discovery:
1.Feeling from Medical Science category programs:
There are no working women who watch programs related toMedical Science in this category.
2.Feeling from New Technologies category programs:
Your feeling;
1.It aware me. 1/22.It entertain me. 0/23.I know aboutexternal World.
0/2
4.I feel phobic. 0/25.Innovative ideascome in my mind
0/2
6.I know about healthproblems.
0/2
7.Want to doadventure.
1/2
8. Other feeling. 0/2
Explanation: The above data shows that 5% working women feelaware and 5% feel adventure.
Result: There is equal percentage of working women who feelaware and adventure by watching programs related to newtechnologies.
3.Feeling from Environment category programs:
Your feeling
1.It aware me. 1/12.It entertain me. 0/13.I know about 0/1
229

external World.4.I feel phobic. 0/15.Innovative ideascome in my mind
0/1
6.I know about healthproblems.
0/1
7.Want to doadventure.
0/1
8. Other feeling.. 0/1
Explanation: The above data shows that 100% working women feelaware by watching programs related to environment.Result: There is full percentage of working women who feelaware of environmental conditions.
4.Feeling from Cultural category programs:
There are no working woman who watch programs related toCulture.
5.Feeling from Health category programs:
There are no working women who watch programs related toHealth.
6.Feeling from food category programs :
There is no working woman who watches programs related to foodcategory.
7.Feeling from Historical Category programs:
There is no working woman who watches programs related tohistorical category.
8.Feeling from Adventurous category programs:
Your feeling
230

1.It aware me. 2/92.It entertain me. 1/93.I know aboutexternal World.
4/9
4.I feel phobic.5.Innovative ideascome in my mind
3/9
6.I know about healthproblems.
1/9
7.Want to doadventure.
2/9
8. Other feeling.. 0/9
Explanation: The above data shows that 22.22% working womenfeel aware, 11.11% feel entertainment ,44.44% feel theexternal world , 33.33% feel innovative ideas, 11.11% feel thehealth problems and 22.22% feel adventure.
Result: There is more percentage of working women who feelthe external world adventures.
Interpretation: There is mostly the percentage of workingwomen who watch programs on adventures and feel the adventuresof foreign countries and feel the external world and variousinnovative ideas come in their mind to do something new typeof adventure that will be different from others and they alsocome to know about the risks and health problems which arecaused by the some types of adventures which cause dangerousdiseases in the body so it shows the positive effect of theprograms of discovery in the mindset of working women and onthe other hand these programs sometimes creates the negativeeffects in the mindset because some of the working womenstart doing innovative things or acts or the acts which is offward in the Indian society so it is the negative effects ofprograms of Discovery. So we conclude that programs ofDiscovery causes positive as well as negative effects on themindset of working women.
231

Q.9. Which category of programme/programs do you watch onother channels and what do you feel?Ans: ………………………………………………………………………………………………………
1.Drama 2.Historical 3.Horror 4.Mythology 5.Reality6.Crime 7.Comedy 8.Fantasy 9.FashionYour Feeling
1. It keeps meaware.2. It entertainsme.3. I know abouthistory.4. It makes mephobic.5. I feel thereality.6. Createscriminal behavior7. I feel Happy.8. I feelromantic.9. Any otherfeeling.
Ans.. The aim of this question is to find out that whichcategories of programs working women watch on other channelsand what they feel which will clarify the impact of programsof other channels on the attitude of working women.
1.Working women who prefer to watch programs as first choicefor a particular category on other channels:
Drama 8/20Historical 0/20Horror 0/20Mythology 2/20Reality(Music Programs) 1/20
232

Crime 0/20Comedy 1/20Fantasy 0/20Fashion 0/20News programs 3/20 (ABP, AAJ TAK,INDIA TV)Not interested in otherchannels
5/20
Explanation: The above data shows that 40% working women watchdrama, 10% watch mythological programs, 5% watch reality, 5%watch comedy and 15% watch news programs.
Result: There are most of the working women who watch drama onother channels.
Feeling of working women who prefer to watch programs as firstchoice for a particular category on other channels:
Feeling from Drama:
Your Feeling
1. It keeps meaware.
0/8
2. It entertainsme.
6/8
3. I know abouthistory.
1/8
4. It makes mephobic.
0/8
5.I feel thereality.
2/8
6. Createscriminal behavior
0/8
7.I feel Happy. 2/88. I feelromantic.
2/8
9.Any otherfeeling
0/8
233

Explanation: The above data shows that 75% working women feelentertainment, 12.5% know about history , 25% feel reality,25% feel happy and 25% feel romantic.
Result: There is most percentage of working women who feelentertainment in watching drama.
Feeling from Mythology:
Your feeling
1. It keeps meaware.
0/2
2. It entertainsme.
1/2
3. I know abouthistory.
1/2
4. It makes mephobic.
0/2
5.I feel thereality.
1/2
6. Createscriminal behavior
0/2
7.I feel Happy. 1/28. I feelromantic.
0/2
9.Any otherfeeling
0/2
Explanation: The above data shows that 5% feel entertainment,5% feel that they want to know about the history behind anymyth and 5% feel happy.
Result: There is equal percentage of housewives who want toknow about history, feel entertainment as well as happy.
Feeling from Comedy:
Your feeling
234

1. It keeps meaware.
0/1
2. It entertainsme.
1/1
3. I know abouthistory.
0/1
4. It makes mephobic.
0/1
5.I feel thereality.
0/1
6. Createscriminal behavior
0/1
7.I feel Happy. 1/18. I feelromantic.
0/1
9.Any otherfeeling
0/1
Explanation: The above data shows that 100% working womenfeel entertainment as well as happy.
Result: There is equal percentage of working women who havethe same feeling.
Feeling from News Programs:
Your Feeling
1. It keeps meaware.
2/3
2. It entertainsme.
1/3
3. I know abouthistory.
0/3
4. It makes mephobic.
0/3
5.I feel thereality.
1/3
6. Creates 0/3
235

criminal behavior7.I feel Happy. 0/38. I feelromantic.
0/3
9.Any otherfeeling
0/3
Explanation: The above data shows that 66.66% working womenfeel aware, 33.33% feel entertainment and 33.33% feel realitywho watches news programs.
Result: There is more percentage of working women who feelaware.
Interpretation: The above study shows that there are moreworking women who watch drama on other channels and feelrefresh which means only for entertainment it shows that thereis no important effects of programs of other channels but mostinteresting things is that working women give some of theirtime in watching programs of news channels which aware them soit shows that the working women also update them regardingproblems of women in India which shows the positive impact ofnews programs on the attitude of working women.
Q.10. Which type of programs do you like most?
1. Related to women 2. Related to children 3. Related tofashion 4. Related to food Habits
Ans. The aim of this question is to find out the impact ofprograms on the attitude of working women by dividing the typeof programs as written above.
Working women who like one type of programs:
Related to Women 9/20Related to Children 1/20Related to Fashion 5/20
236

Related to food Habits 2/20
Explanation: The above data shows that 45% working women likeprograms related to women, 5% like related to children, 25%like programs related to fashion, 10% programs related to foodhabits.
Result: There is more percentage of working women who likeprograms related to women.
Working Women who like two type of programs:
Related to women + Related tofood habits
2/20
Explanation: The above data shows that 10% working women liketwo types of programs related to women and food habits.
Result: There is some percentage of working women who like twotypes of programs
Working women who like three types of programs:
Related to women + Related tofashion + Related to foodhabits
1/20
Explanation: The above data shows that 5% working women likethree types of programs.
Result: There is some percent of working women who like threetypes of programs.
Working women who like four types of programs:
There is no working woman who likes four type of programs.
237
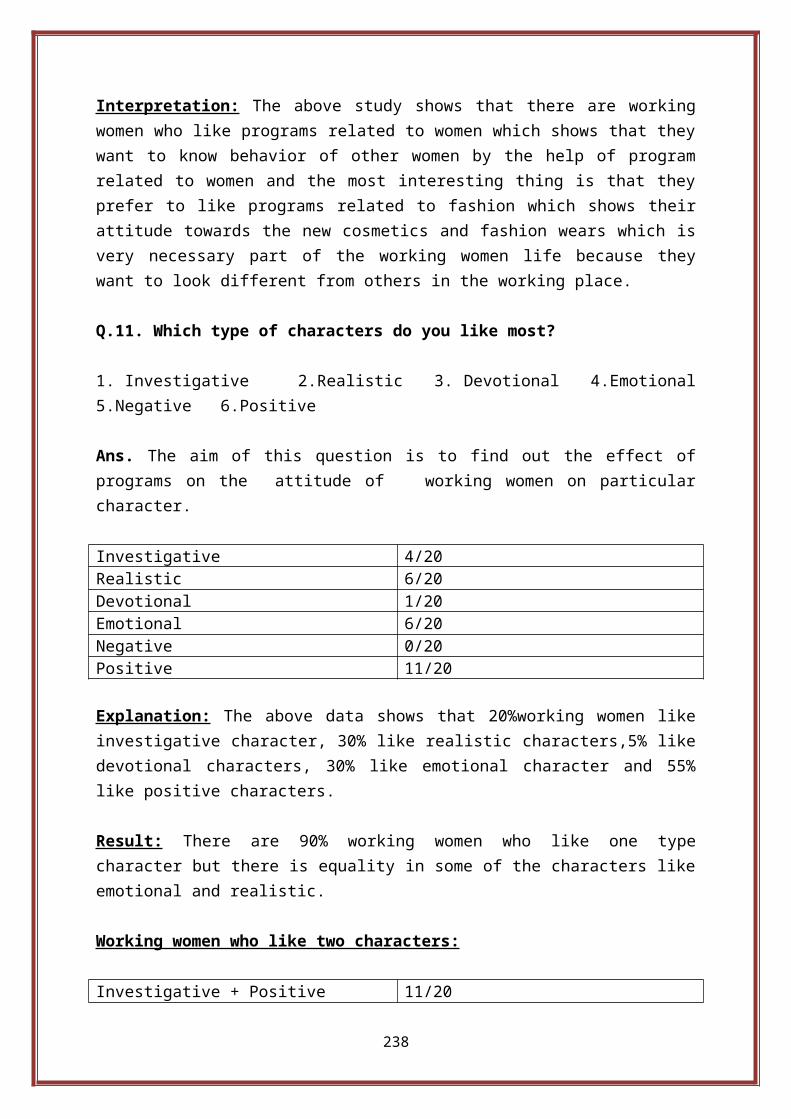
Interpretation: The above study shows that there are workingwomen who like programs related to women which shows that theywant to know behavior of other women by the help of programrelated to women and the most interesting thing is that theyprefer to like programs related to fashion which shows theirattitude towards the new cosmetics and fashion wears which isvery necessary part of the working women life because theywant to look different from others in the working place.
Q.11. Which type of characters do you like most?
1. Investigative 2.Realistic 3. Devotional 4.Emotional5.Negative 6.Positive
Ans. The aim of this question is to find out the effect ofprograms on the attitude of working women on particularcharacter.
Investigative 4/20Realistic 6/20Devotional 1/20Emotional 6/20Negative 0/20Positive 11/20
Explanation: The above data shows that 20%working women likeinvestigative character, 30% like realistic characters,5% likedevotional characters, 30% like emotional character and 55%like positive characters.
Result: There are 90% working women who like one typecharacter but there is equality in some of the characters likeemotional and realistic.
Working women who like two characters:
Investigative + Positive 11/20
238

Realistic + Positive 1/20Investigative + Emotional 1/20
Explanation: The above data shows that 55% like investigativeas well as positive,5% like realistic as well as positive and5% like investigative and emotional.
Result: There are 65% of working women who like twocharacters.
Working women who like three characters:
Realistic + Emotional +Positive
1/20
Devotional + Emotional+Positive
1/20
Explanation: The above data shows that 5% like realistic,emotional as well as positive characters and 5% likedevotional, emotional as well as positive characters.
Result : There are 10% working women who like threecharacters.
Working women who like four characters:
There is no working woman who likes four characters.
Working Women who like five characters:
There is no working woman who likes five characters.
Working Women who like six characters:
There is no working woman who likes six characters.
239

Interpretation: There is more percentage of working women wholike positive characters in the programs as a result theyapply these characters in their own life and feel change intheir life but there are some working women who like threecharacters and there are some who like only emotionalcharacters which shows that they have emotions in them forothers.
Q.12. Do you apply above marked character in your own lifeand what do you experience ?1. Yes 2. No 3. To some extentIf your option is 1 or 3 than your experience: .……………………………………........................................……………………………………………………………………………………………………………….
Ans. The aim of this question is to find out that how manyworking women apply the characters in their own life and whatthey experience. It will explain the effect of programs on theattitude of working women towards the character and itsapplication in owns life.
Yes 10/20No 7/20To some extent 3/20
Explanation: The above data shows that 50% working womenapply the marked characters in their life and 15% apply thesemarked characters to some extent.
Result: There is more percentage of working women who applythe marked characters in their own life.
Experience of working women who say yes:
1. To go up in life.
240

2. Nothing to say.3. It makes me happy.4. Upgrade knowledge.5. Feel entertainment.6. Nothing to say.7. Feel good.8. Feel upgraded.9. Sometimes positive and sometimes negative.10.
Feel good.
Experience of working women who say to some extent:
1.
Try to imbibe the behavior of the characters.
2.
Some positive characters inspire me.
3.
Nothing to say.
Interpretation: The above data shows that there are workingwomen who apply the marked characters in their life and feel apositive change but some say they feel both positive as wellas negative change which shows that programs effects thethinking of working women that they apply some of thecharacters and experience different change in them which isvery tough to judge because every woman feel new change in herbut in positive manner.
Q.13. Do you apply above marked characters in others life andwhat you experience?
1.Yes 2. No 3. To some extent
If your option is 1 or 3 than your experience:……........................................................................................……………………………………………………………………………………………………………….
241

Ans. The aim of this question is to find out that how manyworking women apply the characters on others life and what isthe role of programs on the attitude of working women afterapplying the marked character.
Yes 4/20No 14/20To some extent 2/20
Explanation: The above data shows that 20% working women applythe characters in others life and 10% apply to some extent.
Result: There is very less percentage of working women whoapply the marked characters in others life.
Experience of working women who say Yes :
1.
Feel good
2.
Nothing to say
3.
It depends on other what he/she want.
4.
Nothing to share
Experience of working women who say to some extent :
1.
According to other behavior
2.
I feel reality in others life when I apply particularcharacter.
Interpretation: The above study shows that there are some ofthe working women who apply the marked character in otherslife but the most positive thing is there that they applypositive attitudes in others life. So, it shows the positive
242

impact of programs on the attitude of the working women whoapply the right and authentic character according to thecondition.
Q.14. How much time do you spend on watching Televisionprogramme?
1. Half an Hour 2. One Hour 3. Two Hour4. More than that
Ans. The aim of this question is to find out the time ofworking women they spend in watching television programs. So,it will clarify the attitude towards the time management intheir busy schedule regarding watching programs which clarifythe impact of programs.
Half an Hour 2/20One Hour 6/20Two Hour 8/20More than that 4/20
Explanation: The above data show that 5% watch programs halfan hour, 30% watch programs for one hour, 40% watch programsfor two hour and 20% watch more than that.
Result: There is more percentage of working women who watchprograms for two hour.
Interpretation: The above study shows that most of the workingwomen watch programs for two hour which shows theirregularity to watch the programs regularly for two hour intheir busy timetable. It shows that something is there in theprograms which attract them.
Q.15. At what time do you prefer to watch Televisionprogramme?
243

1. Morning 2. After Noon 3. Evening 4.Late Night
Ans. The aim of this question is to find out the time which ispreferred by the working women to watch television programswhich clarify the eagerness of the working women to watchprograms.
1. Morning 0/202. After Noon 0/203. Evening 11/204. Late Night 9/20
Explanation: The above data shows that 55% working women watchthe programs in evening and 45% watch programs at night.
Result: There are more percent to watch programs in evening.
Interpretation: The above study shows that there are most ofthe working women who watch programs in evening which showsthat they are so eager to watch upcoming episode in evening bywhich we conclude that there is something hidden behind theprograms which pull them.
Q.16. Do you leave all other important work while watchingTelevision Programme?1. Yes 2.No 3.To some extentAns. The aim of this question is to find out that how manyworking women leave their important work and how many workingwomen leave no work and how many working women leave theirwork to some extent. So that we conclude the impact of programon the attitude of working women that how important a programfor them.
Yes 3/20No 15/20To some extent 2/20
244

Explanation: The above data shows that 15% leave importantwork and 10% leave work to some extent.
Result: There is little more percentage of working women wholeave their important work.
Interpretation: The above study shows that there are someworking women who leave their important work while watchingprograms which shows the negative impact of the programs onthe mind of some women or in other words we can say that theyhave habit of carelessness so that they leave the importantwork but it is not the true fact because they feel thatsomething suspense is there in the programs that attract themand they leave their important work even office work and thoseworking women who are married leave their children on theirown risk who want a regular attention of them but thepositive thing is that they are less in percentage.
Q.17. Do you feel that Television programs are responsible forsocial change?1.If yes,why? ..............................................................................................................................................……………………………………………………………………………………………………………….2.If no,why?.................................................................................................................................................……………………………………………………………………………………………………………….Ans. The aim of this question is to find out that how manyworking women feel that programs bring social changes whichwill clarify the importance of programs to bring social changein the eyes of working women.
Yes 15/20
245

No 5/20
Explanation: The above data shows that 75% feel that programsbrings social change and 25% feel that programs do not bringsocial change.Result: There is more percentage of working women who thinkthat programs bring social change.
Opinion of working women who say yes:
1. Nothing to say.2. People are changing.3. Sometimes negative and sometime positive.4. Nothing to say.5. Changing the society.6. Helps to know about social life of people.7. Both negative and positive effect on the society.8. Feel new character of people.9. Helps to change the behavior.10.
Directly impact on our society.
11.
Creates criminal behavior.
11.
Teaches people values.
12.
Aware everyone.
13.
Aware everyone.
14.
Aware everyone.
15.
Nothing to say
Interpretation: The above study shows that there is morepercentage of working women who believe that programs bringssocial change in the society and mindset of people but thetypical thing is that every woman has her own thinking . Somesays that it effects directly our society, some says that it
246

effects both negative and positive and so on. So, it is verytough to differentiate between the thinking of working women.So it means that programs are bringing social change in allrespect.
Q.18. Do you feel that something innovative should be done toimprove the quality of programs?Ans:-………………………………………………………………………………………………………………………………………………………………………………………………………………………………Ans. The aim of this question is to find out that how manyworking women want something innovative in the quality ofprograms and how many do not agree with it which will clarifythe innovation in the programs in the eyes of working women.
Yes 14/20No 6/20
Explanation: The above data shows that 70% feel that somethinginnovative should be done and 30% feel that nothing should bedone to improve the quality of programs.
Result: There is more percentage of working women who feelthat innovation should be done to improve the quality ofprograms. So, it tells the attitude of working women that theyfeel social change in the society.
Opinion of the working women who say yes:
1. Nothing to say.2. Nothing to say.3. Nothing to say.4. Nothing to say.5. Improve the quality of comedy and news programs.
247

6. Nothing to say.7. Everybody wants new types of programs8. More innovative changes should be done. 9. Nothing to say.10.
Programs should be on knowledge.
11.
Something should be innovative.
12.
Try different ideologies of programs.
13.
Nothing to say.
14.
Programs should be on women.
Interpretation: The above study shows that there are workingwomen who want that something innovative is done to improvethe quality of programs so that society will know about thenew problems of women and their solutions and some say thatprograms should be knowledgeable. So, it shows the positiveattitude of working women towards the quality and content ofprogram.
248

DATA ANALYSIS OF HOUSEWIVES
249
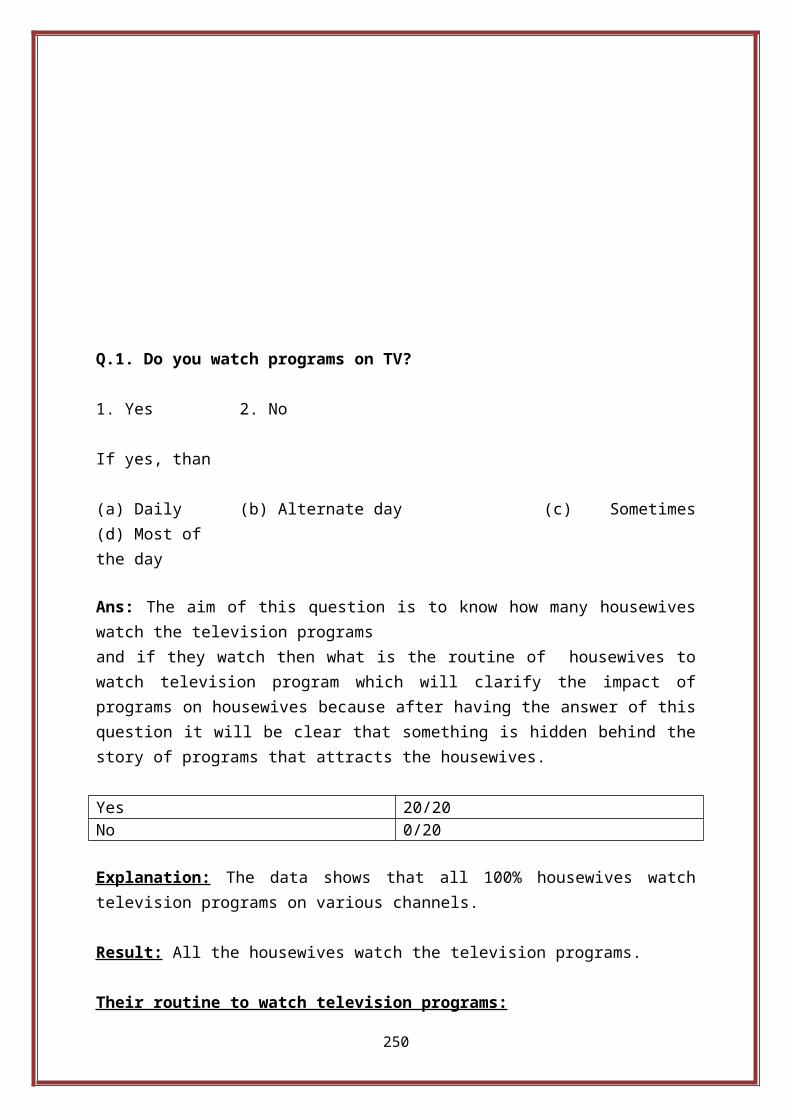
Q.1. Do you watch programs on TV?
1. Yes 2. No
If yes, than
(a) Daily (b) Alternate day (c) Sometimes(d) Most of the day Ans: The aim of this question is to know how many housewiveswatch the television programs and if they watch then what is the routine of housewives towatch television program which will clarify the impact ofprograms on housewives because after having the answer of thisquestion it will be clear that something is hidden behind thestory of programs that attracts the housewives.
Yes 20/20No 0/20
Explanation: The data shows that all 100% housewives watchtelevision programs on various channels.
Result: All the housewives watch the television programs.
Their routine to watch television programs:
250

Daily 13/20Alternate Day 0/20Sometimes 6/20Most of the day 1/20
Explanation: The above data shows that 65% housewives watchtelevision programs daily, 0% watch alternate day, 30% watchsometimes and 5% watch most of the day.
Result: There is more percentage of housewives who watchtelevision programs daily and the most interesting thing isthat no housewife watches programs on alternate day.
Interpretation: There is full percentage of housewives whowatch programs in which there is more percentage of housewiveswho watch programs daily which shows that something is therein the programs which binds more percentage of housewivestowards the programs which shows something negative impact ofprograms on the attitude of housewives because they have towatch every episode at any cost. Sometimes it causes thefamily disturbance because if they watch programs daily thennew thinking strikes in the mind it may be positive ornegative depends upon the mental state of housewife that inwhat condition she is watching television. Sometimeshousewives watch programs at the time of tension for theirrefreshment but it results bad because at that time there aremore chances to adopt negative things from the programs andcommits wrong mistakes and become habitual of doing wrongthings like indulging in the other family, doing investigationof their family members and so on which cause familydisbalance and creates big problems in life.
Q.2. Which type of programs do you watch mostly?
1. Social 2.Entertainment 3.Educational 4.Awareness 5.Devotional
251

Ans: The aim of this question is to find out the types ofprograms which the housewives watch so that we can concludethat what is the thinking of housewives that command them towatch particular type of programs so it will clarify theimpact of programs on the attitude of housewives behindwatching programs. It may be of one category or more than onecategory of programs for each housewife.
One Type :
Number of housewives who watch one type of programme :
Social 1/20Entertainment 13/20Educational 2/20Awareness 1/20Devotional 0/20
Explanation: The above data show that 5% of the housewiveswatch social programs , 65% watch entertainment, 10% watcheducational programs, 5% watch programs related to awarenessand 0% related to devotion.
Result: There is more percentage of housewives who watchprograms of entertainment .
Two type :
Number of housewives who watch two types of programs:
Social +Entertainment 2/20
Explanation: The above data show that 10% housewives watchprograms related to society as well as entertainment.
252

Result: There is very less percentage of housewives who watchtwo types of programs it shows that there are some housewiveswhose attitude is towards two categories.
Three Types :
Number of housewives who watch three types of programs :
There are no housewives who watch three types of programs.
Four Types:
There are no housewives who watch four types of programs.
Number of housewives who watch four type of program:
There are no housewives who watch four types of programs.
Five Types :
There are no housewives who watch five types of programs.
Interpretation: The above study shows that there is morepercentage of housewives who watch programs of entertainmentwhich means that programs only create the feeling ofentertainment y in the mindset of housewives so they watchprograms only for the entertainment which we can say somenegative impact of programs on the attitude of housewivesbecause if they think to watch television programs then onlyone thinking strikes in the mind of housewives that programsare created only for entertainment. It may be the weakness ofprograms themes that they are watched only for entertainmentpurpose by the housewives in most cases.
Q.3. Which channel programs do you like most?
253

1. Zee TV 2. Sony 3. Colors 4. Life Ok5.Discovery 6.Others
Ans. The aim of this question is to find out that whichchannel of the programs is liked by the housewives to watchprograms of their own choice. So from this we can concludethat which channel programs have more impact on the attitudeof housewives.
Number of housewives who like one type of channel programs:
Zee TV 3/20Sony 0/20Colors 5/20Others 0/20Explanation: The above data shows that 15% housewives likeprograms of Zee TV and 25% housewives like programs of Colors.
Result: There are 40% housewives who like programs of onechannel in which more percentage of housewives like theprograms of Colors. .Number of housewives who like two type of channelsprograms :
Zee TV + Others 3/20Zee TV + Colors 1/20Zee TV + Sony 2/20Zee TV + Life OK 1/20Colors + Others 2/20
Explanation: The above data show that 15% housewives like ZeeTV as well as other channels, 5% housewives like Zee TV aswell as Colors, 10% like Zee TV as well as Sony, 5% like ZeeTV as well as Life OK and 10% like Colors as well as otherchannels programs.
254

Result: There are 40% housewives who like programs of twochannels in which there are more percentage of housewives wholike Zee TV and others channels programs.
Number of housewives who like three types channels programs :
Colors + Life OK + Others 1/20
Explanation: The above data shows that 5% housewives who likethree types of channels programs. They are Colors, Life OK aswell as others.
Result: There are only 5% housewives who like three types ofchannels programs.
Number of housewives who like four types of channels programs:
Zee TV + Sony + Colors +Others
1/20
Explanation: The above data shows that 5% housewives like fourtypes of channels programs, they are Zee TV, Sony, Colors aswell as others.
Result: There are only 5% housewives who like four types ofchannels programs.
Number of housewives who watch five types of channels programs:
Zee TV + Sony + Colors +Discovery+ Others
1/20
Explanation: The above data shows that 5% housewives like fivetypes of channels programs, they are Zee TV, Sony, Colors ,Discovery as well as other channels.
255

Result: There are only 5% housewives who like four types ofchannels programs.
Number of housewives who watch six types of channels programs :
There are no housewives who watch six types of channelprograms.
Interpretation: The study shows that there are more percentageof housewives who watch other channels programs which meansother channels make programs on such issues that it attractthe attention of housewives and has more impact on the mindsetof housewives and their thinking. The most interesting thingis that they watch news programs on news channels because newsprograms are made on all the issues which is required by thehousewives because it contains all the programs from filmindustries to serious issues on the women so we can concludethat there is positive impact of programs on the attitude ofhousewives because they want to listen all the news storiesaround the world in a news programs so it clarifies thepositive impact of programs on the attitude of housewives.
256

Note : I have divided the data on the basis of choices ofhousewives marked by the housewives from Q.4 to Q.6 For example:
1.First Choice
2.Second Choice
3.Third Choiceand for Q.7 to Q.9 I shall take only the first choice ofhousewives.For example:1.First Choice Only
So, I shall do my study on choice basis from Q.4 to Q.9.
257

Q.4. Which category of programme/programs of Zee TV do youwatch mostly and what do you feel?
Ans:- ………………………………………………………………………………………………………
1. Drama 2.Historical 3.Horror 4. Mythology 5.Reality 1. It keeps meaware.2. It entertainsme.3. I know abouthistory.4. It makes mephobic.5.I feel thereality.6. Createscriminal
258

behavior7.I feel Happy.8. I feelromantic.9.Any otherfeeling
Ans. The aim of this question is to find out that whichcategory of programs liked by the housewives with first choiceon Zee TV and what they feel after watching these programswhich will clarify the impact of programs of Zee TV on thehousewives.
1. Housewives who prefer to watch programs as first choice fora particular category on Zee TV:
Drama 4/20Historical 9/20Horror 0/20Mythology 0/20Reality 2/20Not interested in Zee TVprograms
5/20
Explanation: The above data shows that 20% housewives preferto watch drama ,45% prefer historical programs, 5% preferreality programs to watch as first choice and 25% take nointerest in programs of Zee TV.
Result: There is more percentage of housewives who prefer towatch historical programs as first choice on Zee TV.
Feeling of Housewives who prefer to watch programs as firstchoice for a particular category on Zee TV:
(a) Feeling from Drama :
259

Your Feeling
1. It keeps meaware.
0/4
2. It entertainsme.
3/4
3. I know abouthistory.
0/4
4. It makes mephobic.
0/4
5.I feel thereality.
0/4
6. Createscriminalbehavior
0/4
7.I feel Happy. 0/48. I feelromantic.
0/4
9.Any otherfeeling
Feel honesty and hard work, feel accordingto the character, 2/4
Explanation: The above data shows that 75% feel entertain and50% feel other feelings of honesty and feel according to thecharacter.
Result: There is more percentage of housewives who feelentertainment after watching drama on Zee TV.
(b)Feeling from Historical category programs :
Your Feeling
1. It keeps meaware.
1/9
2. It entertainsme.
7/9
3. I know abouthistory.
5/9
260

4. It makes mephobic.
1/9
5.I feel thereality.
2/9
6. Createscriminalbehavior
0/9
7.I feel Happy. 2/98. I feelromantic.
2/9
9.Any otherfeeling
0/9
Explanation: The above data shows that 11.11% feel aware,77.77% feel entertain,55 %feel that they know about thehistory, 11.11% feel phobic 22.22% feel reality,22.22% feelhappy and 22.22% feel romance.
Result: There is more percentage of housewives who feel thatthey know about history of India.
(c) Feeling from Horror category programs:
There is no housewife under this category of first choice onZee TV.
(d)Feeling from Mythology category programs:
There is no housewife under this category of first choice onZee TV.
(e) Feeling from Reality category programs:
Your Feeling
1. It keeps meaware.
0/2
2. It entertains 2/2
261

me.3. I know abouthistory.
0/2
4. It makes mephobic.
0/2
5.I feel thereality.
0/2
6.Createscriminalbehavior
0/2
7.I feel Happy. 0/28. I feelromantic.
0/2
9.Any otherfeeling
0/2
Explanation: The above data shows that 100% housewives whowatch reality feel entertainment in reality programs. Result: There is full percentage of housewives who feel thatprograms related to reality entertain them
2. Housewives who prefer to watch programs as second choicefor a particular category on Zee TV:
Drama 3/20Historical 4/20Horror 0/20Mythology 0/20Reality 2/20Not interested in Zee TVprograms
5/20
Explanation: The above data shows that 15% housewives preferdrama ,20% prefer historical programs, 10% prefer realityprograms to watch as second choice and 25% take no interestin programs of Zee TV.
262

Result: There is more percentage of housewives who prefer towatch programs related to history on second choice.
Feeling of housewives who prefer to watch programs as secondchoice for a particular category on Zee TV:
(a) Feeling from Drama category:
Your feeling
1. It keeps meaware.
0/3
2. It entertainsme.
2/3
3. I know abouthistory.
0/3
4. It makes mephobic.
1/3
5. I feel thereality.
0/3
6. Createscriminalbehavior
0/3
7. I feel Happy. 0/38. I feelromantic.
1/3
9.Any otherfeeling
0/3
Explanation: The above data shows that 66.66% feel entertain,33.33% feel phobic,33.33% feel romance.
Result: There is more percentage of housewives who feel thatdrama entertain them and there is equal percentage ofhousewives who feel phobic as well as romantic.
(b) Feeling from Historical category programs :
Your Feeling
263

1. It keeps meaware.
0/4
2. It entertainsme.
0/4
3. I know abouthistory.
3/4
4. It makes mephobic.
0/4
5.I feel thereality.
0/4
6. Createscriminalbehavior
0/4
7.I feel Happy. 3/48. I feelromantic.
0/4
9.Any otherfeeling
0/4
Explanation: The above data shows that 75% feel that they wantto know about history and 25% feel romance.
Result: There is more percentage of housewives who feel thatthey know about the history of India.
(c) Feeling from Horror category programs:
There is no housewife under this category of second choice onZee TV.
(d)Feeling from Mythology category programs:
There is no housewife under this category of second choice onZee TV.
(e) Feeling from Reality category programs:
Your Feeling
264

1. It keeps meaware.
0/2
2. It entertainsme.
1/2
3. I know abouthistory.
0/2
4. It makes mephobic.
0/2
5.I feel thereality.
1/2
6. Createscriminalbehavior
0/2
7.I feel Happy. 0/28. I feelromantic.
0/2
9.Any otherfeeling
0/2
Explanation: The above data shows that 50% feel entertain and50% feel reality in programs related to reality.
Result: There is equal percentage of housewives who feelentertainment as well as reality in the programs related toreality.
3. Housewives who prefer to watch programs as third choice fora particular category on Zee TV:
Drama 2/20Historical 0/20Horror 0/20Mythology 0/20Reality 2/20Not interested in Zee TVprograms
5/20
265

Explanation: The above data shows that 10% housewives preferto watch drama,10% prefer reality programs to watch as thirdchoice and 25% take no interest in programs of Zee TV.
Result: There is equal percentage of housewives who prefer towatch drama as well as reality as third choice.
Feeling of Housewives who prefer to watch programs as thirdchoice for a particular category on Zee TV
(a)Feeling from Drama category:
Your feeling
1. It keeps meaware.
0/2
2. It entertainsme.
2/2
3. I know abouthistory.
0/2
4. It makes mephobic.
0/2
5. I feel thereality.
0/2
6. Createscriminalbehavior
0/2
7. I feel Happy. 0/28. I feelromantic.
0/2
9.Any otherfeeling
0/2
Explanation: The above data shows that 100%feel entertainment.
Result: There is full percentage of housewives who feel thatdrama entertain them .
(b) Feeling from Historical category:
266
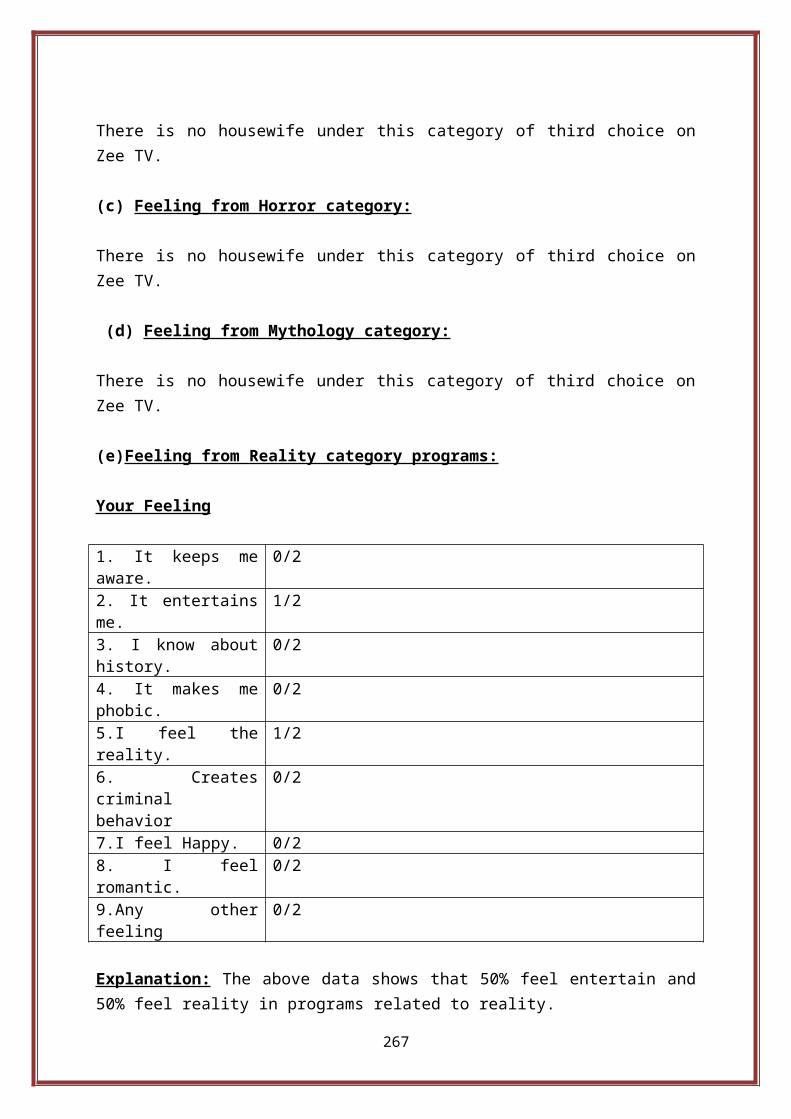
There is no housewife under this category of third choice onZee TV.
(c) Feeling from Horror category:
There is no housewife under this category of third choice onZee TV.
(d) Feeling from Mythology category:
There is no housewife under this category of third choice onZee TV.
(e)Feeling from Reality category programs:
Your Feeling
1. It keeps meaware.
0/2
2. It entertainsme.
1/2
3. I know abouthistory.
0/2
4. It makes mephobic.
0/2
5.I feel thereality.
1/2
6. Createscriminalbehavior
0/2
7.I feel Happy. 0/28. I feelromantic.
0/2
9.Any otherfeeling
0/2
Explanation: The above data shows that 50% feel entertain and50% feel reality in programs related to reality.
267

Result: There is equal percentage of housewives who feelentertainment as well as reality in the programs related toreality.
Interpretation: The above study shows that there is morepercentage of housewives who watch historical programs on ZeeTV as a first choice and upgrade their knowledge but on theother hand there are some of the housewives who feel romancein these historical programs which shows that some of thehousewives fly in the romantic thinking which shows that thehistorical programs give something romantic in every episodebut we cannot say that housewives who feel romantic areupgrading their thinking because they are going out of reallife which can create some astray thinking out of their worldwhich shows the some mediate impact of programs on theattitude of housewives.
Q.5. Which category of programme/programs of Sony do youwatch mostly?
Ans:- ………………………………………………………………………………………………………1. Drama 2.Historical 3.Horror 4.Reality5.Crime/ThrillerYour Feeling:
1. It keeps meaware.2. It entertainsme.3. I know abouthistory.4. It makes mephobic.5.I feel thereality.6. Creates
268

criminal behavior7.I feel Happy.8. I feelromantic.9.Any otherfeeling
Ans. The aim of this question is to find out that whichcategory of programs liked by the housewives on Sony and whatthey feel after watching these programs which will show theimpact of programs of Sony channel on the attitude ofhousewives.
1. Housewives who prefer to watch programs as first choice fora particular category on Sony:
Drama 5/20Historical 2/20Horror 0/20Reality 0/20Crime/Thriller 5/20Not interested in Sonyprograms
8/20
Explanation: The above data shows that 20% housewives preferto watch drama ,10% prefer historical programs, 25% prefercrime/thriller programs to watch as first choice and 40%take no interest in programs of Sony.
Result: There is more percentage of housewives who prefer towatch drama as first choice.
Feeling of Housewives who prefer to watch programs as firstchoice for a particular category on Sony:
(a) Feeling from Drama :
Your Feeling
269

1. It keeps meaware.
1/5
2. It entertainsme.
2/5
3. I know abouthistory.
0/5
4. It makes mephobic.
0/5
5.I feel thereality.
0/5
6. Createscriminalbehavior
0/5
7.I feel Happy. 0/58. I feelromantic.
0/5
9.Any otherfeeling
Honesty regarding partner, to study, 2/5
Explanation: The above data shows that 20% feel aware and 40%feel entertainment and 40% feel other feeling of honestyregarding partner and importance of education.
Result: There is equal percentage of housewives who feelentertainment as well as other feeling by watching drama onSony.
(b) Feeling from Historical category programs :
Your Feeling
1. It keeps meaware.
0/2
2. It entertainsme.
0/2
3. I know abouthistory.
1/2
4. It makes mephobic.
0/2
270

5.I feel thereality.
1/2
6. Createscriminalbehavior
0/2
7.I feel Happy. 1/28. I feelromantic.
0/2
9.Any otherfeeling
0/2
Explanation: The above data shows that 50% feel that they wantto know about the history, 50% feel reality and 50% feelhappy.
Result: There is more percentage of housewives who feel thatthey want to know about history of India after watchingprograms related to history on Sony.
(c) Feeling from Horror category programs:
There is no housewife under this category of first choice onSony.
(d) Feeling from Reality category programs:
There is no housewife under this category of first choice onSony.
(e) Feeling from crime/thriller category programs:
Your feeling
1. It keeps meaware.
5/5
2. It entertainsme.
0/5
3. I know about 0/5
271

history.4. It makes mephobic.
0/5
5.I feel thereality.
1/5
6. Createscriminalbehavior
0/5
7.I feel Happy. 1/58. I feelromantic.
0/5
9.Any otherfeeling
0/5
Explanation: The above data shows that 100% feel aware, 20%feel reality and 20% feel happy. Result: There is full percentage of housewives who feel awarefrom the programs related to crime/thriller.
2. Housewives who prefer to watch programs as second choicefor a particular category on Sony:
Drama 0/20Historical 2/20Horror 0/20Reality 2/20Crime/Thriller 1/20Not interested in Sonyprograms
8/20
Explanation: The above data shows that 10% prefer historicalprograms, 10% prefer reality programs and 5% prefercrime/thriller programs to watch as second choice and 40%take no interest in programs of Sony.
Result: There is equal percentage of housewives who prefer towatch historical as well as reality as second choice.
272

Feeling of Housewives who prefer to watch programs as secondchoice for a particular category on Sony:
(a) Feeling from Drama :
There is no housewife in under this category of second choiceon Sony
(b)Feeling from Historical category programs :
Your Feeling
1. It keeps meaware.
0/2
2. It entertainsme.
0/2
3. I know abouthistory.
2/2
4. It makes mephobic.
0/2
5.I feel thereality.
0/2
6. Createscriminalbehavior
0/2
7. I feel Happy. 0/28. I feelromantic.
0/2
9.Any otherfeeling
0/2
Explanation: The above data shows that 100% feel that theywant to know about the history.
Result: There is full percentage of housewives who feel thatthey want to know about history of India after watchingprograms related to history on Sony.
(c) Feeling from Horror category programs:
273

There is no housewife under this category of second choice onSony.
(d) Feeling from Reality category programs:
Your feeling:
1. It keeps meaware.
0/2
2. It entertainsme.
1/2
3. I know abouthistory.
0/2
4. It makes mephobic.
0/2
5.I feel thereality.
2/2
6. Createscriminalbehavior
0/2
7.I feel Happy. 0/28. I feelromantic.
0/2
9.Any otherfeeling
0/2
Explanation: The above data shows that 50% feel entertainmentand 100% feel reality after watching reality programs.
Result: There is full percentage of housewives who feelreality in programs related to reality on Sony.
(e) Feeling from crime/thriller category programs:
Your feeling:
1. It keeps meaware.
1/1
274

2. It entertainsme.
0/1
3. I know abouthistory.
0/1
4. It makes mephobic.
0/1
5.I feel thereality.
0/1
6. Createscriminalbehavior
0/1
7.I feel Happy. 0/18. I feelromantic.
0/1
9.Any otherfeeling
0/1
Explanation: The above data shows that 100% feel aware.
Result: There is full percentage of housewives who feel awarefrom the programs related to crime/thriller on Sony.
(3) Housewives who prefer to watch programs as third choicefor a particular category on Sony:
There is no housewife who watches programs as third choice fora particular category on Sony.
Interpretation: The above study shows that there arehousewives who regularly watch programs related to crimebecause they think that it is only the medium to aware themfrom dangerous incidents so it is the positive impact ofprograms on the attitude of housewives that they want to awarethemselves so that no incident occur with them in future. Onthe other hand there are some housewives who watch programs onhistory from which they upgrade their knowledge of history ofIndia and get attracted towards content of these categories ofprograms. So, we can say that programs of Sony are awaking thehousewives so that they can avoid any bad incident.
275

Q.6.Which category of programme/programs of Colors do youwatch mostly and what do you feel?
Ans:- …………………………………………………………………………………………………….
1. Drama 2. Comedy 3. Reality
Your Feeling
1. It keeps meaware.2. It entertainsme.3. I know abouthistory.4. It makes mephobic.5.I feel thereality.6. Createscriminal behavior7.I feel Happy.8. I feelromantic.9.Any otherfeeling
Ans. The aim of this question is to find out that whichcategory of programs liked by the housewives on Colors andwhat they feel after watching these programs which willclarify the effect of programs on the attitude of housewives.
1. Housewives who prefer to watch programs as first choice fora particular category on Colors:
Drama 10/20Comedy 1/20Reality 3/20Not interested in Colors 5/20
276

programs
Explanation: The above data shows that 50% housewives preferdrama,5% prefer comedy,15% prefer reality to watch as firstchoice and 25% housewives do not take interest in the programsof Sony.
Result: There is more percentage of housewives who watch dramaas first choice on Colors.
Feelings of housewives who prefer to watch programs as first choice for a particular category on Colors:
(a) Feeling from Drama:
Your feeling
1. It keeps meaware.
3/20
2. It entertainsme.
7/20
3. I know abouthistory.
0/20
4. It makes mephobic.
0/20
5.I feel thereality.
0/20
6. Createscriminal behavior
0/20
7.I feel Happy. 0/208. I feelromantic.
0/20
9.Any otherfeeling
Get emotional,1/20
Explanation: The above data shows that 15% housewives feelaware, 35% feel entertainment and 5% feel emotional.
Result: There is more percentage of housewives who feelentertainment in watching drama of Colors.
277

(b) Feeling from Comedy:
Your feeling
1. It keeps meaware.
0/1
2. It entertainsme.
1/1
3. I know abouthistory.
0/1
4. It makes mephobic.
0/1
5.I feel thereality.
0/1
6. Createscriminal behavior
0/1
7.I feel Happy. 0/18. I feelromantic.
0/1
9.Any otherfeeling
0/1
Explanation: The above data shows that 100% housewives feelentertainment who watches Comedy on Colors.
Result: There is full percentage of housewives who feelentertainment in watching Comedy on Colors.
(c) Feeling from Reality:
Your feeling
1. It keeps meaware.
0/3
2. It entertainsme.
1/3
3. I know abouthistory.
0/3
4. It makes mephobic.
0/3
5.I feel thereality.
2/3
278

6. Createscriminal behavior
0/3
7.I feel Happy. 0/38. I feelromantic.
0/3
9.Any otherfeeling
0/3
Explanation: The above data shows that 33.33% feelentertainment and 66.66% feel reality in watching realityprograms on Colors.
Result: There is more percentage of lecturers who feel realityin watching programs related to reality. 2. Housewives who prefer to watch programs as second choicefor a particular category on Colors:
Drama 0/20Comedy 1/20Reality 3/20Not interested in Colorsprograms
5/20
Explanation: The above data shows that 5% housewives watchcomedy and 15% housewives watch reality as second choice onColors.
Result: There is more percentage of housewives who watchreality on Colors.
Feeling of housewives who prefer to watch programs as secondchoice for a particular category on Colors:
(a)Feeling from Drama
There is no housewife who watches drama under the category ofsecond choice.
(b)Feeling from Comedy
279

Your Feeling:
1. It keeps meaware.
0/1
2. It entertainsme.
1/1
3. I know abouthistory.
0/1
4. It makes mephobic.
0/1
5.I feel thereality.
0/1
6. Createscriminal behavior
0/1
7.I feel Happy. 0/18. I feelromantic.
0/1
9.Any otherfeeling
0/1
Explanation: The above data shows that 100% housewives feelentertainment in watching programs related to Comedy
Result: There is full percentage of housewives who feelentertainment in watching Comedy programs on Colors.
(c)Feeling from Reality
Your Feeling
1. It keeps meaware.
0/3
2. It entertainsme.
1/3
3. I know abouthistory.
0/3
4. It makes mephobic.
0/3
5.I feel thereality.
2/3
6. Creates 0/3
280
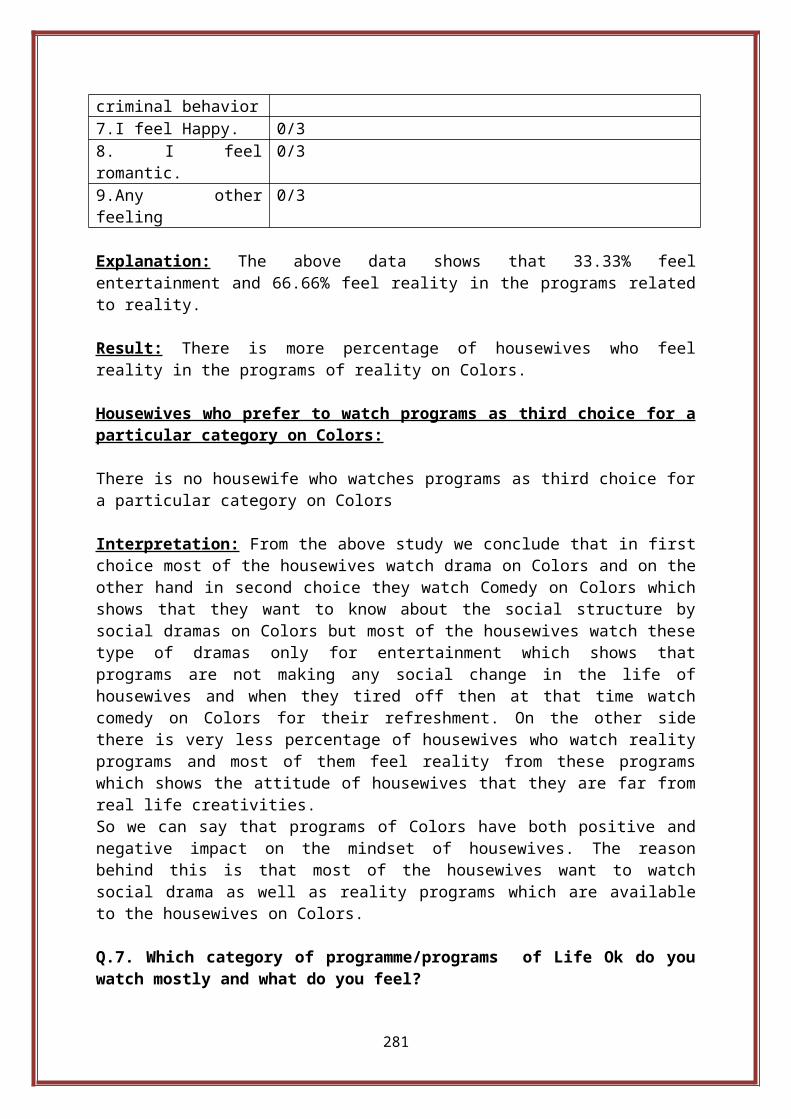
criminal behavior7.I feel Happy. 0/38. I feelromantic.
0/3
9.Any otherfeeling
0/3
Explanation: The above data shows that 33.33% feelentertainment and 66.66% feel reality in the programs relatedto reality.
Result: There is more percentage of housewives who feelreality in the programs of reality on Colors.
Housewives who prefer to watch programs as third choice for aparticular category on Colors:
There is no housewife who watches programs as third choice fora particular category on Colors
Interpretation: From the above study we conclude that in firstchoice most of the housewives watch drama on Colors and on theother hand in second choice they watch Comedy on Colors whichshows that they want to know about the social structure bysocial dramas on Colors but most of the housewives watch thesetype of dramas only for entertainment which shows thatprograms are not making any social change in the life ofhousewives and when they tired off then at that time watchcomedy on Colors for their refreshment. On the other sidethere is very less percentage of housewives who watch realityprograms and most of them feel reality from these programswhich shows the attitude of housewives that they are far fromreal life creativities.So we can say that programs of Colors have both positive andnegative impact on the mindset of housewives. The reasonbehind this is that most of the housewives want to watchsocial drama as well as reality programs which are availableto the housewives on Colors.
Q.7. Which category of programme/programs of Life Ok do youwatch mostly and what do you feel?
281

Ans:- ………………………………………………………………………………………………………
1. Drama 2.Mythogical 3.Fantasy 4.Crime
Your Feeling
1. It keeps meaware.2. It entertainsme.3. I know abouthistory.4. It makes mephobic.5.I feel thereality.6. Createscriminal behavior7.I feel Happy.8. I feelromantic.9.Any otherfeeling
Ans. The aim of this question is to find out that whichcategory of programs liked by the housewives on Life OK andwhat they feel after watching these programs which willclarify the impact of programs on the attitude of housewives.
1.Housewives who prefer to watch programs as first choice fora particular category on Life OK:
Drama 4/20Mythological 1/20Fantasy 0/20Crime 3/20Not interested in Life OK 12/20
282

Explanation: The above data shows that 20% housewives watchdrama, 5% watch mythology, 15% watch Crime and 60% are notinterested in Life OK.
Result: There are some housewives who watch mythology on LifeOK.
Feelings of housewives who prefer to watch programs as firstchoice for a particular category on Life OK:
From drama category:
Your feeling
1. It keeps meaware.
0/4
2. It entertainsme.
4/4
3. I know abouthistory.
0/4
4. It makes mephobic.
0/4
5.I feel thereality.
1/4
6. Createscriminal behavior
0/4
7.I feel Happy. 0/48. I feelromantic.
0/4
9.Any otherfeeling
Honesty wins, 1/4
Explanation: The above data shows that 100% feelentertainment, 25% feel reality and 25% feel other feeling ofhonesty.
Result: There is equal percentage of housewives who feelhonesty and reality.
From mythological category:
Your feeling
283

1. It keeps meaware.
0/1
2. It entertainsme.
0/1
3. I know abouthistory.
1/1
4. It makes mephobic.
0/1
5.I feel thereality.
0/1
6. Createscriminal behavior
0/1
7.I feel Happy. 0/18. I feelromantic.
0/1
9.Any otherfeeling
0/1
Explanation: The above data shows that 100% housewives feelthat they want to know old myths.
Result: There is full percentage of housewives who feel thatit give them knowledge of stories God.
Feeling from fantasy:
Your feeling
There is no housewife who watches fantasy on Life OK.
Feeling from Crime:
Your Feeling
1. It keeps meaware.
3/3
2. It entertainsme.
0/3
284

3. I know abouthistory.
0/3
4. It makes mephobic.
2/3
5.I feel thereality.
0/3
6. Createscriminal behavior
0/3
7.I feel Happy. 0/38. I feelromantic.
0/3
9.Any otherfeeling
0/3
Explanation: The above data shows that 100% feel aware and66.66% feel phobic.
Result: There is more percentage of housewives who feel awarefrom the programs of Crime on Life OK.
Interpretation: The above study shows that there are morepercentage of housewives who do not take interest in theprograms of Life OK which means that programs of Life OK haveno story as a result most of the housewives do not attractedtowards the programs of Life OK but there are some percentagesof housewives who watch drama and feel other feeling regardinghonesty and on the other hand there are some percentage ofhousewives who watch programs related to crime on Life OK andfeel aware which is the positive impact of the programs onhousewives who watch these categories of programs on Like OK.
Q.8. Which category of programme/programs do you watch onDiscovery and what do you feel?
1. Medical Science 2.New technologies 3.Environment4.Culture 5.Health 6.Foods 7.Historical 8.Adventurous
Your Feeling
285
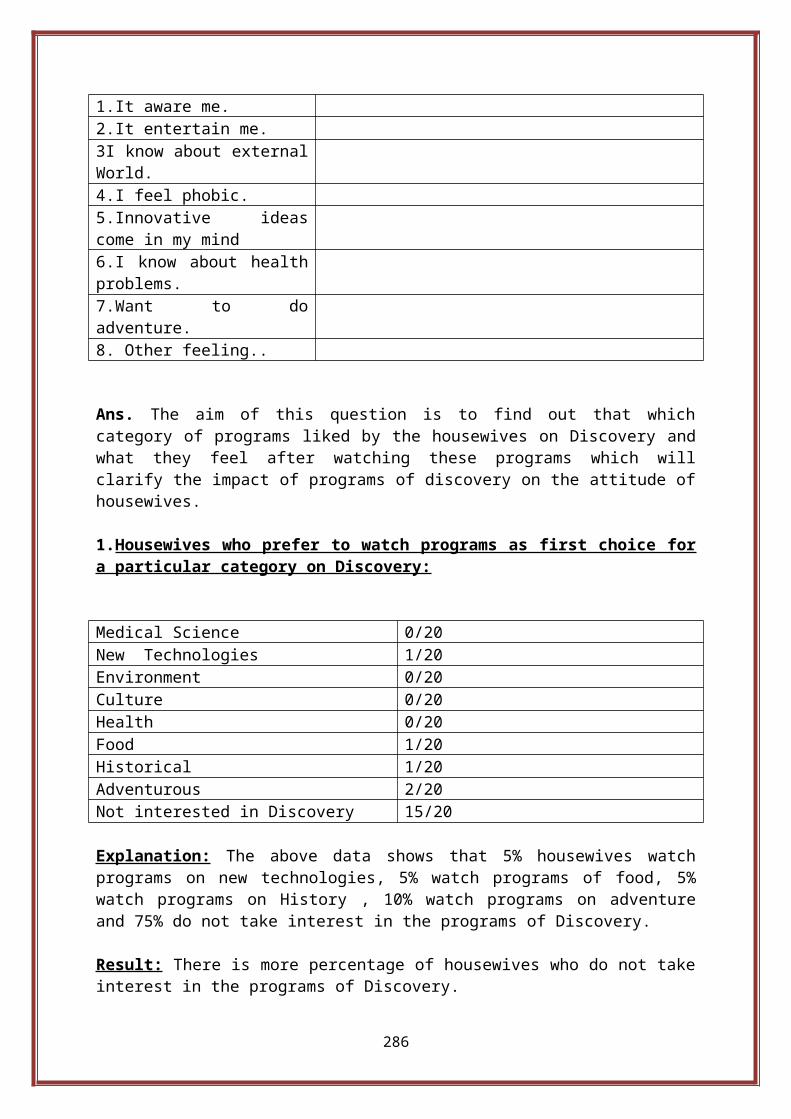
1.It aware me.2.It entertain me.3I know about externalWorld.4.I feel phobic.5.Innovative ideascome in my mind6.I know about healthproblems.7.Want to doadventure.8. Other feeling..
Ans. The aim of this question is to find out that whichcategory of programs liked by the housewives on Discovery andwhat they feel after watching these programs which willclarify the impact of programs of discovery on the attitude ofhousewives.
1.Housewives who prefer to watch programs as first choice fora particular category on Discovery:
Medical Science 0/20New Technologies 1/20Environment 0/20Culture 0/20Health 0/20Food 1/20Historical 1/20Adventurous 2/20Not interested in Discovery 15/20
Explanation: The above data shows that 5% housewives watchprograms on new technologies, 5% watch programs of food, 5%watch programs on History , 10% watch programs on adventureand 75% do not take interest in the programs of Discovery.
Result: There is more percentage of housewives who do not takeinterest in the programs of Discovery.
286

Feeling of Housewives who prefer to watch programs as firstchoice for a particular category on Discovery:
1.Feeling from Medical Science category programs:
There are no housewives who watch programs related to MedicalScience .
2.Feeling from New Technologies category programs: 1. It aware me. 0/12.It entertain me. 0/13.I know aboutexternal World.
1/1
4.I feel phobic. 0/15.Innovative ideascome in my mind
0/1
6.I know about healthproblems.
0/1
7.Want to doadventure.
0/1
8. Other feeling. 0/1
Explanation: The above data shows that those housewives watchprograms on new technologies, in which 100% feel that fromthese programs they come to know about the external World.
Result: There is full percentage of housewives who feel thatthey come to know about the external World technologies.
3.Feeling from Environment category programs:
There are no housewives who watch programs related toEnvironment.
4.Feeling from Cultural category programs:
There are no housewives who watch programs related to Culture.
287

5.Feeling from Health category programs:
There are no housewives who watch programs related to Health.
6.Feeling from food category programs :
1. It keeps meaware.
0/1
2. It entertainsme.
0/1
3. I know abouthistory.
0/1
4. It makes mephobic.
0/1
5. I feel thereality.
0/1
6. Createscriminal behavior
0/1
7. I feel Happy. 0/18. I feelromantic.
0/1
9.Any otherfeeling
Making of food items
Explanation: There are 5% housewives who watch programsrelated to food.
Result: There are some housewives who watch programs onmaking of food items.
7. Feeling from Historical Category programs:
1.It aware me. 0/12.It entertains me. 0/13.I know aboutexternal World.
1/1
4.I feel phobic. 0/15.Innovative ideas 0/1
288

come in my mind6.I know about healthproblems.
0/1
7.Want to doadventure.
0/1
8. Other feeling.. 0/1
Explanation: The above data shows that those housewives whowatch programs related to history, in which 100% housewivesfeel that they know about the history of outside country.
Result: There is full percentage of housewives who feel thatthey come to know about the history of external World.
8.Feeling from Adventurous category programs:
1. It aware me. 0/22. It entertains me. 0/23. I know aboutexternal World.
1/2
4. I feel phobic. 0/25.Innovative ideascome in my mind
1/2
6. I know about healthproblems.
0/2
7. Want to doadventure.
2/2
8. Other feeling. 0/2
Explanation: The above data shows that 5% housewives feel thatthey know about the external World, 5% feel that innovativeideas come in their mind and 10% want to do adventure.
Result: There is more percentage of housewives who want to doadventures after watching these programs.
Interpretation: The above study shows that there is mostly thepercentage of housewives who watch programs on newtechnologies, history and on adventures but the most
289
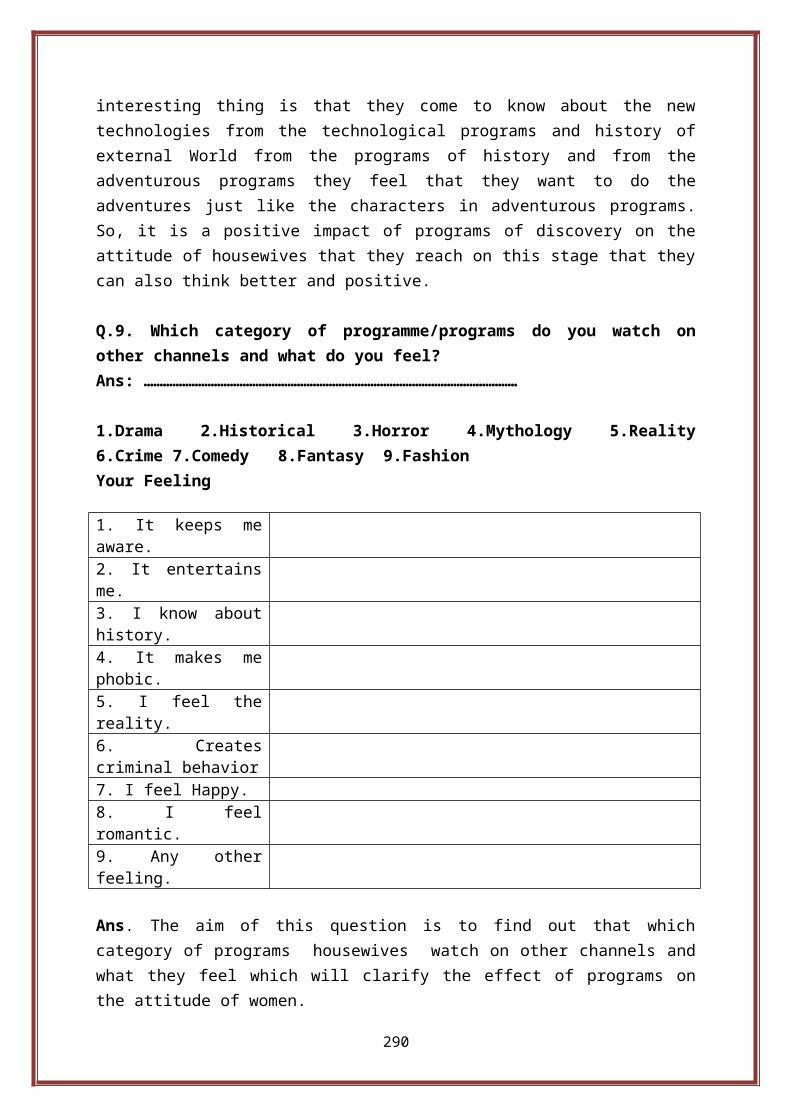
interesting thing is that they come to know about the newtechnologies from the technological programs and history ofexternal World from the programs of history and from theadventurous programs they feel that they want to do theadventures just like the characters in adventurous programs.So, it is a positive impact of programs of discovery on theattitude of housewives that they reach on this stage that theycan also think better and positive.
Q.9. Which category of programme/programs do you watch onother channels and what do you feel?Ans: ………………………………………………………………………………………………………
1.Drama 2.Historical 3.Horror 4.Mythology 5.Reality6.Crime 7.Comedy 8.Fantasy 9.FashionYour Feeling
1. It keeps meaware.2. It entertainsme.3. I know abouthistory.4. It makes mephobic.5. I feel thereality.6. Createscriminal behavior7. I feel Happy.8. I feelromantic.9. Any otherfeeling.
Ans. The aim of this question is to find out that whichcategory of programs housewives watch on other channels andwhat they feel which will clarify the effect of programs onthe attitude of women.
290

1.Housewives who prefer to watch programs as first choice fora particular category on other channels:
Drama 12/20 ( Star Plus)Historical 0/20Horror 0/20Mythology 3/20 (Star Plus)Reality 0/20Crime 0/20Comedy 1/20 (SAB)Fantasy 0/20Fashion 0/20News programs 3/20 ( Aaj Tak and India TV)Not interested in otherchannels
1/20
Explanation: The above data shows that 60% watch drama, 15%watch mythological programs, 5% watch comedy and 15% watchnews programs.
Result: There are most of the housewives who watch drama onother channels.
Feeling of Housewives who prefer to watch programs as firstchoice for a particular category on other channels:
Feeling from Drama:
Your Feeling
1. It keeps meaware.
4/12
2. It entertainsme.
11/12
3. I know abouthistory.
0/12
4. It makes mephobic.
0/12
5.I feel thereality.
0/12
6. Creates 0/12291

criminal behavior7.I feel Happy. 0/128. I feelromantic.
0/12
9.Any otherfeeling
0/12
Explanation: The above data shows that 33.33% feel aware,91.66% feel entertainment.
Result: There is more percentage of housewives who feelentertainment in watching drama.
Feeling from Mythology:
Your feeling
1. It keeps meaware.
0/3
2. It entertainsme.
0/3
3. I know abouthistory.
2/3
4. It makes mephobic.
0/3
5.I feel thereality.
0/3
6. Createscriminal behavior
0/3
7.I feel Happy. 1/38. I feelromantic.
0/3
9.Any otherfeeling
Know about costumes, 1/3
Explanation: The above data shows that 66.66% housewives feelthat they want to know about the history behind any myth and33.33% feel happy.
292

Result: There is more percentage of housewives who want toknow about history behind any myth.
Feeling from Comedy:
Your feeling
1. It keeps meaware.
0/1
2. It entertainsme.
0/1
3. I know abouthistory.
0/1
4. It makes mephobic.
0/1
5.I feel thereality.
0/1
6. Createscriminal behavior
0/1
7.I feel Happy. 1/18. I feelromantic.
0/1
9.Any otherfeeling
0/1
Explanation: The above data shows that 100% housewives feelhappy who watch comedy programs.
Result: There is full percentage of housewives who feel happywho watch comedy programs and come in the category of firstchoice.
Feeling from News Programs:
Your Feeling
1. It keeps meaware.
2/2
2. It entertains 0/2
293

me.3. I know abouthistory.
0/2
4. It makes mephobic.
0/2
5.I feel thereality.
0/2
6. Createscriminal behavior
0/2
7.I feel Happy. 0/28. I feelromantic.
0/2
9.Any otherfeeling
0/2
Explanation: The above data shows that 100% housewives feelaware who watch news programs.
Result: There is full percentage of housewives who feel awarewho watch news programs and come in the category of firstchoice.
Interpretation: The above study shows that there are morehousewives who watch drama on other channels and some of themfeel aware but most of the housewives watch these only forentertainment which shows the negative effects attitude ofhousewives that they do not acquire any positive thing fromthe drama. There are some other housewives who watchmythological programs on other channel and want to know abouthistory behind any myth it shows the positive attitude ofhousewives and most interesting thing is that some watch newsprograms and feel that they news programs aware them from anyincident which can be occur in future. So it shows thepositive impact of the programs which are telecasted on otherchannels on the attitude of the programs.
Q.10. Which type of programs do you like most?
294

1. Related to women 2. Related to children 3. Relatedto fashion 4. Related to food Habits
Ans. The aim of this question is to find out the programhabits of housewives which clarify the attitude of housewiveson the types of programs.Housewives who like one type of programs:
Related to Women 11/20Related to Children 2/20Related to Fashion 0/20Related to food Habits 2/20
Explanation: The above data shows that 55% housewives likeprograms related to women, 5% like programs related toChildren and 10% like programs related to food habits.
Result: There is more percentage of housewives who likeprograms related to women.
Housewives who like two type of programs:
Related to children + Relatedto food habits
1/20
Related to women + Related tofood habits
1/20
Explanation: The above data shows that 5% housewives likeprograms related to children as well as food habits, 5% likeprograms related to women as well as food habits.
Result: There is equal percentage of two types of programs butprograms related to food habits is common in both which are liked by the housewives.
Housewives who like three types of programs:
Related to women + Related to 1/20295

fashion + Related to foodhabits
Explanation: The above data shows that there are 5% housewiveswho like three types of programs that is related to women,fashion and food habits.
Result: There is very less percentage of housewives who likethree types of programs.
Housewives who like four types of programs:
There are no working women who like four types of programs.
Interpretation: The study shows that there is more percentageof housewives who like programs related to women. So, it tellsthe positive effect of programs on the attitude of housewivesthat they are more eager to like programs related to women tofind out the place of women position in the society.
Q.11. Which type of characters do you like most?
1. Investigative 2.Realistic 3. Devotional 4.Emotional5.Negative 6.Positive
Ans. The aim of this question is to find out that whichcharacters are liked by the housewives and from it we canapproach at a aim that which character effects on the attitudeof housewives.
Investigative 0/20Realistic 4/20Devotional 0/20Emotional 9/20Negative 1/20Positive 13/20
296

Explanation: The above data shows that 20% housewives likerealistic characters, 45% like emotional characters, 5% likenegative character and 65% like positive characters.
Result: There is more percentage of housewives who likepositive characters as compared to emotional characters.
Housewives who like two characters:
Emotional + Positive 6/20Realistic + Positive 1/20
Explanation: The above data shows that 30% housewives likeemotional as well as positive characters and 5% like realisticand positive characters.
Result: There is equal percentage of housewives who like twotypes of characters but positive character is common in both.
Housewives who like three characters:
There are no housewives who like three characters.
Housewives who like four characters:
There are no housewives who like four characters.
Housewives who like five characters:
There are no housewives who like four characters.
Housewives who like six characters:
There are no housewives who like six characters.
Interpretation: The study shows that there is more percentageof housewives like positive characters which show their
297

attitude that they like right characters in programs. Thisthinking is caused when housewives watch all type ofcharacters in the programs and reach at a conclusion that whattype of character suits more according to their thinking whichshows the positive impact of the programs on the thinkingattitude of housewives but on the other hand there is somepercentage of housewives who like emotional characters. Itshows the emotional attitude of housewives regarding someonewhich is also the cause of programs that characters playemotional roles in the programs because after watching thesetype of emotional characters a emotional feeling come out fromtheir heart. So we can say that programs help the housewivesto know their inner character it may be emotional, negative,positive and so on.
Q.12. Do you apply above marked character in your own life andwhat do you experience ?
1. Yes 2. No 3. To some extent
If your option is 1 or 3 than your experience: .……………………………………........................................……………………………………………………………………………………………………………….
Ans. The aim of this question is to find out that how manyhousewives apply the characters in their own life whichclarify the impact of programs in their own lives that whatthey think?Is it right or wrong to apply the marked character in theirlife which will clarify the impact of programs on the attitudeof housewives. Yes 13/20No 6/20To some extent 1/20
298

Explanation: The above data shows that 65% housewives say thatthey apply the marked character in their own life, 30% say noand 5% say to some extent.
Result: There is more percentage of housewives who apply themarked character in their own life so it shows the positiveattitude of housewives when they apply the positive things intheir life.
Experience of housewives who say yes:
Those housewives who say yes, in which 65% feel good,5% feelhonest and 5% feel emotion after applying marked character intheir own life and those housewives say,to some extent, havenothing to share.
Experience of housewives who say to some extent:
Those housewives say that they apply marked characters intheir own life have nothing to share.
Interpretation: The study shows that there is more percentageof housewives who apply the marked characters in their ownlife which shows that something is the programs which bindsthe housewives to apply the particular character in their ownlife and most of them feel good which is also a positiveimpact of programs on the attitude of housewives because mostof them apply the positive character in their life.
Q.13. Do you apply above marked characters in others life andwhat you experience?
1.Yes 2. No 3. To some extent
If your option is 1 or 3 than your experience:……........................................................................................
299
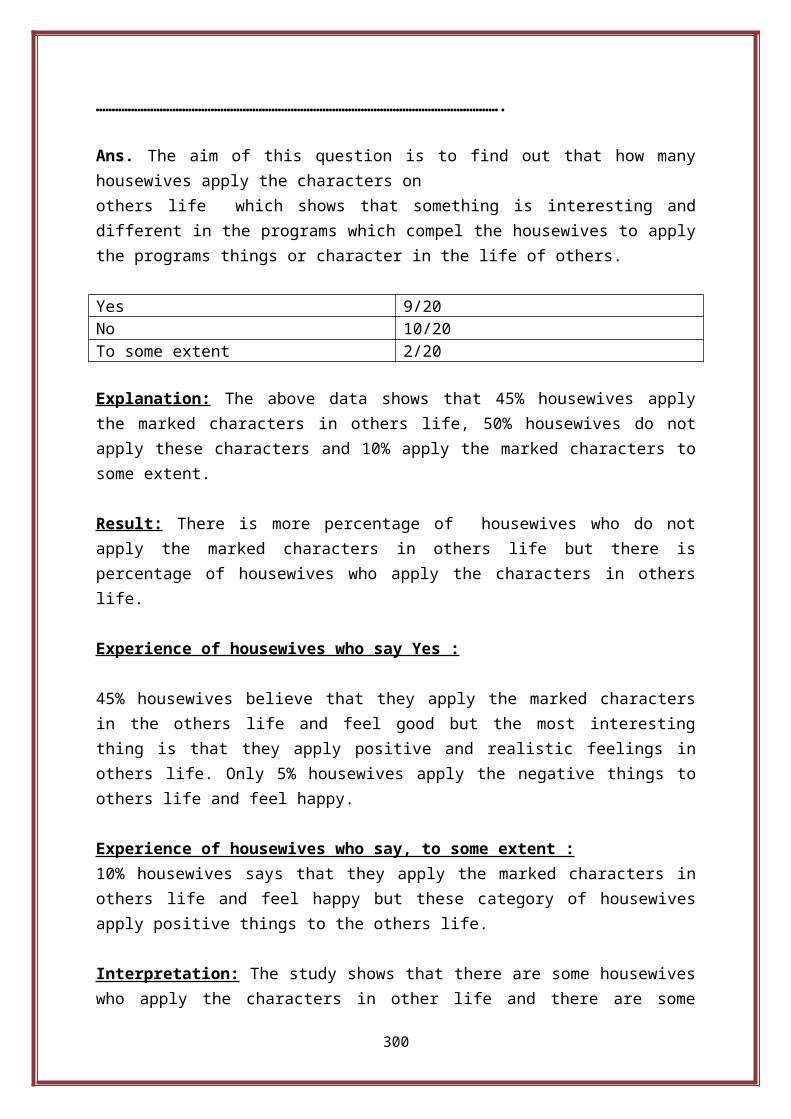
……………………………………………………………………………………………………………….
Ans. The aim of this question is to find out that how manyhousewives apply the characters on others life which shows that something is interesting anddifferent in the programs which compel the housewives to applythe programs things or character in the life of others.
Yes 9/20No 10/20To some extent 2/20
Explanation: The above data shows that 45% housewives applythe marked characters in others life, 50% housewives do notapply these characters and 10% apply the marked characters tosome extent.
Result: There is more percentage of housewives who do notapply the marked characters in others life but there ispercentage of housewives who apply the characters in otherslife.
Experience of housewives who say Yes :
45% housewives believe that they apply the marked charactersin the others life and feel good but the most interestingthing is that they apply positive and realistic feelings inothers life. Only 5% housewives apply the negative things toothers life and feel happy.
Experience of housewives who say, to some extent :10% housewives says that they apply the marked characters inothers life and feel happy but these category of housewivesapply positive things to the others life.
Interpretation: The study shows that there are some housewiveswho apply the characters in other life and there are some
300

housewives who apply the negative characters in others lifeand feel happy so it shows the negative impact of the programson the attitude of housewives but all these thinking issometimes caused by the programs because there are mostlyprograms who focus on applying the bad things by a artist onother artist.
Q.14. How much time do you spend on watching Televisionprogramme?
1. Half an Hour 2. One Hour 3. Two Hour4. More than that
Ans. The aim of this question is to find out the time ofhousewives that they spend in watching television programswhich will clarify the effect of programs on the attitude ofhousewives towards the time management in their family becausea housewife has lot of work to do in the home.
Half an Hour 0/20One Hour 6/20Two Hour 9/20More than that 4/20
Explanation: The above data shows that 30% housewives watchprograms for one hour, 45% watch for two hour and 20% watchmore than that.
Result: There is more percentage of housewives who watchprograms for two hours.
Interpretation: The study shows that there is more percentageof housewives who watch programs for two hour but there aresome housewives who watch programs more than that which showsthat something different is there in the programs whichattracts the housewives which shows the negative impact ofprograms on the attitude of some of the housewives because
301

they are addict to television programs which worsen theirhealth.
Q.15. At what time do you prefer to watch Television programs?
1. Morning 2. After Noon 3. Evening 4.Late Night
Ans. The aim of this question is to find out the time ofhousewives when they watch the programs which will clarify theimpact of programs on the attitude of housewives regardingtime slot for watching programs.
1. Morning 1/202. After Noon 1/203. Evening 14/204. Late Night 4/20
Explanation: The above data shows that 5% watch programs inmorning, 5% at afternoon,70% in evening and 20% watch latenight.
Result: There is some percentage of housewives who watchprograms at night.
Interpretation: The study shows that housewives are so eagerto know about new turn in a program for this they watch theprograms in evening time because in evening new episodes aretelecasted which shows that most of the housewives are eagerto know about the new turn in the particular programs of theirchoice which shows something negative impact of programsbecause programs are molding the housewives in particular timeslot because programs ends at that point which create asuspense in the mind of housewives as a result they watchprograms in evening but the most interesting thing is thatsome percentage of housewives watch programs at late night
302

because there are some interesting programs are telecasted atnight like reality programs and comedy shows which binds themental state of housewives as a result some of the housewiveswatch them which is purely a negative impact of programs onthe attitude of housewives that these late night programscreate a attitude to watch programs at night at any cost.
Q.16. Do you leave all other important work while watchingTelevision Programme?
1. Yes 2.No 3.To some extent
Ans: The aim of this question is to find out that how manyhousewives leave their important work while watching programswhich will clarify that how important a programme for themwhich will clarify the impact of the programs on the attitudeof housewives.
Yes 4/20No 14/20To some extent 3/20
Explanation: The above data shows that 20% housewives leavetheir important work, 70% say no and 15% sat to some extent.
Result: There is more percentage of housewives who do notleave their important work but there are some housewives wholeave the important work.
Interpretation: The study shows that there is some percentageof housewives who leave their important work and there is alsothe second category of housewives who leave their importantwork to some extent which shows that there is some percentageof housewives who have addiction of programs which is darkside of programs that these programs modify the attitude ofhousewives but most important thing is that there are morepercentage of housewives who do not leave their important
303

work. Here, we can say that there are housewives who do nothave habit of programs to such extent that they leave theirimportant work.
Q.17. Do you feel that Television programs are responsible forsocial change?
1.If yes,why? ..............................................................................................................................................……………………………………………………………………………………………………………….
2.If no,why?.................................................................................................................................................……………………………………………………………………………………………………………….
Ans . The aim of this question is to find out that how manyhousewives feel that programs bring social changes which willclarify the importance of programs to bring social change inthe eyes of housewives.
Yes 13/20No 7/20
Explanation: The above data shows that the 65% of housewivesbelieve that it brings social change and 35% do not believethis.
Result: There is more percentage of housewives who believethat programs bring social change.
Opinion of housewives who say yes:
304

1. Accept positive things.2. Learn social things.3. But no change in the mentality of people.4. Nothing to share.5. Create social behaviors. 6. Nothing to share7. People follow negative things.8. Creates more negativity in adults and children.9. Know about World society.10.
Nothing to share.
11.
Both negative and positive effects.
11.
Brings awareness.
12.
Nothing to share.
13.
Brings social changes to very less extent
For No
1. Creates misbehavior2. All is going out of way.
Interpretation: The study shows that more percentage ofhousewives believe that programs bring the social change inthe society but it is very tough task to reach any conclusionthat what type of social change brought by the programsbecause every housewife has her own opinion which is writtenin above table which shows that programs effect the mentalityof people but those say no, they have other thinking which isalso written above.
Q.18. Do you feel that something innovative should be done toimprove the quality of programs?Ans:-………………………………………………………………………………………………………………………………………………………………………………………………………………………………
305

Ans. The aim of this question is to find out that how manyhousewives want something innovative in the quality ofprograms and how many do not agree with it which will clarifythe innovation in the programs in their thinking.
Yes 13/20No 7/20
Explanation: The above data shows that there are 65%housewives who believe that they want some innovations and 35%do not prefer so.
Result: There is more percentage of housewives who believethat innovations should be done.
Opinion of the housewives who say yes:
1. Programs should be on children behavior.2. Dance type programs should be telecasted.3. Devotional and familiar programs should be there.4. Can be seen with the family should be there.5. Related to aware corruption6. Related to society should be telecasted.7. Regarding food recipes.8. Nothing to share.9. Nothing to share.10.
Programs should be on new ideas.
11.
More comedy shows should be there.
12.
Nothing to share.
13.
Nothing to share.
Interpretation: The study shows that more percentage ofhousewives believe that innovation is done to improve thequality of programs and programs should be created on new
306

ideas, So, it shows the positive effects of the programs onthe attitude of housewives so that they feel that newinnovations should be happen in the story of programs. Thisthinking is also caused by watching more and more programs ofevery category by the housewives because after watching theseprograms they reach at a conclusion that innovation isrequired to improve the quality of programs in their thinkingbecause they feel that something new should be telecasted onthe problems of society. This sociological thinking is alsocaused by the programs. So we can conclude that programs arechanging the old thinking of the housewives as a result theywant innovation in the programs.
307

COMPARATIVE ANALYSIS
308

Q.1. Do you watch programs on TV?
1. Yes 2. No
If yes, then(a) Daily (b) Alternate day (c) Sometimes(d) Most of the day
Ans.
LECTURERS TEACHERS DOCTORS WORKING WOMEN HOUSEWIVES
100% 100% 100% 100% 100%
Explanation: The above data shows that all categories of womenwatch programs which clarifies that something is there in theprograms which binds all the women to watch the programs.
TYPES OFCATEGORIESOF WOMEN
DAILY ALTERNATEDAY
SOMETIMES MOST OF THE DAY
LECTURERS 60% 10% 20% 10%TEACHERS 45% 0% 35% 20%DOCTORS 50% 10% 40% 0%WORKINGWOMEN
40% 0 35% 25%
HOUSEWIVES 65% 0% 30% 5%
Explanation: The above data shows that 65% housewives watchprograms daily which is very high percent as compared to othercategories of women which means that they are bounded by theprograms which shows that something interesting is there inthe programs which binds them which can have both positive as
309

well as negative impact on the attitude of housewives becauseprograms creates various thoughts while watching in this typeof condition some housewives think on positive side ofprograms and some think negative because new ideas take birthfrom the programs it may be investigative, realistic,emotional, positive, negative and so on.
If we talk about on alternate basis then 10% lecturers as wellas doctors prefer to watch programs on alternate days thereason behind this is that lecturers and doctors keep thembusy in other works which shows that programs have very lessimpact on them because there is no continuity in watchingepisodes of programs.
If we talk about on sometimes basis then 40% doctors watchprograms sometimes when they get free time which shows thatthey are very far away from the plots of characters in theprograms so as a result programs have very less impact onthem.
If we talk about on most of the day basis then 25% workingwomen watch programs on most of the day which means when thereis Sunday or any other holiday then they prefer to watchprograms on whole day which we can say that negative impact ofprograms on the working women which shows that they haveaddiction of programs which changes their attitude whileworking in the offices which disturbs their performance intheir particular work.
Interpretation: If we consider all categories of women as onecategory of women then there is more percentage of women watchtelevision programs daily (52%) and according to them thereis something hidden present in the stories of programs whichpull them to watch these programs which clarifies the impactof programs on attitude of women as a result they are eager towatch the programs daily because programs are produced such away that more and more women watch them by creating theinteresting turns in the programs by the directors..
310

Q.2.Which type of programs do you watch mostly?
1. Social 2.Entertainment 3.Educational 4.Awareness 5.Devotional
Ans:
Note: Here we have taken only one category of programme likedby all the categories of women.
TYPES OF CATEGORIESOF WOMEN
Soc. Ent. Edu. Awar. Devo.
LECTURERS 5% 35% 5% 0 0TEACHERS 10% 55% 5% 25% 0DOCTORS 5% 45% 0 5% 5%WORKING WOMEN 5% 10% 5% 5% 5%
HOUSEWIVES 5% 65% 10% 5% 0
Explanation: The above data shows that 10% teachers who watchsocial programs which is very less percentage but is higherthan other categories of women which shows that they want toknow about the social position of women in the Indian societywhich shows that programs have more impact on the attitude ofteachers because in various categories of programs they wantto watch programs on social changes which shows that programsrelated to social behavior creates a social mindset ofteachers and they feel a social change in them.
If we talk about the entertainment programs then 65%housewives watch entertainment programs which is very high ascompared to other categories of women and some of them feelthat they watch programs only for entertainment. So, we canconclude that there is some negative impact of programs onhousewives because they wait to watch programs only for theirentertainment but it is not fully true because some of thehousewives watch programs related to awareness as well aseducational programs.
311

If we talk about the educational programs than an importantthing come out from the research that there is more percentage(5%) of housewives who watch educational programs as comparedto other categories of women which shows the positive impactof programs on the attitude of housewives because they want toknow about the various educational policies of government forthe children as well as new educational institutions fortheir children education.
If we talk about the awareness programs than there is equalpercentage of doctors, working women as well as housewives(5%) who prefer to watch programs related to awareness butthere is more percentage of teachers (25%) who watch theseprograms which shows the more positive impact of programs onthe attitude of teachers as compared to doctors as well asworking women as teachers want to know about the problemswhich occur on working places with the women so they want toknow about the laws regarding punishment of person who doeswrong with the women in the working places it may be anemployee or may be a Boss.
Interpretation: If we consider all categories of women as onecategory of women then most of the women watch programsrelated to entertainment (42%) which takes place between theprograms which shows that programs have very less impact ofawareness in the mindset of women which shapes the womenattitude in negative manner because they do not earn somethinggood from the programs which can be helpful in badcircumstances in their life so that they can take a positivestep in that particular problem because there are variousprograms on awareness, education, health which update thewomen thinking process.
Q.3. Which channel programs do you like most?
1. Zee TV 2. Sony 3. Colors 4. Life Ok5.Discovery 6.Others
312

Ans:
Note : Here we have taken only percentage of one channel whois liked by all the categories of women.
TYPES OFCATEGORIES OFWOMEN
Zee TV Sony Colors
Life OK Discovery
Others
LECTURERS 0 0 30% 0 20% 5%TEACHERS 10% 10% 40% 0 0 15%DOCTORS 0 5% 20% 5% 0 25%WORKING WOMEN 25% 10% 15% 0 0 5%
HOUSEWIVES 15% 0 25% 0 0 0
Explanation: The above data shows that there is morepercentage of working women (25%) who like Zee TV which showsthat there is something different the programs of Zee TV whichattracts most of the working women which shows that somethingis positive in the programs of Zee TV which binds the workingwomen.
If we talk about the programs of Sony then there is equalpercentage of teachers and working women (10%) who likeprograms of Sony which shows that programs of Sony has someimpact on the teachers as well as working women becausehistorical category of programs on Sony upgrade theirknowledge and programs related to crime/thriller aware theteachers and doctors from various exploitations and crimes onwomen in Indian society and their solutions to overcome fromany diverse circumstances which can be happened in their lifewhich shows the positive impact of programs on the attitude ofteachers as well as doctors because they come to know aboutthe real face of the Indian society.
If we talk about the Colors then there is more percentage ofteachers (40%) who like programs on Colors because accordingto them Colors is famous for the social programs which attracttheir mind to watch programs on Colors and earn something
313

positive for the upliftment of the women role in the Indiansociety which shows the positive impact of the programs ofColors on the teachers that they come to know about the socialcondition of women in India.
If we talk about the programs of Life Ok then there is onlyone category of women who like programs of Life OK which areteachers (5%) who prefer to watch programs related to crimewhich aware them from upcoming bad circumstances which showsthe positive impact of programs of Life Ok on the attitude ofteachers because they aware them from the incidents which takeplace on working places where they teach which can be done byany employee or higher authority because on Life OK variousepisodes on this issue has been telecasted.
If we talk about the programs of Discovery than it is likedby the lecturers (20%) which shows the positive impact onthe lectures because on Discovery various programs aretelecasted on various issues which increase their knowledgelevel.
Interpretation: If we consider all categories of women as onecategory of women then it is concluded that Colors (26%) isthe channel which is liked by the most of the women because intheir thinking, it telecasts programs on real problems offamily as well as society, from which they learn how to be asocial person in society and what is the position of women inthe society?
Note 1 : I have divided the data on the basis of choices ofwomen marked by the women from Q.4 to Q.6 For example:
314

1.First Choice
2.Second Choice
3.Third ChoiceBut I have taken only first choice of women under the study.
and for Q.7 to Q.9 I shall take only the first choice of womenFor example:1. First Choice Only
So, I shall do my study on choice basis from Q.4 to Q.9.
Note 2 : From Q.No.4 to Q.No.11, I have not taken thepercentage of women, while writing the explanation as well asinterpretation who do not take interest in the programs ofparticular channel under my study but I have written theirpercentage in the tables and I shall consider this percentagewhen I shall right the conclusions in Chapter No. 9.
315

Q.4. Which category of programme/programs of Zee TV do youwatch mostly and what do you feel?
Ans:- ………………………………………………………………………………………………………
1. Drama 2.Historical 3.Horror 4. Mythology 5.Reality
Ans :
Note: Here we have taken only first choice of women of all thecategories.
TYPES OFCATEGORIESOF WOMEN
Drama Historical
Horror Mythology
Reality
Notinterested inZee TV
LECTURERS 5% 45% 0 0 5% 40%TEACHERS 35% 10% 0 0 0 60%DOCTORS 5% 10% 5% 0 5% 60%WORKINGWOMEN
30% 25% 10% 0 10% 20%
HOUSEWIVES 20% 45% 0 0 10% 25%
Explanation: The above data shows that there is morepercentage of teachers (35%) who watch drama as a first choiceon Zee TV which shows that there is something which increasesthe eagerness in teachers to watch drama on Zee TV becausethey feel that programs of Zee TV aware them from theproblems which come in the life so that they can solve theseproblems easily if it comes in their life which shows thatprograms of Zee TV has positive impact on the attitude ofteachers.
If we talk about the historical programs then there is equalpercentage of lecturers as well as housewives (45%) who preferto watch historical programs as a first choice on Zee TVbecause they want to know about the history of India and for
316

this historical programs are the best medium which shows thepositive impact on the attitude of lecturers as well ashousewives which creates a thinking to know about the history.
If we talk about the horror category then there is morepercentage of working women (10%) who prefer to watch horrorprograms as first choice on Zee TV because they want to knowthat there is existence of spirits or not. Secondly theseprograms aware them from the places where generally thesetypes of incidents occur which shows that these programs haspositive impact on the attitude of working women as a resultthey remain aware from such types of incidents which createsworse problems in future life.
If we talk about the reality programs then there is equalpercentage of lecturers as well as doctors (5%) and workingwomen as well as housewives (10%) who prefer to watch realityprograms as a first choice on Zee TV but most of them feelhappy as well as entertainment in reality programs which wecan say that is not a positive impact on both of them becausethey do not feel any reality in these programs which issomehow a normal effect on the attitude of both.
Interpretation: If we consider all categories of women asone category of women then there is more percentage of womenwho watch historical programs (27%) as their first choicebecause most of the women want to know about the history ofIndia and some of the women feel romance from these programswhich shows that programs of Zee TV have positive impact incase of providing knowledge of Indian history but on the otherside creates a hypothetical feeling of romance which plays acontradictory role in the thinking of some of the womenbecause they watch these programs to fell romance which we cansay a day dreaming impact.
Q. 5. Which category of programme/programs of Sony do youwatch mostly and what do you feel ?
317

Ans:- ………………………………………………………………………………………………………
1. Drama 2.Historical 3.Horror 4.Reality5.Crime/Thriller
Ans :
Note: Here we have taken only first choice of women of all thecategories.
TYPES OFCATEGORIESOF WOMEN
Drama Historical
Horror
Reality
Crime/Thriller
Notinterested inSony
LECTURERS 5% 10% 0 5% 15% 65%TEACHERS 5% 0 0 0 40% 55%DOCTORS 5% 10% 0 5% 25% 55%WORKINGWOMEN
0 10% 5% 0 40% 40%
HOUSEWIVES 25% 10% 0 0 25% 40%
Explanation: The above data shows that there is morepercentage of housewives (25%) who watch drama on Sony as afirst choice and feel that the drama of Sony make them awareand give them the teaching of honesty regarding their partnerand tell the importance of education in this world whichclarifies the positive impact of drama on the attitude ofhousewives that these drama creates a feeling of faith ,honesty and tell the importance of education.
If we talk about the historical programs on Sony then there isequal percentage of lecturers, doctors, working women andhousewives (10%) who prefer to watch historical programs as afirst choice on Sony because they feel that it updates theirknowledge on history of India and they feel the reality inthese programs which binds them from these programs whichshows the positive impact of historical programs on theattitude of all the selected categories as these types of
318

programs creates a eagerness in the mindset of women to knowabout the reality of old histories.
If we talk about the horror programs on Sony then there isvery less percentage of working women (5%) who watch horrorprograms as a first choice because they feel that theseprograms tell them the reality of spirits and souls which isthe positive impact of these programs on the attitude of womenthat these types of programs aware them as well as tell themthe existence of spirits as a result they can avoid thoseplaces where these types of incidents have been occurred inthe country. It may be their nearby place in their city sothese types of problems can be avoided in future.
If we talk about the reality programs then there is equalpercentage of lecturers as well as doctors (5%) who prefer towatch reality programs as a first choice on Sony because theyfeel entertainment as well as feel happy which we can say thatsome normal impact of reality programs on the attitude ofLecturers as well as doctors because they are not able to findthe hard work behind doing any real thing in front of them.
If we talk about the programs related to crime/thriller thenthere is equal of teachers as well as working women (40%) whoprefer to watch these programs as a first choice on Sonybecause most of them feel aware as well as reality in theseprograms and want to know about the various crimes which aregenerally caused in working places of teachers as well as inoffices but most strange thing is that some of the workingwomen feel the feeling of criminal behavior in them which is adangerous fact in this study.
Interpretation: If we consider all categories of women asone category of women then there is more percentage of womenwho watch programs related to crime/thriller (29%) on Sony astheir first choice because most of them feel aware and realityin these programs which aware them from upcoming incidents intheir life and give them the solutions of any misbehaviorwhich is done by any person so it shows the positive impact of
319

programs of Sony on the attitude of women as a result they canthink for their safe future in any place and area but there issome women who feel a feeling of criminal behavior in themwhich is a alarming fact in this study.
Q.6. Which category of programme/programs of Colors do youwatch mostly and what do you feel?
Ans:- …………………………………………………………………………………………………….
1. Drama 2. Comedy 3. Reality
Ans:
Note: Here we have taken only first choice of women of all thecategories.
TYPES OFCATEGORIES OFWOMEN
Drama Comedy Reality Notinterestedin Colors
LECTURERS 30% 30% 10% 30%TEACHERS 35% 30% 10% 25%DOCTORS 35% 15% 5% 45%WORKING WOMEN 35% 15% 35% 15%
HOUSEWIVES 50% 5% 15% 25%
Explanation: The above data shows that there is equalpercentage of teachers, doctors and working women (35%) whoprefer to watch dramas as a first choice on Colors becausemost of them feel aware with entertainment and feel a fellingof social change which shows a positive impact on theattitude of women because they feel that it brings a socialchange in the society.
If we talk about comedy programs then there is equalpercentage of lecturers as well as teachers (30%) and doctorsas well as working women (15%)who prefer to watch realityprograms on Colors because most of them feel entertainment andhappy which shows the positive impact of comedy programs onthe selected categories of women as a result when they gettired then they opt for the comedy programs on Colors as a
320

first choice which keep them refresh and keep away tensionsfrom them as e result they feel more healthy.
If we talk about the reality programs then there is equalpercentage of lecturers as well as teachers (10%) and workingwomen (35%) who prefer to watch reality programs and feel thereality in these programs which creates a attitude of thinkingfrom different angle that how a human being can do all thesedangerous acts on stage specially there are some acts whichare done by the women in the reality shows.
Interpretation: If we consider all categories of women as onecategory of women then above study shows that there is morepercentage of women who watch drama(37%) as well as realityshows (15%) as first choice on Colors because they feelentertainment as well as other feeling of social change in thesociety and on the other hand feel the reality of human naturein the reality programs which shows the positive impact ofprograms on the attitude of women as a result they can thinkbetter and positive.
Q.7. Which category of programme/programs of Life Ok do youwatch mostly and what do you feel?
Ans:- ………………………………………………………………………………………………………
1. Drama 2. Mythological 3.Fantasy4.Crime
Ans:
Note: Here we have taken only first choice of women of all thecategories.
TYPES OFCATEGORIES OFWOMEN
Drama Mythological
Fantasy Crime Notinterested inLife OK
LECTURERS 5% 20% 0 5% 70%TEACHERS 0 0 0 50% 50%DOCTORS 0 15% 0 0 85%
321

WORKING WOMEN 20% 5% 0 5% 70%
HOUSEWIVES 20% 5% 0 15% 60%
Explanation: The above data shows that there is equalpercentage of working women as well as housewives (20%) whoprefer to watch drama as a first choice on Life OK becausemost of the working women feel entertainment, romance andcreates feeling of criminal behavior which is a negativeimpact of drama on the attitude of working women as e resultthey can bring a wrong step in their life to make their lifeeasy from any problem and on the other hand housewives feelthe entertainment, reality as well as other feeling of honestywhich is a positive impact of programs on the attitude ofhousewives that they are able to think different from theirregular thoughts. If we talk about the mythological programs then there is morepercentage of lecturers (20%) who prefer to watch theseprograms as a first choice on Life OK because they feelreality as well as come to know about the history behind themyth and feel other feeling of spiritual enhancement as well adevotion from these programs which shows the positive impactof these programs on the attitude of lecturers that they canfeel the presence of divine and know about Indian myths.
If we talk about the programs related to crime then there ismore percentage of teachers (50%) who prefer to watch theseprograms as a first choice on Life OK because most of theteachers feel aware from these programs and can save them inworking places as well as outside their work place. Interpretation: If we consider all categories of women as onecategory of women then most of the women prefer to watchprograms related to crime (15%) on Life OK which make themaware from the criminal minds of people so that they remainalert from these types of persons to avoid any type ofmisbehavior which shows the positive impact of these programson the attitude of women because they can judge any personwhether he/she is right or wrong.
Q.8. Which category of programme/programs do you watch onDiscovery and what do you feel?
322

1. Medical Science 2.New technologies 3.Environment4.Culture 5.Health 6.Foods 7.Historical8. Adventurous
Ans:
Note: Here we have taken only first choice of women of all thecategories.
TYPES OFCATEGORIES OFWOMEN
1 2 3 4 5 6 7 8 NotInterested inDiscovery
LECTURERS 10% 30% 20% 5% 0 0 0 0 35%TEACHERS 5% 0 0 5% 5% 0 5% 10% 70%DOCTORS 30% 0 0 0 0 0 0 25% 45%WORKING WOMEN 0 10% 5% 0 0 0 0 45% 40%
HOUSEWIVES 0 5% 0 0 0 5% 5% 10% 75%
Explanation: The above data shows that there is morepercentage of doctors (30%) who prefer to watch programsrelated to medical sciences which shows that in all categoriesonly doctors are eager to watch medical sciences because theywant to know about the methods of other countries doctors tocure a particular disease as a result a feeling of innovationcome under them and they get aware from the newly occurreddiseases and their medicinal discoveries which shows thatprograms of Discovery has a positive impact on the attitudeof Doctors because it awakens them to think beyond a normalpattern which is applied in India for a particular disease.
323

If we talk about the programs related to new discoveries thenthere is more percentage of lecturers (20%) who prefer towatch these programs as a first choice because most of themget aware of the negative effect of technologies on the humanbeing as well as nature and some of them know about theexternal World technologies which they are using in theircountries and some of them feel that innovation ideas strikesin their mind and they want to feel it by doing adventuresfrom their innovations which shows that these programs effectthe inner thinking of lecturers as a result they feel changein their attitude as they think behind any technologicalinventions and about the peoples who have done it whichincreases their thinking fundamentals and open their brain.
If we talk about programs related to the environment thenthere is more percentage of lecturers (20%) who prefer towatch programs related to environment as a first choice onDiscovery because they come to know about the health problemswhich is caused by polluted environment as well as feelexited to watch beauty of nature and feel that these programsaware them towards the worse condition of environment which iscaused by human being as a result there is a imbalancebetween flora and fauna which shows the positive impact ofthese programs on lecturers as a result they come to knowabout the problems of environment which changes their attitudeto save the environment rather then make it worse to live forthem as well their future generations.
If we talk about the programs related to culture then thereis equal percentage of lecturers as well as teachers (5%) whoprefer to watch these programs as their first choice becausemost of them come to know about the culture of other countrieswhich is the positive impact of these programs on the attitudeof both of them because they are able to differentiate betweentheir culture as well as Indian culture and come to know howtheir culture are different from ours.
324

If we talk about the health problems then there is morepercentage of teachers (5%) who prefer to watch these programsas a first choice because these programs aware them fromdeadly diseases as a result their attitude to think on thehealth issues changes and they adjust their busy life in sucha manner that their health is not effected in any condition.
If we talk about the programs related to food then there isonly housewives (5%) who prefer to watch these programs as afirst choice because these programs give them a properknowledge of food making as a result their attitude to cookfood changes in other directions as a result they apply theserecipes in making different types of food items which showsthat programs of these type has a positive impact on thehousewives. If we talk about the historical programs than there is equalpercentage of teachers as well as housewives (5%) who watchthese programs as a first choice because these programs updatetheir knowledge regarding history of other countries as eresult they can compare the facts of their own history withother countries history to conclude the reasons behind thewar.
If we talk about the adventurous programs then there is morepercentage of working women (45%) who prefer to watch theseprograms as a first choice because most of them get aware fromthe external world adventures as a result they want to doadventure to make their different image in the society whichshows that these programs has positive impact on the attitudeof working women as a result they feel the feeling ofadventurous things.
Interpretation: If we consider all categories of women as onecategory of women then most of the women prefer to watchprograms related to adventures (18%) because they want toexpress their inner talent as well as feeling by doing
325

adventures which is the positive impact of these type ofprograms as a result they feel something different and strangeto make their extra ordinary image in the eyes of the society.
Q.9. Which category of programme/programs do you watch onother channels and what do you feel ?Ans: ………………………………………………………………………………………………………
1.Drama 2.Historical 3.Horror 4.Mythology 5.Reality6.Crime 7.Comedy 8.Fantasy 9.Fashion 10. News programs 11.Music programs 12. Devotional
Ans:
Note: Here we have taken only first choice of women of all thecategories.
TYPES OFCATEGORIESOF WOMEN
1 2 3 4 5 6 7 8 9 10 11 12 NotInterestedinOtherchannels.
LECTURERS 15%
0 0 5% 20%
0 15%
0 0 0 10%
15%
20%
TEACHERS 20%
0 0 5% 0 0 0 0 0 25%
0 0 50%
DOCTORS 25%
0 0 0 0 0 0 0 0 50%
5 0 20%
WORKINGWOMEN
40%
0 0 10%
5% 0 5% 0 0 15%
0 0 25%
HOUSEWIVES 60%
0 0 15%
0% 0 5% 0 0 15%
0 0 5%
326

Explanation: The above data shows that there is morepercentage of housewives (65%) who watch drama on otherchannels as a first choice most of them feel that dramaentertain them which we can say that the normal impact on theattitude of housewives because they learn nothing from theseprograms but some of them feel that drama aware them from theproblems of society and think over new issues and problems ofsociety.
If we talk about the programs related to mythology than thereis more percentage of housewives (15%) who feel that theseprograms give them knowledge of history behind any myth whichis a positive effect of programs in the mind of housewives.
If we talk about the reality programs then there is morepercentage of lecturers (20%) who watch these programs as afirst choice because they want to know about the realitybehind any human being that what he/she can do if he/she wantsto do which is a positive impact on the thinking of lecturersas a result they can feel the hard work behind any reality.
If we talk about the programs related to comedy then there isonly lecturers (15%) who watch these programs as a firstchoice because they want to refresh themselves from all thetiredness which is caused during the day which is a positiveimpact as a result their working power increases and they canwork for long hours.
If we talk about the news programs then there is morepercentage of doctors (50%) who watch news programs as a firstchoice because it keep them aware from unconditional problemsin life which shows the positive impact of programs on thedoctors.
If we talk about the devotional programs (15%) then onlylecturers watch these programs as a first choice because theseprograms give them the devotional feeling which is thepositive impact of programs as result a feeling of devotiontake birth in them.
327

Interpretation: : If we consider all categories of women asone category of women then most of the women watch drama (32%)as well as news programs (21%) as a first choice on otherchannels because they want entertainment as well asawareness, for this drama and news programs are the bestsource of attaining these factors.
Q.10.Which type of programs do you like most?
1. Related to women 2. Related to children 3. Related tofashion 4. Related to food HabitsAns:
Note: Here we have taken only one type programme for all thecategories of women.
TYPES OFCATEGORIES OFWOMEN
Related towomen
Relatedtochildren
Relatedtofashion
Related tofood Habits
LECTURERS 50% 0 20% 25%TEACHERS 55% 20% 5% 10%DOCTORS 15% 0 5% 0WORKING WOMEN 45% 5% 25% 10%
HOUSEWIVES 55% 10% 0 10%
Explanation: The above data shows that there is equalpercentage of teachers as well as housewives (55%) who watchprograms related to women and there is something equalpercentage of lecturers as well as working women who watchprograms related to women because all the selected categoriesof women want to know about the social position of women inthe Indian society and what are the problems are they feel inthe particular family atmosphere where they reach aftermarriage which is the positive impact of programs becausewomen watch every types of programs on television in whichthey are most attracted towards the programs related towomen. All these feeling are caused by different types of
328

programs which are telecasted regularly which shows thepositive impact of programs on the attitude of women as aresult they are eager to watch programs related to womenissues. If we talk about the programs related to children then thereis more percentage of teachers (20%) who watch these type ofprograms because they want to know the role of parents in thecare of their children by these programs and feel theimportance of right care of parents in the upliftment of thecareer of their children which is also the positive impact ofprograms on the attitude of teachers as a result they givetime to their children from their busy schedule.
If we talk about the programs related to fashion then there ismore percentage of working women (25%) who watch these typesof programs because they want to look different from others inworking place which shows the positive impact of programs onthe attitude of working women as a result they feel new changein them. If we talk about the programs related to food then there ismore percentage of lecturers (25%) who watch these programsbecause they want to try some new things regarding food makingwhich shows the positive impact of programs on them becausethey prefer a tasty food.
Interpretation: If we consider all categories of women as onecategory of women then there is more percentage of women whowatch programs related to women (44%) which shows the positiveimpact of programs because some of the women feel thatprograms creates such type of feeling in them.
Note : From Q.No.11 to Q.No.18 we have written only theInterpretation not the explanation.
329

Q.11. Which type of characters do you like most?
1. Investigative 2.Realistic 3. Devotional 4.Emotional5.Negative 6.Positive
Ans:Note: Here we have taken those women only who like one type ofcharacter liked by the women.
TYPES OF CATEGORIES OFWOMEN
1 2 3 4 5 6 Do notlike anycharacter
LECTURERS 5% 50% 5% 20% 0 30% 0TEACHERS 10% 35% 0 5% 0 20% 5%DOCTORS 10% 25% 5% 15% 0 20% 15%WORKING WOMEN 20% 30% 5% 30% 0 55% 0
HOUSEWIVES 0 20% 0 45% 5 65% 0
Interpretation: If we consider all categories of women as onecategory of women then there is more percentage of women wholike positive character (38%) as well as realistic characters(32%) because they feel that reality comes ion life when actin positive direction which shows a deep effect of characterson the attitude of women as a result they reach at thisconclusion by watching different types of programs ontelevision.
Q.12. Do you apply above marked character in your own life andwhat do you experience?
1. Yes 2. No 3. To some extent
330

Ans.TYPES OF CATEGORIES OF WOMEN Yes No To some extent
LECTURERS 40% 35% 25%TEACHERS 10% 65% 25%DOCTORS 15% 70% 15%WORKING WOMEN 50% 35% 15%
HOUSEWIVES 65% 30% 5%
Interpretation: : If we consider all categories of women asone category of women then there is more percentage of women(36%) who apply the marked character in her own life becausethey feel that programs create the characters and it dependson women that what they apply in their life but in this studyit has been concluded that most of the women apply positiveas well as realistic characters in their own life which is apositive impact of programs on the attitude of women that theyapply only positive characters not negative characters becausethey watch different programs and feel that positive thingscan be better for their future and some of them apply thesecharacters to some extent and feel good as well as differentfrom others.
Q.13. Do you apply above marked characters in others life andwhat do you experience? 1.Yes 2. No 3. To some extent
Ans.TYPES OF CATEGORIES OFWOMEN
Yes No To someextent
LECTURERS 15% 75% 10%TEACHERS 15% 60% 15%DOCTORS 15% 80% 5%WORKING WOMEN 20% 70% 10%
HOUSEWIVES 45% 50% 10%
331

Interpretation: If we consider all categories of women as onecategory of women then there is some percentage of women whoapply the marked character in others life (22%) and feel goodas well as it depends on the other person what he/se wants butthere is a serious thing that some of the women apply thenegative characters in others life for their work which we cansay that negative impact of programs on the attitude of someof the women.
Q.14. How much time do you spend on watching Televisionprogramme?
1. Half an Hour 2. One Hour 3. Two Hour4. More than that
Ans:
TYPES OFCATEGORIES OFWOMEN
Half anHour
OneHour
TwoHour
Morethanthat
Notingto say
LECTURERS 15% 55% 35% 0 0TEACHERS 20% 30% 35% 5% 10%DOCTORS 15% 55% 20% 5% 0WORKING WOMEN 10% 30% 40% 20% 0
HOUSEWIVES 0 30% 45% 20% 0
Interpretation: If we consider all categories of women as onecategory of women then there is more percentage of women whowatch programs for one hour (40%) it depends on the situationof particular woman if she is a lecturer then it is obviousthat she will watch the programs for one hour because theyhave very less time. This condition is also applicable on
332

teachers, working women and doctors but it is true thatsomething is there in the programs that binds the women whichwe can say that normal impact of programs because if somebodywants to watch something then he/she will prefer to watchprograms on television.
Q.15. At what time do you prefer to watch Televisionprogramme?
1. Morning 2. After Noon 3. Evening 4.Late Night
Ans:TYPES OFCATEGORIES OFWOMEN
Morning AfterNoon
Evening LateNight
Notingto say
LECTURERS 0 5% 80% 15% 0TEACHERS 0 0 60% 20% 20%DOCTORS 0 0 45% 55% 0WORKING WOMEN 0 0 55% 45% 0
HOUSEWIVES 5% 5% 70% 20% 0
Interpretation: If we consider all categories of women as onecategory of women then there is more percentage of women whowatch programs in evening (62%) because evening is that timewhen they remain free so watch programs in evening but it isnot the true things because there are some of the women whowatch programs at night which shows that programs make themaddicts to watch programs at night which effects the workingas well as thinking phenomenon of women which shows thenegative impact of the programs on the attitude of women thatthey remain busy in watching programs at late night which isvery serious impact of programs because programs are producedin such a manner that more and more women watch theseprograms.
333

Q.16. Do you leave all other important work while watchingTelevision Programme?
1. Yes 2.No 3.To some extent
Ans:
TYPES OF CATEGORIESOF WOMEN
Yes No To someextent
Nothing tosay
LECTURERS 15% 85% 0 0TEACHERS 10% 70% 5% 15%DOCTORS 0 95% 5% 0WORKING WOMEN 15% 75% 10% 0
HOUSEWIVES 20% 70% 15% 0
Interpretation: If we consider all categories of women as onecategory of women then there is more percentage of women whodo not leave their important work (79%) but this is not fullytrue because there is percentage of women who leave theirimportant work totally as well as to some extent which showsthat there is something hidden behind on the story orcharacter of programs that binds some of the women that theyleave their important work while watching the programs whichshows the negative impact of programs on the mind of the womenbecause they do not want to leave any episode as there may beproblem in understanding the programs on next day but now aday’s some channel give the glimpses of the previous episodeand then start the new one so that there will be no problem inunderstanding the new episode but some of the women do nottake interest in all these things because they are addicted toa large extent that they always want to watch the realepisode.
Q.17. Do you feel that Television programs are responsible forsocial change? Ans.
334

TYPES OF CATEGORIESOF WOMEN
Yes No To someextent
Nothing tosay
LECTURERS 85% 10% 0 0TEACHERS 80% 15% 0 5%DOCTORS 80% 15% 0 5%WORKING WOMEN 75% 25% 0 0
HOUSEWIVES 65% 35% 0 0
Interpretation: If we consider all categories of women as onecategory of women then there is more percentage of women (77%)who feel that programs brings social changes because in theiropinion channels telecast all type of programs and every womanhas her own choice and thinking as a result she wants tochange her attitude according to the characters whenpercentage of these types of woman increases then there comesa social change because according to them many women who hadharsh attitude towards their family has been changed to someextent which is a positive impact of programs on the thinkingof the women which shows that programs brings social change inthe orthodox society of India. Q.18. Do you feel that something innovative should be done toimprove the quality of programs?Ans:-………………………………………………………………………………………………………………………………………………………………………………………………………………………………
TYPES OF CATEGORIES OFWOMEN
Yes No To someextent
Nothing tosay
LECTURERS 75% 25% 0 0TEACHERS 65% 35% 0 0DOCTORS 40% 60% 0 0WORKING WOMEN 70% 30% 0 0
HOUSEWIVES 65% 35% 0 0
335

Interpretation: If we consider all categories of women as onecategory of women then there is more percentage of women whofeel that innovation (63%) should be done to improve thequality of programs because they feel that programs arecentered to the role of mother-in-law which is to be changedand more programs should be produced on children so that theycan learn something from these programs and some of them feelthat more programs should be on hidden social problems whichare very far away from us which shows the innovative impact ofprograms on the women that after watching different types ofprograms on television because variety of programs give them achance to say something on the quality of programs so thatinnovation should be done in the programs.
336

Graphical Representation
337

of Comparative Analysis
Q.1. Do you watch programs on TV?
1. Yes 2. No If yes, then
(a) Daily (b) Alternate day (c) Sometimes(d) Most of the day
338

Ans.
Lecturers TeachersDoctors Working
WomenHousewives
Explanation: The above chart shows that all categories ofwomen watch programs.
Lecturers
Teachers
Doctors
Working Women
Housewives
0%20%40%60%
Daily Alternate DaySometimes Most Of the day
Interpretation: If we consider all categories of women as onecategory of women then there is more percentage of women watchtelevision programs daily (52%) and according to them thereis something hidden present in the stories of programs whichpull them to watch these programs which clarifies the impactof programs on attitude of women as a result they are eager towatch the programs daily because programs are produced such away that more and more women watch them by creating theinteresting turns in the programs by the directors.
Q.2.Which type of programs do you watch mostly?
339

1. Social 2.Entertainment 3.Educational 4.Awareness 5.Devotional
Ans:
Lecturers Teachers Doctors Working Women
Housewives0%
10%
20%
30%
40%
50%
60%
70%
Social Entertainment EducationalAwareness Devotional
Interpretation: If we consider all categories of women as onecategory of women then most of the women watch programsrelated to entertainment (42%) which takes place between theprograms which shows that programs have very less impact ofawareness in the mindset of women which shapes the womenattitude in negative manner because they do not earn somethinggood from the programs which can be helpful in badcircumstances in their life so that they can take a positivestep in that particular problem because there are variousprograms on awareness, education, health which update thewomen thinking process.
340

Q.3. Which channel programs do you like most?
1. Zee TV 2. Sony 3. Colors 4. Life Ok5.Discovery 6.OthersAns.
Lecturers Teachers Doctors Working Women
Housewives0%5%10%15%20%25%30%35%40%
Zee TV Sony ColorsLife OK Discovery Others
Interpretation: If we consider all categories of women as onecategory of women then it is concluded that Colors (26%) isthe channel which is liked by the most of the women because intheir thinking, it telecasts programs on real problems offamily as well as society, from which they learn how to be asocial person in society and what is the position of women inthe society?
341

Note : I have divided the data on the basis of choices ofwomen marked by the women from Q.4 to Q.6 For example:
1.First Choice
2.Second Choice
3.Third ChoiceBut I have taken only first choice of women under the study.
and for Q.7 to Q.9 I shall take only the first choice of womenFor example:1.First Choice Only
So, I shall do our study on choice basis from Q.4 to Q.9.
342

Note 2 : From Q.No.4 to Q.No.11, I have not taken thepercentage of women while writing the explanation as well asinterpretation who do not take interest in the programs ofparticular channel under my study but I have written theirpercentage in the tables and I shall consider this percentagewhen I shall right the conclusions in Chapter No. 9.
Q.4. Which category of programme/programs of Zee TV do youwatch mostly and what do you feel ?
Ans:- ………………………………………………………………………………………………………
1. Drama 2.Historical 3.Horror 4. Mythology 5.Reality
Ans:
343

Lecturers Teachers Doctors Working Women
Housewives0%
10%
20%
30%
40%
50%
60%
Drama HistoricalHorror MythologyReality Not Interested in Zee TV
Interpretation: If we consider all categories of women asone category of women then there is more percentage of womenwho watch historical programs (27%) as their first choicebecause most of the women want to know about the history ofIndia and some of the women feel romance from these programswhich shows that programs of Zee TV have positive impact incase of providing knowledge of Indian history but on the otherside creates a hypothetical feeling of romance which plays acontradictory role in the thinking of some of the womenbecause they watch these programs to fell romance which we cansay a day dreaming impact.
Q. 5. Which category of programme/programs of Sony do youwatch mostly and what do you feel?
Ans:- ………………………………………………………………………………………………………
344

1. Drama 2.Historical 3.Horror 4.Reality5.Crime/ThrillerAns.
Lecturers Teachers Doctors Working Women
Housewives0%
10%
20%
30%
40%
50%
60%
70%
Drama HistoricalHorror RealityCrime/Thriller Not Interested in Sony
Interpretation: If we consider all categories of women asone category of women then there is more percentage of womenwho watch programs related to crime/thriller (29%) on Sony astheir first choice because most of them feel aware and realityin these programs which aware them from upcoming incidents intheir life and give them the solutions of any misbehaviorwhich is done by any person so it shows the positive impact ofprograms of Sony on the attitude of women as a result they canthink for their safe future in any place and area but there issome women who feel a feeling of criminal behavior in themwhich is a alarming fact in this study.
345

Q.6.Which category of programme/programs of Colors do youwatch mostly and what do you feel ?
Ans:- …………………………………………………………………………………………………….
1. Drama 2. Comedy 3. Reality
Ans:
Lecturers Teachers Doctors Working Women
Housewives0%5%10%15%20%25%30%35%40%45%50%
Drama ComedyReality Not interested In Colors
Interpretation: If we consider all categories of women as onecategory of women then above study shows that there is morepercentage of women who watch drama (37%) as well as realityshows (15%) as first choice on Colors because they feelentertainment as well as other feeling of social change in thesociety and on the other hand feel the reality of human naturein the reality programs which shows the positive impact ofprograms on the attitude of women as a result they can thinkbetter and positive.
346

Q.7. Which category of programme/programs of Life Ok do youwatch mostly and what do you feel?
Ans:- ………………………………………………………………………………………………………
1. Drama 2. Mythological 3.Fantasy4.Crime
Ans.
Lecturers Teachers Doctors Working Women
Housewives0%10%20%30%40%50%60%70%80%90%
Drama MythologicalFantasy CrimeNot Interested in Life OK
Interpretation: If we consider all categories of women as onecategory of women then most of the women prefer to watchprograms related to crime (15%) on Life OK which make themaware from the criminal minds of people so that they remainalert from these types of persons to avoid any type ofmisbehavior which shows the positive impact of these programs
347

on the attitude of women because they can judge any personwhether he/she is right or wrong.
Q.8. Which category of programme/programs do you watch onDiscovery and what do you feel ?
1. Medical Science 2.New technologies 3.Environment4.Culture 5.Health 6.Foods 7.Historical 8.AdventurousAns.
Lecturers Teachers Doctors Working Women
Housewives0%
10%
20%
30%
40%
50%
60%
70%
80%
Medical Sciences New TechnologiesEnvironment CultureHealth FoodsHistorical AdventurousNot interested in Discovery
348
Interpretation: If we consider all categories of women as onecategory of women then most of the women prefer to watchprograms related to adventures (18%) because they want toexpress their inner talent as well as feeling by doingadventures which is the positive impact of these type ofprograms as a result they feel something different and strangeto make their extra ordinary image in the eyes of the society.
Q.9 Which category of programme/programs do you watch on otherchannels and what do you feel ?Ans: ………………………………………………………………………………………………………
1.Drama 2.Historical 3.Horror 4.Mythology 5.Reality6.Crime 7.Comedy 8.Fantasy 9.Fashion 10. News programs 11.Music programs 12. Devotional
Ans:
349

Lecturers Teachers Doctors Working Women
Housewives0%
10%
20%
30%
40%
50%
60%
Drama Historical Horror MythologyReality Crime Comedy FantasyFashion News Programs Music Programs DevotionalNot interested
Interpretation: If we consider all categories of women as onecategory of women then most of the women watch drama (32%) aswell as news programs (21%) as a first choice on otherchannels because they want entertainment as well asawareness, for this drama and news programs are the bestsource of attaining these factors.
Q.10 Which type of programs do you like most?
1. Related to women 2. Related to children 3. Related tofashion 4. Related to food HabitsAns:
350

Lecturers Teachers Doctors Working Women
Housewives0%
10%
20%
30%
40%
50%
60%
Related to Women Related to childrenRelated to fashion Related to food habits
Interpretation: If we consider all categories of women as onecategory of women then there is more percentage of women whowatch programs related to women (44%) which shows the positiveimpact of programs because some of the women feel thatprograms creates such type of feeling in them.
351

Q.11 Which type of characters do you like most?
1. Investigative 2.Realistic 3. Devotional 4.Emotional5.Negative 6.Positive
Ans:
Lecturers Teachers Doctors Working Women
Housewives0%
10%
20%
30%
40%
50%
60%
70%
Investigative Realistic Devotional EmotionalNegative Positive Nothing to Say
Interpretation: If we consider all categories of women as onecategory of women then there is more percentage of women wholike positive character (38%) as well as realistic characters(32%) because they feel that reality comes ion life when actin positive direction which shows a deep effect of characterson the attitude of women as a result they reach at thisconclusion by watching different types of programs ontelevision.
352

Q.12. Do you apply above marked character in your own life andwhat do you experience?
1. Yes 2. No 3. To some extent
Ans:
Lecturers Teachers Doctors Working Women
Housewives0%
10%
20%
30%
40%
50%
60%
70%
Yes No To some extent
Interpretation: : If we consider all categories of women asone category of women then there is more percentage of women(36%) who apply the marked character in her own life becausethey feel that programs create the characters and it dependson women that what they apply in their life but in this studyit has been concluded that most of the women apply positive
353

as well as realistic characters in their own life which is apositive impact of programs on the attitude of women that theyapply only positive characters not negative characters becausethey watch different programs and feel that positive thingscan be better for their future and some of them apply thesecharacters to some extent and feel good as well as differentfrom others.
‘Q.13. Do you apply above marked characters in others lifeand what do you experience? 1.Yes 2. No 3. To some extent
Ans.
Lecturers Teachers Doctors Working women
Housewives0%
10%
20%
30%
40%
50%
60%
70%
80%
Yes No To some extent
354

Interpretation: If we consider all categories of women as onecategory of women then there is some percentage of women whoapply the marked character in others life (22%) and feel goodas well as it depends on the other person what he/se wants butthere is a serious thing that some of the women apply thenegative characters in others life for their work which we cansay that negative impact of programs on the attitude of someof the women.
Q.14. How much time do you spend on watching Televisionprogramme?
1. Half an Hour 2. One Hour 3. Two Hour4. More than that
Ans.
355

Lecturers
Teachers
Doctors
Working women
Housewives
0%
10%
20%
30%
40%
50%
60%
Half an hourOne hourTwo hourMore than thatNothing to say
Interpretation: If we consider all categories of women as onecategory of women then there is more percentage of women whowatch programs for one hour (40%) it depends on the situationof particular woman if she is a lecturer then it is obviousthat she will watch the programs for one hour because theyhave very less time. This condition is also applicable onteachers, working women and doctors but it is true thatsomething is there in the programs that binds the women whichwe can say that normal impact of programs because if somebodywants to watch something then he/she will prefer to watchprograms on television.
356

Q.15. At what time do you prefer to watch Televisionprogramme?
1. Morning 2. After Noon 3. Evening 4.Late Night
Ans:
Lecturers Teachers Doctors Working Women Housewives
0%
20%
40%
60%
80%
100%
Morning After Noon EveningLate Night Nothing to say
Interpretation: If we consider all categories of women as onecategory of women then there is more percentage of women whowatch programs in evening (62%) because evening is that timewhen they remain free so watch programs in evening but it isnot the true things because there are some of the women whowatch programs at night which shows that programs make themaddicts to watch programs at night which effects the workingas well as thinking phenomenon of women which shows thenegative impact of the programs on the attitude of women thatthey remain busy in watching programs at late night which is
357

very serious impact of programs because programs are producedin such a manner that more and more women watch theseprograms.
Q.16. Do you leave all other important work while watchingTelevision Programme?
1. Yes 2.No 3.To some extent
Ans:
Lecturers Teachers Doctors Working Women
Housewives0%10%20%30%40%50%60%70%80%90%100%
Yes No To some extent Nothing to say
Interpretation: : If we consider all categories of women asone category of women then there is more percentage of womenwho do not leave their important work (79%) but this is not
358

fully true because there is percentage of women who leavetheir important work totally as well as to some extent whichshows that there is something hidden behind on the story orcharacter of programs that binds some of the women that theyleave their important work while watching the programs whichshows the negative impact of programs on the mind of the womenbecause they do not want to leave any episode as there may beproblem in understanding the programs on next day but now aday’s some channel give the glimpses of the previous episodeand then start the new one so that there will be no problem inunderstanding the new episode but some of the women do nottake interest in all these things because they are addicted toa large extent that they always want to watch the realepisode.
Q.17. Do you feel that Television programs are responsible forsocial change? 1. Yes 2.No 3.To some extent
Ans.
359

Lecturers
Teachers
Doctors
Working Women
Housewives
0%10%20%30%40%50%60%70%80%90%
YesNoTo some extentNothing to say
Interpretation: If we consider all categories of women as onecategory of women then there is more percentage of women (77%)who feel that programs brings social changes because in theiropinion channels telecast all type of programs and every womanhas her own choice and thinking as a result she wants tochange her attitude according to the characters whenpercentage of these types of woman increases then there comesa social change because according to them many women who hadharsh attitude towards their family has been changed to someextent which is a positive impact of programs on the thinkingof the women which shows that programs brings social change inthe orthodox society of India.
360

Q.18. Do you feel that something innovative should be done toimprove the quality of programs?1. Yes 2.No 3.To some extent
Ans.
Lecturers
Teachers
Doctors
Workiong Women
Housewives
0%10%20%30%40%50%60%70%80%
YesNoTo some extentNothing to say
Interpretation: If we consider all categories of women as onecategory of women then there is more percentage of women whofeel that innovation (63%) should be done to improve thequality of programs because they feel that programs arecentered to the role of mother-in-law which is to be changedand more programs should be produced on children so that theycan learn something from these programs and some of them feelthat more programs should be on hidden social problems whichare very far away from us which shows the innovative impact ofprograms on the women that after watching different types ofprograms on television because variety of programs give them achance to say something on the quality of programs so thatinnovation should be done in the programs.
361

Chapter 8
362

Findings
363

FINDINGS OF LECTURERS
For Q.No.1
1. There is full percentage (100%) of lecturers who watchprograms and in which there is more percentage (60%) oflecturers who watch television programs daily as compared toalternate day (10%), sometimes (20%) and most of the day(10%).
364

For Q.No.2
1. There is more percentage (45%) of lecturers who watch onecategory of programs with more percentage (35%) ofentertainment programs as compared to social programs (5%),educational programs (5%), awareness programs (0%) anddevotional programs (0%).
For Q.No.3
1. There is more percentage (55%) of lecturers who like onechannel programs with more percentage (30%) of Colors.
Note: From Q.No.4 to Q.No.6 we have taken three choices ofprograms of a particular channel.
For Q.No.4
1. There are 40% lecturers who do not take interest in theprograms of Zee TV.
2. There is more percentage of lecturers (45%) who prefer towatch historical programs as compared to Drama (5%), Realityprograms (5%), Horror programs (0%) and Mythological programs(0%) as first choice on Zee TV and most of them feelentertainment by watching historical programs.
3. There are only (10%) lecturers who prefer to watch realityprograms as a second choice as compared to other programswhich all have 0% of preference on Zee TV and most of themfeel entertainment by watching reality programs.
4. There is no lecturer who comes under the category of thirdchoice of programs on Zee TV.
For Q. No. 5
365

1. There are 65% lecturers who do not take interest in theprograms of Sony.
2. There is more percentage (15%) of lecturers who prefer towatch Crime/thriller programs as compared to Drama (5%) andhistorical programs (10%) on Sony as a first choice and mostof them feel aware by watching Crime/Thriller programs.
3. There is more percentage (10%) of lecturers who prefer towatch drama as compared to Historical programs (5%) andreality programs (5%) on Sony as second choice and most ofthem feel aware, reality, and romantic as well as know aboutthe human relation as another feeling by watching historicalprograms.
4. Only 5% lecturers prefer to watch drama on Sony as thirdchoice with 0% preference to other categories of programs andmost of them feel entertainment as well as happiness bywatching drama.
For Q. No.6
1. There are 30% lecturers who do not take interest in theprograms of Colors.
2. There is equal percentage of lecturers (30%) who prefer towatch drama as well as comedy programs as a first choice onColors and most of them feel entertainment from drama and feelentertainment as well as happiness from comedy programs.
3. There is equal percentage of lecturers (5%) who prefer towatch comedy as well as reality programs as a second choice onColors and most of them feel happy from comedy programs andfrom reality programs feel entertainment as well as reality.
4. There is no lecturer who watches programs as third choicefor a particular category on Colors.
Q. No.7
366

1. There are 70% lecturers who do not take interest in theprograms of Life OK.
2. There is more percentage (20%) of lecturers who watchmythological programs on Life OK as a first choice as comparedto drama (5%), crime (5%) and fantasy programs (0%) and mostof them feel aware, entertainment and want to know about thehistory behind the myth as well as feel devotion and spiritualenhancement as another feeling by watching mythologicalprograms on Life OK.
For Q.No.8
1. There are 35% lecturers who do not take interest in theprograms of Discovery.
2. There is more percentage of lecturers (30%) who prefer towatch programs related to new technologies on Discovery as afirst choice as compared to medical science (10%), environment(20%), culture (5%) and have 0% preference to programs relatedto health, food, historical and adventurers and most of themfeel aware from the negative effects of technologies on thehuman beings as well as on the ecosystem by watching programsrelated to new technologies.
For Q.No.9
1. There are 20% lecturers who do not prefer to watch programson other channels.
2. There is more percentage (20%) of lecturers who prefer towatch reality program on other channels as a first choice ascompared to mythology (5%), comedy (15%), music programs(10%), devotional (15%) and have 0% preference for theprograms related to crime, fantasy, fashion and news programsand most of them feel entertainment as well as happiness bywatching reality programs.
For Q. No.10
367

1. There is more percentage (50%) of lecturers who likeprograms related to women as compared to fashion (20%),related to food habits (25%) and 0% like programs related tochildren.
For Q.No.11
1. There is more percentage of lecturers who like realisticcharacters (50%) in the programs as compared to investigative(5%), devotional (5%), emotional (20%), positive (20%) andnegative (0%).
For Q.No.12
1. There is more percentage (40%) of lecturers who apply themarked characters in their own life as compared to thoselecturers who do not apply the marked character in otherslife.
For Q. No.13
1. There is less percentage (15%) of lecturers who apply themarked characters in other life as compared to the percentage(10%) of lecturers who apply the marked character to someextent in others life.
For Q.No.14
1. There is more percentage of lecturers (55%) who watch theprograms for one hour as compared to half an hour (15%) andtwo hour (35%).
For.Q.No.15
1. There is more percentage (80%) of lecturers who watchprograms in evening as compared to morning (0%), after noon(5%) and late night (15%).
368

For Q. No16
1. There is very less percentage (15%) of lecturers who leavetheir important work while watching programs as compared topercentage (85%) of lecturers who do not leave their importantwork.
For Q.No.17
1. There is more percentage of lecturers (85%) who feel thatprograms bring social change as compared to percentage (15%)of lecturers who feel that programs do not bring socialchange.
For Q. No.18
1. There is more percentage (75%) of lecturers who feel thatinnovation should be done to improve the quality of programsas compared to the percentage (25%) of lecturers who do notbelieve in innovation.
SOME OTHER IMPORTANT FINDINGS OF LECTURERS:
No lecturer watch news programs because they prefer towatch news programs on Internet while they get some freetime in University.
No lecturer watches horror programs. No lecturer watches programs related to fantasy. No lecturer watches programs related to health as well as
adventure. Some lecturers watch devotional programs on devotional
channels.
369

370

FINDINGSOFTEACHERS
For Q.No.1
1. There is full percentage (100%) of teachers who watchprograms and in which there is more percentage (45%) of
371

teachers who watch television programs daily as compared toalternate day(0%), sometimes(35%) and most of the day(20)%.
For Q.No.2
1. There is more percentage (95%) of teachers who watch onetype of programs and in which there is more percentage (55%)of teachers who watch programs related to entertainment as onetype category as compared to social (10%), educational(5%),awareness(25%) and devotional(0%).
For Q.No.3
There is more percentage (40%) of teachers who prefer to likeColors programs as a one type channel category as compared toZee TV (10%), Sony(10%) and others (15%).
Note: From Q.No.4 to Q.No.6 we have taken three choices ofprograms on a particular channel.
For Q.No.4
1. There are 40% teachers who do not take interest in theprograms of Zee TV.
2. There is more percentage (35%) of teachers who prefer towatch drama as a first choice on Zee TV as compared tohistorical programs(10%), horror (0%), mythology(0%) andreality programs (0%) and most of them feel entertainment bywatching drama.
3. There is more percentage (5%) of teachers who prefer towatch historical programs as a second choice on Zee TV ascompared to other categories of programs having 0% preferenceas a second choice and most of them feel entertainment as wellas want to know about the history of India by watchinghistorical programs.
372

4. There is no teacher who prefers to watch any category ofprograms as a third choice on Zee TV.
For Q.No.5
1. There are 55% teachers who do not take interest in theprograms of Sony.
2. There is more percentage (40%) of teachers who prefer towatch programs related to crime/thriller as a first choice onSony as compared to drama (5%), historical programs(0%) ,horror (0%), mythology (0%) and reality programs (0%) and mostof them feel aware by watching crime/thriller programs.
3. There is more percentage of teachers (5%) who prefer towatch programs related to history as a second choice on Sonyas compared to other categories of programs having 0%preference as a second choice and most of them want to knowabout the history of India by watching historical programs.
4. There is more percentage (5%) of teachers who prefer towatch programs related to reality as a third choice on Sony ascompared to other categories of programs having 0% preferenceas a third choice and most of them feel the reality bywatching reality programs.
For Q. No.6
1. There are 25% teachers who do not take interest in theprograms of Colors.
2. There is more percentage (35%) of teachers who prefer towatch drama as a first choice on Colors as compared to Comedy(30%) and reality (10%) and most of them feel entertainment bywatching drama.
3. There is more percentage (10%) of teachers who prefer towatch programs related to Comedy as a second choice on Colorsas compared to drama (0%) and reality (0%) and most of themfeel entertainment as well as happiness by watching comedy.
373

4. There is no teacher who prefers to watch any category ofprograms as a third choice on Colors.
For Q.No.7
1. There are 50% teachers who do not take interest in theprograms of Life OK.
2. There is more percentage (50%) of teachers who prefer towatch programs related to Crime on Life OK as first choice ascompared to mythology, fantasy and drama having 0% preferenceas first choice and most of them feel aware by watchingprograms related to crime.
For Q. No.8
1. There are 70% teachers who do not take interest in theprograms of Discovery.
2. There is more percentage of teachers who prefer to watchprograms related to adventure (10%) on Discovery as firstchoice as compared to medical sciences (0%), new technologies(5%), environment (0%), culture (5%), health (5%) , food (0%)and historical programs (5%) and most of them want to doadventures in their life by watching adventurous programs.
For Q. No.9
1. There are 50% teachers who do not take interest in theprograms of other channels.
2. There is more percentage (25%) of teachers who watch newsprograms on the other channels as a first choice as comparedto drama (20%), historical (0%), horror (0%), mythology (5%),reality (0%), crime (0%), comedy (0%), fantasy (0%),fashion(0%),music programs (0%) and devotional programs (0%)and most of them feel aware by watching news programs.
For Q. No. 10
374

1. There is more percentage (55%) of teachers who likeprograms related to women as compared to children (20%), food(10%), and fashion programs (5%).
For Q.No.11
1. There is more percentage (35%) of teachers who likerealistic characters as compared to investigative (5%),devotional (0%), emotional (5%), negative (0%) and positive(20%).
For Q.No.12
1. There is more percentage (65%) of teachers who do not applythe marked character in their own life as compared to thepercentage (10%) of teachers who apply the marked character intheir own life and who apply the marked character to someextent (25%) in their own life.
For Q.No.13
1. There is equal percentage (15%) of teachers who apply themarked characters in others life as well as apply thesecharacters to some extent in others life and more percentage(60%) of teachers who do not apply the marked characters inothers life.
For Q.No.14
1. There is more percentage (35%) of teachers who watchprograms for two hour in a day as compared to half an hour(20%), one hour (30%), more than that (5%) and 10% havenothing to say.
For Q.No.15
1. There is more percentage of teachers (60%) who watchprograms in evening as compared to morning (0%), afternoon(0%), late night (20%) and 20% have nothing to say.
For Q.No.16
375

1. There is more percentage of teachers who leave theirimportant work (10%) as compared to the teachers who leavetheir important work to some extent (5%) but there is morepercentage (70%) of teachers who do not leave their importantwork and 15% have nothing to say.
For Q.No.17
1. There is more percentage (80%) of teachers who believe thatprograms bring social changes and 15% do not believe in thisand 5% have nothing to share.
For Q. No. 18
1. There is more percentage (65%) of teachers who believe thatinnovation should be done to improve the quality of programsand 35% do not believe in innovation of programs.
SOME IMPORTANT FINDINGS OF TEACHERS: There is no teacher who watches programs on alternate
days. There is no teacher who watches reality as well as
mythological programs on Zee TV. There is no teacher who watches programs related on
History as well as reality on Sony. There is no teacher who watches drama, fantasy and
mythology on Life OK. There is no teacher who watches programs related to
environment as well as food on Discovery. There are some teachers who watch news programs on news
channels.
376

FINDINGSOF DOCTORS
377

For Q.No.1
1. There is full percentage (100%) of doctors who watchprograms in which there is more percentage (50%) of doctorswho watch television programs daily as compared to alternateday (10%), sometimes (40%) and most of the day (0%).
For Q.No.2
1. There is more percentage (45%) of doctors who watchprograms related to entertainment as one type category ascompared to social (5%), educational (0%), awareness (5%),devotional (5%) and 5% have nothing to say.
For Q.No.3
There is more percentage (30%) of doctors who like twochannels programs with more percentage of combination of Sonyand Discovery.
Note: From Q.No.4 to Q.No.6 we have taken three choices ofprograms on a particular channel.
For Q.No.4
378

1. There are 75% doctors who do not take interest in theprograms of Zee TV.
2. There is more percentage of doctors who prefer to watchprograms related to history as a first choice on Zee TV ascompared to drama (5%), horror (5%) mythology (0%) and reality(5%) and most of them feel entertainment by watchinghistorical programs.
3. There is more percentage of doctors (5%) who prefer towatch historical programs as a second choice on Zee TV andthere is 0% preference for other categories of programs as asecond choice and most of them want to know about the historyof India by watching historical programs.
4. There is no doctor who prefers to watch any category ofprograms as a third choice on Zee TV.
For Q.No.5
1. There are 55% doctors who do not take interest in theprograms of Sony.
2. There is more percentage (25%) of doctors who prefer towatch programs related to crime/thriller as a first choice onSony as compared to historical programs (10%), drama (5%),horror (0%) and reality (5%) and most of them feel aware aswell as entertainment by watching programs related to crime.
3. There is no doctor who prefers to watch programs as asecond choice on Sony.
4. There is no doctor who prefers to watch programs as a thirdchoice on Sony.
For Q. No.6
1. There are 45% doctors who do not take interest in theprograms of Colors.
379

2. There is more percentage (35%) of doctors who prefer towatch drama as a first choice on Colors as compared to comedy(15%) and reality programs (5%) and most of them feelentertainment as well as reality by watching drama.
3. There is more percentage of doctors (5%) who prefer towatch programs related to reality as a second choice on Colorsas drama as well as comedy have 0% preference as secondchoice and most of them feel entertainment as well as realityby watching reality programs.
4. There is more percentage of doctors who prefer to watchcomedy programs as a third choice on Colors and feel happinessby watching comedy programs.
For Q.No.7
1. There are 85% doctors who do not take interest in theprograms of Life OK.
2. There is more percentage (15%) of doctors who prefer towatch programs related to mythology on Life OK as a firstchoice and want to know about the history behind the myth.
For Q. No.8
1. There are 45% doctors who do not take interest in theprograms of Discovery.
2. There is more percentage of doctors who prefer to watchprograms related to medical sciences (30%) as well asadventurous programs (25%) and most of them feel aware fromthe programs of medical sciences and want to do adventures intheir life just like adventurous programs.
For Q. No.9
1. There are 20% doctors who do not take interest in theprograms of other channels.
380

2. There is more percentage (50%) of doctors who watch newsprograms on the other channels and most of them feel aware bywatching these programs.
For Q. No. 10
1. There is more percentage (50%) of doctors who have nothingto mark in this questions.
For Q.No.11
1. There is more percentage of doctors who like realistic(25%) as well as positive (20%) characters.
For Q.No.12
1. There is more percentage (70%) of doctors who do not applythe marked character in their own life.
For Q.No.13
1. There is more percentage (15%) of doctors who apply themarked characters in others life as compared to the doctorswho apply the characters to some extent (5%) in others life.
For Q.No.14
1. There is more percentage (55%) of doctors who watchprograms for one hour in a day.
For Q.No.15
1. There is more percentage (55%) of doctors who watchprograms at late night.
For Q.No.16
1. There is very less percentage (5%) of doctors who leavetheir important work to some extent while watching programs.
For Q.No.17
1. There is more percentage (80%) of doctors who believe thatprograms bring social changes.
381

For Q. No. 18
1. There is more percentage (60%) of doctors who believe thatno innovation should be done to improve the quality ofprograms.
SOME IMPORTANT FINDINGS OF DOCTORS:
No doctor watches educational programs. No doctor watches programs related to mythology on Zee
TV. No doctor watches horror programs on Sony. Doctors watch mythological programs on Life OK. Doctors do not watch programs of environment, health,
historical as well as culture on Discovery.
NOTE: I HAVE WRITTEN ONLY THEORITICAL FINDINGS OF WORKINGWOMEN WITHOUT ANY PERCENTILE.
382

FINDINGSOFWORKINGWOMEN
For Q.No.1
383

1. There is more percentage of working women who watchtelevision programs daily.
For Q.No.2
1. There is more percentage of working women who watch twotypes of programs related to entertainment as well asawareness.
For Q.No.3
There is equal percentage of working women who like Zee TVprograms as a one type channel programs as well as two typesof programs with more percentage of combination of Zee TV andColors.
Note: From Q.No.4 to Q.No.6 we have taken three choices ofprograms on a particular channel.
For Q.No.4
1. There are 20% working women who do not take interest in theprograms of Zee TV.
2. There is more percentage of working women who prefer towatch drama as a first choice on Zee TV and most of them feelentertainment.
3. There is equal percentage of working women who prefer towatch drama, horror and reality programs as a second choice onZee TV and from drama most of them feel aware, entertainmentas well as happiness, from horror programs most of them feelaware, reality as well as feel the feeling of criminalbehavior and from reality programs feel entertainment.
4. There is more percentage of working women who prefer towatch programs related to history as a second choice on Zee TVand most of them want to know about the history.
384

For Q.No.5
1. There are 40% working women who do not take interest in theprograms of Sony.
2. There is more percentage of working women who prefer towatch programs related to crime/thriller as a first choice onSony and most of them feel aware.
3. There is equal percentage of working women who prefer towatch drama as well as historical programs as a second choiceon Sony and feel entertainment from the drama and fromhistorical programs most of them want to know about thehistory.
4. There are no working women who watch programs as thirdchoice for a particular category of programs on Sony.
For Q. No.6
1. There are 15% working women who do not take interest in theprograms of Colors.
2. There is more percentage of working women who prefer towatch drama as well as reality programs as a first choice onColors and from drama most of them feel reality and fromreality programs most of them feel entertainment.
3. There is more percentage of working women who prefer towatch programs related to comedy as a second choice on Colorsand most of them feel happy.
4. There is no working women who prefer to watch programs asa third choice on Colors.
For Q.No.7
1. There are 70% working women who do not take interest in theprograms of Life OK.
385

2. There is more percentage of working women who prefer towatch drama on Life OK and most of them feel that criminalbehavior strikes them and most of them feel happy as well asromantic.
For Q. No.8
1. There are 40% working women who do not take interest in theprograms of Discovery.
2. There is more percentage of working women who prefer towatch adventurous programs and most of them feel that theywant to know about the external world adventures.
For Q. No.9
1. There are 25% working women who do not take interest in theprograms of other channels.
2. There is more percentage of working women who watch dramaon the other channels and most of them feel entertainment.
For Q. No. 10
1. There is more percentage of working women who prefer towatch programs related to women.
For Q.No.11
1. There is more percentage of working women who like positivecharacters.
For Q.No.12
1. There is more percentage of working women who apply themarked character in their own life.
For Q.No.13
1. There is more percentage of working women who apply themarked characters in others life as compared to the workingwomen who apply the characters to some extent in other life.
386

For Q.No.14
1. There is more percentage of working women who watchprograms for two hour in a day.
For Q.No.15
1. There is more percentage of working women who watchprograms in evening.
For Q.No.16
1. There is very less percentage of working women who leavetheir important work as compared to the working women wholeave their important work to some extent while watchingprograms.
For Q.No.17
1. There is more percentage of working women who believe thatprograms bring social changes.
For Q. No. 18
1. There is more percentage of working women who believe thatinnovation should be done to improve the quality of programs.
SOME IMPORTANT FINDINGS OF WORKING WOMEN:
They watch horror programs on Zee TV. They do not watch reality programs as well as drama on
Sony. They do not watch programs related to fantasy on Life OK. They do not watch programs related to health, culture and
history on Discovery.
387

NOTE: I HAVE WRITTEN ONLY THEORITICAL FINDINGS OF HOUSEWIVESWITHOUT ANY PERCENTILE.
FINDINGS OFHOUSEWIVES
388

For Q.No.1
1. There is more percentage of housewives who watch televisionprograms daily.
For Q.No.2
1. There is more percentage of housewives who watchentertainment programs as one type category.
For Q.No.3
There is more percentage of housewives who prefer to like twochannels programs with more percentage of combination of ZeeTV and other channels.
Note: From Q.No.4 to Q.No.6 we have taken three choices ofprograms on a particular channel.
For Q.No.4
1. There are 15% housewives who do not take interest in theprograms of Zee TV.
2. There is more percentage of housewives who prefer to watchprograms related to history as a first choice on Zee TV andmost of them feel entertainment.
389

3. There is more percentage of housewives who prefer to watchhistorical programs as a second choice on Zee TV and most ofthem want to know about the history.
4. There is equal percentage of housewives who prefer to watchdrama as well as reality programs as a third choice on Zee TVand most of them feel entertainment from drama and most ofthem feel reality from reality programs.
For Q.No.5
1. There are 40% housewives who do not take interest in theprograms of Sony.
2. There is more percentage of housewives who prefer to watchdrama as a first choice on Sony and most of them feelentertainment.
3. There is equal percentage of housewives who prefer to watchhistorical as well as reality programs as a second choice onSony and most of them want to know about the history ofIndia from the programs related to history and most of themfeel reality from the reality programs.
4. There are no housewives who watch programs as third choicefor a particular category of programs on Sony.For Q. No.6
1. There are 25% housewives who do not take interest in theprograms of Colors.
2. There is more percentage of housewives who prefer to watchdrama as a first choice on Colors and most of them feelentertainment.
3. There is more percentage of housewives who prefer to watchprograms related to reality as a second choice and most ofthem feel reality in these programs.
4. There is no housewives who prefer to watch programs as athird choice on Colors.
390

For Q.No.7
1. There are 60% housewives who do not take interest in theprograms of Life OK.
2. There is more percentage of housewives who prefer to watchdrama on Life OK and most of them feel entertainment.
For Q. No.8
1. There are 75% housewives who do not take interest in theprograms of Discovery.
2. There is more percentage of housewives who prefer to watchadventurous programs and most of them feel that they want todo adventure.
For Q. No.9
1. There are 5% housewives who do not take interest in theprograms of other channels.
2. There is more percentage of housewives who watch drama onthe other channels and most of them feel entertainment.
For Q. No. 10
1. There is more percentage of housewives who prefer to watchprograms related to women.
For Q.No.11
1. There is more percentage of housewives who like positivecharacters.
For Q.No.12
1. There is more percentage of housewives who apply the markedcharacter in their own life.
For Q.No.13
1. There is more percentage of housewives who apply the markedcharacters in others life.
391

For Q.No.14
1. There is more percentage of housewives who watch programsfor two hour in a day.
For Q.No.15
1. There is more percentage of housewives who watch programsin evening.
For Q.No.16
1. There is more percentage of housewives who leave theirimportant work as compared to the housewives who leave theirimportant work to some extent while watching programs.
For Q.No.17
1. There is more percentage of housewives who believe thatprograms bring social changes.
For Q. No. 18
1. There is more percentage of housewives who believe thatinnovation should be done to improve the quality of programs.
SOME IMPORTANT FINDINGS OF HOUSEWIVES:
No housewife watches Sony as a first choice of channels. No housewife watch mythological programs on Zee TV as a
first choice. No housewife watches reality programs as a first choice
on Sony. There are some housewives who watch news programs for the
awareness on news programs. There is no housewife who watches programs related to
fashion under the one category of programs.
392

COMPARATIVEFINDINGS
393

Q.1. Do you watch programs on TV?
1. Yes 2. No
(a) Daily (b) Alternate day (c) Sometimes(d) Most of the day
Ans.
LECTURERS TEACHERS DOCTORS WORKING WOMEN HOUSEWIVES
100% 100% 100% 100% 100%
All categories of women watch programs.
TYPES OFCATEGORIES
DAILY ALTERNATEDAY
SOMETIMES MOST OF THE DAY
394

OF WOMENLECTURERS 60% 10% 20% 10%TEACHERS 45% 0% 35% 20%DOCTORS 50% 10% 40% 0%WORKINGWOMEN
40% 0 35% 25%
HOUSEWIVES 65% 0% 30% 5%
1. There is more percentage of housewives who watch programsdaily.
2. There is equal percentage of lecturers as well as doctorswho watch programs on alternate days.
3. There is equal percentage of teachers as well as workingwomen who watch programs on alternate day.
4. There is more percentage of working women who watchprograms on most of the day.
Q.2.Which type of programs do you watch mostly?
1. Social 2.Entertainment 3.Educational 4.Awareness 5.Devotional
Ans:
Note: Here we have taken only one category of programms likedby all the categories of women.
TYPES OF CATEGORIESOF WOMEN
Soc. Ent. Edu. Awar. Devo.
395

LECTURERS 5% 35% 5% 0 0TEACHERS 10% 55% 5% 25% 0DOCTORS 5% 45% 0 5% 5%WORKING WOMEN 5% 10% 5% 5% 5%
HOUSEWIVES 5% 65% 10% 5% 0
1. There is more percentage of teachers who watch socialprograms.
2.There is more percentage of housewives who watch programson entertainment.
3. There is more percentage of housewives who watcheducational programs.
4. There is more percentage of teachers who watch programsrelated awareness.
5. There is equal percentage of doctors as well as workingwomen who watch devotional programs.
Q.3. Which channel programs do you like most?
396

1. Zee TV 2. Sony 3. Colors 4. Life Ok5.Discovery 6.OthersAns:
Note : Here we have taken only percentage of one channel whois liked by all the categories of women.
TYPES OFCATEGORIES OFWOMEN
Zee TV Sony Colors
Life OK Discovery
Others
LECTURERS 0 0 30% 0 20% 5%TEACHERS 10% 10% 40% 0 0 15%DOCTORS 0 5% 20% 5% 0 25%WORKING WOMEN 25% 10% 15% 0 0 5%
HOUSEWIVES 15% 0 25% 0 0 0
1. There is more percentage of working women who likeprograms of Zee TV.
2. There is equal percentage of teachers as well as workingwomen who like programs of Sony.
3. There is more percentage of teachers who like programs ofColors.
4. There is only percentage of doctors who like programs ofLife OK.
5. There is only percentage of lecturers who like programsof Discovery.
6. There is more percentage of doctors who like programs ofother channels.
397

Note : I have divided the data on the basis of choices ofwomen marked by the women from Q.4 to Q.6 For example:
1.First Choice
2.Second Choice
3.Third Choice
But I shall take the findings of women as a first choice only.
and for Q.7 to Q.9 I shall take only the first choice of womenFor example:1.First Choice Only
So, I shall do my study on choice basis from Q.4 to Q.9.
398

Q.4. Which category of programme/programs of Zee TV do youwatch mostly ?Ans:- ………………………………………………………………………………………………………
1. Drama 2.Historical 3.Horror 4. Mythology 5.Reality
Ans :
Note: Here we have taken only first choice of women of all thecategories.
TYPES OFCATEGORIESOF WOMEN
Drama Historical
Horror Mythology
Reality
Notinterested inZee TV
LECTURERS 5% 45% 0 0 5% 40%TEACHERS 35% 10% 0 0 0 0DOCTORS 5% 10% 5% 0 5% 60%WORKINGWOMEN
30% 25% 10% 0 10% 20%
HOUSEWIVES 20% 45% 0 0 10% 25%
399

1. There is more percentage of teachers who watch dramaon Zee TV.
2. There is more percentage of working women who watchhistorical programs on Zee TV and equal percentage ofteachers as well as doctors who watch historical programson Zee TV.
3. There is more percentage of working women who watchhorror programs on ZeeTV.
4. There is no woman who watches mythological programs onZee TV.
5. There is equal percentage of lecturers as well asdoctors and working women as well as housewives who watchreality programs on Zee TV.
6. There is more percentage of doctors who do not takeinterest in the programs of Zee TV.
Q. 5. Which category of programme/programs of Sony do youwatch mostly?
Ans:- ………………………………………………………………………………………………………
1. Drama 2.Historical 3.Horror 4.Reality5.Crime/Thriller
Ans :
Note: Here we have taken only first choice of women of all thecategories.
400

TYPES OFCATEGORIESOF WOMEN
Drama Historical
Horror
Reality
Crime/Thriller
Notinterested inSony
LECTURERS 5% 10% 0 5% 15% 65%TEACHERS 5% 0 0 0 40% 55%DOCTORS 5% 10% 0 5% 25% 55%WORKINGWOMEN
0 10% 5% 0 40% 40%
HOUSEWIVES 25% 10% 0 0 25% 40%
1. There is more percentage of housewives who watch dramaon Sony and there is equal percentage of lecturers,teachers as well as doctors who watch drama on Sony.
2. There is equal percentage of lecturers, doctors,working women as well as housewives who watchhistorical programs on Sony.
3. Only working women watch horror programs on Sony.4. There is equal percentage of working women as well as
doctors who watch reality programs on Sony.5. There is more percentage of teachers who watch
crime/thriller on Sony.6. There is more percentage of lecturers who do not take
interest in the programs of Sony and equal percentageof teachers as well as doctors who do not take interestin the programs of Sony.
401

Q.6.Which category of programme/programs of Colors do youwatch mostly ?
Ans:- …………………………………………………………………………………………………….
1. Drama 2. Comedy 3. Reality
Ans:
Note: Here we have taken only first choice of women of all thecategories.
TYPES OFCATEGORIES OFWOMEN
Drama Comedy Reality Notinterestedin Colors
LECTURERS 30% 30% 10% 30%TEACHERS 35% 30% 10% 25%DOCTORS 35% 15% 5% 45%WORKING WOMEN 35% 15% 35% 15%
HOUSEWIVES 50% 5% 15% 25%
1. There is more percentage of housewives who watch dramaon Colors and equal percentage of teachers, doctors aswell as working women who watch drama on Colors.
2. There is equal percentage of lecturers as well asteachers and doctors as well as working women who watchcomedy programs on Colors.
3. There is more percentage of working women who watchreality programs and equal percentage of lecturers aswell as teachers who watch reality programs on Colors.
4. There is more percentage of doctors who do not takeinterest in the programs of Colors.
402

Q.7. Which category of programme/programs of Life Ok do youwatch mostly?
Ans:- ………………………………………………………………………………………………………
1. Drama 2. Mythological 3.Fantasy4.Crime
Ans:
Note: Here we have taken only first choice of women of all thecategories.
TYPES OFCATEGORIES OFWOMEN
Drama Mythological
Fantasy Crime Notinterested inLife OK
LECTURERS 5% 20% 0 5% 70%TEACHERS 0 0 0 50% 50%DOCTORS 0 15% 0 0 85%WORKING WOMEN 20% 5% 0 5% 70%
HOUSEWIVES 20% 5% 0 15% 60%
1. There is equal percentage of working women as wellas housewives who watch drama on Life OK.
2. There is more percentage of lecturers who watchmythological programs on Life OK.
3. There is no woman who watches programs related tofantasy on Life OK.
4. There is more percentage of teachers who watchprograms related to crime on Life OK.
403
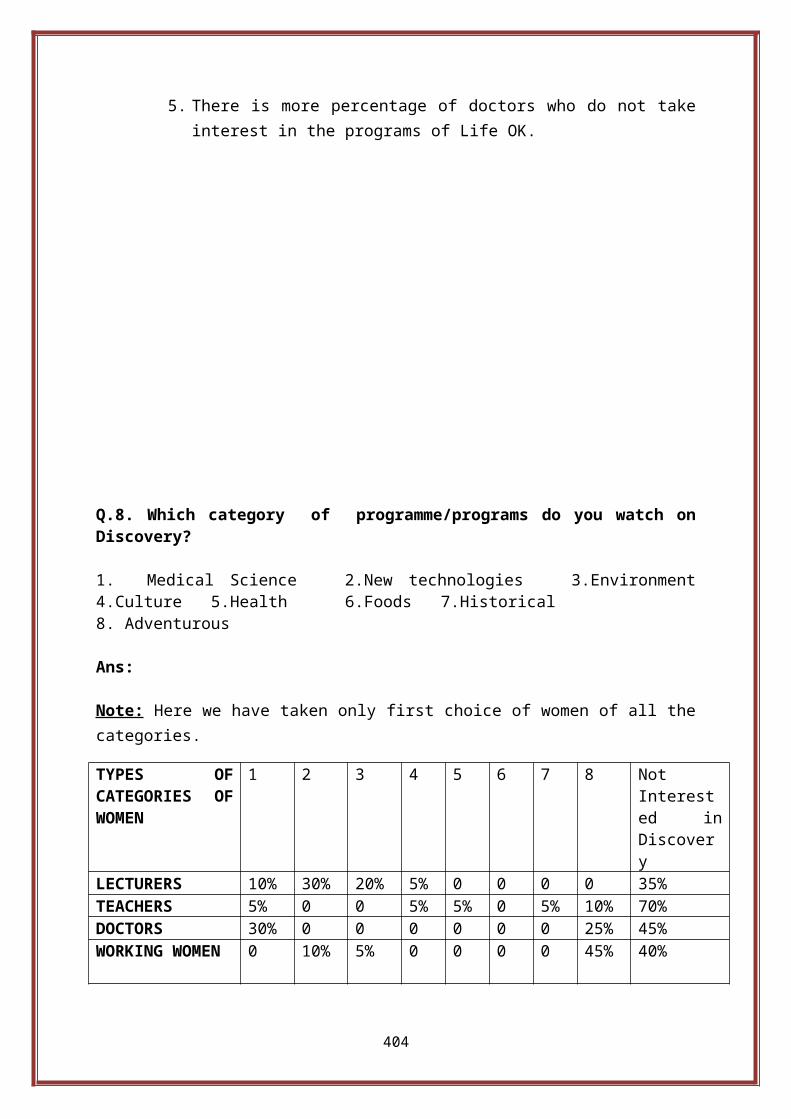
5. There is more percentage of doctors who do not takeinterest in the programs of Life OK.
Q.8. Which category of programme/programs do you watch onDiscovery?
1. Medical Science 2.New technologies 3.Environment4.Culture 5.Health 6.Foods 7.Historical8. Adventurous
Ans:
Note: Here we have taken only first choice of women of all thecategories.
TYPES OFCATEGORIES OFWOMEN
1 2 3 4 5 6 7 8 NotInterested inDiscovery
LECTURERS 10% 30% 20% 5% 0 0 0 0 35%TEACHERS 5% 0 0 5% 5% 0 5% 10% 70%DOCTORS 30% 0 0 0 0 0 0 25% 45%WORKING WOMEN 0 10% 5% 0 0 0 0 45% 40%
404

HOUSEWIVES 0 5% 0 0 0 5% 5% 10% 75%
1. There is more percentage of doctors who watchprograms related to medical sciences on Discovery.
2. There is more percentage of lecturers who watchprograms related to new technologies on Discovery.
3. There is more percentage of lectures who watchprograms related to environment on Discovery.
4. There is equal percentage of lecturers as well asteachers who watch programs related to culture.
5. There are only teachers who watch health relatedprograms on Discovery.
6. Only housewives watch programs related to food ondiscovery.
7. There is equal percentage of teachers as well ashousewives who watch programs related to historyon Discovery.
8. There is more percentage of worki9ng women whowatch programs related to adventurers.
9. There is more percentage of housewives who do nottake interest in the programs of Discovery.
Q.9. Which category of programme/programs do you watch onother channels?Ans: ………………………………………………………………………………………………………1.Drama 2.Historical 3.Horror 4.Mythology 5.Reality6.Crime 7.Comedy 8.Fantasy 9.Fashion 10. News programs 11.Music programs 12. Devotional Ans:Note: Here we have taken only first choice of women of all thecategories.
405

TYPES OFCATEGORIESOF WOMEN
1 2 3 4 5 6 7 8 9 10 11 12 NotInterestedinOtherchannels.
LECTURERS 15%
0 0 5% 20%
0 15%
0 0 0 10%
15%
20%
TEACHERS 20%
0 0 5% 0 0 0 0 0 25%
0 0 50%
DOCTORS 25%
0 0 0 0 0 0 0 50%
5 0 20%
WORKINGWOMEN
40%
0 0 10%
5% 0 5 0 0 15%
0 0 25%
HOUSEWIVES 60%
0 0 15%
0% 0 1 0 0 15%
0 0 5%
1. There is more percentage of housewives whowatch drama on other channel.
2. There is no woman who watches historicalprograms on other channels.
3. There is no woman who watches horror programson other channels.
4. There is more percentage of housewives whowatch mythological programs on other channels.
5. There is more percentage of lecturers whowatches reality programs on other channels.
6. There is no woman who watches programs relatedto crime on other channels.
7. There is more percentage of lecturers who watchcomedy programs on other channels.
8. No woman watches programs on fantasy on otherchannels.
9. No woman watches programs on fashion on otherchannels.
10. There is more percentage of doctors whowatch news programs.
406

11. Only lecturers watch music programs onother channels.
12. Only lecturers watch devotional programson other channels.
13. More percentage of teachers does not takeinterest in the programs of other channels.
Q.10. Which type of programs do you like most?
1. Related to women 2. Related to children 3. Related tofashion 4. Related to food HabitsAns:
Note: Here we have taken only one type programme for all thecategories of women.
TYPES OFCATEGORIES OFWOMEN
Related towomen
Relatedtochildren
Relatedtofashion
Related tofood Habits
LECTURERS 50% 0 20% 25%TEACHERS 55% 20% 5% 10%DOCTORS 15% 0 5% 0WORKING WOMEN 45% 5% 25% 10%
HOUSEWIVES 55% 10% 0 10%
1. There is equal percentage of teachers as well ashousewives who watch programs related to women.
2. There is more percentage of teachers who watch programsrelated to children.
3. There is more percentage of working women who watchprograms related to fashion.
4. There is more percentage of lecturers who watch programsrelated to food habits and there is equal percentage ofteachers, working women as well as housewives who watchprograms related to food habits.
407

Q.11. Which type of characters do you like most?
1. Investigative 2.Realistic 3. Devotional 4.Emotional5.Negative 6.Positive
Ans:Note: Here we have taken those women only who like one typeof character liked by the women.
TYPES OF CATEGORIES OFWOMEN
1 2 3 4 5 6 Do notlike anycharacter
LECTURERS 5% 50% 5% 20% 0 30% 0TEACHERS 10% 35% 0 5% 0 20% 5%DOCTORS 10% 25% 5% 15% 0 20% 15%WORKING WOMEN 20% 30% 5% 30% 0 55% 0
HOUSEWIVES 0 20% 0 45% 5 65% 0
408

1. There is more percentage of working women who likeinvestigative characters and equal percentage of teachersas well as doctors who like investigative character.2. There is more percentage of teachers who likerealistic character.3. There is equal percentage of lecturers, doctors aswell as working women who like devotional characters.4. There is more percentage of housewives who likeemotional character.5. There is no woman who likes negative character. 6. There is more percentage of housewives who likepositive characters.7. There is more percentage of doctors who do not likeany type of character.
Q.12. Do you apply above marked character in your own life?
1. Yes 2. No 3. To some extentTYPES OF CATEGORIES OF WOMEN Yes No To some extent
LECTURERS 40% 35% 25%
409

TEACHERS 10% 65% 25%DOCTORS 15% 70% 15%WORKING WOMEN 50% 35% 15%
HOUSEWIVES 65% 30% 5%
Ans.
1. There is more percentage of housewives who apply themarked character in their own life.
2. There is more percentage og doctors who do not apply themarked character in their own life.
3. There is equal percentage of lecturers as well asteachers and doctors as well as working women who applythe marked character to some extent in their own life.
410

Q.13. Do you apply above marked characters in others life? 1.Yes 2. No 3. To some extent
Ans.
TYPES OF CATEGORIES OFWOMEN
Yes No To someextent
LECTURERS 15% 75% 10%TEACHERS 15% 60% 15%DOCTORS 15% 80% 5%WORKING WOMEN 20% 70% 10%
HOUSEWIVES 45% 50% 10%
1. There is more percentage of housewives who apply themarked character in others life and there is equalpercentage of lecturers, teachers as well as doctors whoapply the marked character in others life.
2. There is more percentage of doctors who do not apply themarked character in others life.
3. There is more percentage of teachers who apply the markedcharacter to some extent in others life and equalpercentage of lecturers, working women as well ashousewives who apply the marked character in others life.
411

Q.14. How much time do you spend on watching Televisionprogramme?
1. Half an Hour 2. One Hour 3. Two Hour4. More than that
Ans:
TYPES OFCATEGORIES OFWOMEN
Half anHour
OneHour
TwoHour
Morethanthat
Notingto say
LECTURERS 15% 55% 35% 0 0TEACHERS 20% 30% 35% 5% 10%DOCTORS 15% 55% 20% 5% 0WORKING WOMEN 10% 30% 40% 20% 0
HOUSEWIVES 0 30% 45% 20% 0
1. There is more percentage of teachers who watch programsfor half an hour and there is equal percentage oflecturers as well as doctors who watch programs for halfan hour.
2. There is equal percentage of lecturers as well as doctorsand teachers, working women as well as housewives whowatch programs for one hour.
3. There is more percentage of housewives who watchprograms for two hour and equal percentage of lecturersas well as teachers who watch programs for two hour.
412

4. There is equal percentage of teachers as well as doctorsand working women as well as housewives who watchprograms more than that.
5. Only some percentage of teachers has nothing to say.
Q.15. At what time do you prefer to watch Televisionprogramme?
1. Morning 2. After Noon 3. Evening 4.Late Night
Ans:TYPES OFCATEGORIES OFWOMEN
Morning AfterNoon
Evening LateNight
Notingto say
LECTURERS 0 5% 80% 15% 0TEACHERS 0 0 60% 20% 20%DOCTORS 0 0 45% 55% 0WORKING WOMEN 0 0 55% 45% 0
HOUSEWIVES 5% 5% 70% 20% 0
1. Only housewives watch programs in morning.2. There is equal percentage of lecturers as well as
housewives who watch programs in after noon.3. There is more percentage of lecturers who watch programs
in evening.
413

4. There is more percentage of doctors who watch programs atlate night and equal percentage of teachers as well ashousewives who watch programs at late night.
5. Only some percentage of teachers have nothing to say inthis respect.
Q.16. Do you leave all other important work while watchingTelevision Programme?
1. Yes 2.No 3.To some extent
Ans:
TYPES OF CATEGORIESOF WOMEN
Yes No To someextent
Nothing tosay
LECTURERS 15% 85% 0 0414

TEACHERS 10% 70% 5% 15%DOCTORS 0 95% 5% 0WORKING WOMEN 15% 75% 10% 0
HOUSEWIVES 20% 70% 15% 0
1. There is more percentage of housewives who leave theirimportant work and equal percentage of lecturers as wellas working women who leave their important work whilewatching programs.
2. There is more percentage of doctors who do not leavetheir important work while watching programs.
3. There is more percentage of housewives who leave theirimportant work to some extent while watching programs.
4. There is some percentage of teachers who have nothing tosay.
415

Q.17. Do you feel that Television programs are responsible forsocial change? Ans.
TYPES OF CATEGORIESOF WOMEN
Yes No To someextent
Nothing tosay
LECTURERS 85% 10% 0 0TEACHERS 80% 15% 0 5%DOCTORS 80% 15% 0 5%WORKING WOMEN 75% 25% 0 0
HOUSEWIVES 65% 35% 0 0
1. There is more percentage of lecturers who feel thatprograms bring social change and equal percentage ofteachers as well as doctors who fell that programs bringsocial change.
2. There is more percentage of housewives who feel thatprograms do not bring social change and equal percentageof teachers as well as doctors who feel that programs donot bring social change.
3. There is no woman under the option of some extent.
416

Q.18. Do you feel that something innovative should be done toimprove the quality of programs?Ans:-………………………………………………………………………………………………………………………………………………………………………………………………………………………………
TYPES OF CATEGORIES OFWOMEN
Yes No To someextent
Nothing tosay
LECTURERS 75% 25% 0 0TEACHERS 65% 35% 0 0DOCTORS 40% 60% 0 0WORKING WOMEN 70% 30% 0 0
HOUSEWIVES 65% 35% 0 0
1. There is more percentage of lectures who feel thatinnovation should be done to improve the quality ofprograms.2. There is more percentage of doctors who feel thatthere should be no innovation in the programs and equalpercentage of teachers as well as housewives who believethat innovation should not be there in the quality ofprograms.3. There is no woman under the option of some extent.
417

Chapter 9
418

Conclusions
Note: I have divided the categories of women into lecturers,teachers, doctors, working women and housewives but my projectwork is to study the impact of television programs on women.So, I am writing the conclusions by taking the all categories of women as one category of women .
1.There is more percentage of women who watch televisionprograms daily (52%) and according to them there is somethingcreative is present in the programs, it may be acting ofstars, their cloth wearing protocol, their makeup and theirliving standard which pull them to watch these programs whichclarifies the impact of programs on attitude of women as aresult they are eager to watch the programs daily becauseprograms are produced such a way that more and more womenwatch them by creating the interesting turns in the programsby the directors as well as by applying new ideas in theprograms it may be the idea of fashion and glamour in theprograms which sometimes make them romantic.
2.Most of the women watch programs related to entertainment(42%) which takes place between the programs as compared to
419

social programs (6%), educational (5%), awareness programs(8%), devotional programs (5%) as a one category of programswhich shows that programs have very less impact of awarenessin the mindset of women which can shape the women attitude innegative manner because they do not earn something good fromthe programs which can be helpful in their problem of lifeso that they can take a positive step in a particular problemwhich is hazardous for their own as well as for their near anddear ones because there are various other programs onawareness, education, health which change the women thinkingprocess in positive manner but its percentage is very lowwhich is a problematic situation.
3.Colors (26%) is the channel which is liked by the most ofthe women as compared to Sony (5%), Zee TV (10%), Life OK(1%), Discovery (4%) and other channels (10%) as a one channelchoice because in their thinking, it telecasts programs onreal problems of family as well as society, from which theylearn how to be a social person in society and what is theposition of women in the society?
4. There is more percentage of women who watch historicalprograms (27%) as compared to drama(19%), horror programs(3%), mythological programs (0%), and reality programs (6%) astheir first choice because most of the women want to knowabout the history of India and some of the women feel romancefrom these programs which shows that programs of Zee TV havepositive impact in case of providing knowledge of Indianhistory but on the other side creates a hypothetical feelingof romance which plays a contradictory role in the thinking ofsome of the women because they watch these programs to feelromance which we can say a day dreaming impact and there is nowomen who prefer to watch mythological programs on Zee TVwhich is a serious problem that no women want to know aboutthe history behind any myth on Zee TV and 41% women do nottake interest in the programs of Zee TV which I have notconsidered in my research.
420

5. There is more percentage of women who watch programsrelated to crime/thriller (29%) on Sony as compared to drama(10%), historical programs (8%), horror programs (1%) andreality programs (2%) as their first choice because most ofthem feel aware and reality in these programs which aware themfrom upcoming incidents in their life and give them thesolutions of any misbehavior which is done by any person so itshows the positive impact of programs of Sony on the attitudeof women as a result they can think for their safety in anyplace and area and they come to know about the wrong physicalacts and the thinking of person behind these actions but thereis some women who feel a feeling of criminal behavior in themwhich is a alarming fact in this study that programs oncrime/thriller on Sony creates some negative impact on themindset of women which we can say that it comes from theseprograms that they feel negative changes in them which is aserious impact on the women by the programs of Sony and 51%women do not take interest in the programs of Sony .
6. There is more percentage of women who watch drama(37%) aswell as reality shows (15%) as first choice on Colors becausethey feel entertainment as well as other feeling of socialchange in the society from the dramas and on the other handfeel the reality of human nature in the reality programs whichshows the positive impact of programs on the attitude of womenas a result they can think better and positive but 19% womenwatch comedy programs on Colors for their refreshment which isslightly more than reality programs which shows that comedyprograms of Colors have ability to make them happy in theirproblems and the tensions which is created by these problemswhich shows that programs of Colors have positive and healthyimpact on the women as a result they can overcome them fromproblems of their own and 28% women do not take interest inthe programs of Colors .
7. Most of the women prefer to watch programs related to crime(15%) on Life OK as a first choice as compared to drama (11%),mythological programs (9%) and fantasy programs (0%) which
421

make them aware from the criminal minds of people so that theyremain alert from these types of persons to avoid any type ofmisbehavior which shows the positive impact of these programson the attitude of women because they can judge any personwhether he/she is right or wrong and 67% women do not takeinterest in the programs of Life OK .
8. Most of the women prefer to watch programs related toadventures (18%) as a first choice as compared to programsrelated to medical sciences (9%), new technologies (9%),environment (5%), culture (2%), health (1%), food (1%) andhistorical (2%) because they want to express their innertalent as well as feeling by doing adventures which is thepositive impact of these type of programs as a result theyfeel something different and strange to make their extraordinary image in the eyes of the society 53% women do nottake interest in the programs of discovery.
9. Most of the women watch drama (32%) as well as newsprograms (21%) as compared to mythological programs (7%),reality programs (5%), comedy (5%), music programs (2%),devotional programs (3%) as a first choice on other channelsbecause they want entertainment as well as awareness, for thisdrama and news programs are the best source of attaining thesefactors and 24% do not take interest in the programs of otherchannels.
10. There is more percentage of women who watch programsrelated to women (44%) as compared to related to children(7%), related to fashion (9%) and related to food habits (9%),which shows the positive impact of programs because some ofthe women feel that programs creates such type of feeling inthem and 24% women do not like the programs of other channels.
11. There is more percentage of women who like positivecharacter (38%) as well as realistic characters (32%) as
422

compared to investigative characters (9%), devotionalcharacters (3%), emotional characters (19%) and negativecharacters (1%) because they feel that reality comes in lifewhen act in positive direction which shows a deep impact ofcharacters on the attitude of women as a result they reach atthis conclusion by watching different types of programs ontelevision.
12.There is more percentage of women (36%) who apply themarked character in their own life as compared because theyfeel that programs create the characters and it depends onwomen that what they apply in their life but in this study ithas been concluded that most of the women apply positive aswell as realistic characters in their own life which is apositive impact of programs on the attitude of women that theyapply only positive characters not negative characters becausethey watch different programs and feel that positive thingscan be better for their future and some of them apply thesecharacters to some extent and feel good as well as differentfrom others.
13. There is some percentage of women who apply the markedcharacter in others life (22%) and feel good as well as feelthat it depends on the other person what he/se wants but thereis a serious thing that some of the women apply the negativecharacters in others life for their work which we can say thatnegative impact of programs on the attitude of some of thewomen and there is 67% women who do not apply the markedcharacters in others life as compared to the women (10%) whoapply the marked characters in others life.
14. There is more percentage of women who watch programs forone hour (40%) as compared to women who watch programs forhalf an hour (12%), two hour (35%), more than that (10%) as itdepends on the situation of particular woman if she is alecturer then it is obvious that she will watch the programsfor one hour because they have very less time. This conditionis also applicable on teachers, working women and doctors but
423

it is true that something is there in the programs that bindsthe women which we can say that normal impact of programsbecause if somebody wants to watch something then he/she willprefer to watch programs on television.
15. There is more percentage of women who watch programs inevening (62%) as compared to morning (1%), after noon (2%) andlate night (31%) because evening is the time when they remainfree so watch programs in evening but it is not the truethings because there are some of the women who watch programsat night which shows that programs make them addicts to watchprograms at night which effects the working as well asthinking phenomenon of women which shows the negative impactof the programs on the attitude of women that they remain busyin watching programs at late night which is very seriousimpact of programs because programs are produced in such amanner that more and more women watch these programs.
16. There is more percentage of women who do not leave theirimportant work (79%) but this is not fully true because thereis percentage of women (12%) who leave their important worktotally as well as to some extent (7%) which shows that thereis something hidden behind on the story or character ofprograms that binds some of the women that they leave theirimportant work while watching the programs which shows thenegative impact of programs on the mind of the women becausethey do not want to leave any episode as there may be problemin understanding the programs on next day but now a day’s somechannel give the glimpses of the previous episode and thenstart the new one so that there will be no problem inunderstanding the new episode but some of the women do nottake interest in all these things because they are addicted toa large extent that they always want to watch the realepisode.
17. There is more percentage of women (77%) who feel thatprograms brings social changes because in their opinionchannels telecast all type of programs and every woman has her
424

own choice and thinking as a result she wants to change herattitude according to the characters when percentage of thesetypes of woman increases then there comes a social changebecause according to them many women who had harsh attitudetowards their family has been changed to some extent which isa positive impact of programs on the thinking of the womenwhich shows that programs brings social change in the orthodoxsociety of India and there is some percentage of women (20%)who do not believe that programs brings social change becauseaccording to them everything is depend on own thinking and 2%women have nothing to say.
18.There is more percentage of women who feel that innovation(63%) should be done to improve the quality of programsbecause they feel that programs are centered to the role ofmother-in-law which is to be changed and more programs shouldbe produced on children so that they can learn something fromthese programs and some of them feel that more programs shouldbe on hidden social problems which are very far away from uswhich shows the innovative impact of programs on the womenthat after watching different types of programs on televisionbecause variety of programs give them a chance to saysomething on the quality of programs so that innovation shouldbe done in the programs.
Final Conclusion:So, from above conclusions we conclude that women prefer towatch historical as well as crime related programs whichincreases their knowledge of historical happenings as well asthey come to know about the incidents that can be occur intheir future so they aware them from the programs related tocrime and on the other side they apply the positive charactersof programs in owns as well as others life and feel a changein their life which is different from other changes becausethis particular thinking of women make them feel that they aredoing something positive for their own as well as their nearand dear ones which give them a pleasurable feeling of
425

positivity and most of the women also feel that programsbrings social change in the society as well as in thementality of people which we can say that programs havepositive impact on them as a result they can differentiatebetween the social changes and they also feel that innovationshould be done to improve the quality of programs and programsare produced on those social issues of women which are faraway from eyes of many women so that they will know that how awoman can filter the evils from the society.
At last it is right to say that television programs have morepositive impact on the attitude of women in this scenario ofmolding society.
426

Chapter 10
427

Limitations
Results cannot be generalized as a whole because thestudy represents a small sample size of women.
Some of the housewives as well as working women werehesitating to mark the answers because of thesocietal influence.
Some of the doctors were busy in their patients sothey have no time to think over the questions. So,it may be possible that they had not marked theproper answers of the questions.
428

Chapter 11
429

Suggestions
1. Programs are produced in such a manner so that its storyshould not be stretched.
2. Programs on public interest should be produced.
3. Inspirational programs should be there so that more womenwill be inspired.
430

4. Realistic programs should be more so that women can feelthe reality behind any real performance.
5. More educational programs should be there so that women canfeel the importance of education.
6. There should be innovation in the quality of programsrelated to comedy.
7. There should be little emotional drama in the programs.
8. There should be more historical programs so that women knowabout the hidden history of India.
9. Programs should be produced on culture and traditions ofancient India.
10. Negative, violent and vulgar programs should not be aired.
431

Chapter 12
Bibliography
432

Internet Sites:
1. www.amazon.com
2. www.aber.ac.uk
3. www.blogs.reuters.com
4. www.impact on net.com
5. Udini.proguest.com
6. www.pire.org
7. www.slate.com
8. www.thehoot.org
433

Chapter 13
Annexure434

IMPACT OF TELEVISION PROGRAMS ON THE ATTITUDE OF WOMEN
Dear Respondent,
The following questionnaire is for my Dissertation entitled“IMPACT OF TELEVISION PROGRAMS ON THE ATTITUDE OF WOMEN: ANANALYTICAL STUDY OF ALIGARH REGION.” Thanks in advance foryour cooperation and valuable time that you have given to markthe answers.
Name of Respondent: - …………………………………………… Age:-………
Address :- ……………………………………………e-mail :……………………………………
Q.1. Do you watch programs on TV?
1. Yes 2. No
If yes, than
(a) Daily (b) Alternate day (c) Sometimes(d) Most of the day
Q.2. Which type of programs do you watch mostly?
435

1. Social 2.Entertainment 3.Educational 4.Awareness 5.Devotional
Q.3. Which channel programs do you like most?
1. Zee TV 2. Sony 3. Colors 4. Life Ok5.Discovery 6.Others
Q.4. Which category of programme/programs of Zee TV do youwatch mostly and what do you feel?
Ans:- ………………………………………………………………………………………………………
1. Drama 2.Historical 3.Horror 4. Mythology 5.Reality
Your Feeling1. It keeps meaware.2. It entertainsme.3. I know abouthistory.4. It makes mephobic.5.I feel thereality.6. Createscriminalbehavior7.I feel Happy.8. I feelromantic.9.Any otherfeeling
436

Q. 5.Which category of programme/programs of Sony do youwatch mostly?
Ans:- ………………………………………………………………………………………………………
1. Drama 2.Historical 3.Horror 4.Reality5.Crime/ThrillerYour Feeling1. It keeps meaware.2. It entertainsme.3. I know abouthistory.4. It makes mephobic.5.I feel thereality.6. Createscriminal behavior7.I feel Happy.8. I feelromantic.9.Any otherfeeling
Q.6.Which category of programme/programs of Colors do youwatch mostly and what do you feel?
Ans:- …………………………………………………………………………………………………….
1. Drama 2.Reality 3.Comedy
Your Feeling1. It keeps meaware.2. It entertainsme.3. I know abouthistory.4. It makes me
437

phobic.5.I feel thereality.6. Createscriminal behavior7.I feel Happy.8. I feelromantic.9.Any otherfeeling
Q.7. Which category of programme/programs of Life Ok do youwatch mostly and what do you feel?
Ans:- ………………………………………………………………………………………………………
1. Drama 2. Mythological 3.Fantasy4.Crime
Your Feeling1. It keeps meaware.2. It entertainsme.3. I know abouthistory.4. It makes mephobic.5.I feel thereality.6. Createscriminal behavior7.I feel Happy.8. I feelromantic.9.Any otherfeeling
Q.8. Which category of programme/programs do you watch onDiscovery and what do you feel?
438

1. Medical Science 2.New technologies 3.Environment4.Culture 5.Health 6.Foods 7.Historical8. Adventurous
Your Feeling1.It aware me.2.It entertain me.3.I know aboutexternal World.4.I feel phobic.5.Innovative ideascome in my mind6.I know about healthproblems.7.Want to doadventure.8. Other feeling..
Q.9. Which category of programme/programs do you watch onother channels and what do you feel?
Ans: ………………………………………………………………………………………………………
1.Drama 2.Historical 3.Horror 4.Mythology 5.Reality6.Crime 7.Comedy 8.Fantasy 9.Fashion
Your Feeling1. It keeps meaware.2. It entertainsme.3. I know abouthistory.4. It makes mephobic.5. I feel thereality.6. Createscriminal behavior7. I feel Happy.8. I feel
439

romantic.9. Any otherfeeling.
Q.10. Which type of programs do you like most?
1. Related to women 2. Related to children 3. Related tofashion 4. Related to food Habits
Q.11. Which type of characters do you like most?
1. Investigative 2.Realistic 3. Devotional 4.Emotional5.Negative 6.Positive
Q.12. Do you apply above marked character in your own lifeand what do you experience ?
1. Yes 2. No 3. To some extent
If your option is 1 or 3 than your experience: .……………………………………........................................……………………………………………………………………………………………………………….Q.13. Do you apply above marked characters in others life andwhat you experience?
1.Yes 2. No 3. To some extent
If your option is 1 or 3 than your experience:……........................................................................................……………………………………………………………………………………………………………….
Q.14. How much time do you spend on watching Televisionprogramme?
440

1. Half an Hour 2. One Hour 3. Two Hour4. More than that
Q.15. At what time do you prefer to watch Televisionprogramme?
1. Morning 2. After Noon 3. Evening 4.Late Night
Q.16. Do you leave all other important work while watchingTelevision Programme?
1. Yes 2.No 3.To some extent
Q.17. Do you feel that Television programs are responsible forsocial change?
1.If yes,why? ..............................................................................................................................................……………………………………………………………………………………………………………….
2.If no,why?.................................................................................................................................................……………………………………………………………………………………………………………….
Q.18. Do you feel that something innovative should be done toimprove the quality of programs?Ans:-………………………………………………………………………………………………………………………………………………………………………………………………………………………………
441

442